Loveland, CO Map & Demographics
Loveland Map
Loveland Overview
$42,119
PER CAPITA INCOME
$94,121
AVG FAMILY INCOME
$81,898
AVG HOUSEHOLD INCOME
35.4%
WAGE / INCOME GAP [ % ]
64.6¢/ $1
WAGE / INCOME GAP [ $ ]
$10,391
FAMILY INCOME DEFICIT
0.40
INEQUALITY / GINI INDEX
76,500
TOTAL POPULATION
37,927
MALE POPULATION
38,573
FEMALE POPULATION
98.33
MALES / 100 FEMALES
101.70
FEMALES / 100 MALES
40.4
MEDIAN AGE
2.8
AVG FAMILY SIZE
2.3
AVG HOUSEHOLD SIZE
40,741
LABOR FORCE [ PEOPLE ]
65.0%
PERCENT IN LABOR FORCE
4.4%
UNEMPLOYMENT RATE
Loveland Area Codes
Income in Loveland
Income Overview in Loveland
Per Capita Income in Loveland is $42,119, while median incomes of families and households are $94,121 and $81,898 respectively.
| Characteristic | Number | Measure |
| Per Capita Income | 76,500 | $42,119 |
| Median Family Income | 20,825 | $94,121 |
| Mean Family Income | 20,825 | $111,672 |
| Median Household Income | 33,126 | $81,898 |
| Mean Household Income | 33,126 | $97,443 |
| Income Deficit | 20,825 | $10,391 |
| Wage / Income Gap (%) | 76,500 | 35.40% |
| Wage / Income Gap ($) | 76,500 | 64.60¢ per $1 |
| Gini / Inequality Index | 76,500 | 0.40 |
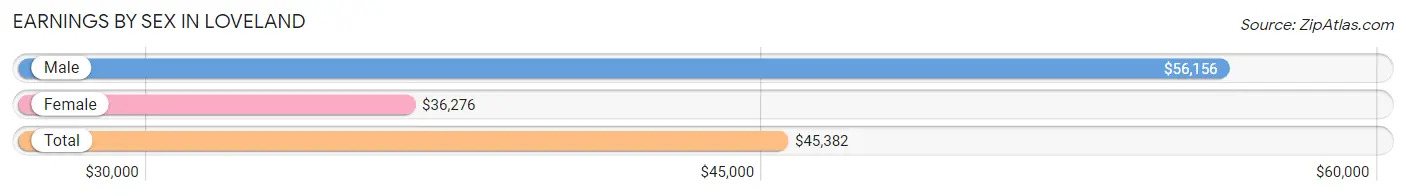
Earnings by Sex in Loveland
Average Earnings in Loveland are $45,382, $56,156 for men and $36,276 for women, a difference of 35.4%.
| Sex | Number | Average Earnings |
| Male | 22,609 (52.9%) | $56,156 |
| Female | 20,098 (47.1%) | $36,276 |
| Total | 42,707 (100.0%) | $45,382 |
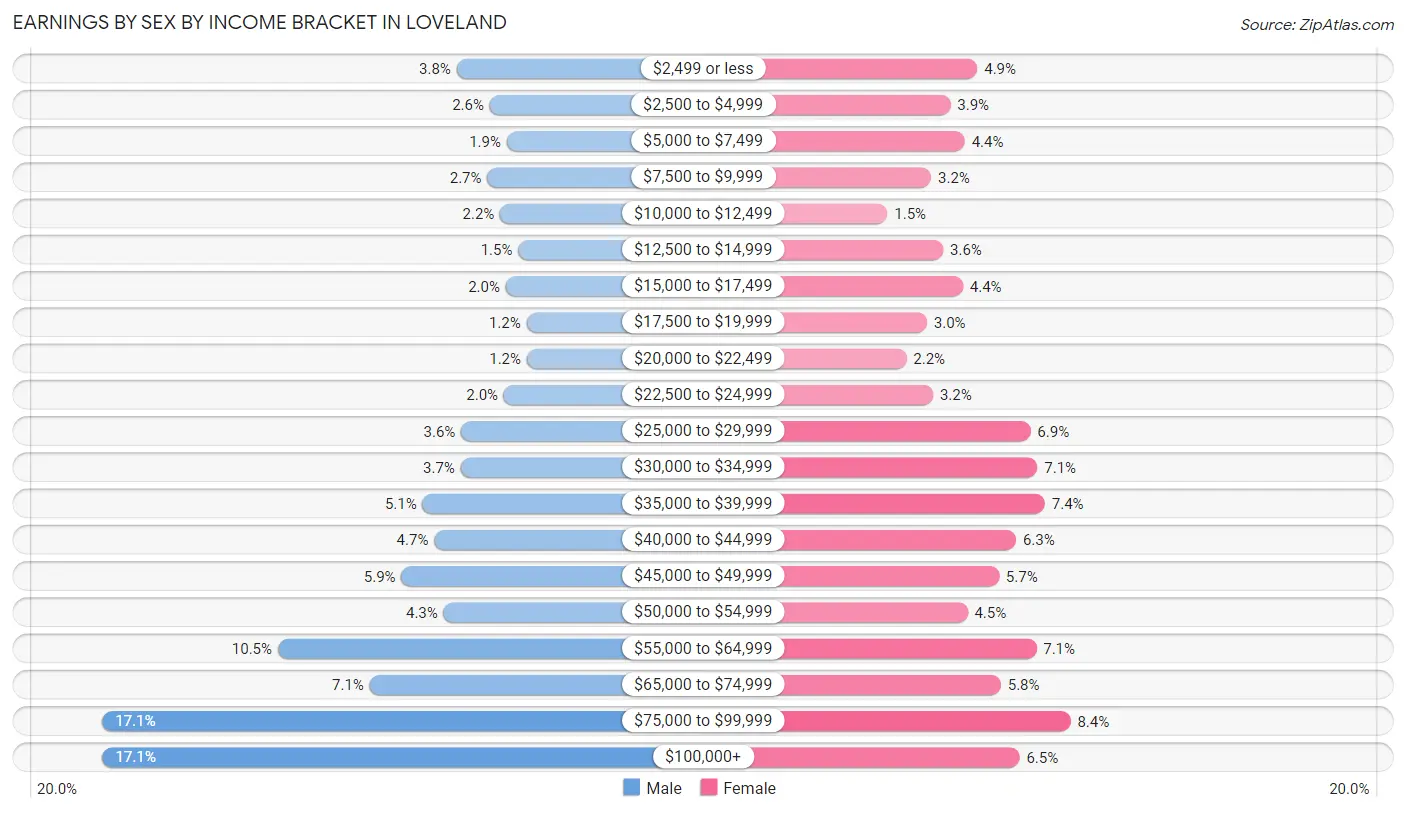
Earnings by Sex by Income Bracket in Loveland
The most common earnings brackets in Loveland are $75,000 to $99,999 for men (3,863 | 17.1%) and $75,000 to $99,999 for women (1,684 | 8.4%).
| Income | Male | Female |
| $2,499 or less | 861 (3.8%) | 982 (4.9%) |
| $2,500 to $4,999 | 580 (2.6%) | 780 (3.9%) |
| $5,000 to $7,499 | 437 (1.9%) | 888 (4.4%) |
| $7,500 to $9,999 | 602 (2.7%) | 636 (3.2%) |
| $10,000 to $12,499 | 494 (2.2%) | 306 (1.5%) |
| $12,500 to $14,999 | 339 (1.5%) | 725 (3.6%) |
| $15,000 to $17,499 | 446 (2.0%) | 875 (4.3%) |
| $17,500 to $19,999 | 269 (1.2%) | 602 (3.0%) |
| $20,000 to $22,499 | 267 (1.2%) | 448 (2.2%) |
| $22,500 to $24,999 | 461 (2.0%) | 650 (3.2%) |
| $25,000 to $29,999 | 822 (3.6%) | 1,382 (6.9%) |
| $30,000 to $34,999 | 828 (3.7%) | 1,434 (7.1%) |
| $35,000 to $39,999 | 1,150 (5.1%) | 1,492 (7.4%) |
| $40,000 to $44,999 | 1,051 (4.6%) | 1,275 (6.3%) |
| $45,000 to $49,999 | 1,330 (5.9%) | 1,146 (5.7%) |
| $50,000 to $54,999 | 972 (4.3%) | 908 (4.5%) |
| $55,000 to $64,999 | 2,377 (10.5%) | 1,426 (7.1%) |
| $65,000 to $74,999 | 1,598 (7.1%) | 1,159 (5.8%) |
| $75,000 to $99,999 | 3,863 (17.1%) | 1,684 (8.4%) |
| $100,000+ | 3,862 (17.1%) | 1,300 (6.5%) |
| Total | 22,609 (100.0%) | 20,098 (100.0%) |
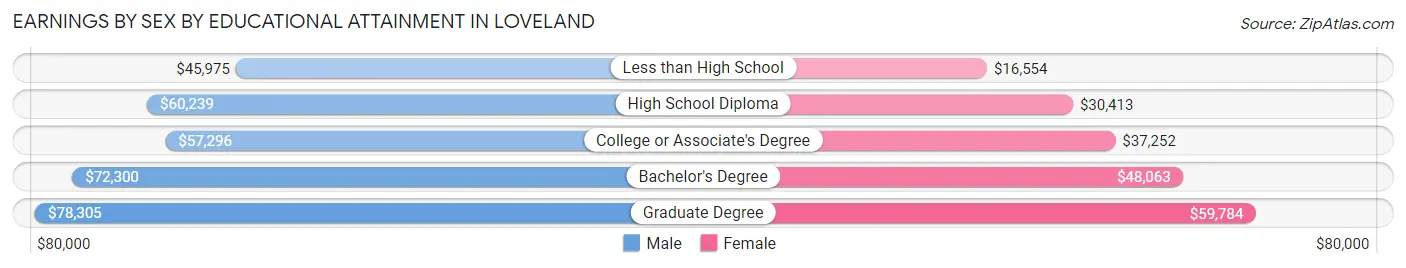
Earnings by Sex by Educational Attainment in Loveland
Average earnings in Loveland are $62,535 for men and $40,305 for women, a difference of 35.5%. Men with an educational attainment of graduate degree enjoy the highest average annual earnings of $78,305, while those with less than high school education earn the least with $45,975. Women with an educational attainment of graduate degree earn the most with the average annual earnings of $59,784, while those with less than high school education have the smallest earnings of $16,554.
| Educational Attainment | Male Income | Female Income |
| Less than High School | $45,975 | $16,554 |
| High School Diploma | $60,239 | $30,413 |
| College or Associate's Degree | $57,296 | $37,252 |
| Bachelor's Degree | $72,300 | $48,063 |
| Graduate Degree | $78,305 | $59,784 |
| Total | $62,535 | $40,305 |
Family Income in Loveland
Family Income Brackets in Loveland
According to the Loveland family income data, there are 4,977 families falling into the $100,000 to $149,999 income range, which is the most common income bracket and makes up 23.9% of all families. Conversely, the $10,000 to $14,999 income bracket is the least frequent group with only 187 families (0.9%) belonging to this category.
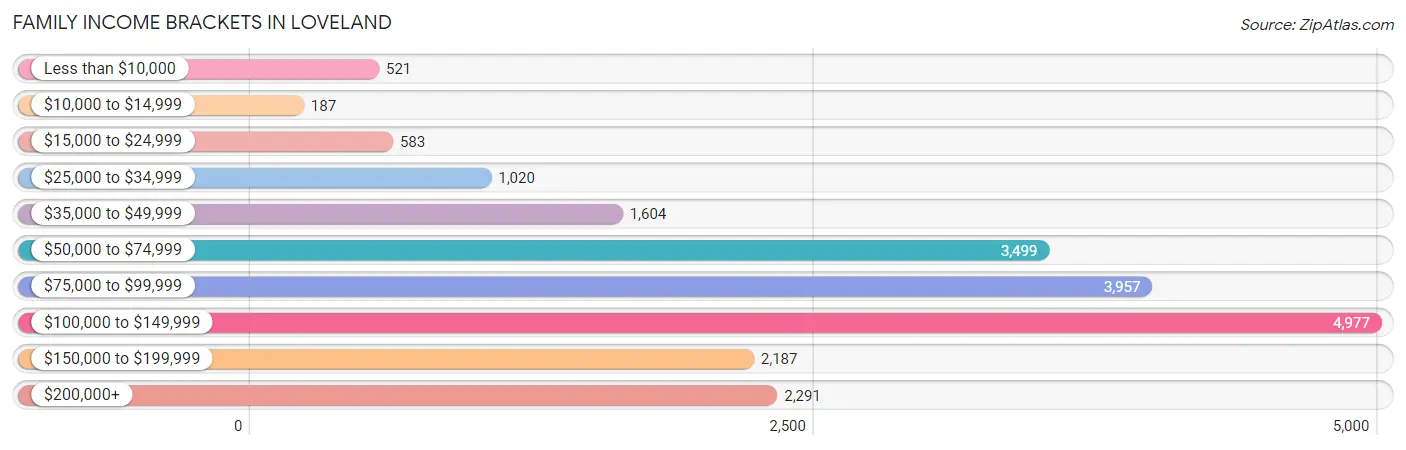
| Income Bracket | # Families | % Families |
| Less than $10,000 | 521 | 2.5% |
| $10,000 to $14,999 | 187 | 0.9% |
| $15,000 to $24,999 | 583 | 2.8% |
| $25,000 to $34,999 | 1,020 | 4.9% |
| $35,000 to $49,999 | 1,604 | 7.7% |
| $50,000 to $74,999 | 3,499 | 16.8% |
| $75,000 to $99,999 | 3,957 | 19.0% |
| $100,000 to $149,999 | 4,977 | 23.9% |
| $150,000 to $199,999 | 2,187 | 10.5% |
| $200,000+ | 2,291 | 11.0% |
Family Income by Famaliy Size in Loveland
4-person families (3,244 | 15.6%) account for the highest median family income in Loveland with $119,425 per family, while 2-person families (11,890 | 57.1%) have the highest median income of $40,928 per family member.
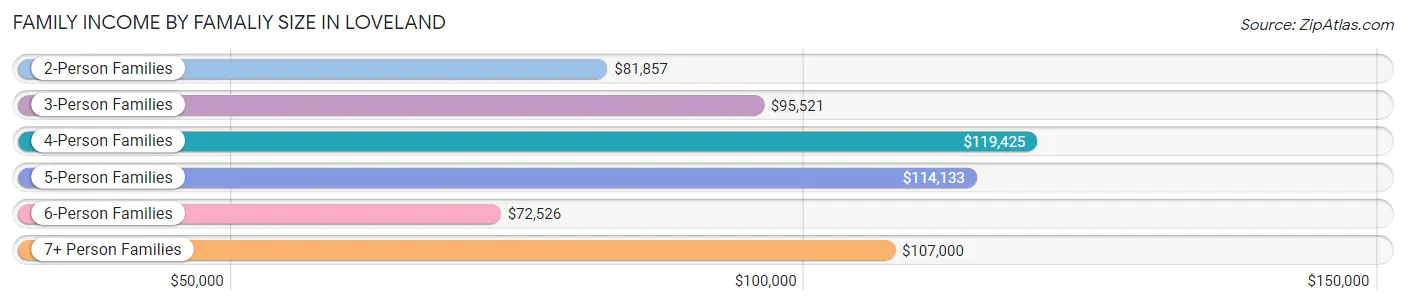
| Income Bracket | # Families | Median Income |
| 2-Person Families | 11,890 (57.1%) | $81,857 |
| 3-Person Families | 3,636 (17.5%) | $95,521 |
| 4-Person Families | 3,244 (15.6%) | $119,425 |
| 5-Person Families | 1,412 (6.8%) | $114,133 |
| 6-Person Families | 499 (2.4%) | $72,526 |
| 7+ Person Families | 144 (0.7%) | $107,000 |
| Total | 20,825 (100.0%) | $94,121 |
Family Income by Number of Earners in Loveland
The median family income in Loveland is $94,121, with families comprising 3+ earners (2,031) having the highest median family income of $141,563, while families with no earners (3,688) have the lowest median family income of $66,055, accounting for 9.8% and 17.7% of families, respectively.
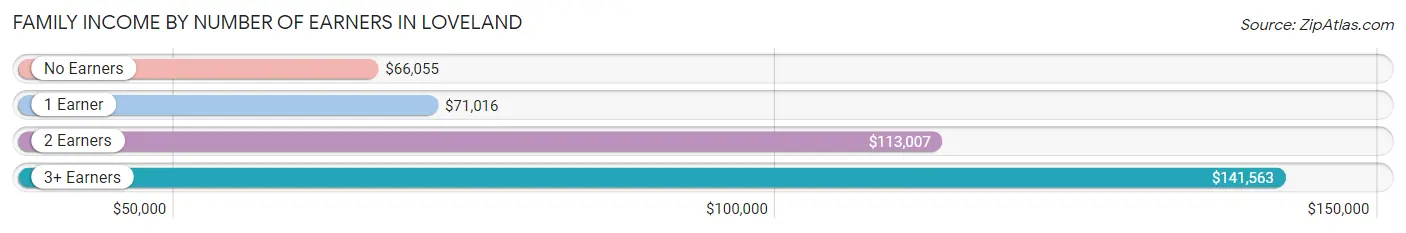
| Number of Earners | # Families | Median Income |
| No Earners | 3,688 (17.7%) | $66,055 |
| 1 Earner | 6,282 (30.2%) | $71,016 |
| 2 Earners | 8,824 (42.4%) | $113,007 |
| 3+ Earners | 2,031 (9.8%) | $141,563 |
| Total | 20,825 (100.0%) | $94,121 |
Household Income in Loveland
Household Income Brackets in Loveland
With 6,625 households falling in the category, the $100,000 to $149,999 income range is the most frequent in Loveland, accounting for 20.0% of all households. In contrast, only 663 households (2.0%) fall into the $10,000 to $14,999 income bracket, making it the least populous group.
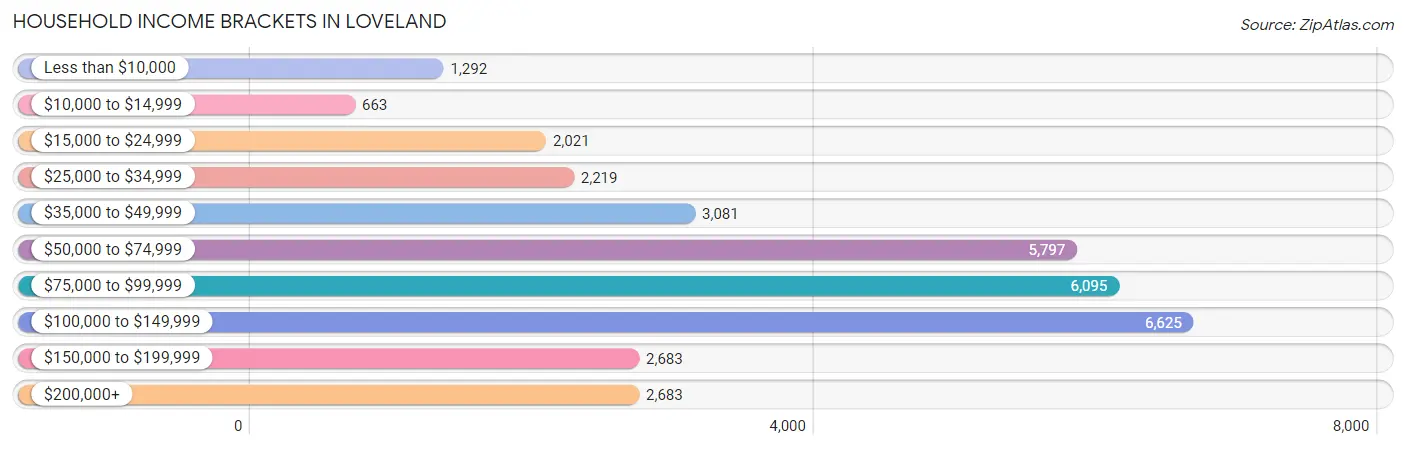
| Income Bracket | # Households | % Households |
| Less than $10,000 | 1,292 | 3.9% |
| $10,000 to $14,999 | 663 | 2.0% |
| $15,000 to $24,999 | 2,021 | 6.1% |
| $25,000 to $34,999 | 2,219 | 6.7% |
| $35,000 to $49,999 | 3,081 | 9.3% |
| $50,000 to $74,999 | 5,797 | 17.5% |
| $75,000 to $99,999 | 6,095 | 18.4% |
| $100,000 to $149,999 | 6,625 | 20.0% |
| $150,000 to $199,999 | 2,683 | 8.1% |
| $200,000+ | 2,683 | 8.1% |
Household Income by Householder Age in Loveland
The median household income in Loveland is $81,898, with the highest median household income of $94,541 found in the 25 to 44 years age bracket for the primary householder. A total of 10,802 households (32.6%) fall into this category. Meanwhile, the 15 to 24 years age bracket for the primary householder has the lowest median household income of $45,531, with 1,511 households (4.6%) in this group.
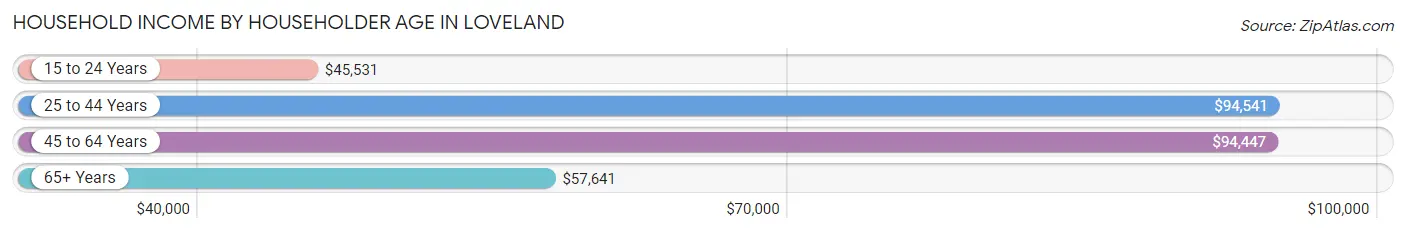
| Income Bracket | # Households | Median Income |
| 15 to 24 Years | 1,511 (4.6%) | $45,531 |
| 25 to 44 Years | 10,802 (32.6%) | $94,541 |
| 45 to 64 Years | 10,362 (31.3%) | $94,447 |
| 65+ Years | 10,451 (31.6%) | $57,641 |
| Total | 33,126 (100.0%) | $81,898 |
Poverty in Loveland
Income Below Poverty by Sex and Age in Loveland
With 6.7% poverty level for males and 8.8% for females among the residents of Loveland, 15 year old males and 15 year old females are the most vulnerable to poverty, with 206 males (38.8%) and 80 females (29.0%) in their respective age groups living below the poverty level.
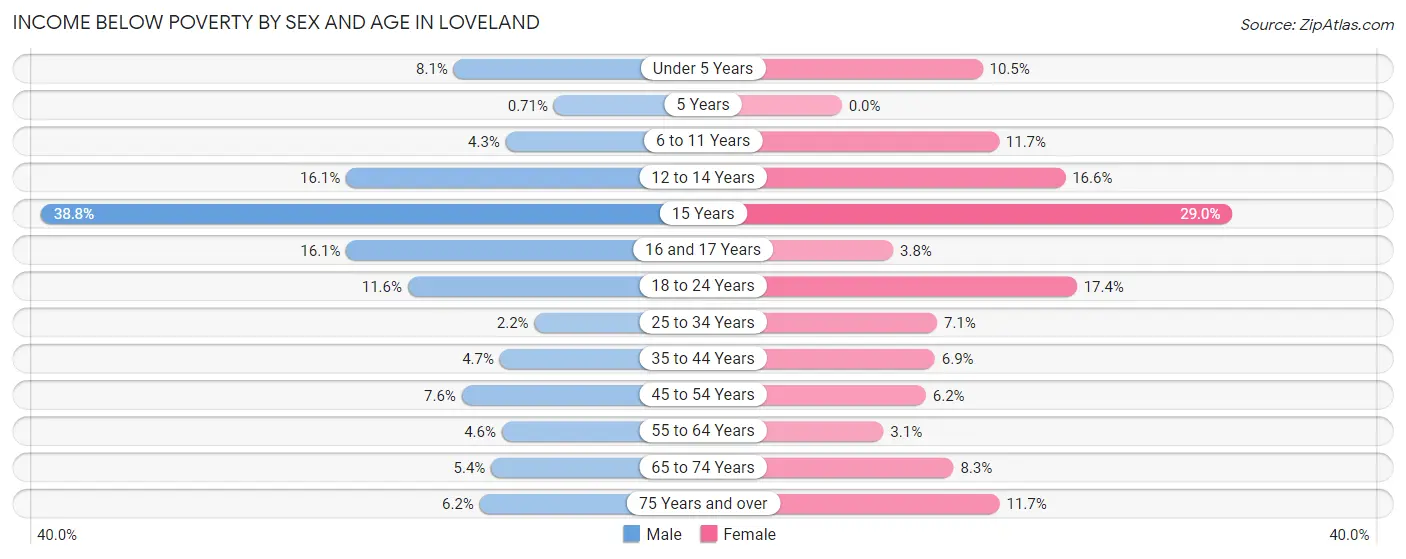
| Age Bracket | Male | Female |
| Under 5 Years | 184 (8.1%) | 194 (10.4%) |
| 5 Years | 4 (0.7%) | 0 (0.0%) |
| 6 to 11 Years | 100 (4.3%) | 306 (11.7%) |
| 12 to 14 Years | 270 (16.1%) | 179 (16.6%) |
| 15 Years | 206 (38.8%) | 80 (29.0%) |
| 16 and 17 Years | 101 (16.1%) | 27 (3.8%) |
| 18 to 24 Years | 379 (11.6%) | 584 (17.4%) |
| 25 to 34 Years | 116 (2.1%) | 375 (7.1%) |
| 35 to 44 Years | 244 (4.7%) | 331 (6.9%) |
| 45 to 54 Years | 332 (7.5%) | 247 (6.2%) |
| 55 to 64 Years | 206 (4.6%) | 153 (3.1%) |
| 65 to 74 Years | 217 (5.4%) | 411 (8.3%) |
| 75 Years and over | 176 (6.2%) | 462 (11.7%) |
| Total | 2,535 (6.7%) | 3,349 (8.8%) |
Income Above Poverty by Sex and Age in Loveland
According to the poverty statistics in Loveland, males aged 5 years and females aged 5 years are the age groups that are most secure financially, with 99.3% of males and 100.0% of females in these age groups living above the poverty line.
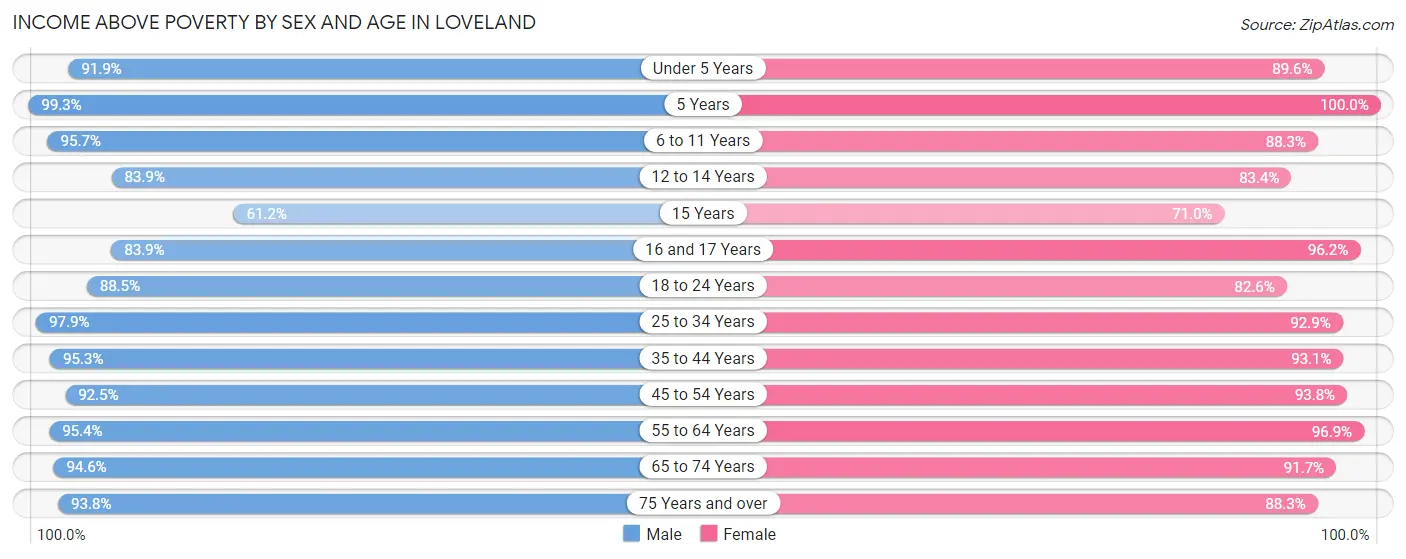
| Age Bracket | Male | Female |
| Under 5 Years | 2,076 (91.9%) | 1,663 (89.5%) |
| 5 Years | 558 (99.3%) | 403 (100.0%) |
| 6 to 11 Years | 2,237 (95.7%) | 2,318 (88.3%) |
| 12 to 14 Years | 1,404 (83.9%) | 900 (83.4%) |
| 15 Years | 325 (61.2%) | 196 (71.0%) |
| 16 and 17 Years | 526 (83.9%) | 682 (96.2%) |
| 18 to 24 Years | 2,903 (88.4%) | 2,764 (82.6%) |
| 25 to 34 Years | 5,291 (97.9%) | 4,927 (92.9%) |
| 35 to 44 Years | 4,929 (95.3%) | 4,460 (93.1%) |
| 45 to 54 Years | 4,065 (92.4%) | 3,714 (93.8%) |
| 55 to 64 Years | 4,299 (95.4%) | 4,793 (96.9%) |
| 65 to 74 Years | 3,829 (94.6%) | 4,546 (91.7%) |
| 75 Years and over | 2,657 (93.8%) | 3,485 (88.3%) |
| Total | 35,099 (93.3%) | 34,851 (91.2%) |
Income Below Poverty Among Married-Couple Families in Loveland
The poverty statistics for married-couple families in Loveland show that 2.6% or 438 of the total 16,540 families live below the poverty line. Families with 3 or 4 children have the highest poverty rate of 14.0%, comprising of 191 families. On the other hand, families with 5 or more children have the lowest poverty rate of 0.0%, which includes 0 families.
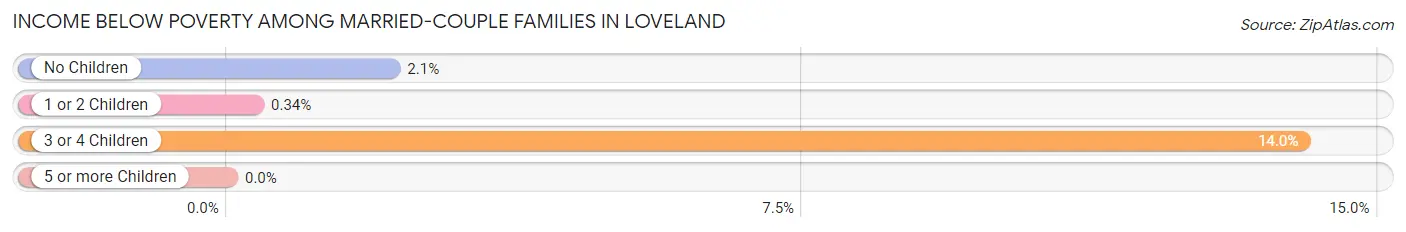
| Children | Above Poverty | Below Poverty |
| No Children | 10,778 (97.9%) | 233 (2.1%) |
| 1 or 2 Children | 4,099 (99.7%) | 14 (0.3%) |
| 3 or 4 Children | 1,173 (86.0%) | 191 (14.0%) |
| 5 or more Children | 52 (100.0%) | 0 (0.0%) |
| Total | 16,102 (97.4%) | 438 (2.6%) |
Income Below Poverty Among Single-Parent Households in Loveland
According to the poverty data in Loveland, 21.8% or 341 single-father households and 13.2% or 359 single-mother households are living below the poverty line. Among single-father households, those with 1 or 2 children have the highest poverty rate, with 330 households (36.3%) experiencing poverty. Likewise, among single-mother households, those with 5 or more children have the highest poverty rate, with 16 households (100.0%) falling below the poverty line.
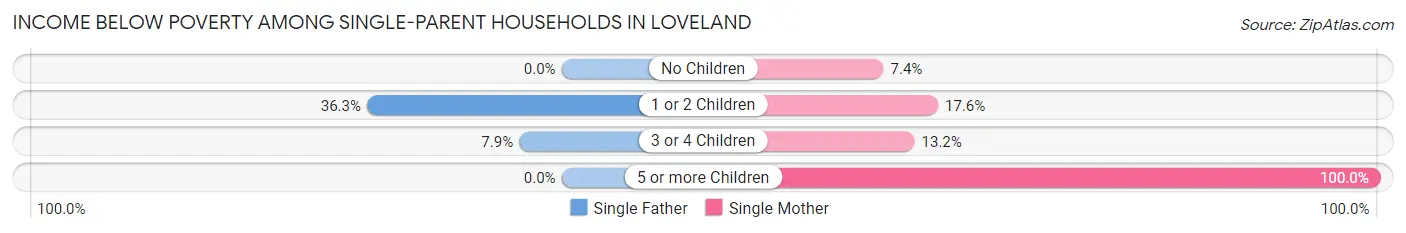
| Children | Single Father | Single Mother |
| No Children | 0 (0.0%) | 94 (7.4%) |
| 1 or 2 Children | 330 (36.3%) | 235 (17.6%) |
| 3 or 4 Children | 11 (7.9%) | 14 (13.2%) |
| 5 or more Children | 0 (0.0%) | 16 (100.0%) |
| Total | 341 (21.8%) | 359 (13.2%) |
Income Below Poverty Among Married-Couple vs Single-Parent Households in Loveland
The poverty data for Loveland shows that 438 of the married-couple family households (2.6%) and 700 of the single-parent households (16.3%) are living below the poverty level. Within the married-couple family households, those with 3 or 4 children have the highest poverty rate, with 191 households (14.0%) falling below the poverty line. Among the single-parent households, those with 5 or more children have the highest poverty rate, with 16 household (100.0%) living below poverty.
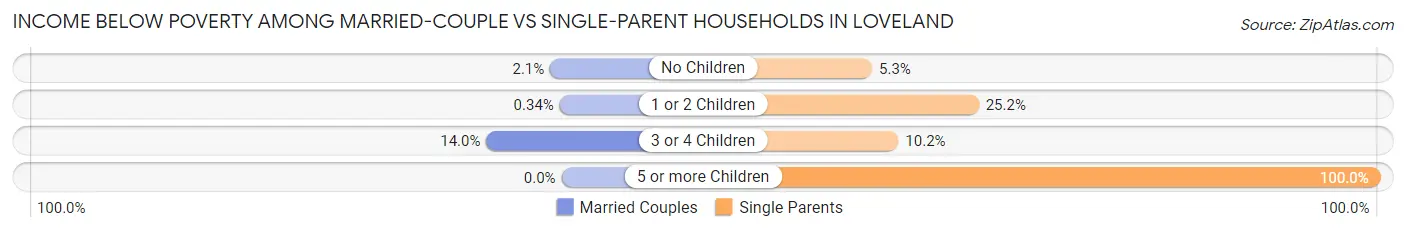
| Children | Married-Couple Families | Single-Parent Households |
| No Children | 233 (2.1%) | 94 (5.3%) |
| 1 or 2 Children | 14 (0.3%) | 565 (25.2%) |
| 3 or 4 Children | 191 (14.0%) | 25 (10.2%) |
| 5 or more Children | 0 (0.0%) | 16 (100.0%) |
| Total | 438 (2.6%) | 700 (16.3%) |
Race in Loveland
The most populous races in Loveland are White / Caucasian (68,134 | 89.1%), Hispanic or Latino (10,239 | 13.4%), and Two or more Races (5,260 | 6.9%).
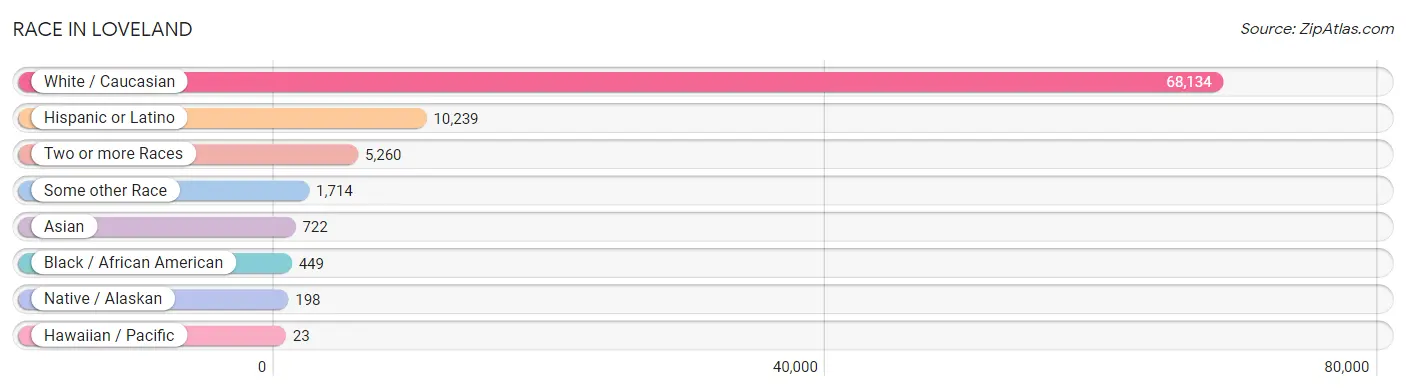
| Race | # Population | % Population |
| Asian | 722 | 0.9% |
| Black / African American | 449 | 0.6% |
| Hawaiian / Pacific | 23 | 0.0% |
| Hispanic or Latino | 10,239 | 13.4% |
| Native / Alaskan | 198 | 0.3% |
| White / Caucasian | 68,134 | 89.1% |
| Two or more Races | 5,260 | 6.9% |
| Some other Race | 1,714 | 2.2% |
| Total | 76,500 | 100.0% |
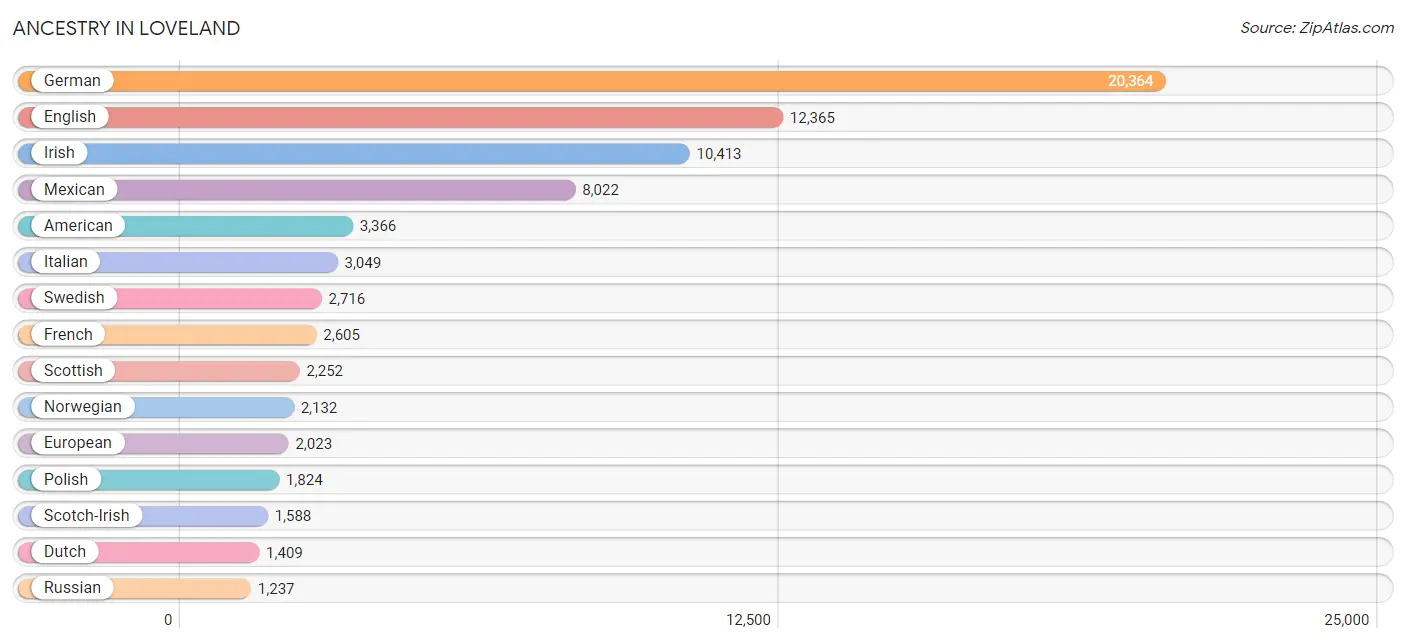
Ancestry in Loveland
The most populous ancestries reported in Loveland are German (20,364 | 26.6%), English (12,365 | 16.2%), Irish (10,413 | 13.6%), Mexican (8,022 | 10.5%), and American (3,366 | 4.4%), together accounting for 71.3% of all Loveland residents.
| Ancestry | # Population | % Population |
| African | 36 | 0.1% |
| American | 3,366 | 4.4% |
| Apache | 117 | 0.2% |
| Arab | 295 | 0.4% |
| Argentinean | 17 | 0.0% |
| Armenian | 23 | 0.0% |
| Assyrian / Chaldean / Syriac | 8 | 0.0% |
| Australian | 57 | 0.1% |
| Austrian | 229 | 0.3% |
| Basque | 157 | 0.2% |
| Belgian | 87 | 0.1% |
| Bhutanese | 204 | 0.3% |
| Bolivian | 17 | 0.0% |
| British | 576 | 0.7% |
| Burmese | 87 | 0.1% |
| Cajun | 19 | 0.0% |
| Canadian | 256 | 0.3% |
| Celtic | 17 | 0.0% |
| Central American | 292 | 0.4% |
| Central American Indian | 44 | 0.1% |
| Cherokee | 444 | 0.6% |
| Cheyenne | 15 | 0.0% |
| Chickasaw | 13 | 0.0% |
| Chippewa | 38 | 0.1% |
| Choctaw | 13 | 0.0% |
| Colombian | 169 | 0.2% |
| Costa Rican | 43 | 0.1% |
| Croatian | 54 | 0.1% |
| Cuban | 158 | 0.2% |
| Czech | 532 | 0.7% |
| Czechoslovakian | 36 | 0.1% |
| Danish | 705 | 0.9% |
| Delaware | 10 | 0.0% |
| Dominican | 106 | 0.1% |
| Dutch | 1,409 | 1.8% |
| Eastern European | 314 | 0.4% |
| Ecuadorian | 204 | 0.3% |
| English | 12,365 | 16.2% |
| Estonian | 10 | 0.0% |
| Ethiopian | 9 | 0.0% |
| European | 2,023 | 2.6% |
| Finnish | 496 | 0.6% |
| French | 2,605 | 3.4% |
| French Canadian | 247 | 0.3% |
| German | 20,364 | 26.6% |
| German Russian | 181 | 0.2% |
| Greek | 333 | 0.4% |
| Guamanian / Chamorro | 46 | 0.1% |
| Guatemalan | 24 | 0.0% |
| Guyanese | 7 | 0.0% |
| Honduran | 14 | 0.0% |
| Hopi | 30 | 0.0% |
| Hungarian | 261 | 0.3% |
| Icelander | 15 | 0.0% |
| Indian (Asian) | 446 | 0.6% |
| Iranian | 22 | 0.0% |
| Irish | 10,413 | 13.6% |
| Iroquois | 20 | 0.0% |
| Israeli | 49 | 0.1% |
| Italian | 3,049 | 4.0% |
| Jordanian | 26 | 0.0% |
| Korean | 274 | 0.4% |
| Laotian | 19 | 0.0% |
| Latvian | 15 | 0.0% |
| Lebanese | 87 | 0.1% |
| Lithuanian | 126 | 0.2% |
| Luxembourger | 9 | 0.0% |
| Macedonian | 21 | 0.0% |
| Mexican | 8,022 | 10.5% |
| Mexican American Indian | 8 | 0.0% |
| Native Hawaiian | 26 | 0.0% |
| Navajo | 123 | 0.2% |
| New Zealander | 27 | 0.0% |
| Nicaraguan | 26 | 0.0% |
| Northern European | 190 | 0.3% |
| Norwegian | 2,132 | 2.8% |
| Osage | 7 | 0.0% |
| Ottawa | 12 | 0.0% |
| Pennsylvania German | 10 | 0.0% |
| Peruvian | 65 | 0.1% |
| Polish | 1,824 | 2.4% |
| Portuguese | 223 | 0.3% |
| Pueblo | 43 | 0.1% |
| Puerto Rican | 287 | 0.4% |
| Romanian | 40 | 0.1% |
| Russian | 1,237 | 1.6% |
| Salvadoran | 160 | 0.2% |
| Scandinavian | 793 | 1.0% |
| Scotch-Irish | 1,588 | 2.1% |
| Scottish | 2,252 | 2.9% |
| Seminole | 20 | 0.0% |
| Serbian | 54 | 0.1% |
| Sioux | 21 | 0.0% |
| Slavic | 35 | 0.1% |
| Slovak | 78 | 0.1% |
| Slovene | 32 | 0.0% |
| South African | 27 | 0.0% |
| South American | 472 | 0.6% |
| Spaniard | 264 | 0.4% |
| Spanish | 205 | 0.3% |
| Sri Lankan | 227 | 0.3% |
| Subsaharan African | 72 | 0.1% |
| Swedish | 2,716 | 3.5% |
| Swiss | 324 | 0.4% |
| Syrian | 33 | 0.0% |
| Thai | 62 | 0.1% |
| Tongan | 2 | 0.0% |
| Turkish | 7 | 0.0% |
| Ukrainian | 167 | 0.2% |
| Ute | 7 | 0.0% |
| Welsh | 937 | 1.2% |
| West Indian | 14 | 0.0% |
| Yaqui | 27 | 0.0% |
| Yugoslavian | 18 | 0.0% |
| Yup'ik | 24 | 0.0% | View All 115 Rows |
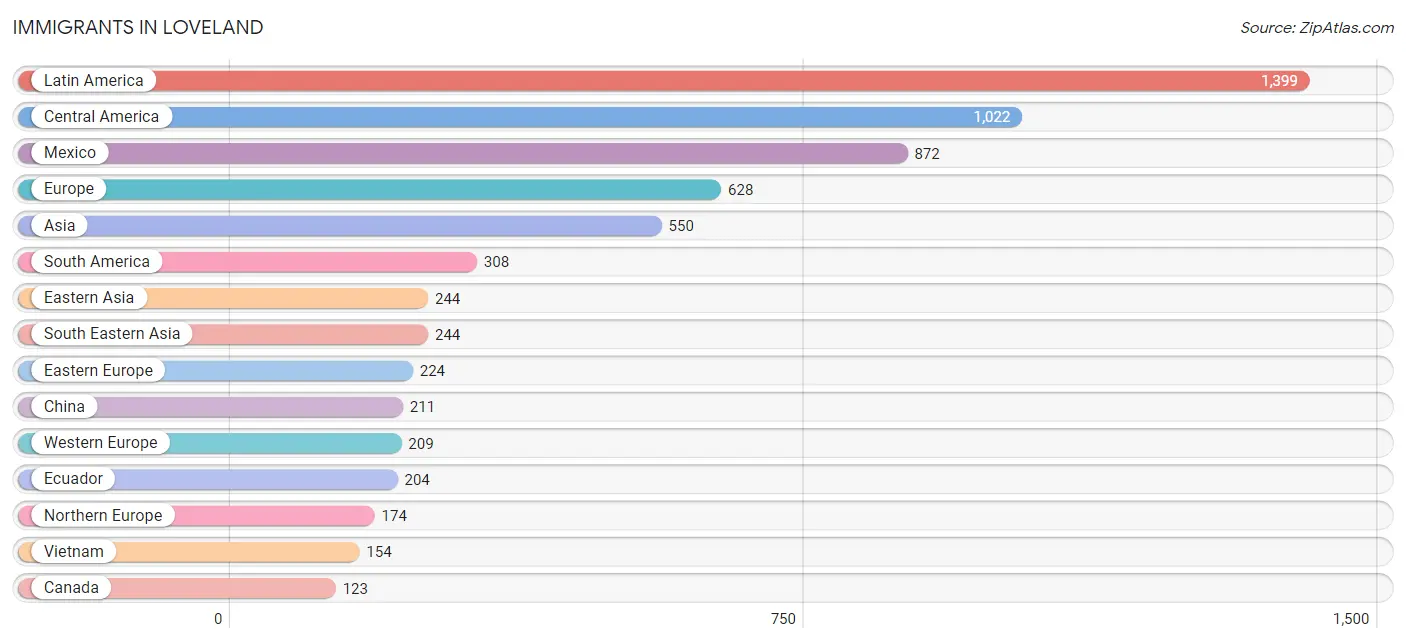
Immigrants in Loveland
The most numerous immigrant groups reported in Loveland came from Latin America (1,399 | 1.8%), Central America (1,022 | 1.3%), Mexico (872 | 1.1%), Europe (628 | 0.8%), and Asia (550 | 0.7%), together accounting for 5.8% of all Loveland residents.
| Immigration Origin | # Population | % Population |
| Africa | 69 | 0.1% |
| Argentina | 8 | 0.0% |
| Asia | 550 | 0.7% |
| Australia | 9 | 0.0% |
| Austria | 15 | 0.0% |
| Belarus | 44 | 0.1% |
| Belgium | 31 | 0.0% |
| Belize | 24 | 0.0% |
| Canada | 123 | 0.2% |
| Caribbean | 69 | 0.1% |
| Central America | 1,022 | 1.3% |
| China | 211 | 0.3% |
| Colombia | 66 | 0.1% |
| Costa Rica | 43 | 0.1% |
| Croatia | 13 | 0.0% |
| Cuba | 15 | 0.0% |
| Denmark | 65 | 0.1% |
| Dominican Republic | 54 | 0.1% |
| Eastern Africa | 9 | 0.0% |
| Eastern Asia | 244 | 0.3% |
| Eastern Europe | 224 | 0.3% |
| Ecuador | 204 | 0.3% |
| El Salvador | 45 | 0.1% |
| England | 13 | 0.0% |
| Ethiopia | 9 | 0.0% |
| Europe | 628 | 0.8% |
| France | 50 | 0.1% |
| Germany | 94 | 0.1% |
| Greece | 21 | 0.0% |
| Guatemala | 24 | 0.0% |
| Guyana | 7 | 0.0% |
| Honduras | 14 | 0.0% |
| Hungary | 82 | 0.1% |
| India | 31 | 0.0% |
| Ireland | 38 | 0.1% |
| Israel | 31 | 0.0% |
| Japan | 23 | 0.0% |
| Korea | 10 | 0.0% |
| Latin America | 1,399 | 1.8% |
| Mexico | 872 | 1.1% |
| Netherlands | 19 | 0.0% |
| Northern Africa | 15 | 0.0% |
| Northern Europe | 174 | 0.2% |
| Oceania | 52 | 0.1% |
| Philippines | 81 | 0.1% |
| Poland | 6 | 0.0% |
| Russia | 71 | 0.1% |
| Scotland | 10 | 0.0% |
| Singapore | 9 | 0.0% |
| South Africa | 45 | 0.1% |
| South America | 308 | 0.4% |
| South Central Asia | 31 | 0.0% |
| South Eastern Asia | 244 | 0.3% |
| Southern Europe | 21 | 0.0% |
| Sudan | 15 | 0.0% |
| Sweden | 9 | 0.0% |
| Taiwan | 13 | 0.0% |
| Ukraine | 8 | 0.0% |
| Venezuela | 23 | 0.0% |
| Vietnam | 154 | 0.2% |
| Western Asia | 31 | 0.0% |
| Western Europe | 209 | 0.3% | View All 62 Rows |
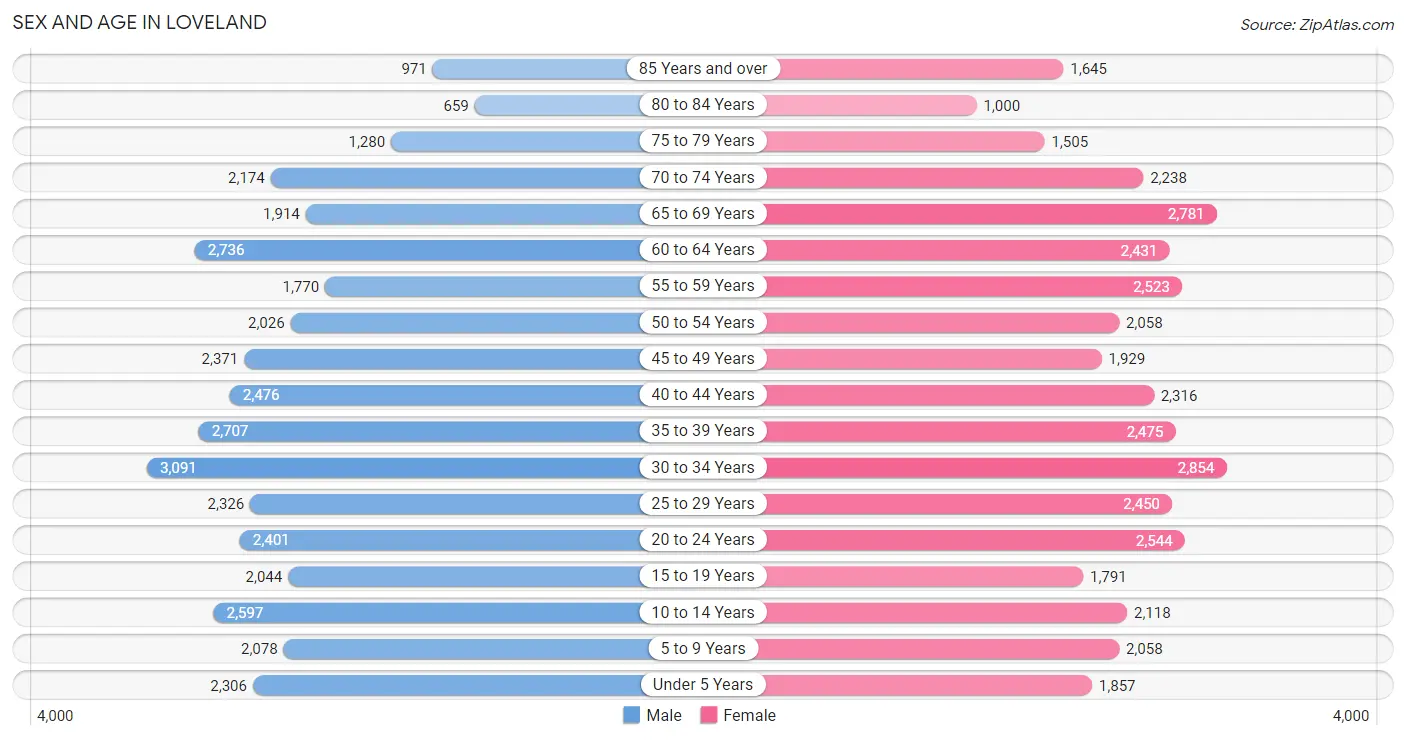
Sex and Age in Loveland
Sex and Age in Loveland
The most populous age groups in Loveland are 30 to 34 Years (3,091 | 8.2%) for men and 30 to 34 Years (2,854 | 7.4%) for women.
| Age Bracket | Male | Female |
| Under 5 Years | 2,306 (6.1%) | 1,857 (4.8%) |
| 5 to 9 Years | 2,078 (5.5%) | 2,058 (5.3%) |
| 10 to 14 Years | 2,597 (6.9%) | 2,118 (5.5%) |
| 15 to 19 Years | 2,044 (5.4%) | 1,791 (4.6%) |
| 20 to 24 Years | 2,401 (6.3%) | 2,544 (6.6%) |
| 25 to 29 Years | 2,326 (6.1%) | 2,450 (6.4%) |
| 30 to 34 Years | 3,091 (8.2%) | 2,854 (7.4%) |
| 35 to 39 Years | 2,707 (7.1%) | 2,475 (6.4%) |
| 40 to 44 Years | 2,476 (6.5%) | 2,316 (6.0%) |
| 45 to 49 Years | 2,371 (6.2%) | 1,929 (5.0%) |
| 50 to 54 Years | 2,026 (5.3%) | 2,058 (5.3%) |
| 55 to 59 Years | 1,770 (4.7%) | 2,523 (6.5%) |
| 60 to 64 Years | 2,736 (7.2%) | 2,431 (6.3%) |
| 65 to 69 Years | 1,914 (5.1%) | 2,781 (7.2%) |
| 70 to 74 Years | 2,174 (5.7%) | 2,238 (5.8%) |
| 75 to 79 Years | 1,280 (3.4%) | 1,505 (3.9%) |
| 80 to 84 Years | 659 (1.7%) | 1,000 (2.6%) |
| 85 Years and over | 971 (2.6%) | 1,645 (4.3%) |
| Total | 37,927 (100.0%) | 38,573 (100.0%) |
Families and Households in Loveland
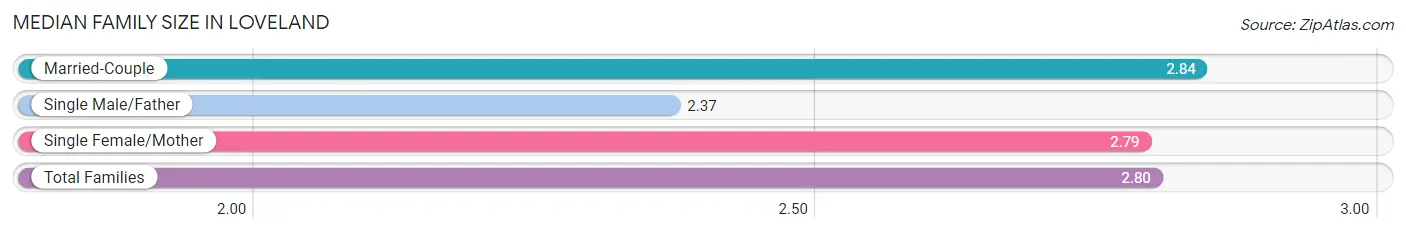
Median Family Size in Loveland
The median family size in Loveland is 2.80 persons per family, with married-couple families (16,540 | 79.4%) accounting for the largest median family size of 2.84 persons per family. On the other hand, single male/father families (1,563 | 7.5%) represent the smallest median family size with 2.37 persons per family.
| Family Type | # Families | Family Size |
| Married-Couple | 16,540 (79.4%) | 2.84 |
| Single Male/Father | 1,563 (7.5%) | 2.37 |
| Single Female/Mother | 2,722 (13.1%) | 2.79 |
| Total Families | 20,825 (100.0%) | 2.80 |
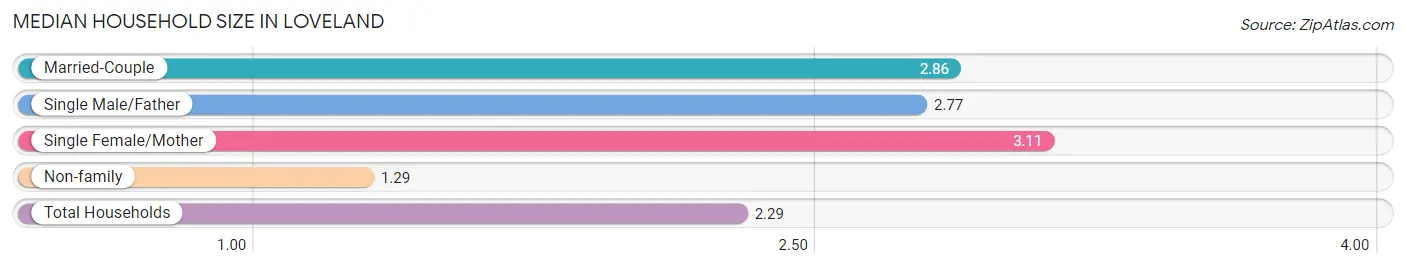
Median Household Size in Loveland
The median household size in Loveland is 2.29 persons per household, with single female/mother households (2,722 | 8.2%) accounting for the largest median household size of 3.11 persons per household. non-family households (12,301 | 37.1%) represent the smallest median household size with 1.29 persons per household.
| Household Type | # Households | Household Size |
| Married-Couple | 16,540 (49.9%) | 2.86 |
| Single Male/Father | 1,563 (4.7%) | 2.77 |
| Single Female/Mother | 2,722 (8.2%) | 3.11 |
| Non-family | 12,301 (37.1%) | 1.29 |
| Total Households | 33,126 (100.0%) | 2.29 |
Household Size by Marriage Status in Loveland
Out of a total of 33,126 households in Loveland, 20,825 (62.9%) are family households, while 12,301 (37.1%) are nonfamily households. The most numerous type of family households are 2-person households, comprising 10,983, and the most common type of nonfamily households are 1-person households, comprising 9,270.
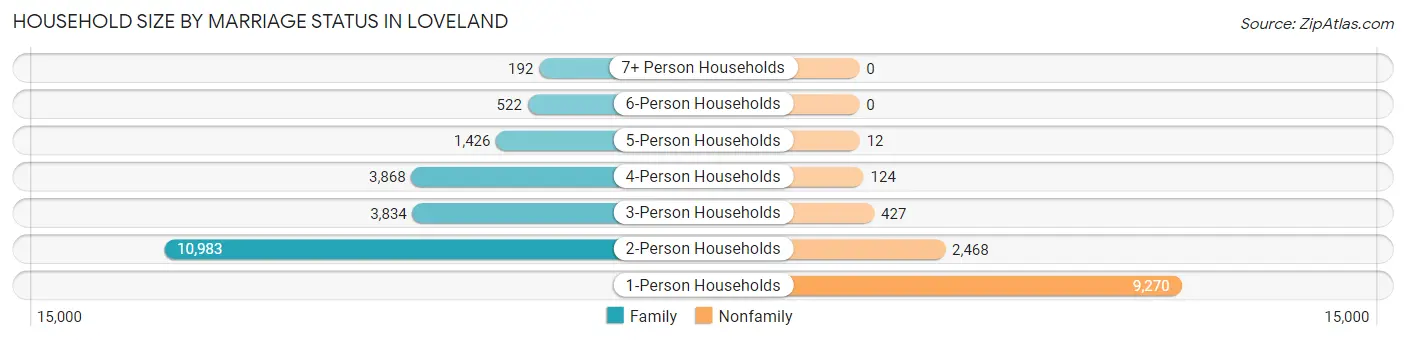
| Household Size | Family Households | Nonfamily Households |
| 1-Person Households | - | 9,270 (28.0%) |
| 2-Person Households | 10,983 (33.2%) | 2,468 (7.4%) |
| 3-Person Households | 3,834 (11.6%) | 427 (1.3%) |
| 4-Person Households | 3,868 (11.7%) | 124 (0.4%) |
| 5-Person Households | 1,426 (4.3%) | 12 (0.0%) |
| 6-Person Households | 522 (1.6%) | 0 (0.0%) |
| 7+ Person Households | 192 (0.6%) | 0 (0.0%) |
| Total | 20,825 (62.9%) | 12,301 (37.1%) |
Female Fertility in Loveland
Fertility by Age in Loveland
Average fertility rate in Loveland is 56.0 births per 1,000 women. Women in the age bracket of 20 to 34 years have the highest fertility rate with 81.0 births per 1,000 women. Women in the age bracket of 20 to 34 years acount for 67.5% of all women with births.
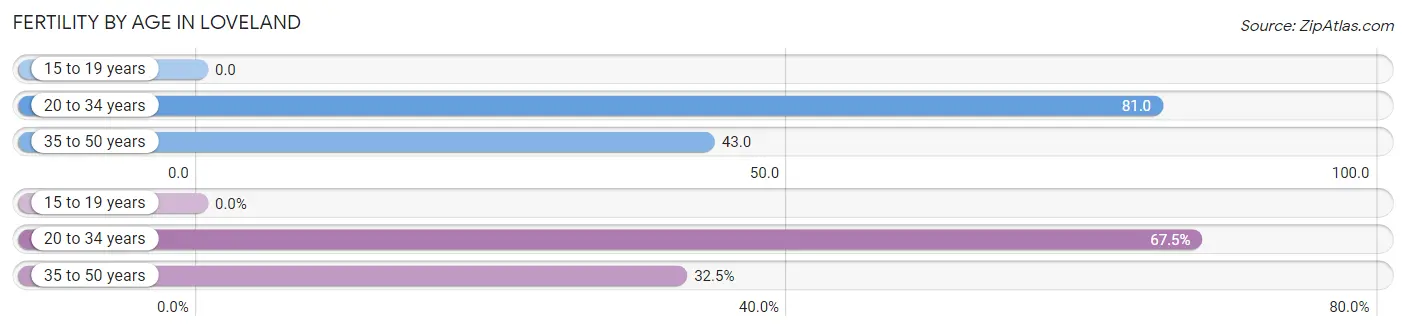
| Age Bracket | Women with Births | Births / 1,000 Women |
| 15 to 19 years | 0 (0.0%) | 0.0 |
| 20 to 34 years | 635 (67.5%) | 81.0 |
| 35 to 50 years | 306 (32.5%) | 43.0 |
| Total | 941 (100.0%) | 56.0 |
Fertility by Age by Marriage Status in Loveland
65.6% of women with births (941) in Loveland are married. The highest percentage of unmarried women with births falls into 20 to 34 years age bracket with 35.3% of them unmarried at the time of birth, while the lowest percentage of unmarried women with births belong to 35 to 50 years age bracket with 32.7% of them unmarried.
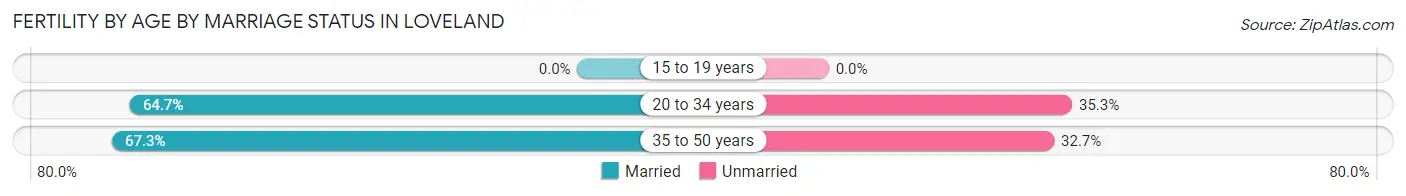
| Age Bracket | Married | Unmarried |
| 15 to 19 years | 0 (0.0%) | 0 (0.0%) |
| 20 to 34 years | 411 (64.7%) | 224 (35.3%) |
| 35 to 50 years | 206 (67.3%) | 100 (32.7%) |
| Total | 617 (65.6%) | 324 (34.4%) |
Fertility by Education in Loveland
Average fertility rate in Loveland is 56.0 births per 1,000 women. Women with the education attainment of college or associate's degree have the highest fertility rate of 105.0 births per 1,000 women, while women with the education attainment of high school diploma have the lowest fertility at 16.0 births per 1,000 women. Women with the education attainment of college or associate's degree represent 54.9% of all women with births.
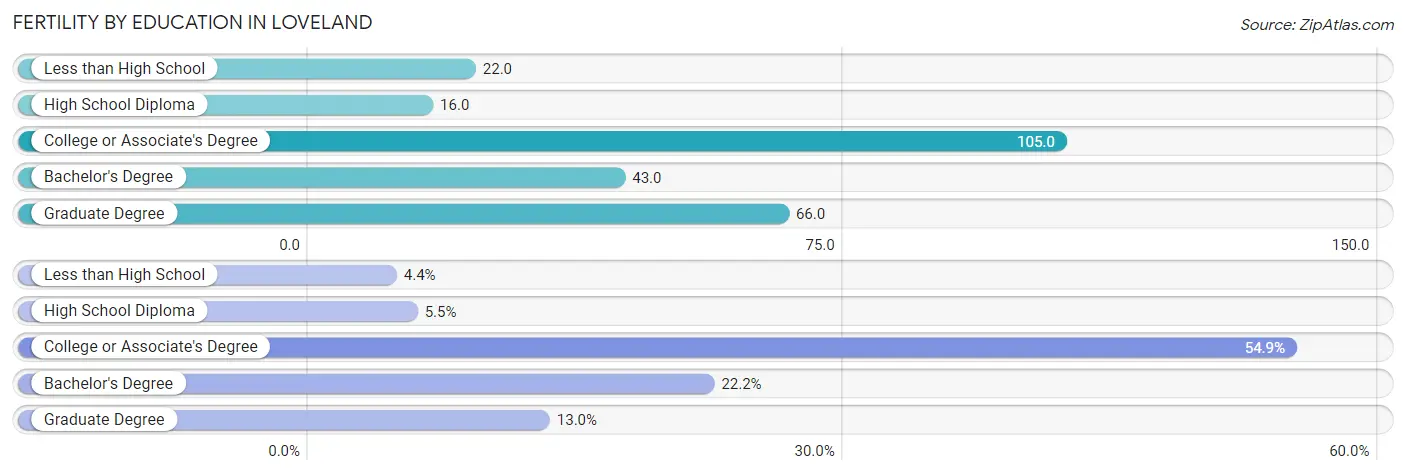
| Educational Attainment | Women with Births | Births / 1,000 Women |
| Less than High School | 41 (4.4%) | 22.0 |
| High School Diploma | 52 (5.5%) | 16.0 |
| College or Associate's Degree | 517 (54.9%) | 105.0 |
| Bachelor's Degree | 209 (22.2%) | 43.0 |
| Graduate Degree | 122 (13.0%) | 66.0 |
| Total | 941 (100.0%) | 56.0 |
Fertility by Education by Marriage Status in Loveland
34.4% of women with births in Loveland are unmarried. Women with the educational attainment of bachelor's degree are most likely to be married with 100.0% of them married at childbirth, while women with the educational attainment of high school diploma are least likely to be married with 57.7% of them unmarried at childbirth.
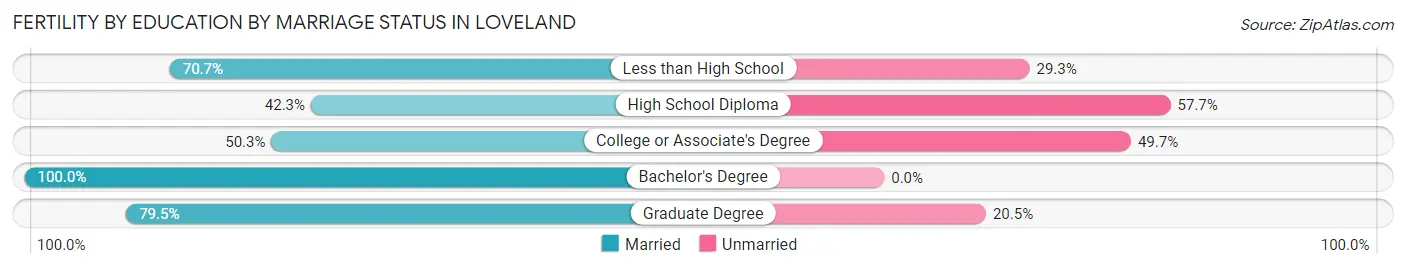
| Educational Attainment | Married | Unmarried |
| Less than High School | 29 (70.7%) | 12 (29.3%) |
| High School Diploma | 22 (42.3%) | 30 (57.7%) |
| College or Associate's Degree | 260 (50.3%) | 257 (49.7%) |
| Bachelor's Degree | 209 (100.0%) | 0 (0.0%) |
| Graduate Degree | 97 (79.5%) | 25 (20.5%) |
| Total | 617 (65.6%) | 324 (34.4%) |
Employment Characteristics in Loveland
Employment by Class of Employer in Loveland
Among the 38,469 employed individuals in Loveland, private company employees (26,040 | 67.7%), local government employees (2,683 | 7.0%), and self-employed (not incorporated) (2,613 | 6.8%) make up the most common classes of employment.
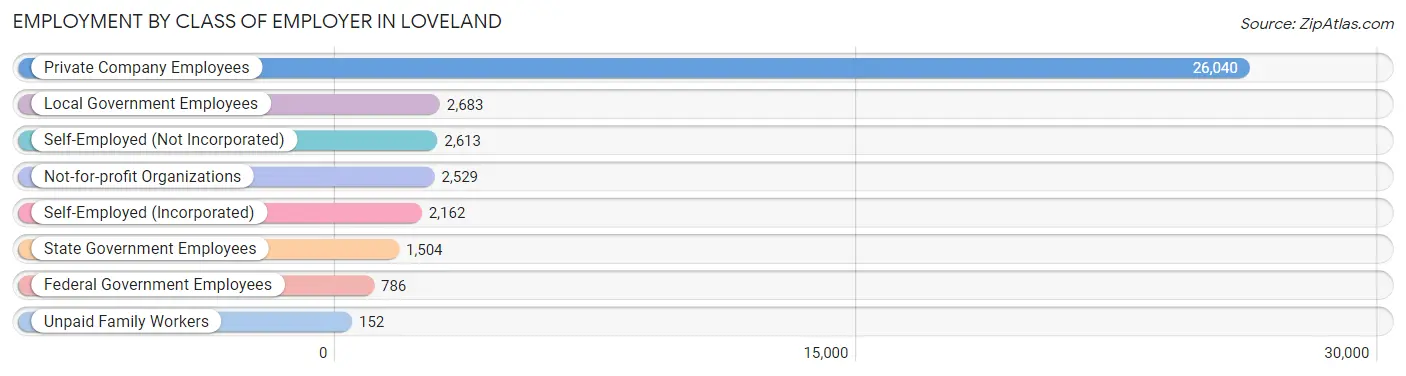
| Employer Class | # Employees | % Employees |
| Private Company Employees | 26,040 | 67.7% |
| Self-Employed (Incorporated) | 2,162 | 5.6% |
| Self-Employed (Not Incorporated) | 2,613 | 6.8% |
| Not-for-profit Organizations | 2,529 | 6.6% |
| Local Government Employees | 2,683 | 7.0% |
| State Government Employees | 1,504 | 3.9% |
| Federal Government Employees | 786 | 2.0% |
| Unpaid Family Workers | 152 | 0.4% |
| Total | 38,469 | 100.0% |
Employment Status by Age in Loveland
According to the labor force statistics for Loveland, out of the total population over 16 years of age (62,679), 65.0% or 40,741 individuals are in the labor force, with 4.4% or 1,793 of them unemployed. The age group with the highest labor force participation rate is 35 to 44 years, with 91.5% or 9,126 individuals in the labor force. Within the labor force, the 16 to 19 years age range has the highest percentage of unemployed individuals, with 16.2% or 285 of them being unemployed.
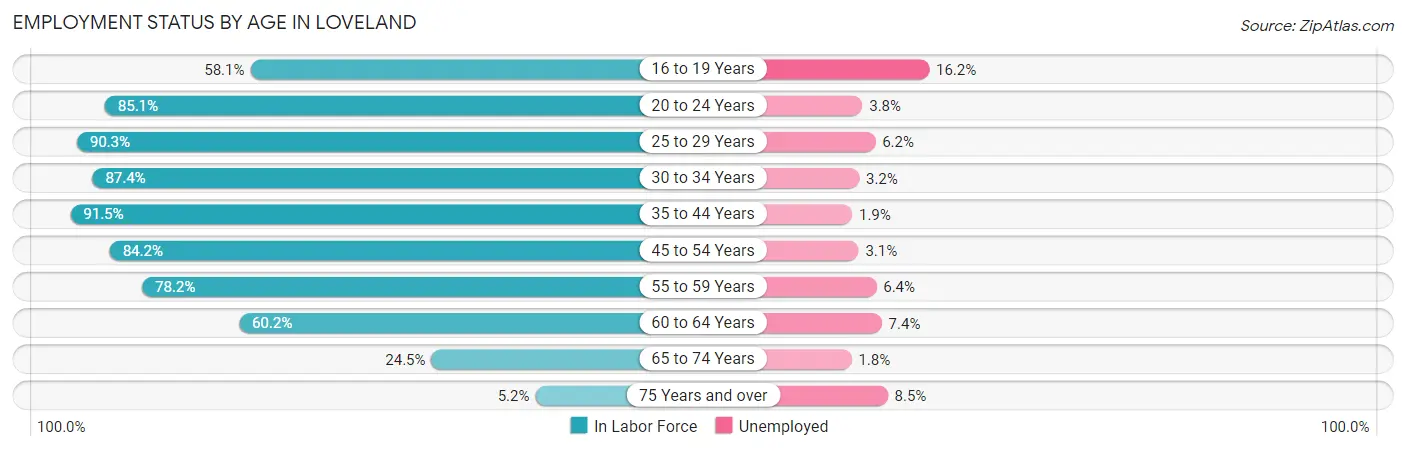
| Age Bracket | In Labor Force | Unemployed |
| 16 to 19 Years | 1,759 (58.1%) | 285 (16.2%) |
| 20 to 24 Years | 4,208 (85.1%) | 160 (3.8%) |
| 25 to 29 Years | 4,313 (90.3%) | 267 (6.2%) |
| 30 to 34 Years | 5,196 (87.4%) | 166 (3.2%) |
| 35 to 44 Years | 9,126 (91.5%) | 173 (1.9%) |
| 45 to 54 Years | 7,059 (84.2%) | 219 (3.1%) |
| 55 to 59 Years | 3,357 (78.2%) | 215 (6.4%) |
| 60 to 64 Years | 3,111 (60.2%) | 230 (7.4%) |
| 65 to 74 Years | 2,231 (24.5%) | 40 (1.8%) |
| 75 Years and over | 367 (5.2%) | 31 (8.5%) |
| Total | 40,741 (65.0%) | 1,793 (4.4%) |
Employment Status by Educational Attainment in Loveland
According to labor force statistics for Loveland, 83.5% of individuals (32,180) out of the total population between 25 and 64 years of age (38,539) are in the labor force, with 4.0% or 1,287 of them being unemployed. The group with the highest labor force participation rate are those with the educational attainment of bachelor's degree or higher, with 87.1% or 14,034 individuals in the labor force. Within the labor force, individuals with college / associate degree education have the highest percentage of unemployment, with 5.3% or 539 of them being unemployed.
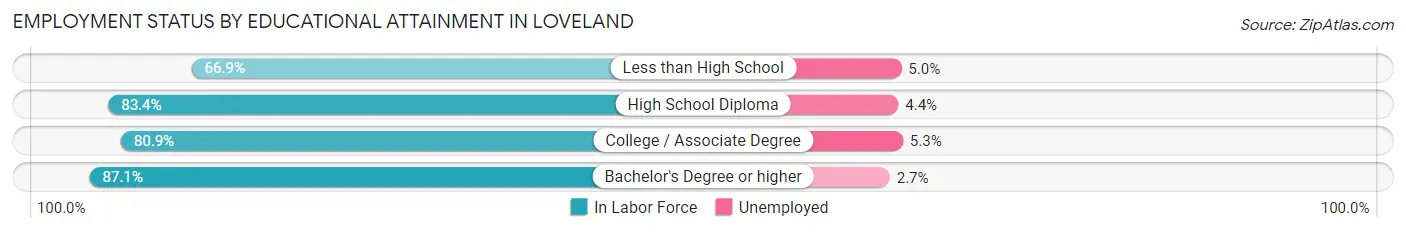
| Educational Attainment | In Labor Force | Unemployed |
| Less than High School | 1,048 (66.9%) | 78 (5.0%) |
| High School Diploma | 6,903 (83.4%) | 364 (4.4%) |
| College / Associate Degree | 10,179 (80.9%) | 667 (5.3%) |
| Bachelor's Degree or higher | 14,034 (87.1%) | 435 (2.7%) |
| Total | 32,180 (83.5%) | 1,542 (4.0%) |
Employment Occupations by Sex in Loveland
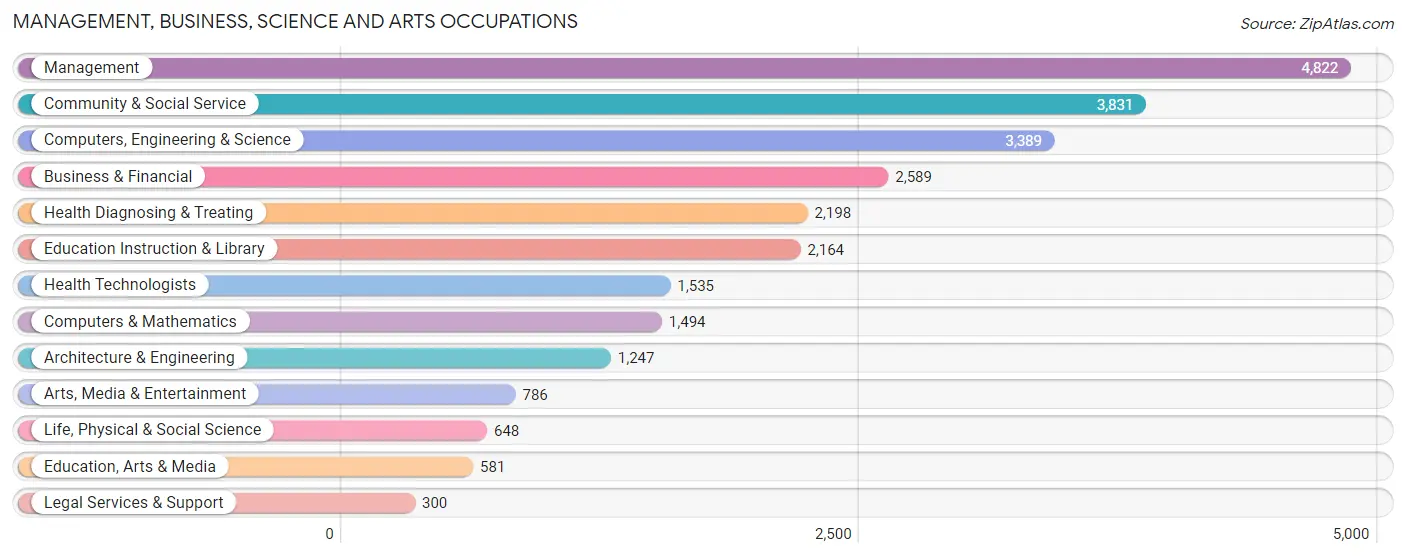
Management, Business, Science and Arts Occupations
The most common Management, Business, Science and Arts occupations in Loveland are Management (4,822 | 12.4%), Community & Social Service (3,831 | 9.8%), Computers, Engineering & Science (3,389 | 8.7%), Business & Financial (2,589 | 6.7%), and Health Diagnosing & Treating (2,198 | 5.7%).
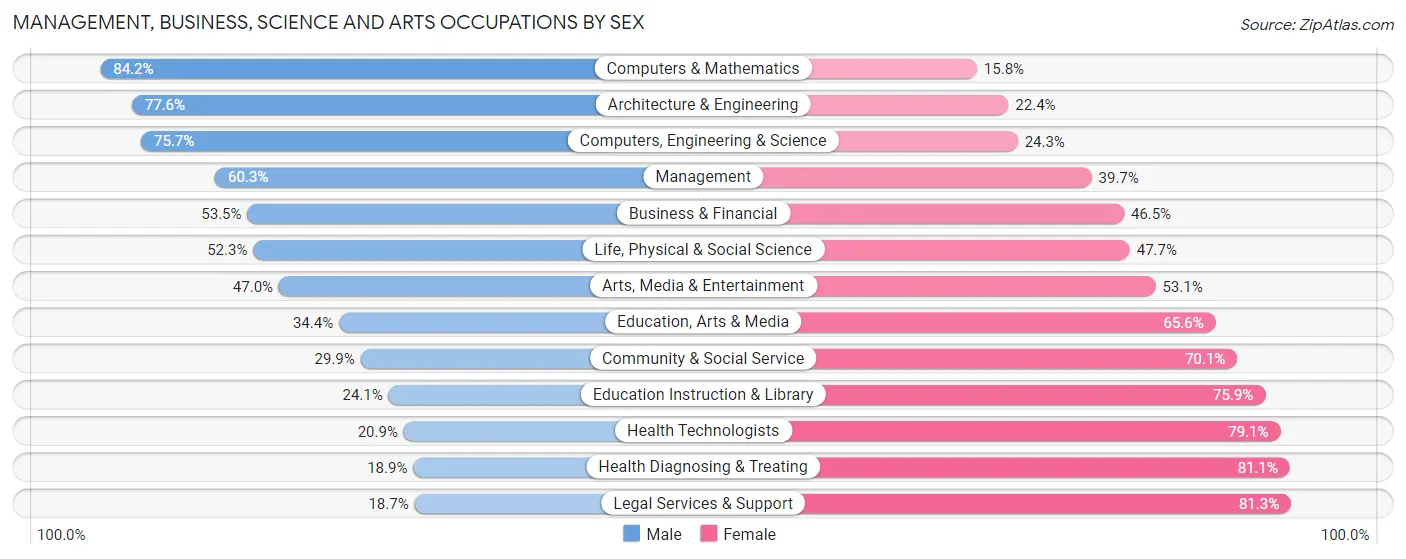
Management, Business, Science and Arts Occupations by Sex
Within the Management, Business, Science and Arts occupations in Loveland, the most male-oriented occupations are Computers & Mathematics (84.2%), Architecture & Engineering (77.6%), and Computers, Engineering & Science (75.7%), while the most female-oriented occupations are Legal Services & Support (81.3%), Health Diagnosing & Treating (81.1%), and Health Technologists (79.1%).
| Occupation | Male | Female |
| Management | 2,906 (60.3%) | 1,916 (39.7%) |
| Business & Financial | 1,386 (53.5%) | 1,203 (46.5%) |
| Computers, Engineering & Science | 2,565 (75.7%) | 824 (24.3%) |
| Computers & Mathematics | 1,258 (84.2%) | 236 (15.8%) |
| Architecture & Engineering | 968 (77.6%) | 279 (22.4%) |
| Life, Physical & Social Science | 339 (52.3%) | 309 (47.7%) |
| Community & Social Service | 1,146 (29.9%) | 2,685 (70.1%) |
| Education, Arts & Media | 200 (34.4%) | 381 (65.6%) |
| Legal Services & Support | 56 (18.7%) | 244 (81.3%) |
| Education Instruction & Library | 521 (24.1%) | 1,643 (75.9%) |
| Arts, Media & Entertainment | 369 (46.9%) | 417 (53.0%) |
| Health Diagnosing & Treating | 416 (18.9%) | 1,782 (81.1%) |
| Health Technologists | 321 (20.9%) | 1,214 (79.1%) |
| Total (Category) | 8,419 (50.0%) | 8,410 (50.0%) |
| Total (Overall) | 20,662 (53.1%) | 18,258 (46.9%) |
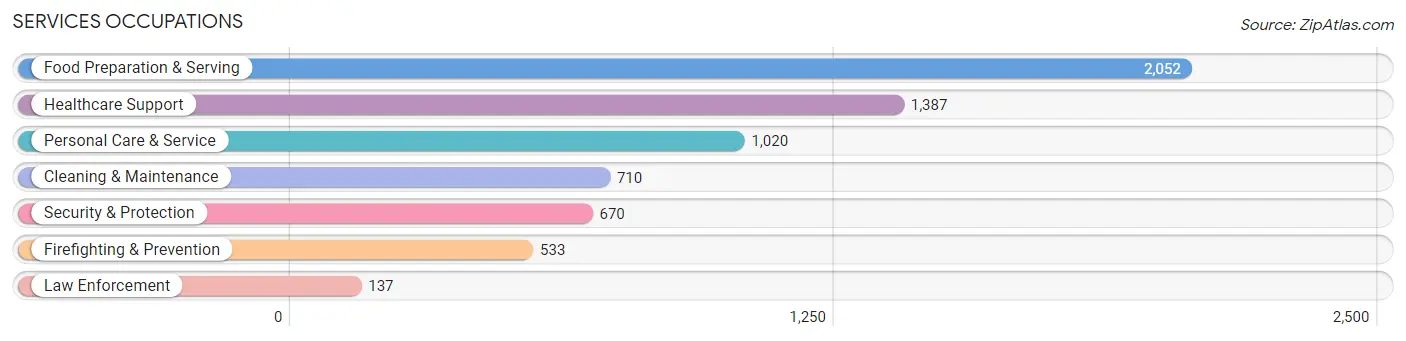
Services Occupations
The most common Services occupations in Loveland are Food Preparation & Serving (2,052 | 5.3%), Healthcare Support (1,387 | 3.6%), Personal Care & Service (1,020 | 2.6%), Cleaning & Maintenance (710 | 1.8%), and Security & Protection (670 | 1.7%).
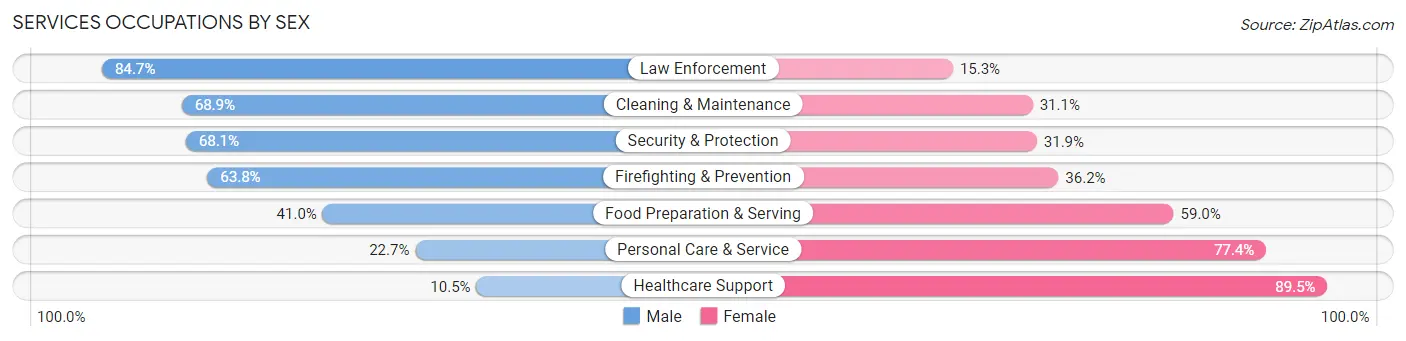
Services Occupations by Sex
Within the Services occupations in Loveland, the most male-oriented occupations are Law Enforcement (84.7%), Cleaning & Maintenance (68.9%), and Security & Protection (68.1%), while the most female-oriented occupations are Healthcare Support (89.5%), Personal Care & Service (77.3%), and Food Preparation & Serving (59.0%).
| Occupation | Male | Female |
| Healthcare Support | 146 (10.5%) | 1,241 (89.5%) |
| Security & Protection | 456 (68.1%) | 214 (31.9%) |
| Firefighting & Prevention | 340 (63.8%) | 193 (36.2%) |
| Law Enforcement | 116 (84.7%) | 21 (15.3%) |
| Food Preparation & Serving | 841 (41.0%) | 1,211 (59.0%) |
| Cleaning & Maintenance | 489 (68.9%) | 221 (31.1%) |
| Personal Care & Service | 231 (22.7%) | 789 (77.3%) |
| Total (Category) | 2,163 (37.0%) | 3,676 (63.0%) |
| Total (Overall) | 20,662 (53.1%) | 18,258 (46.9%) |
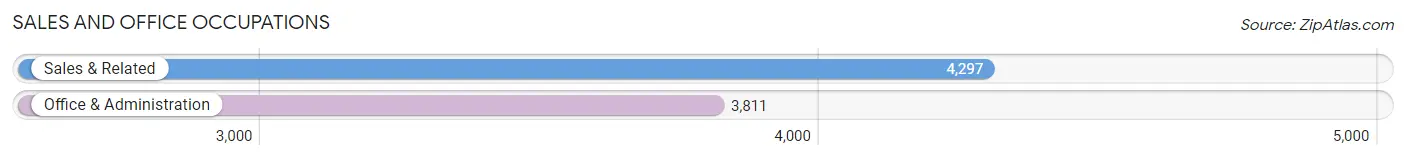
Sales and Office Occupations
The most common Sales and Office occupations in Loveland are Sales & Related (4,297 | 11.0%), and Office & Administration (3,811 | 9.8%).
Sales and Office Occupations by Sex
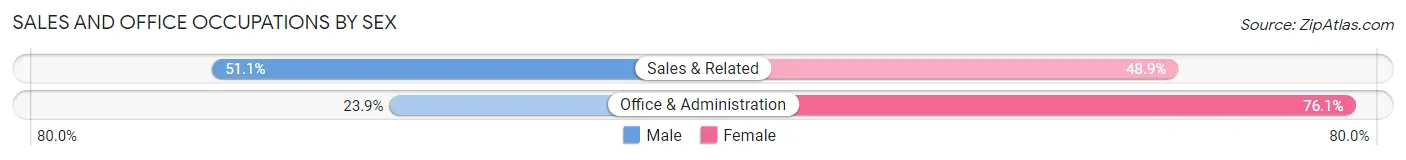
| Occupation | Male | Female |
| Sales & Related | 2,197 (51.1%) | 2,100 (48.9%) |
| Office & Administration | 910 (23.9%) | 2,901 (76.1%) |
| Total (Category) | 3,107 (38.3%) | 5,001 (61.7%) |
| Total (Overall) | 20,662 (53.1%) | 18,258 (46.9%) |
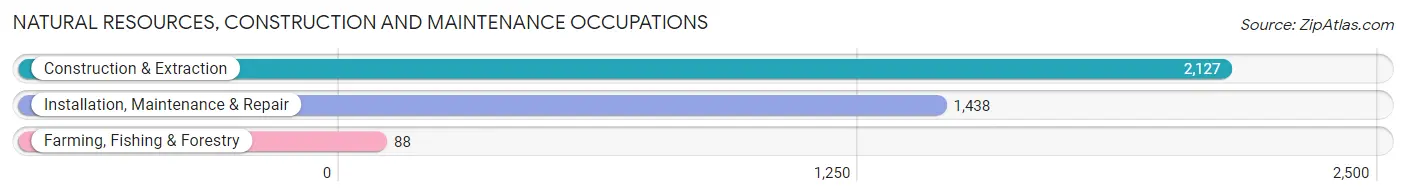
Natural Resources, Construction and Maintenance Occupations
The most common Natural Resources, Construction and Maintenance occupations in Loveland are Construction & Extraction (2,127 | 5.5%), Installation, Maintenance & Repair (1,438 | 3.7%), and Farming, Fishing & Forestry (88 | 0.2%).
Natural Resources, Construction and Maintenance Occupations by Sex
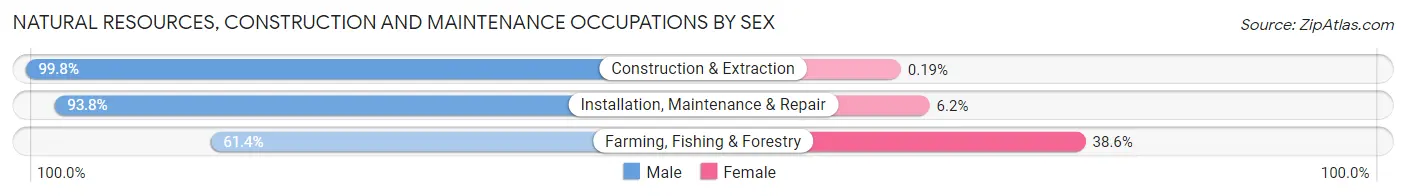
| Occupation | Male | Female |
| Farming, Fishing & Forestry | 54 (61.4%) | 34 (38.6%) |
| Construction & Extraction | 2,123 (99.8%) | 4 (0.2%) |
| Installation, Maintenance & Repair | 1,349 (93.8%) | 89 (6.2%) |
| Total (Category) | 3,526 (96.5%) | 127 (3.5%) |
| Total (Overall) | 20,662 (53.1%) | 18,258 (46.9%) |
Production, Transportation and Moving Occupations
The most common Production, Transportation and Moving occupations in Loveland are Production (2,554 | 6.6%), Material Moving (981 | 2.5%), and Transportation (956 | 2.5%).
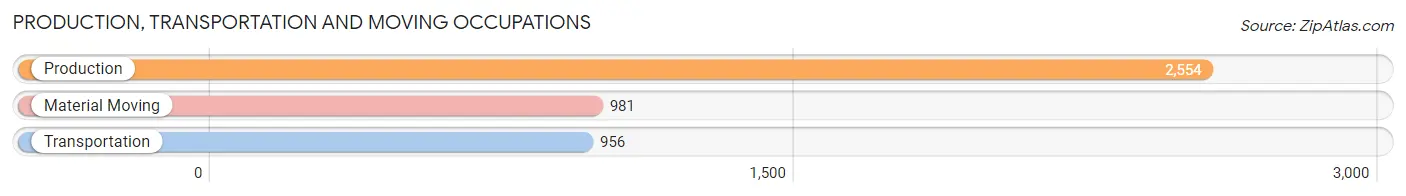
Production, Transportation and Moving Occupations by Sex
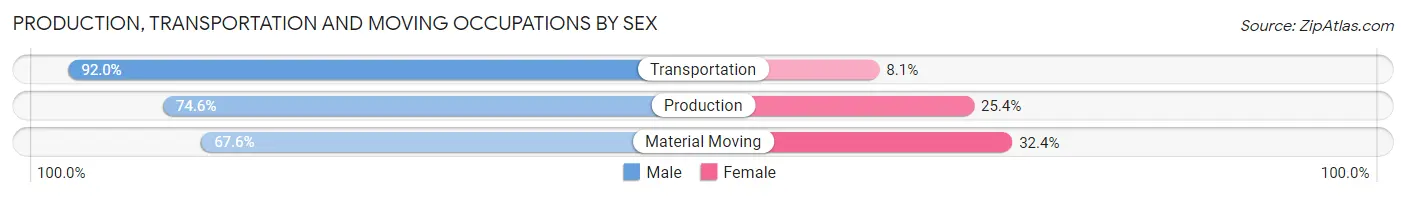
| Occupation | Male | Female |
| Production | 1,905 (74.6%) | 649 (25.4%) |
| Transportation | 879 (91.9%) | 77 (8.1%) |
| Material Moving | 663 (67.6%) | 318 (32.4%) |
| Total (Category) | 3,447 (76.7%) | 1,044 (23.3%) |
| Total (Overall) | 20,662 (53.1%) | 18,258 (46.9%) |
Employment Industries by Sex in Loveland
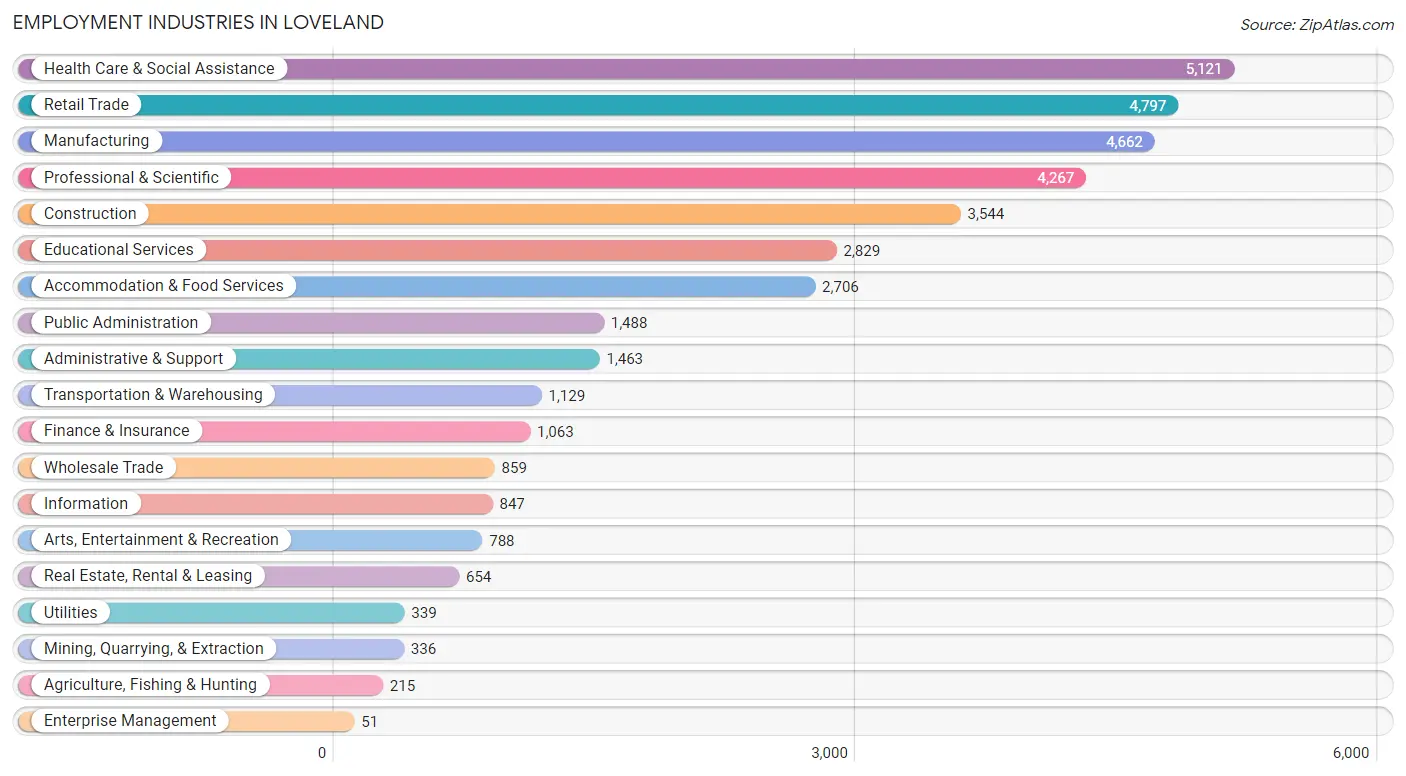
Employment Industries in Loveland
The major employment industries in Loveland include Health Care & Social Assistance (5,121 | 13.2%), Retail Trade (4,797 | 12.3%), Manufacturing (4,662 | 12.0%), Professional & Scientific (4,267 | 11.0%), and Construction (3,544 | 9.1%).
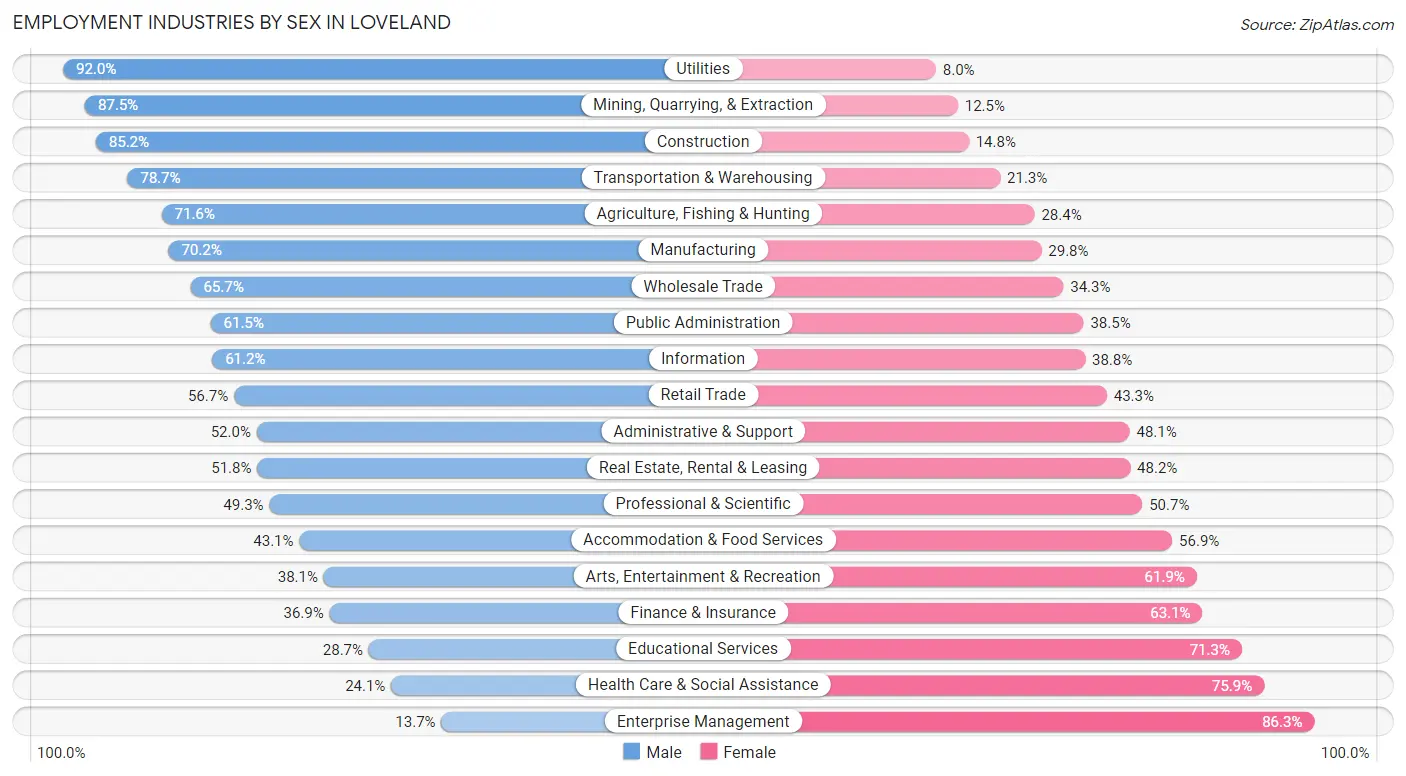
Employment Industries by Sex in Loveland
The Loveland industries that see more men than women are Utilities (92.0%), Mining, Quarrying, & Extraction (87.5%), and Construction (85.2%), whereas the industries that tend to have a higher number of women are Enterprise Management (86.3%), Health Care & Social Assistance (75.9%), and Educational Services (71.3%).
| Industry | Male | Female |
| Agriculture, Fishing & Hunting | 154 (71.6%) | 61 (28.4%) |
| Mining, Quarrying, & Extraction | 294 (87.5%) | 42 (12.5%) |
| Construction | 3,021 (85.2%) | 523 (14.8%) |
| Manufacturing | 3,273 (70.2%) | 1,389 (29.8%) |
| Wholesale Trade | 564 (65.7%) | 295 (34.3%) |
| Retail Trade | 2,718 (56.7%) | 2,079 (43.3%) |
| Transportation & Warehousing | 889 (78.7%) | 240 (21.3%) |
| Utilities | 312 (92.0%) | 27 (8.0%) |
| Information | 518 (61.2%) | 329 (38.8%) |
| Finance & Insurance | 392 (36.9%) | 671 (63.1%) |
| Real Estate, Rental & Leasing | 339 (51.8%) | 315 (48.2%) |
| Professional & Scientific | 2,105 (49.3%) | 2,162 (50.7%) |
| Enterprise Management | 7 (13.7%) | 44 (86.3%) |
| Administrative & Support | 760 (51.9%) | 703 (48.0%) |
| Educational Services | 813 (28.7%) | 2,016 (71.3%) |
| Health Care & Social Assistance | 1,235 (24.1%) | 3,886 (75.9%) |
| Arts, Entertainment & Recreation | 300 (38.1%) | 488 (61.9%) |
| Accommodation & Food Services | 1,167 (43.1%) | 1,539 (56.9%) |
| Public Administration | 915 (61.5%) | 573 (38.5%) |
| Total | 20,662 (53.1%) | 18,258 (46.9%) |
Education in Loveland
School Enrollment in Loveland
The most common levels of schooling among the 15,472 students in Loveland are middle school (3,689 | 23.8%), high school (3,225 | 20.8%), and elementary school (3,027 | 19.6%).
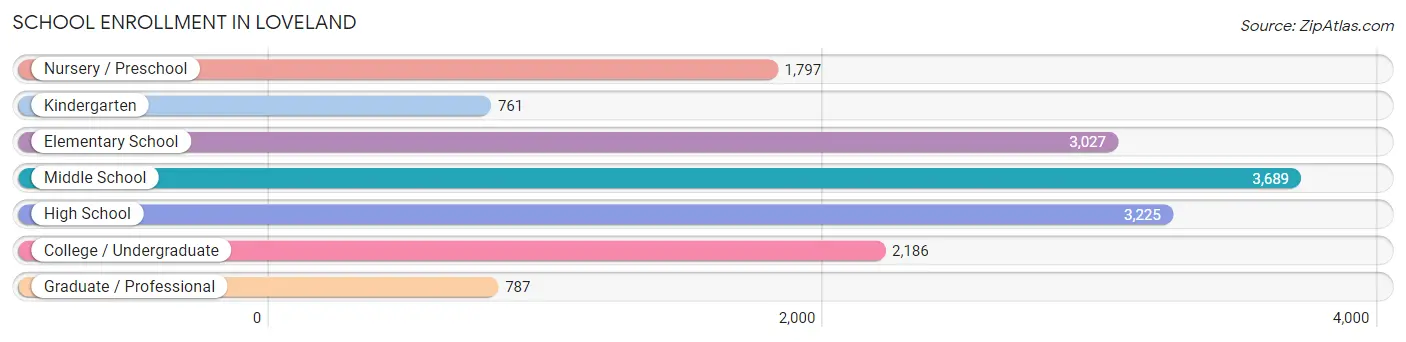
| School Level | # Students | % Students |
| Nursery / Preschool | 1,797 | 11.6% |
| Kindergarten | 761 | 4.9% |
| Elementary School | 3,027 | 19.6% |
| Middle School | 3,689 | 23.8% |
| High School | 3,225 | 20.8% |
| College / Undergraduate | 2,186 | 14.1% |
| Graduate / Professional | 787 | 5.1% |
| Total | 15,472 | 100.0% |
School Enrollment by Age by Funding Source in Loveland
Out of a total of 15,472 students who are enrolled in schools in Loveland, 2,940 (19.0%) attend a private institution, while the remaining 12,532 (81.0%) are enrolled in public schools. The age group of 3 to 4 year olds has the highest likelihood of being enrolled in private schools, with 781 (56.6% in the age bracket) enrolled. Conversely, the age group of 20 to 24 year olds has the lowest likelihood of being enrolled in a private school, with 1,215 (96.4% in the age bracket) attending a public institution.
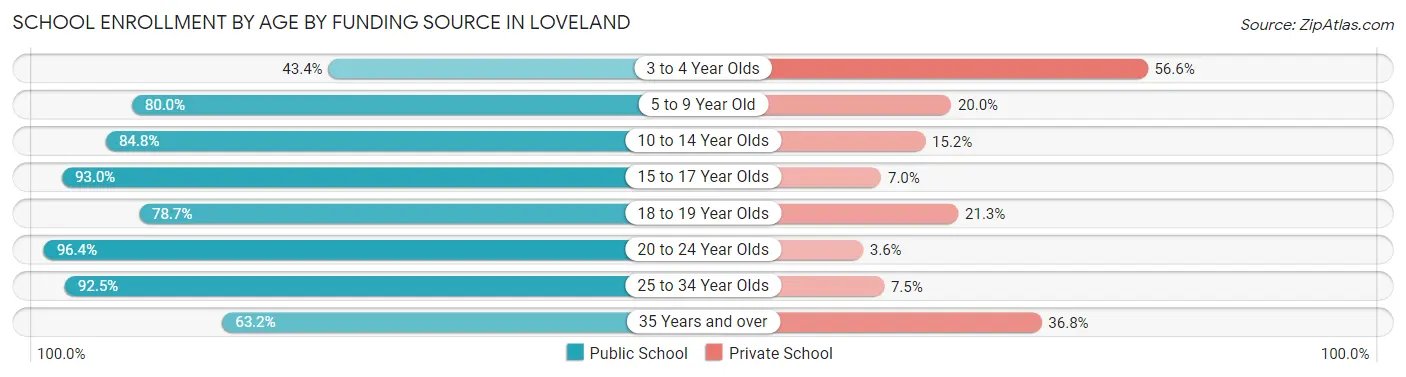
| Age Bracket | Public School | Private School |
| 3 to 4 Year Olds | 599 (43.4%) | 781 (56.6%) |
| 5 to 9 Year Old | 3,103 (80.0%) | 775 (20.0%) |
| 10 to 14 Year Olds | 3,792 (84.8%) | 678 (15.2%) |
| 15 to 17 Year Olds | 1,977 (93.0%) | 148 (7.0%) |
| 18 to 19 Year Olds | 775 (78.7%) | 210 (21.3%) |
| 20 to 24 Year Olds | 1,215 (96.4%) | 45 (3.6%) |
| 25 to 34 Year Olds | 653 (92.5%) | 53 (7.5%) |
| 35 Years and over | 422 (63.2%) | 246 (36.8%) |
| Total | 12,532 (81.0%) | 2,940 (19.0%) |
Educational Attainment by Field of Study in Loveland
Business (4,012 | 17.1%), education (2,414 | 10.3%), science & technology (2,369 | 10.1%), engineering (2,198 | 9.4%), and social sciences (2,027 | 8.7%) are the most common fields of study among 23,413 individuals in Loveland who have obtained a bachelor's degree or higher.
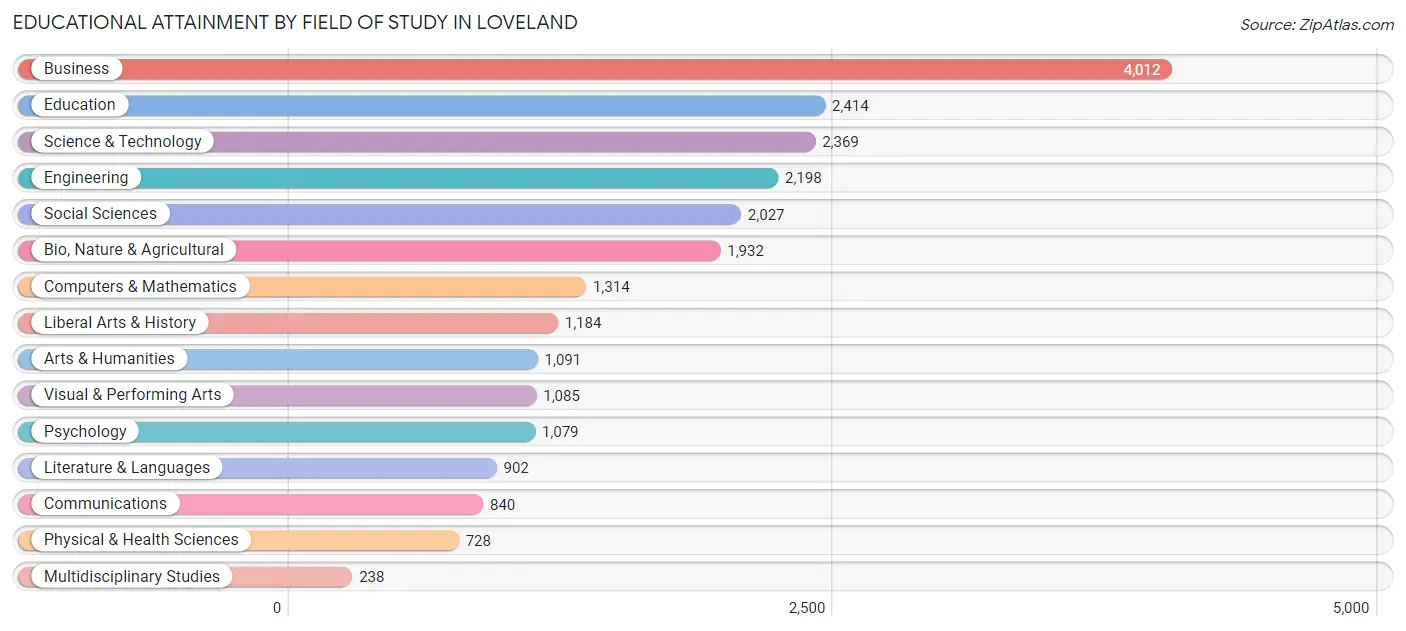
| Field of Study | # Graduates | % Graduates |
| Computers & Mathematics | 1,314 | 5.6% |
| Bio, Nature & Agricultural | 1,932 | 8.3% |
| Physical & Health Sciences | 728 | 3.1% |
| Psychology | 1,079 | 4.6% |
| Social Sciences | 2,027 | 8.7% |
| Engineering | 2,198 | 9.4% |
| Multidisciplinary Studies | 238 | 1.0% |
| Science & Technology | 2,369 | 10.1% |
| Business | 4,012 | 17.1% |
| Education | 2,414 | 10.3% |
| Literature & Languages | 902 | 3.8% |
| Liberal Arts & History | 1,184 | 5.1% |
| Visual & Performing Arts | 1,085 | 4.6% |
| Communications | 840 | 3.6% |
| Arts & Humanities | 1,091 | 4.7% |
| Total | 23,413 | 100.0% |
Transportation & Commute in Loveland
Vehicle Availability by Sex in Loveland
The most prevalent vehicle ownership categories in Loveland are males with 2 vehicles (8,983, accounting for 44.0%) and females with 2 vehicles (8,110, making up 49.9%).
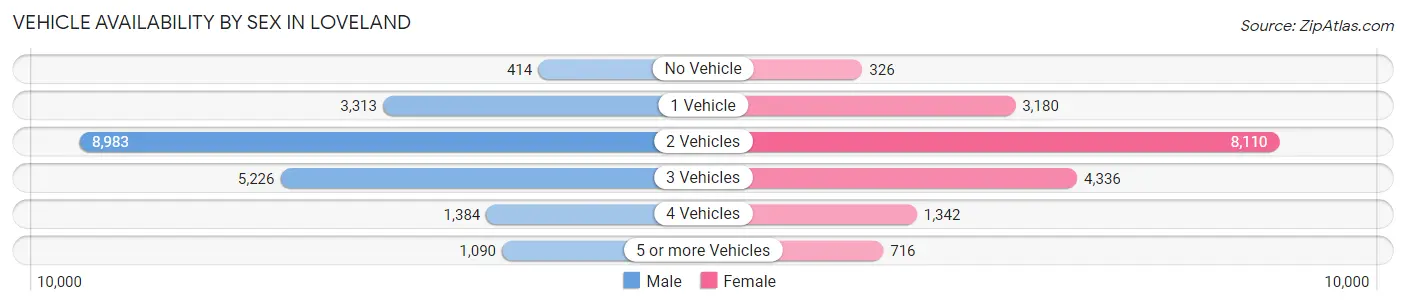
| Vehicles Available | Male | Female |
| No Vehicle | 414 (2.0%) | 326 (1.8%) |
| 1 Vehicle | 3,313 (16.2%) | 3,180 (17.7%) |
| 2 Vehicles | 8,983 (44.0%) | 8,110 (45.0%) |
| 3 Vehicles | 5,226 (25.6%) | 4,336 (24.1%) |
| 4 Vehicles | 1,384 (6.8%) | 1,342 (7.4%) |
| 5 or more Vehicles | 1,090 (5.3%) | 716 (4.0%) |
| Total | 20,410 (100.0%) | 18,010 (100.0%) |
Commute Time in Loveland
The most frequently occuring commute durations in Loveland are 30 to 34 minutes (5,633 commuters, 17.3%), 20 to 24 minutes (5,487 commuters, 16.9%), and 15 to 19 minutes (4,611 commuters, 14.2%).
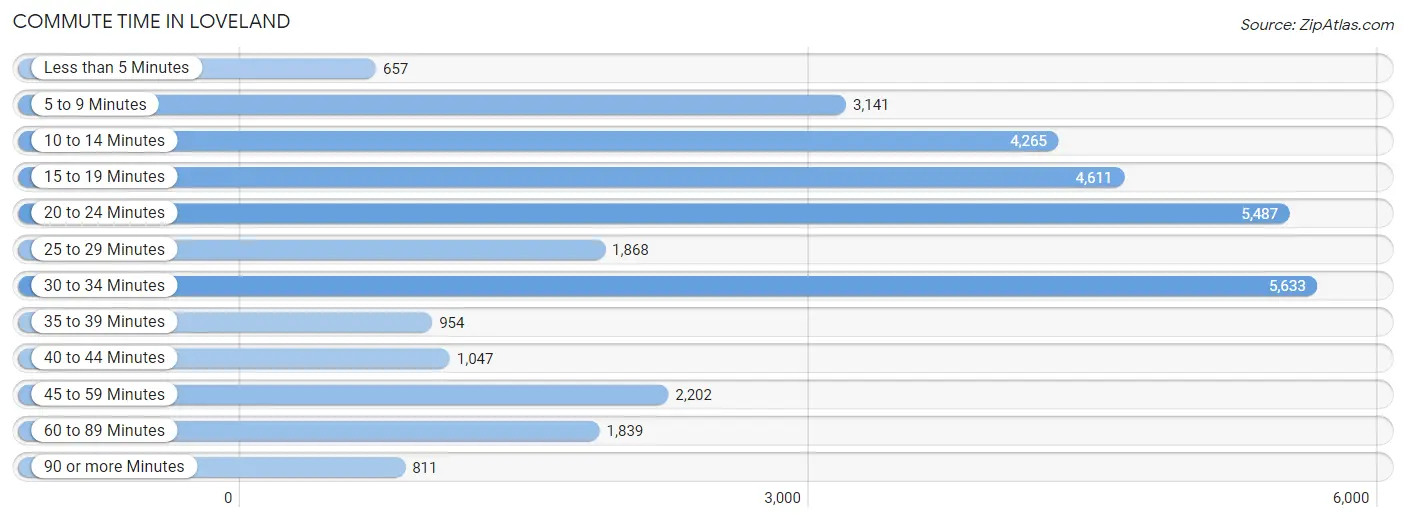
| Commute Time | # Commuters | % Commuters |
| Less than 5 Minutes | 657 | 2.0% |
| 5 to 9 Minutes | 3,141 | 9.7% |
| 10 to 14 Minutes | 4,265 | 13.1% |
| 15 to 19 Minutes | 4,611 | 14.2% |
| 20 to 24 Minutes | 5,487 | 16.9% |
| 25 to 29 Minutes | 1,868 | 5.8% |
| 30 to 34 Minutes | 5,633 | 17.3% |
| 35 to 39 Minutes | 954 | 2.9% |
| 40 to 44 Minutes | 1,047 | 3.2% |
| 45 to 59 Minutes | 2,202 | 6.8% |
| 60 to 89 Minutes | 1,839 | 5.7% |
| 90 or more Minutes | 811 | 2.5% |
Commute Time by Sex in Loveland
The most common commute times in Loveland are 20 to 24 minutes (3,067 commuters, 17.4%) for males and 30 to 34 minutes (2,710 commuters, 18.2%) for females.
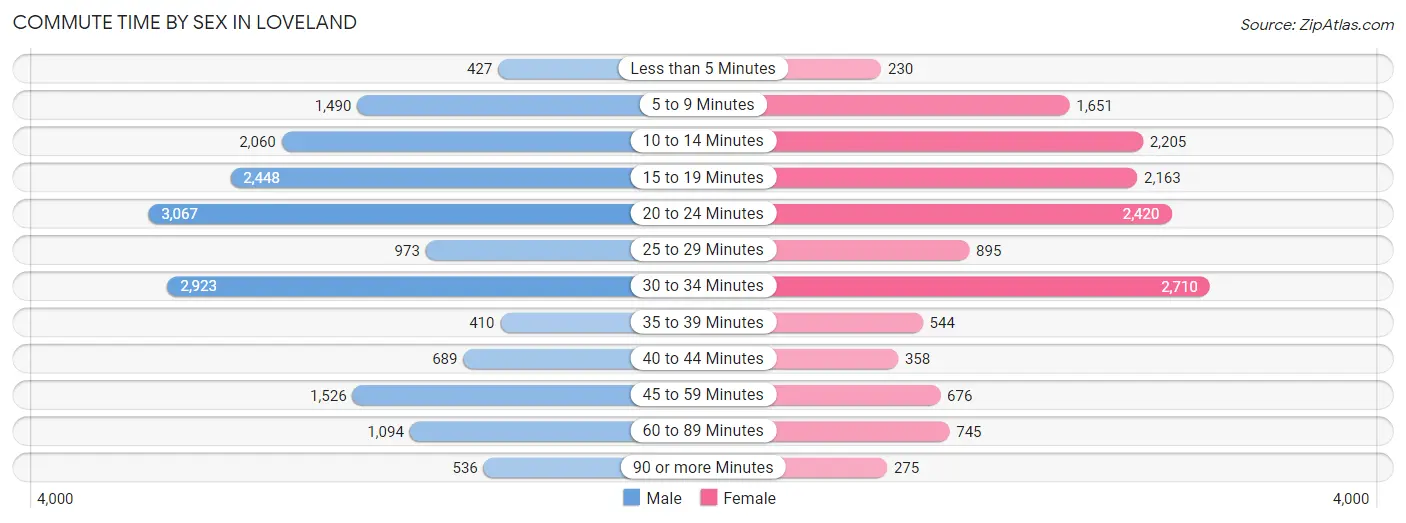
| Commute Time | Male | Female |
| Less than 5 Minutes | 427 (2.4%) | 230 (1.5%) |
| 5 to 9 Minutes | 1,490 (8.5%) | 1,651 (11.1%) |
| 10 to 14 Minutes | 2,060 (11.7%) | 2,205 (14.8%) |
| 15 to 19 Minutes | 2,448 (13.9%) | 2,163 (14.5%) |
| 20 to 24 Minutes | 3,067 (17.4%) | 2,420 (16.3%) |
| 25 to 29 Minutes | 973 (5.5%) | 895 (6.0%) |
| 30 to 34 Minutes | 2,923 (16.6%) | 2,710 (18.2%) |
| 35 to 39 Minutes | 410 (2.3%) | 544 (3.7%) |
| 40 to 44 Minutes | 689 (3.9%) | 358 (2.4%) |
| 45 to 59 Minutes | 1,526 (8.6%) | 676 (4.5%) |
| 60 to 89 Minutes | 1,094 (6.2%) | 745 (5.0%) |
| 90 or more Minutes | 536 (3.0%) | 275 (1.8%) |
Time of Departure to Work by Sex in Loveland
The most frequent times of departure to work in Loveland are 7:30 AM to 7:59 AM (2,214, 12.6%) for males and 7:30 AM to 7:59 AM (2,502, 16.8%) for females.
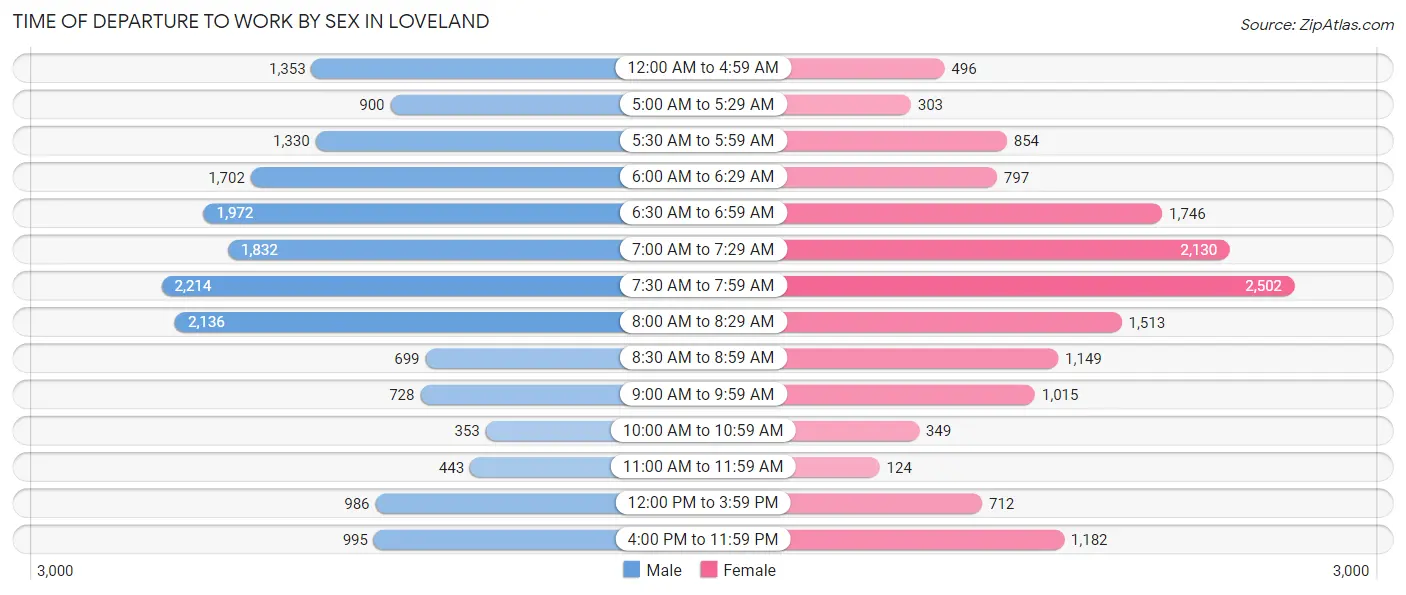
| Time of Departure | Male | Female |
| 12:00 AM to 4:59 AM | 1,353 (7.7%) | 496 (3.3%) |
| 5:00 AM to 5:29 AM | 900 (5.1%) | 303 (2.0%) |
| 5:30 AM to 5:59 AM | 1,330 (7.5%) | 854 (5.7%) |
| 6:00 AM to 6:29 AM | 1,702 (9.7%) | 797 (5.4%) |
| 6:30 AM to 6:59 AM | 1,972 (11.2%) | 1,746 (11.7%) |
| 7:00 AM to 7:29 AM | 1,832 (10.4%) | 2,130 (14.3%) |
| 7:30 AM to 7:59 AM | 2,214 (12.6%) | 2,502 (16.8%) |
| 8:00 AM to 8:29 AM | 2,136 (12.1%) | 1,513 (10.2%) |
| 8:30 AM to 8:59 AM | 699 (4.0%) | 1,149 (7.7%) |
| 9:00 AM to 9:59 AM | 728 (4.1%) | 1,015 (6.8%) |
| 10:00 AM to 10:59 AM | 353 (2.0%) | 349 (2.4%) |
| 11:00 AM to 11:59 AM | 443 (2.5%) | 124 (0.8%) |
| 12:00 PM to 3:59 PM | 986 (5.6%) | 712 (4.8%) |
| 4:00 PM to 11:59 PM | 995 (5.6%) | 1,182 (8.0%) |
| Total | 17,643 (100.0%) | 14,872 (100.0%) |
Housing Occupancy in Loveland
Occupancy by Ownership in Loveland
Of the total 33,126 dwellings in Loveland, owner-occupied units account for 20,847 (62.9%), while renter-occupied units make up 12,279 (37.1%).
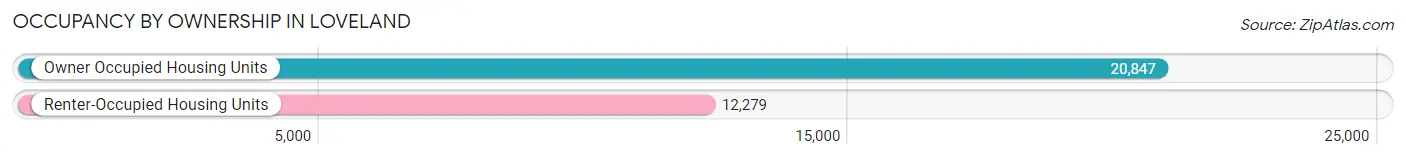
| Occupancy | # Housing Units | % Housing Units |
| Owner Occupied Housing Units | 20,847 | 62.9% |
| Renter-Occupied Housing Units | 12,279 | 37.1% |
| Total Occupied Housing Units | 33,126 | 100.0% |
Occupancy by Household Size in Loveland
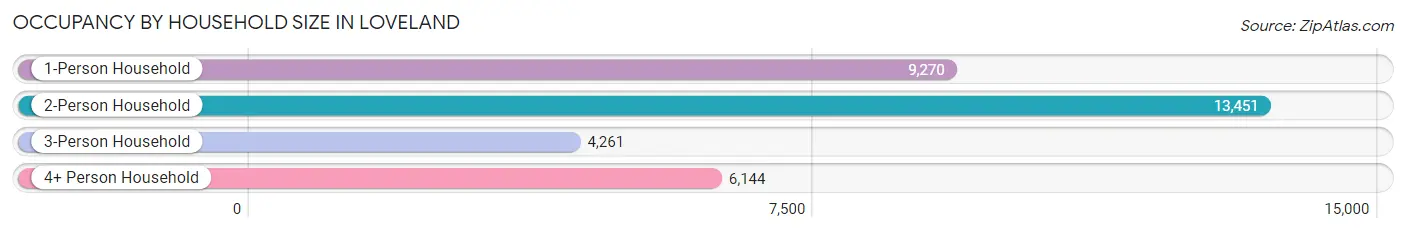
| Household Size | # Housing Units | % Housing Units |
| 1-Person Household | 9,270 | 28.0% |
| 2-Person Household | 13,451 | 40.6% |
| 3-Person Household | 4,261 | 12.9% |
| 4+ Person Household | 6,144 | 18.5% |
| Total Housing Units | 33,126 | 100.0% |
Occupancy by Ownership by Household Size in Loveland
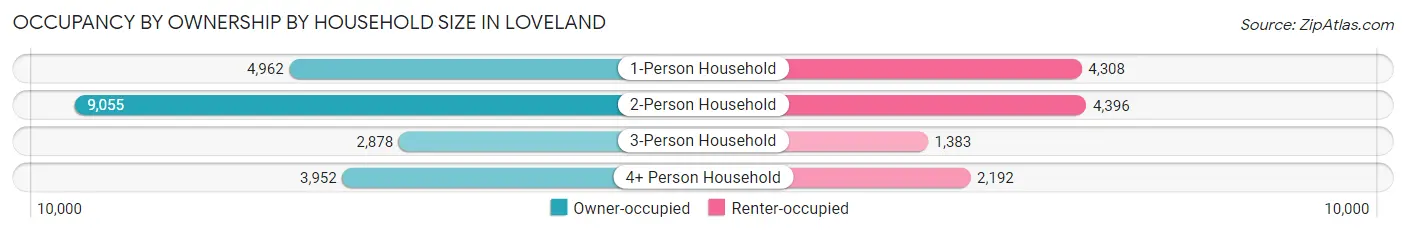
| Household Size | Owner-occupied | Renter-occupied |
| 1-Person Household | 4,962 (53.5%) | 4,308 (46.5%) |
| 2-Person Household | 9,055 (67.3%) | 4,396 (32.7%) |
| 3-Person Household | 2,878 (67.5%) | 1,383 (32.5%) |
| 4+ Person Household | 3,952 (64.3%) | 2,192 (35.7%) |
| Total Housing Units | 20,847 (62.9%) | 12,279 (37.1%) |
Occupancy by Educational Attainment in Loveland
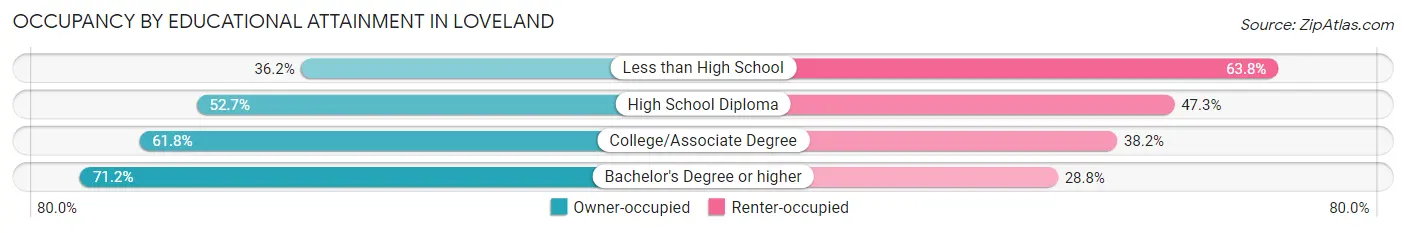
| Household Size | Owner-occupied | Renter-occupied |
| Less than High School | 465 (36.2%) | 818 (63.8%) |
| High School Diploma | 3,580 (52.7%) | 3,210 (47.3%) |
| College/Associate Degree | 6,826 (61.8%) | 4,218 (38.2%) |
| Bachelor's Degree or higher | 9,976 (71.2%) | 4,033 (28.8%) |
Occupancy by Age of Householder in Loveland
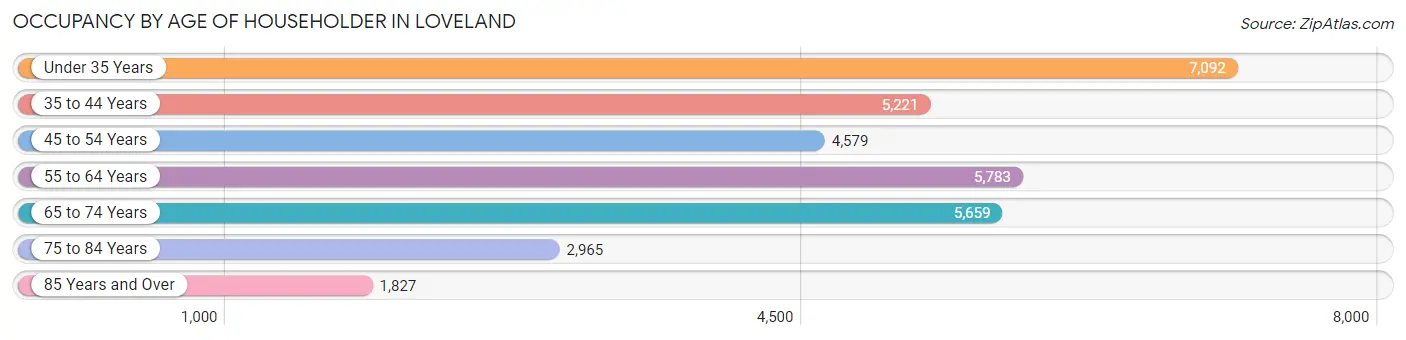
| Age Bracket | # Households | % Households |
| Under 35 Years | 7,092 | 21.4% |
| 35 to 44 Years | 5,221 | 15.8% |
| 45 to 54 Years | 4,579 | 13.8% |
| 55 to 64 Years | 5,783 | 17.5% |
| 65 to 74 Years | 5,659 | 17.1% |
| 75 to 84 Years | 2,965 | 8.9% |
| 85 Years and Over | 1,827 | 5.5% |
| Total | 33,126 | 100.0% |
Housing Finances in Loveland
Median Income by Occupancy in Loveland
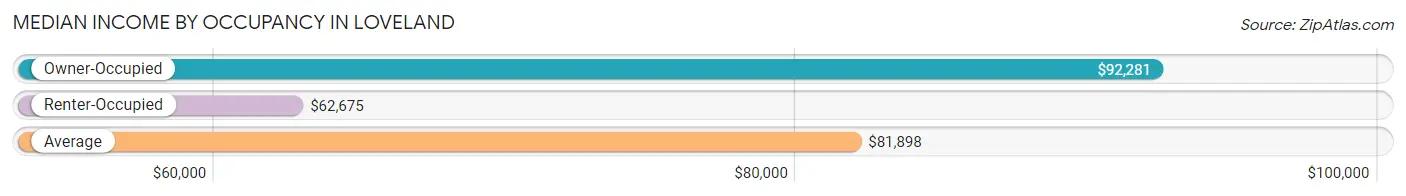
| Occupancy Type | # Households | Median Income |
| Owner-Occupied | 20,847 (62.9%) | $92,281 |
| Renter-Occupied | 12,279 (37.1%) | $62,675 |
| Average | 33,126 (100.0%) | $81,898 |
Occupancy by Householder Income Bracket in Loveland
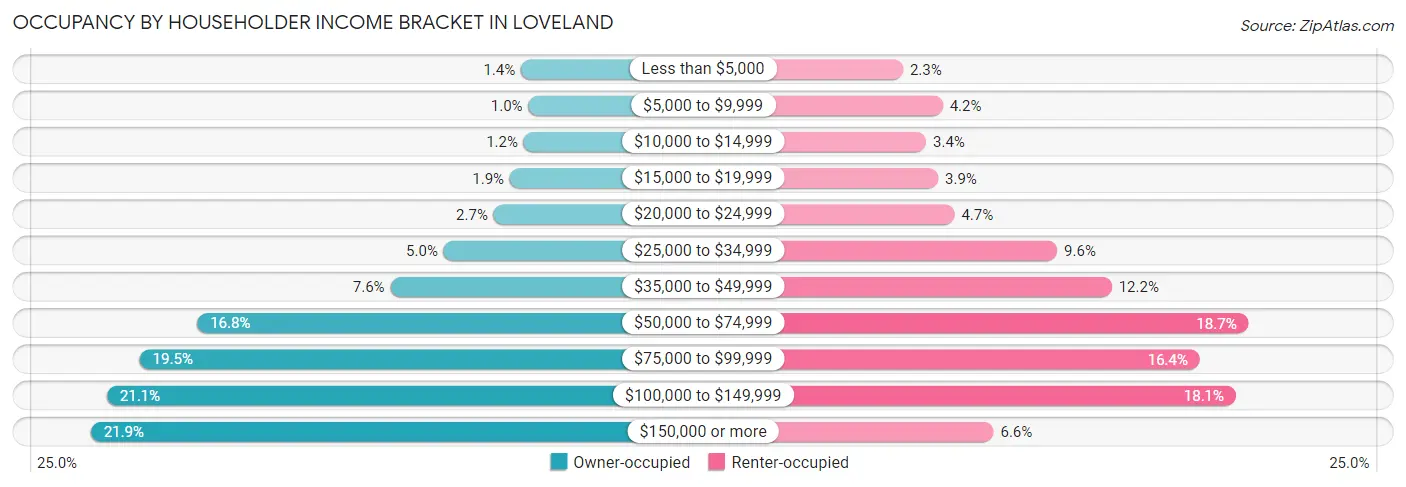
| Income Bracket | Owner-occupied | Renter-occupied |
| Less than $5,000 | 283 (1.4%) | 278 (2.3%) |
| $5,000 to $9,999 | 210 (1.0%) | 510 (4.2%) |
| $10,000 to $14,999 | 256 (1.2%) | 412 (3.4%) |
| $15,000 to $19,999 | 393 (1.9%) | 482 (3.9%) |
| $20,000 to $24,999 | 555 (2.7%) | 578 (4.7%) |
| $25,000 to $34,999 | 1,051 (5.0%) | 1,179 (9.6%) |
| $35,000 to $49,999 | 1,581 (7.6%) | 1,498 (12.2%) |
| $50,000 to $74,999 | 3,499 (16.8%) | 2,298 (18.7%) |
| $75,000 to $99,999 | 4,070 (19.5%) | 2,013 (16.4%) |
| $100,000 to $149,999 | 4,394 (21.1%) | 2,224 (18.1%) |
| $150,000 or more | 4,555 (21.8%) | 807 (6.6%) |
| Total | 20,847 (100.0%) | 12,279 (100.0%) |
Monthly Housing Cost Tiers in Loveland
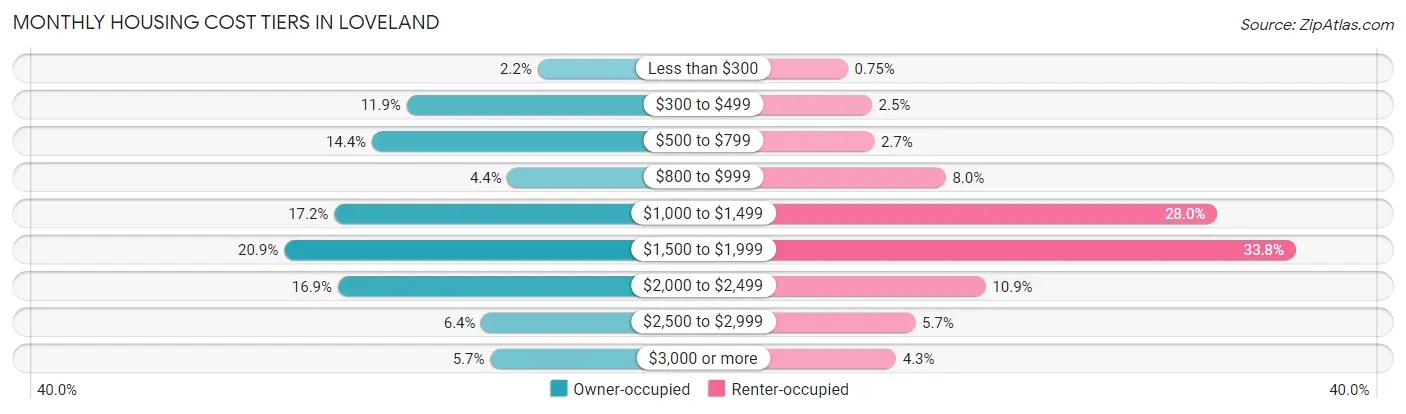
| Monthly Cost | Owner-occupied | Renter-occupied |
| Less than $300 | 461 (2.2%) | 92 (0.7%) |
| $300 to $499 | 2,473 (11.9%) | 309 (2.5%) |
| $500 to $799 | 3,007 (14.4%) | 330 (2.7%) |
| $800 to $999 | 924 (4.4%) | 978 (8.0%) |
| $1,000 to $1,499 | 3,585 (17.2%) | 3,435 (28.0%) |
| $1,500 to $1,999 | 4,354 (20.9%) | 4,146 (33.8%) |
| $2,000 to $2,499 | 3,529 (16.9%) | 1,338 (10.9%) |
| $2,500 to $2,999 | 1,325 (6.4%) | 702 (5.7%) |
| $3,000 or more | 1,189 (5.7%) | 528 (4.3%) |
| Total | 20,847 (100.0%) | 12,279 (100.0%) |
Physical Housing Characteristics in Loveland
Housing Structures in Loveland
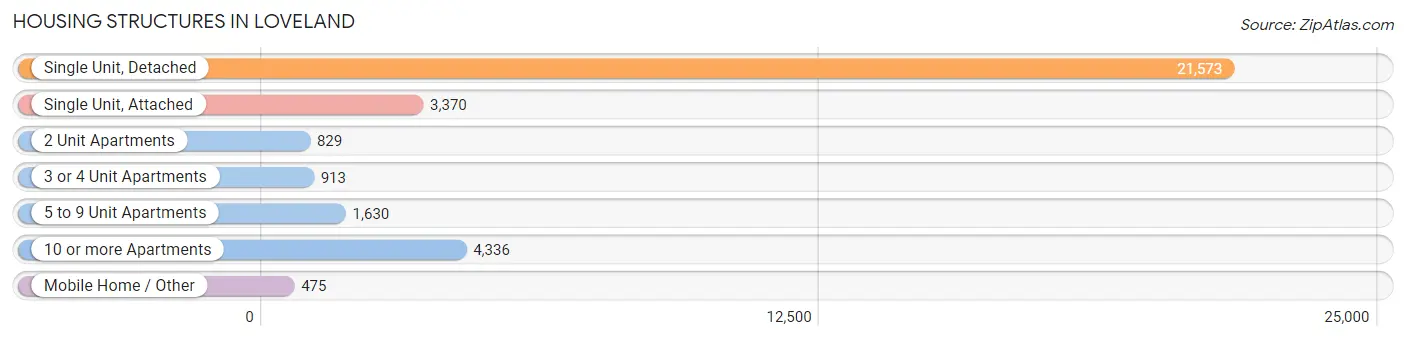
| Structure Type | # Housing Units | % Housing Units |
| Single Unit, Detached | 21,573 | 65.1% |
| Single Unit, Attached | 3,370 | 10.2% |
| 2 Unit Apartments | 829 | 2.5% |
| 3 or 4 Unit Apartments | 913 | 2.8% |
| 5 to 9 Unit Apartments | 1,630 | 4.9% |
| 10 or more Apartments | 4,336 | 13.1% |
| Mobile Home / Other | 475 | 1.4% |
| Total | 33,126 | 100.0% |
Housing Structures by Occupancy in Loveland
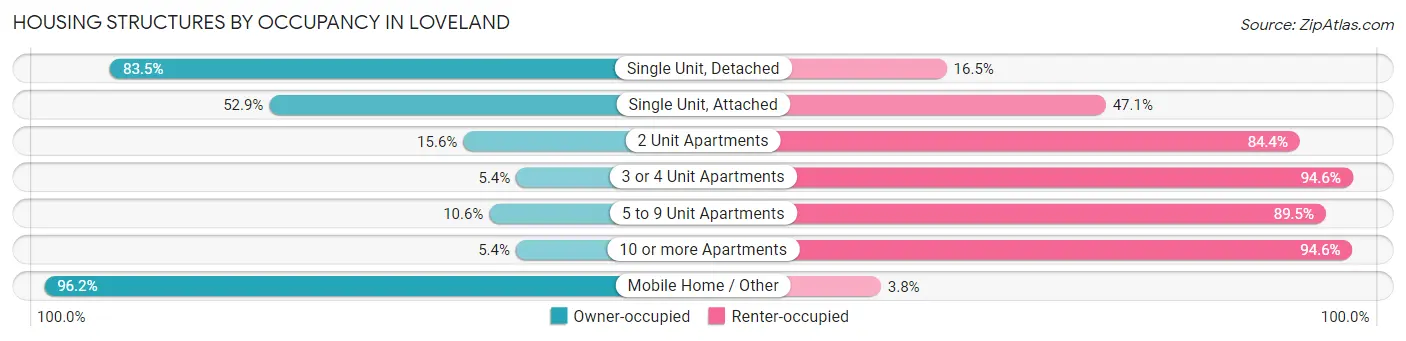
| Structure Type | Owner-occupied | Renter-occupied |
| Single Unit, Detached | 18,022 (83.5%) | 3,551 (16.5%) |
| Single Unit, Attached | 1,783 (52.9%) | 1,587 (47.1%) |
| 2 Unit Apartments | 129 (15.6%) | 700 (84.4%) |
| 3 or 4 Unit Apartments | 49 (5.4%) | 864 (94.6%) |
| 5 to 9 Unit Apartments | 172 (10.5%) | 1,458 (89.4%) |
| 10 or more Apartments | 235 (5.4%) | 4,101 (94.6%) |
| Mobile Home / Other | 457 (96.2%) | 18 (3.8%) |
| Total | 20,847 (62.9%) | 12,279 (37.1%) |
Housing Structures by Number of Rooms in Loveland
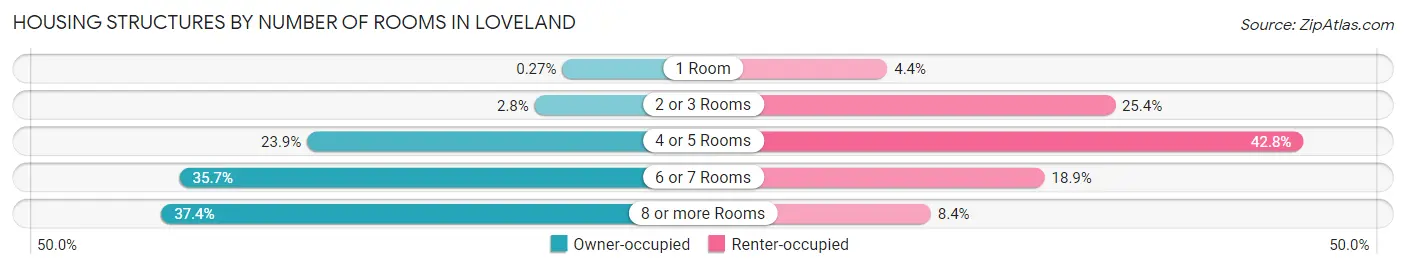
| Number of Rooms | Owner-occupied | Renter-occupied |
| 1 Room | 57 (0.3%) | 538 (4.4%) |
| 2 or 3 Rooms | 591 (2.8%) | 3,124 (25.4%) |
| 4 or 5 Rooms | 4,976 (23.9%) | 5,260 (42.8%) |
| 6 or 7 Rooms | 7,434 (35.7%) | 2,324 (18.9%) |
| 8 or more Rooms | 7,789 (37.4%) | 1,033 (8.4%) |
| Total | 20,847 (100.0%) | 12,279 (100.0%) |
Housing Structure by Heating Type in Loveland
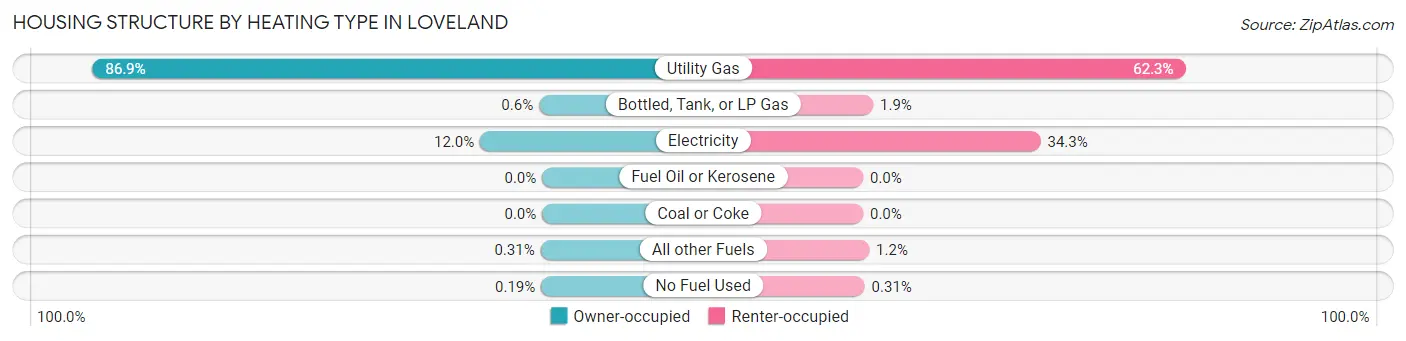
| Heating Type | Owner-occupied | Renter-occupied |
| Utility Gas | 18,117 (86.9%) | 7,646 (62.3%) |
| Bottled, Tank, or LP Gas | 126 (0.6%) | 238 (1.9%) |
| Electricity | 2,500 (12.0%) | 4,212 (34.3%) |
| Fuel Oil or Kerosene | 0 (0.0%) | 0 (0.0%) |
| Coal or Coke | 0 (0.0%) | 0 (0.0%) |
| All other Fuels | 65 (0.3%) | 145 (1.2%) |
| No Fuel Used | 39 (0.2%) | 38 (0.3%) |
| Total | 20,847 (100.0%) | 12,279 (100.0%) |
Household Vehicle Usage in Loveland
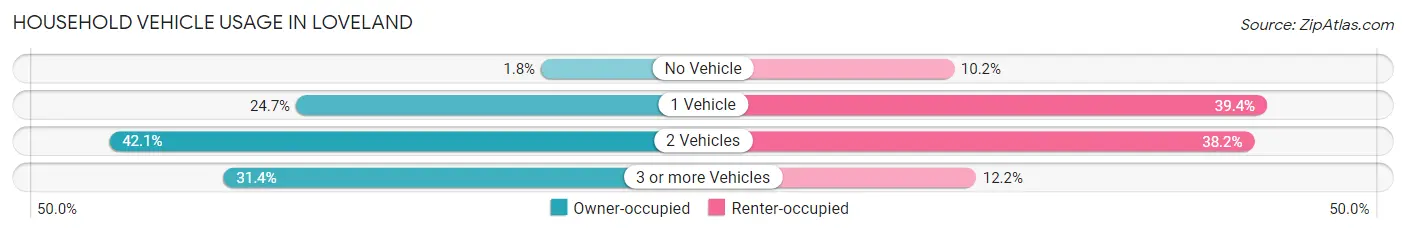
| Vehicles per Household | Owner-occupied | Renter-occupied |
| No Vehicle | 375 (1.8%) | 1,249 (10.2%) |
| 1 Vehicle | 5,142 (24.7%) | 4,837 (39.4%) |
| 2 Vehicles | 8,776 (42.1%) | 4,692 (38.2%) |
| 3 or more Vehicles | 6,554 (31.4%) | 1,501 (12.2%) |
| Total | 20,847 (100.0%) | 12,279 (100.0%) |
Real Estate & Mortgages in Loveland
Real Estate and Mortgage Overview in Loveland
| Characteristic | Without Mortgage | With Mortgage |
| Housing Units | 6,436 | 14,411 |
| Median Property Value | $423,100 | $428,600 |
| Median Household Income | $71,101 | $3,673 |
| Monthly Housing Costs | $525 | $1,176 |
| Real Estate Taxes | $1,918 | $182 |
Property Value by Mortgage Status in Loveland
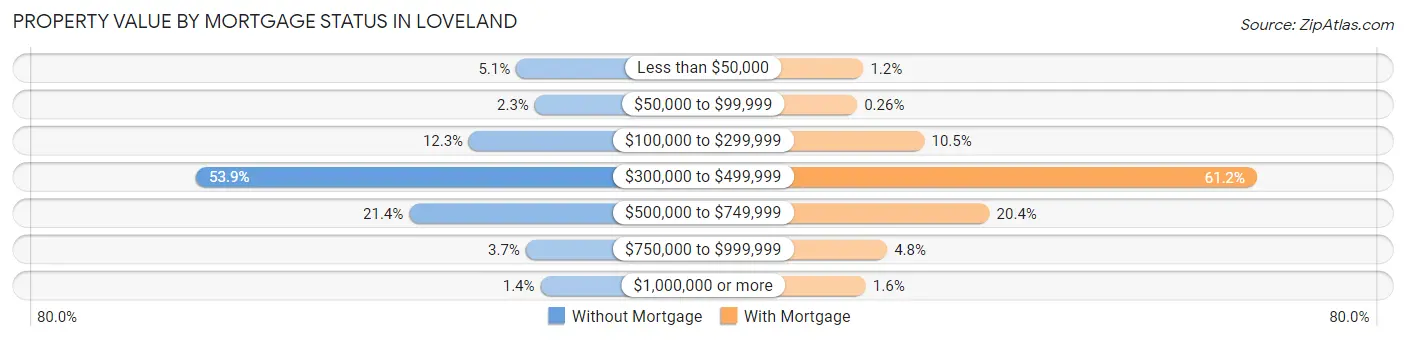
| Property Value | Without Mortgage | With Mortgage |
| Less than $50,000 | 329 (5.1%) | 175 (1.2%) |
| $50,000 to $99,999 | 146 (2.3%) | 38 (0.3%) |
| $100,000 to $299,999 | 791 (12.3%) | 1,515 (10.5%) |
| $300,000 to $499,999 | 3,466 (53.8%) | 8,813 (61.2%) |
| $500,000 to $749,999 | 1,378 (21.4%) | 2,946 (20.4%) |
| $750,000 to $999,999 | 235 (3.6%) | 696 (4.8%) |
| $1,000,000 or more | 91 (1.4%) | 228 (1.6%) |
| Total | 6,436 (100.0%) | 14,411 (100.0%) |
Household Income by Mortgage Status in Loveland
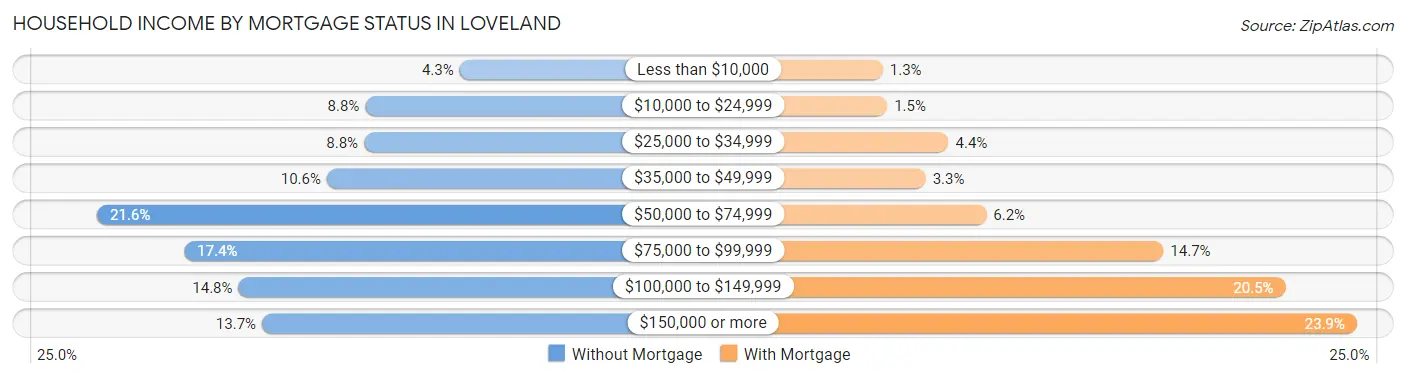
| Household Income | Without Mortgage | With Mortgage |
| Less than $10,000 | 276 (4.3%) | 188 (1.3%) |
| $10,000 to $24,999 | 565 (8.8%) | 217 (1.5%) |
| $25,000 to $34,999 | 569 (8.8%) | 639 (4.4%) |
| $35,000 to $49,999 | 683 (10.6%) | 482 (3.3%) |
| $50,000 to $74,999 | 1,387 (21.5%) | 898 (6.2%) |
| $75,000 to $99,999 | 1,120 (17.4%) | 2,112 (14.7%) |
| $100,000 to $149,999 | 954 (14.8%) | 2,950 (20.5%) |
| $150,000 or more | 882 (13.7%) | 3,440 (23.9%) |
| Total | 6,436 (100.0%) | 14,411 (100.0%) |
Property Value to Household Income Ratio in Loveland
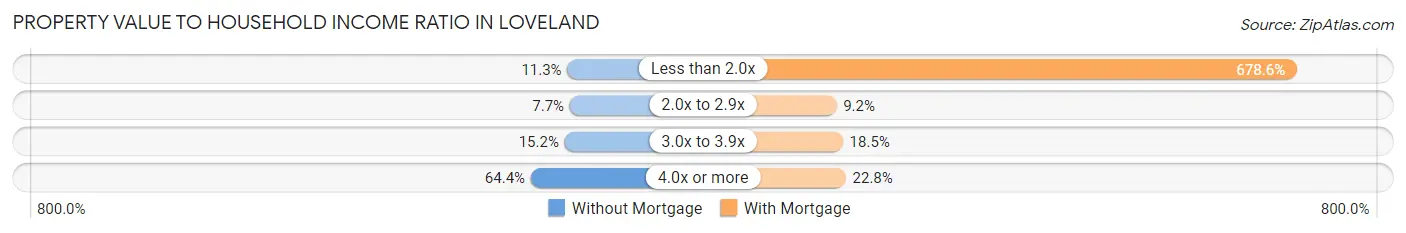
| Value-to-Income Ratio | Without Mortgage | With Mortgage |
| Less than 2.0x | 728 (11.3%) | 97,798 (678.6%) |
| 2.0x to 2.9x | 493 (7.7%) | 1,320 (9.2%) |
| 3.0x to 3.9x | 979 (15.2%) | 2,668 (18.5%) |
| 4.0x or more | 4,144 (64.4%) | 3,288 (22.8%) |
| Total | 6,436 (100.0%) | 14,411 (100.0%) |
Real Estate Taxes by Mortgage Status in Loveland
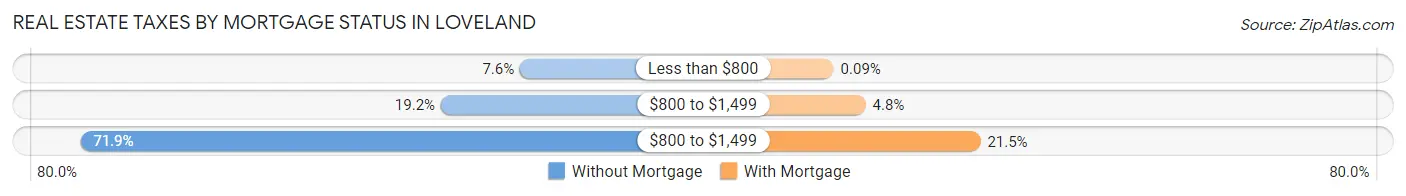
| Property Taxes | Without Mortgage | With Mortgage |
| Less than $800 | 489 (7.6%) | 13 (0.1%) |
| $800 to $1,499 | 1,234 (19.2%) | 686 (4.8%) |
| $800 to $1,499 | 4,625 (71.9%) | 3,104 (21.5%) |
| Total | 6,436 (100.0%) | 14,411 (100.0%) |
Health & Disability in Loveland
Health Insurance Coverage by Age in Loveland
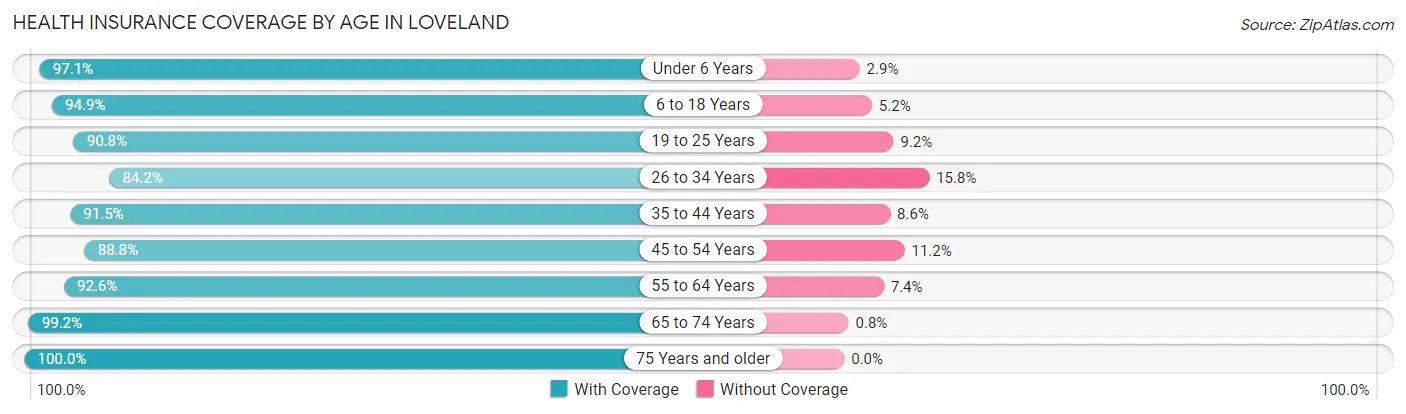
| Age Bracket | With Coverage | Without Coverage |
| Under 6 Years | 4,998 (97.1%) | 147 (2.9%) |
| 6 to 18 Years | 10,439 (94.9%) | 567 (5.1%) |
| 19 to 25 Years | 6,064 (90.8%) | 613 (9.2%) |
| 26 to 34 Years | 8,116 (84.2%) | 1,527 (15.8%) |
| 35 to 44 Years | 9,112 (91.4%) | 852 (8.6%) |
| 45 to 54 Years | 7,419 (88.8%) | 939 (11.2%) |
| 55 to 64 Years | 8,755 (92.6%) | 696 (7.4%) |
| 65 to 74 Years | 8,931 (99.2%) | 72 (0.8%) |
| 75 Years and older | 6,780 (100.0%) | 0 (0.0%) |
| Total | 70,614 (92.9%) | 5,413 (7.1%) |
Health Insurance Coverage by Citizenship Status in Loveland
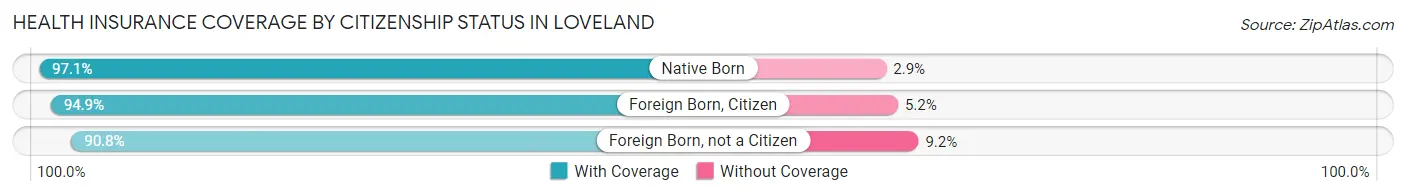
| Citizenship Status | With Coverage | Without Coverage |
| Native Born | 4,998 (97.1%) | 147 (2.9%) |
| Foreign Born, Citizen | 10,439 (94.9%) | 567 (5.1%) |
| Foreign Born, not a Citizen | 6,064 (90.8%) | 613 (9.2%) |
Health Insurance Coverage by Household Income in Loveland
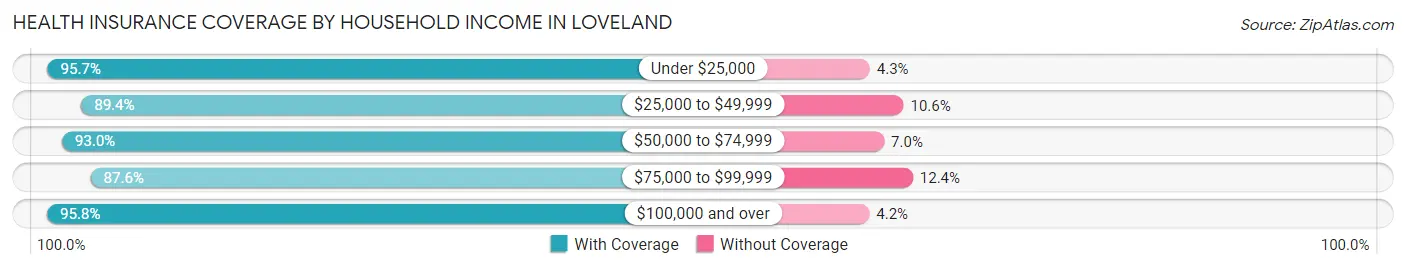
| Household Income | With Coverage | Without Coverage |
| Under $25,000 | 5,894 (95.7%) | 266 (4.3%) |
| $25,000 to $49,999 | 8,136 (89.4%) | 968 (10.6%) |
| $50,000 to $74,999 | 11,201 (93.0%) | 843 (7.0%) |
| $75,000 to $99,999 | 13,410 (87.6%) | 1,895 (12.4%) |
| $100,000 and over | 31,905 (95.8%) | 1,405 (4.2%) |
Public vs Private Health Insurance Coverage by Age in Loveland
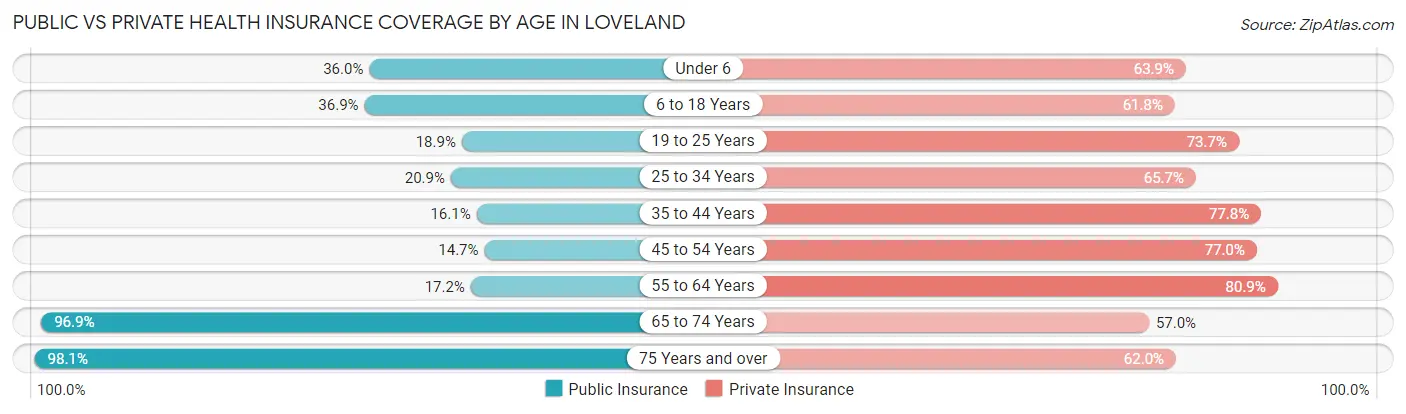
| Age Bracket | Public Insurance | Private Insurance |
| Under 6 | 1,854 (36.0%) | 3,285 (63.8%) |
| 6 to 18 Years | 4,064 (36.9%) | 6,801 (61.8%) |
| 19 to 25 Years | 1,259 (18.9%) | 4,919 (73.7%) |
| 25 to 34 Years | 2,014 (20.9%) | 6,335 (65.7%) |
| 35 to 44 Years | 1,606 (16.1%) | 7,753 (77.8%) |
| 45 to 54 Years | 1,225 (14.7%) | 6,438 (77.0%) |
| 55 to 64 Years | 1,626 (17.2%) | 7,645 (80.9%) |
| 65 to 74 Years | 8,725 (96.9%) | 5,133 (57.0%) |
| 75 Years and over | 6,653 (98.1%) | 4,204 (62.0%) |
| Total | 29,026 (38.2%) | 52,513 (69.1%) |
Disability Status by Sex by Age in Loveland
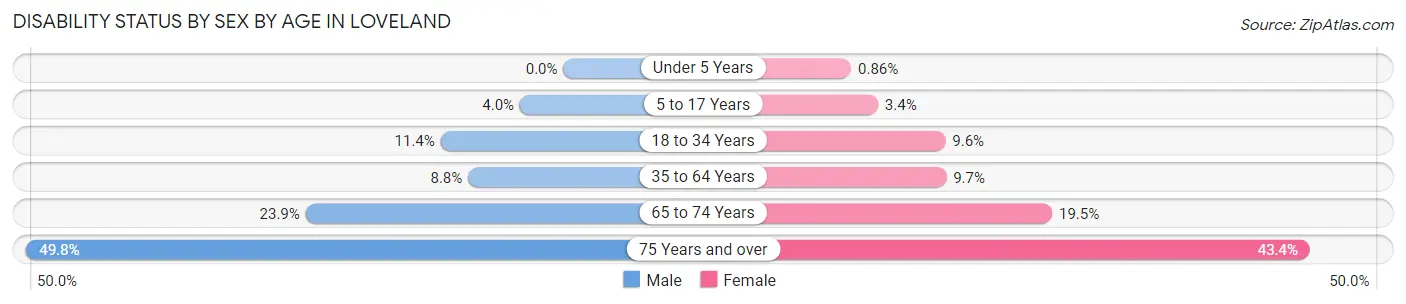
| Age Bracket | Male | Female |
| Under 5 Years | 0 (0.0%) | 16 (0.9%) |
| 5 to 17 Years | 235 (4.0%) | 173 (3.4%) |
| 18 to 34 Years | 987 (11.4%) | 831 (9.6%) |
| 35 to 64 Years | 1,244 (8.8%) | 1,328 (9.7%) |
| 65 to 74 Years | 968 (23.9%) | 967 (19.5%) |
| 75 Years and over | 1,412 (49.8%) | 1,714 (43.4%) |
Disability Class by Sex by Age in Loveland
Disability Class: Hearing Difficulty
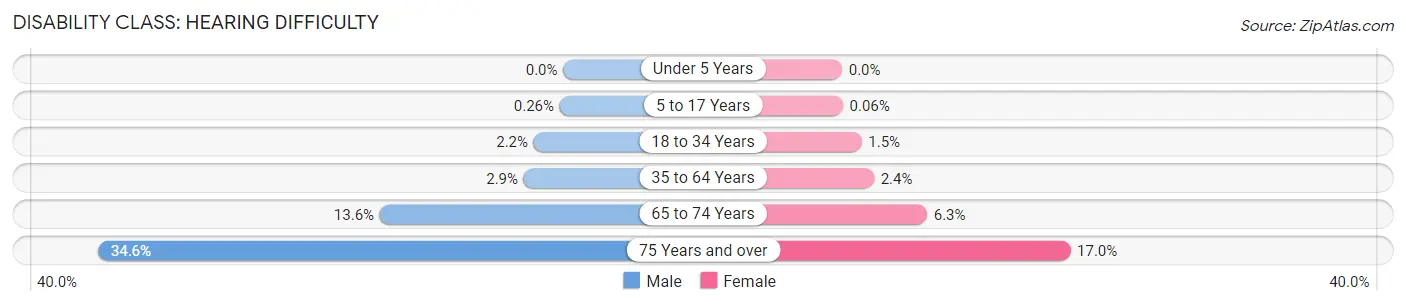
| Age Bracket | Male | Female |
| Under 5 Years | 0 (0.0%) | 0 (0.0%) |
| 5 to 17 Years | 15 (0.3%) | 3 (0.1%) |
| 18 to 34 Years | 190 (2.2%) | 125 (1.5%) |
| 35 to 64 Years | 413 (2.9%) | 324 (2.4%) |
| 65 to 74 Years | 551 (13.6%) | 313 (6.3%) |
| 75 Years and over | 979 (34.6%) | 669 (17.0%) |
Disability Class: Vision Difficulty
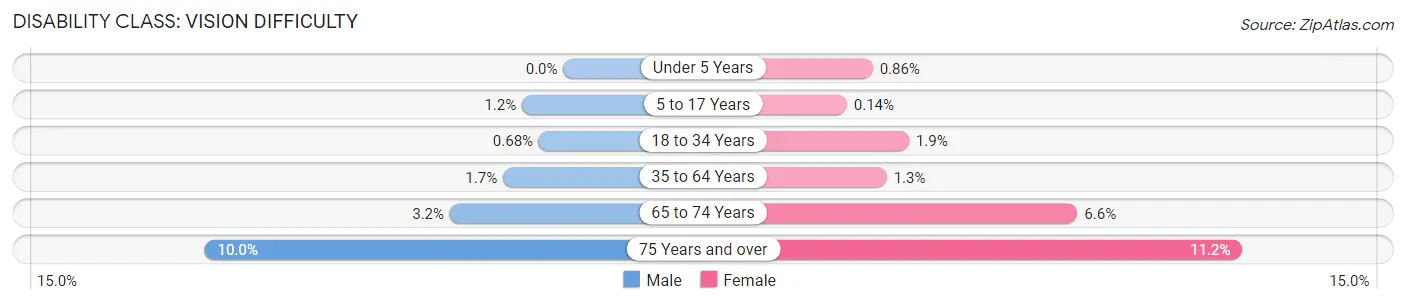
| Age Bracket | Male | Female |
| Under 5 Years | 0 (0.0%) | 16 (0.9%) |
| 5 to 17 Years | 67 (1.1%) | 7 (0.1%) |
| 18 to 34 Years | 59 (0.7%) | 162 (1.9%) |
| 35 to 64 Years | 237 (1.7%) | 171 (1.3%) |
| 65 to 74 Years | 128 (3.2%) | 325 (6.6%) |
| 75 Years and over | 283 (10.0%) | 440 (11.2%) |
Disability Class: Cognitive Difficulty
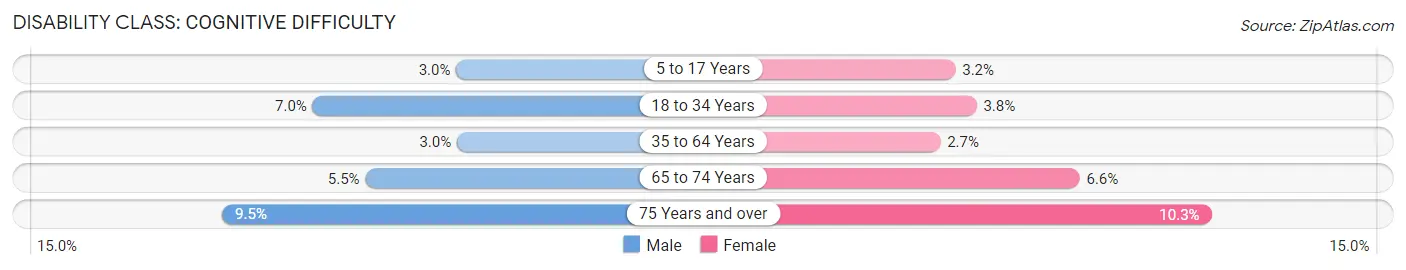
| Age Bracket | Male | Female |
| 5 to 17 Years | 174 (3.0%) | 163 (3.2%) |
| 18 to 34 Years | 605 (7.0%) | 324 (3.7%) |
| 35 to 64 Years | 416 (3.0%) | 376 (2.7%) |
| 65 to 74 Years | 223 (5.5%) | 328 (6.6%) |
| 75 Years and over | 269 (9.5%) | 406 (10.3%) |
Disability Class: Ambulatory Difficulty
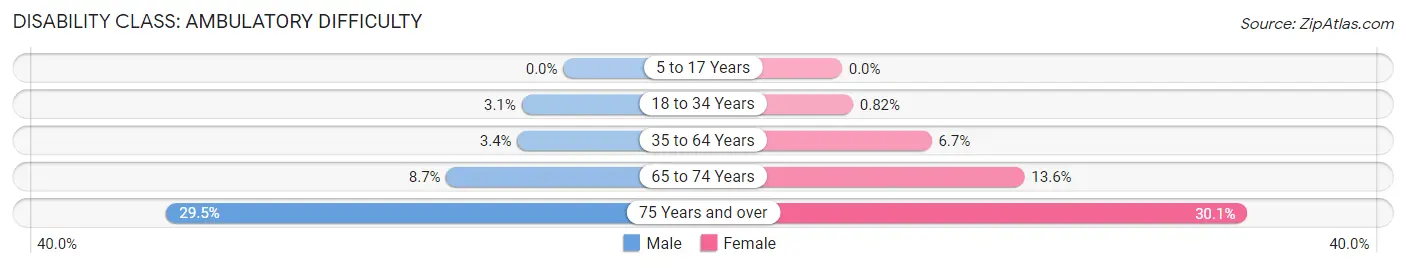
| Age Bracket | Male | Female |
| 5 to 17 Years | 0 (0.0%) | 0 (0.0%) |
| 18 to 34 Years | 269 (3.1%) | 71 (0.8%) |
| 35 to 64 Years | 480 (3.4%) | 912 (6.7%) |
| 65 to 74 Years | 351 (8.7%) | 672 (13.6%) |
| 75 Years and over | 835 (29.5%) | 1,188 (30.1%) |
Disability Class: Self-Care Difficulty
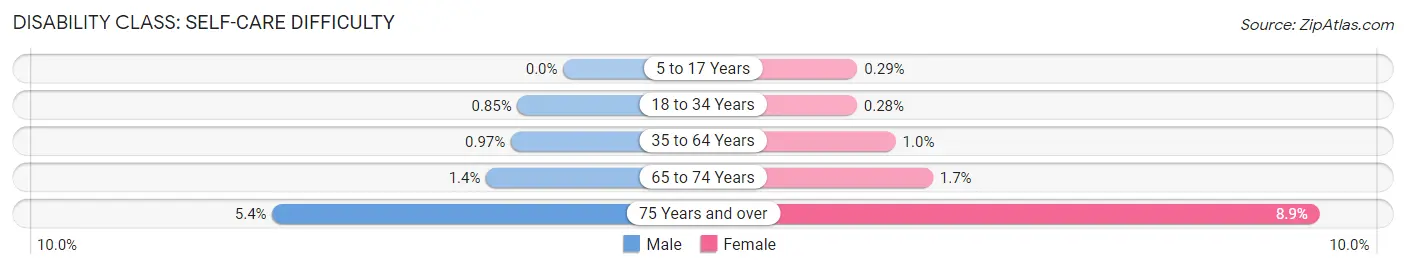
| Age Bracket | Male | Female |
| 5 to 17 Years | 0 (0.0%) | 15 (0.3%) |
| 18 to 34 Years | 74 (0.9%) | 24 (0.3%) |
| 35 to 64 Years | 136 (1.0%) | 137 (1.0%) |
| 65 to 74 Years | 58 (1.4%) | 84 (1.7%) |
| 75 Years and over | 153 (5.4%) | 350 (8.9%) |
Technology Access in Loveland
Computing Device Access in Loveland
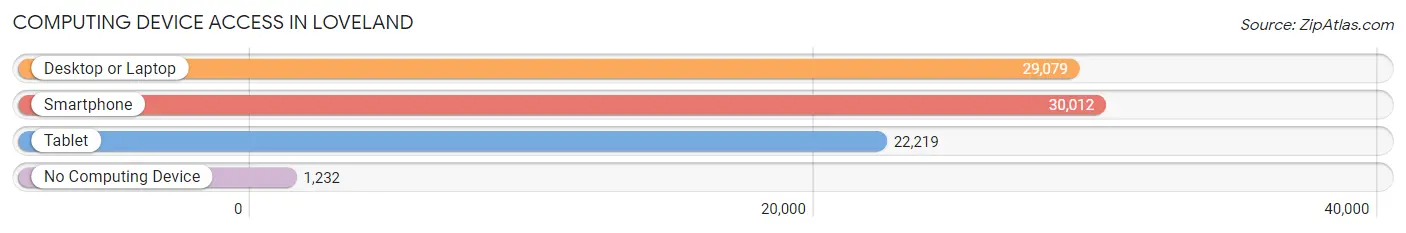
| Device Type | # Households | % Households |
| Desktop or Laptop | 29,079 | 87.8% |
| Smartphone | 30,012 | 90.6% |
| Tablet | 22,219 | 67.1% |
| No Computing Device | 1,232 | 3.7% |
| Total | 33,126 | 100.0% |
Internet Access in Loveland
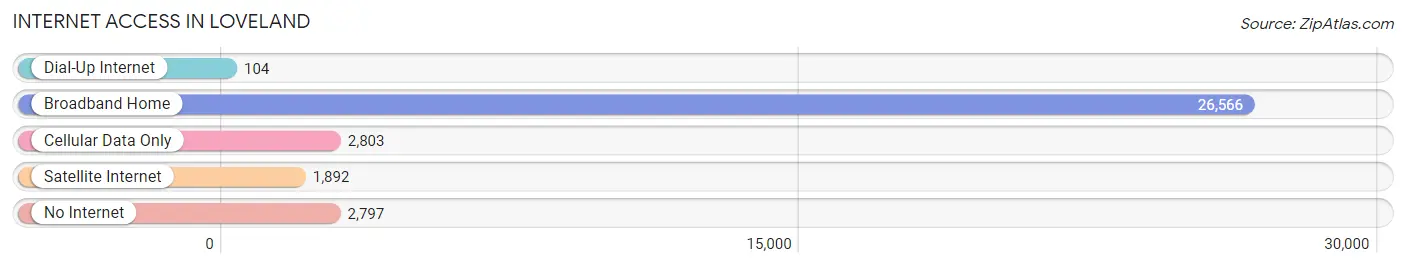
| Internet Type | # Households | % Households |
| Dial-Up Internet | 104 | 0.3% |
| Broadband Home | 26,566 | 80.2% |
| Cellular Data Only | 2,803 | 8.5% |
| Satellite Internet | 1,892 | 5.7% |
| No Internet | 2,797 | 8.4% |
| Total | 33,126 | 100.0% |
Loveland Summary
Loveland, Colorado is a city located in Larimer County, Colorado, United States. It is situated along the Big Thompson River, approximately 45 miles north of Denver. The city is a part of the Fort Collins-Loveland Metropolitan Statistical Area, and is the 14th most populous city in the state. As of the 2010 census, the population of Loveland was 66,859.
Geography
Loveland is located in northern Colorado, at the base of the Rocky Mountains. It is situated along the Big Thompson River, approximately 45 miles north of Denver. The city is bordered by Fort Collins to the north, Berthoud to the east, Longmont to the south, and Estes Park to the west. The elevation of Loveland is 5,098 feet above sea level.
Climate
Loveland has a semi-arid climate, with hot summers and cold winters. The average temperature in July is 79°F, and the average temperature in January is 24°F. The average annual precipitation is 16.5 inches, with the majority of precipitation occurring in the spring and summer months.
History
Loveland was founded in 1877 by William A.H. Loveland, a former president of the Colorado Central Railroad. The city was named after him, and was incorporated in 1881. In the late 19th century, Loveland was a major agricultural center, with many farms and ranches in the area.
In the early 20th century, Loveland began to grow rapidly, due to the construction of the Colorado-Big Thompson Project. This project brought water from the western slope of the Rocky Mountains to the eastern plains, and allowed for the development of agriculture and industry in the area.
Economy
Loveland’s economy is largely based on agriculture, manufacturing, and tourism. The city is home to several large companies, including Agilent Technologies, Hewlett Packard, and Intel. The city is also home to several large agricultural companies, such as Cargill, JBS USA, and Leprino Foods.
Tourism is also an important part of the economy, with many visitors coming to the city to enjoy the nearby Rocky Mountains. The city is home to several popular attractions, such as the Benson Sculpture Garden, the Loveland Museum/Gallery, and the Loveland Ski Area.
Demographics
As of the 2010 census, the population of Loveland was 66,859. The racial makeup of the city was 87.3% White, 2.2% African American, 0.7% Native American, 2.2% Asian, 0.1% Pacific Islander, 4.7% from other races, and 2.7% from two or more races. Hispanic or Latino of any race were 11.3% of the population.
The median income for a household in Loveland was $54,945, and the median income for a family was $63,945. The per capita income for the city was $27,945. About 8.2% of families and 10.7% of the population were below the poverty line, including 14.2% of those under age 18 and 6.2% of those age 65 or over.
Common Questions
What is Per Capita Income in Loveland?
Per Capita income in Loveland is $42,119.
What is the Median Family Income in Loveland?
Median Family Income in Loveland is $94,121.
What is the Median Household income in Loveland?
Median Household Income in Loveland is $81,898.
What is Income or Wage Gap in Loveland?
Income or Wage Gap in Loveland is 35.4%.
Women in Loveland earn 64.6 cents for every dollar earned by a man.
What is Family Income Deficit in Loveland?
Family Income Deficit in Loveland is $10,391.
Families that are below poverty line in Loveland earn $10,391 less on average than the poverty threshold level.
What is Inequality or Gini Index in Loveland?
Inequality or Gini Index in Loveland is 0.40.
What is the Total Population of Loveland?
Total Population of Loveland is 76,500.
What is the Total Male Population of Loveland?
Total Male Population of Loveland is 37,927.
What is the Total Female Population of Loveland?
Total Female Population of Loveland is 38,573.
What is the Ratio of Males per 100 Females in Loveland?
There are 98.33 Males per 100 Females in Loveland.
What is the Ratio of Females per 100 Males in Loveland?
There are 101.70 Females per 100 Males in Loveland.
What is the Median Population Age in Loveland?
Median Population Age in Loveland is 40.4 Years.
What is the Average Family Size in Loveland
Average Family Size in Loveland is 2.8 People.
What is the Average Household Size in Loveland
Average Household Size in Loveland is 2.3 People.
How Large is the Labor Force in Loveland?
There are 40,741 People in the Labor Forcein in Loveland.
What is the Percentage of People in the Labor Force in Loveland?
65.0% of People are in the Labor Force in Loveland.
What is the Unemployment Rate in Loveland?
Unemployment Rate in Loveland is 4.4%.