Cities with the Most Immigrants from Argentina in New York
RELATED REPORTS & OPTIONS
Argentina
New York
Compare Cities
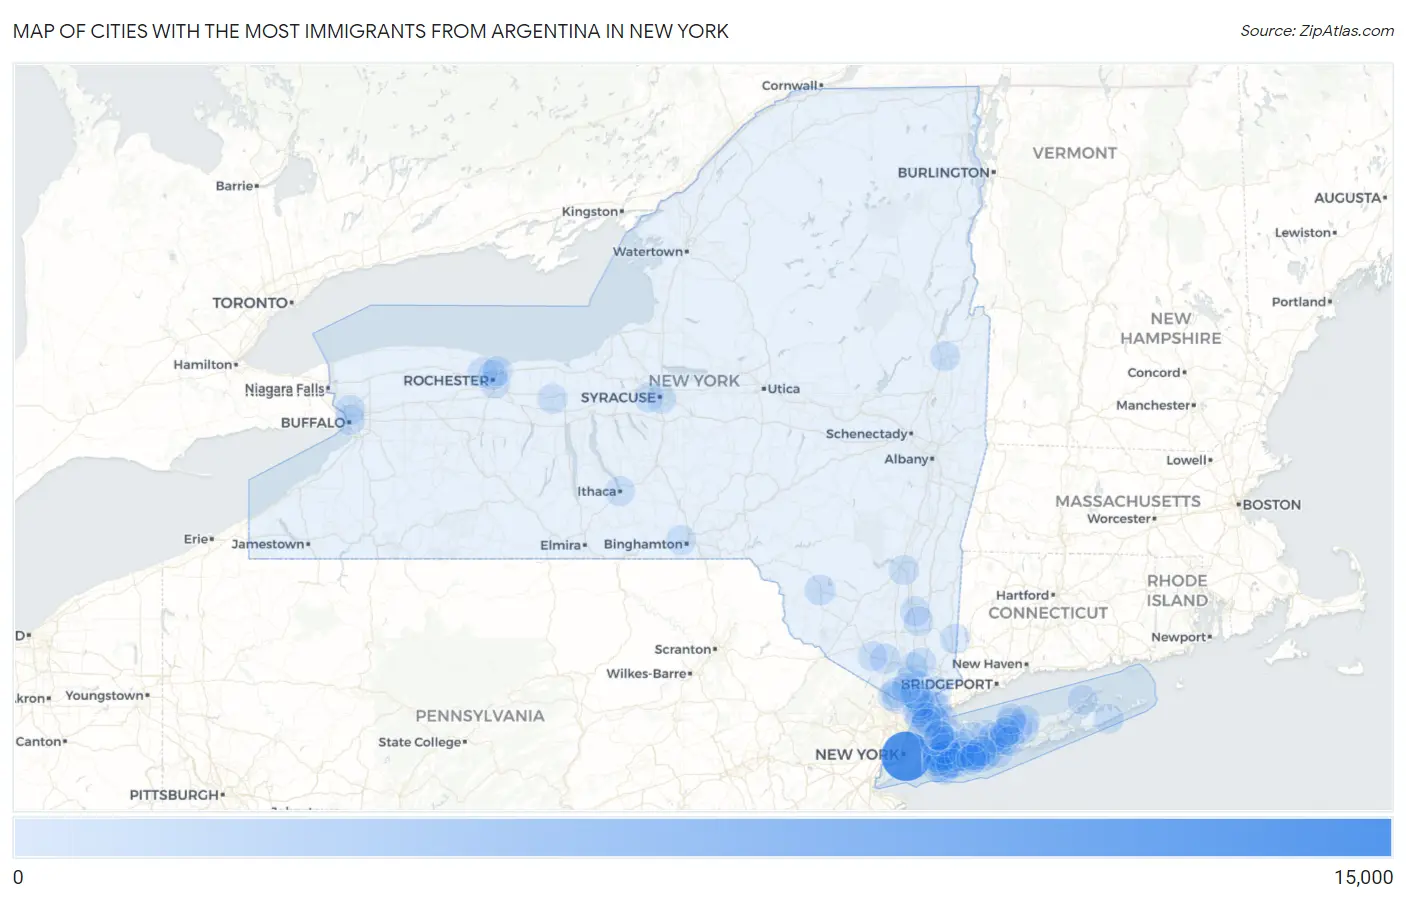
Map of Cities with the Most Immigrants from Argentina in New York
0
15,000
Cities with the Most Immigrants from Argentina in New York
| City | Argentina | vs State | vs National | |
| 1. | New York | 12,718 | 21,928(58.00%)#1 | 200,110(6.36%)#1 |
| 2. | Liberty | 402 | 21,928(1.83%)#2 | 200,110(0.20%)#57 |
| 3. | Harrison | 286 | 21,928(1.30%)#3 | 200,110(0.14%)#90 |
| 4. | Baldwin | 243 | 21,928(1.11%)#4 | 200,110(0.12%)#107 |
| 5. | Kiryas Joel | 242 | 21,928(1.10%)#5 | 200,110(0.12%)#109 |
| 6. | New Rochelle | 201 | 21,928(0.92%)#6 | 200,110(0.10%)#156 |
| 7. | Bellmore | 185 | 21,928(0.84%)#7 | 200,110(0.09%)#172 |
| 8. | White Plains | 180 | 21,928(0.82%)#8 | 200,110(0.09%)#180 |
| 9. | Franklin Square | 163 | 21,928(0.74%)#9 | 200,110(0.08%)#193 |
| 10. | Yonkers | 160 | 21,928(0.73%)#10 | 200,110(0.08%)#195 |
| 11. | Glen Head | 155 | 21,928(0.71%)#11 | 200,110(0.08%)#201 |
| 12. | North Bellmore | 144 | 21,928(0.66%)#12 | 200,110(0.07%)#225 |
| 13. | Middle Island | 134 | 21,928(0.61%)#13 | 200,110(0.07%)#248 |
| 14. | Brentwood | 133 | 21,928(0.61%)#14 | 200,110(0.07%)#250 |
| 15. | Commack | 133 | 21,928(0.61%)#15 | 200,110(0.07%)#251 |
| 16. | Hicksville | 130 | 21,928(0.59%)#16 | 200,110(0.06%)#255 |
| 17. | Dobbs Ferry | 122 | 21,928(0.56%)#17 | 200,110(0.06%)#276 |
| 18. | North Lindenhurst | 119 | 21,928(0.54%)#18 | 200,110(0.06%)#283 |
| 19. | Mamaroneck | 117 | 21,928(0.53%)#19 | 200,110(0.06%)#288 |
| 20. | Ossining | 116 | 21,928(0.53%)#20 | 200,110(0.06%)#292 |
| 21. | Oceanside | 113 | 21,928(0.52%)#21 | 200,110(0.06%)#296 |
| 22. | Bay Shore | 103 | 21,928(0.47%)#22 | 200,110(0.05%)#327 |
| 23. | Lake Ronkonkoma | 103 | 21,928(0.47%)#23 | 200,110(0.05%)#328 |
| 24. | Elmont | 85 | 21,928(0.39%)#24 | 200,110(0.04%)#406 |
| 25. | Floral Park | 85 | 21,928(0.39%)#25 | 200,110(0.04%)#407 |
| 26. | Plainview | 83 | 21,928(0.38%)#26 | 200,110(0.04%)#418 |
| 27. | Coram | 76 | 21,928(0.35%)#27 | 200,110(0.04%)#453 |
| 28. | North Massapequa | 69 | 21,928(0.31%)#28 | 200,110(0.03%)#500 |
| 29. | Roslyn Heights | 69 | 21,928(0.31%)#29 | 200,110(0.03%)#501 |
| 30. | Malverne | 68 | 21,928(0.31%)#30 | 200,110(0.03%)#512 |
| 31. | Armonk | 67 | 21,928(0.31%)#31 | 200,110(0.03%)#518 |
| 32. | Ronkonkoma | 65 | 21,928(0.30%)#32 | 200,110(0.03%)#526 |
| 33. | Hastings On Hudson | 64 | 21,928(0.29%)#33 | 200,110(0.03%)#531 |
| 34. | Syracuse | 60 | 21,928(0.27%)#34 | 200,110(0.03%)#562 |
| 35. | Chestnut Ridge | 57 | 21,928(0.26%)#35 | 200,110(0.03%)#597 |
| 36. | Hempstead | 55 | 21,928(0.25%)#36 | 200,110(0.03%)#608 |
| 37. | Island Park | 55 | 21,928(0.25%)#37 | 200,110(0.03%)#617 |
| 38. | Fairview Cdp Dutchess County | 54 | 21,928(0.25%)#38 | 200,110(0.03%)#627 |
| 39. | Babylon | 53 | 21,928(0.24%)#39 | 200,110(0.03%)#636 |
| 40. | Port Jefferson Station | 53 | 21,928(0.24%)#40 | 200,110(0.03%)#638 |
| 41. | West Islip | 52 | 21,928(0.24%)#41 | 200,110(0.03%)#647 |
| 42. | Putnam Lake | 51 | 21,928(0.23%)#42 | 200,110(0.03%)#667 |
| 43. | Roslyn | 51 | 21,928(0.23%)#43 | 200,110(0.03%)#668 |
| 44. | West Babylon | 50 | 21,928(0.23%)#44 | 200,110(0.02%)#676 |
| 45. | Brighton | 50 | 21,928(0.23%)#45 | 200,110(0.02%)#677 |
| 46. | West Hempstead | 50 | 21,928(0.23%)#46 | 200,110(0.02%)#678 |
| 47. | North Merrick | 49 | 21,928(0.22%)#47 | 200,110(0.02%)#685 |
| 48. | Chester | 49 | 21,928(0.22%)#48 | 200,110(0.02%)#688 |
| 49. | Glens Falls | 46 | 21,928(0.21%)#49 | 200,110(0.02%)#713 |
| 50. | Buffalo | 45 | 21,928(0.21%)#50 | 200,110(0.02%)#715 |
| 51. | North Amityville | 45 | 21,928(0.21%)#51 | 200,110(0.02%)#721 |
| 52. | East Islip | 45 | 21,928(0.21%)#52 | 200,110(0.02%)#722 |
| 53. | Rye | 44 | 21,928(0.20%)#53 | 200,110(0.02%)#733 |
| 54. | Irvington | 44 | 21,928(0.20%)#54 | 200,110(0.02%)#735 |
| 55. | North Valley Stream | 43 | 21,928(0.20%)#55 | 200,110(0.02%)#742 |
| 56. | Woodsburgh | 42 | 21,928(0.19%)#56 | 200,110(0.02%)#759 |
| 57. | Valley Stream | 41 | 21,928(0.19%)#57 | 200,110(0.02%)#766 |
| 58. | Haverstraw | 41 | 21,928(0.19%)#58 | 200,110(0.02%)#776 |
| 59. | Peekskill | 40 | 21,928(0.18%)#59 | 200,110(0.02%)#787 |
| 60. | Islandia | 39 | 21,928(0.18%)#60 | 200,110(0.02%)#804 |
| 61. | Hauppauge | 38 | 21,928(0.17%)#61 | 200,110(0.02%)#821 |
| 62. | Greece | 38 | 21,928(0.17%)#62 | 200,110(0.02%)#824 |
| 63. | East Hills | 36 | 21,928(0.16%)#63 | 200,110(0.02%)#855 |
| 64. | Centereach | 35 | 21,928(0.16%)#64 | 200,110(0.02%)#863 |
| 65. | Kingston | 35 | 21,928(0.16%)#65 | 200,110(0.02%)#864 |
| 66. | Rocky Point | 35 | 21,928(0.16%)#66 | 200,110(0.02%)#870 |
| 67. | North Wantagh | 35 | 21,928(0.16%)#67 | 200,110(0.02%)#872 |
| 68. | Port Jefferson | 35 | 21,928(0.16%)#68 | 200,110(0.02%)#874 |
| 69. | Holbrook | 34 | 21,928(0.16%)#69 | 200,110(0.02%)#891 |
| 70. | Tarrytown | 34 | 21,928(0.16%)#70 | 200,110(0.02%)#894 |
| 71. | Mineola | 33 | 21,928(0.15%)#71 | 200,110(0.02%)#906 |
| 72. | Great Neck | 31 | 21,928(0.14%)#72 | 200,110(0.02%)#958 |
| 73. | Rochester | 30 | 21,928(0.14%)#73 | 200,110(0.01%)#964 |
| 74. | Monsey | 30 | 21,928(0.14%)#74 | 200,110(0.01%)#971 |
| 75. | Plainedge | 30 | 21,928(0.14%)#75 | 200,110(0.01%)#976 |
| 76. | Eastchester | 29 | 21,928(0.13%)#76 | 200,110(0.01%)#992 |
| 77. | Freeport | 28 | 21,928(0.13%)#77 | 200,110(0.01%)#1,012 |
| 78. | Fairmount | 27 | 21,928(0.12%)#78 | 200,110(0.01%)#1,033 |
| 79. | Johnson City | 26 | 21,928(0.12%)#79 | 200,110(0.01%)#1,057 |
| 80. | Spackenkill | 26 | 21,928(0.12%)#80 | 200,110(0.01%)#1,063 |
| 81. | Lindenhurst | 25 | 21,928(0.11%)#81 | 200,110(0.01%)#1,081 |
| 82. | Kenmore | 25 | 21,928(0.11%)#82 | 200,110(0.01%)#1,082 |
| 83. | South Huntington | 25 | 21,928(0.11%)#83 | 200,110(0.01%)#1,086 |
| 84. | Airmont | 25 | 21,928(0.11%)#84 | 200,110(0.01%)#1,087 |
| 85. | Upper Nyack | 25 | 21,928(0.11%)#85 | 200,110(0.01%)#1,100 |
| 86. | North Babylon | 24 | 21,928(0.11%)#86 | 200,110(0.01%)#1,120 |
| 87. | Southold | 24 | 21,928(0.11%)#87 | 200,110(0.01%)#1,127 |
| 88. | Lake Mohegan | 24 | 21,928(0.11%)#88 | 200,110(0.01%)#1,128 |
| 89. | Chelsea Cove | 23 | 21,928(0.10%)#89 | 200,110(0.01%)#1,161 |
| 90. | Irondequoit | 22 | 21,928(0.10%)#90 | 200,110(0.01%)#1,170 |
| 91. | Port Washington | 22 | 21,928(0.10%)#91 | 200,110(0.01%)#1,182 |
| 92. | Myers Corner | 22 | 21,928(0.10%)#92 | 200,110(0.01%)#1,187 |
| 93. | Pelham | 22 | 21,928(0.10%)#93 | 200,110(0.01%)#1,189 |
| 94. | Port Washington North | 22 | 21,928(0.10%)#94 | 200,110(0.01%)#1,193 |
| 95. | Ithaca | 21 | 21,928(0.10%)#95 | 200,110(0.01%)#1,215 |
| 96. | Lake Grove | 21 | 21,928(0.10%)#96 | 200,110(0.01%)#1,228 |
| 97. | New City | 20 | 21,928(0.09%)#97 | 200,110(0.01%)#1,242 |
| 98. | Amityville | 20 | 21,928(0.09%)#98 | 200,110(0.01%)#1,255 |
| 99. | Newark | 20 | 21,928(0.09%)#99 | 200,110(0.01%)#1,256 |
| 100. | East Hampton | 20 | 21,928(0.09%)#100 | 200,110(0.01%)#1,261 |
Common Questions
What are the Top 10 Cities with the Most Immigrants from Argentina in New York?
Top 10 Cities with the Most Immigrants from Argentina in New York are:
#1
12,718
#2
402
#3
286
#4
243
#5
242
#6
201
#7
185
#8
180
#9
163
#10
160
What city has the Most Immigrants from Argentina in New York?
New York has the Most Immigrants from Argentina in New York with 12,718.
What is the Total Immigrants from Argentina in the State of New York?
Total Immigrants from Argentina in New York is 21,928.
What is the Total Immigrants from Argentina in the United States?
Total Immigrants from Argentina in the United States is 200,110.