Cities with the Most Immigrants from Argentina in Washington
RELATED REPORTS & OPTIONS
Argentina
Washington
Compare Cities
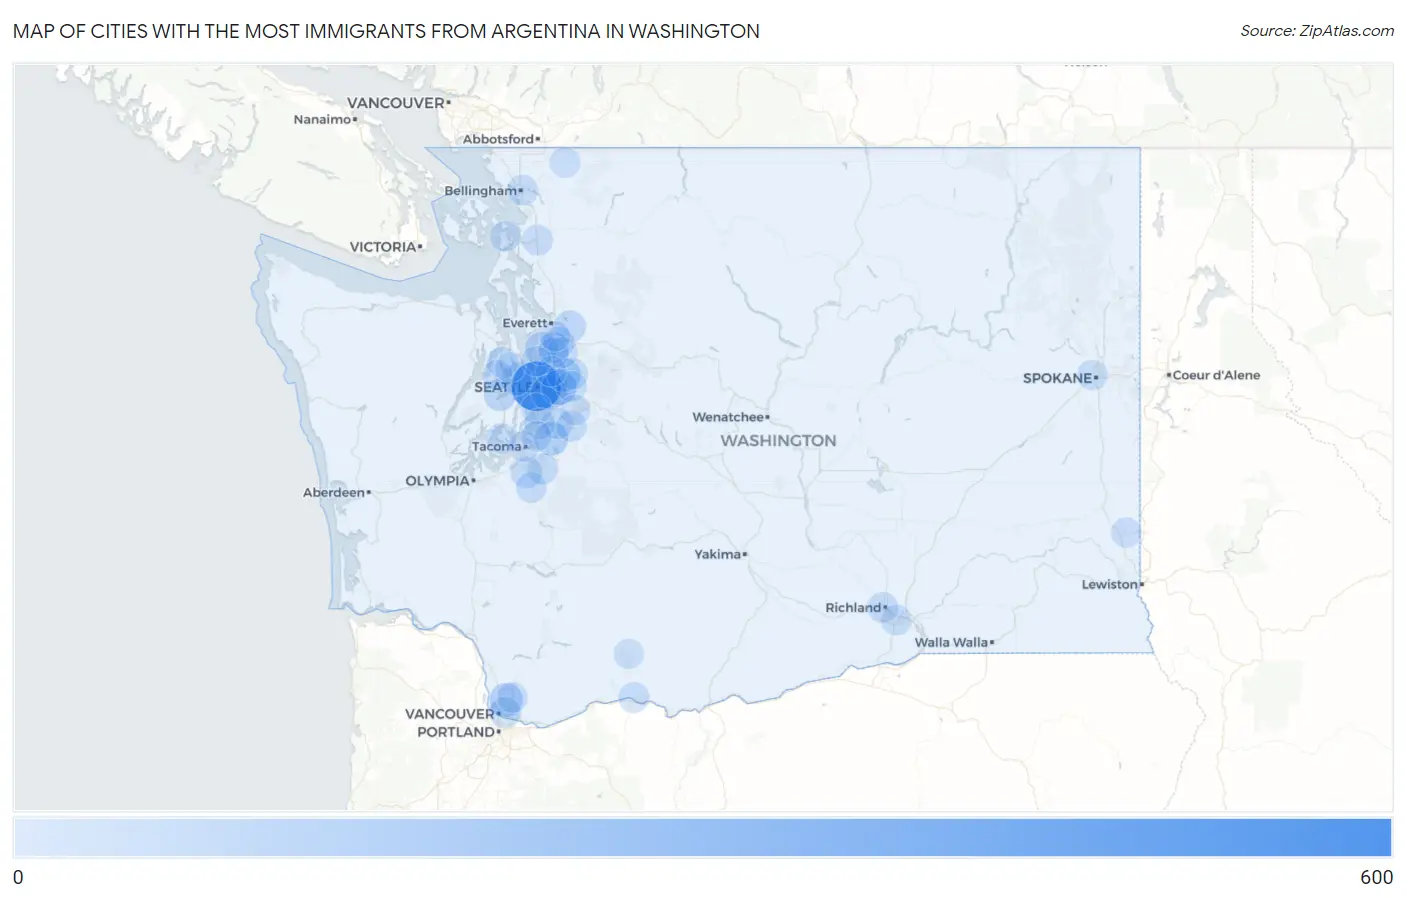
Map of Cities with the Most Immigrants from Argentina in Washington
0
600
Cities with the Most Immigrants from Argentina in Washington
| City | Argentina | vs State | vs National | |
| 1. | Seattle | 551 | 2,284(24.12%)#1 | 200,110(0.28%)#42 |
| 2. | Mercer Island | 144 | 2,284(6.30%)#2 | 200,110(0.07%)#224 |
| 3. | Bellevue | 139 | 2,284(6.09%)#3 | 200,110(0.07%)#233 |
| 4. | Auburn | 101 | 2,284(4.42%)#4 | 200,110(0.05%)#332 |
| 5. | Redmond | 101 | 2,284(4.42%)#5 | 200,110(0.05%)#333 |
| 6. | Barberton | 93 | 2,284(4.07%)#6 | 200,110(0.05%)#372 |
| 7. | Lynnwood | 70 | 2,284(3.06%)#7 | 200,110(0.03%)#492 |
| 8. | Navy Yard City | 51 | 2,284(2.23%)#8 | 200,110(0.03%)#669 |
| 9. | Everett | 44 | 2,284(1.93%)#9 | 200,110(0.02%)#724 |
| 10. | Vancouver | 37 | 2,284(1.62%)#10 | 200,110(0.02%)#833 |
| 11. | Spanaway | 37 | 2,284(1.62%)#11 | 200,110(0.02%)#838 |
| 12. | Silver Firs | 37 | 2,284(1.62%)#12 | 200,110(0.02%)#839 |
| 13. | Bainbridge Island | 31 | 2,284(1.36%)#13 | 200,110(0.02%)#953 |
| 14. | Union Hill Novelty Hill | 31 | 2,284(1.36%)#14 | 200,110(0.02%)#955 |
| 15. | Mill Creek East | 26 | 2,284(1.14%)#15 | 200,110(0.01%)#1,051 |
| 16. | Fairwood Cdp King County | 26 | 2,284(1.14%)#16 | 200,110(0.01%)#1,055 |
| 17. | Kent | 24 | 2,284(1.05%)#17 | 200,110(0.01%)#1,104 |
| 18. | Poulsbo | 24 | 2,284(1.05%)#18 | 200,110(0.01%)#1,122 |
| 19. | Burien | 23 | 2,284(1.01%)#19 | 200,110(0.01%)#1,142 |
| 20. | South Hill | 22 | 2,284(0.96%)#20 | 200,110(0.01%)#1,169 |
| 21. | Maltby | 22 | 2,284(0.96%)#21 | 200,110(0.01%)#1,186 |
| 22. | Burlington | 21 | 2,284(0.92%)#22 | 200,110(0.01%)#1,230 |
| 23. | Des Moines | 20 | 2,284(0.88%)#23 | 200,110(0.01%)#1,243 |
| 24. | Richland | 19 | 2,284(0.83%)#24 | 200,110(0.01%)#1,266 |
| 25. | Maple Valley | 19 | 2,284(0.83%)#25 | 200,110(0.01%)#1,274 |
| 26. | White Salmon | 19 | 2,284(0.83%)#26 | 200,110(0.01%)#1,295 |
| 27. | Sammamish | 18 | 2,284(0.79%)#27 | 200,110(0.01%)#1,298 |
| 28. | Artondale | 17 | 2,284(0.74%)#28 | 200,110(0.01%)#1,356 |
| 29. | Kennewick | 15 | 2,284(0.66%)#29 | 200,110(0.01%)#1,415 |
| 30. | South Creek | 15 | 2,284(0.66%)#30 | 200,110(0.01%)#1,455 |
| 31. | Bellingham | 14 | 2,284(0.61%)#31 | 200,110(0.01%)#1,466 |
| 32. | Tacoma | 13 | 2,284(0.57%)#32 | 200,110(0.01%)#1,510 |
| 33. | Bothell East | 13 | 2,284(0.57%)#33 | 200,110(0.01%)#1,537 |
| 34. | Maple Falls | 13 | 2,284(0.57%)#34 | 200,110(0.01%)#1,555 |
| 35. | Kirkland | 12 | 2,284(0.53%)#35 | 200,110(0.01%)#1,559 |
| 36. | Mirrormont | 12 | 2,284(0.53%)#36 | 200,110(0.01%)#1,598 |
| 37. | Brush Prairie | 12 | 2,284(0.53%)#37 | 200,110(0.01%)#1,601 |
| 38. | Spokane | 11 | 2,284(0.48%)#38 | 200,110(0.01%)#1,610 |
| 39. | Federal Way | 10 | 2,284(0.44%)#39 | 200,110(0.00%)#1,671 |
| 40. | Eastmont | 10 | 2,284(0.44%)#40 | 200,110(0.00%)#1,693 |
| 41. | Anacortes | 8 | 2,284(0.35%)#41 | 200,110(0.00%)#1,812 |
| 42. | Pullman | 7 | 2,284(0.31%)#42 | 200,110(0.00%)#1,861 |
| 43. | Shoreline | 5 | 2,284(0.22%)#43 | 200,110(0.00%)#1,975 |
| 44. | Silverdale | 5 | 2,284(0.22%)#44 | 200,110(0.00%)#1,984 |
| 45. | Suquamish | 2 | 2,284(0.09%)#45 | 200,110(0.00%)#2,119 |
| 46. | Trout Lake | 1 | 2,284(0.04%)#46 | 200,110(0.00%)#2,175 |
Common Questions
What are the Top 10 Cities with the Most Immigrants from Argentina in Washington?
Top 10 Cities with the Most Immigrants from Argentina in Washington are:
#1
551
#2
144
#3
139
#4
101
#5
101
#6
93
#7
70
#8
51
#9
44
#10
37
What city has the Most Immigrants from Argentina in Washington?
Seattle has the Most Immigrants from Argentina in Washington with 551.
What is the Total Immigrants from Argentina in the State of Washington?
Total Immigrants from Argentina in Washington is 2,284.
What is the Total Immigrants from Argentina in the United States?
Total Immigrants from Argentina in the United States is 200,110.