Cities with the Most Immigrants from Argentina in Connecticut
RELATED REPORTS & OPTIONS
Argentina
Connecticut
Compare Cities
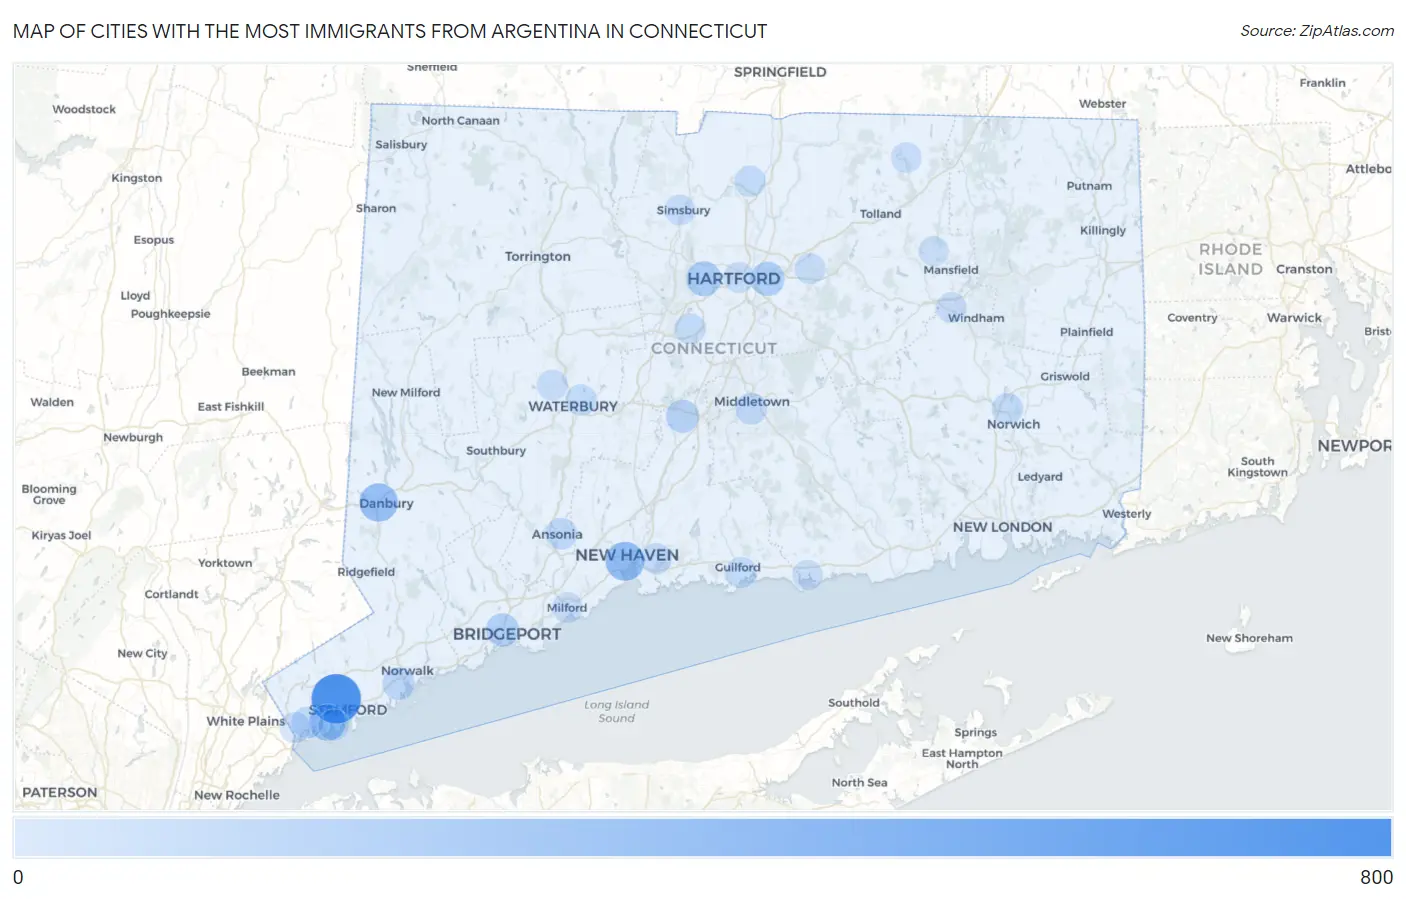
Map of Cities with the Most Immigrants from Argentina in Connecticut
0
800
Cities with the Most Immigrants from Argentina in Connecticut
| City | Argentina | vs State | vs National | |
| 1. | Stamford | 626 | 3,583(17.47%)#1 | 200,110(0.31%)#33 |
| 2. | New Haven | 276 | 3,583(7.70%)#2 | 200,110(0.14%)#92 |
| 3. | Danbury | 255 | 3,583(7.12%)#3 | 200,110(0.13%)#101 |
| 4. | Riverside | 202 | 3,583(5.64%)#4 | 200,110(0.10%)#155 |
| 5. | West Hartford | 147 | 3,583(4.10%)#5 | 200,110(0.07%)#216 |
| 6. | East Hartford | 127 | 3,583(3.54%)#6 | 200,110(0.06%)#261 |
| 7. | Bridgeport | 100 | 3,583(2.79%)#7 | 200,110(0.05%)#338 |
| 8. | Meriden | 91 | 3,583(2.54%)#8 | 200,110(0.05%)#378 |
| 9. | Norwalk | 70 | 3,583(1.95%)#9 | 200,110(0.03%)#488 |
| 10. | Oronoque | 68 | 3,583(1.90%)#10 | 200,110(0.03%)#513 |
| 11. | Ansonia | 53 | 3,583(1.48%)#11 | 200,110(0.03%)#635 |
| 12. | Greenwich | 52 | 3,583(1.45%)#12 | 200,110(0.03%)#649 |
| 13. | Middletown | 51 | 3,583(1.42%)#13 | 200,110(0.03%)#657 |
| 14. | Norwich | 38 | 3,583(1.06%)#14 | 200,110(0.02%)#814 |
| 15. | Ball Pond | 38 | 3,583(1.06%)#15 | 200,110(0.02%)#832 |
| 16. | Windsor Locks | 35 | 3,583(0.98%)#16 | 200,110(0.02%)#871 |
| 17. | Old Greenwich | 35 | 3,583(0.98%)#17 | 200,110(0.02%)#875 |
| 18. | Waterbury | 33 | 3,583(0.92%)#18 | 200,110(0.02%)#899 |
| 19. | Coleytown | 32 | 3,583(0.89%)#19 | 200,110(0.02%)#938 |
| 20. | Guilford Center | 32 | 3,583(0.89%)#20 | 200,110(0.02%)#939 |
| 21. | East Haven | 31 | 3,583(0.87%)#21 | 200,110(0.02%)#952 |
| 22. | New Britain | 30 | 3,583(0.84%)#22 | 200,110(0.01%)#967 |
| 23. | Staples | 28 | 3,583(0.78%)#23 | 200,110(0.01%)#1,021 |
| 24. | Hartford | 25 | 3,583(0.70%)#24 | 200,110(0.01%)#1,067 |
| 25. | Pemberwick | 25 | 3,583(0.70%)#25 | 200,110(0.01%)#1,097 |
| 26. | Oakville | 23 | 3,583(0.64%)#26 | 200,110(0.01%)#1,155 |
| 27. | Manchester | 21 | 3,583(0.59%)#27 | 200,110(0.01%)#1,211 |
| 28. | Simsbury Center | 18 | 3,583(0.50%)#28 | 200,110(0.01%)#1,326 |
| 29. | Milford City Balance | 16 | 3,583(0.45%)#29 | 200,110(0.01%)#1,380 |
| 30. | Stafford Springs | 14 | 3,583(0.39%)#30 | 200,110(0.01%)#1,502 |
| 31. | Willimantic | 12 | 3,583(0.33%)#31 | 200,110(0.01%)#1,573 |
| 32. | Noroton | 9 | 3,583(0.25%)#32 | 200,110(0.00%)#1,773 |
| 33. | Clinton | 9 | 3,583(0.25%)#33 | 200,110(0.00%)#1,779 |
| 34. | Fairfield University | 8 | 3,583(0.22%)#34 | 200,110(0.00%)#1,832 |
| 35. | Litchfield Borough | 7 | 3,583(0.20%)#35 | 200,110(0.00%)#1,904 |
| 36. | Quinnipiac University | 6 | 3,583(0.17%)#36 | 200,110(0.00%)#1,945 |
| 37. | Storrs | 4 | 3,583(0.11%)#37 | 200,110(0.00%)#2,026 |
1
2Common Questions
What are the Top 10 Cities with the Most Immigrants from Argentina in Connecticut?
Top 10 Cities with the Most Immigrants from Argentina in Connecticut are:
#1
626
#2
276
#3
255
#4
202
#5
147
#6
127
#7
100
#8
91
#9
70
#10
53
What city has the Most Immigrants from Argentina in Connecticut?
Stamford has the Most Immigrants from Argentina in Connecticut with 626.
What is the Total Immigrants from Argentina in the State of Connecticut?
Total Immigrants from Argentina in Connecticut is 3,583.
What is the Total Immigrants from Argentina in the United States?
Total Immigrants from Argentina in the United States is 200,110.