Harrison, NY Map & Demographics
Harrison Map
Harrison Overview
$76,274
PER CAPITA INCOME
$182,099
AVG FAMILY INCOME
$151,038
AVG HOUSEHOLD INCOME
61.3%
WAGE / INCOME GAP [ % ]
38.7¢/ $1
WAGE / INCOME GAP [ $ ]
$18,736
FAMILY INCOME DEFICIT
0.53
INEQUALITY / GINI INDEX
28,721
TOTAL POPULATION
13,453
MALE POPULATION
15,268
FEMALE POPULATION
88.11
MALES / 100 FEMALES
113.49
FEMALES / 100 MALES
35.5
MEDIAN AGE
3.4
AVG FAMILY SIZE
3.1
AVG HOUSEHOLD SIZE
14,420
LABOR FORCE [ PEOPLE ]
62.7%
PERCENT IN LABOR FORCE
5.3%
UNEMPLOYMENT RATE
Harrison Zip Codes
Harrison Area Codes
Income in Harrison
Income Overview in Harrison
Per Capita Income in Harrison is $76,274, while median incomes of families and households are $182,099 and $151,038 respectively.
| Characteristic | Number | Measure |
| Per Capita Income | 28,721 | $76,274 |
| Median Family Income | 6,457 | $182,099 |
| Mean Family Income | 6,457 | $291,367 |
| Median Household Income | 8,242 | $151,038 |
| Mean Household Income | 8,242 | $257,202 |
| Income Deficit | 6,457 | $18,736 |
| Wage / Income Gap (%) | 28,721 | 61.27% |
| Wage / Income Gap ($) | 28,721 | 38.73¢ per $1 |
| Gini / Inequality Index | 28,721 | 0.53 |
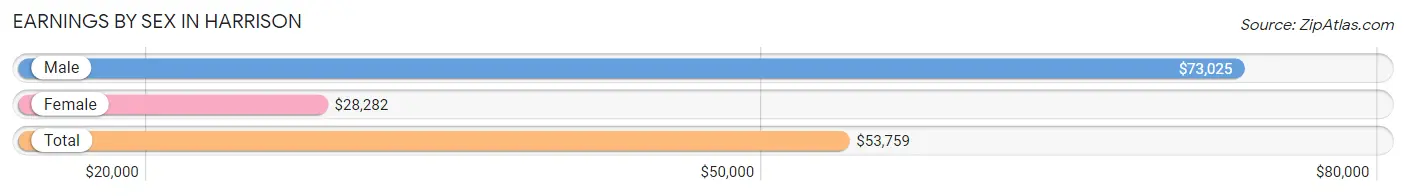
Earnings by Sex in Harrison
Average Earnings in Harrison are $53,759, $73,025 for men and $28,282 for women, a difference of 61.3%.
| Sex | Number | Average Earnings |
| Male | 8,305 (51.0%) | $73,025 |
| Female | 7,992 (49.0%) | $28,282 |
| Total | 16,297 (100.0%) | $53,759 |
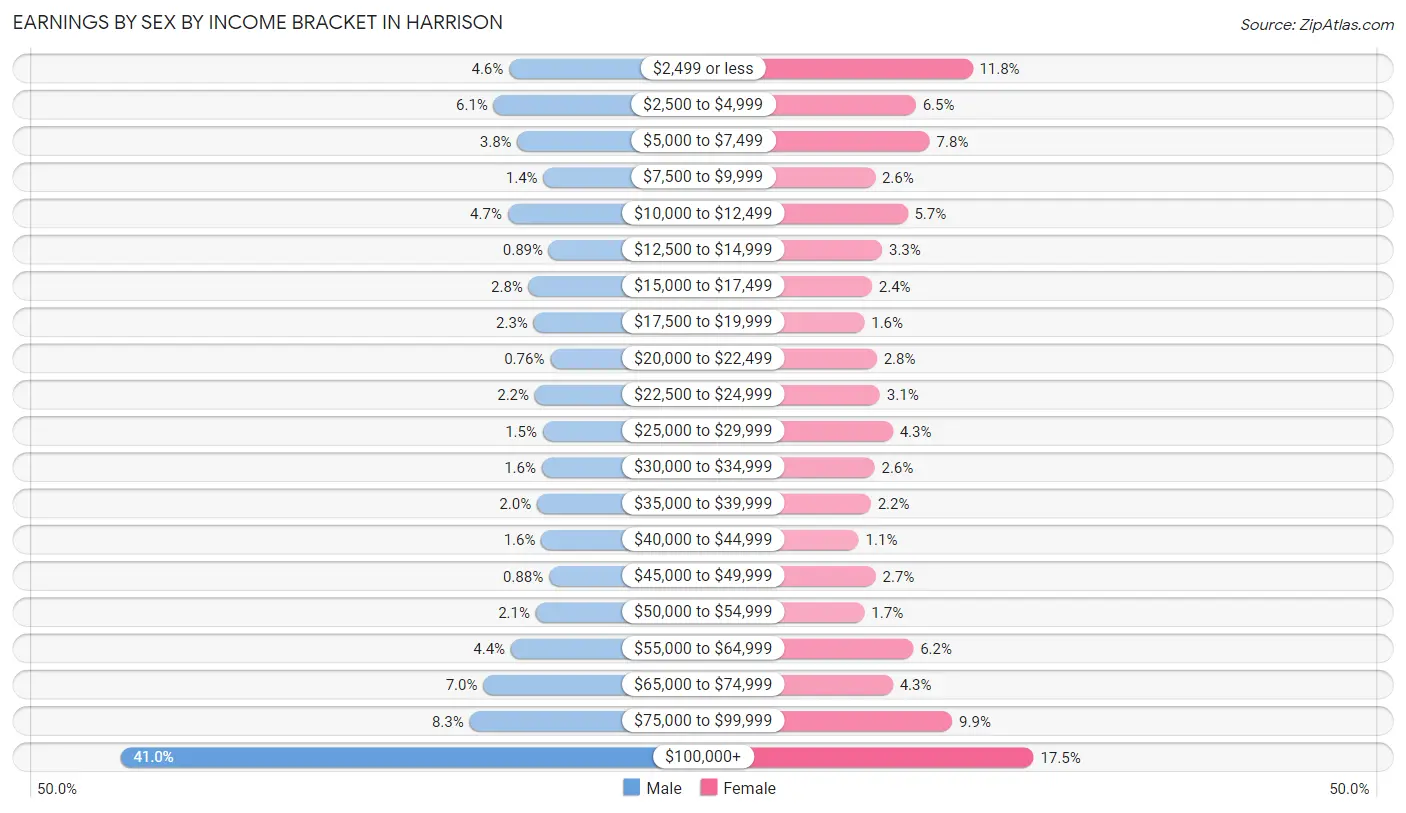
Earnings by Sex by Income Bracket in Harrison
The most common earnings brackets in Harrison are $100,000+ for men (3,407 | 41.0%) and $100,000+ for women (1,398 | 17.5%).
| Income | Male | Female |
| $2,499 or less | 383 (4.6%) | 941 (11.8%) |
| $2,500 to $4,999 | 503 (6.1%) | 516 (6.5%) |
| $5,000 to $7,499 | 318 (3.8%) | 620 (7.8%) |
| $7,500 to $9,999 | 116 (1.4%) | 211 (2.6%) |
| $10,000 to $12,499 | 394 (4.7%) | 454 (5.7%) |
| $12,500 to $14,999 | 74 (0.9%) | 264 (3.3%) |
| $15,000 to $17,499 | 231 (2.8%) | 188 (2.4%) |
| $17,500 to $19,999 | 192 (2.3%) | 131 (1.6%) |
| $20,000 to $22,499 | 63 (0.8%) | 224 (2.8%) |
| $22,500 to $24,999 | 183 (2.2%) | 248 (3.1%) |
| $25,000 to $29,999 | 121 (1.5%) | 344 (4.3%) |
| $30,000 to $34,999 | 129 (1.5%) | 208 (2.6%) |
| $35,000 to $39,999 | 166 (2.0%) | 179 (2.2%) |
| $40,000 to $44,999 | 133 (1.6%) | 89 (1.1%) |
| $45,000 to $49,999 | 73 (0.9%) | 215 (2.7%) |
| $50,000 to $54,999 | 175 (2.1%) | 132 (1.7%) |
| $55,000 to $64,999 | 369 (4.4%) | 497 (6.2%) |
| $65,000 to $74,999 | 584 (7.0%) | 344 (4.3%) |
| $75,000 to $99,999 | 691 (8.3%) | 789 (9.9%) |
| $100,000+ | 3,407 (41.0%) | 1,398 (17.5%) |
| Total | 8,305 (100.0%) | 7,992 (100.0%) |
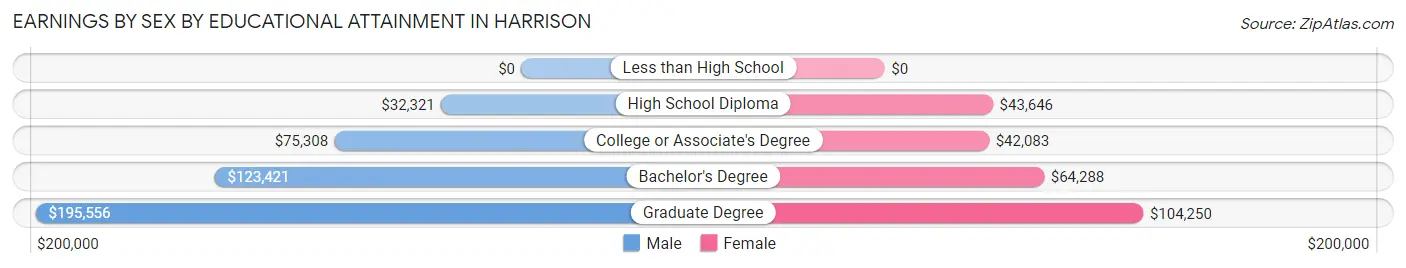
Earnings by Sex by Educational Attainment in Harrison
Average earnings in Harrison are $103,929 for men and $63,541 for women, a difference of 38.9%. Men with an educational attainment of graduate degree enjoy the highest average annual earnings of $195,556, while those with high school diploma education earn the least with $32,321. Women with an educational attainment of graduate degree earn the most with the average annual earnings of $104,250, while those with college or associate's degree education have the smallest earnings of $42,083.
| Educational Attainment | Male Income | Female Income |
| Less than High School | - | - |
| High School Diploma | $32,321 | $43,646 |
| College or Associate's Degree | $75,308 | $42,083 |
| Bachelor's Degree | $123,421 | $64,288 |
| Graduate Degree | $195,556 | $104,250 |
| Total | $103,929 | $63,541 |
Family Income in Harrison
Family Income Brackets in Harrison
According to the Harrison family income data, there are 2,977 families falling into the $200,000+ income range, which is the most common income bracket and makes up 46.1% of all families. Conversely, the $10,000 to $14,999 income bracket is the least frequent group with only 32 families (0.5%) belonging to this category.
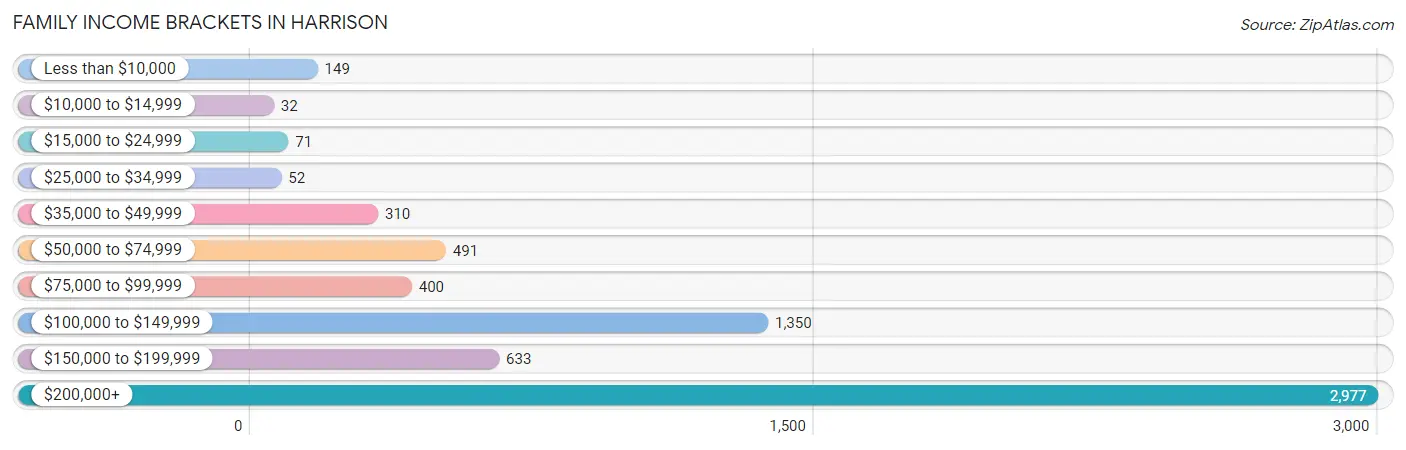
| Income Bracket | # Families | % Families |
| Less than $10,000 | 149 | 2.3% |
| $10,000 to $14,999 | 32 | 0.5% |
| $15,000 to $24,999 | 71 | 1.1% |
| $25,000 to $34,999 | 52 | 0.8% |
| $35,000 to $49,999 | 310 | 4.8% |
| $50,000 to $74,999 | 491 | 7.6% |
| $75,000 to $99,999 | 400 | 6.2% |
| $100,000 to $149,999 | 1,350 | 20.9% |
| $150,000 to $199,999 | 633 | 9.8% |
| $200,000+ | 2,977 | 46.1% |
Family Income by Famaliy Size in Harrison
4-person families (1,998 | 30.9%) account for the highest median family income in Harrison with $227,961 per family, while 3-person families (1,315 | 20.4%) have the highest median income of $62,727 per family member.
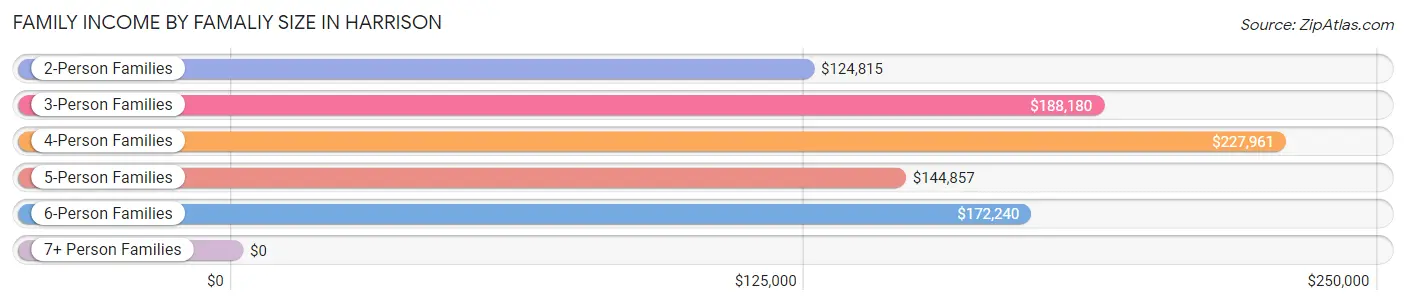
| Income Bracket | # Families | Median Income |
| 2-Person Families | 2,104 (32.6%) | $124,815 |
| 3-Person Families | 1,315 (20.4%) | $188,180 |
| 4-Person Families | 1,998 (30.9%) | $227,961 |
| 5-Person Families | 799 (12.4%) | $144,857 |
| 6-Person Families | 199 (3.1%) | $172,240 |
| 7+ Person Families | 42 (0.6%) | $0 |
| Total | 6,457 (100.0%) | $182,099 |
Family Income by Number of Earners in Harrison
The median family income in Harrison is $182,099, with families comprising 2 earners (2,936) having the highest median family income of $209,345, while families with no earners (648) have the lowest median family income of $73,713, accounting for 45.5% and 10.0% of families, respectively.
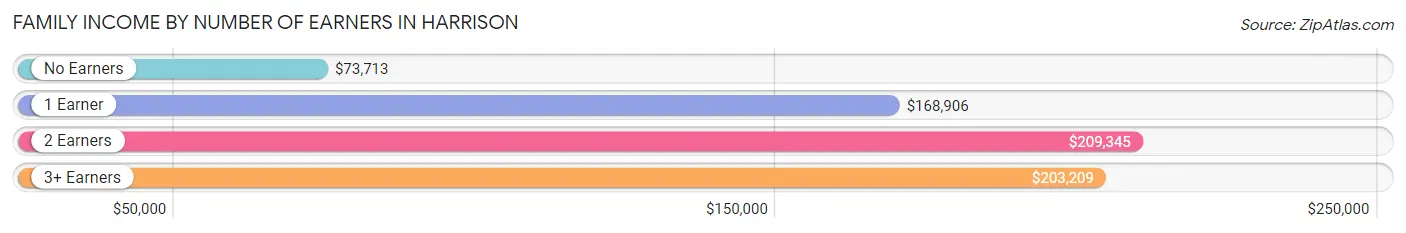
| Number of Earners | # Families | Median Income |
| No Earners | 648 (10.0%) | $73,713 |
| 1 Earner | 1,972 (30.5%) | $168,906 |
| 2 Earners | 2,936 (45.5%) | $209,345 |
| 3+ Earners | 901 (14.0%) | $203,209 |
| Total | 6,457 (100.0%) | $182,099 |
Household Income in Harrison
Household Income Brackets in Harrison
With 3,214 households falling in the category, the $200,000+ income range is the most frequent in Harrison, accounting for 39.0% of all households. In contrast, only 82 households (1.0%) fall into the $10,000 to $14,999 income bracket, making it the least populous group.
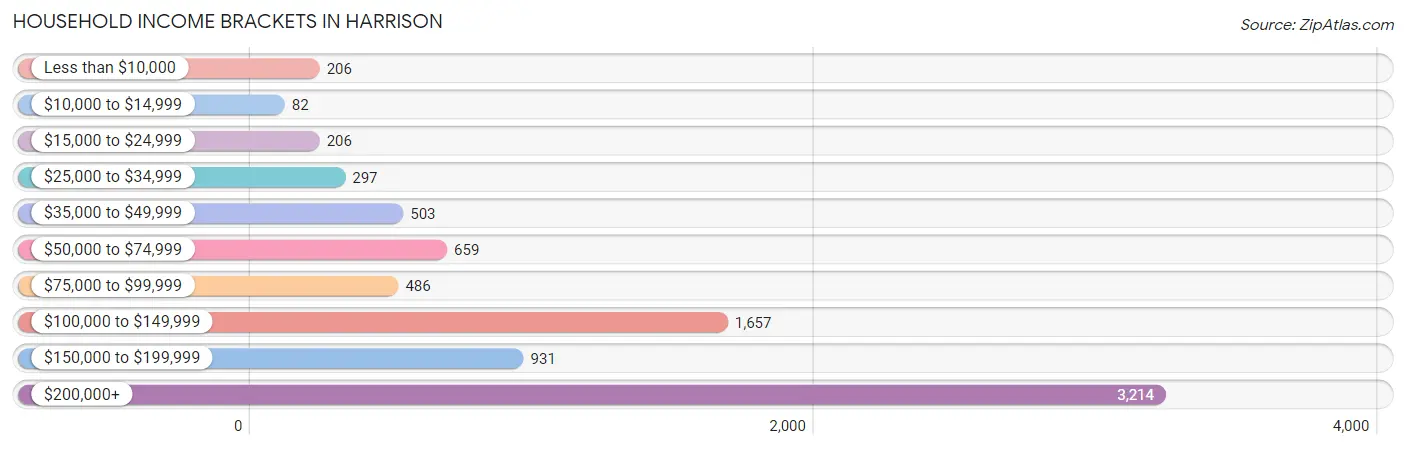
| Income Bracket | # Households | % Households |
| Less than $10,000 | 206 | 2.5% |
| $10,000 to $14,999 | 82 | 1.0% |
| $15,000 to $24,999 | 206 | 2.5% |
| $25,000 to $34,999 | 297 | 3.6% |
| $35,000 to $49,999 | 503 | 6.1% |
| $50,000 to $74,999 | 659 | 8.0% |
| $75,000 to $99,999 | 486 | 5.9% |
| $100,000 to $149,999 | 1,657 | 20.1% |
| $150,000 to $199,999 | 931 | 11.3% |
| $200,000+ | 3,214 | 39.0% |
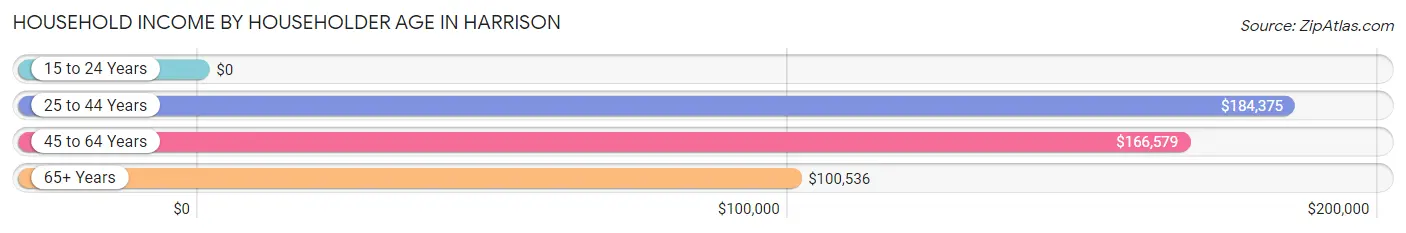
Household Income by Householder Age in Harrison
The median household income in Harrison is $151,038, with the highest median household income of $184,375 found in the 25 to 44 years age bracket for the primary householder. A total of 2,605 households (31.6%) fall into this category. Meanwhile, the 15 to 24 years age bracket for the primary householder has the lowest median household income of $0, with 5 households (0.1%) in this group.
| Income Bracket | # Households | Median Income |
| 15 to 24 Years | 5 (0.1%) | $0 |
| 25 to 44 Years | 2,605 (31.6%) | $184,375 |
| 45 to 64 Years | 3,466 (42.0%) | $166,579 |
| 65+ Years | 2,166 (26.3%) | $100,536 |
| Total | 8,242 (100.0%) | $151,038 |
Poverty in Harrison
Income Below Poverty by Sex and Age in Harrison
With 3.0% poverty level for males and 5.9% for females among the residents of Harrison, 18 to 24 year old males and 18 to 24 year old females are the most vulnerable to poverty, with 77 males (10.0%) and 147 females (12.8%) in their respective age groups living below the poverty level.
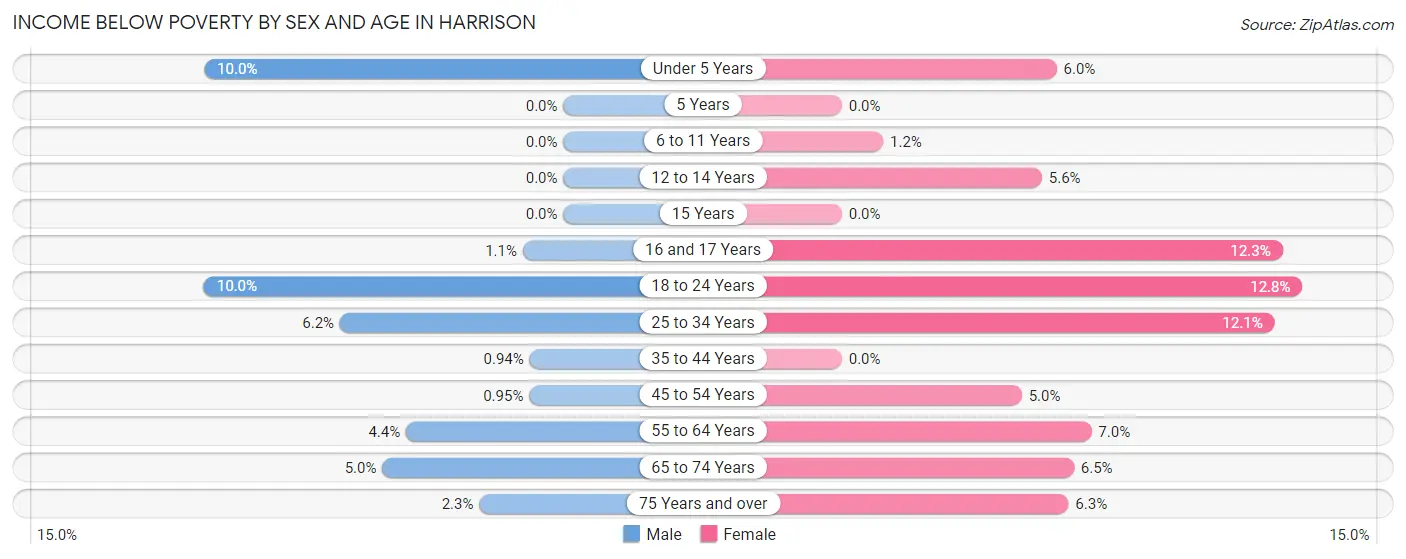
| Age Bracket | Male | Female |
| Under 5 Years | 63 (10.0%) | 49 (6.0%) |
| 5 Years | 0 (0.0%) | 0 (0.0%) |
| 6 to 11 Years | 0 (0.0%) | 15 (1.1%) |
| 12 to 14 Years | 0 (0.0%) | 39 (5.6%) |
| 15 Years | 0 (0.0%) | 0 (0.0%) |
| 16 and 17 Years | 7 (1.1%) | 74 (12.3%) |
| 18 to 24 Years | 77 (10.0%) | 147 (12.8%) |
| 25 to 34 Years | 57 (6.2%) | 140 (12.0%) |
| 35 to 44 Years | 19 (0.9%) | 0 (0.0%) |
| 45 to 54 Years | 20 (0.9%) | 111 (5.0%) |
| 55 to 64 Years | 61 (4.4%) | 89 (7.0%) |
| 65 to 74 Years | 43 (5.0%) | 70 (6.5%) |
| 75 Years and over | 15 (2.3%) | 61 (6.3%) |
| Total | 362 (3.0%) | 795 (5.9%) |
Income Above Poverty by Sex and Age in Harrison
According to the poverty statistics in Harrison, males aged 5 years and females aged 5 years are the age groups that are most secure financially, with 100.0% of males and 100.0% of females in these age groups living above the poverty line.
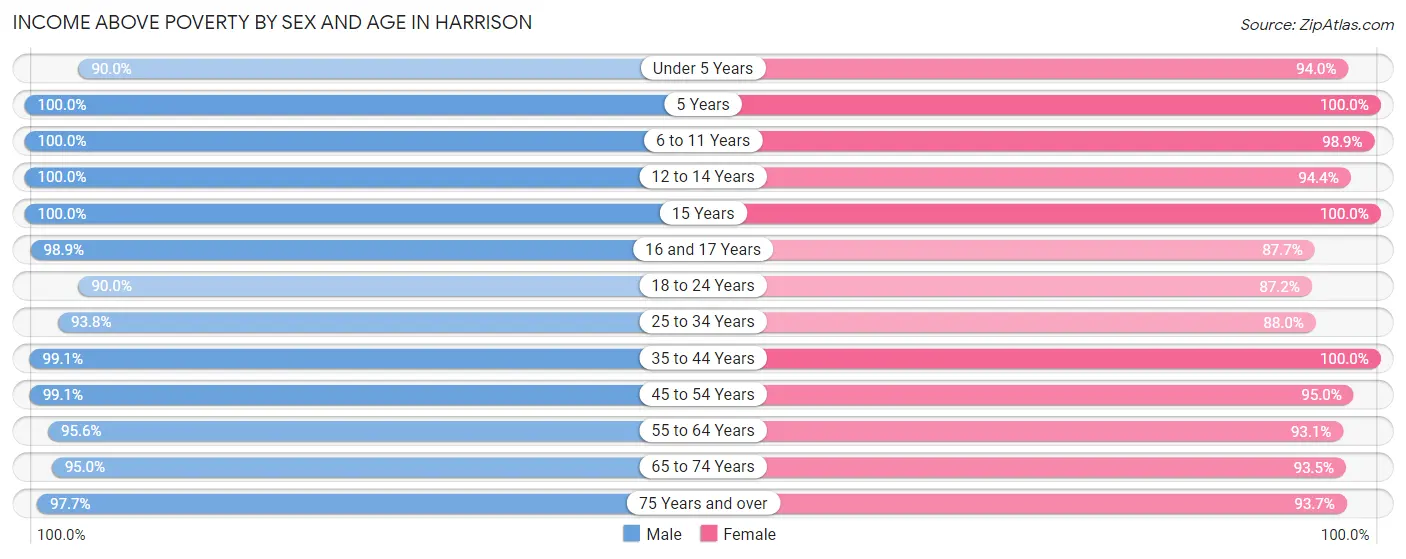
| Age Bracket | Male | Female |
| Under 5 Years | 567 (90.0%) | 770 (94.0%) |
| 5 Years | 89 (100.0%) | 59 (100.0%) |
| 6 to 11 Years | 1,250 (100.0%) | 1,285 (98.9%) |
| 12 to 14 Years | 554 (100.0%) | 661 (94.4%) |
| 15 Years | 148 (100.0%) | 63 (100.0%) |
| 16 and 17 Years | 613 (98.9%) | 529 (87.7%) |
| 18 to 24 Years | 692 (90.0%) | 1,000 (87.2%) |
| 25 to 34 Years | 860 (93.8%) | 1,022 (87.9%) |
| 35 to 44 Years | 2,000 (99.1%) | 1,957 (100.0%) |
| 45 to 54 Years | 2,092 (99.1%) | 2,103 (95.0%) |
| 55 to 64 Years | 1,331 (95.6%) | 1,192 (93.0%) |
| 65 to 74 Years | 811 (95.0%) | 1,014 (93.5%) |
| 75 Years and over | 627 (97.7%) | 906 (93.7%) |
| Total | 11,634 (97.0%) | 12,561 (94.1%) |
Income Below Poverty Among Married-Couple Families in Harrison
The poverty statistics for married-couple families in Harrison show that 1.3% or 68 of the total 5,275 families live below the poverty line. Families with no children have the highest poverty rate of 2.4%, comprising of 48 families. On the other hand, families with 3 or 4 children have the lowest poverty rate of 0.0%, which includes 0 families.
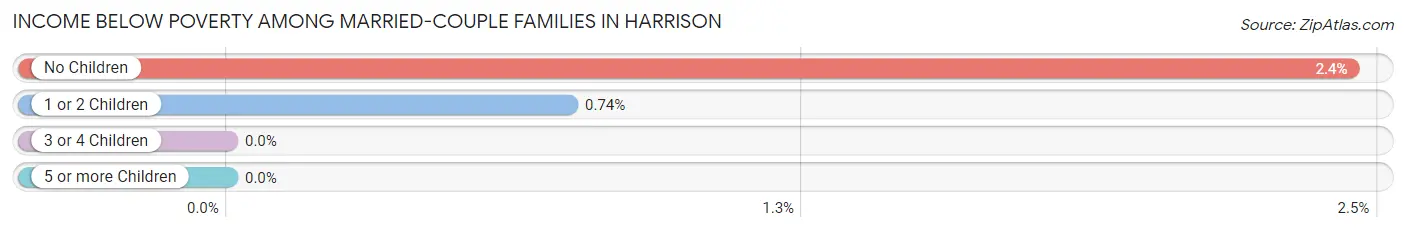
| Children | Above Poverty | Below Poverty |
| No Children | 1,921 (97.6%) | 48 (2.4%) |
| 1 or 2 Children | 2,687 (99.3%) | 20 (0.7%) |
| 3 or 4 Children | 599 (100.0%) | 0 (0.0%) |
| 5 or more Children | 0 (0.0%) | 0 (0.0%) |
| Total | 5,207 (98.7%) | 68 (1.3%) |
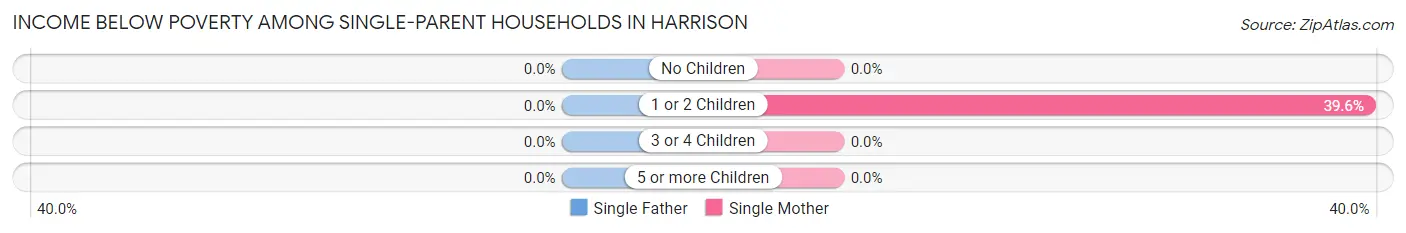
Income Below Poverty Among Single-Parent Households in Harrison
| Children | Single Father | Single Mother |
| No Children | 0 (0.0%) | 0 (0.0%) |
| 1 or 2 Children | 0 (0.0%) | 132 (39.6%) |
| 3 or 4 Children | 0 (0.0%) | 0 (0.0%) |
| 5 or more Children | 0 (0.0%) | 0 (0.0%) |
| Total | 0 (0.0%) | 132 (17.2%) |
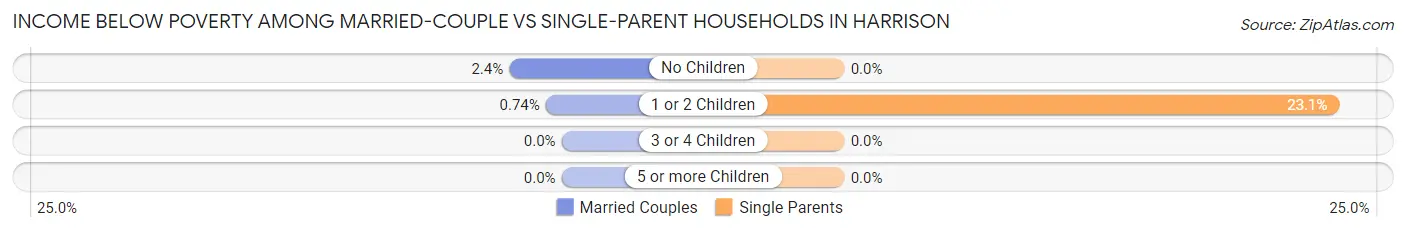
Income Below Poverty Among Married-Couple vs Single-Parent Households in Harrison
The poverty data for Harrison shows that 68 of the married-couple family households (1.3%) and 132 of the single-parent households (11.2%) are living below the poverty level. Within the married-couple family households, those with no children have the highest poverty rate, with 48 households (2.4%) falling below the poverty line. Among the single-parent households, those with 1 or 2 children have the highest poverty rate, with 132 household (23.1%) living below poverty.
| Children | Married-Couple Families | Single-Parent Households |
| No Children | 48 (2.4%) | 0 (0.0%) |
| 1 or 2 Children | 20 (0.7%) | 132 (23.1%) |
| 3 or 4 Children | 0 (0.0%) | 0 (0.0%) |
| 5 or more Children | 0 (0.0%) | 0 (0.0%) |
| Total | 68 (1.3%) | 132 (11.2%) |
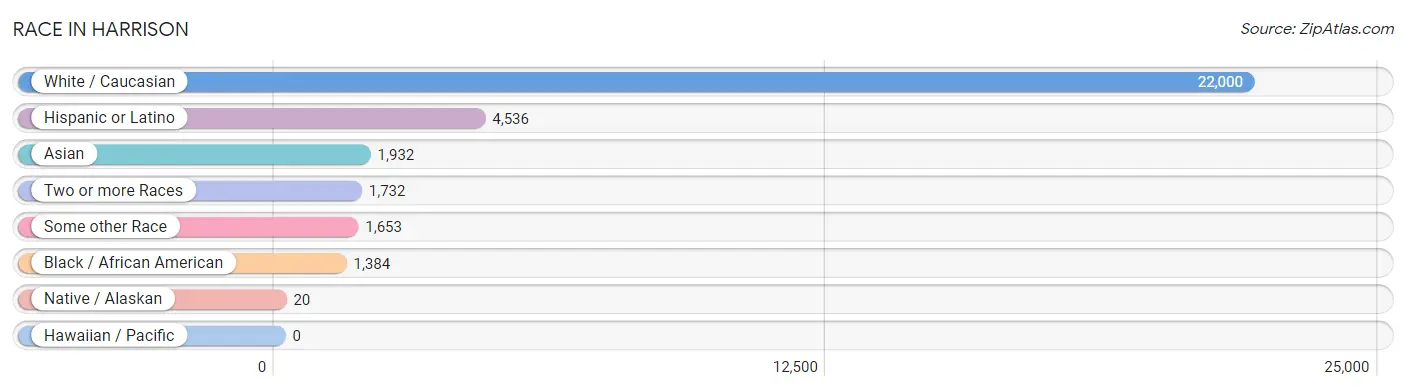
Race in Harrison
The most populous races in Harrison are White / Caucasian (22,000 | 76.6%), Hispanic or Latino (4,536 | 15.8%), and Asian (1,932 | 6.7%).
| Race | # Population | % Population |
| Asian | 1,932 | 6.7% |
| Black / African American | 1,384 | 4.8% |
| Hawaiian / Pacific | 0 | 0.0% |
| Hispanic or Latino | 4,536 | 15.8% |
| Native / Alaskan | 20 | 0.1% |
| White / Caucasian | 22,000 | 76.6% |
| Two or more Races | 1,732 | 6.0% |
| Some other Race | 1,653 | 5.8% |
| Total | 28,721 | 100.0% |
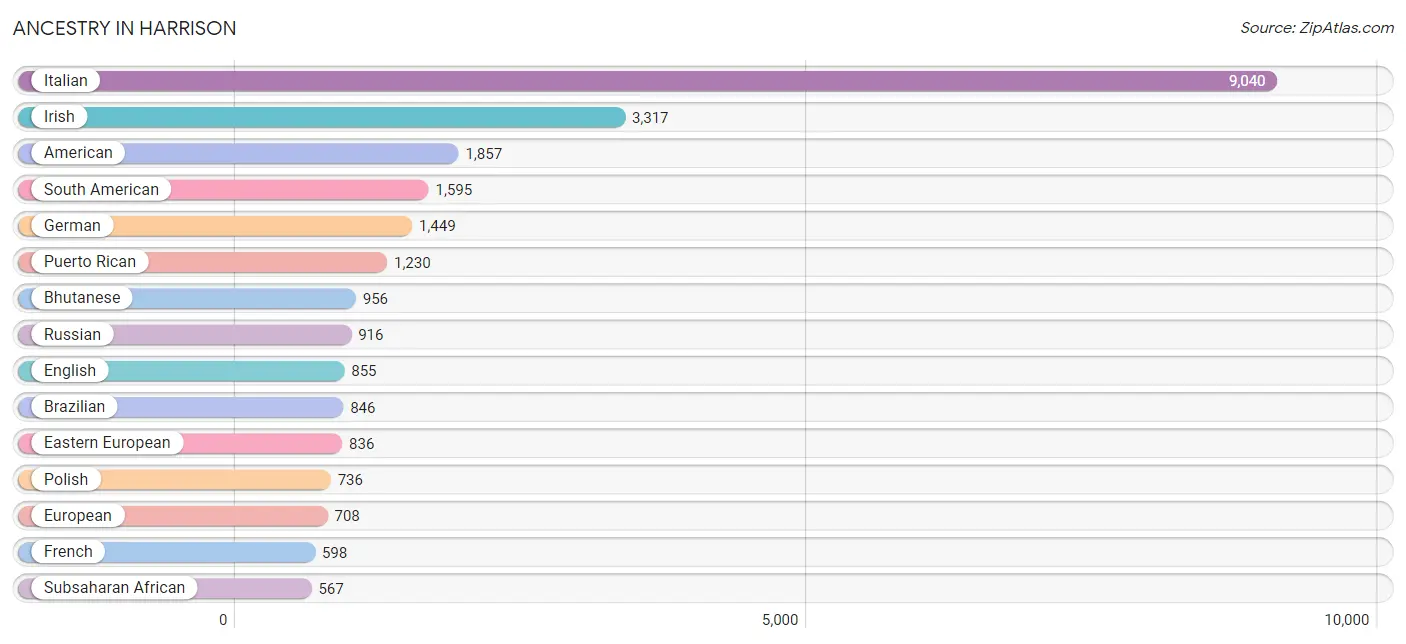
Ancestry in Harrison
The most populous ancestries reported in Harrison are Italian (9,040 | 31.5%), Irish (3,317 | 11.6%), American (1,857 | 6.5%), South American (1,595 | 5.6%), and German (1,449 | 5.1%), together accounting for 60.1% of all Harrison residents.
| Ancestry | # Population | % Population |
| African | 5 | 0.0% |
| Albanian | 106 | 0.4% |
| American | 1,857 | 6.5% |
| Arab | 302 | 1.1% |
| Argentinean | 336 | 1.2% |
| Armenian | 25 | 0.1% |
| Australian | 19 | 0.1% |
| Austrian | 67 | 0.2% |
| Barbadian | 10 | 0.0% |
| Basque | 9 | 0.0% |
| Belizean | 8 | 0.0% |
| Bhutanese | 956 | 3.3% |
| Bolivian | 103 | 0.4% |
| Brazilian | 846 | 2.9% |
| British | 102 | 0.4% |
| British West Indian | 59 | 0.2% |
| Burmese | 54 | 0.2% |
| Canadian | 89 | 0.3% |
| Celtic | 2 | 0.0% |
| Central American | 306 | 1.1% |
| Central American Indian | 32 | 0.1% |
| Cherokee | 8 | 0.0% |
| Chilean | 117 | 0.4% |
| Colombian | 329 | 1.1% |
| Croatian | 4 | 0.0% |
| Cuban | 100 | 0.4% |
| Czech | 56 | 0.2% |
| Czechoslovakian | 13 | 0.1% |
| Danish | 11 | 0.0% |
| Dominican | 293 | 1.0% |
| Dutch | 60 | 0.2% |
| Eastern European | 836 | 2.9% |
| Ecuadorian | 483 | 1.7% |
| Egyptian | 15 | 0.1% |
| English | 855 | 3.0% |
| Ethiopian | 235 | 0.8% |
| European | 708 | 2.5% |
| Finnish | 6 | 0.0% |
| French | 598 | 2.1% |
| French Canadian | 184 | 0.6% |
| German | 1,449 | 5.1% |
| Ghanaian | 8 | 0.0% |
| Greek | 381 | 1.3% |
| Guatemalan | 248 | 0.9% |
| Guyanese | 71 | 0.3% |
| Haitian | 69 | 0.2% |
| Hungarian | 168 | 0.6% |
| Icelander | 12 | 0.0% |
| Indian (Asian) | 438 | 1.5% |
| Iranian | 175 | 0.6% |
| Iraqi | 11 | 0.0% |
| Irish | 3,317 | 11.6% |
| Israeli | 144 | 0.5% |
| Italian | 9,040 | 31.5% |
| Jamaican | 187 | 0.6% |
| Jordanian | 88 | 0.3% |
| Kenyan | 15 | 0.1% |
| Korean | 190 | 0.7% |
| Latvian | 9 | 0.0% |
| Lebanese | 169 | 0.6% |
| Lithuanian | 82 | 0.3% |
| Macedonian | 7 | 0.0% |
| Maltese | 4 | 0.0% |
| Mexican | 460 | 1.6% |
| Moroccan | 10 | 0.0% |
| New Zealander | 4 | 0.0% |
| Nigerian | 232 | 0.8% |
| Northern European | 19 | 0.1% |
| Norwegian | 68 | 0.2% |
| Pakistani | 8 | 0.0% |
| Palestinian | 6 | 0.0% |
| Panamanian | 33 | 0.1% |
| Paraguayan | 18 | 0.1% |
| Peruvian | 170 | 0.6% |
| Polish | 736 | 2.6% |
| Portuguese | 177 | 0.6% |
| Puerto Rican | 1,230 | 4.3% |
| Romanian | 23 | 0.1% |
| Russian | 916 | 3.2% |
| Salvadoran | 25 | 0.1% |
| Scandinavian | 36 | 0.1% |
| Scotch-Irish | 50 | 0.2% |
| Scottish | 190 | 0.7% |
| Seminole | 5 | 0.0% |
| Serbian | 12 | 0.0% |
| Slovak | 30 | 0.1% |
| Slovene | 10 | 0.0% |
| South African | 64 | 0.2% |
| South American | 1,595 | 5.6% |
| Spaniard | 160 | 0.6% |
| Spanish | 49 | 0.2% |
| Subsaharan African | 567 | 2.0% |
| Swedish | 125 | 0.4% |
| Swiss | 66 | 0.2% |
| Thai | 231 | 0.8% |
| Trinidadian and Tobagonian | 37 | 0.1% |
| Turkish | 110 | 0.4% |
| Ukrainian | 83 | 0.3% |
| Venezuelan | 39 | 0.1% |
| West Indian | 1 | 0.0% |
| Yugoslavian | 17 | 0.1% | View All 101 Rows |
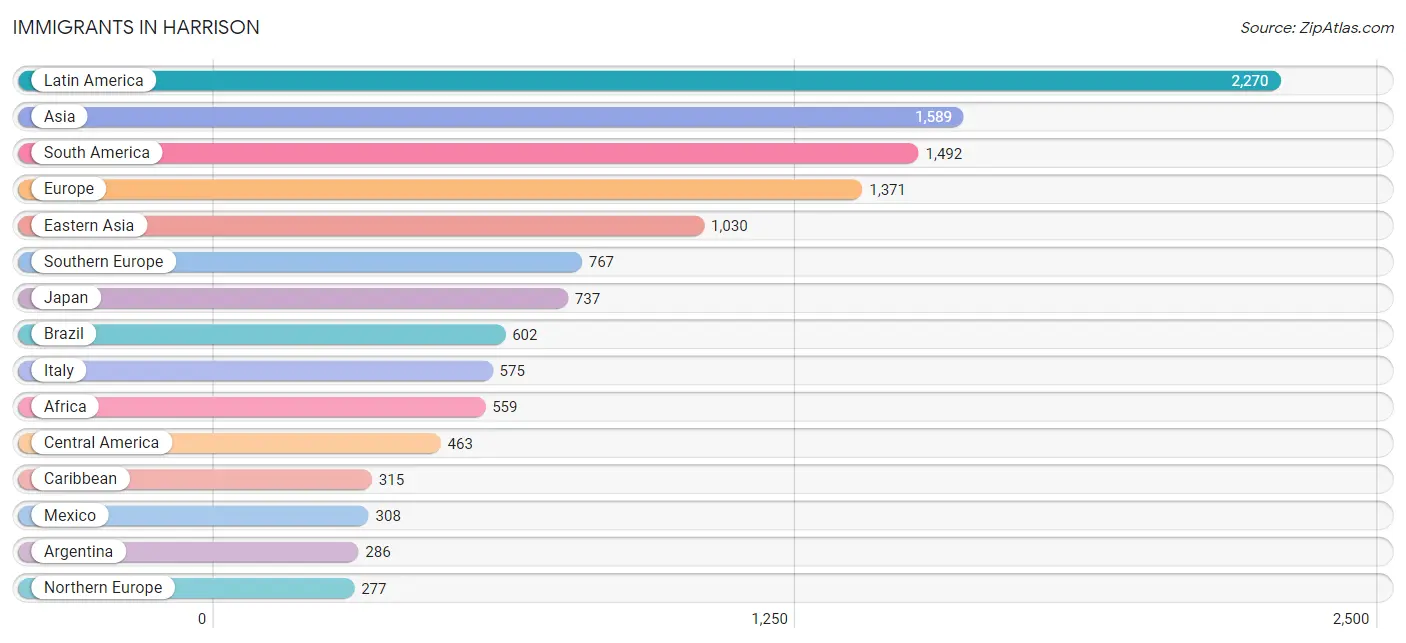
Immigrants in Harrison
The most numerous immigrant groups reported in Harrison came from Latin America (2,270 | 7.9%), Asia (1,589 | 5.5%), South America (1,492 | 5.2%), Europe (1,371 | 4.8%), and Eastern Asia (1,030 | 3.6%), together accounting for 27.0% of all Harrison residents.
| Immigration Origin | # Population | % Population |
| Africa | 559 | 1.9% |
| Albania | 11 | 0.0% |
| Argentina | 286 | 1.0% |
| Asia | 1,589 | 5.5% |
| Australia | 28 | 0.1% |
| Bolivia | 27 | 0.1% |
| Bosnia and Herzegovina | 10 | 0.0% |
| Brazil | 602 | 2.1% |
| Canada | 193 | 0.7% |
| Caribbean | 315 | 1.1% |
| Central America | 463 | 1.6% |
| China | 264 | 0.9% |
| Colombia | 197 | 0.7% |
| Cuba | 27 | 0.1% |
| Denmark | 16 | 0.1% |
| Dominica | 11 | 0.0% |
| Dominican Republic | 142 | 0.5% |
| Eastern Africa | 231 | 0.8% |
| Eastern Asia | 1,030 | 3.6% |
| Eastern Europe | 141 | 0.5% |
| Ecuador | 221 | 0.8% |
| Egypt | 15 | 0.1% |
| England | 35 | 0.1% |
| Ethiopia | 221 | 0.8% |
| Europe | 1,371 | 4.8% |
| France | 157 | 0.5% |
| Germany | 18 | 0.1% |
| Ghana | 6 | 0.0% |
| Greece | 56 | 0.2% |
| Guatemala | 140 | 0.5% |
| Guyana | 54 | 0.2% |
| Haiti | 7 | 0.0% |
| Hong Kong | 6 | 0.0% |
| Hungary | 18 | 0.1% |
| India | 62 | 0.2% |
| Iran | 84 | 0.3% |
| Ireland | 78 | 0.3% |
| Israel | 95 | 0.3% |
| Italy | 575 | 2.0% |
| Jamaica | 69 | 0.2% |
| Japan | 737 | 2.6% |
| Jordan | 24 | 0.1% |
| Kenya | 10 | 0.0% |
| Korea | 29 | 0.1% |
| Latin America | 2,270 | 7.9% |
| Lebanon | 24 | 0.1% |
| Mexico | 308 | 1.1% |
| Middle Africa | 5 | 0.0% |
| Nepal | 93 | 0.3% |
| Netherlands | 11 | 0.0% |
| Nigeria | 232 | 0.8% |
| Northern Africa | 15 | 0.1% |
| Northern Europe | 277 | 1.0% |
| Norway | 26 | 0.1% |
| Oceania | 28 | 0.1% |
| Pakistan | 8 | 0.0% |
| Panama | 15 | 0.1% |
| Peru | 53 | 0.2% |
| Philippines | 142 | 0.5% |
| Poland | 10 | 0.0% |
| Portugal | 44 | 0.2% |
| Russia | 27 | 0.1% |
| Scotland | 13 | 0.1% |
| Serbia | 5 | 0.0% |
| South Africa | 70 | 0.2% |
| South America | 1,492 | 5.2% |
| South Central Asia | 247 | 0.9% |
| South Eastern Asia | 152 | 0.5% |
| Southern Europe | 767 | 2.7% |
| Spain | 92 | 0.3% |
| Taiwan | 33 | 0.1% |
| Thailand | 10 | 0.0% |
| Turkey | 12 | 0.0% |
| Ukraine | 7 | 0.0% |
| Uruguay | 24 | 0.1% |
| Venezuela | 10 | 0.0% |
| Western Africa | 238 | 0.8% |
| Western Asia | 160 | 0.6% |
| Western Europe | 186 | 0.6% | View All 79 Rows |
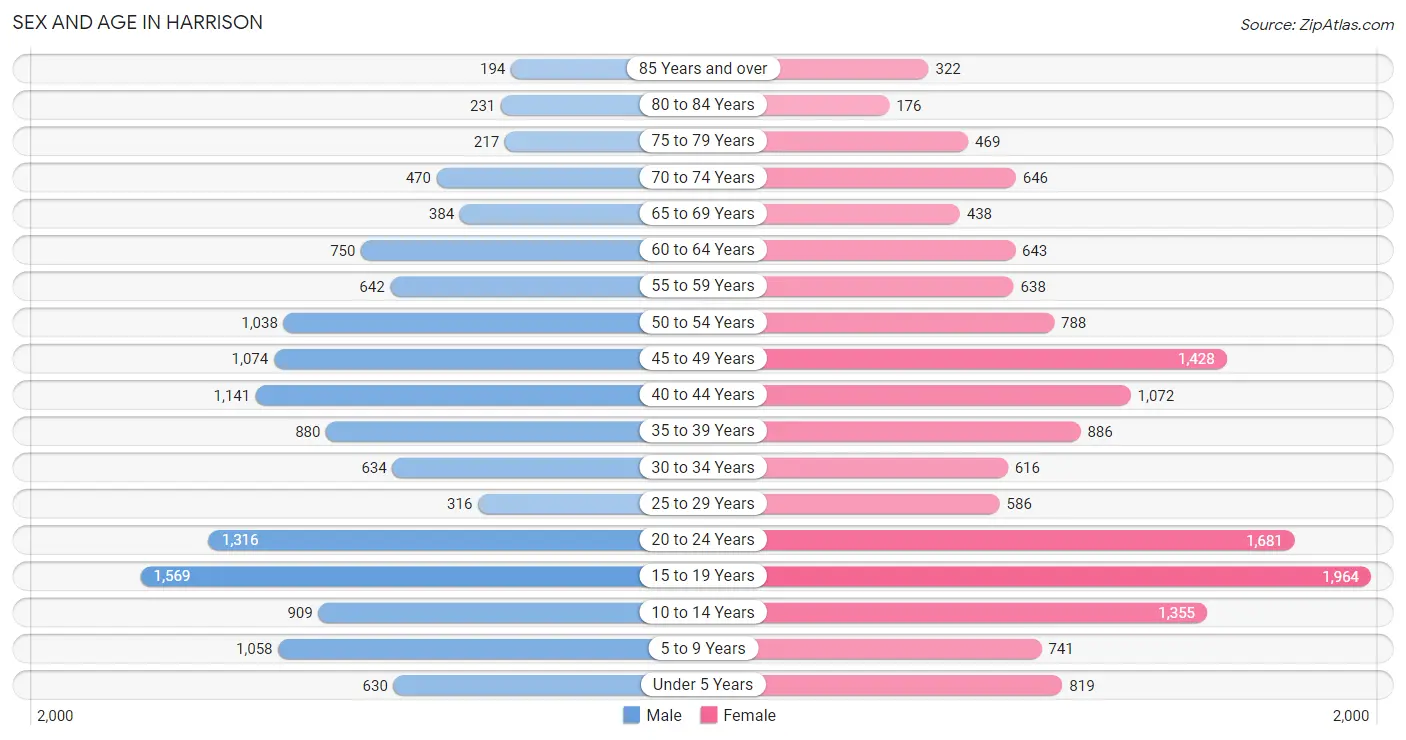
Sex and Age in Harrison
Sex and Age in Harrison
The most populous age groups in Harrison are 15 to 19 Years (1,569 | 11.7%) for men and 15 to 19 Years (1,964 | 12.9%) for women.
| Age Bracket | Male | Female |
| Under 5 Years | 630 (4.7%) | 819 (5.4%) |
| 5 to 9 Years | 1,058 (7.9%) | 741 (4.9%) |
| 10 to 14 Years | 909 (6.8%) | 1,355 (8.9%) |
| 15 to 19 Years | 1,569 (11.7%) | 1,964 (12.9%) |
| 20 to 24 Years | 1,316 (9.8%) | 1,681 (11.0%) |
| 25 to 29 Years | 316 (2.4%) | 586 (3.8%) |
| 30 to 34 Years | 634 (4.7%) | 616 (4.0%) |
| 35 to 39 Years | 880 (6.5%) | 886 (5.8%) |
| 40 to 44 Years | 1,141 (8.5%) | 1,072 (7.0%) |
| 45 to 49 Years | 1,074 (8.0%) | 1,428 (9.3%) |
| 50 to 54 Years | 1,038 (7.7%) | 788 (5.2%) |
| 55 to 59 Years | 642 (4.8%) | 638 (4.2%) |
| 60 to 64 Years | 750 (5.6%) | 643 (4.2%) |
| 65 to 69 Years | 384 (2.9%) | 438 (2.9%) |
| 70 to 74 Years | 470 (3.5%) | 646 (4.2%) |
| 75 to 79 Years | 217 (1.6%) | 469 (3.1%) |
| 80 to 84 Years | 231 (1.7%) | 176 (1.1%) |
| 85 Years and over | 194 (1.4%) | 322 (2.1%) |
| Total | 13,453 (100.0%) | 15,268 (100.0%) |
Families and Households in Harrison
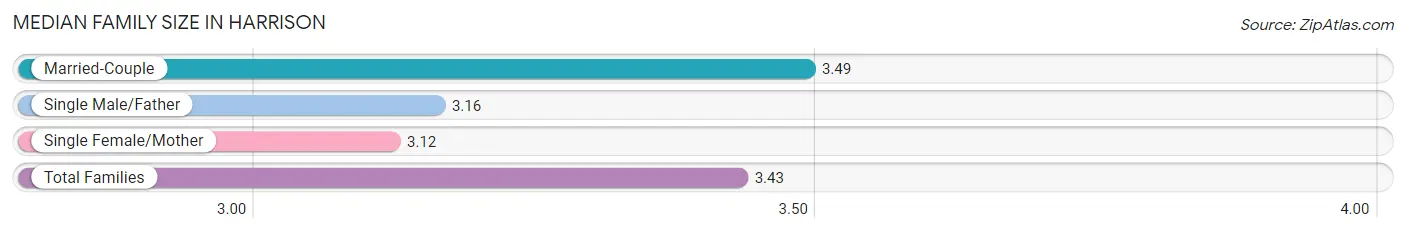
Median Family Size in Harrison
The median family size in Harrison is 3.43 persons per family, with married-couple families (5,275 | 81.7%) accounting for the largest median family size of 3.49 persons per family. On the other hand, single female/mother families (766 | 11.9%) represent the smallest median family size with 3.12 persons per family.
| Family Type | # Families | Family Size |
| Married-Couple | 5,275 (81.7%) | 3.49 |
| Single Male/Father | 416 (6.4%) | 3.16 |
| Single Female/Mother | 766 (11.9%) | 3.12 |
| Total Families | 6,457 (100.0%) | 3.43 |
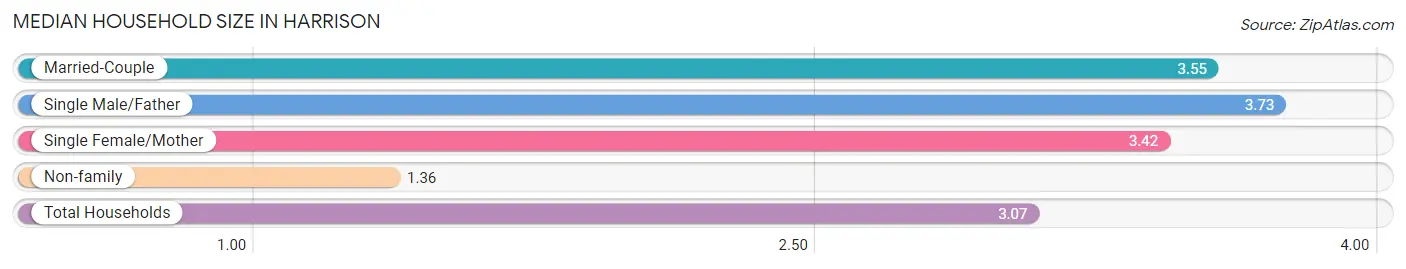
Median Household Size in Harrison
The median household size in Harrison is 3.07 persons per household, with single male/father households (416 | 5.1%) accounting for the largest median household size of 3.73 persons per household. non-family households (1,785 | 21.7%) represent the smallest median household size with 1.36 persons per household.
| Household Type | # Households | Household Size |
| Married-Couple | 5,275 (64.0%) | 3.55 |
| Single Male/Father | 416 (5.1%) | 3.73 |
| Single Female/Mother | 766 (9.3%) | 3.42 |
| Non-family | 1,785 (21.7%) | 1.36 |
| Total Households | 8,242 (100.0%) | 3.07 |
Household Size by Marriage Status in Harrison
Out of a total of 8,242 households in Harrison, 6,457 (78.3%) are family households, while 1,785 (21.7%) are nonfamily households. The most numerous type of family households are 4-person households, comprising 2,040, and the most common type of nonfamily households are 1-person households, comprising 1,363.
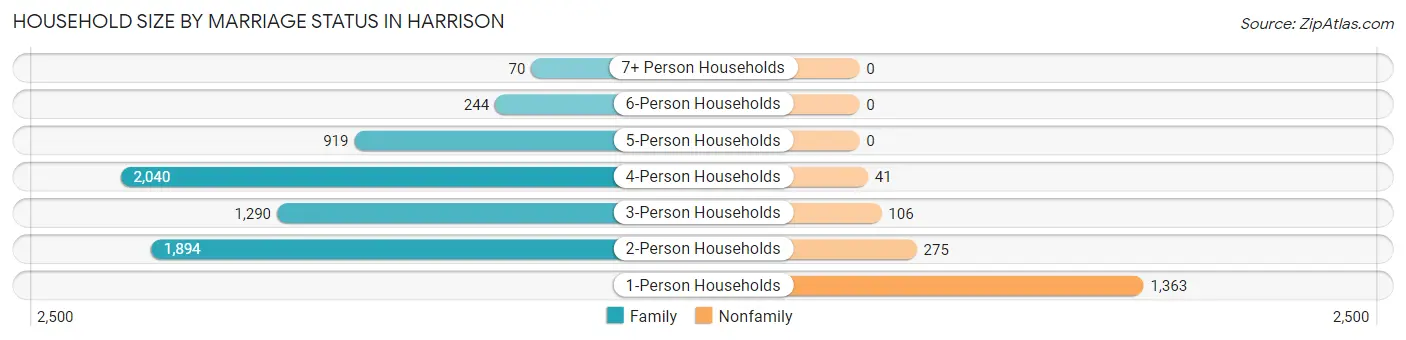
| Household Size | Family Households | Nonfamily Households |
| 1-Person Households | - | 1,363 (16.5%) |
| 2-Person Households | 1,894 (23.0%) | 275 (3.3%) |
| 3-Person Households | 1,290 (15.7%) | 106 (1.3%) |
| 4-Person Households | 2,040 (24.7%) | 41 (0.5%) |
| 5-Person Households | 919 (11.2%) | 0 (0.0%) |
| 6-Person Households | 244 (3.0%) | 0 (0.0%) |
| 7+ Person Households | 70 (0.9%) | 0 (0.0%) |
| Total | 6,457 (78.3%) | 1,785 (21.7%) |
Female Fertility in Harrison
Fertility by Age in Harrison
Average fertility rate in Harrison is 23.0 births per 1,000 women. Women in the age bracket of 20 to 34 years have the highest fertility rate with 35.0 births per 1,000 women. Women in the age bracket of 20 to 34 years acount for 51.0% of all women with births.
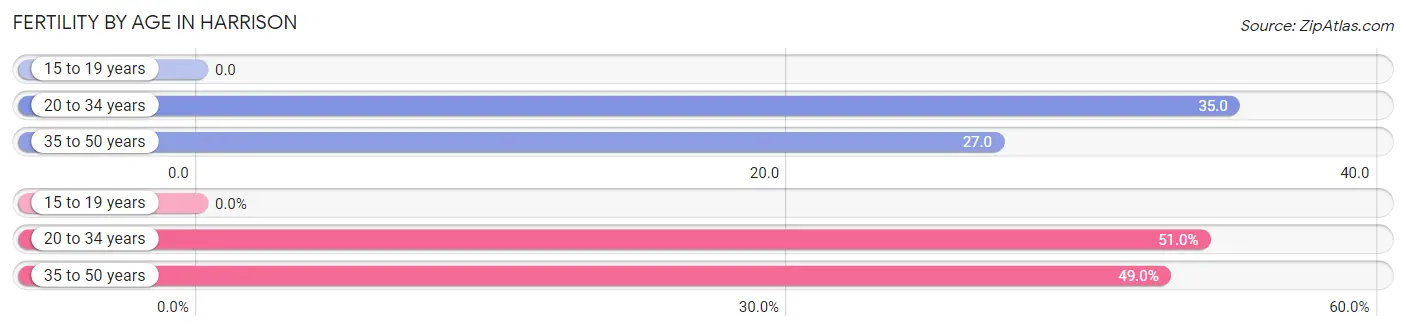
| Age Bracket | Women with Births | Births / 1,000 Women |
| 15 to 19 years | 0 (0.0%) | 0.0 |
| 20 to 34 years | 101 (51.0%) | 35.0 |
| 35 to 50 years | 97 (49.0%) | 27.0 |
| Total | 198 (100.0%) | 23.0 |
Fertility by Age by Marriage Status in Harrison
87.4% of women with births (198) in Harrison are married. The highest percentage of unmarried women with births falls into 20 to 34 years age bracket with 12.9% of them unmarried at the time of birth, while the lowest percentage of unmarried women with births belong to 35 to 50 years age bracket with 12.4% of them unmarried.
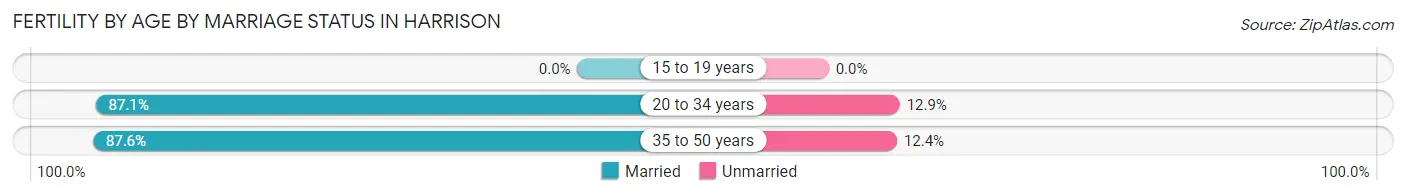
| Age Bracket | Married | Unmarried |
| 15 to 19 years | 0 (0.0%) | 0 (0.0%) |
| 20 to 34 years | 88 (87.1%) | 13 (12.9%) |
| 35 to 50 years | 85 (87.6%) | 12 (12.4%) |
| Total | 173 (87.4%) | 25 (12.6%) |
Fertility by Education in Harrison
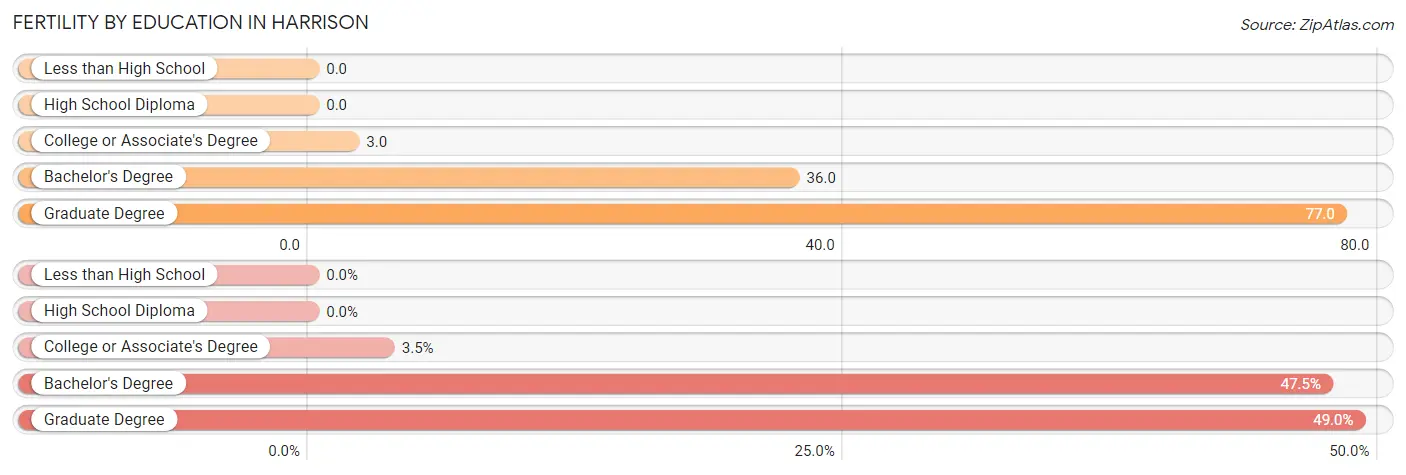
| Educational Attainment | Women with Births | Births / 1,000 Women |
| Less than High School | 0 (0.0%) | 0.0 |
| High School Diploma | 0 (0.0%) | 0.0 |
| College or Associate's Degree | 7 (3.5%) | 3.0 |
| Bachelor's Degree | 94 (47.5%) | 36.0 |
| Graduate Degree | 97 (49.0%) | 77.0 |
| Total | 198 (100.0%) | 23.0 |
Fertility by Education by Marriage Status in Harrison
12.6% of women with births in Harrison are unmarried. Women with the educational attainment of college or associate's degree are most likely to be married with 100.0% of them married at childbirth, while women with the educational attainment of bachelor's degree are least likely to be married with 13.8% of them unmarried at childbirth.
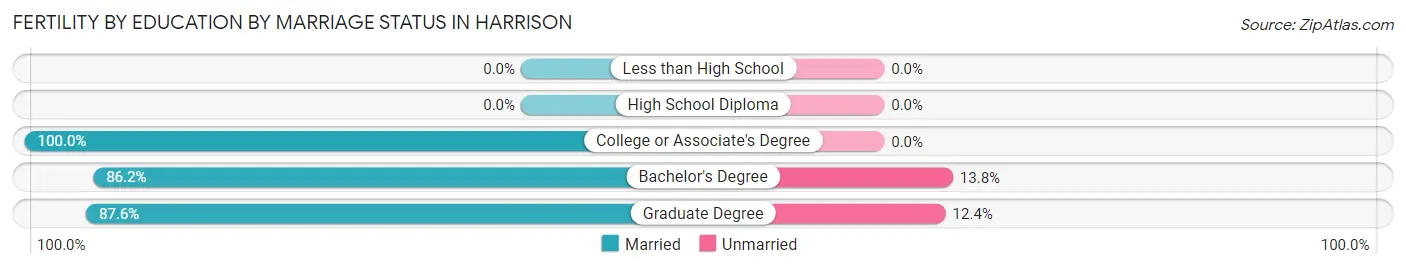
| Educational Attainment | Married | Unmarried |
| Less than High School | 0 (0.0%) | 0 (0.0%) |
| High School Diploma | 0 (0.0%) | 0 (0.0%) |
| College or Associate's Degree | 7 (100.0%) | 0 (0.0%) |
| Bachelor's Degree | 81 (86.2%) | 13 (13.8%) |
| Graduate Degree | 85 (87.6%) | 12 (12.4%) |
| Total | 173 (87.4%) | 25 (12.6%) |
Employment Characteristics in Harrison
Employment by Class of Employer in Harrison
Among the 13,297 employed individuals in Harrison, private company employees (8,866 | 66.7%), not-for-profit organizations (1,300 | 9.8%), and local government employees (1,228 | 9.2%) make up the most common classes of employment.
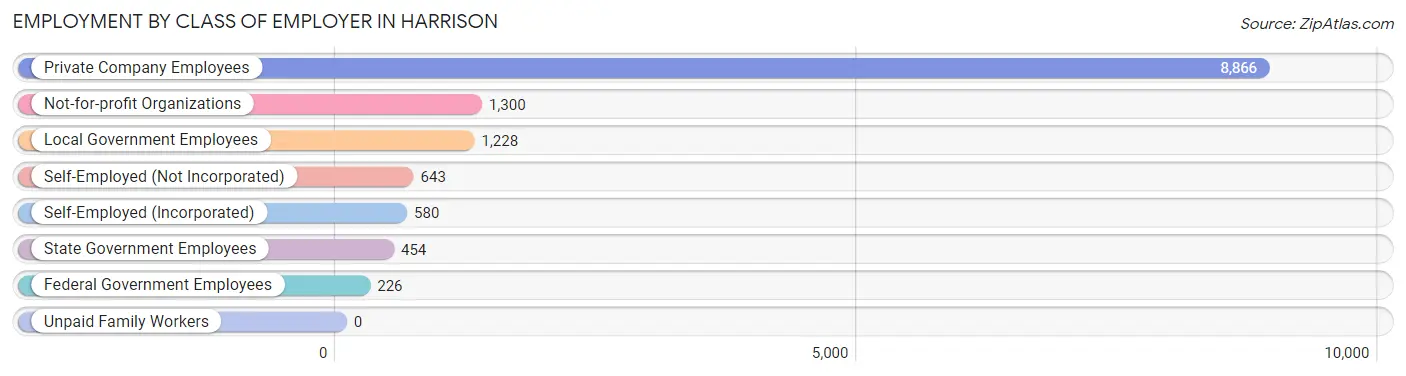
| Employer Class | # Employees | % Employees |
| Private Company Employees | 8,866 | 66.7% |
| Self-Employed (Incorporated) | 580 | 4.4% |
| Self-Employed (Not Incorporated) | 643 | 4.8% |
| Not-for-profit Organizations | 1,300 | 9.8% |
| Local Government Employees | 1,228 | 9.2% |
| State Government Employees | 454 | 3.4% |
| Federal Government Employees | 226 | 1.7% |
| Unpaid Family Workers | 0 | 0.0% |
| Total | 13,297 | 100.0% |
Employment Status by Age in Harrison
According to the labor force statistics for Harrison, out of the total population over 16 years of age (22,998), 62.7% or 14,420 individuals are in the labor force, with 5.3% or 764 of them unemployed. The age group with the highest labor force participation rate is 30 to 34 years, with 89.0% or 1,112 individuals in the labor force. Within the labor force, the 16 to 19 years age range has the highest percentage of unemployed individuals, with 11.3% or 129 of them being unemployed.
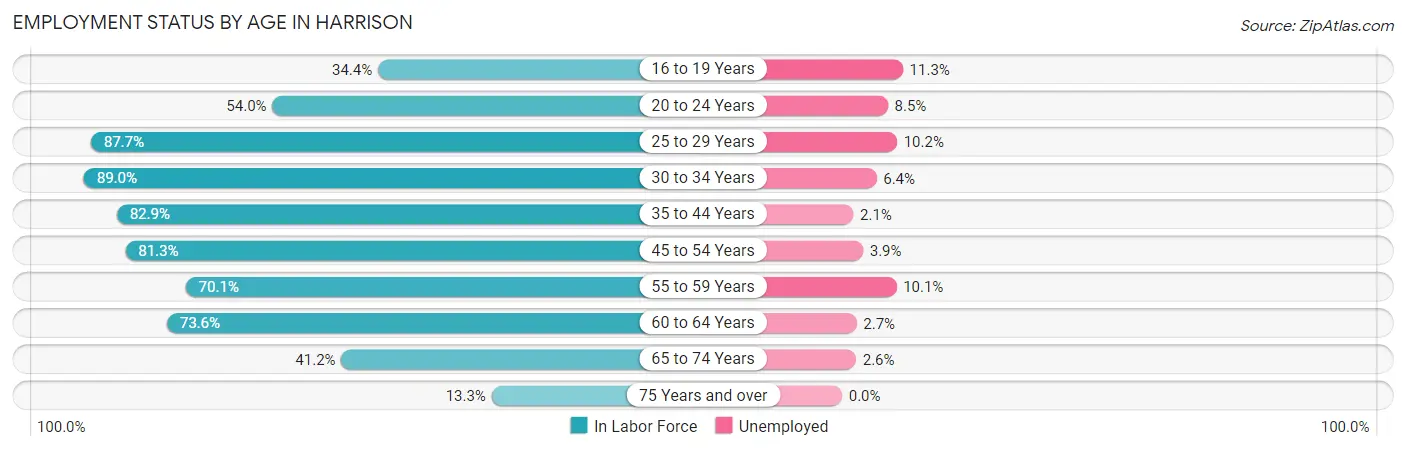
| Age Bracket | In Labor Force | Unemployed |
| 16 to 19 Years | 1,143 (34.4%) | 129 (11.3%) |
| 20 to 24 Years | 1,618 (54.0%) | 138 (8.5%) |
| 25 to 29 Years | 791 (87.7%) | 81 (10.2%) |
| 30 to 34 Years | 1,112 (89.0%) | 71 (6.4%) |
| 35 to 44 Years | 3,299 (82.9%) | 69 (2.1%) |
| 45 to 54 Years | 3,519 (81.3%) | 137 (3.9%) |
| 55 to 59 Years | 897 (70.1%) | 91 (10.1%) |
| 60 to 64 Years | 1,025 (73.6%) | 28 (2.7%) |
| 65 to 74 Years | 798 (41.2%) | 21 (2.6%) |
| 75 Years and over | 214 (13.3%) | 0 (0.0%) |
| Total | 14,420 (62.7%) | 764 (5.3%) |
Employment Status by Educational Attainment in Harrison
According to labor force statistics for Harrison, 81.1% of individuals (10,650) out of the total population between 25 and 64 years of age (13,132) are in the labor force, with 4.5% or 479 of them being unemployed. The group with the highest labor force participation rate are those with the educational attainment of college / associate degree, with 83.8% or 2,067 individuals in the labor force. Within the labor force, individuals with less than high school education have the highest percentage of unemployment, with 11.7% or 52 of them being unemployed.
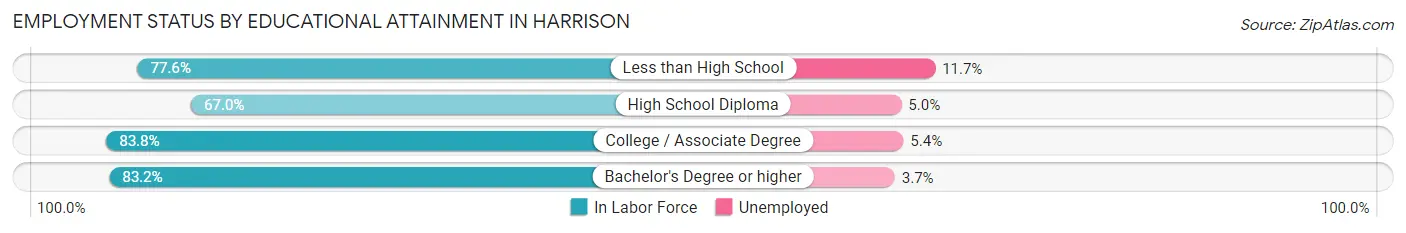
| Educational Attainment | In Labor Force | Unemployed |
| Less than High School | 446 (77.6%) | 67 (11.7%) |
| High School Diploma | 1,084 (67.0%) | 81 (5.0%) |
| College / Associate Degree | 2,067 (83.8%) | 133 (5.4%) |
| Bachelor's Degree or higher | 7,050 (83.2%) | 314 (3.7%) |
| Total | 10,650 (81.1%) | 591 (4.5%) |
Employment Occupations by Sex in Harrison
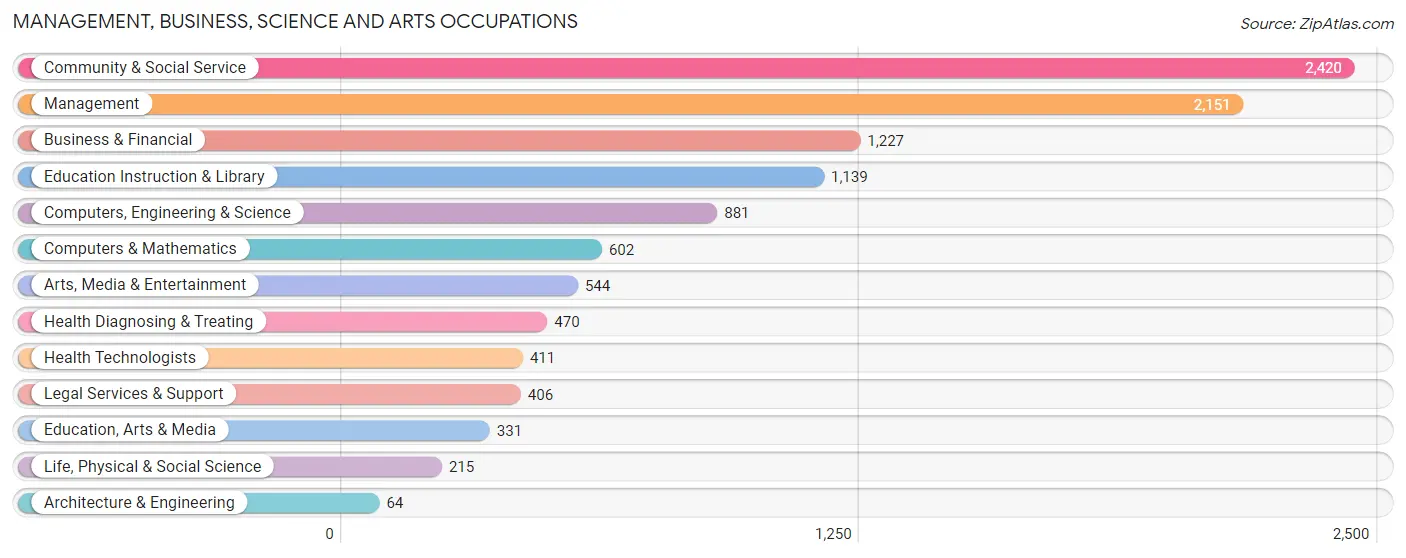
Management, Business, Science and Arts Occupations
The most common Management, Business, Science and Arts occupations in Harrison are Community & Social Service (2,420 | 17.7%), Management (2,151 | 15.8%), Business & Financial (1,227 | 9.0%), Education Instruction & Library (1,139 | 8.3%), and Computers, Engineering & Science (881 | 6.5%).
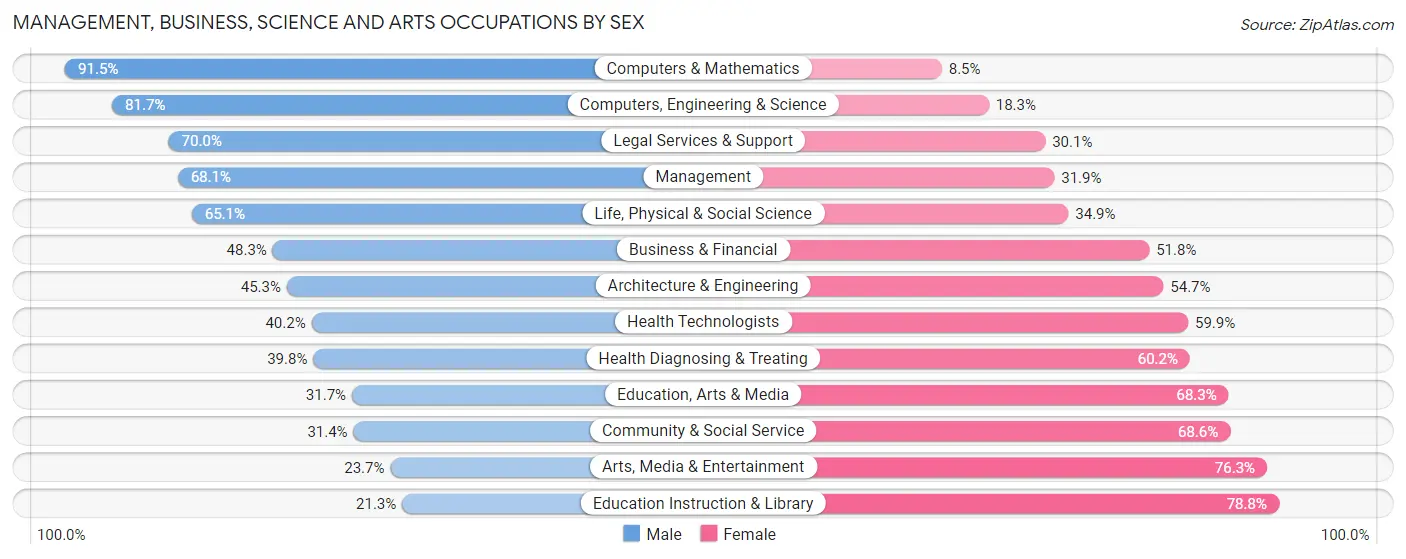
Management, Business, Science and Arts Occupations by Sex
Within the Management, Business, Science and Arts occupations in Harrison, the most male-oriented occupations are Computers & Mathematics (91.5%), Computers, Engineering & Science (81.7%), and Legal Services & Support (70.0%), while the most female-oriented occupations are Education Instruction & Library (78.7%), Arts, Media & Entertainment (76.3%), and Community & Social Service (68.6%).
| Occupation | Male | Female |
| Management | 1,464 (68.1%) | 687 (31.9%) |
| Business & Financial | 592 (48.2%) | 635 (51.7%) |
| Computers, Engineering & Science | 720 (81.7%) | 161 (18.3%) |
| Computers & Mathematics | 551 (91.5%) | 51 (8.5%) |
| Architecture & Engineering | 29 (45.3%) | 35 (54.7%) |
| Life, Physical & Social Science | 140 (65.1%) | 75 (34.9%) |
| Community & Social Service | 760 (31.4%) | 1,660 (68.6%) |
| Education, Arts & Media | 105 (31.7%) | 226 (68.3%) |
| Legal Services & Support | 284 (70.0%) | 122 (30.0%) |
| Education Instruction & Library | 242 (21.2%) | 897 (78.7%) |
| Arts, Media & Entertainment | 129 (23.7%) | 415 (76.3%) |
| Health Diagnosing & Treating | 187 (39.8%) | 283 (60.2%) |
| Health Technologists | 165 (40.2%) | 246 (59.9%) |
| Total (Category) | 3,723 (52.1%) | 3,426 (47.9%) |
| Total (Overall) | 7,216 (52.8%) | 6,437 (47.1%) |
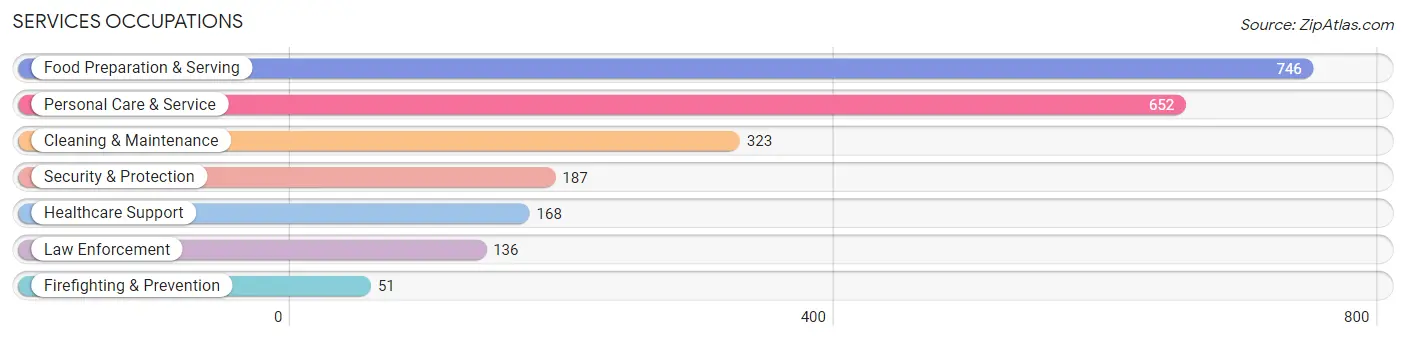
Services Occupations
The most common Services occupations in Harrison are Food Preparation & Serving (746 | 5.5%), Personal Care & Service (652 | 4.8%), Cleaning & Maintenance (323 | 2.4%), Security & Protection (187 | 1.4%), and Healthcare Support (168 | 1.2%).
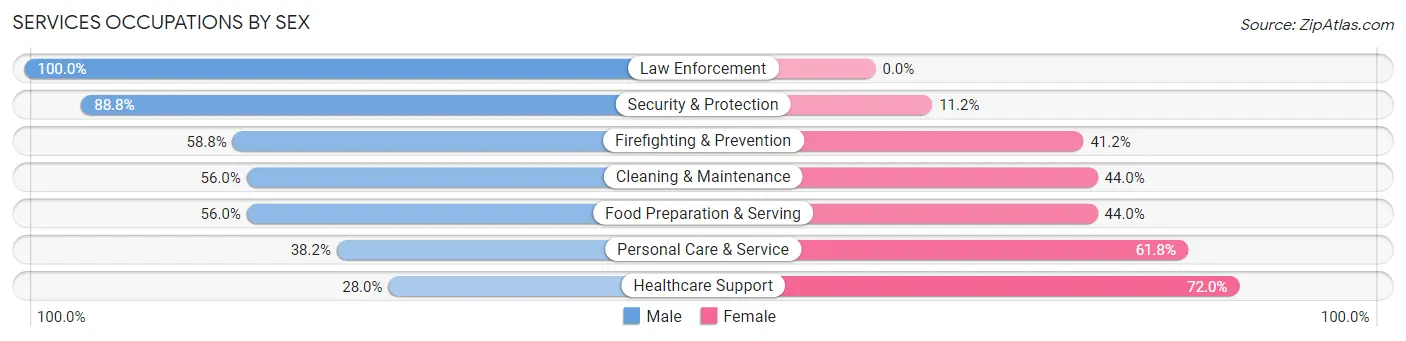
Services Occupations by Sex
Within the Services occupations in Harrison, the most male-oriented occupations are Law Enforcement (100.0%), Security & Protection (88.8%), and Firefighting & Prevention (58.8%), while the most female-oriented occupations are Healthcare Support (72.0%), Personal Care & Service (61.8%), and Food Preparation & Serving (44.0%).
| Occupation | Male | Female |
| Healthcare Support | 47 (28.0%) | 121 (72.0%) |
| Security & Protection | 166 (88.8%) | 21 (11.2%) |
| Firefighting & Prevention | 30 (58.8%) | 21 (41.2%) |
| Law Enforcement | 136 (100.0%) | 0 (0.0%) |
| Food Preparation & Serving | 418 (56.0%) | 328 (44.0%) |
| Cleaning & Maintenance | 181 (56.0%) | 142 (44.0%) |
| Personal Care & Service | 249 (38.2%) | 403 (61.8%) |
| Total (Category) | 1,061 (51.1%) | 1,015 (48.9%) |
| Total (Overall) | 7,216 (52.8%) | 6,437 (47.1%) |
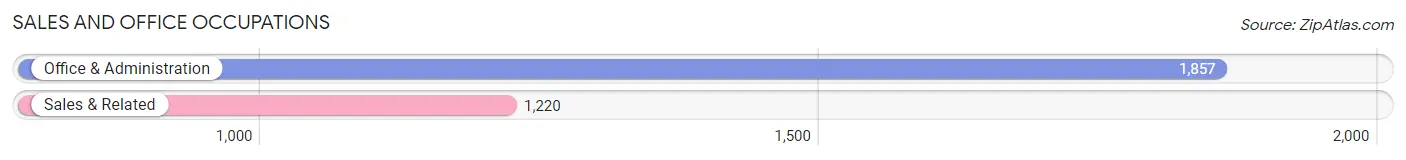
Sales and Office Occupations
The most common Sales and Office occupations in Harrison are Office & Administration (1,857 | 13.6%), and Sales & Related (1,220 | 8.9%).
Sales and Office Occupations by Sex
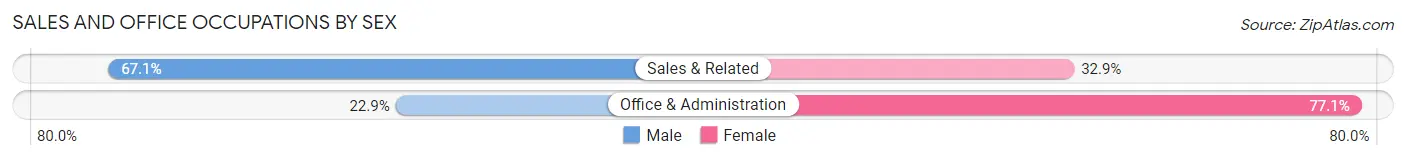
| Occupation | Male | Female |
| Sales & Related | 819 (67.1%) | 401 (32.9%) |
| Office & Administration | 426 (22.9%) | 1,431 (77.1%) |
| Total (Category) | 1,245 (40.5%) | 1,832 (59.5%) |
| Total (Overall) | 7,216 (52.8%) | 6,437 (47.1%) |
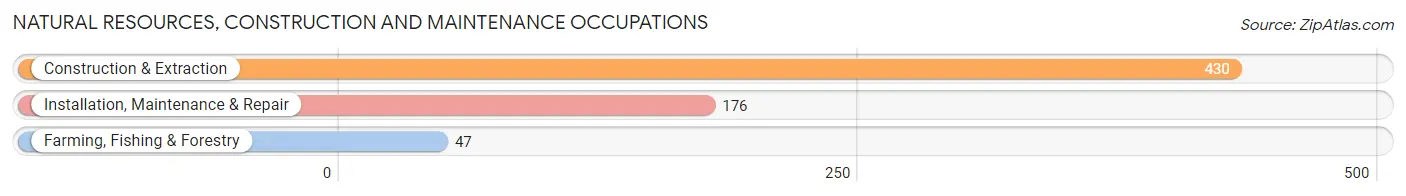
Natural Resources, Construction and Maintenance Occupations
The most common Natural Resources, Construction and Maintenance occupations in Harrison are Construction & Extraction (430 | 3.2%), Installation, Maintenance & Repair (176 | 1.3%), and Farming, Fishing & Forestry (47 | 0.3%).
Natural Resources, Construction and Maintenance Occupations by Sex
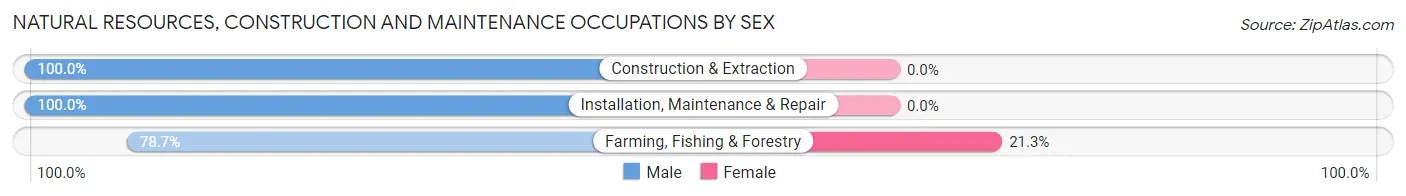
| Occupation | Male | Female |
| Farming, Fishing & Forestry | 37 (78.7%) | 10 (21.3%) |
| Construction & Extraction | 430 (100.0%) | 0 (0.0%) |
| Installation, Maintenance & Repair | 176 (100.0%) | 0 (0.0%) |
| Total (Category) | 643 (98.5%) | 10 (1.5%) |
| Total (Overall) | 7,216 (52.8%) | 6,437 (47.1%) |
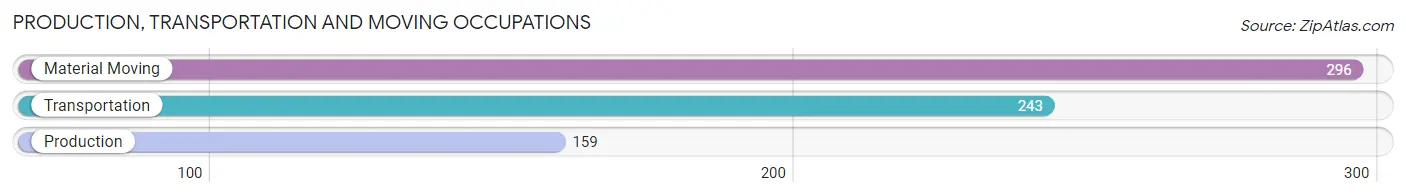
Production, Transportation and Moving Occupations
The most common Production, Transportation and Moving occupations in Harrison are Material Moving (296 | 2.2%), Transportation (243 | 1.8%), and Production (159 | 1.2%).
Production, Transportation and Moving Occupations by Sex
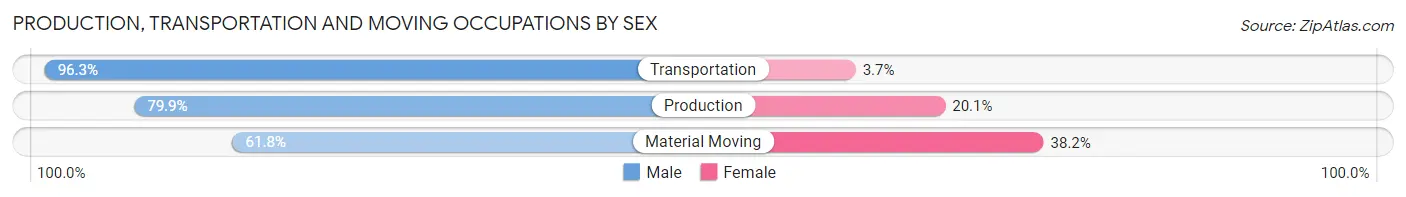
| Occupation | Male | Female |
| Production | 127 (79.9%) | 32 (20.1%) |
| Transportation | 234 (96.3%) | 9 (3.7%) |
| Material Moving | 183 (61.8%) | 113 (38.2%) |
| Total (Category) | 544 (77.9%) | 154 (22.1%) |
| Total (Overall) | 7,216 (52.8%) | 6,437 (47.1%) |
Employment Industries by Sex in Harrison
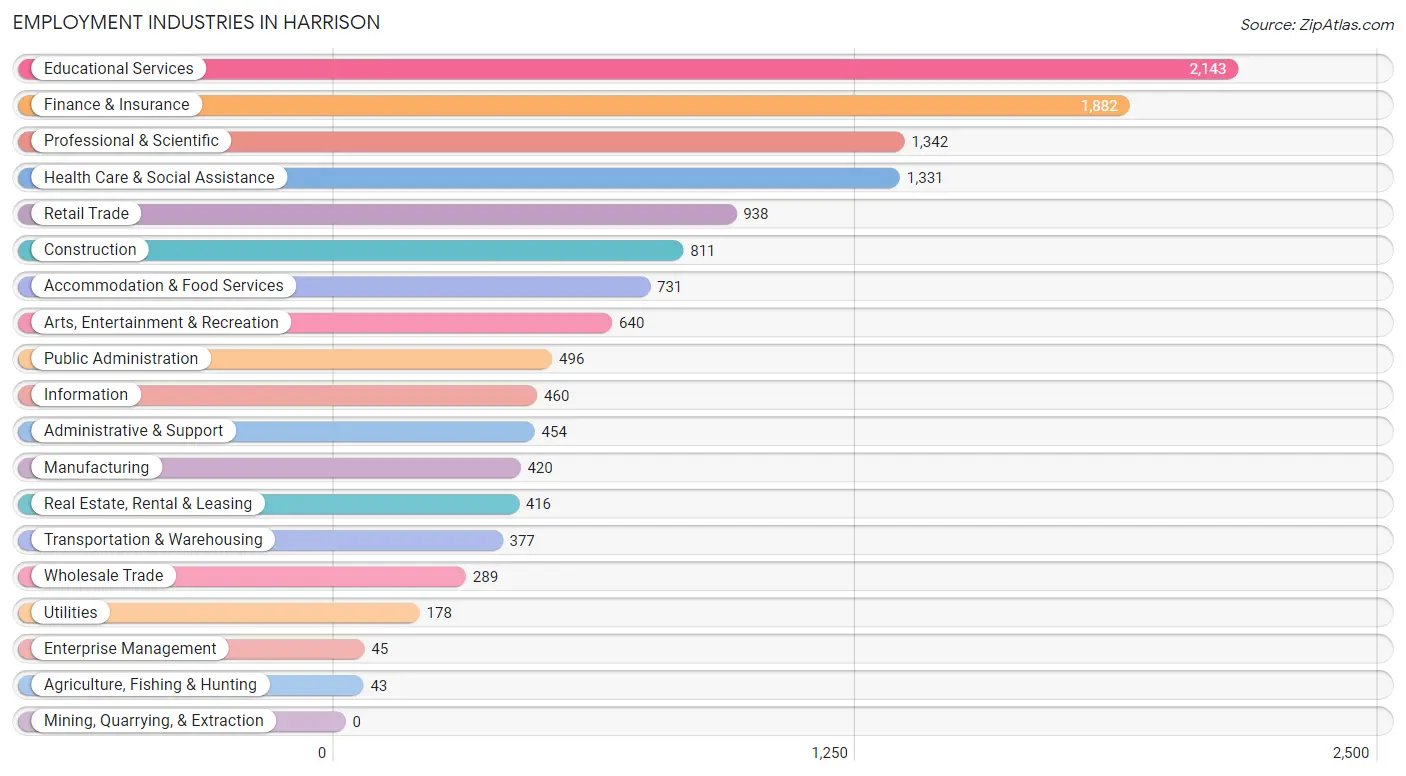
Employment Industries in Harrison
The major employment industries in Harrison include Educational Services (2,143 | 15.7%), Finance & Insurance (1,882 | 13.8%), Professional & Scientific (1,342 | 9.8%), Health Care & Social Assistance (1,331 | 9.8%), and Retail Trade (938 | 6.9%).
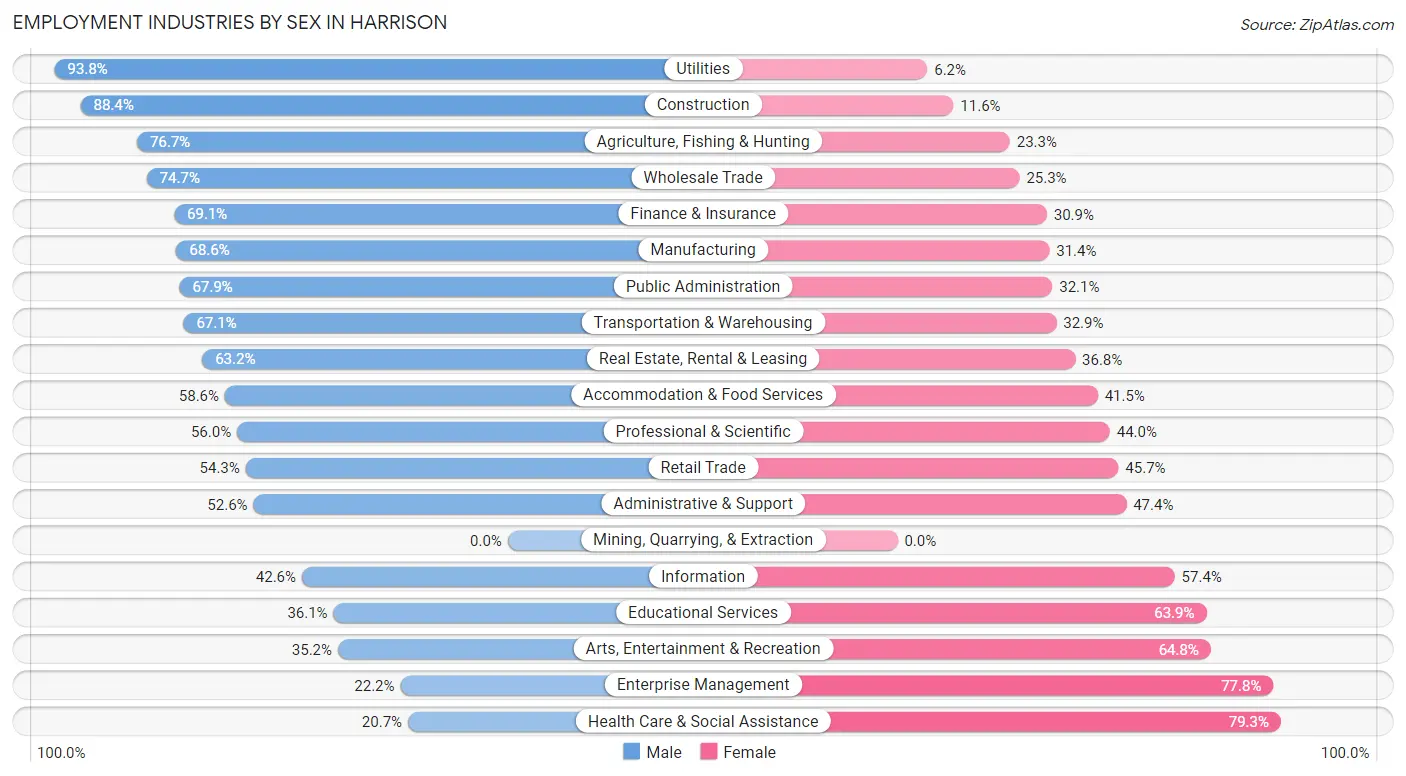
Employment Industries by Sex in Harrison
The Harrison industries that see more men than women are Utilities (93.8%), Construction (88.4%), and Agriculture, Fishing & Hunting (76.7%), whereas the industries that tend to have a higher number of women are Health Care & Social Assistance (79.3%), Enterprise Management (77.8%), and Arts, Entertainment & Recreation (64.8%).
| Industry | Male | Female |
| Agriculture, Fishing & Hunting | 33 (76.7%) | 10 (23.3%) |
| Mining, Quarrying, & Extraction | 0 (0.0%) | 0 (0.0%) |
| Construction | 717 (88.4%) | 94 (11.6%) |
| Manufacturing | 288 (68.6%) | 132 (31.4%) |
| Wholesale Trade | 216 (74.7%) | 73 (25.3%) |
| Retail Trade | 509 (54.3%) | 429 (45.7%) |
| Transportation & Warehousing | 253 (67.1%) | 124 (32.9%) |
| Utilities | 167 (93.8%) | 11 (6.2%) |
| Information | 196 (42.6%) | 264 (57.4%) |
| Finance & Insurance | 1,300 (69.1%) | 582 (30.9%) |
| Real Estate, Rental & Leasing | 263 (63.2%) | 153 (36.8%) |
| Professional & Scientific | 752 (56.0%) | 590 (44.0%) |
| Enterprise Management | 10 (22.2%) | 35 (77.8%) |
| Administrative & Support | 239 (52.6%) | 215 (47.4%) |
| Educational Services | 773 (36.1%) | 1,370 (63.9%) |
| Health Care & Social Assistance | 275 (20.7%) | 1,056 (79.3%) |
| Arts, Entertainment & Recreation | 225 (35.2%) | 415 (64.8%) |
| Accommodation & Food Services | 428 (58.6%) | 303 (41.4%) |
| Public Administration | 337 (67.9%) | 159 (32.1%) |
| Total | 7,216 (52.8%) | 6,437 (47.1%) |
Education in Harrison
School Enrollment in Harrison
The most common levels of schooling among the 10,801 students in Harrison are college / undergraduate (4,508 | 41.7%), elementary school (1,816 | 16.8%), and high school (1,782 | 16.5%).
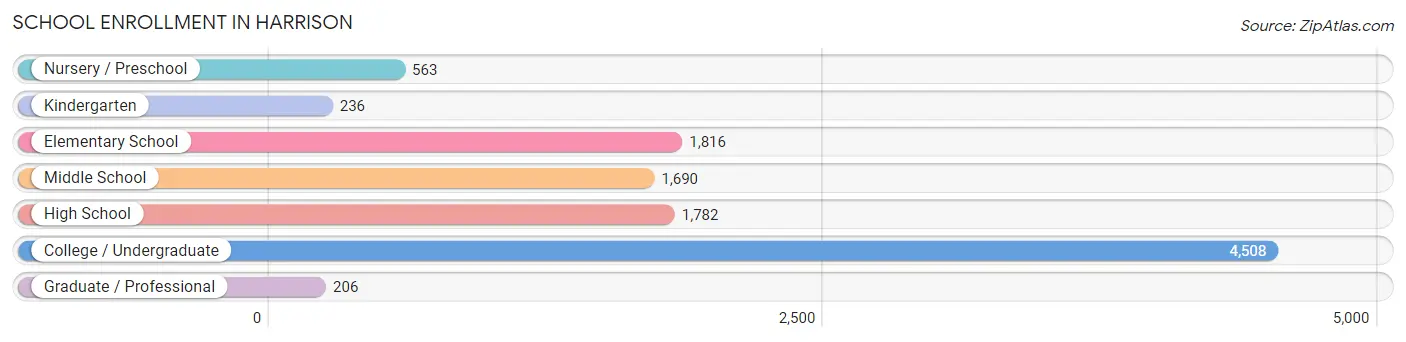
| School Level | # Students | % Students |
| Nursery / Preschool | 563 | 5.2% |
| Kindergarten | 236 | 2.2% |
| Elementary School | 1,816 | 16.8% |
| Middle School | 1,690 | 15.7% |
| High School | 1,782 | 16.5% |
| College / Undergraduate | 4,508 | 41.7% |
| Graduate / Professional | 206 | 1.9% |
| Total | 10,801 | 100.0% |
School Enrollment by Age by Funding Source in Harrison
Out of a total of 10,801 students who are enrolled in schools in Harrison, 4,709 (43.6%) attend a private institution, while the remaining 6,092 (56.4%) are enrolled in public schools. The age group of 35 years and over has the highest likelihood of being enrolled in private schools, with 277 (92.9% in the age bracket) enrolled. Conversely, the age group of 10 to 14 year olds has the lowest likelihood of being enrolled in a private school, with 1,792 (79.1% in the age bracket) attending a public institution.
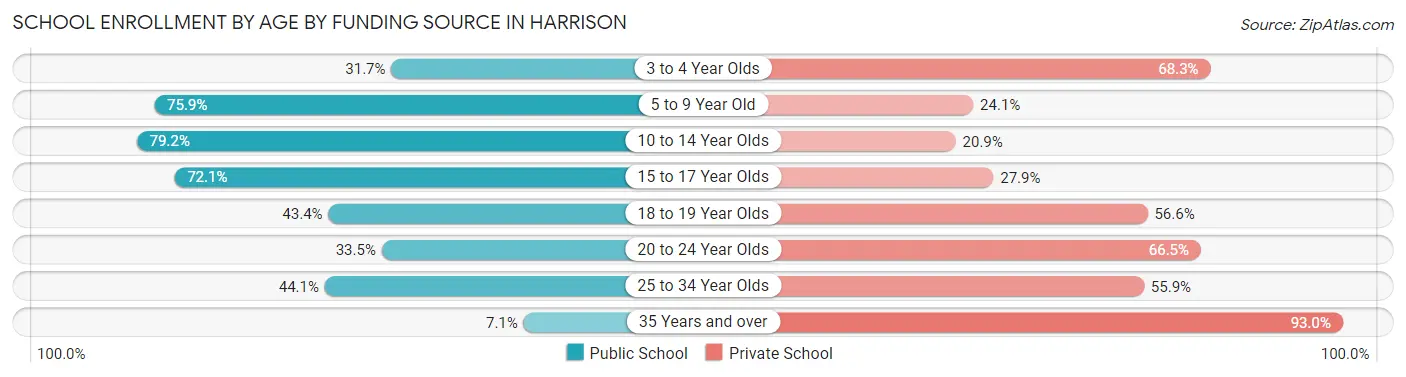
| Age Bracket | Public School | Private School |
| 3 to 4 Year Olds | 174 (31.7%) | 375 (68.3%) |
| 5 to 9 Year Old | 1,331 (75.9%) | 423 (24.1%) |
| 10 to 14 Year Olds | 1,792 (79.1%) | 472 (20.8%) |
| 15 to 17 Year Olds | 1,048 (72.1%) | 405 (27.9%) |
| 18 to 19 Year Olds | 869 (43.4%) | 1,133 (56.6%) |
| 20 to 24 Year Olds | 760 (33.5%) | 1,510 (66.5%) |
| 25 to 34 Year Olds | 93 (44.1%) | 118 (55.9%) |
| 35 Years and over | 21 (7.0%) | 277 (92.9%) |
| Total | 6,092 (56.4%) | 4,709 (43.6%) |
Educational Attainment by Field of Study in Harrison
Business (2,723 | 25.4%), social sciences (1,455 | 13.6%), education (908 | 8.5%), psychology (736 | 6.9%), and literature & languages (616 | 5.7%) are the most common fields of study among 10,730 individuals in Harrison who have obtained a bachelor's degree or higher.
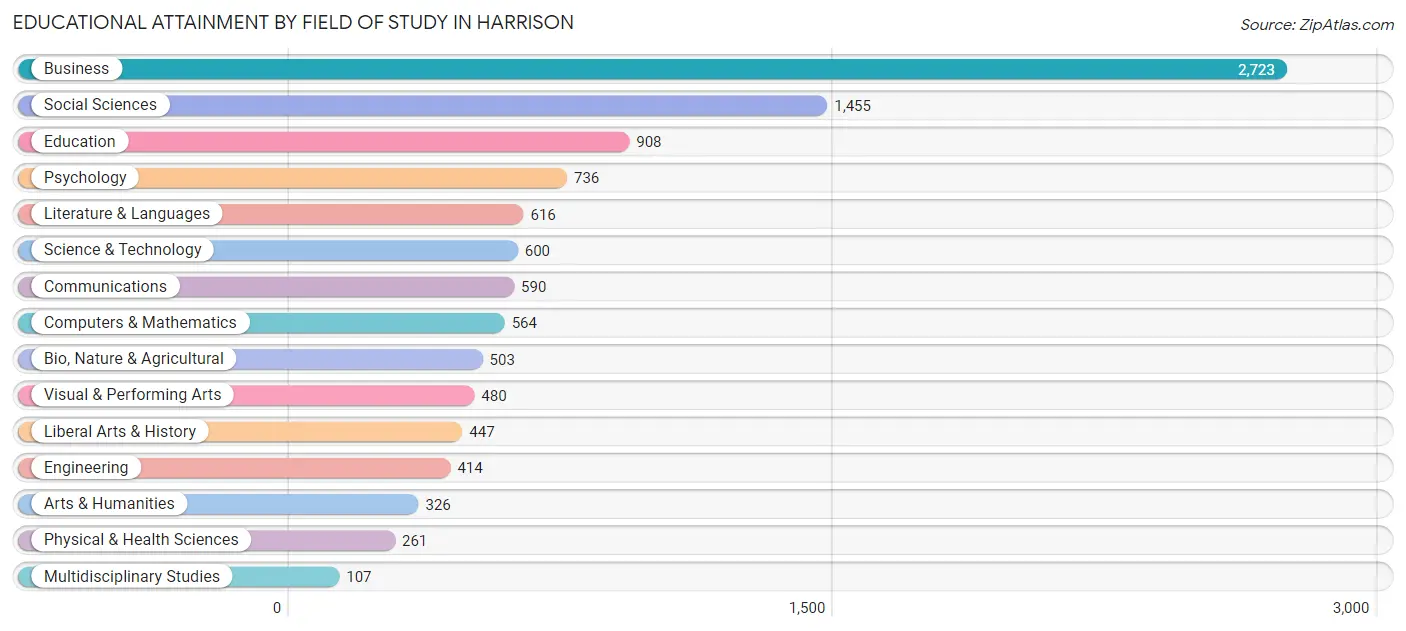
| Field of Study | # Graduates | % Graduates |
| Computers & Mathematics | 564 | 5.3% |
| Bio, Nature & Agricultural | 503 | 4.7% |
| Physical & Health Sciences | 261 | 2.4% |
| Psychology | 736 | 6.9% |
| Social Sciences | 1,455 | 13.6% |
| Engineering | 414 | 3.9% |
| Multidisciplinary Studies | 107 | 1.0% |
| Science & Technology | 600 | 5.6% |
| Business | 2,723 | 25.4% |
| Education | 908 | 8.5% |
| Literature & Languages | 616 | 5.7% |
| Liberal Arts & History | 447 | 4.2% |
| Visual & Performing Arts | 480 | 4.5% |
| Communications | 590 | 5.5% |
| Arts & Humanities | 326 | 3.0% |
| Total | 10,730 | 100.0% |
Transportation & Commute in Harrison
Vehicle Availability by Sex in Harrison
The most prevalent vehicle ownership categories in Harrison are males with 2 vehicles (2,787, accounting for 41.6%) and females with 2 vehicles (2,248, making up 52.4%).
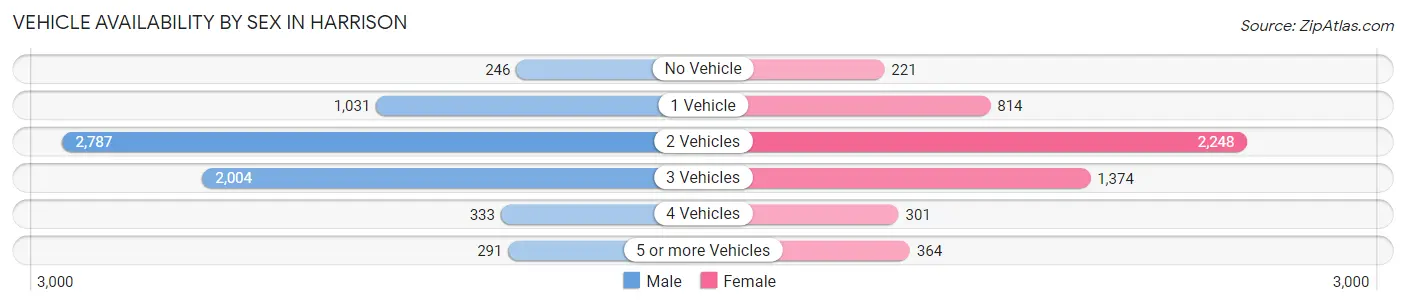
| Vehicles Available | Male | Female |
| No Vehicle | 246 (3.7%) | 221 (4.2%) |
| 1 Vehicle | 1,031 (15.4%) | 814 (15.3%) |
| 2 Vehicles | 2,787 (41.6%) | 2,248 (42.2%) |
| 3 Vehicles | 2,004 (29.9%) | 1,374 (25.8%) |
| 4 Vehicles | 333 (5.0%) | 301 (5.7%) |
| 5 or more Vehicles | 291 (4.3%) | 364 (6.8%) |
| Total | 6,692 (100.0%) | 5,322 (100.0%) |
Commute Time in Harrison
The most frequently occuring commute durations in Harrison are 60 to 89 minutes (1,929 commuters, 17.7%), 15 to 19 minutes (1,773 commuters, 16.3%), and 10 to 14 minutes (1,580 commuters, 14.5%).
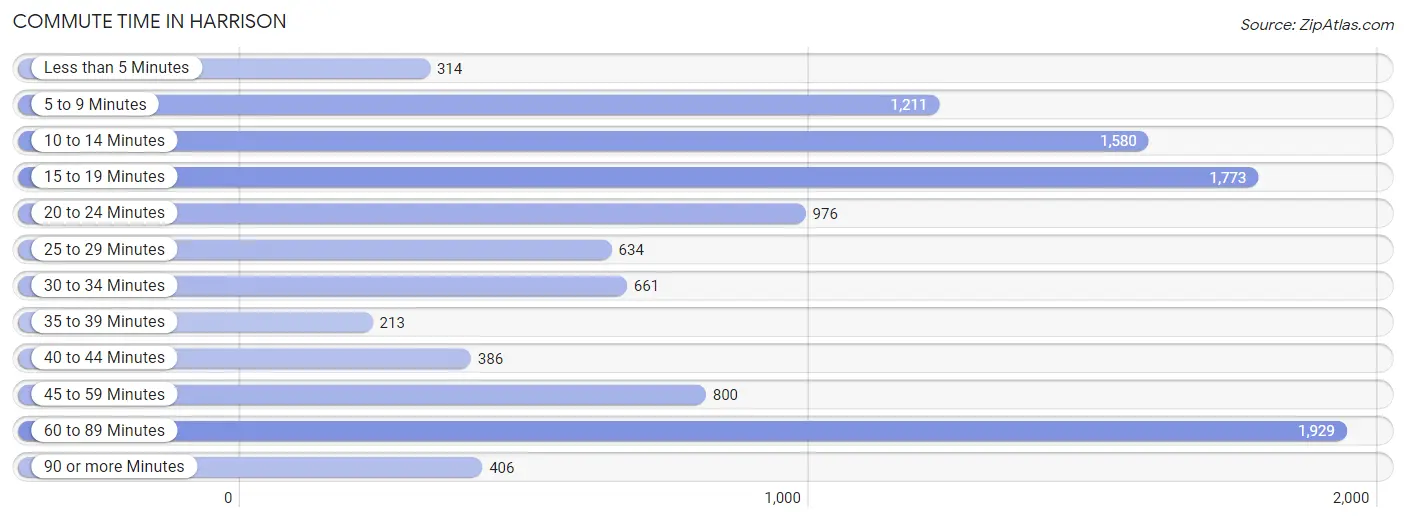
| Commute Time | # Commuters | % Commuters |
| Less than 5 Minutes | 314 | 2.9% |
| 5 to 9 Minutes | 1,211 | 11.1% |
| 10 to 14 Minutes | 1,580 | 14.5% |
| 15 to 19 Minutes | 1,773 | 16.3% |
| 20 to 24 Minutes | 976 | 9.0% |
| 25 to 29 Minutes | 634 | 5.8% |
| 30 to 34 Minutes | 661 | 6.1% |
| 35 to 39 Minutes | 213 | 2.0% |
| 40 to 44 Minutes | 386 | 3.5% |
| 45 to 59 Minutes | 800 | 7.3% |
| 60 to 89 Minutes | 1,929 | 17.7% |
| 90 or more Minutes | 406 | 3.7% |
Commute Time by Sex in Harrison
The most common commute times in Harrison are 60 to 89 minutes (1,141 commuters, 19.6%) for males and 15 to 19 minutes (966 commuters, 19.1%) for females.
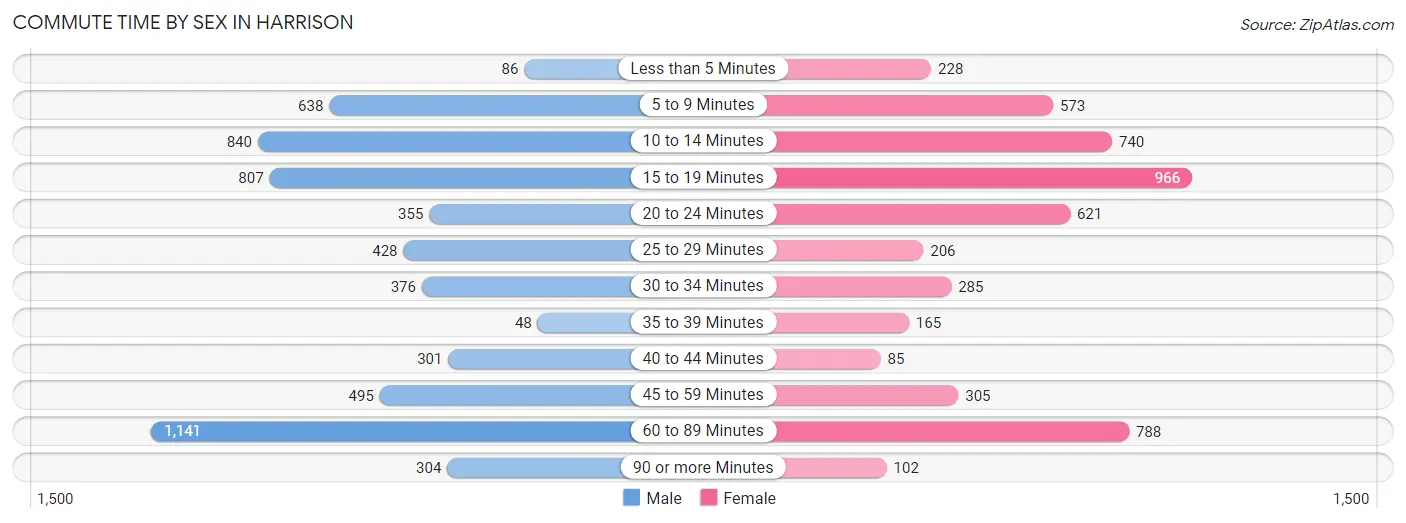
| Commute Time | Male | Female |
| Less than 5 Minutes | 86 (1.5%) | 228 (4.5%) |
| 5 to 9 Minutes | 638 (11.0%) | 573 (11.3%) |
| 10 to 14 Minutes | 840 (14.4%) | 740 (14.6%) |
| 15 to 19 Minutes | 807 (13.9%) | 966 (19.1%) |
| 20 to 24 Minutes | 355 (6.1%) | 621 (12.3%) |
| 25 to 29 Minutes | 428 (7.4%) | 206 (4.1%) |
| 30 to 34 Minutes | 376 (6.5%) | 285 (5.6%) |
| 35 to 39 Minutes | 48 (0.8%) | 165 (3.3%) |
| 40 to 44 Minutes | 301 (5.2%) | 85 (1.7%) |
| 45 to 59 Minutes | 495 (8.5%) | 305 (6.0%) |
| 60 to 89 Minutes | 1,141 (19.6%) | 788 (15.6%) |
| 90 or more Minutes | 304 (5.2%) | 102 (2.0%) |
Time of Departure to Work by Sex in Harrison
The most frequent times of departure to work in Harrison are 7:00 AM to 7:29 AM (1,015, 17.4%) for males and 8:00 AM to 8:29 AM (1,128, 22.3%) for females.
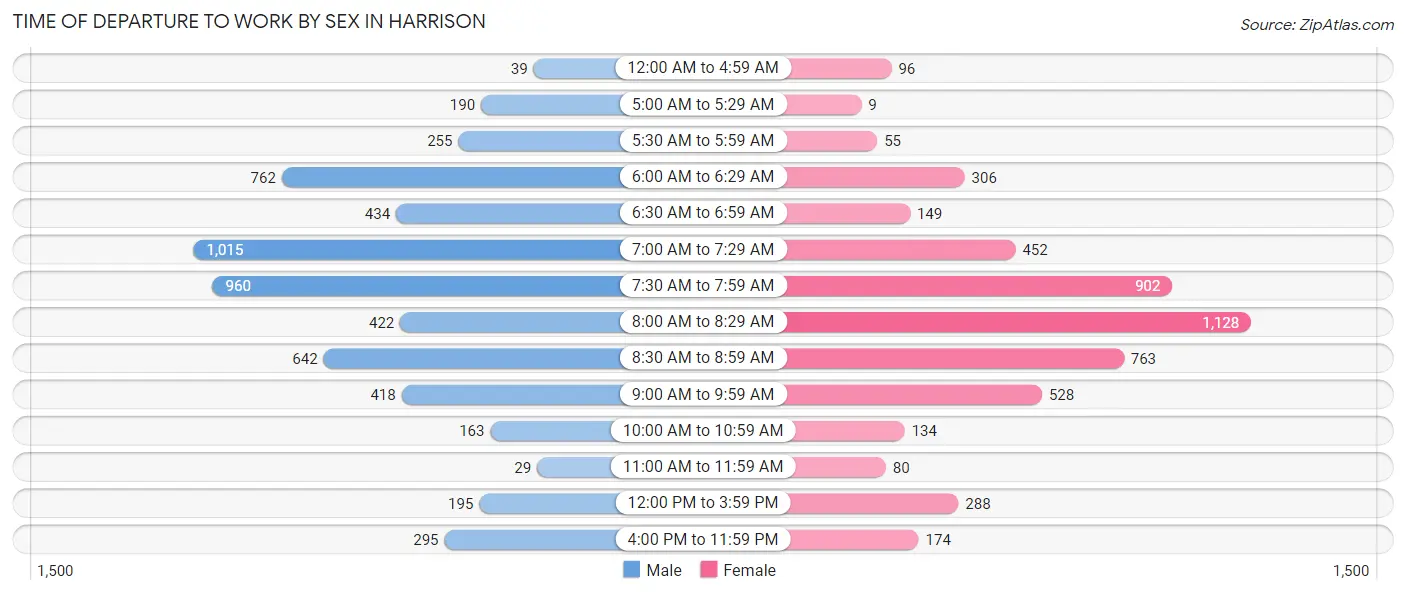
| Time of Departure | Male | Female |
| 12:00 AM to 4:59 AM | 39 (0.7%) | 96 (1.9%) |
| 5:00 AM to 5:29 AM | 190 (3.3%) | 9 (0.2%) |
| 5:30 AM to 5:59 AM | 255 (4.4%) | 55 (1.1%) |
| 6:00 AM to 6:29 AM | 762 (13.1%) | 306 (6.0%) |
| 6:30 AM to 6:59 AM | 434 (7.5%) | 149 (2.9%) |
| 7:00 AM to 7:29 AM | 1,015 (17.4%) | 452 (8.9%) |
| 7:30 AM to 7:59 AM | 960 (16.5%) | 902 (17.8%) |
| 8:00 AM to 8:29 AM | 422 (7.2%) | 1,128 (22.3%) |
| 8:30 AM to 8:59 AM | 642 (11.0%) | 763 (15.1%) |
| 9:00 AM to 9:59 AM | 418 (7.2%) | 528 (10.4%) |
| 10:00 AM to 10:59 AM | 163 (2.8%) | 134 (2.6%) |
| 11:00 AM to 11:59 AM | 29 (0.5%) | 80 (1.6%) |
| 12:00 PM to 3:59 PM | 195 (3.4%) | 288 (5.7%) |
| 4:00 PM to 11:59 PM | 295 (5.1%) | 174 (3.4%) |
| Total | 5,819 (100.0%) | 5,064 (100.0%) |
Housing Occupancy in Harrison
Occupancy by Ownership in Harrison
Of the total 8,242 dwellings in Harrison, owner-occupied units account for 5,509 (66.8%), while renter-occupied units make up 2,733 (33.2%).
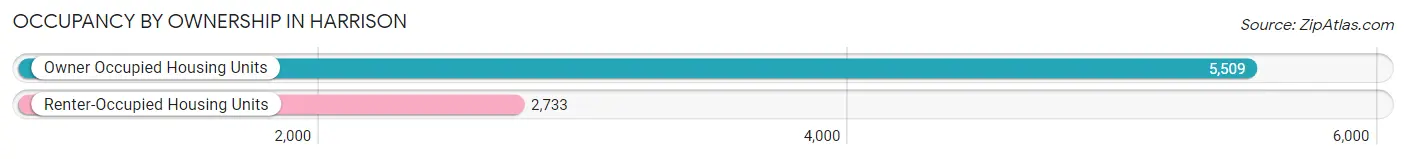
| Occupancy | # Housing Units | % Housing Units |
| Owner Occupied Housing Units | 5,509 | 66.8% |
| Renter-Occupied Housing Units | 2,733 | 33.2% |
| Total Occupied Housing Units | 8,242 | 100.0% |
Occupancy by Household Size in Harrison
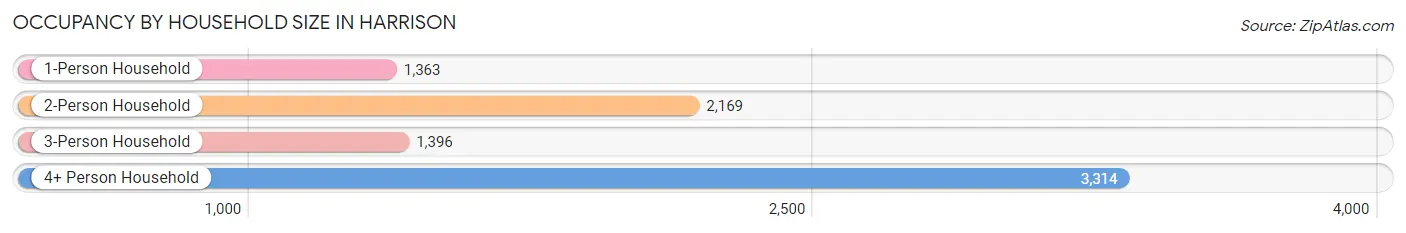
| Household Size | # Housing Units | % Housing Units |
| 1-Person Household | 1,363 | 16.5% |
| 2-Person Household | 2,169 | 26.3% |
| 3-Person Household | 1,396 | 16.9% |
| 4+ Person Household | 3,314 | 40.2% |
| Total Housing Units | 8,242 | 100.0% |
Occupancy by Ownership by Household Size in Harrison
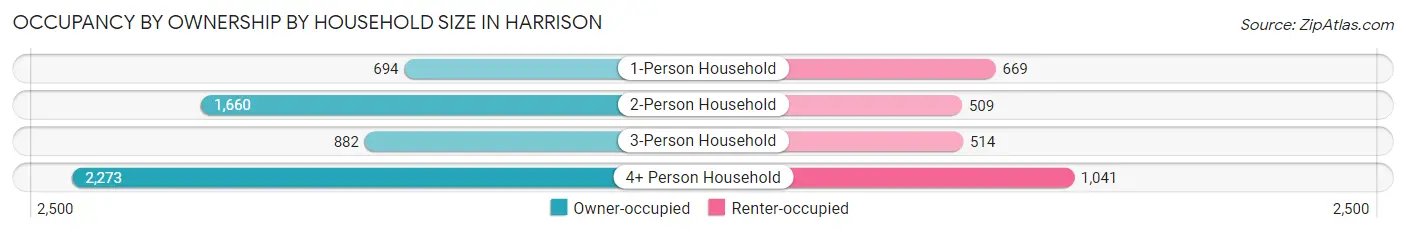
| Household Size | Owner-occupied | Renter-occupied |
| 1-Person Household | 694 (50.9%) | 669 (49.1%) |
| 2-Person Household | 1,660 (76.5%) | 509 (23.5%) |
| 3-Person Household | 882 (63.2%) | 514 (36.8%) |
| 4+ Person Household | 2,273 (68.6%) | 1,041 (31.4%) |
| Total Housing Units | 5,509 (66.8%) | 2,733 (33.2%) |
Occupancy by Educational Attainment in Harrison
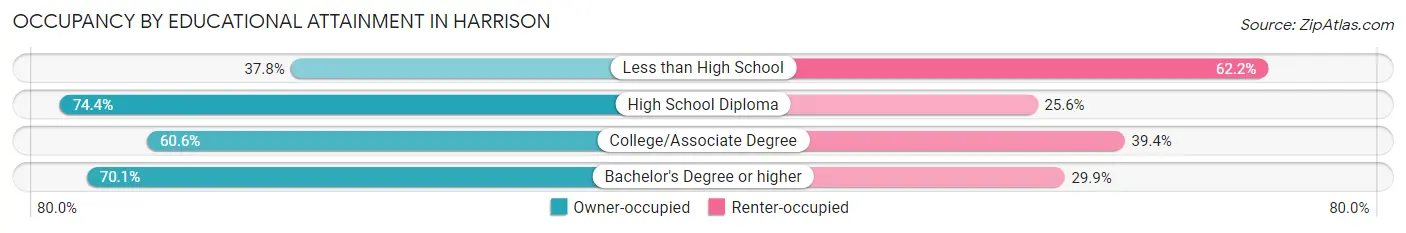
| Household Size | Owner-occupied | Renter-occupied |
| Less than High School | 199 (37.8%) | 327 (62.2%) |
| High School Diploma | 774 (74.4%) | 266 (25.6%) |
| College/Associate Degree | 927 (60.6%) | 603 (39.4%) |
| Bachelor's Degree or higher | 3,609 (70.1%) | 1,537 (29.9%) |
Occupancy by Age of Householder in Harrison
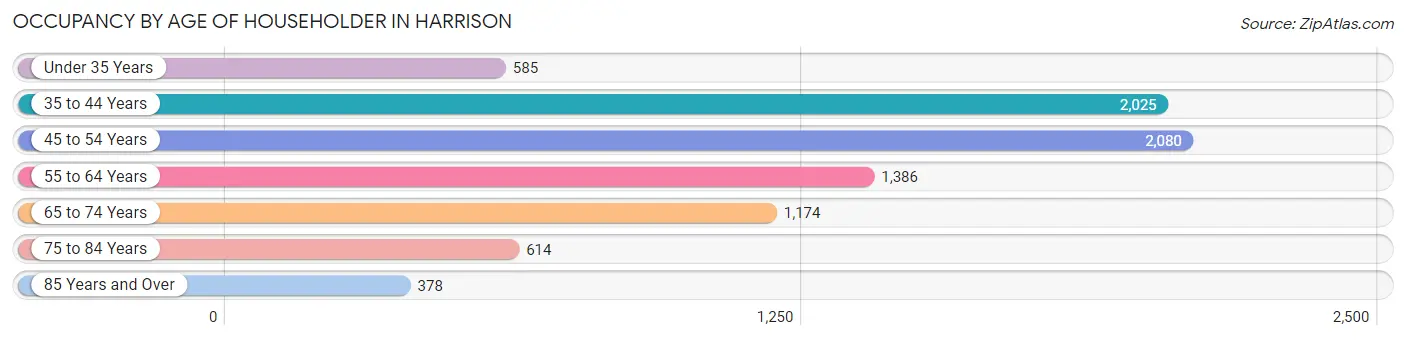
| Age Bracket | # Households | % Households |
| Under 35 Years | 585 | 7.1% |
| 35 to 44 Years | 2,025 | 24.6% |
| 45 to 54 Years | 2,080 | 25.2% |
| 55 to 64 Years | 1,386 | 16.8% |
| 65 to 74 Years | 1,174 | 14.2% |
| 75 to 84 Years | 614 | 7.4% |
| 85 Years and Over | 378 | 4.6% |
| Total | 8,242 | 100.0% |
Housing Finances in Harrison
Median Income by Occupancy in Harrison
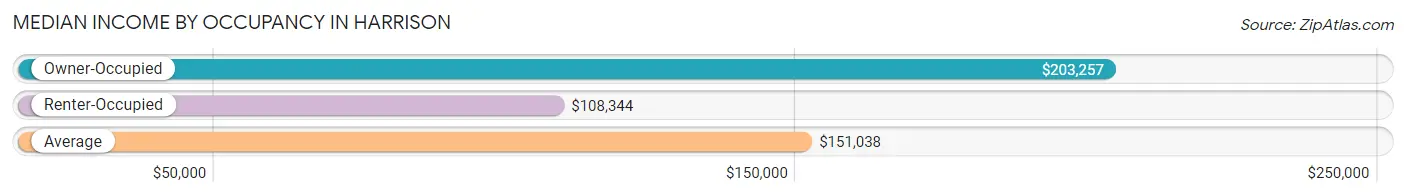
| Occupancy Type | # Households | Median Income |
| Owner-Occupied | 5,509 (66.8%) | $203,257 |
| Renter-Occupied | 2,733 (33.2%) | $108,344 |
| Average | 8,242 (100.0%) | $151,038 |
Occupancy by Householder Income Bracket in Harrison
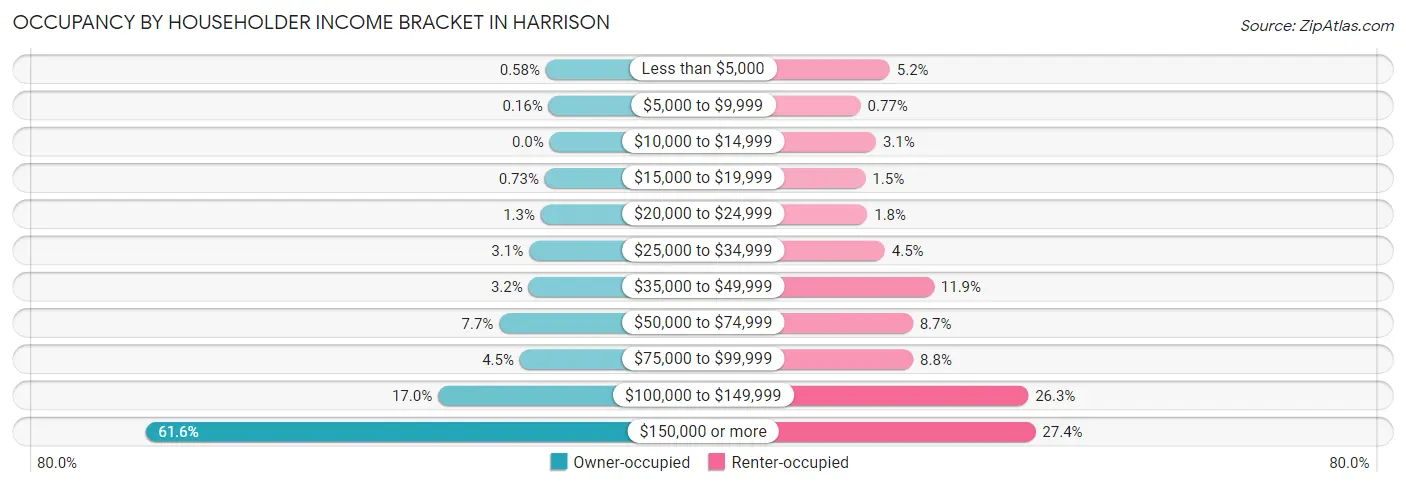
| Income Bracket | Owner-occupied | Renter-occupied |
| Less than $5,000 | 32 (0.6%) | 143 (5.2%) |
| $5,000 to $9,999 | 9 (0.2%) | 21 (0.8%) |
| $10,000 to $14,999 | 0 (0.0%) | 85 (3.1%) |
| $15,000 to $19,999 | 40 (0.7%) | 41 (1.5%) |
| $20,000 to $24,999 | 74 (1.3%) | 49 (1.8%) |
| $25,000 to $34,999 | 173 (3.1%) | 122 (4.5%) |
| $35,000 to $49,999 | 177 (3.2%) | 326 (11.9%) |
| $50,000 to $74,999 | 423 (7.7%) | 238 (8.7%) |
| $75,000 to $99,999 | 250 (4.5%) | 240 (8.8%) |
| $100,000 to $149,999 | 937 (17.0%) | 719 (26.3%) |
| $150,000 or more | 3,394 (61.6%) | 749 (27.4%) |
| Total | 5,509 (100.0%) | 2,733 (100.0%) |
Monthly Housing Cost Tiers in Harrison
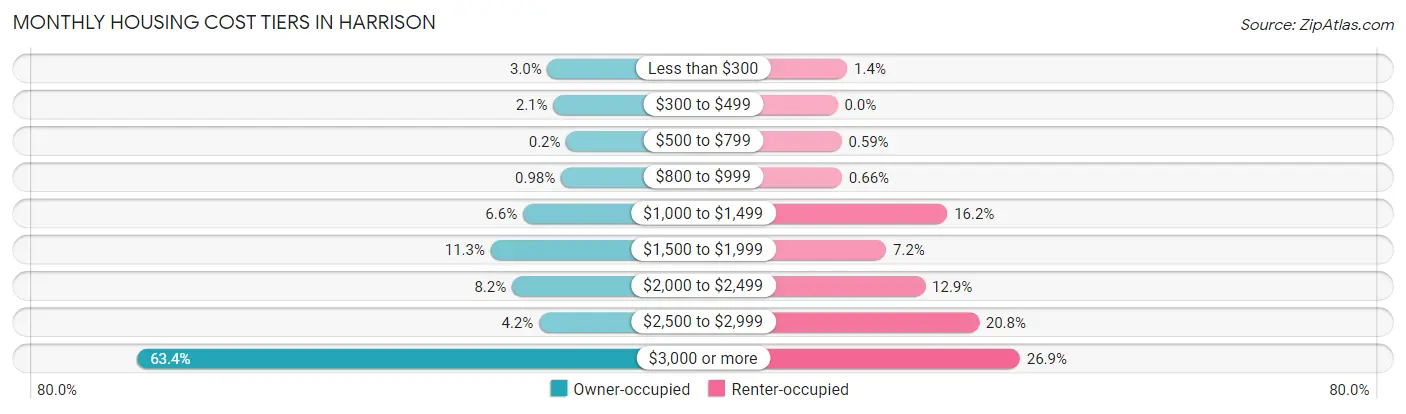
| Monthly Cost | Owner-occupied | Renter-occupied |
| Less than $300 | 163 (3.0%) | 39 (1.4%) |
| $300 to $499 | 117 (2.1%) | 0 (0.0%) |
| $500 to $799 | 11 (0.2%) | 16 (0.6%) |
| $800 to $999 | 54 (1.0%) | 18 (0.7%) |
| $1,000 to $1,499 | 363 (6.6%) | 442 (16.2%) |
| $1,500 to $1,999 | 624 (11.3%) | 196 (7.2%) |
| $2,000 to $2,499 | 452 (8.2%) | 353 (12.9%) |
| $2,500 to $2,999 | 232 (4.2%) | 569 (20.8%) |
| $3,000 or more | 3,493 (63.4%) | 734 (26.9%) |
| Total | 5,509 (100.0%) | 2,733 (100.0%) |
Physical Housing Characteristics in Harrison
Housing Structures in Harrison
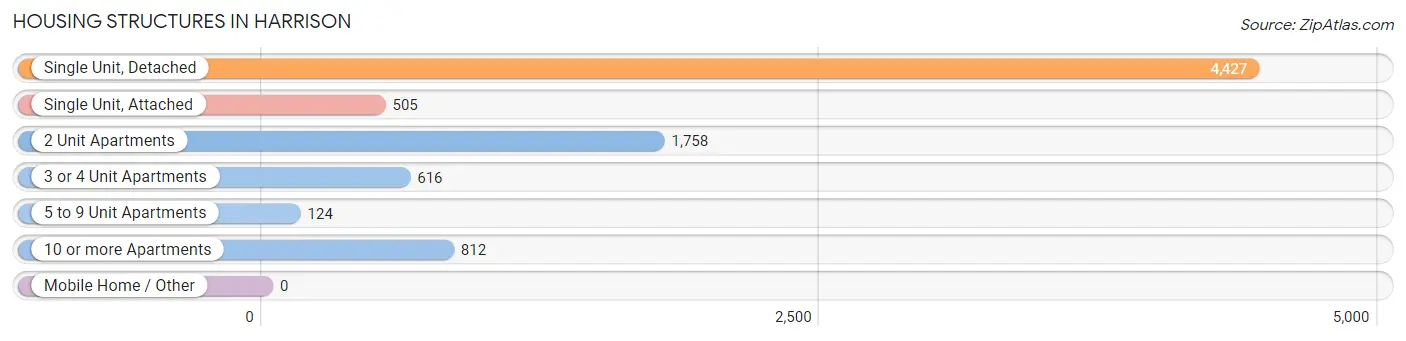
| Structure Type | # Housing Units | % Housing Units |
| Single Unit, Detached | 4,427 | 53.7% |
| Single Unit, Attached | 505 | 6.1% |
| 2 Unit Apartments | 1,758 | 21.3% |
| 3 or 4 Unit Apartments | 616 | 7.5% |
| 5 to 9 Unit Apartments | 124 | 1.5% |
| 10 or more Apartments | 812 | 9.9% |
| Mobile Home / Other | 0 | 0.0% |
| Total | 8,242 | 100.0% |
Housing Structures by Occupancy in Harrison
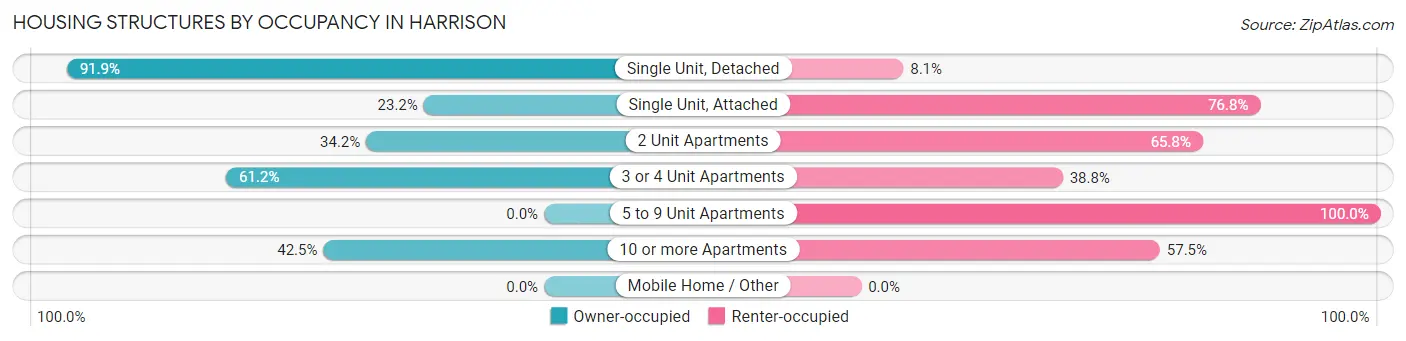
| Structure Type | Owner-occupied | Renter-occupied |
| Single Unit, Detached | 4,068 (91.9%) | 359 (8.1%) |
| Single Unit, Attached | 117 (23.2%) | 388 (76.8%) |
| 2 Unit Apartments | 602 (34.2%) | 1,156 (65.8%) |
| 3 or 4 Unit Apartments | 377 (61.2%) | 239 (38.8%) |
| 5 to 9 Unit Apartments | 0 (0.0%) | 124 (100.0%) |
| 10 or more Apartments | 345 (42.5%) | 467 (57.5%) |
| Mobile Home / Other | 0 (0.0%) | 0 (0.0%) |
| Total | 5,509 (66.8%) | 2,733 (33.2%) |
Housing Structures by Number of Rooms in Harrison
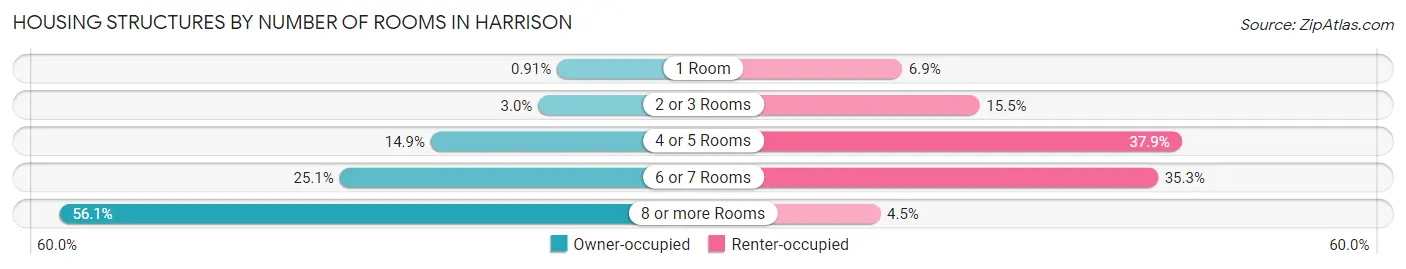
| Number of Rooms | Owner-occupied | Renter-occupied |
| 1 Room | 50 (0.9%) | 188 (6.9%) |
| 2 or 3 Rooms | 165 (3.0%) | 423 (15.5%) |
| 4 or 5 Rooms | 822 (14.9%) | 1,036 (37.9%) |
| 6 or 7 Rooms | 1,380 (25.1%) | 964 (35.3%) |
| 8 or more Rooms | 3,092 (56.1%) | 122 (4.5%) |
| Total | 5,509 (100.0%) | 2,733 (100.0%) |
Housing Structure by Heating Type in Harrison
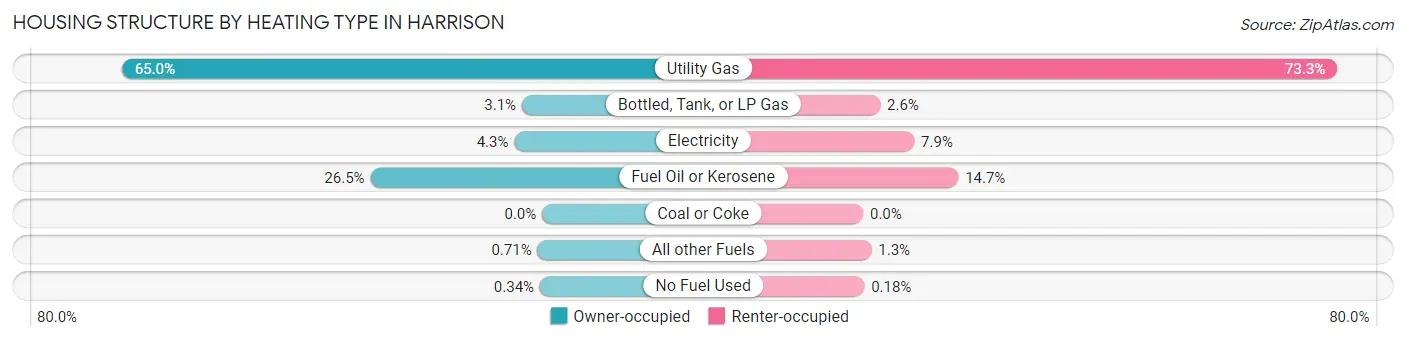
| Heating Type | Owner-occupied | Renter-occupied |
| Utility Gas | 3,580 (65.0%) | 2,003 (73.3%) |
| Bottled, Tank, or LP Gas | 172 (3.1%) | 72 (2.6%) |
| Electricity | 237 (4.3%) | 216 (7.9%) |
| Fuel Oil or Kerosene | 1,462 (26.5%) | 402 (14.7%) |
| Coal or Coke | 0 (0.0%) | 0 (0.0%) |
| All other Fuels | 39 (0.7%) | 35 (1.3%) |
| No Fuel Used | 19 (0.3%) | 5 (0.2%) |
| Total | 5,509 (100.0%) | 2,733 (100.0%) |
Household Vehicle Usage in Harrison
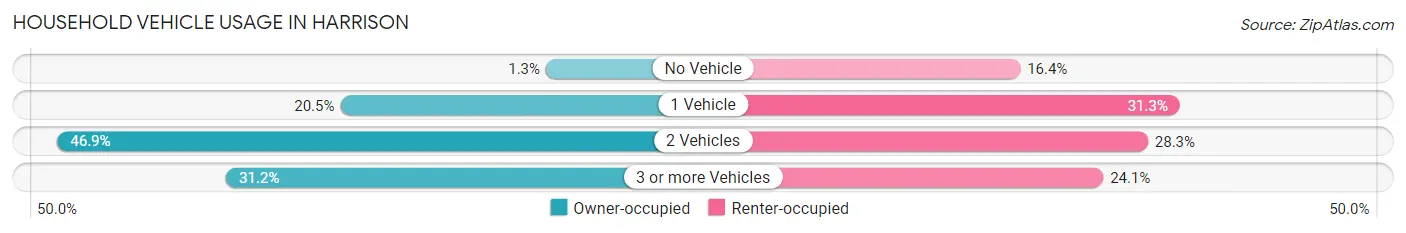
| Vehicles per Household | Owner-occupied | Renter-occupied |
| No Vehicle | 74 (1.3%) | 447 (16.4%) |
| 1 Vehicle | 1,131 (20.5%) | 854 (31.2%) |
| 2 Vehicles | 2,586 (46.9%) | 773 (28.3%) |
| 3 or more Vehicles | 1,718 (31.2%) | 659 (24.1%) |
| Total | 5,509 (100.0%) | 2,733 (100.0%) |
Real Estate & Mortgages in Harrison
Real Estate and Mortgage Overview in Harrison
| Characteristic | Without Mortgage | With Mortgage |
| Housing Units | 2,062 | 3,447 |
| Median Property Value | $903,100 | $986,000 |
| Median Household Income | $137,308 | $2,448 |
| Monthly Housing Costs | $1,501 | $2,831 |
| Real Estate Taxes | $10,001 | $135 |
Property Value by Mortgage Status in Harrison
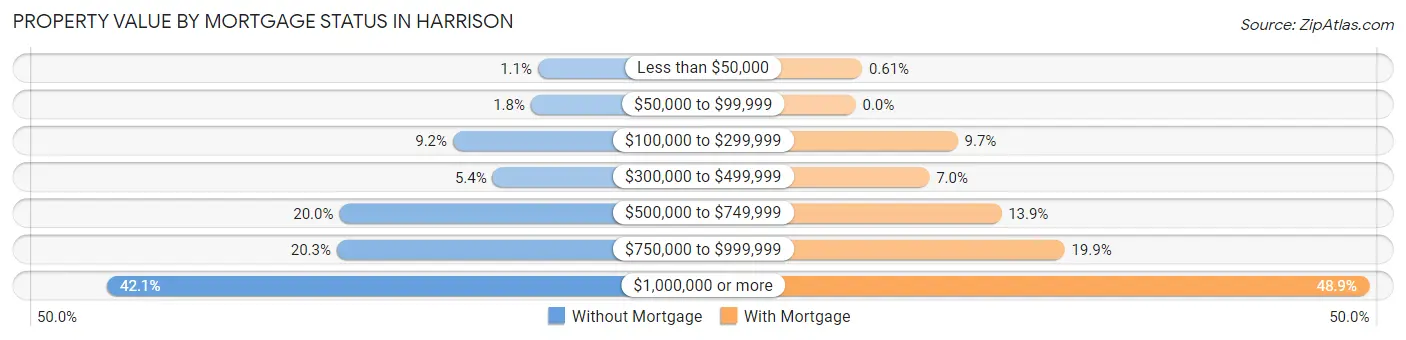
| Property Value | Without Mortgage | With Mortgage |
| Less than $50,000 | 23 (1.1%) | 21 (0.6%) |
| $50,000 to $99,999 | 37 (1.8%) | 0 (0.0%) |
| $100,000 to $299,999 | 190 (9.2%) | 335 (9.7%) |
| $300,000 to $499,999 | 112 (5.4%) | 242 (7.0%) |
| $500,000 to $749,999 | 413 (20.0%) | 478 (13.9%) |
| $750,000 to $999,999 | 418 (20.3%) | 686 (19.9%) |
| $1,000,000 or more | 869 (42.1%) | 1,685 (48.9%) |
| Total | 2,062 (100.0%) | 3,447 (100.0%) |
Household Income by Mortgage Status in Harrison
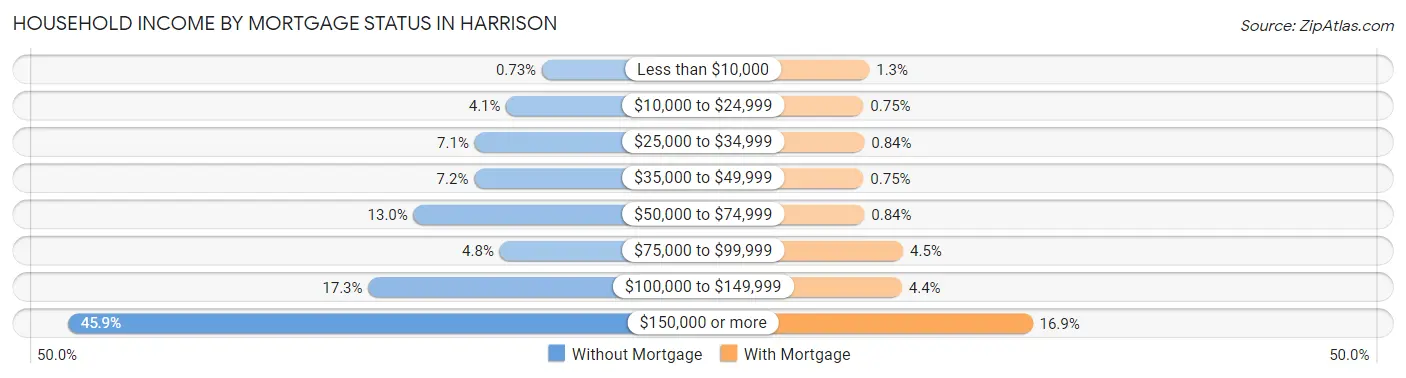
| Household Income | Without Mortgage | With Mortgage |
| Less than $10,000 | 15 (0.7%) | 45 (1.3%) |
| $10,000 to $24,999 | 85 (4.1%) | 26 (0.7%) |
| $25,000 to $34,999 | 147 (7.1%) | 29 (0.8%) |
| $35,000 to $49,999 | 148 (7.2%) | 26 (0.7%) |
| $50,000 to $74,999 | 267 (13.0%) | 29 (0.8%) |
| $75,000 to $99,999 | 98 (4.8%) | 156 (4.5%) |
| $100,000 to $149,999 | 356 (17.3%) | 152 (4.4%) |
| $150,000 or more | 946 (45.9%) | 581 (16.9%) |
| Total | 2,062 (100.0%) | 3,447 (100.0%) |
Property Value to Household Income Ratio in Harrison
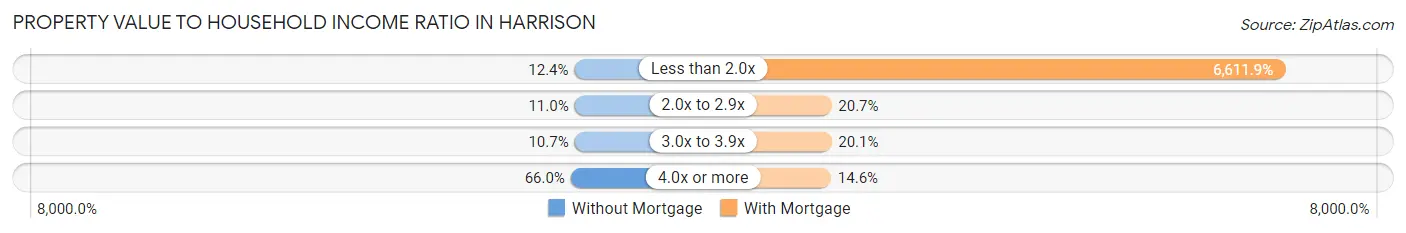
| Value-to-Income Ratio | Without Mortgage | With Mortgage |
| Less than 2.0x | 255 (12.4%) | 227,911 (6,611.9%) |
| 2.0x to 2.9x | 226 (11.0%) | 713 (20.7%) |
| 3.0x to 3.9x | 220 (10.7%) | 692 (20.1%) |
| 4.0x or more | 1,361 (66.0%) | 503 (14.6%) |
| Total | 2,062 (100.0%) | 3,447 (100.0%) |
Real Estate Taxes by Mortgage Status in Harrison
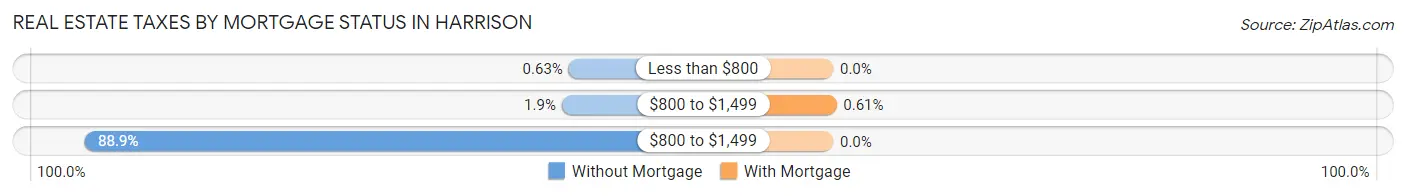
| Property Taxes | Without Mortgage | With Mortgage |
| Less than $800 | 13 (0.6%) | 0 (0.0%) |
| $800 to $1,499 | 39 (1.9%) | 21 (0.6%) |
| $800 to $1,499 | 1,834 (88.9%) | 0 (0.0%) |
| Total | 2,062 (100.0%) | 3,447 (100.0%) |
Health & Disability in Harrison
Health Insurance Coverage by Age in Harrison
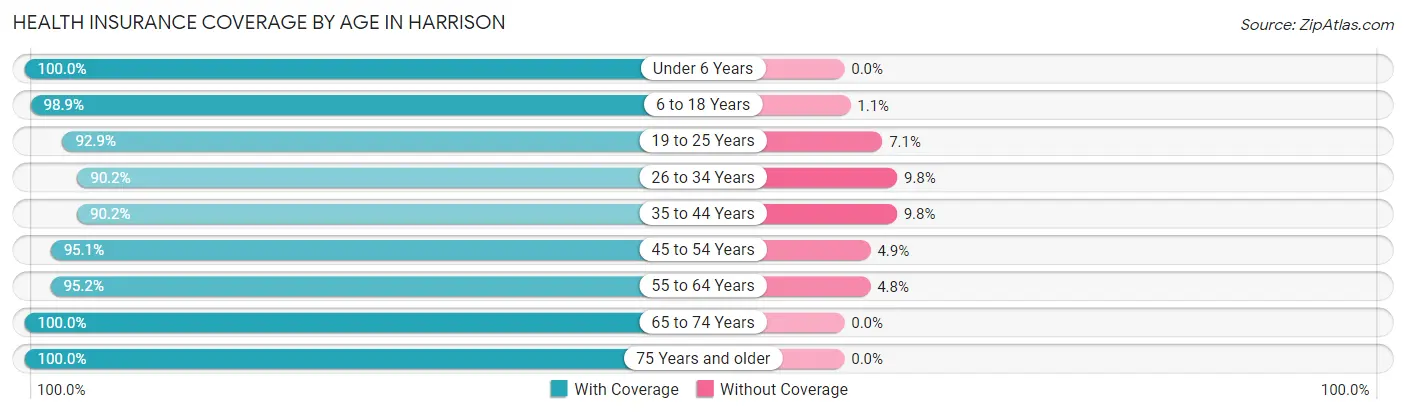
| Age Bracket | With Coverage | Without Coverage |
| Under 6 Years | 1,640 (100.0%) | 0 (0.0%) |
| 6 to 18 Years | 6,289 (98.9%) | 72 (1.1%) |
| 19 to 25 Years | 3,904 (92.9%) | 297 (7.1%) |
| 26 to 34 Years | 1,796 (90.2%) | 196 (9.8%) |
| 35 to 44 Years | 3,588 (90.2%) | 389 (9.8%) |
| 45 to 54 Years | 4,115 (95.1%) | 211 (4.9%) |
| 55 to 64 Years | 2,544 (95.2%) | 129 (4.8%) |
| 65 to 74 Years | 1,938 (100.0%) | 0 (0.0%) |
| 75 Years and older | 1,609 (100.0%) | 0 (0.0%) |
| Total | 27,423 (95.5%) | 1,294 (4.5%) |
Health Insurance Coverage by Citizenship Status in Harrison
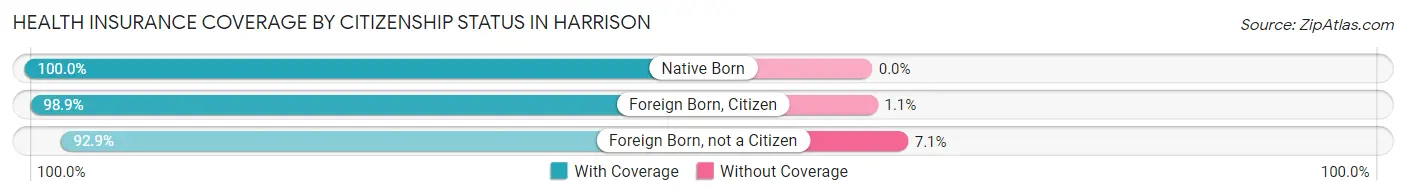
| Citizenship Status | With Coverage | Without Coverage |
| Native Born | 1,640 (100.0%) | 0 (0.0%) |
| Foreign Born, Citizen | 6,289 (98.9%) | 72 (1.1%) |
| Foreign Born, not a Citizen | 3,904 (92.9%) | 297 (7.1%) |
Health Insurance Coverage by Household Income in Harrison
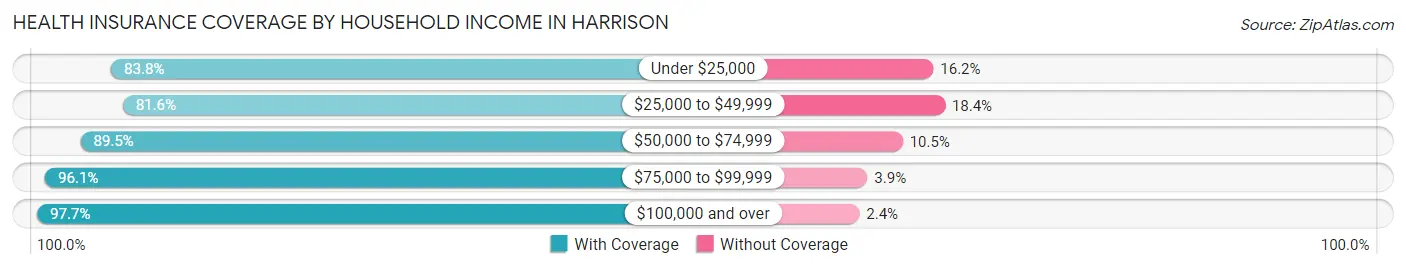
| Household Income | With Coverage | Without Coverage |
| Under $25,000 | 749 (83.8%) | 145 (16.2%) |
| $25,000 to $49,999 | 1,402 (81.6%) | 316 (18.4%) |
| $50,000 to $74,999 | 1,445 (89.5%) | 169 (10.5%) |
| $75,000 to $99,999 | 996 (96.1%) | 40 (3.9%) |
| $100,000 and over | 19,582 (97.7%) | 471 (2.4%) |
Public vs Private Health Insurance Coverage by Age in Harrison
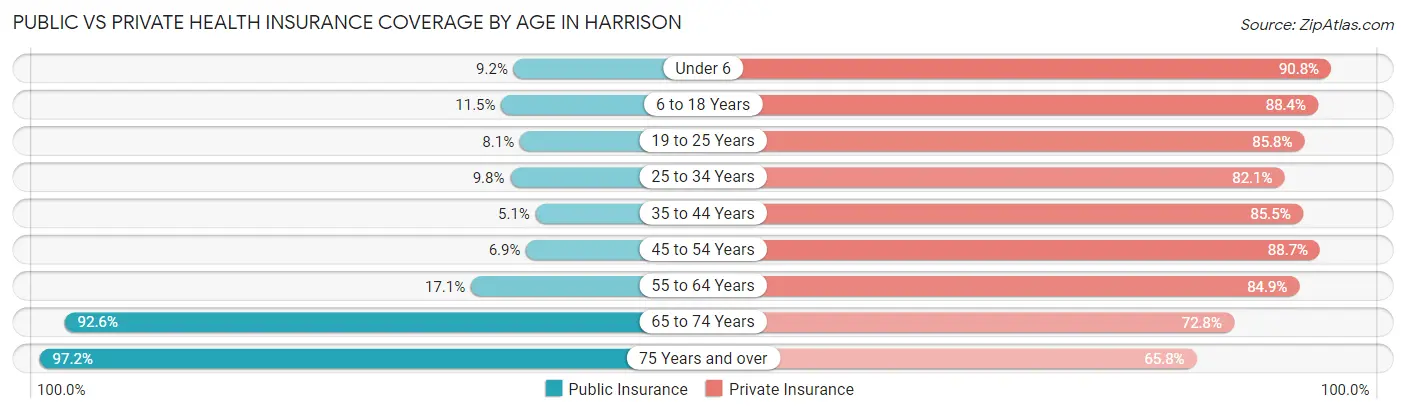
| Age Bracket | Public Insurance | Private Insurance |
| Under 6 | 151 (9.2%) | 1,489 (90.8%) |
| 6 to 18 Years | 732 (11.5%) | 5,620 (88.3%) |
| 19 to 25 Years | 338 (8.1%) | 3,606 (85.8%) |
| 25 to 34 Years | 196 (9.8%) | 1,636 (82.1%) |
| 35 to 44 Years | 204 (5.1%) | 3,401 (85.5%) |
| 45 to 54 Years | 297 (6.9%) | 3,839 (88.7%) |
| 55 to 64 Years | 458 (17.1%) | 2,269 (84.9%) |
| 65 to 74 Years | 1,794 (92.6%) | 1,410 (72.8%) |
| 75 Years and over | 1,564 (97.2%) | 1,059 (65.8%) |
| Total | 5,734 (20.0%) | 24,329 (84.7%) |
Disability Status by Sex by Age in Harrison
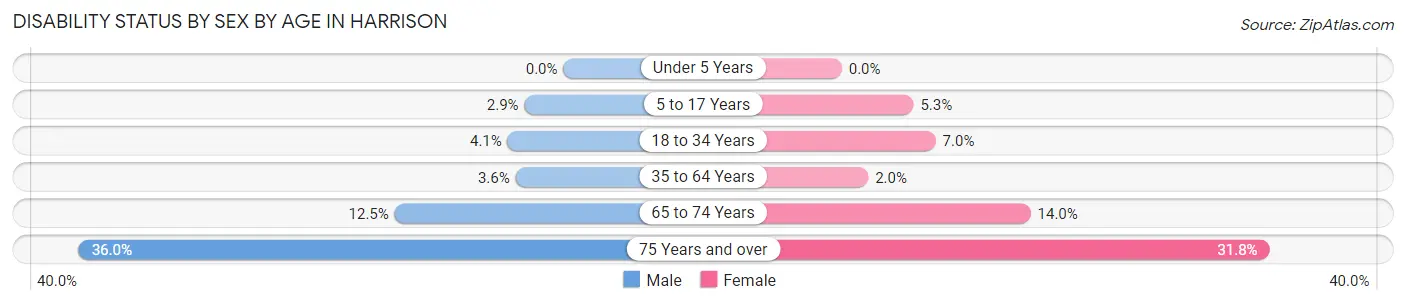
| Age Bracket | Male | Female |
| Under 5 Years | 0 (0.0%) | 0 (0.0%) |
| 5 to 17 Years | 79 (2.9%) | 148 (5.3%) |
| 18 to 34 Years | 127 (4.1%) | 290 (7.0%) |
| 35 to 64 Years | 196 (3.5%) | 107 (2.0%) |
| 65 to 74 Years | 107 (12.5%) | 152 (14.0%) |
| 75 Years and over | 231 (36.0%) | 307 (31.8%) |
Disability Class by Sex by Age in Harrison
Disability Class: Hearing Difficulty
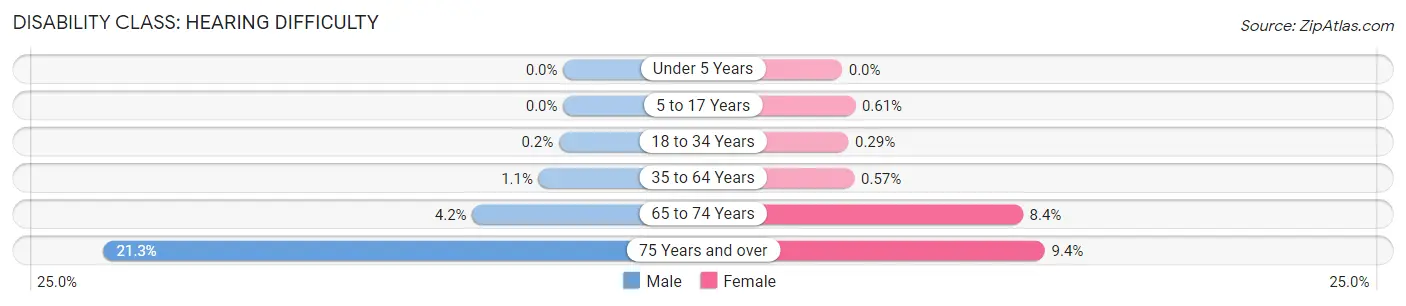
| Age Bracket | Male | Female |
| Under 5 Years | 0 (0.0%) | 0 (0.0%) |
| 5 to 17 Years | 0 (0.0%) | 17 (0.6%) |
| 18 to 34 Years | 6 (0.2%) | 12 (0.3%) |
| 35 to 64 Years | 63 (1.1%) | 31 (0.6%) |
| 65 to 74 Years | 36 (4.2%) | 91 (8.4%) |
| 75 Years and over | 137 (21.3%) | 91 (9.4%) |
Disability Class: Vision Difficulty
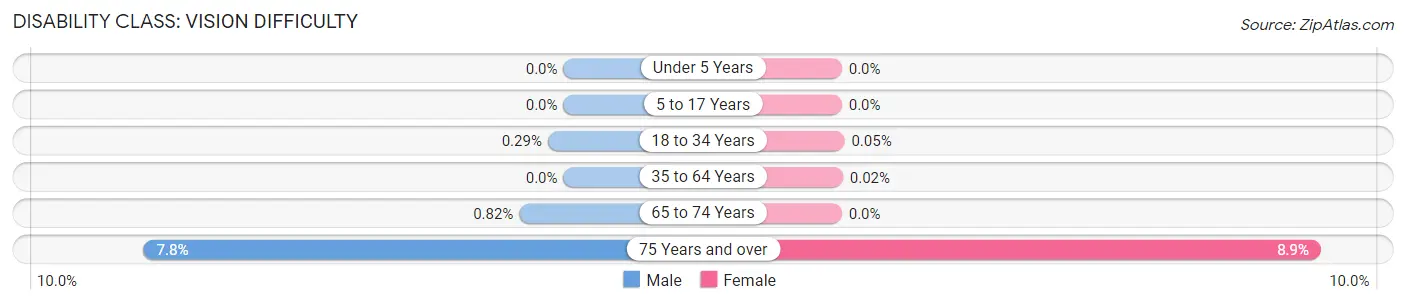
| Age Bracket | Male | Female |
| Under 5 Years | 0 (0.0%) | 0 (0.0%) |
| 5 to 17 Years | 0 (0.0%) | 0 (0.0%) |
| 18 to 34 Years | 9 (0.3%) | 2 (0.1%) |
| 35 to 64 Years | 0 (0.0%) | 1 (0.0%) |
| 65 to 74 Years | 7 (0.8%) | 0 (0.0%) |
| 75 Years and over | 50 (7.8%) | 86 (8.9%) |
Disability Class: Cognitive Difficulty
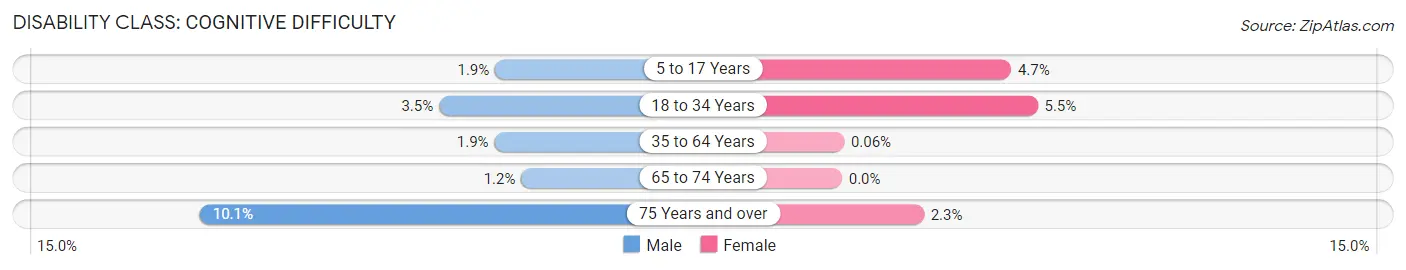
| Age Bracket | Male | Female |
| 5 to 17 Years | 52 (1.9%) | 131 (4.7%) |
| 18 to 34 Years | 106 (3.5%) | 227 (5.4%) |
| 35 to 64 Years | 106 (1.9%) | 3 (0.1%) |
| 65 to 74 Years | 10 (1.2%) | 0 (0.0%) |
| 75 Years and over | 65 (10.1%) | 22 (2.3%) |
Disability Class: Ambulatory Difficulty
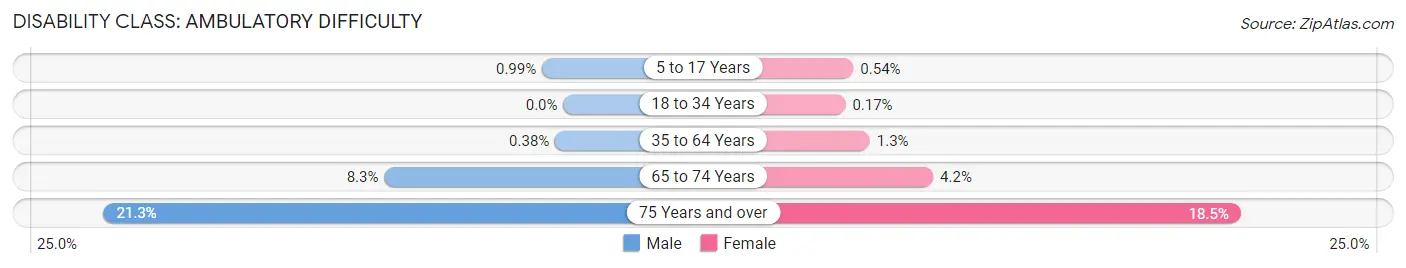
| Age Bracket | Male | Female |
| 5 to 17 Years | 27 (1.0%) | 15 (0.5%) |
| 18 to 34 Years | 0 (0.0%) | 7 (0.2%) |
| 35 to 64 Years | 21 (0.4%) | 71 (1.3%) |
| 65 to 74 Years | 71 (8.3%) | 46 (4.2%) |
| 75 Years and over | 137 (21.3%) | 179 (18.5%) |
Disability Class: Self-Care Difficulty
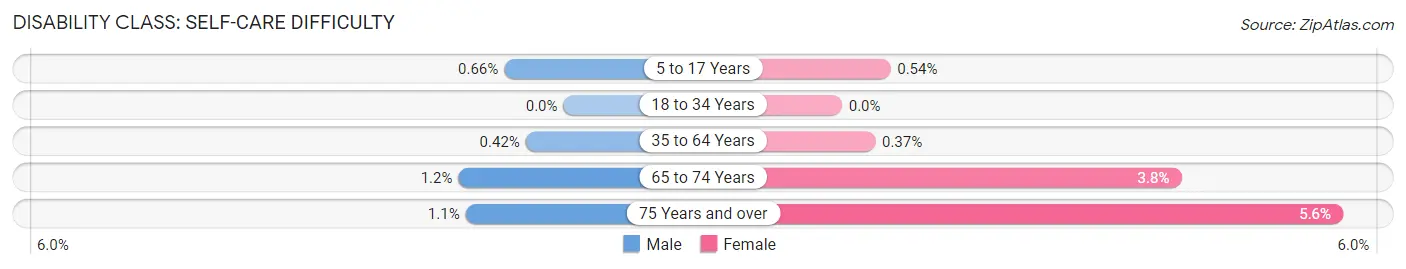
| Age Bracket | Male | Female |
| 5 to 17 Years | 18 (0.7%) | 15 (0.5%) |
| 18 to 34 Years | 0 (0.0%) | 0 (0.0%) |
| 35 to 64 Years | 23 (0.4%) | 20 (0.4%) |
| 65 to 74 Years | 10 (1.2%) | 41 (3.8%) |
| 75 Years and over | 7 (1.1%) | 54 (5.6%) |
Technology Access in Harrison
Computing Device Access in Harrison
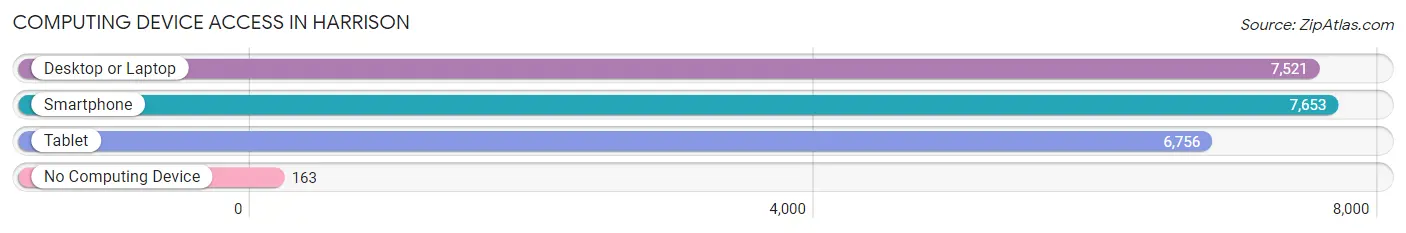
| Device Type | # Households | % Households |
| Desktop or Laptop | 7,521 | 91.2% |
| Smartphone | 7,653 | 92.8% |
| Tablet | 6,756 | 82.0% |
| No Computing Device | 163 | 2.0% |
| Total | 8,242 | 100.0% |
Internet Access in Harrison
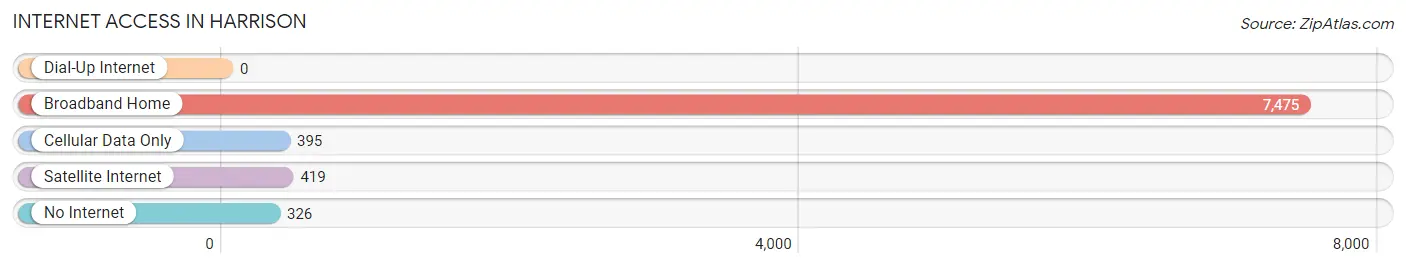
| Internet Type | # Households | % Households |
| Dial-Up Internet | 0 | 0.0% |
| Broadband Home | 7,475 | 90.7% |
| Cellular Data Only | 395 | 4.8% |
| Satellite Internet | 419 | 5.1% |
| No Internet | 326 | 4.0% |
| Total | 8,242 | 100.0% |
Harrison Summary
Harrison is a town located in Westchester County, New York, United States. It is located in the southeastern part of the county, about 22 miles (35 km) northeast of Manhattan. The population was 27,472 at the 2010 census.
History
Harrison was first settled in 1696 by John Harrison, a Quaker from Rye, New York. The town was originally part of Rye until 1788, when it was incorporated as its own town. During the American Revolution, the town was the site of a major battle between the British and American forces. The town was also home to a large number of mills and factories during the 19th century.
Geography
Harrison is located in southeastern Westchester County, bordered by the towns of Rye to the north, Mamaroneck to the east, White Plains to the south, and Purchase to the west. The town is located on the Long Island Sound, with the Hutchinson River forming the northern border. The town is hilly, with elevations ranging from sea level to over 400 feet (120 m).
Economy
Harrison is home to a number of businesses, including several large corporations. The town is home to the headquarters of PepsiCo, MasterCard, and Heineken USA. Other major employers include the Westchester Medical Center, the Westchester County Airport, and the Westchester County Department of Social Services.
Demographics
As of the 2010 census, there were 27,472 people, 9,845 households, and 7,717 families residing in the town. The population density was 2,845.3 people per square mile (1,098.7/km2). There were 10,093 housing units at an average density of 1,053.3 per square mile (406.2/km2). The racial makeup of the town was 79.2% White, 8.2% African American, 0.1% Native American, 8.3% Asian, 0.0% Pacific Islander, 1.7% from other races, and 2.5% from two or more races. Hispanic or Latino of any race were 6.7% of the population.
The median income for a household in the town was $100,945, and the median income for a family was $118,871. Males had a median income of $87,811 versus $51,939 for females. The per capita income for the town was $50,890. About 2.2% of families and 3.3% of the population were below the poverty line, including 3.7% of those under age 18 and 4.2% of those age 65 or over.
Common Questions
What is Per Capita Income in Harrison?
Per Capita income in Harrison is $76,274.
What is the Median Family Income in Harrison?
Median Family Income in Harrison is $182,099.
What is the Median Household income in Harrison?
Median Household Income in Harrison is $151,038.
What is Income or Wage Gap in Harrison?
Income or Wage Gap in Harrison is 61.3%.
Women in Harrison earn 38.7 cents for every dollar earned by a man.
What is Family Income Deficit in Harrison?
Family Income Deficit in Harrison is $18,736.
Families that are below poverty line in Harrison earn $18,736 less on average than the poverty threshold level.
What is Inequality or Gini Index in Harrison?
Inequality or Gini Index in Harrison is 0.53.
What is the Total Population of Harrison?
Total Population of Harrison is 28,721.
What is the Total Male Population of Harrison?
Total Male Population of Harrison is 13,453.
What is the Total Female Population of Harrison?
Total Female Population of Harrison is 15,268.
What is the Ratio of Males per 100 Females in Harrison?
There are 88.11 Males per 100 Females in Harrison.
What is the Ratio of Females per 100 Males in Harrison?
There are 113.49 Females per 100 Males in Harrison.
What is the Median Population Age in Harrison?
Median Population Age in Harrison is 35.5 Years.
What is the Average Family Size in Harrison
Average Family Size in Harrison is 3.4 People.
What is the Average Household Size in Harrison
Average Household Size in Harrison is 3.1 People.
How Large is the Labor Force in Harrison?
There are 14,420 People in the Labor Forcein in Harrison.
What is the Percentage of People in the Labor Force in Harrison?
62.7% of People are in the Labor Force in Harrison.
What is the Unemployment Rate in Harrison?
Unemployment Rate in Harrison is 5.3%.