Gainesville, FL Map & Demographics
Gainesville Map
Gainesville Overview
$27,414
PER CAPITA INCOME
$72,147
AVG FAMILY INCOME
$43,783
AVG HOUSEHOLD INCOME
16.3%
WAGE / INCOME GAP [ % ]
83.7¢/ $1
WAGE / INCOME GAP [ $ ]
$10,482
FAMILY INCOME DEFICIT
0.53
INEQUALITY / GINI INDEX
142,414
TOTAL POPULATION
67,984
MALE POPULATION
74,430
FEMALE POPULATION
91.34
MALES / 100 FEMALES
109.48
FEMALES / 100 MALES
26.0
MEDIAN AGE
3.2
AVG FAMILY SIZE
2.3
AVG HOUSEHOLD SIZE
72,229
LABOR FORCE [ PEOPLE ]
57.8%
PERCENT IN LABOR FORCE
5.5%
UNEMPLOYMENT RATE
Gainesville Area Codes
Income in Gainesville
Income Overview in Gainesville
Per Capita Income in Gainesville is $27,414, while median incomes of families and households are $72,147 and $43,783 respectively.
| Characteristic | Number | Measure |
| Per Capita Income | 142,414 | $27,414 |
| Median Family Income | 21,141 | $72,147 |
| Mean Family Income | 21,141 | $99,135 |
| Median Household Income | 55,193 | $43,783 |
| Mean Household Income | 55,193 | $66,377 |
| Income Deficit | 21,141 | $10,482 |
| Wage / Income Gap (%) | 142,414 | 16.27% |
| Wage / Income Gap ($) | 142,414 | 83.73¢ per $1 |
| Gini / Inequality Index | 142,414 | 0.53 |
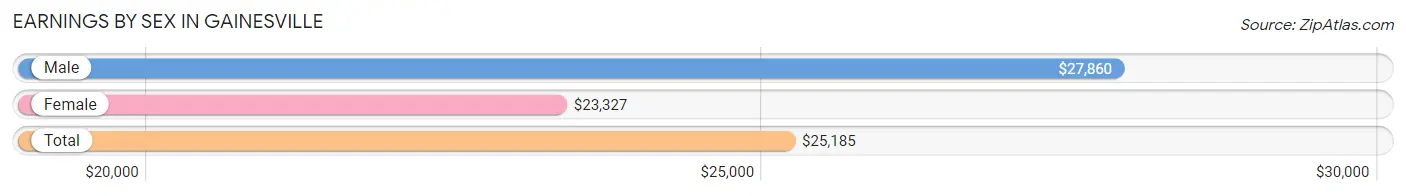
Earnings by Sex in Gainesville
Average Earnings in Gainesville are $25,185, $27,860 for men and $23,327 for women, a difference of 16.3%.
| Sex | Number | Average Earnings |
| Male | 39,559 (48.5%) | $27,860 |
| Female | 42,048 (51.5%) | $23,327 |
| Total | 81,607 (100.0%) | $25,185 |
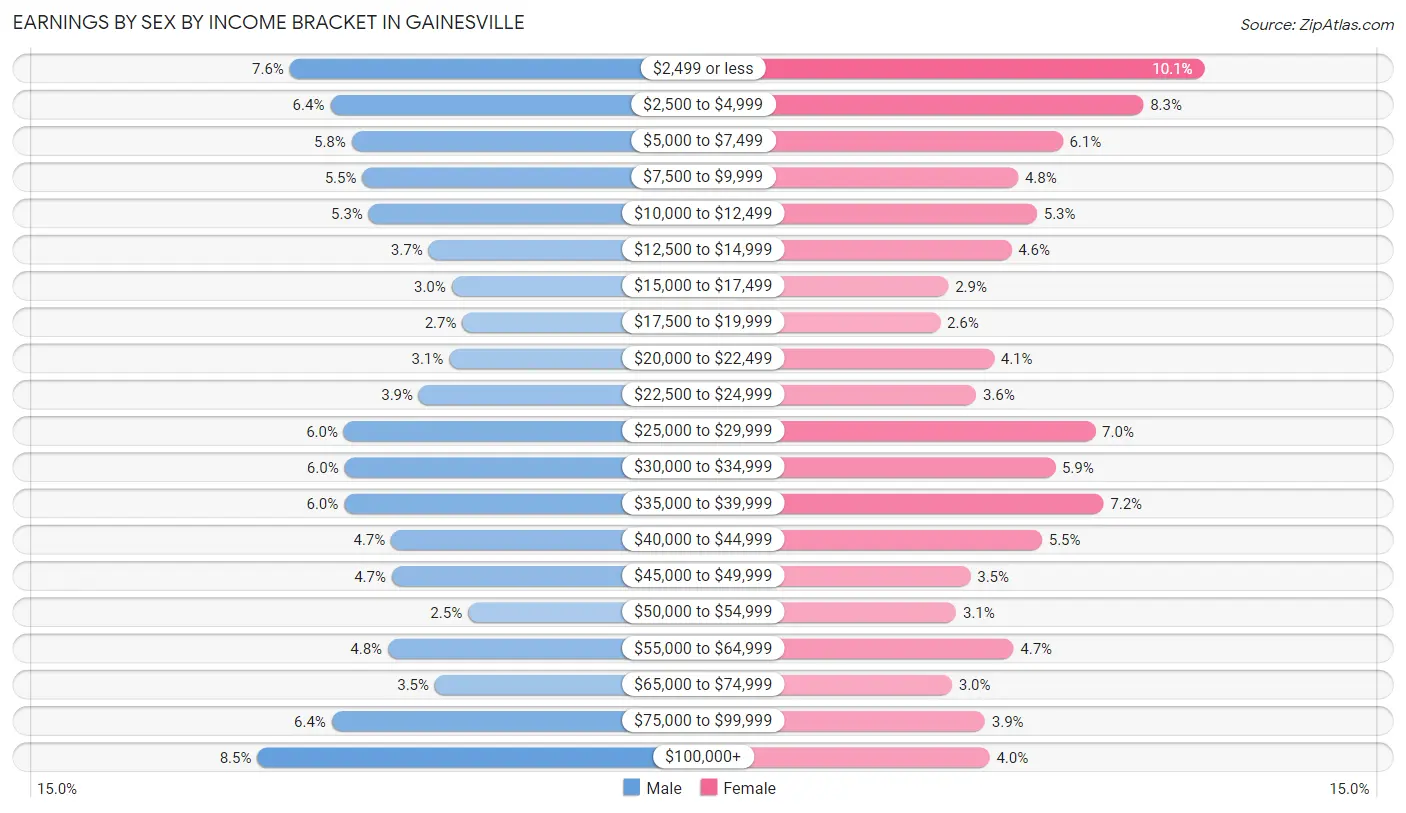
Earnings by Sex by Income Bracket in Gainesville
The most common earnings brackets in Gainesville are $100,000+ for men (3,345 | 8.5%) and $2,499 or less for women (4,224 | 10.1%).
| Income | Male | Female |
| $2,499 or less | 2,985 (7.5%) | 4,224 (10.1%) |
| $2,500 to $4,999 | 2,535 (6.4%) | 3,501 (8.3%) |
| $5,000 to $7,499 | 2,300 (5.8%) | 2,550 (6.1%) |
| $7,500 to $9,999 | 2,178 (5.5%) | 2,021 (4.8%) |
| $10,000 to $12,499 | 2,108 (5.3%) | 2,247 (5.3%) |
| $12,500 to $14,999 | 1,444 (3.6%) | 1,941 (4.6%) |
| $15,000 to $17,499 | 1,185 (3.0%) | 1,197 (2.9%) |
| $17,500 to $19,999 | 1,068 (2.7%) | 1,100 (2.6%) |
| $20,000 to $22,499 | 1,214 (3.1%) | 1,738 (4.1%) |
| $22,500 to $24,999 | 1,549 (3.9%) | 1,526 (3.6%) |
| $25,000 to $29,999 | 2,386 (6.0%) | 2,934 (7.0%) |
| $30,000 to $34,999 | 2,378 (6.0%) | 2,459 (5.9%) |
| $35,000 to $39,999 | 2,383 (6.0%) | 3,032 (7.2%) |
| $40,000 to $44,999 | 1,858 (4.7%) | 2,303 (5.5%) |
| $45,000 to $49,999 | 1,852 (4.7%) | 1,458 (3.5%) |
| $50,000 to $54,999 | 1,006 (2.5%) | 1,292 (3.1%) |
| $55,000 to $64,999 | 1,895 (4.8%) | 1,968 (4.7%) |
| $65,000 to $74,999 | 1,372 (3.5%) | 1,240 (2.9%) |
| $75,000 to $99,999 | 2,518 (6.4%) | 1,632 (3.9%) |
| $100,000+ | 3,345 (8.5%) | 1,685 (4.0%) |
| Total | 39,559 (100.0%) | 42,048 (100.0%) |
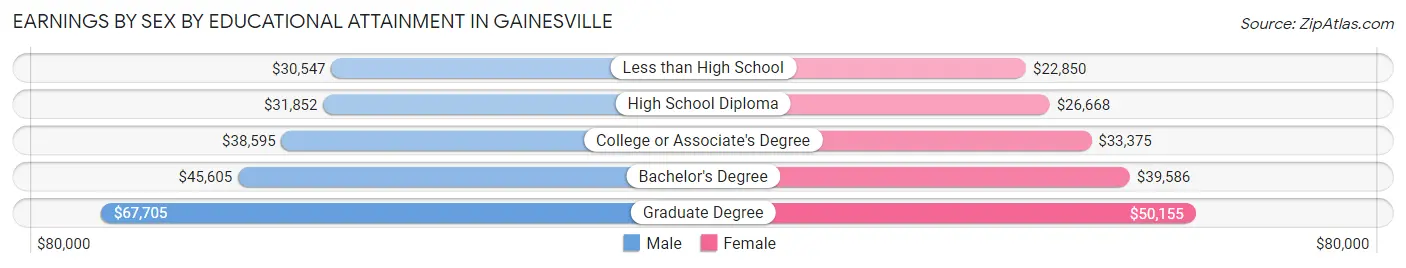
Earnings by Sex by Educational Attainment in Gainesville
Average earnings in Gainesville are $41,699 for men and $37,580 for women, a difference of 9.9%. Men with an educational attainment of graduate degree enjoy the highest average annual earnings of $67,705, while those with less than high school education earn the least with $30,547. Women with an educational attainment of graduate degree earn the most with the average annual earnings of $50,155, while those with less than high school education have the smallest earnings of $22,850.
| Educational Attainment | Male Income | Female Income |
| Less than High School | $30,547 | $22,850 |
| High School Diploma | $31,852 | $26,668 |
| College or Associate's Degree | $38,595 | $33,375 |
| Bachelor's Degree | $45,605 | $39,586 |
| Graduate Degree | $67,705 | $50,155 |
| Total | $41,699 | $37,580 |
Family Income in Gainesville
Family Income Brackets in Gainesville
According to the Gainesville family income data, there are 3,636 families falling into the $100,000 to $149,999 income range, which is the most common income bracket and makes up 17.2% of all families. Conversely, the less than $10,000 income bracket is the least frequent group with only 909 families (4.3%) belonging to this category.
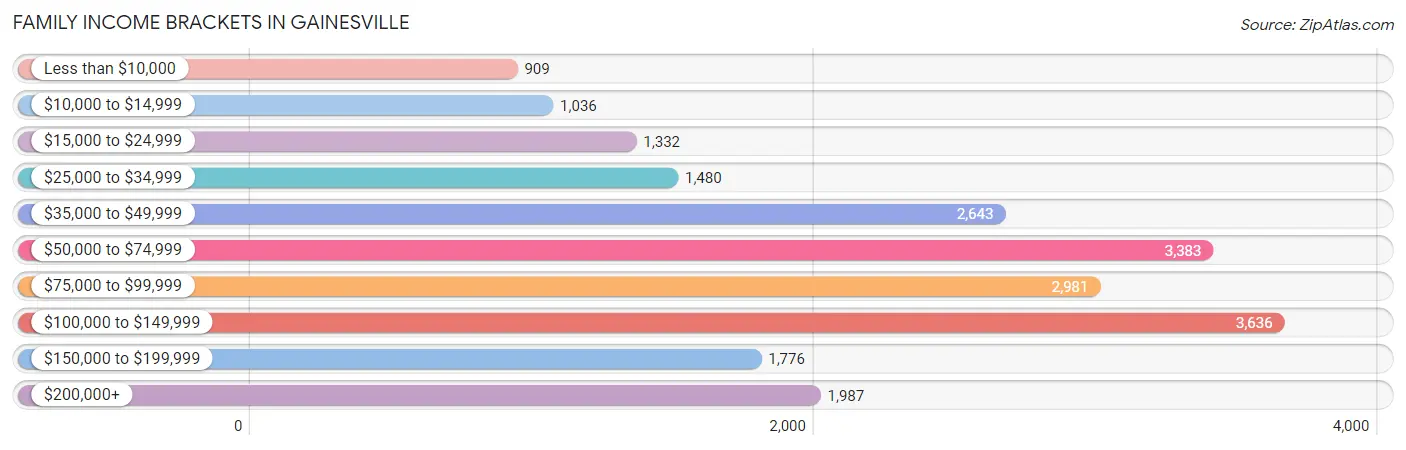
| Income Bracket | # Families | % Families |
| Less than $10,000 | 909 | 4.3% |
| $10,000 to $14,999 | 1,036 | 4.9% |
| $15,000 to $24,999 | 1,332 | 6.3% |
| $25,000 to $34,999 | 1,480 | 7.0% |
| $35,000 to $49,999 | 2,643 | 12.5% |
| $50,000 to $74,999 | 3,383 | 16.0% |
| $75,000 to $99,999 | 2,981 | 14.1% |
| $100,000 to $149,999 | 3,636 | 17.2% |
| $150,000 to $199,999 | 1,776 | 8.4% |
| $200,000+ | 1,987 | 9.4% |
Family Income by Famaliy Size in Gainesville
5-person families (1,095 | 5.2%) account for the highest median family income in Gainesville with $106,806 per family, while 2-person families (11,185 | 52.9%) have the highest median income of $32,700 per family member.
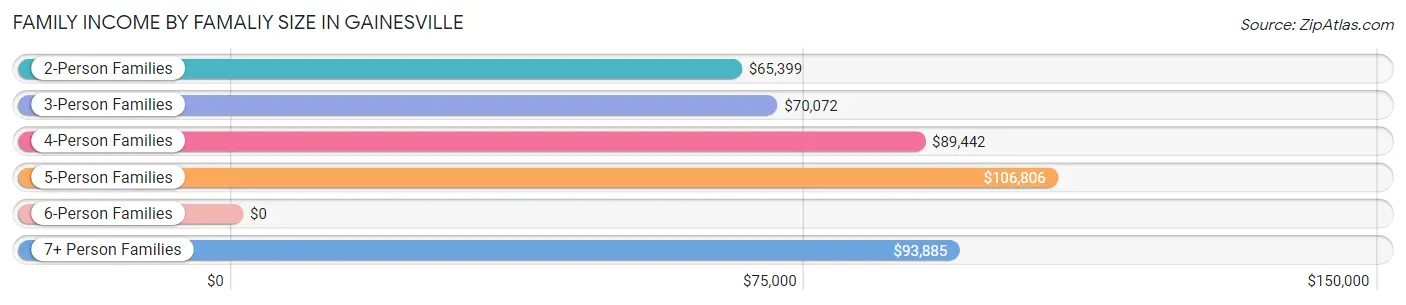
| Income Bracket | # Families | Median Income |
| 2-Person Families | 11,185 (52.9%) | $65,399 |
| 3-Person Families | 5,105 (24.1%) | $70,072 |
| 4-Person Families | 3,204 (15.2%) | $89,442 |
| 5-Person Families | 1,095 (5.2%) | $106,806 |
| 6-Person Families | 245 (1.2%) | $0 |
| 7+ Person Families | 307 (1.5%) | $93,885 |
| Total | 21,141 (100.0%) | $72,147 |
Family Income by Number of Earners in Gainesville
The median family income in Gainesville is $72,147, with families comprising 3+ earners (1,519) having the highest median family income of $122,663, while families with 1 earner (8,053) have the lowest median family income of $48,792, accounting for 7.2% and 38.1% of families, respectively.
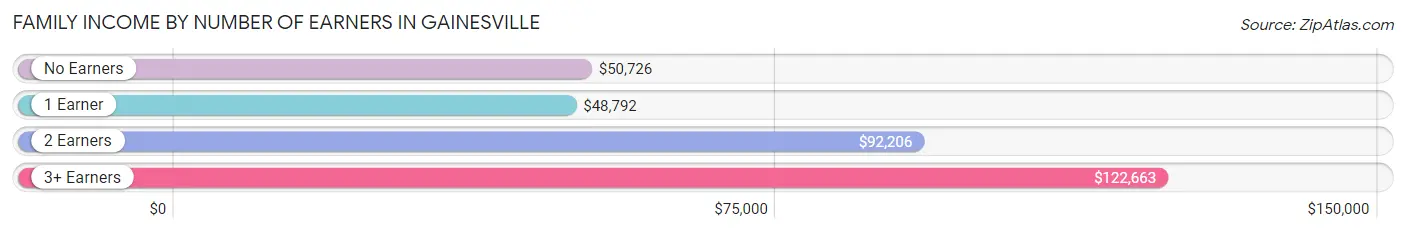
| Number of Earners | # Families | Median Income |
| No Earners | 3,290 (15.6%) | $50,726 |
| 1 Earner | 8,053 (38.1%) | $48,792 |
| 2 Earners | 8,279 (39.2%) | $92,206 |
| 3+ Earners | 1,519 (7.2%) | $122,663 |
| Total | 21,141 (100.0%) | $72,147 |
Household Income in Gainesville
Household Income Brackets in Gainesville
With 8,334 households falling in the category, the $35,000 to $49,999 income range is the most frequent in Gainesville, accounting for 15.1% of all households. In contrast, only 2,428 households (4.4%) fall into the $150,000 to $199,999 income bracket, making it the least populous group.
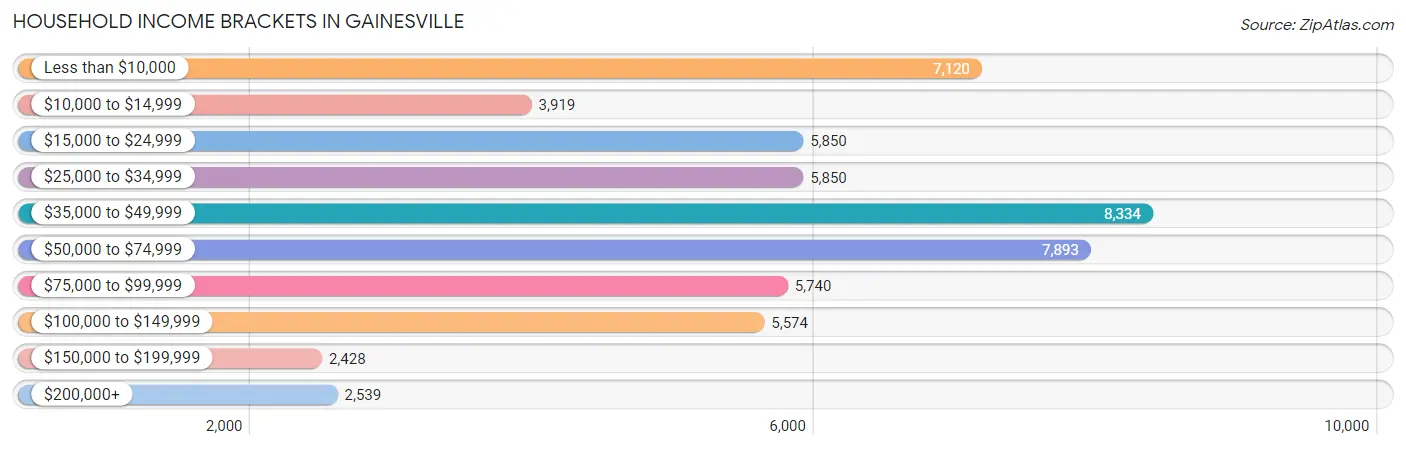
| Income Bracket | # Households | % Households |
| Less than $10,000 | 7,120 | 12.9% |
| $10,000 to $14,999 | 3,919 | 7.1% |
| $15,000 to $24,999 | 5,850 | 10.6% |
| $25,000 to $34,999 | 5,850 | 10.6% |
| $35,000 to $49,999 | 8,334 | 15.1% |
| $50,000 to $74,999 | 7,893 | 14.3% |
| $75,000 to $99,999 | 5,740 | 10.4% |
| $100,000 to $149,999 | 5,574 | 10.1% |
| $150,000 to $199,999 | 2,428 | 4.4% |
| $200,000+ | 2,539 | 4.6% |
Household Income by Householder Age in Gainesville
The median household income in Gainesville is $43,783, with the highest median household income of $60,351 found in the 45 to 64 years age bracket for the primary householder. A total of 12,569 households (22.8%) fall into this category. Meanwhile, the 15 to 24 years age bracket for the primary householder has the lowest median household income of $17,500, with 12,988 households (23.5%) in this group.
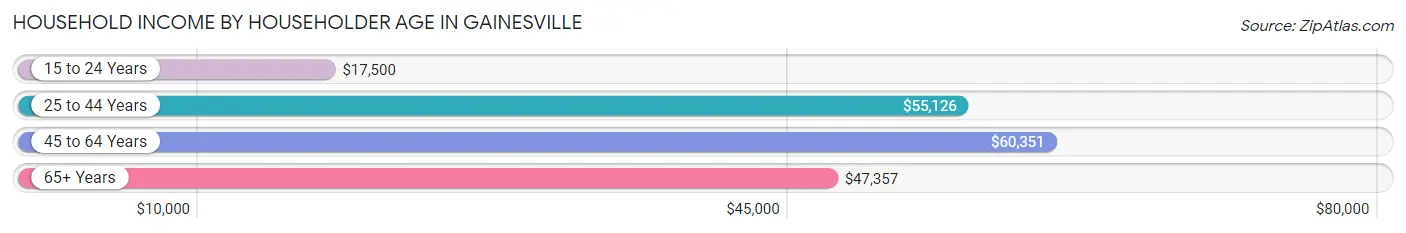
| Income Bracket | # Households | Median Income |
| 15 to 24 Years | 12,988 (23.5%) | $17,500 |
| 25 to 44 Years | 19,893 (36.0%) | $55,126 |
| 45 to 64 Years | 12,569 (22.8%) | $60,351 |
| 65+ Years | 9,743 (17.6%) | $47,357 |
| Total | 55,193 (100.0%) | $43,783 |
Poverty in Gainesville
Income Below Poverty by Sex and Age in Gainesville
With 28.1% poverty level for males and 29.8% for females among the residents of Gainesville, 18 to 24 year old males and 18 to 24 year old females are the most vulnerable to poverty, with 10,353 males (60.7%) and 11,435 females (61.9%) in their respective age groups living below the poverty level.
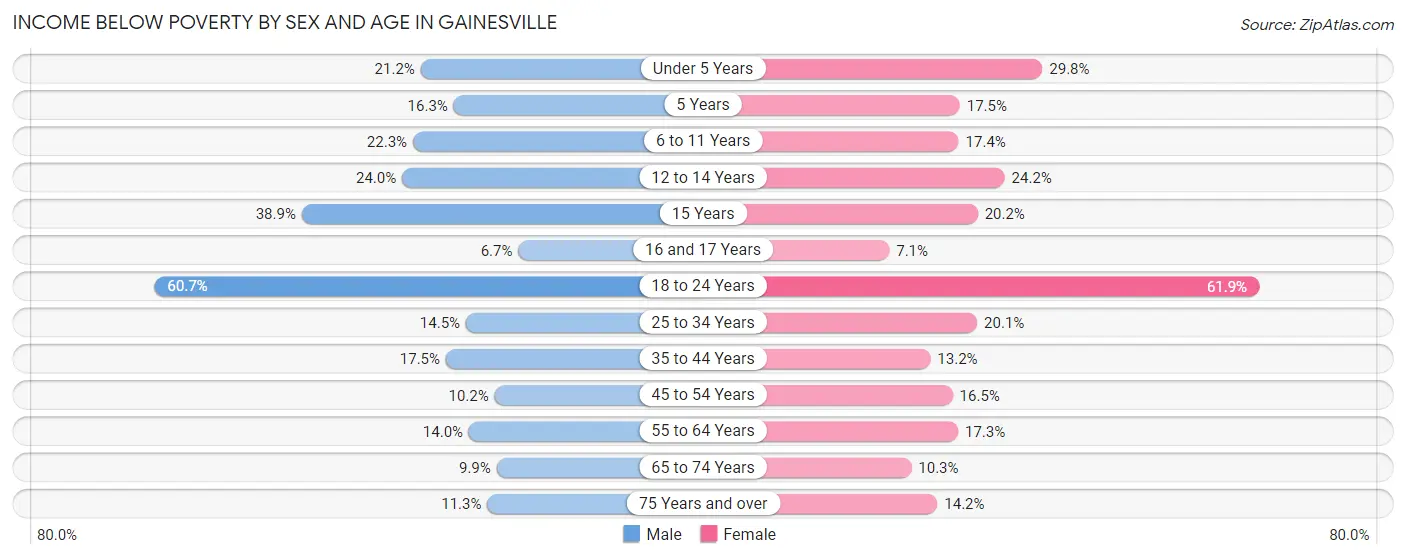
| Age Bracket | Male | Female |
| Under 5 Years | 595 (21.2%) | 897 (29.8%) |
| 5 Years | 107 (16.3%) | 82 (17.5%) |
| 6 to 11 Years | 704 (22.3%) | 488 (17.3%) |
| 12 to 14 Years | 451 (23.9%) | 317 (24.2%) |
| 15 Years | 263 (38.9%) | 92 (20.2%) |
| 16 and 17 Years | 60 (6.7%) | 56 (7.0%) |
| 18 to 24 Years | 10,353 (60.7%) | 11,435 (61.9%) |
| 25 to 34 Years | 1,729 (14.5%) | 2,513 (20.1%) |
| 35 to 44 Years | 1,250 (17.4%) | 786 (13.2%) |
| 45 to 54 Years | 447 (10.2%) | 848 (16.5%) |
| 55 to 64 Years | 667 (14.0%) | 985 (17.3%) |
| 65 to 74 Years | 363 (9.9%) | 555 (10.3%) |
| 75 Years and over | 251 (11.3%) | 499 (14.2%) |
| Total | 17,240 (28.1%) | 19,553 (29.8%) |
Income Above Poverty by Sex and Age in Gainesville
According to the poverty statistics in Gainesville, males aged 16 and 17 years and females aged 16 and 17 years are the age groups that are most secure financially, with 93.3% of males and 92.9% of females in these age groups living above the poverty line.
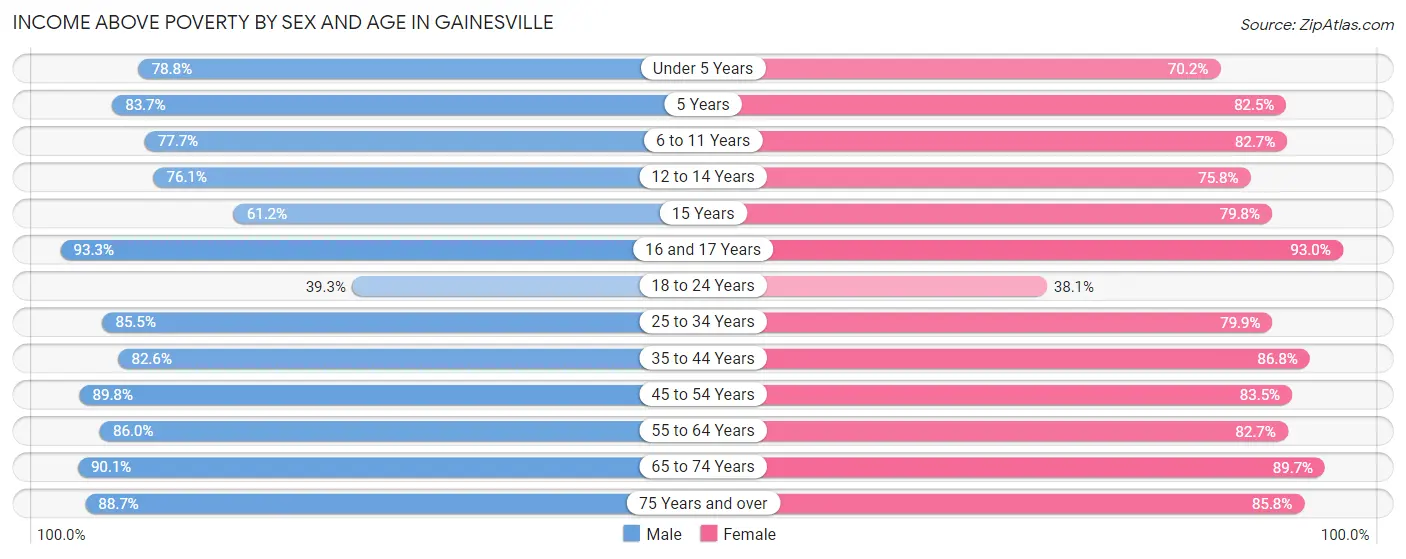
| Age Bracket | Male | Female |
| Under 5 Years | 2,213 (78.8%) | 2,115 (70.2%) |
| 5 Years | 550 (83.7%) | 386 (82.5%) |
| 6 to 11 Years | 2,447 (77.7%) | 2,324 (82.7%) |
| 12 to 14 Years | 1,432 (76.0%) | 994 (75.8%) |
| 15 Years | 414 (61.2%) | 364 (79.8%) |
| 16 and 17 Years | 837 (93.3%) | 738 (92.9%) |
| 18 to 24 Years | 6,698 (39.3%) | 7,027 (38.1%) |
| 25 to 34 Years | 10,221 (85.5%) | 9,990 (79.9%) |
| 35 to 44 Years | 5,915 (82.6%) | 5,185 (86.8%) |
| 45 to 54 Years | 3,928 (89.8%) | 4,305 (83.5%) |
| 55 to 64 Years | 4,090 (86.0%) | 4,722 (82.7%) |
| 65 to 74 Years | 3,300 (90.1%) | 4,819 (89.7%) |
| 75 Years and over | 1,973 (88.7%) | 3,017 (85.8%) |
| Total | 44,018 (71.9%) | 45,986 (70.2%) |
Income Below Poverty Among Married-Couple Families in Gainesville
The poverty statistics for married-couple families in Gainesville show that 4.0% or 532 of the total 13,462 families live below the poverty line. Families with 3 or 4 children have the highest poverty rate of 5.8%, comprising of 41 families. On the other hand, families with 5 or more children have the lowest poverty rate of 0.0%, which includes 0 families.
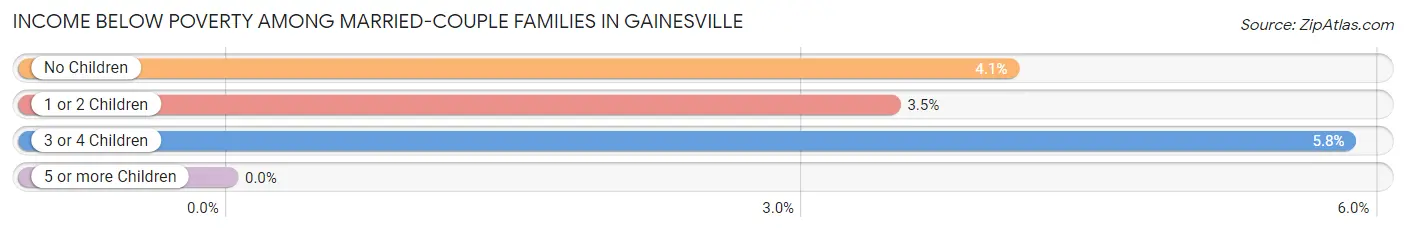
| Children | Above Poverty | Below Poverty |
| No Children | 8,110 (95.9%) | 345 (4.1%) |
| 1 or 2 Children | 4,069 (96.5%) | 146 (3.5%) |
| 3 or 4 Children | 661 (94.2%) | 41 (5.8%) |
| 5 or more Children | 90 (100.0%) | 0 (0.0%) |
| Total | 12,930 (96.1%) | 532 (4.0%) |
Income Below Poverty Among Single-Parent Households in Gainesville
According to the poverty data in Gainesville, 22.7% or 417 single-father households and 30.6% or 1,789 single-mother households are living below the poverty line. Among single-father households, those with no children have the highest poverty rate, with 332 households (34.8%) experiencing poverty. Likewise, among single-mother households, those with 3 or 4 children have the highest poverty rate, with 343 households (65.0%) falling below the poverty line.
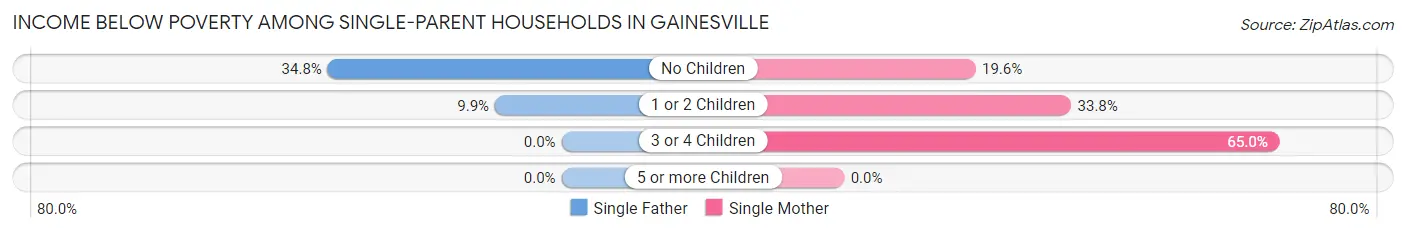
| Children | Single Father | Single Mother |
| No Children | 332 (34.8%) | 450 (19.6%) |
| 1 or 2 Children | 85 (9.9%) | 996 (33.8%) |
| 3 or 4 Children | 0 (0.0%) | 343 (65.0%) |
| 5 or more Children | 0 (0.0%) | 0 (0.0%) |
| Total | 417 (22.7%) | 1,789 (30.6%) |
Income Below Poverty Among Married-Couple vs Single-Parent Households in Gainesville
The poverty data for Gainesville shows that 532 of the married-couple family households (4.0%) and 2,206 of the single-parent households (28.7%) are living below the poverty level. Within the married-couple family households, those with 3 or 4 children have the highest poverty rate, with 41 households (5.8%) falling below the poverty line. Among the single-parent households, those with 3 or 4 children have the highest poverty rate, with 343 household (62.3%) living below poverty.
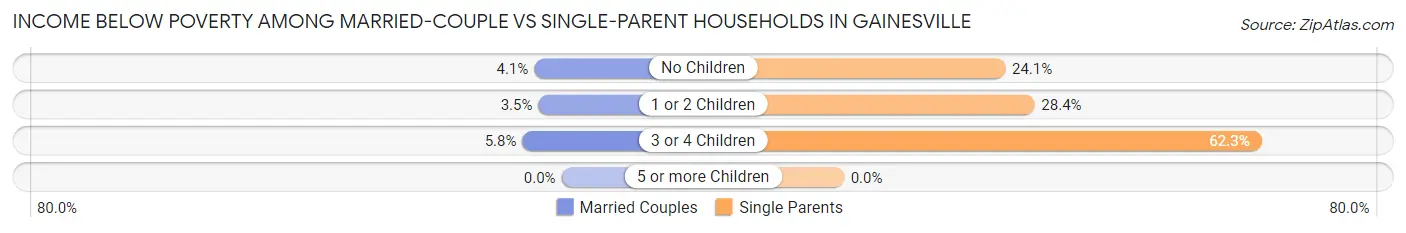
| Children | Married-Couple Families | Single-Parent Households |
| No Children | 345 (4.1%) | 782 (24.0%) |
| 1 or 2 Children | 146 (3.5%) | 1,081 (28.4%) |
| 3 or 4 Children | 41 (5.8%) | 343 (62.3%) |
| 5 or more Children | 0 (0.0%) | 0 (0.0%) |
| Total | 532 (4.0%) | 2,206 (28.7%) |
Race in Gainesville
The most populous races in Gainesville are White / Caucasian (87,442 | 61.4%), Black / African American (31,182 | 21.9%), and Hispanic or Latino (17,171 | 12.1%).
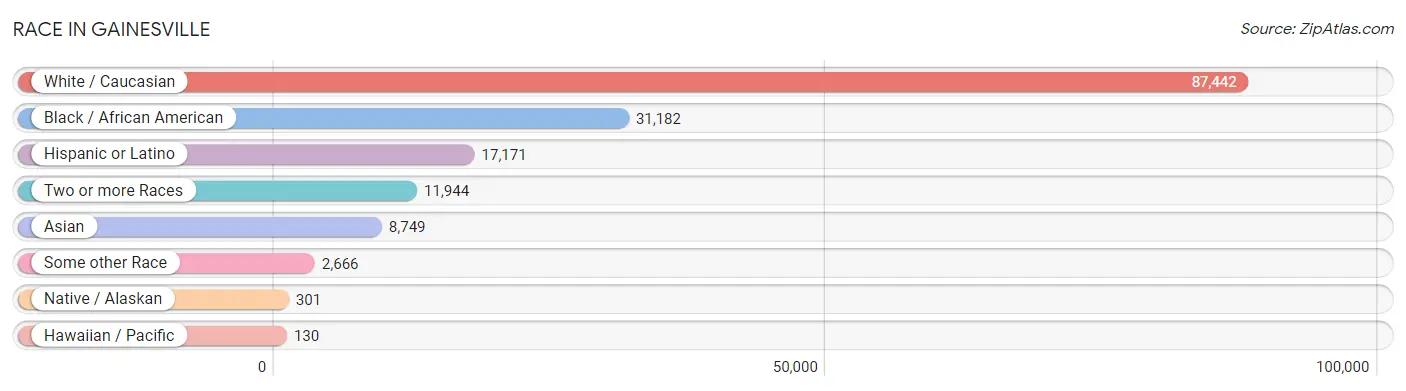
| Race | # Population | % Population |
| Asian | 8,749 | 6.1% |
| Black / African American | 31,182 | 21.9% |
| Hawaiian / Pacific | 130 | 0.1% |
| Hispanic or Latino | 17,171 | 12.1% |
| Native / Alaskan | 301 | 0.2% |
| White / Caucasian | 87,442 | 61.4% |
| Two or more Races | 11,944 | 8.4% |
| Some other Race | 2,666 | 1.9% |
| Total | 142,414 | 100.0% |
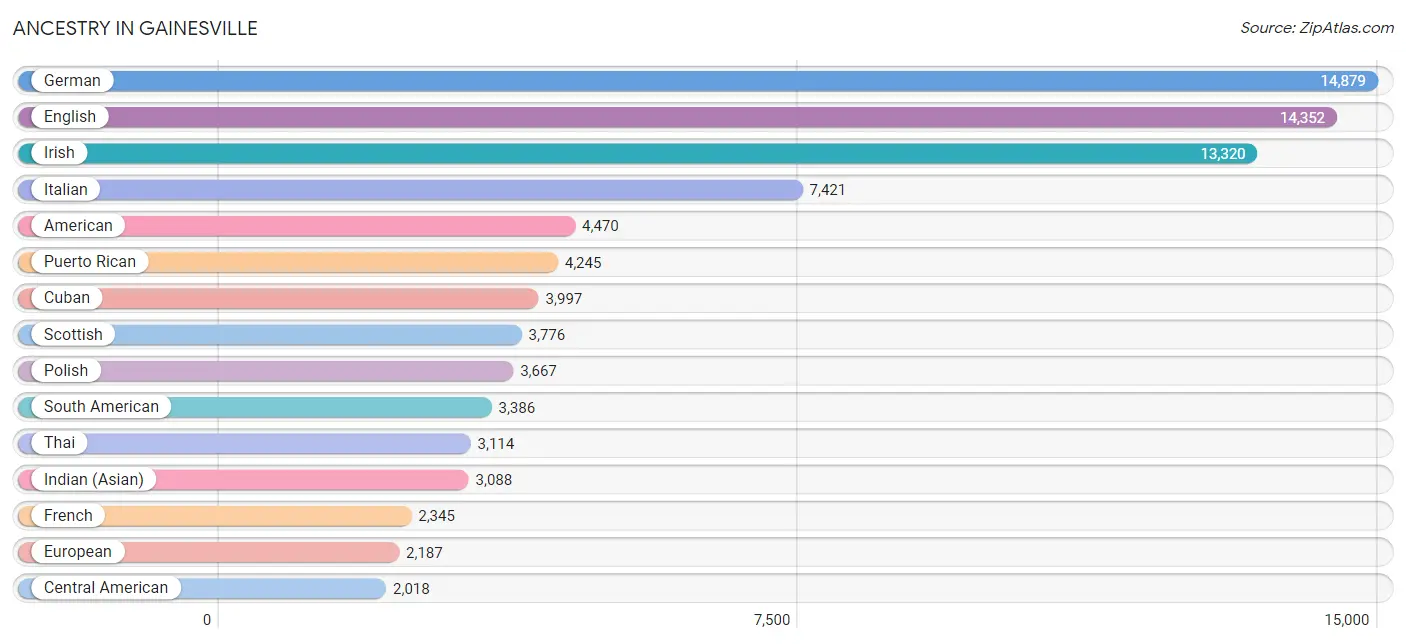
Ancestry in Gainesville
The most populous ancestries reported in Gainesville are German (14,879 | 10.4%), English (14,352 | 10.1%), Irish (13,320 | 9.3%), Italian (7,421 | 5.2%), and American (4,470 | 3.1%), together accounting for 38.2% of all Gainesville residents.
| Ancestry | # Population | % Population |
| Afghan | 4 | 0.0% |
| African | 766 | 0.5% |
| Albanian | 368 | 0.3% |
| American | 4,470 | 3.1% |
| Arab | 1,810 | 1.3% |
| Argentinean | 379 | 0.3% |
| Armenian | 104 | 0.1% |
| Australian | 57 | 0.0% |
| Austrian | 283 | 0.2% |
| Bahamian | 213 | 0.2% |
| Belgian | 219 | 0.2% |
| Bhutanese | 429 | 0.3% |
| Blackfeet | 58 | 0.0% |
| Bolivian | 38 | 0.0% |
| Brazilian | 707 | 0.5% |
| British | 1,190 | 0.8% |
| Bulgarian | 132 | 0.1% |
| Burmese | 893 | 0.6% |
| Cajun | 9 | 0.0% |
| Canadian | 390 | 0.3% |
| Cape Verdean | 4 | 0.0% |
| Celtic | 12 | 0.0% |
| Central American | 2,018 | 1.4% |
| Central American Indian | 133 | 0.1% |
| Cherokee | 380 | 0.3% |
| Chickasaw | 60 | 0.0% |
| Chilean | 79 | 0.1% |
| Chippewa | 46 | 0.0% |
| Choctaw | 117 | 0.1% |
| Colombian | 1,061 | 0.7% |
| Costa Rican | 232 | 0.2% |
| Creek | 23 | 0.0% |
| Croatian | 55 | 0.0% |
| Cuban | 3,997 | 2.8% |
| Czech | 309 | 0.2% |
| Czechoslovakian | 79 | 0.1% |
| Danish | 331 | 0.2% |
| Dominican | 545 | 0.4% |
| Dutch | 1,051 | 0.7% |
| Eastern European | 605 | 0.4% |
| Ecuadorian | 302 | 0.2% |
| Egyptian | 571 | 0.4% |
| English | 14,352 | 10.1% |
| Ethiopian | 74 | 0.1% |
| European | 2,187 | 1.5% |
| Filipino | 129 | 0.1% |
| Finnish | 187 | 0.1% |
| French | 2,345 | 1.7% |
| French Canadian | 750 | 0.5% |
| German | 14,879 | 10.4% |
| German Russian | 9 | 0.0% |
| Ghanaian | 12 | 0.0% |
| Greek | 577 | 0.4% |
| Guamanian / Chamorro | 73 | 0.1% |
| Guatemalan | 157 | 0.1% |
| Guyanese | 146 | 0.1% |
| Haitian | 549 | 0.4% |
| Honduran | 529 | 0.4% |
| Hungarian | 633 | 0.4% |
| Indian (Asian) | 3,088 | 2.2% |
| Indonesian | 115 | 0.1% |
| Iranian | 429 | 0.3% |
| Iraqi | 71 | 0.1% |
| Irish | 13,320 | 9.3% |
| Iroquois | 46 | 0.0% |
| Israeli | 137 | 0.1% |
| Italian | 7,421 | 5.2% |
| Jamaican | 964 | 0.7% |
| Japanese | 22 | 0.0% |
| Jordanian | 17 | 0.0% |
| Kenyan | 105 | 0.1% |
| Korean | 1,946 | 1.4% |
| Laotian | 197 | 0.1% |
| Latvian | 61 | 0.0% |
| Lebanese | 265 | 0.2% |
| Lithuanian | 282 | 0.2% |
| Lumbee | 29 | 0.0% |
| Luxembourger | 46 | 0.0% |
| Macedonian | 19 | 0.0% |
| Mexican | 1,593 | 1.1% |
| Mexican American Indian | 168 | 0.1% |
| Mongolian | 7 | 0.0% |
| Native Hawaiian | 181 | 0.1% |
| Navajo | 8 | 0.0% |
| New Zealander | 4 | 0.0% |
| Nicaraguan | 396 | 0.3% |
| Nigerian | 78 | 0.1% |
| Northern European | 249 | 0.2% |
| Norwegian | 1,190 | 0.8% |
| Palestinian | 121 | 0.1% |
| Panamanian | 178 | 0.1% |
| Pennsylvania German | 74 | 0.1% |
| Peruvian | 303 | 0.2% |
| Polish | 3,667 | 2.6% |
| Portuguese | 441 | 0.3% |
| Potawatomi | 35 | 0.0% |
| Pueblo | 9 | 0.0% |
| Puerto Rican | 4,245 | 3.0% |
| Puget Sound Salish | 6 | 0.0% |
| Romanian | 173 | 0.1% |
| Russian | 1,348 | 0.9% |
| Salvadoran | 526 | 0.4% |
| Samoan | 22 | 0.0% |
| Scandinavian | 420 | 0.3% |
| Scotch-Irish | 1,329 | 0.9% |
| Scottish | 3,776 | 2.6% |
| Seminole | 22 | 0.0% |
| Serbian | 49 | 0.0% |
| Sioux | 2 | 0.0% |
| Slavic | 12 | 0.0% |
| Slovak | 66 | 0.1% |
| Slovene | 417 | 0.3% |
| South African | 115 | 0.1% |
| South American | 3,386 | 2.4% |
| South American Indian | 100 | 0.1% |
| Spaniard | 789 | 0.5% |
| Spanish | 237 | 0.2% |
| Spanish American | 14 | 0.0% |
| Sri Lankan | 1,148 | 0.8% |
| Subsaharan African | 1,227 | 0.9% |
| Swedish | 1,413 | 1.0% |
| Swiss | 224 | 0.2% |
| Syrian | 170 | 0.1% |
| Thai | 3,114 | 2.2% |
| Tongan | 60 | 0.0% |
| Trinidadian and Tobagonian | 238 | 0.2% |
| Turkish | 187 | 0.1% |
| U.S. Virgin Islander | 75 | 0.1% |
| Ukrainian | 372 | 0.3% |
| Uruguayan | 37 | 0.0% |
| Venezuelan | 1,122 | 0.8% |
| Vietnamese | 141 | 0.1% |
| Welsh | 1,092 | 0.8% |
| West Indian | 165 | 0.1% |
| Yugoslavian | 131 | 0.1% | View All 135 Rows |
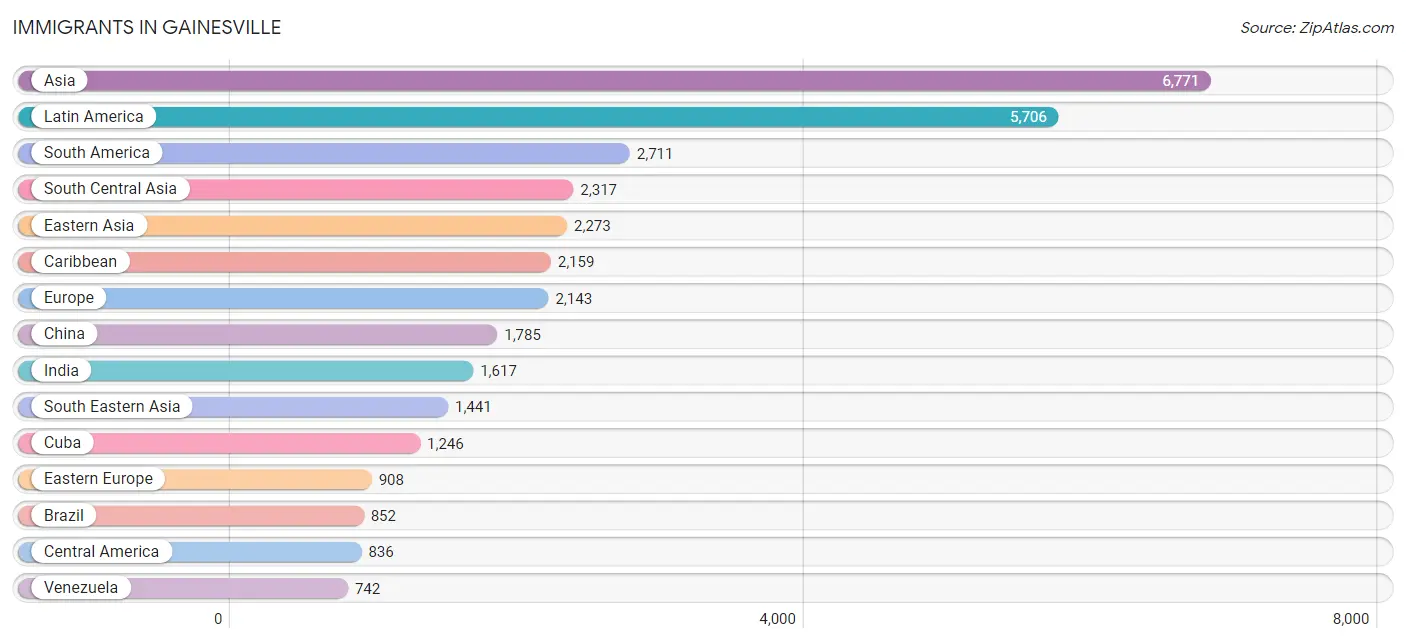
Immigrants in Gainesville
The most numerous immigrant groups reported in Gainesville came from Asia (6,771 | 4.8%), Latin America (5,706 | 4.0%), South America (2,711 | 1.9%), South Central Asia (2,317 | 1.6%), and Eastern Asia (2,273 | 1.6%), together accounting for 13.9% of all Gainesville residents.
| Immigration Origin | # Population | % Population |
| Africa | 611 | 0.4% |
| Albania | 282 | 0.2% |
| Argentina | 261 | 0.2% |
| Asia | 6,771 | 4.8% |
| Bahamas | 49 | 0.0% |
| Bangladesh | 198 | 0.1% |
| Belgium | 141 | 0.1% |
| Bolivia | 14 | 0.0% |
| Bosnia and Herzegovina | 3 | 0.0% |
| Brazil | 852 | 0.6% |
| Bulgaria | 45 | 0.0% |
| Cameroon | 56 | 0.0% |
| Canada | 613 | 0.4% |
| Caribbean | 2,159 | 1.5% |
| Central America | 836 | 0.6% |
| Chile | 21 | 0.0% |
| China | 1,785 | 1.3% |
| Colombia | 523 | 0.4% |
| Costa Rica | 39 | 0.0% |
| Cuba | 1,246 | 0.9% |
| Czechoslovakia | 31 | 0.0% |
| Dominica | 15 | 0.0% |
| Dominican Republic | 77 | 0.1% |
| Eastern Africa | 69 | 0.1% |
| Eastern Asia | 2,273 | 1.6% |
| Eastern Europe | 908 | 0.6% |
| Ecuador | 113 | 0.1% |
| Egypt | 105 | 0.1% |
| El Salvador | 170 | 0.1% |
| England | 57 | 0.0% |
| Ethiopia | 39 | 0.0% |
| Europe | 2,143 | 1.5% |
| France | 198 | 0.1% |
| Germany | 175 | 0.1% |
| Ghana | 12 | 0.0% |
| Greece | 5 | 0.0% |
| Guatemala | 144 | 0.1% |
| Guyana | 60 | 0.0% |
| Haiti | 310 | 0.2% |
| Honduras | 100 | 0.1% |
| Hong Kong | 63 | 0.0% |
| India | 1,617 | 1.1% |
| Indonesia | 163 | 0.1% |
| Iran | 395 | 0.3% |
| Iraq | 78 | 0.1% |
| Ireland | 106 | 0.1% |
| Israel | 109 | 0.1% |
| Italy | 82 | 0.1% |
| Jamaica | 283 | 0.2% |
| Japan | 41 | 0.0% |
| Jordan | 45 | 0.0% |
| Kenya | 17 | 0.0% |
| Korea | 447 | 0.3% |
| Laos | 12 | 0.0% |
| Latin America | 5,706 | 4.0% |
| Latvia | 8 | 0.0% |
| Lebanon | 22 | 0.0% |
| Malaysia | 87 | 0.1% |
| Mexico | 304 | 0.2% |
| Middle Africa | 108 | 0.1% |
| Morocco | 17 | 0.0% |
| Nepal | 47 | 0.0% |
| Nicaragua | 61 | 0.0% |
| Nigeria | 43 | 0.0% |
| Northern Africa | 122 | 0.1% |
| Northern Europe | 390 | 0.3% |
| Norway | 37 | 0.0% |
| Oceania | 68 | 0.1% |
| Pakistan | 42 | 0.0% |
| Panama | 18 | 0.0% |
| Peru | 104 | 0.1% |
| Philippines | 587 | 0.4% |
| Poland | 94 | 0.1% |
| Portugal | 3 | 0.0% |
| Romania | 16 | 0.0% |
| Russia | 193 | 0.1% |
| Saudi Arabia | 248 | 0.2% |
| Scotland | 27 | 0.0% |
| Serbia | 6 | 0.0% |
| Singapore | 36 | 0.0% |
| South Africa | 119 | 0.1% |
| South America | 2,711 | 1.9% |
| South Central Asia | 2,317 | 1.6% |
| South Eastern Asia | 1,441 | 1.0% |
| Southern Europe | 314 | 0.2% |
| Spain | 224 | 0.2% |
| Sri Lanka | 18 | 0.0% |
| Sweden | 10 | 0.0% |
| Switzerland | 17 | 0.0% |
| Taiwan | 102 | 0.1% |
| Thailand | 33 | 0.0% |
| Trinidad and Tobago | 166 | 0.1% |
| Turkey | 57 | 0.0% |
| Ukraine | 60 | 0.0% |
| Uruguay | 21 | 0.0% |
| Venezuela | 742 | 0.5% |
| Vietnam | 523 | 0.4% |
| Western Africa | 151 | 0.1% |
| Western Asia | 654 | 0.5% |
| Western Europe | 531 | 0.4% |
| Yemen | 81 | 0.1% |
| Zaire | 52 | 0.0% | View All 102 Rows |
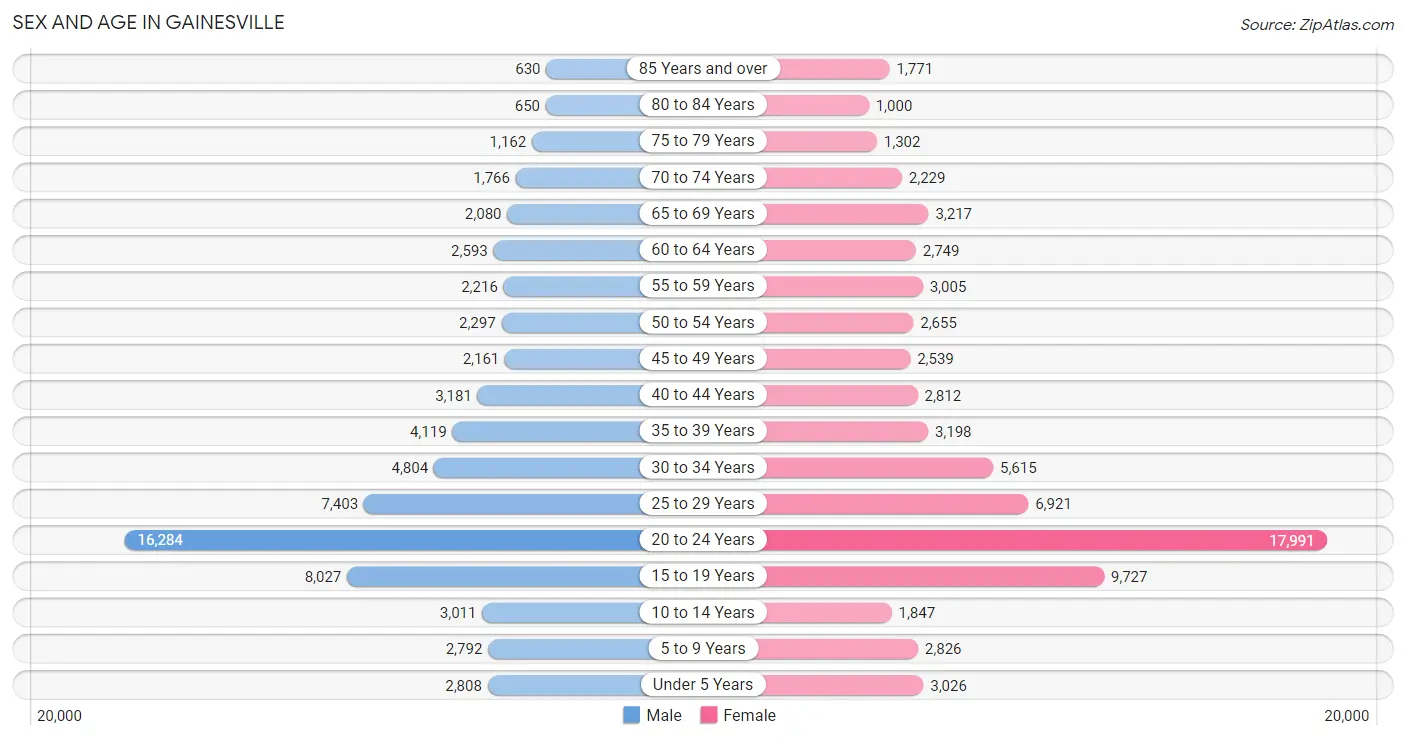
Sex and Age in Gainesville
Sex and Age in Gainesville
The most populous age groups in Gainesville are 20 to 24 Years (16,284 | 23.9%) for men and 20 to 24 Years (17,991 | 24.2%) for women.
| Age Bracket | Male | Female |
| Under 5 Years | 2,808 (4.1%) | 3,026 (4.1%) |
| 5 to 9 Years | 2,792 (4.1%) | 2,826 (3.8%) |
| 10 to 14 Years | 3,011 (4.4%) | 1,847 (2.5%) |
| 15 to 19 Years | 8,027 (11.8%) | 9,727 (13.1%) |
| 20 to 24 Years | 16,284 (23.9%) | 17,991 (24.2%) |
| 25 to 29 Years | 7,403 (10.9%) | 6,921 (9.3%) |
| 30 to 34 Years | 4,804 (7.1%) | 5,615 (7.5%) |
| 35 to 39 Years | 4,119 (6.1%) | 3,198 (4.3%) |
| 40 to 44 Years | 3,181 (4.7%) | 2,812 (3.8%) |
| 45 to 49 Years | 2,161 (3.2%) | 2,539 (3.4%) |
| 50 to 54 Years | 2,297 (3.4%) | 2,655 (3.6%) |
| 55 to 59 Years | 2,216 (3.3%) | 3,005 (4.0%) |
| 60 to 64 Years | 2,593 (3.8%) | 2,749 (3.7%) |
| 65 to 69 Years | 2,080 (3.1%) | 3,217 (4.3%) |
| 70 to 74 Years | 1,766 (2.6%) | 2,229 (3.0%) |
| 75 to 79 Years | 1,162 (1.7%) | 1,302 (1.8%) |
| 80 to 84 Years | 650 (1.0%) | 1,000 (1.3%) |
| 85 Years and over | 630 (0.9%) | 1,771 (2.4%) |
| Total | 67,984 (100.0%) | 74,430 (100.0%) |
Families and Households in Gainesville
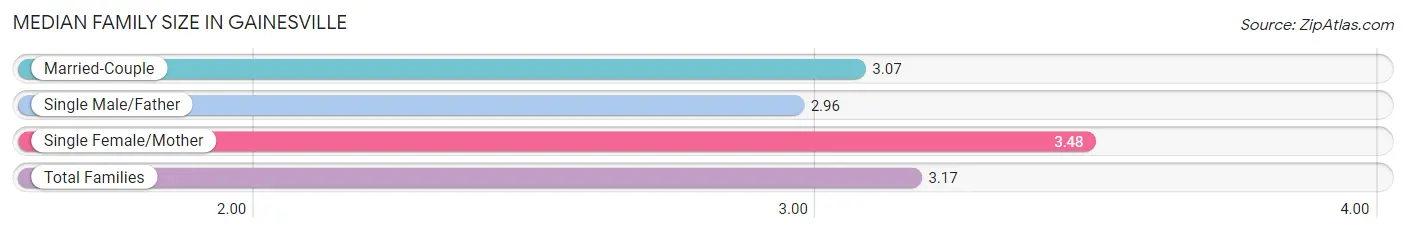
Median Family Size in Gainesville
The median family size in Gainesville is 3.17 persons per family, with single female/mother families (5,845 | 27.7%) accounting for the largest median family size of 3.48 persons per family. On the other hand, single male/father families (1,834 | 8.7%) represent the smallest median family size with 2.96 persons per family.
| Family Type | # Families | Family Size |
| Married-Couple | 13,462 (63.7%) | 3.07 |
| Single Male/Father | 1,834 (8.7%) | 2.96 |
| Single Female/Mother | 5,845 (27.7%) | 3.48 |
| Total Families | 21,141 (100.0%) | 3.17 |
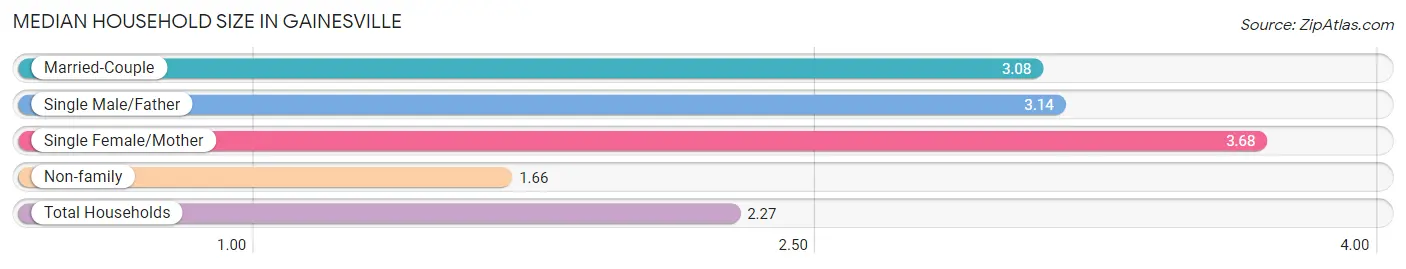
Median Household Size in Gainesville
The median household size in Gainesville is 2.27 persons per household, with single female/mother households (5,845 | 10.6%) accounting for the largest median household size of 3.68 persons per household. non-family households (34,052 | 61.7%) represent the smallest median household size with 1.66 persons per household.
| Household Type | # Households | Household Size |
| Married-Couple | 13,462 (24.4%) | 3.08 |
| Single Male/Father | 1,834 (3.3%) | 3.14 |
| Single Female/Mother | 5,845 (10.6%) | 3.68 |
| Non-family | 34,052 (61.7%) | 1.66 |
| Total Households | 55,193 (100.0%) | 2.27 |
Household Size by Marriage Status in Gainesville
Out of a total of 55,193 households in Gainesville, 21,141 (38.3%) are family households, while 34,052 (61.7%) are nonfamily households. The most numerous type of family households are 2-person households, comprising 10,331, and the most common type of nonfamily households are 1-person households, comprising 21,989.
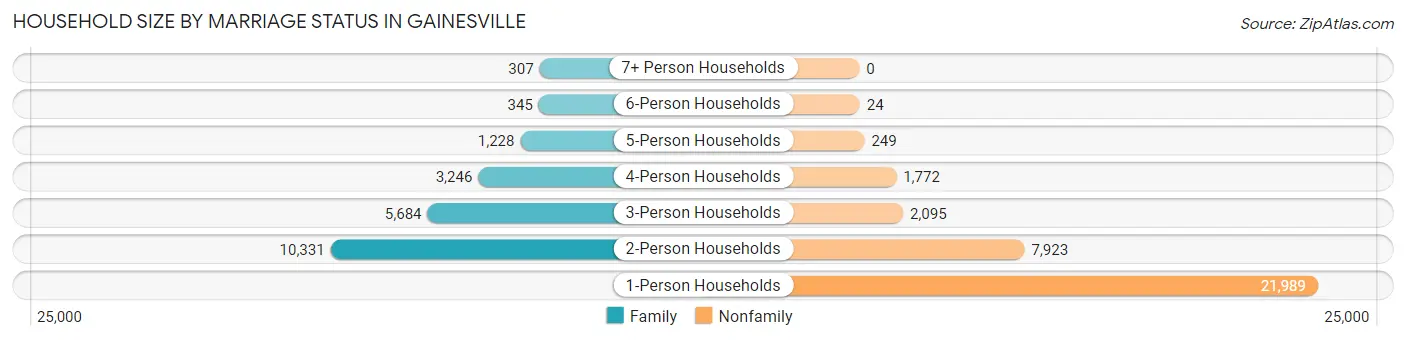
| Household Size | Family Households | Nonfamily Households |
| 1-Person Households | - | 21,989 (39.8%) |
| 2-Person Households | 10,331 (18.7%) | 7,923 (14.4%) |
| 3-Person Households | 5,684 (10.3%) | 2,095 (3.8%) |
| 4-Person Households | 3,246 (5.9%) | 1,772 (3.2%) |
| 5-Person Households | 1,228 (2.2%) | 249 (0.4%) |
| 6-Person Households | 345 (0.6%) | 24 (0.0%) |
| 7+ Person Households | 307 (0.6%) | 0 (0.0%) |
| Total | 21,141 (38.3%) | 34,052 (61.7%) |
Female Fertility in Gainesville
Fertility by Age in Gainesville
Average fertility rate in Gainesville is 17.0 births per 1,000 women. Women in the age bracket of 35 to 50 years have the highest fertility rate with 26.0 births per 1,000 women. Women in the age bracket of 20 to 34 years acount for 72.5% of all women with births.
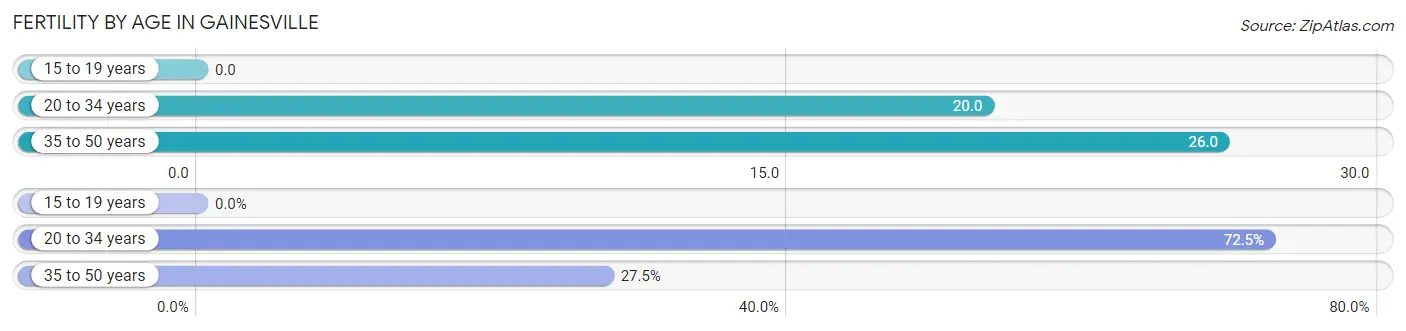
| Age Bracket | Women with Births | Births / 1,000 Women |
| 15 to 19 years | 0 (0.0%) | 0.0 |
| 20 to 34 years | 616 (72.5%) | 20.0 |
| 35 to 50 years | 234 (27.5%) | 26.0 |
| Total | 850 (100.0%) | 17.0 |
Fertility by Age by Marriage Status in Gainesville
61.3% of women with births (850) in Gainesville are married. The highest percentage of unmarried women with births falls into 20 to 34 years age bracket with 51.9% of them unmarried at the time of birth, while the lowest percentage of unmarried women with births belong to 35 to 50 years age bracket with 3.8% of them unmarried.
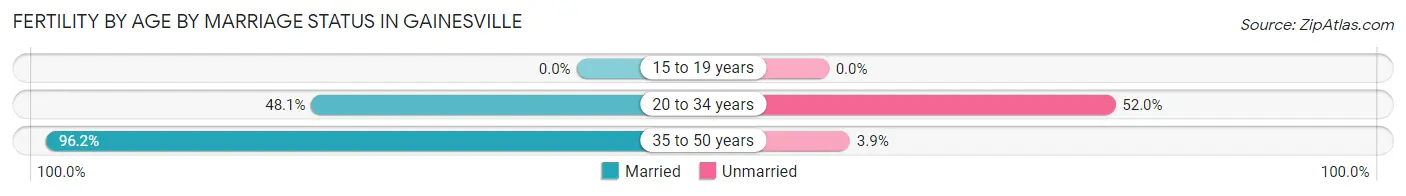
| Age Bracket | Married | Unmarried |
| 15 to 19 years | 0 (0.0%) | 0 (0.0%) |
| 20 to 34 years | 296 (48.0%) | 320 (51.9%) |
| 35 to 50 years | 225 (96.2%) | 9 (3.8%) |
| Total | 521 (61.3%) | 329 (38.7%) |
Fertility by Education in Gainesville
Average fertility rate in Gainesville is 17.0 births per 1,000 women. Women with the education attainment of graduate degree have the highest fertility rate of 33.0 births per 1,000 women, while women with the education attainment of college or associate's degree have the lowest fertility at 6.0 births per 1,000 women. Women with the education attainment of bachelor's degree represent 31.9% of all women with births.
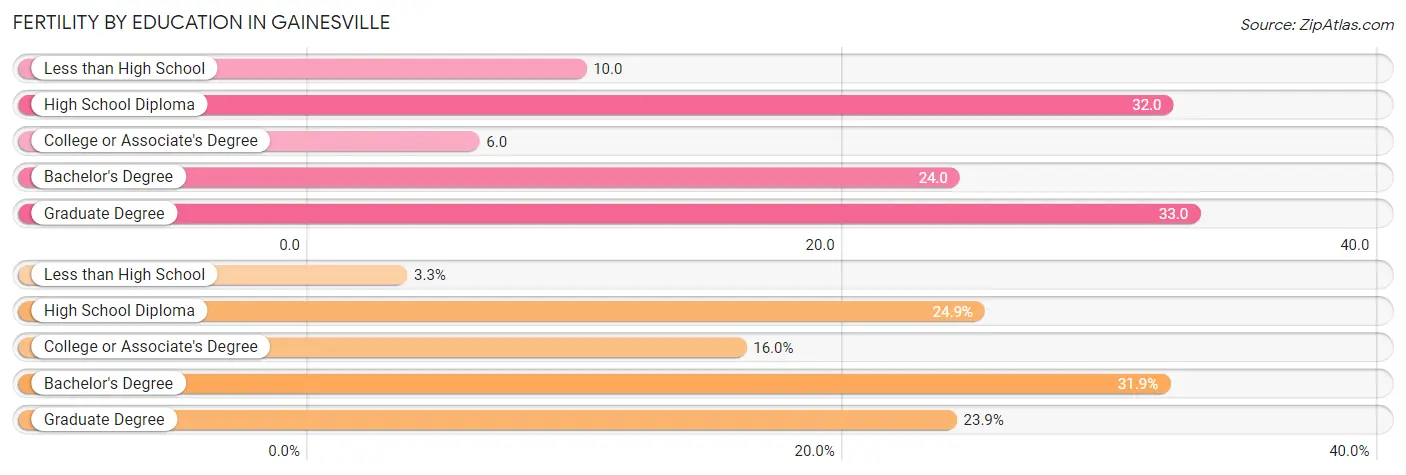
| Educational Attainment | Women with Births | Births / 1,000 Women |
| Less than High School | 28 (3.3%) | 10.0 |
| High School Diploma | 212 (24.9%) | 32.0 |
| College or Associate's Degree | 136 (16.0%) | 6.0 |
| Bachelor's Degree | 271 (31.9%) | 24.0 |
| Graduate Degree | 203 (23.9%) | 33.0 |
| Total | 850 (100.0%) | 17.0 |
Fertility by Education by Marriage Status in Gainesville
38.7% of women with births in Gainesville are unmarried. Women with the educational attainment of graduate degree are most likely to be married with 100.0% of them married at childbirth, while women with the educational attainment of less than high school are least likely to be married with 100.0% of them unmarried at childbirth.
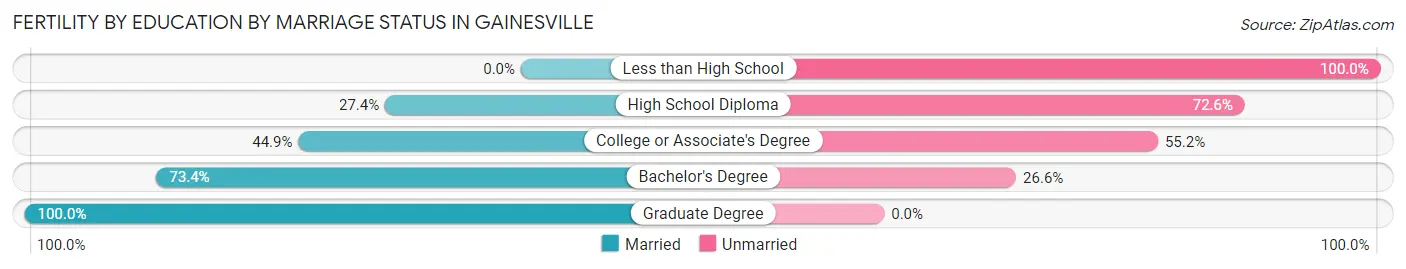
| Educational Attainment | Married | Unmarried |
| Less than High School | 0 (0.0%) | 28 (100.0%) |
| High School Diploma | 58 (27.4%) | 154 (72.6%) |
| College or Associate's Degree | 61 (44.9%) | 75 (55.1%) |
| Bachelor's Degree | 199 (73.4%) | 72 (26.6%) |
| Graduate Degree | 203 (100.0%) | 0 (0.0%) |
| Total | 521 (61.3%) | 329 (38.7%) |
Employment Characteristics in Gainesville
Employment by Class of Employer in Gainesville
Among the 66,480 employed individuals in Gainesville, private company employees (38,056 | 57.2%), state government employees (12,366 | 18.6%), and not-for-profit organizations (5,541 | 8.3%) make up the most common classes of employment.
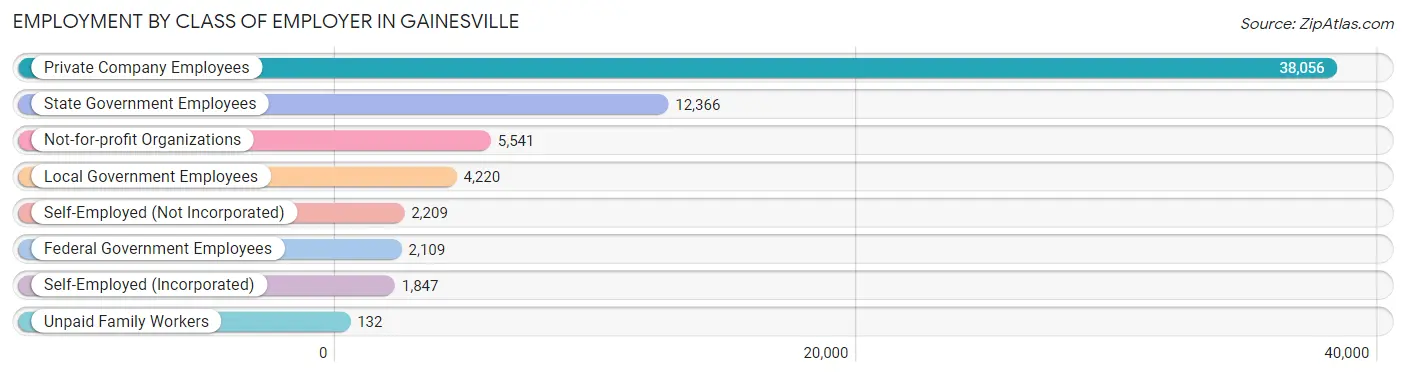
| Employer Class | # Employees | % Employees |
| Private Company Employees | 38,056 | 57.2% |
| Self-Employed (Incorporated) | 1,847 | 2.8% |
| Self-Employed (Not Incorporated) | 2,209 | 3.3% |
| Not-for-profit Organizations | 5,541 | 8.3% |
| Local Government Employees | 4,220 | 6.4% |
| State Government Employees | 12,366 | 18.6% |
| Federal Government Employees | 2,109 | 3.2% |
| Unpaid Family Workers | 132 | 0.2% |
| Total | 66,480 | 100.0% |
Employment Status by Age in Gainesville
According to the labor force statistics for Gainesville, out of the total population over 16 years of age (124,963), 57.8% or 72,229 individuals are in the labor force, with 5.5% or 3,973 of them unemployed. The age group with the highest labor force participation rate is 35 to 44 years, with 83.3% or 11,087 individuals in the labor force. Within the labor force, the 16 to 19 years age range has the highest percentage of unemployed individuals, with 12.6% or 479 of them being unemployed.
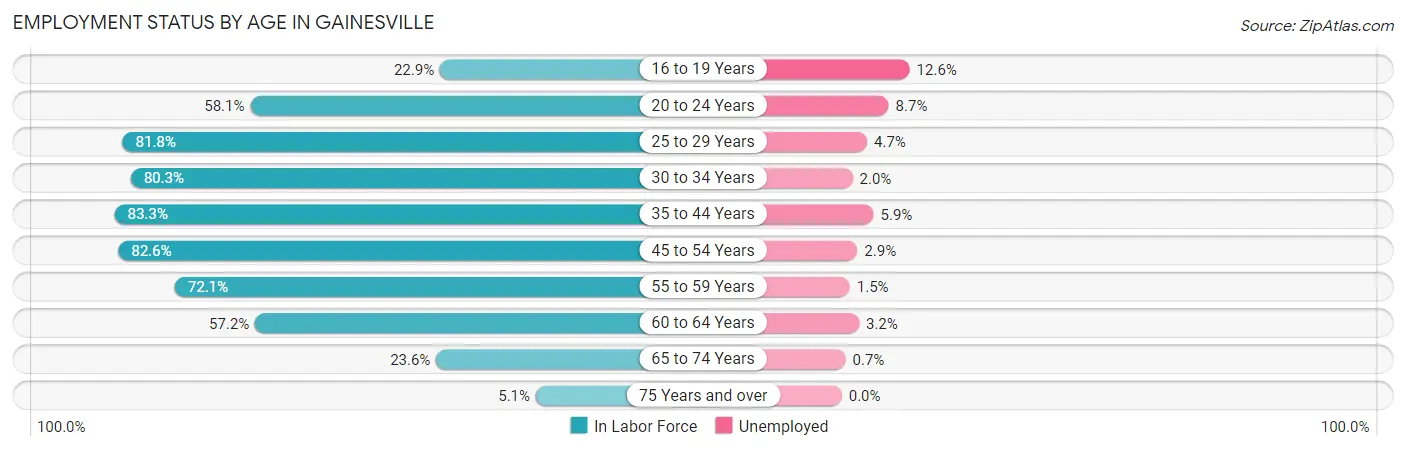
| Age Bracket | In Labor Force | Unemployed |
| 16 to 19 Years | 3,804 (22.9%) | 479 (12.6%) |
| 20 to 24 Years | 19,914 (58.1%) | 1,733 (8.7%) |
| 25 to 29 Years | 11,717 (81.8%) | 551 (4.7%) |
| 30 to 34 Years | 8,366 (80.3%) | 167 (2.0%) |
| 35 to 44 Years | 11,087 (83.3%) | 654 (5.9%) |
| 45 to 54 Years | 7,973 (82.6%) | 231 (2.9%) |
| 55 to 59 Years | 3,764 (72.1%) | 56 (1.5%) |
| 60 to 64 Years | 3,056 (57.2%) | 98 (3.2%) |
| 65 to 74 Years | 2,193 (23.6%) | 15 (0.7%) |
| 75 Years and over | 332 (5.1%) | 0 (0.0%) |
| Total | 72,229 (57.8%) | 3,973 (5.5%) |
Employment Status by Educational Attainment in Gainesville
According to labor force statistics for Gainesville, 78.9% of individuals (45,973) out of the total population between 25 and 64 years of age (58,268) are in the labor force, with 3.8% or 1,747 of them being unemployed. The group with the highest labor force participation rate are those with the educational attainment of bachelor's degree or higher, with 83.2% or 24,847 individuals in the labor force. Within the labor force, individuals with less than high school education have the highest percentage of unemployment, with 10.9% or 213 of them being unemployed.
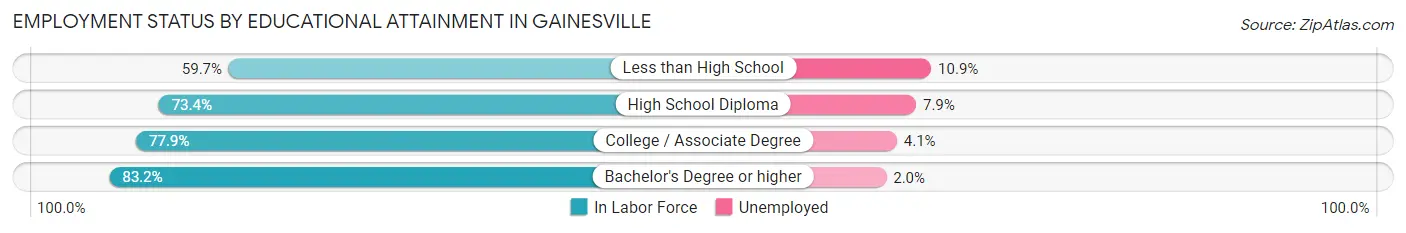
| Educational Attainment | In Labor Force | Unemployed |
| Less than High School | 1,952 (59.7%) | 356 (10.9%) |
| High School Diploma | 7,021 (73.4%) | 756 (7.9%) |
| College / Associate Degree | 12,128 (77.9%) | 638 (4.1%) |
| Bachelor's Degree or higher | 24,847 (83.2%) | 597 (2.0%) |
| Total | 45,973 (78.9%) | 2,214 (3.8%) |
Employment Occupations by Sex in Gainesville
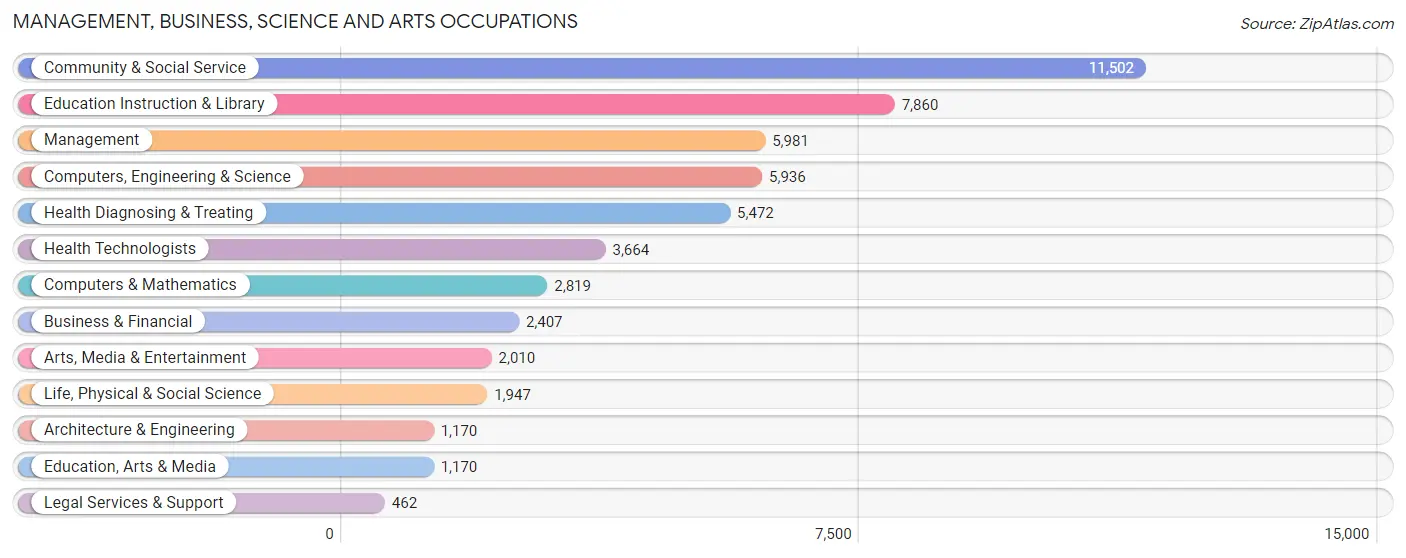
Management, Business, Science and Arts Occupations
The most common Management, Business, Science and Arts occupations in Gainesville are Community & Social Service (11,502 | 16.9%), Education Instruction & Library (7,860 | 11.5%), Management (5,981 | 8.8%), Computers, Engineering & Science (5,936 | 8.7%), and Health Diagnosing & Treating (5,472 | 8.0%).
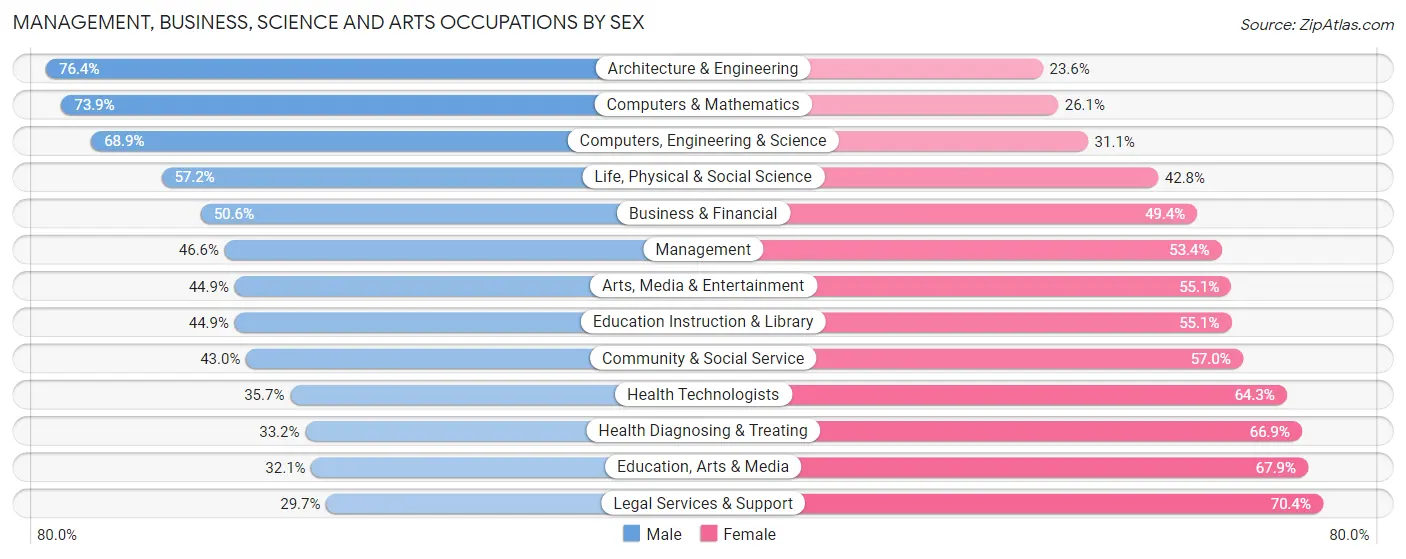
Management, Business, Science and Arts Occupations by Sex
Within the Management, Business, Science and Arts occupations in Gainesville, the most male-oriented occupations are Architecture & Engineering (76.4%), Computers & Mathematics (73.9%), and Computers, Engineering & Science (68.9%), while the most female-oriented occupations are Legal Services & Support (70.4%), Education, Arts & Media (67.9%), and Health Diagnosing & Treating (66.8%).
| Occupation | Male | Female |
| Management | 2,786 (46.6%) | 3,195 (53.4%) |
| Business & Financial | 1,218 (50.6%) | 1,189 (49.4%) |
| Computers, Engineering & Science | 4,089 (68.9%) | 1,847 (31.1%) |
| Computers & Mathematics | 2,082 (73.9%) | 737 (26.1%) |
| Architecture & Engineering | 894 (76.4%) | 276 (23.6%) |
| Life, Physical & Social Science | 1,113 (57.2%) | 834 (42.8%) |
| Community & Social Service | 4,947 (43.0%) | 6,555 (57.0%) |
| Education, Arts & Media | 376 (32.1%) | 794 (67.9%) |
| Legal Services & Support | 137 (29.6%) | 325 (70.4%) |
| Education Instruction & Library | 3,531 (44.9%) | 4,329 (55.1%) |
| Arts, Media & Entertainment | 903 (44.9%) | 1,107 (55.1%) |
| Health Diagnosing & Treating | 1,814 (33.2%) | 3,658 (66.8%) |
| Health Technologists | 1,307 (35.7%) | 2,357 (64.3%) |
| Total (Category) | 14,854 (47.5%) | 16,444 (52.5%) |
| Total (Overall) | 33,330 (48.9%) | 34,797 (51.1%) |
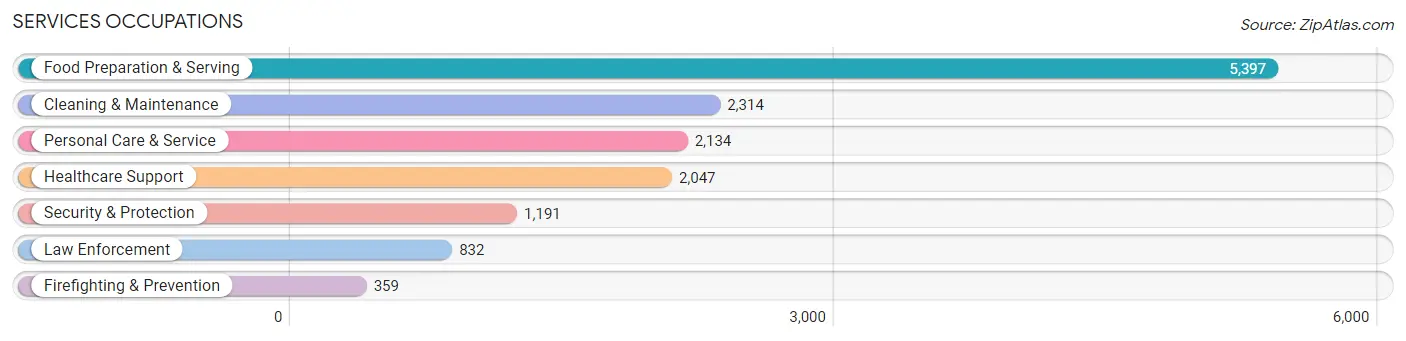
Services Occupations
The most common Services occupations in Gainesville are Food Preparation & Serving (5,397 | 7.9%), Cleaning & Maintenance (2,314 | 3.4%), Personal Care & Service (2,134 | 3.1%), Healthcare Support (2,047 | 3.0%), and Security & Protection (1,191 | 1.8%).
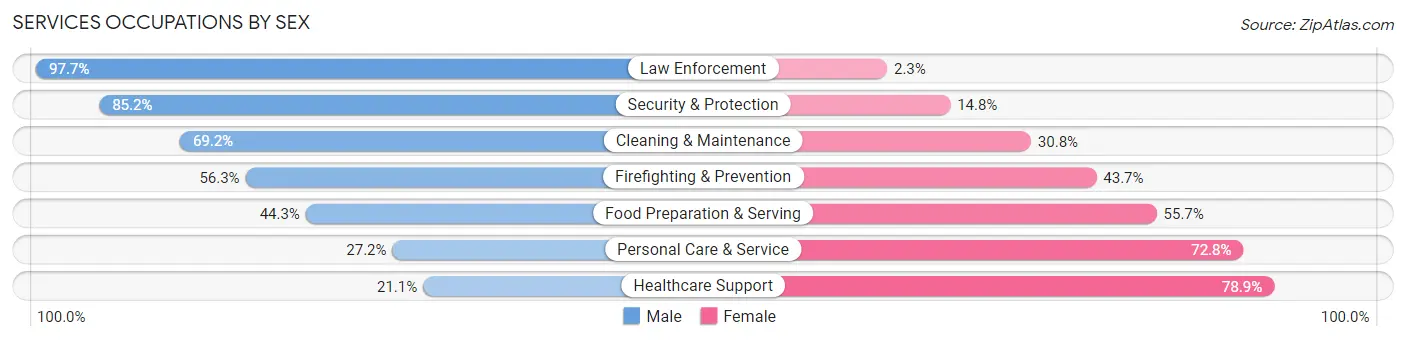
Services Occupations by Sex
Within the Services occupations in Gainesville, the most male-oriented occupations are Law Enforcement (97.7%), Security & Protection (85.2%), and Cleaning & Maintenance (69.2%), while the most female-oriented occupations are Healthcare Support (78.9%), Personal Care & Service (72.8%), and Food Preparation & Serving (55.7%).
| Occupation | Male | Female |
| Healthcare Support | 432 (21.1%) | 1,615 (78.9%) |
| Security & Protection | 1,015 (85.2%) | 176 (14.8%) |
| Firefighting & Prevention | 202 (56.3%) | 157 (43.7%) |
| Law Enforcement | 813 (97.7%) | 19 (2.3%) |
| Food Preparation & Serving | 2,393 (44.3%) | 3,004 (55.7%) |
| Cleaning & Maintenance | 1,602 (69.2%) | 712 (30.8%) |
| Personal Care & Service | 580 (27.2%) | 1,554 (72.8%) |
| Total (Category) | 6,022 (46.0%) | 7,061 (54.0%) |
| Total (Overall) | 33,330 (48.9%) | 34,797 (51.1%) |
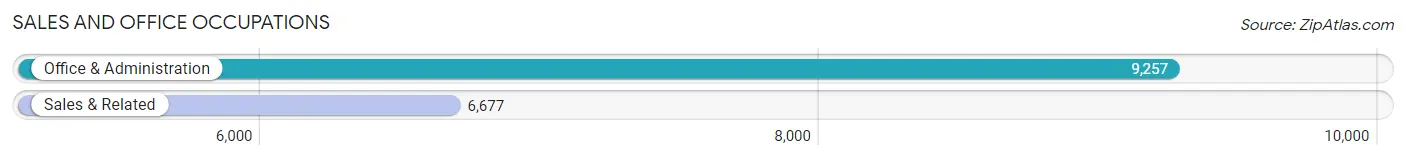
Sales and Office Occupations
The most common Sales and Office occupations in Gainesville are Office & Administration (9,257 | 13.6%), and Sales & Related (6,677 | 9.8%).
Sales and Office Occupations by Sex
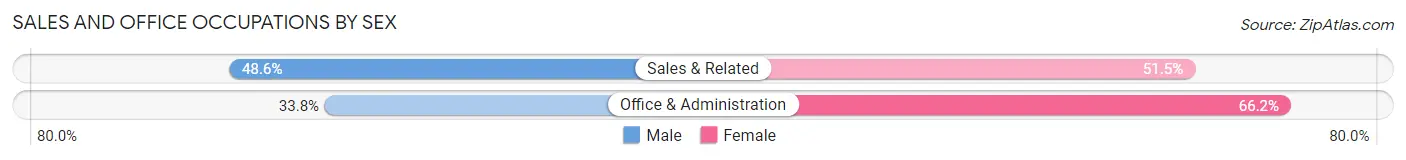
| Occupation | Male | Female |
| Sales & Related | 3,242 (48.5%) | 3,435 (51.4%) |
| Office & Administration | 3,129 (33.8%) | 6,128 (66.2%) |
| Total (Category) | 6,371 (40.0%) | 9,563 (60.0%) |
| Total (Overall) | 33,330 (48.9%) | 34,797 (51.1%) |
Natural Resources, Construction and Maintenance Occupations
The most common Natural Resources, Construction and Maintenance occupations in Gainesville are Construction & Extraction (1,701 | 2.5%), Installation, Maintenance & Repair (1,188 | 1.7%), and Farming, Fishing & Forestry (342 | 0.5%).

Natural Resources, Construction and Maintenance Occupations by Sex
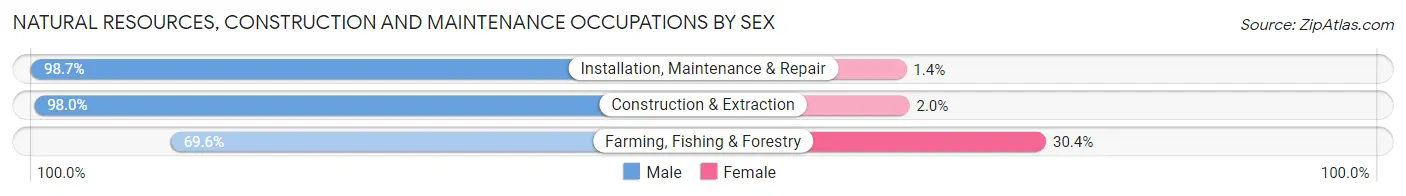
| Occupation | Male | Female |
| Farming, Fishing & Forestry | 238 (69.6%) | 104 (30.4%) |
| Construction & Extraction | 1,667 (98.0%) | 34 (2.0%) |
| Installation, Maintenance & Repair | 1,172 (98.7%) | 16 (1.3%) |
| Total (Category) | 3,077 (95.2%) | 154 (4.8%) |
| Total (Overall) | 33,330 (48.9%) | 34,797 (51.1%) |
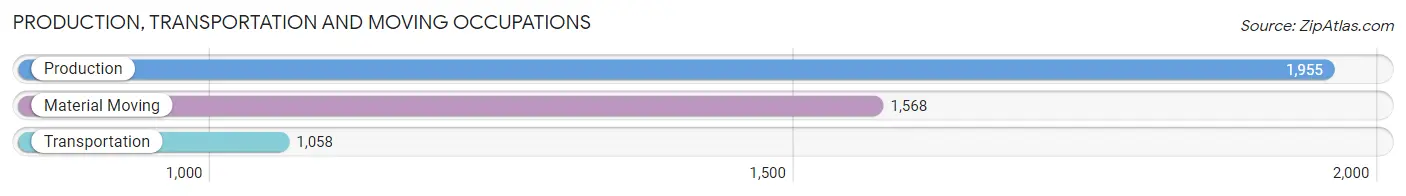
Production, Transportation and Moving Occupations
The most common Production, Transportation and Moving occupations in Gainesville are Production (1,955 | 2.9%), Material Moving (1,568 | 2.3%), and Transportation (1,058 | 1.5%).
Production, Transportation and Moving Occupations by Sex
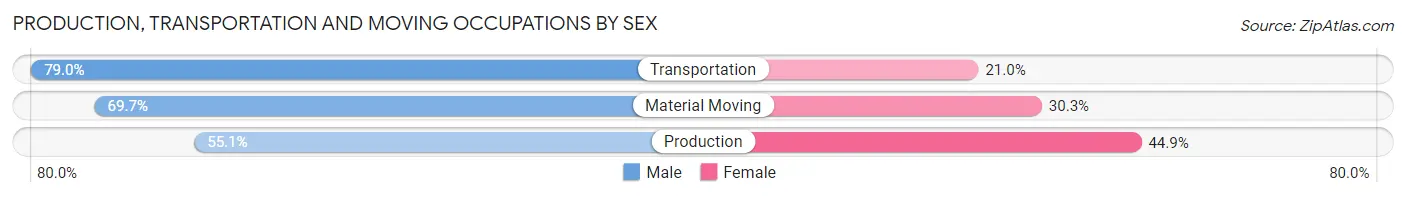
| Occupation | Male | Female |
| Production | 1,077 (55.1%) | 878 (44.9%) |
| Transportation | 836 (79.0%) | 222 (21.0%) |
| Material Moving | 1,093 (69.7%) | 475 (30.3%) |
| Total (Category) | 3,006 (65.6%) | 1,575 (34.4%) |
| Total (Overall) | 33,330 (48.9%) | 34,797 (51.1%) |
Employment Industries by Sex in Gainesville
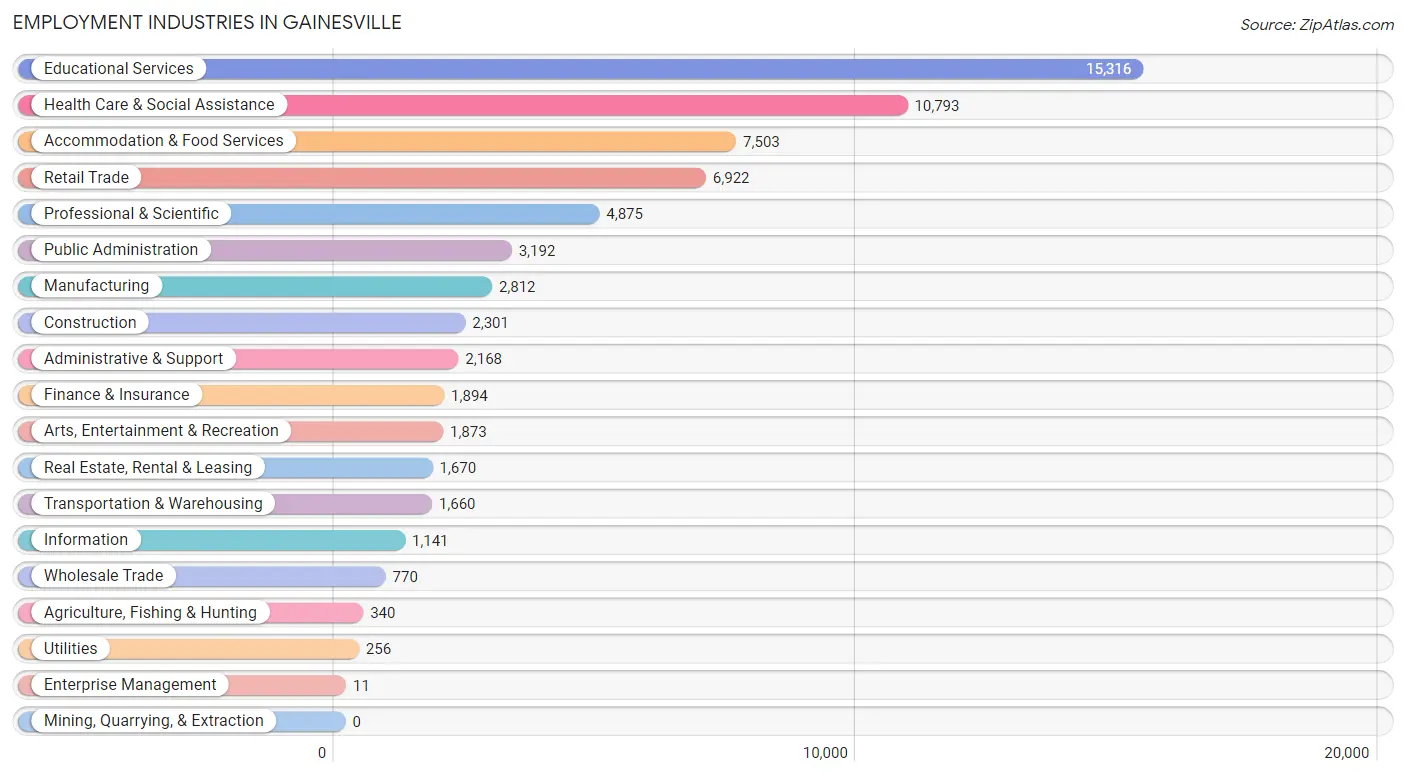
Employment Industries in Gainesville
The major employment industries in Gainesville include Educational Services (15,316 | 22.5%), Health Care & Social Assistance (10,793 | 15.8%), Accommodation & Food Services (7,503 | 11.0%), Retail Trade (6,922 | 10.2%), and Professional & Scientific (4,875 | 7.2%).
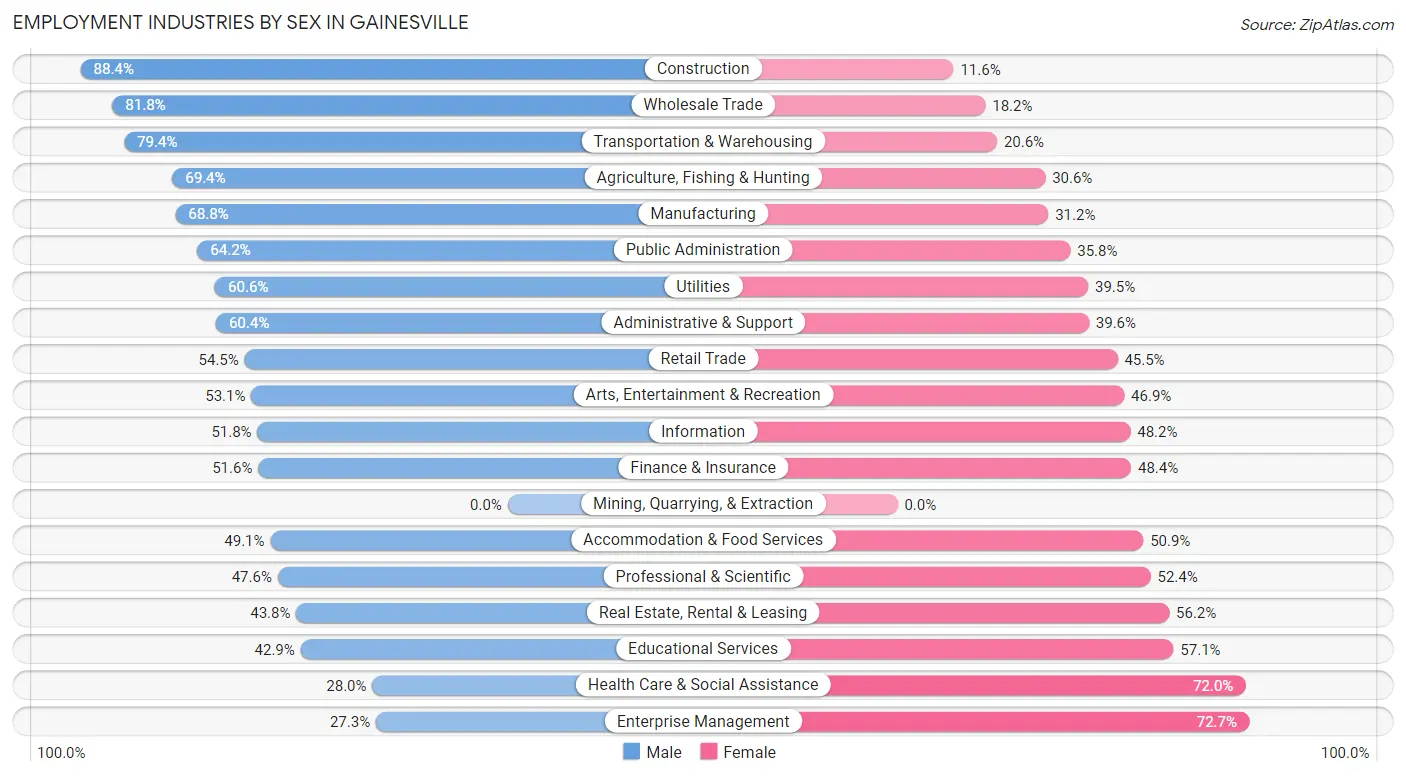
Employment Industries by Sex in Gainesville
The Gainesville industries that see more men than women are Construction (88.4%), Wholesale Trade (81.8%), and Transportation & Warehousing (79.4%), whereas the industries that tend to have a higher number of women are Enterprise Management (72.7%), Health Care & Social Assistance (72.0%), and Educational Services (57.1%).
| Industry | Male | Female |
| Agriculture, Fishing & Hunting | 236 (69.4%) | 104 (30.6%) |
| Mining, Quarrying, & Extraction | 0 (0.0%) | 0 (0.0%) |
| Construction | 2,034 (88.4%) | 267 (11.6%) |
| Manufacturing | 1,934 (68.8%) | 878 (31.2%) |
| Wholesale Trade | 630 (81.8%) | 140 (18.2%) |
| Retail Trade | 3,770 (54.5%) | 3,152 (45.5%) |
| Transportation & Warehousing | 1,318 (79.4%) | 342 (20.6%) |
| Utilities | 155 (60.6%) | 101 (39.5%) |
| Information | 591 (51.8%) | 550 (48.2%) |
| Finance & Insurance | 978 (51.6%) | 916 (48.4%) |
| Real Estate, Rental & Leasing | 731 (43.8%) | 939 (56.2%) |
| Professional & Scientific | 2,321 (47.6%) | 2,554 (52.4%) |
| Enterprise Management | 3 (27.3%) | 8 (72.7%) |
| Administrative & Support | 1,309 (60.4%) | 859 (39.6%) |
| Educational Services | 6,566 (42.9%) | 8,750 (57.1%) |
| Health Care & Social Assistance | 3,024 (28.0%) | 7,769 (72.0%) |
| Arts, Entertainment & Recreation | 994 (53.1%) | 879 (46.9%) |
| Accommodation & Food Services | 3,686 (49.1%) | 3,817 (50.9%) |
| Public Administration | 2,050 (64.2%) | 1,142 (35.8%) |
| Total | 33,330 (48.9%) | 34,797 (51.1%) |
Education in Gainesville
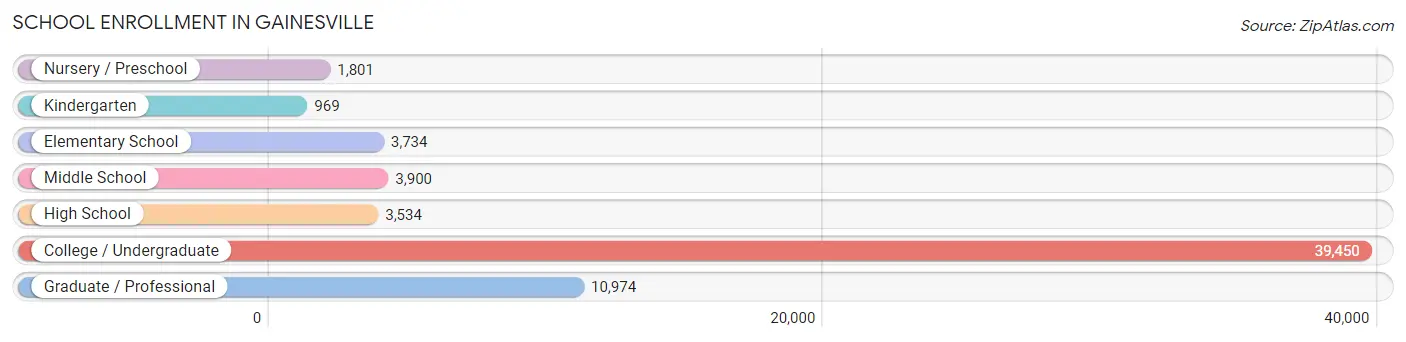
School Enrollment in Gainesville
The most common levels of schooling among the 64,362 students in Gainesville are college / undergraduate (39,450 | 61.3%), graduate / professional (10,974 | 17.1%), and middle school (3,900 | 6.1%).
| School Level | # Students | % Students |
| Nursery / Preschool | 1,801 | 2.8% |
| Kindergarten | 969 | 1.5% |
| Elementary School | 3,734 | 5.8% |
| Middle School | 3,900 | 6.1% |
| High School | 3,534 | 5.5% |
| College / Undergraduate | 39,450 | 61.3% |
| Graduate / Professional | 10,974 | 17.1% |
| Total | 64,362 | 100.0% |
School Enrollment by Age by Funding Source in Gainesville
Out of a total of 64,362 students who are enrolled in schools in Gainesville, 3,926 (6.1%) attend a private institution, while the remaining 60,436 (93.9%) are enrolled in public schools. The age group of 3 to 4 year olds has the highest likelihood of being enrolled in private schools, with 365 (31.9% in the age bracket) enrolled. Conversely, the age group of 18 to 19 year olds has the lowest likelihood of being enrolled in a private school, with 14,088 (99.6% in the age bracket) attending a public institution.
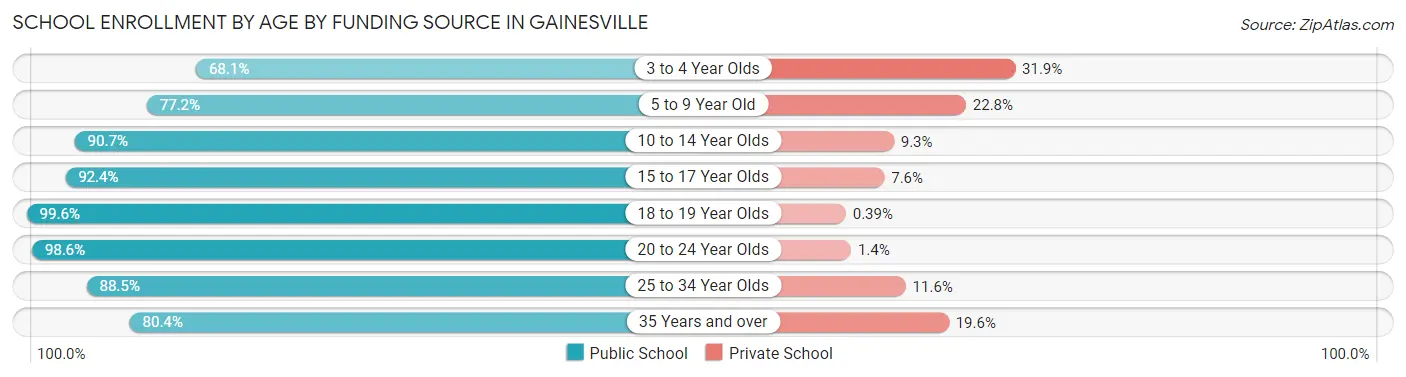
| Age Bracket | Public School | Private School |
| 3 to 4 Year Olds | 778 (68.1%) | 365 (31.9%) |
| 5 to 9 Year Old | 3,956 (77.2%) | 1,166 (22.8%) |
| 10 to 14 Year Olds | 3,830 (90.7%) | 394 (9.3%) |
| 15 to 17 Year Olds | 2,455 (92.4%) | 201 (7.6%) |
| 18 to 19 Year Olds | 14,088 (99.6%) | 55 (0.4%) |
| 20 to 24 Year Olds | 26,187 (98.6%) | 360 (1.4%) |
| 25 to 34 Year Olds | 7,096 (88.4%) | 927 (11.6%) |
| 35 Years and over | 2,014 (80.4%) | 490 (19.6%) |
| Total | 60,436 (93.9%) | 3,926 (6.1%) |
Educational Attainment by Field of Study in Gainesville
Bio, nature & agricultural (5,611 | 13.9%), business (4,546 | 11.3%), science & technology (4,443 | 11.0%), social sciences (3,471 | 8.6%), and education (3,135 | 7.8%) are the most common fields of study among 40,347 individuals in Gainesville who have obtained a bachelor's degree or higher.
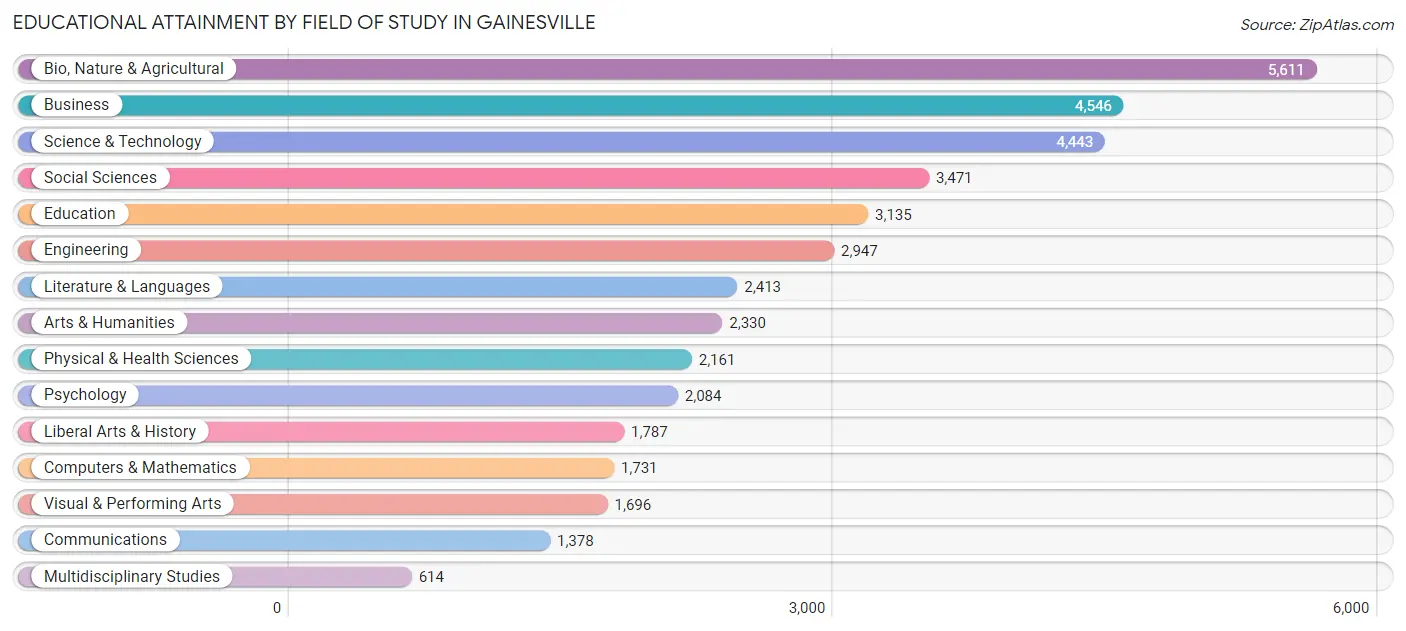
| Field of Study | # Graduates | % Graduates |
| Computers & Mathematics | 1,731 | 4.3% |
| Bio, Nature & Agricultural | 5,611 | 13.9% |
| Physical & Health Sciences | 2,161 | 5.4% |
| Psychology | 2,084 | 5.2% |
| Social Sciences | 3,471 | 8.6% |
| Engineering | 2,947 | 7.3% |
| Multidisciplinary Studies | 614 | 1.5% |
| Science & Technology | 4,443 | 11.0% |
| Business | 4,546 | 11.3% |
| Education | 3,135 | 7.8% |
| Literature & Languages | 2,413 | 6.0% |
| Liberal Arts & History | 1,787 | 4.4% |
| Visual & Performing Arts | 1,696 | 4.2% |
| Communications | 1,378 | 3.4% |
| Arts & Humanities | 2,330 | 5.8% |
| Total | 40,347 | 100.0% |
Transportation & Commute in Gainesville
Vehicle Availability by Sex in Gainesville
The most prevalent vehicle ownership categories in Gainesville are males with 2 vehicles (12,188, accounting for 38.5%) and females with 2 vehicles (12,843, making up 38.2%).
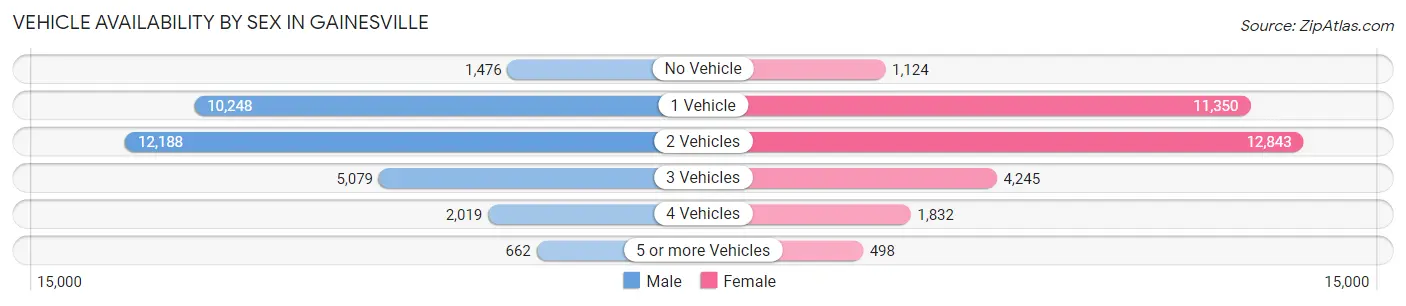
| Vehicles Available | Male | Female |
| No Vehicle | 1,476 (4.7%) | 1,124 (3.5%) |
| 1 Vehicle | 10,248 (32.4%) | 11,350 (35.6%) |
| 2 Vehicles | 12,188 (38.5%) | 12,843 (40.3%) |
| 3 Vehicles | 5,079 (16.0%) | 4,245 (13.3%) |
| 4 Vehicles | 2,019 (6.4%) | 1,832 (5.7%) |
| 5 or more Vehicles | 662 (2.1%) | 498 (1.6%) |
| Total | 31,672 (100.0%) | 31,892 (100.0%) |
Commute Time in Gainesville
The most frequently occuring commute durations in Gainesville are 15 to 19 minutes (15,121 commuters, 25.5%), 20 to 24 minutes (11,804 commuters, 19.9%), and 10 to 14 minutes (11,503 commuters, 19.4%).
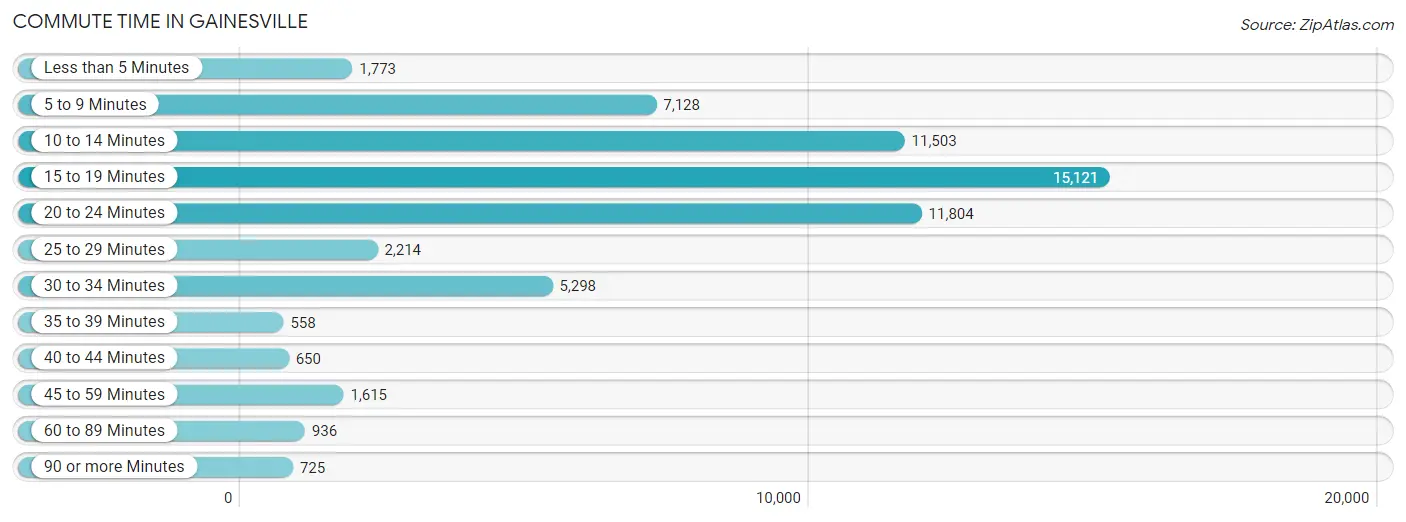
| Commute Time | # Commuters | % Commuters |
| Less than 5 Minutes | 1,773 | 3.0% |
| 5 to 9 Minutes | 7,128 | 12.0% |
| 10 to 14 Minutes | 11,503 | 19.4% |
| 15 to 19 Minutes | 15,121 | 25.5% |
| 20 to 24 Minutes | 11,804 | 19.9% |
| 25 to 29 Minutes | 2,214 | 3.7% |
| 30 to 34 Minutes | 5,298 | 8.9% |
| 35 to 39 Minutes | 558 | 0.9% |
| 40 to 44 Minutes | 650 | 1.1% |
| 45 to 59 Minutes | 1,615 | 2.7% |
| 60 to 89 Minutes | 936 | 1.6% |
| 90 or more Minutes | 725 | 1.2% |
Commute Time by Sex in Gainesville
The most common commute times in Gainesville are 15 to 19 minutes (7,733 commuters, 26.0%) for males and 15 to 19 minutes (7,388 commuters, 25.0%) for females.
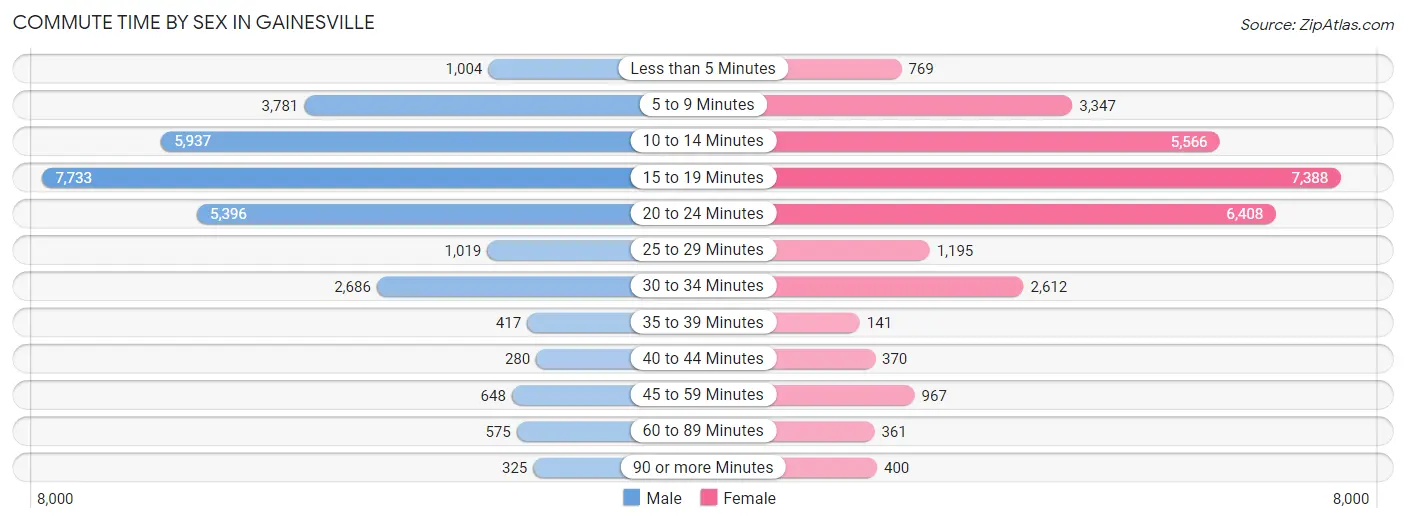
| Commute Time | Male | Female |
| Less than 5 Minutes | 1,004 (3.4%) | 769 (2.6%) |
| 5 to 9 Minutes | 3,781 (12.7%) | 3,347 (11.3%) |
| 10 to 14 Minutes | 5,937 (19.9%) | 5,566 (18.9%) |
| 15 to 19 Minutes | 7,733 (26.0%) | 7,388 (25.0%) |
| 20 to 24 Minutes | 5,396 (18.1%) | 6,408 (21.7%) |
| 25 to 29 Minutes | 1,019 (3.4%) | 1,195 (4.1%) |
| 30 to 34 Minutes | 2,686 (9.0%) | 2,612 (8.8%) |
| 35 to 39 Minutes | 417 (1.4%) | 141 (0.5%) |
| 40 to 44 Minutes | 280 (0.9%) | 370 (1.3%) |
| 45 to 59 Minutes | 648 (2.2%) | 967 (3.3%) |
| 60 to 89 Minutes | 575 (1.9%) | 361 (1.2%) |
| 90 or more Minutes | 325 (1.1%) | 400 (1.3%) |
Time of Departure to Work by Sex in Gainesville
The most frequent times of departure to work in Gainesville are 7:30 AM to 7:59 AM (3,820, 12.8%) for males and 7:30 AM to 7:59 AM (4,274, 14.5%) for females.
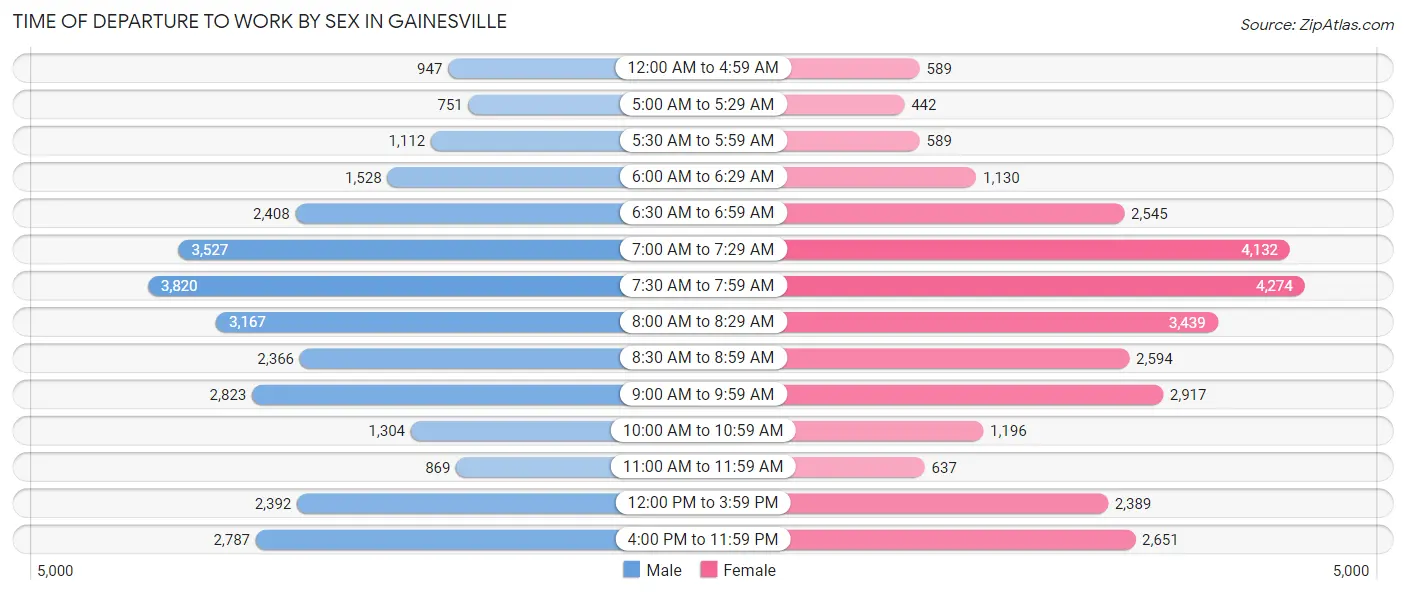
| Time of Departure | Male | Female |
| 12:00 AM to 4:59 AM | 947 (3.2%) | 589 (2.0%) |
| 5:00 AM to 5:29 AM | 751 (2.5%) | 442 (1.5%) |
| 5:30 AM to 5:59 AM | 1,112 (3.7%) | 589 (2.0%) |
| 6:00 AM to 6:29 AM | 1,528 (5.1%) | 1,130 (3.8%) |
| 6:30 AM to 6:59 AM | 2,408 (8.1%) | 2,545 (8.6%) |
| 7:00 AM to 7:29 AM | 3,527 (11.8%) | 4,132 (14.0%) |
| 7:30 AM to 7:59 AM | 3,820 (12.8%) | 4,274 (14.5%) |
| 8:00 AM to 8:29 AM | 3,167 (10.6%) | 3,439 (11.7%) |
| 8:30 AM to 8:59 AM | 2,366 (7.9%) | 2,594 (8.8%) |
| 9:00 AM to 9:59 AM | 2,823 (9.5%) | 2,917 (9.9%) |
| 10:00 AM to 10:59 AM | 1,304 (4.4%) | 1,196 (4.1%) |
| 11:00 AM to 11:59 AM | 869 (2.9%) | 637 (2.2%) |
| 12:00 PM to 3:59 PM | 2,392 (8.0%) | 2,389 (8.1%) |
| 4:00 PM to 11:59 PM | 2,787 (9.3%) | 2,651 (9.0%) |
| Total | 29,801 (100.0%) | 29,524 (100.0%) |
Housing Occupancy in Gainesville
Occupancy by Ownership in Gainesville
Of the total 55,193 dwellings in Gainesville, owner-occupied units account for 21,238 (38.5%), while renter-occupied units make up 33,955 (61.5%).
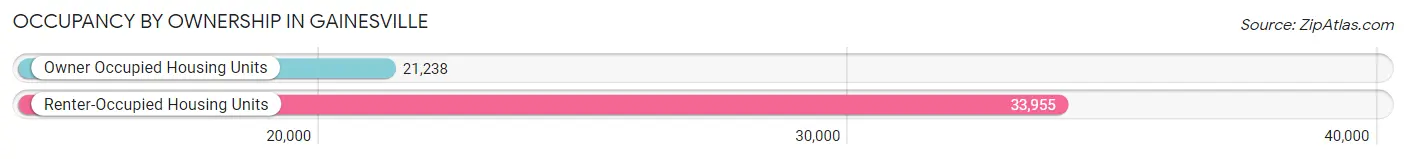
| Occupancy | # Housing Units | % Housing Units |
| Owner Occupied Housing Units | 21,238 | 38.5% |
| Renter-Occupied Housing Units | 33,955 | 61.5% |
| Total Occupied Housing Units | 55,193 | 100.0% |
Occupancy by Household Size in Gainesville
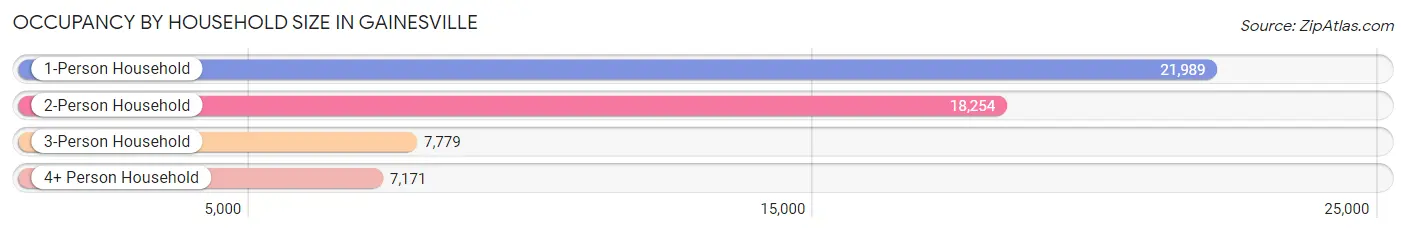
| Household Size | # Housing Units | % Housing Units |
| 1-Person Household | 21,989 | 39.8% |
| 2-Person Household | 18,254 | 33.1% |
| 3-Person Household | 7,779 | 14.1% |
| 4+ Person Household | 7,171 | 13.0% |
| Total Housing Units | 55,193 | 100.0% |
Occupancy by Ownership by Household Size in Gainesville
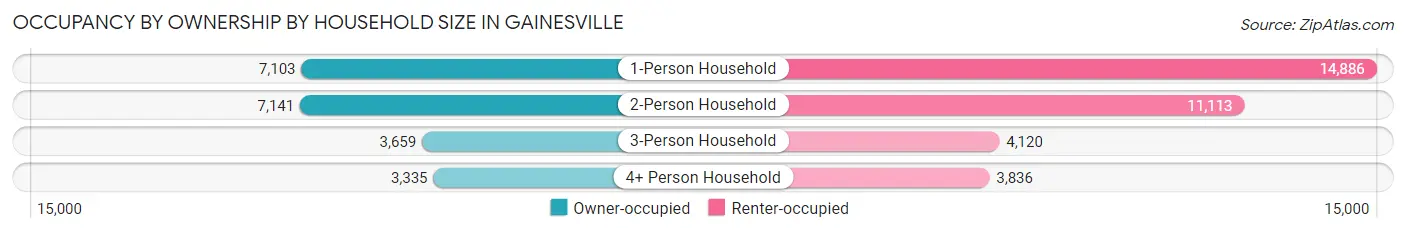
| Household Size | Owner-occupied | Renter-occupied |
| 1-Person Household | 7,103 (32.3%) | 14,886 (67.7%) |
| 2-Person Household | 7,141 (39.1%) | 11,113 (60.9%) |
| 3-Person Household | 3,659 (47.0%) | 4,120 (53.0%) |
| 4+ Person Household | 3,335 (46.5%) | 3,836 (53.5%) |
| Total Housing Units | 21,238 (38.5%) | 33,955 (61.5%) |
Occupancy by Educational Attainment in Gainesville
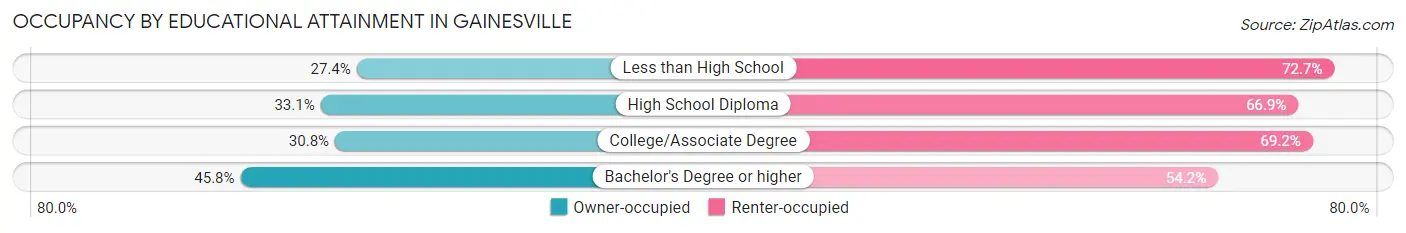
| Household Size | Owner-occupied | Renter-occupied |
| Less than High School | 582 (27.4%) | 1,546 (72.7%) |
| High School Diploma | 2,581 (33.1%) | 5,223 (66.9%) |
| College/Associate Degree | 5,433 (30.8%) | 12,216 (69.2%) |
| Bachelor's Degree or higher | 12,642 (45.8%) | 14,970 (54.2%) |
Occupancy by Age of Householder in Gainesville
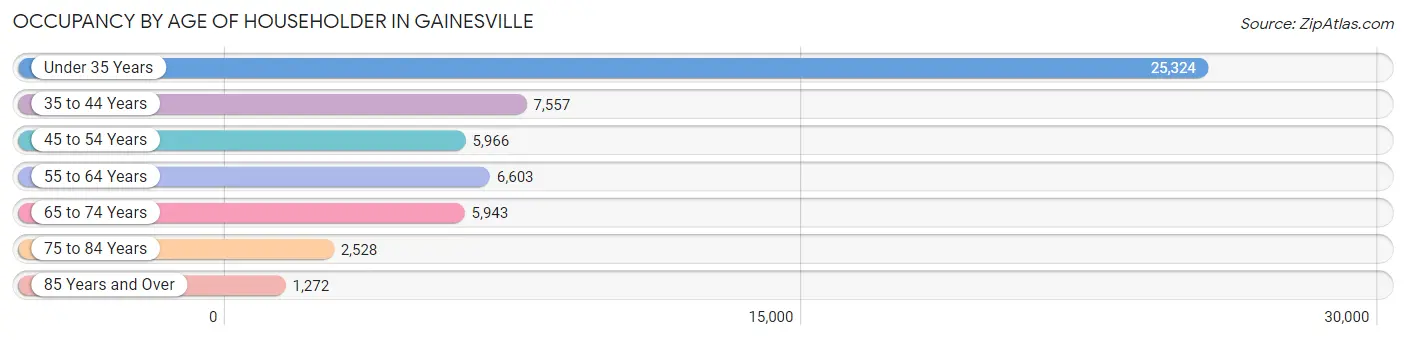
| Age Bracket | # Households | % Households |
| Under 35 Years | 25,324 | 45.9% |
| 35 to 44 Years | 7,557 | 13.7% |
| 45 to 54 Years | 5,966 | 10.8% |
| 55 to 64 Years | 6,603 | 12.0% |
| 65 to 74 Years | 5,943 | 10.8% |
| 75 to 84 Years | 2,528 | 4.6% |
| 85 Years and Over | 1,272 | 2.3% |
| Total | 55,193 | 100.0% |
Housing Finances in Gainesville
Median Income by Occupancy in Gainesville
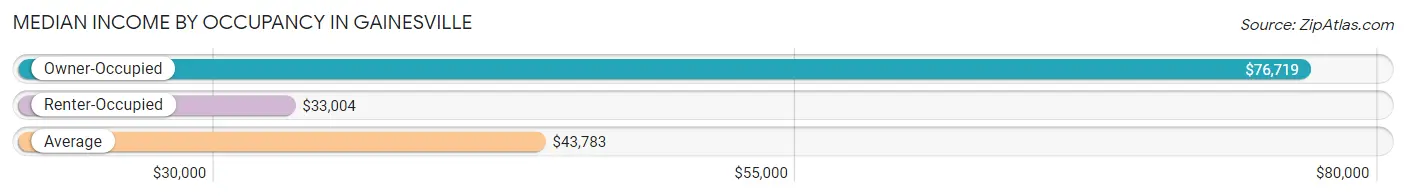
| Occupancy Type | # Households | Median Income |
| Owner-Occupied | 21,238 (38.5%) | $76,719 |
| Renter-Occupied | 33,955 (61.5%) | $33,004 |
| Average | 55,193 (100.0%) | $43,783 |
Occupancy by Householder Income Bracket in Gainesville
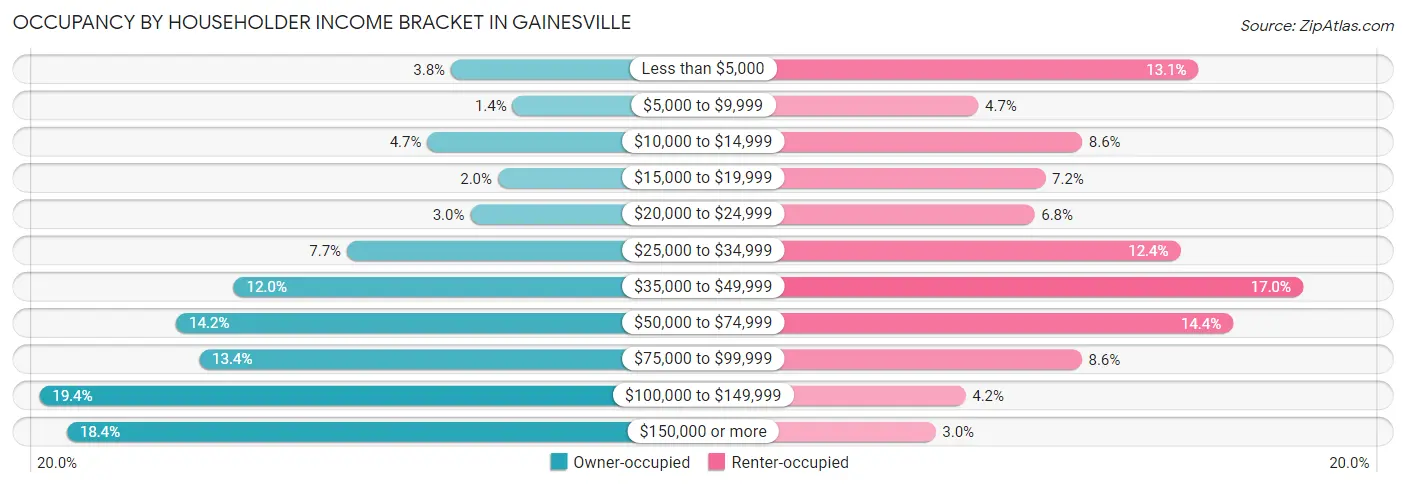
| Income Bracket | Owner-occupied | Renter-occupied |
| Less than $5,000 | 798 (3.8%) | 4,433 (13.1%) |
| $5,000 to $9,999 | 300 (1.4%) | 1,586 (4.7%) |
| $10,000 to $14,999 | 990 (4.7%) | 2,928 (8.6%) |
| $15,000 to $19,999 | 418 (2.0%) | 2,453 (7.2%) |
| $20,000 to $24,999 | 642 (3.0%) | 2,313 (6.8%) |
| $25,000 to $34,999 | 1,639 (7.7%) | 4,201 (12.4%) |
| $35,000 to $49,999 | 2,558 (12.0%) | 5,785 (17.0%) |
| $50,000 to $74,999 | 3,023 (14.2%) | 4,882 (14.4%) |
| $75,000 to $99,999 | 2,836 (13.4%) | 2,923 (8.6%) |
| $100,000 to $149,999 | 4,128 (19.4%) | 1,419 (4.2%) |
| $150,000 or more | 3,906 (18.4%) | 1,032 (3.0%) |
| Total | 21,238 (100.0%) | 33,955 (100.0%) |
Monthly Housing Cost Tiers in Gainesville
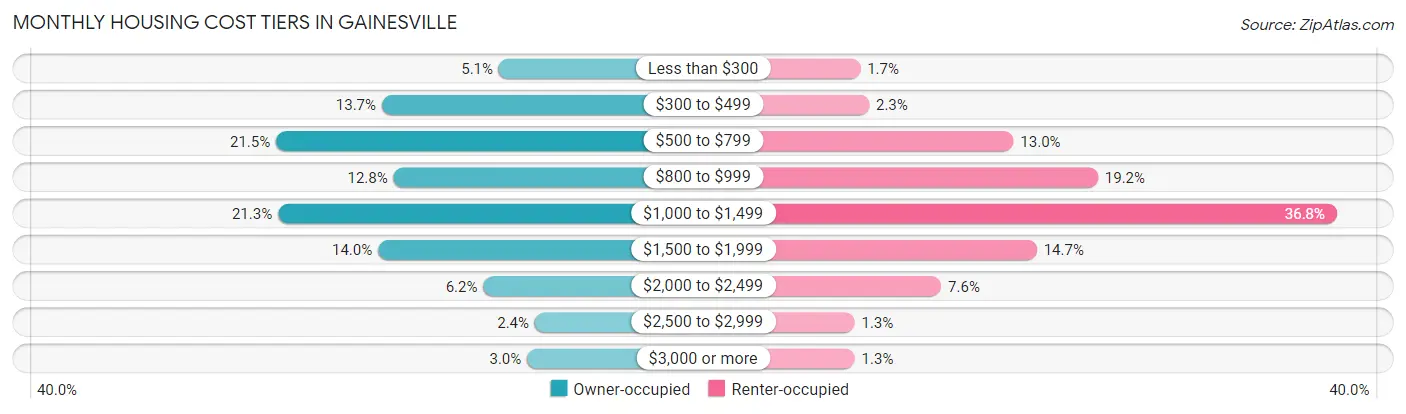
| Monthly Cost | Owner-occupied | Renter-occupied |
| Less than $300 | 1,076 (5.1%) | 571 (1.7%) |
| $300 to $499 | 2,907 (13.7%) | 790 (2.3%) |
| $500 to $799 | 4,561 (21.5%) | 4,400 (13.0%) |
| $800 to $999 | 2,724 (12.8%) | 6,512 (19.2%) |
| $1,000 to $1,499 | 4,533 (21.3%) | 12,487 (36.8%) |
| $1,500 to $1,999 | 2,966 (14.0%) | 4,985 (14.7%) |
| $2,000 to $2,499 | 1,322 (6.2%) | 2,595 (7.6%) |
| $2,500 to $2,999 | 515 (2.4%) | 427 (1.3%) |
| $3,000 or more | 634 (3.0%) | 432 (1.3%) |
| Total | 21,238 (100.0%) | 33,955 (100.0%) |
Physical Housing Characteristics in Gainesville
Housing Structures in Gainesville
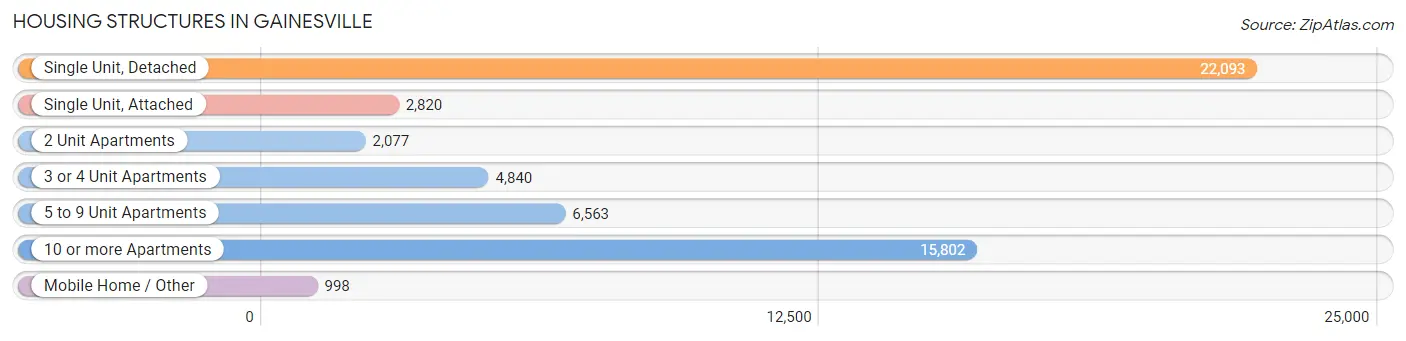
| Structure Type | # Housing Units | % Housing Units |
| Single Unit, Detached | 22,093 | 40.0% |
| Single Unit, Attached | 2,820 | 5.1% |
| 2 Unit Apartments | 2,077 | 3.8% |
| 3 or 4 Unit Apartments | 4,840 | 8.8% |
| 5 to 9 Unit Apartments | 6,563 | 11.9% |
| 10 or more Apartments | 15,802 | 28.6% |
| Mobile Home / Other | 998 | 1.8% |
| Total | 55,193 | 100.0% |
Housing Structures by Occupancy in Gainesville
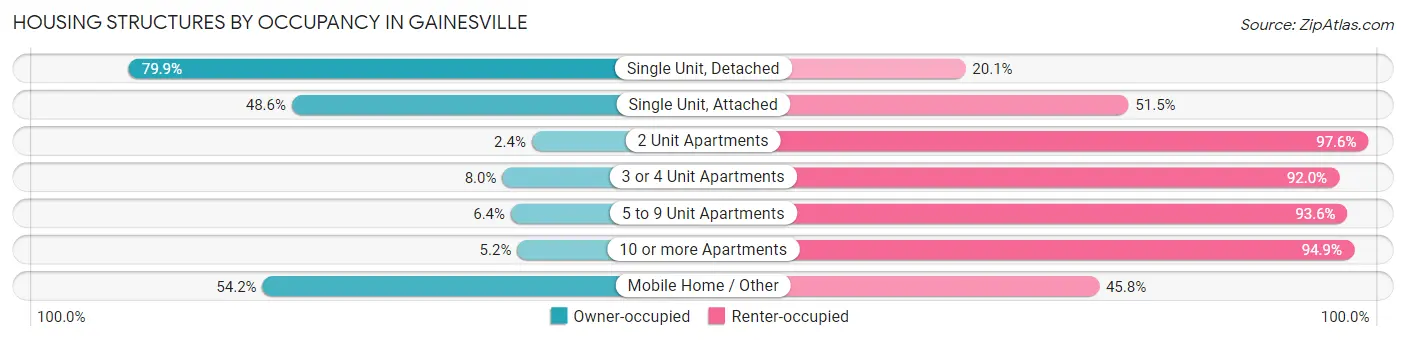
| Structure Type | Owner-occupied | Renter-occupied |
| Single Unit, Detached | 17,658 (79.9%) | 4,435 (20.1%) |
| Single Unit, Attached | 1,369 (48.5%) | 1,451 (51.4%) |
| 2 Unit Apartments | 49 (2.4%) | 2,028 (97.6%) |
| 3 or 4 Unit Apartments | 388 (8.0%) | 4,452 (92.0%) |
| 5 to 9 Unit Apartments | 419 (6.4%) | 6,144 (93.6%) |
| 10 or more Apartments | 814 (5.1%) | 14,988 (94.9%) |
| Mobile Home / Other | 541 (54.2%) | 457 (45.8%) |
| Total | 21,238 (38.5%) | 33,955 (61.5%) |
Housing Structures by Number of Rooms in Gainesville
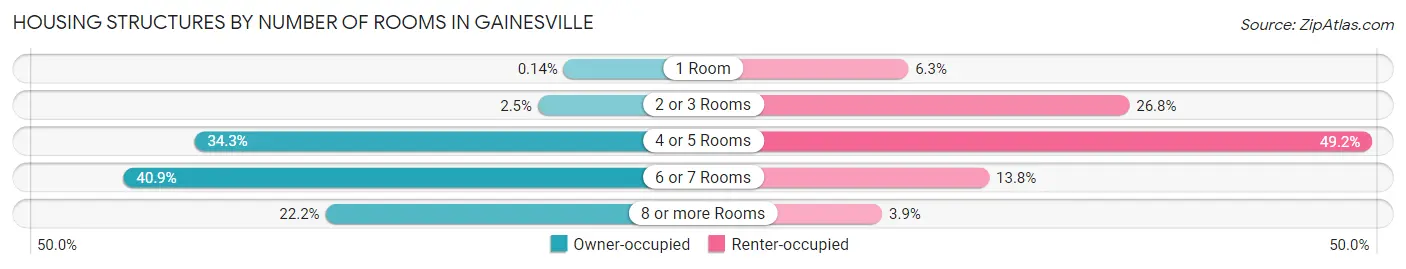
| Number of Rooms | Owner-occupied | Renter-occupied |
| 1 Room | 29 (0.1%) | 2,145 (6.3%) |
| 2 or 3 Rooms | 538 (2.5%) | 9,085 (26.8%) |
| 4 or 5 Rooms | 7,282 (34.3%) | 16,714 (49.2%) |
| 6 or 7 Rooms | 8,678 (40.9%) | 4,686 (13.8%) |
| 8 or more Rooms | 4,711 (22.2%) | 1,325 (3.9%) |
| Total | 21,238 (100.0%) | 33,955 (100.0%) |
Housing Structure by Heating Type in Gainesville
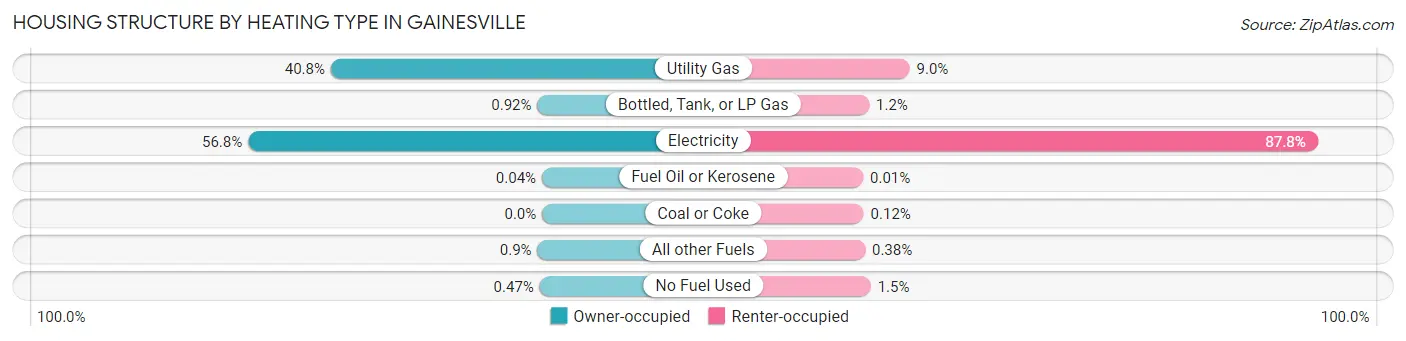
| Heating Type | Owner-occupied | Renter-occupied |
| Utility Gas | 8,674 (40.8%) | 3,057 (9.0%) |
| Bottled, Tank, or LP Gas | 196 (0.9%) | 397 (1.2%) |
| Electricity | 12,068 (56.8%) | 29,824 (87.8%) |
| Fuel Oil or Kerosene | 9 (0.0%) | 3 (0.0%) |
| Coal or Coke | 0 (0.0%) | 40 (0.1%) |
| All other Fuels | 191 (0.9%) | 130 (0.4%) |
| No Fuel Used | 100 (0.5%) | 504 (1.5%) |
| Total | 21,238 (100.0%) | 33,955 (100.0%) |
Household Vehicle Usage in Gainesville
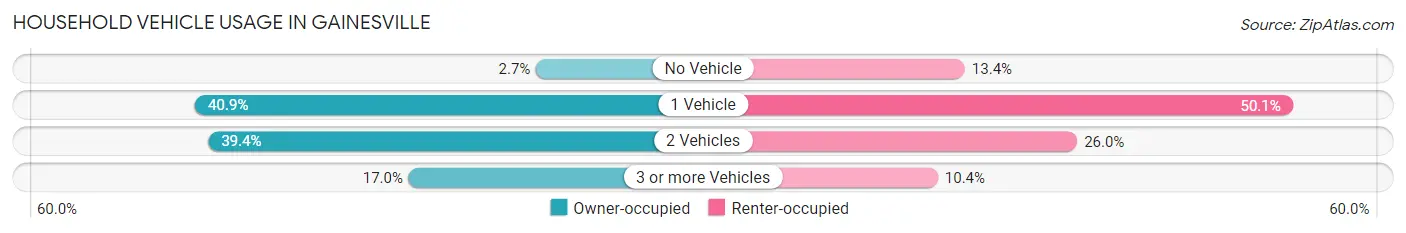
| Vehicles per Household | Owner-occupied | Renter-occupied |
| No Vehicle | 572 (2.7%) | 4,562 (13.4%) |
| 1 Vehicle | 8,689 (40.9%) | 17,025 (50.1%) |
| 2 Vehicles | 8,375 (39.4%) | 8,834 (26.0%) |
| 3 or more Vehicles | 3,602 (17.0%) | 3,534 (10.4%) |
| Total | 21,238 (100.0%) | 33,955 (100.0%) |
Real Estate & Mortgages in Gainesville
Real Estate and Mortgage Overview in Gainesville
| Characteristic | Without Mortgage | With Mortgage |
| Housing Units | 9,660 | 11,578 |
| Median Property Value | $208,400 | $221,400 |
| Median Household Income | $58,327 | $2,626 |
| Monthly Housing Costs | $553 | $601 |
| Real Estate Taxes | $1,957 | $310 |
Property Value by Mortgage Status in Gainesville
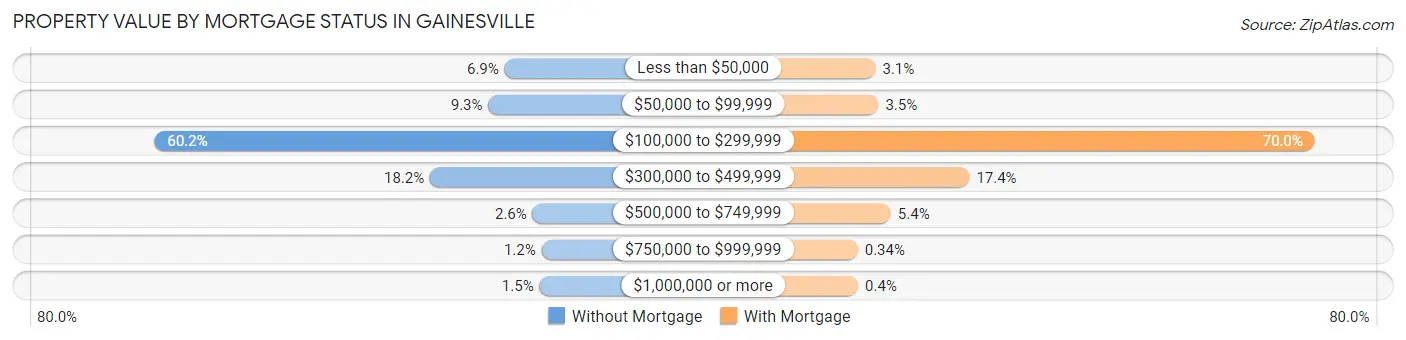
| Property Value | Without Mortgage | With Mortgage |
| Less than $50,000 | 663 (6.9%) | 353 (3.0%) |
| $50,000 to $99,999 | 901 (9.3%) | 404 (3.5%) |
| $100,000 to $299,999 | 5,818 (60.2%) | 8,102 (70.0%) |
| $300,000 to $499,999 | 1,760 (18.2%) | 2,010 (17.4%) |
| $500,000 to $749,999 | 250 (2.6%) | 624 (5.4%) |
| $750,000 to $999,999 | 119 (1.2%) | 39 (0.3%) |
| $1,000,000 or more | 149 (1.5%) | 46 (0.4%) |
| Total | 9,660 (100.0%) | 11,578 (100.0%) |
Household Income by Mortgage Status in Gainesville
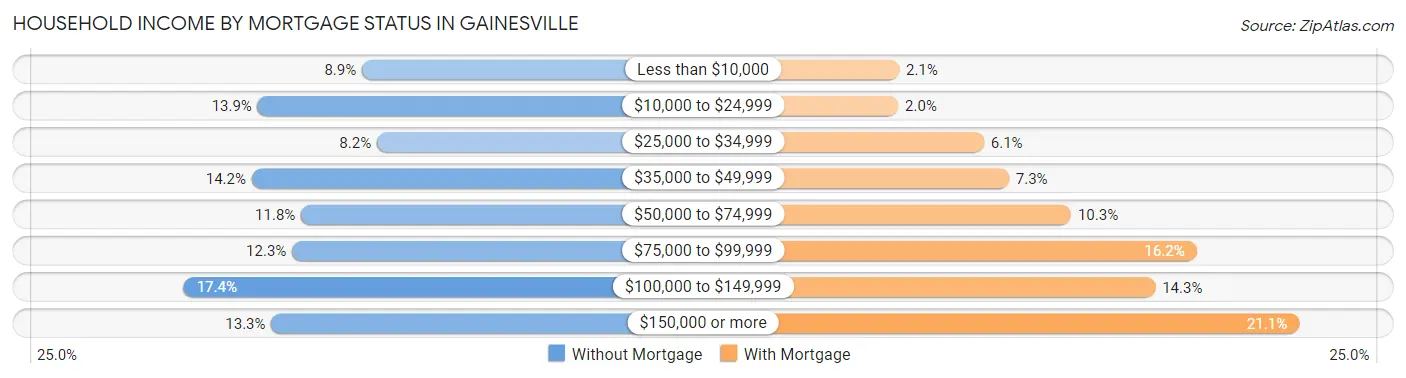
| Household Income | Without Mortgage | With Mortgage |
| Less than $10,000 | 863 (8.9%) | 240 (2.1%) |
| $10,000 to $24,999 | 1,343 (13.9%) | 235 (2.0%) |
| $25,000 to $34,999 | 794 (8.2%) | 707 (6.1%) |
| $35,000 to $49,999 | 1,370 (14.2%) | 845 (7.3%) |
| $50,000 to $74,999 | 1,143 (11.8%) | 1,188 (10.3%) |
| $75,000 to $99,999 | 1,184 (12.3%) | 1,880 (16.2%) |
| $100,000 to $149,999 | 1,683 (17.4%) | 1,652 (14.3%) |
| $150,000 or more | 1,280 (13.3%) | 2,445 (21.1%) |
| Total | 9,660 (100.0%) | 11,578 (100.0%) |
Property Value to Household Income Ratio in Gainesville
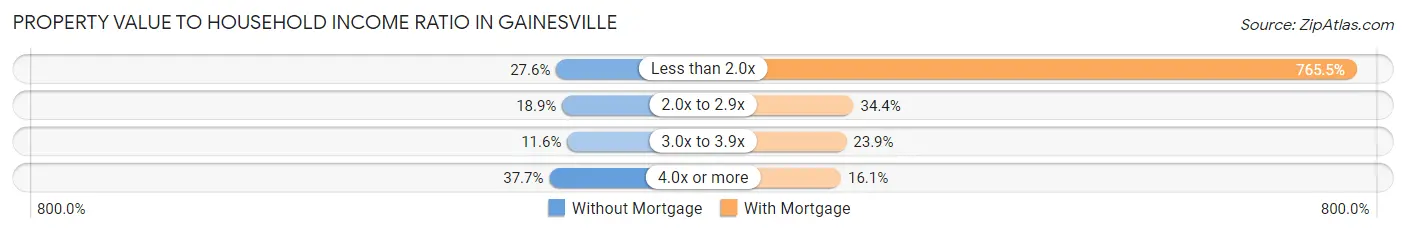
| Value-to-Income Ratio | Without Mortgage | With Mortgage |
| Less than 2.0x | 2,665 (27.6%) | 88,625 (765.5%) |
| 2.0x to 2.9x | 1,826 (18.9%) | 3,983 (34.4%) |
| 3.0x to 3.9x | 1,119 (11.6%) | 2,766 (23.9%) |
| 4.0x or more | 3,643 (37.7%) | 1,867 (16.1%) |
| Total | 9,660 (100.0%) | 11,578 (100.0%) |
Real Estate Taxes by Mortgage Status in Gainesville
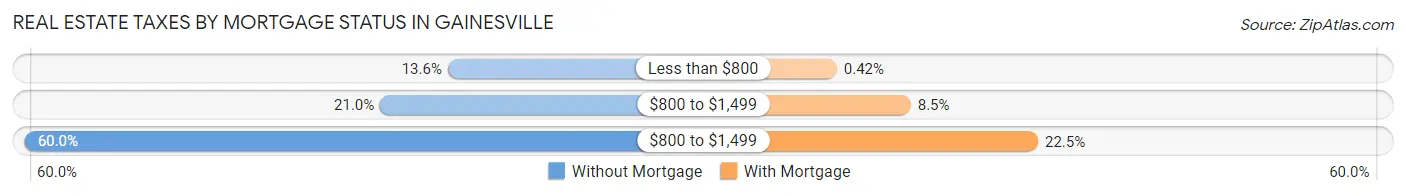
| Property Taxes | Without Mortgage | With Mortgage |
| Less than $800 | 1,317 (13.6%) | 49 (0.4%) |
| $800 to $1,499 | 2,032 (21.0%) | 987 (8.5%) |
| $800 to $1,499 | 5,794 (60.0%) | 2,602 (22.5%) |
| Total | 9,660 (100.0%) | 11,578 (100.0%) |
Health & Disability in Gainesville
Health Insurance Coverage by Age in Gainesville
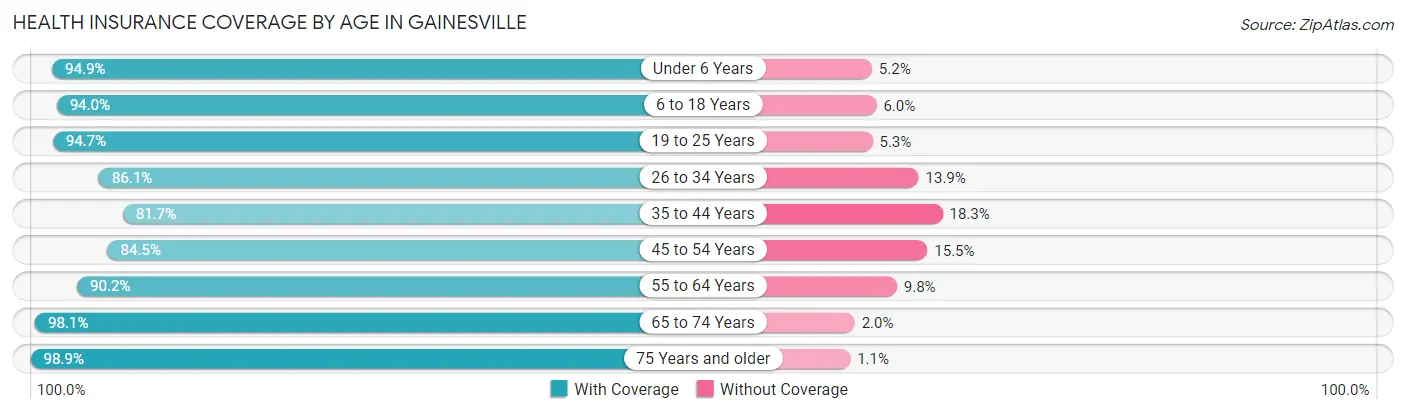
| Age Bracket | With Coverage | Without Coverage |
| Under 6 Years | 6,627 (94.9%) | 360 (5.1%) |
| 6 to 18 Years | 18,409 (94.0%) | 1,175 (6.0%) |
| 19 to 25 Years | 42,139 (94.7%) | 2,342 (5.3%) |
| 26 to 34 Years | 18,533 (86.1%) | 2,981 (13.9%) |
| 35 to 44 Years | 10,715 (81.7%) | 2,404 (18.3%) |
| 45 to 54 Years | 8,052 (84.5%) | 1,476 (15.5%) |
| 55 to 64 Years | 9,454 (90.2%) | 1,027 (9.8%) |
| 65 to 74 Years | 8,861 (98.1%) | 176 (1.9%) |
| 75 Years and older | 5,676 (98.9%) | 64 (1.1%) |
| Total | 128,466 (91.4%) | 12,005 (8.6%) |
Health Insurance Coverage by Citizenship Status in Gainesville
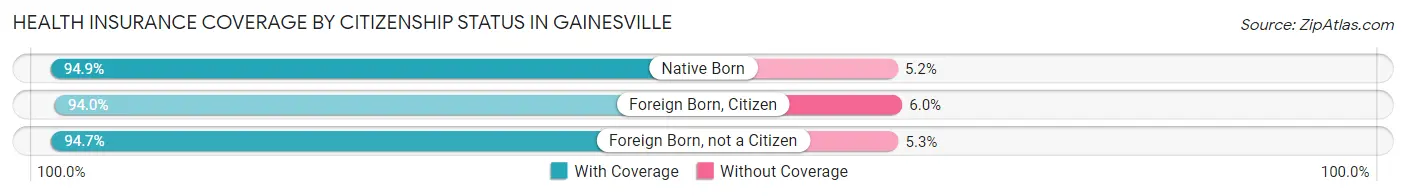
| Citizenship Status | With Coverage | Without Coverage |
| Native Born | 6,627 (94.9%) | 360 (5.1%) |
| Foreign Born, Citizen | 18,409 (94.0%) | 1,175 (6.0%) |
| Foreign Born, not a Citizen | 42,139 (94.7%) | 2,342 (5.3%) |
Health Insurance Coverage by Household Income in Gainesville
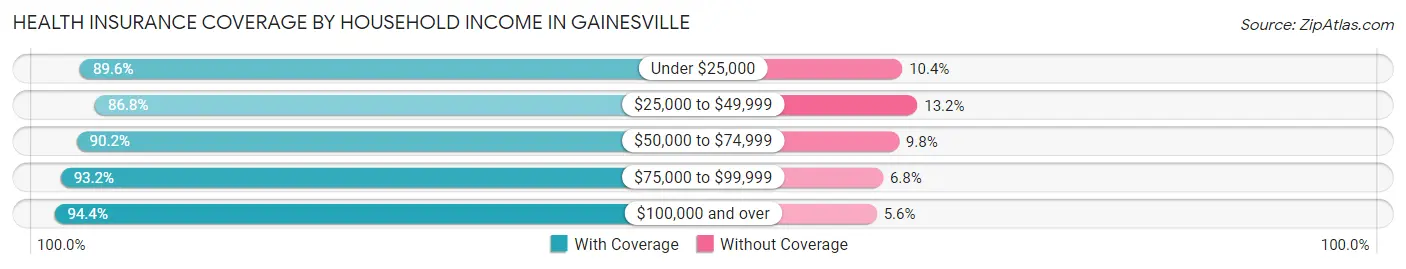
| Household Income | With Coverage | Without Coverage |
| Under $25,000 | 28,923 (89.6%) | 3,350 (10.4%) |
| $25,000 to $49,999 | 24,055 (86.8%) | 3,662 (13.2%) |
| $50,000 to $74,999 | 16,256 (90.2%) | 1,759 (9.8%) |
| $75,000 to $99,999 | 14,563 (93.2%) | 1,058 (6.8%) |
| $100,000 and over | 29,964 (94.4%) | 1,781 (5.6%) |
Public vs Private Health Insurance Coverage by Age in Gainesville
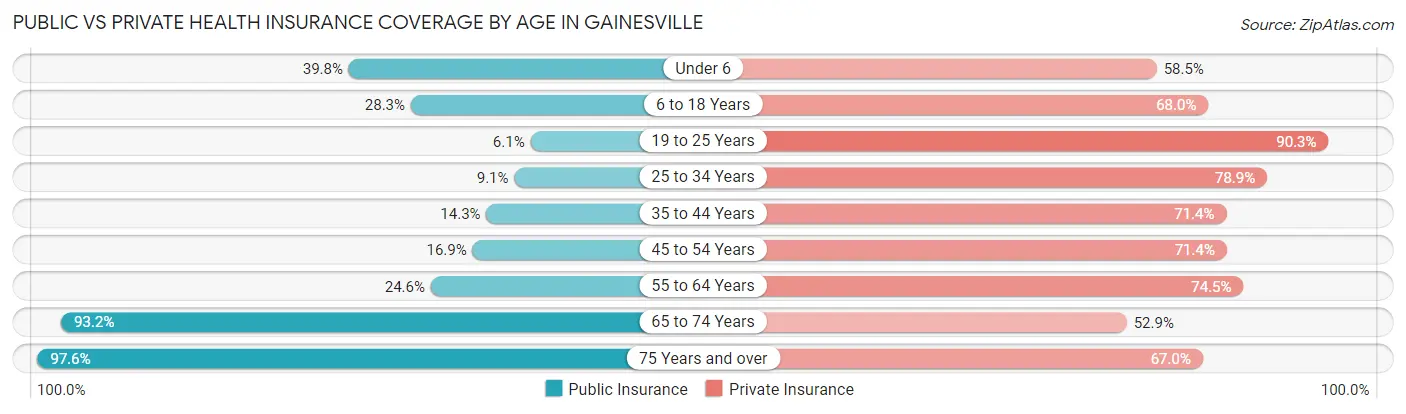
| Age Bracket | Public Insurance | Private Insurance |
| Under 6 | 2,782 (39.8%) | 4,084 (58.5%) |
| 6 to 18 Years | 5,542 (28.3%) | 13,320 (68.0%) |
| 19 to 25 Years | 2,712 (6.1%) | 40,172 (90.3%) |
| 25 to 34 Years | 1,955 (9.1%) | 16,980 (78.9%) |
| 35 to 44 Years | 1,874 (14.3%) | 9,363 (71.4%) |
| 45 to 54 Years | 1,605 (16.9%) | 6,807 (71.4%) |
| 55 to 64 Years | 2,579 (24.6%) | 7,812 (74.5%) |
| 65 to 74 Years | 8,426 (93.2%) | 4,780 (52.9%) |
| 75 Years and over | 5,604 (97.6%) | 3,845 (67.0%) |
| Total | 33,079 (23.5%) | 107,163 (76.3%) |
Disability Status by Sex by Age in Gainesville
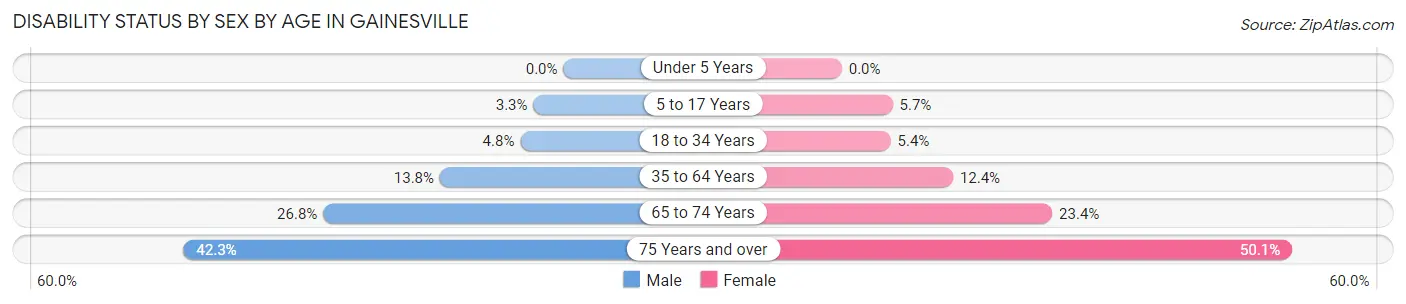
| Age Bracket | Male | Female |
| Under 5 Years | 0 (0.0%) | 0 (0.0%) |
| 5 to 17 Years | 249 (3.3%) | 342 (5.7%) |
| 18 to 34 Years | 1,652 (4.8%) | 2,112 (5.4%) |
| 35 to 64 Years | 2,239 (13.8%) | 2,086 (12.4%) |
| 65 to 74 Years | 980 (26.8%) | 1,259 (23.4%) |
| 75 Years and over | 941 (42.3%) | 1,763 (50.1%) |
Disability Class by Sex by Age in Gainesville
Disability Class: Hearing Difficulty
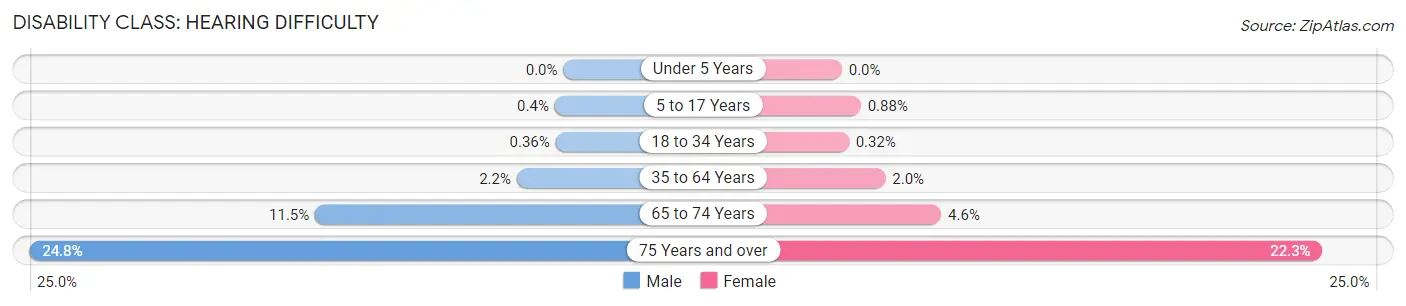
| Age Bracket | Male | Female |
| Under 5 Years | 0 (0.0%) | 0 (0.0%) |
| 5 to 17 Years | 30 (0.4%) | 53 (0.9%) |
| 18 to 34 Years | 124 (0.4%) | 124 (0.3%) |
| 35 to 64 Years | 352 (2.2%) | 340 (2.0%) |
| 65 to 74 Years | 422 (11.5%) | 248 (4.6%) |
| 75 Years and over | 551 (24.8%) | 784 (22.3%) |
Disability Class: Vision Difficulty
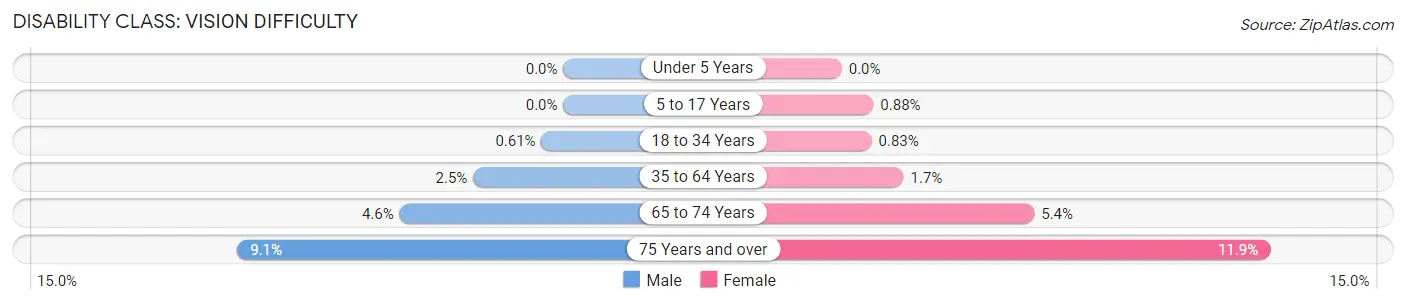
| Age Bracket | Male | Female |
| Under 5 Years | 0 (0.0%) | 0 (0.0%) |
| 5 to 17 Years | 0 (0.0%) | 53 (0.9%) |
| 18 to 34 Years | 211 (0.6%) | 321 (0.8%) |
| 35 to 64 Years | 409 (2.5%) | 289 (1.7%) |
| 65 to 74 Years | 167 (4.6%) | 288 (5.4%) |
| 75 Years and over | 202 (9.1%) | 419 (11.9%) |
Disability Class: Cognitive Difficulty
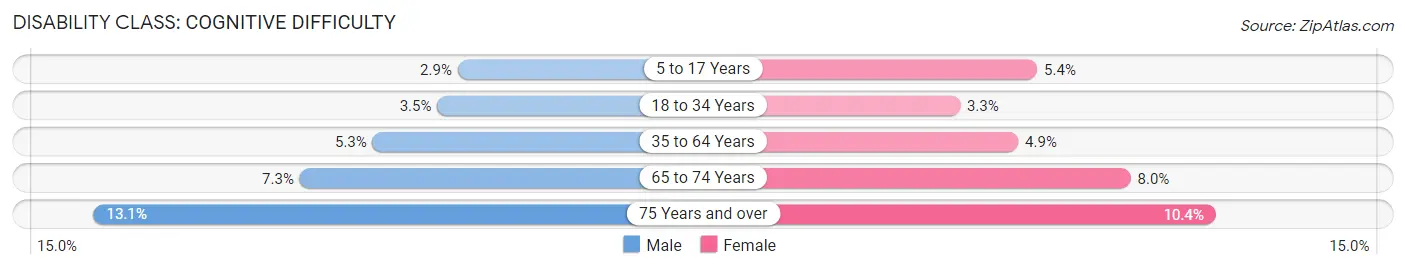
| Age Bracket | Male | Female |
| 5 to 17 Years | 219 (2.9%) | 329 (5.4%) |
| 18 to 34 Years | 1,206 (3.5%) | 1,277 (3.3%) |
| 35 to 64 Years | 864 (5.3%) | 828 (4.9%) |
| 65 to 74 Years | 269 (7.3%) | 432 (8.0%) |
| 75 Years and over | 291 (13.1%) | 366 (10.4%) |
Disability Class: Ambulatory Difficulty
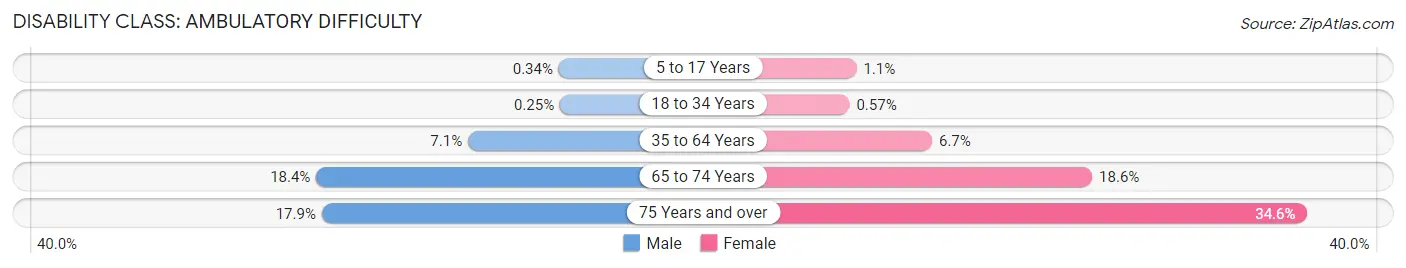
| Age Bracket | Male | Female |
| 5 to 17 Years | 25 (0.3%) | 66 (1.1%) |
| 18 to 34 Years | 85 (0.3%) | 221 (0.6%) |
| 35 to 64 Years | 1,152 (7.1%) | 1,129 (6.7%) |
| 65 to 74 Years | 672 (18.3%) | 999 (18.6%) |
| 75 Years and over | 399 (17.9%) | 1,215 (34.6%) |
Disability Class: Self-Care Difficulty
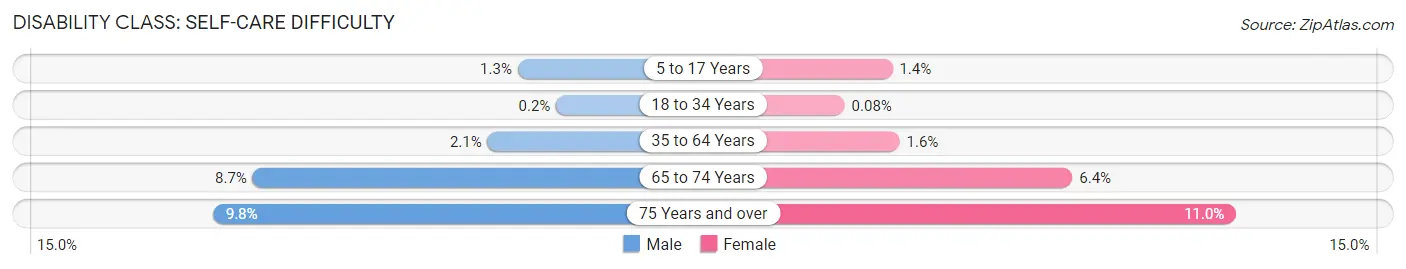
| Age Bracket | Male | Female |
| 5 to 17 Years | 95 (1.3%) | 85 (1.4%) |
| 18 to 34 Years | 70 (0.2%) | 33 (0.1%) |
| 35 to 64 Years | 344 (2.1%) | 272 (1.6%) |
| 65 to 74 Years | 317 (8.6%) | 345 (6.4%) |
| 75 Years and over | 217 (9.8%) | 386 (11.0%) |
Technology Access in Gainesville
Computing Device Access in Gainesville
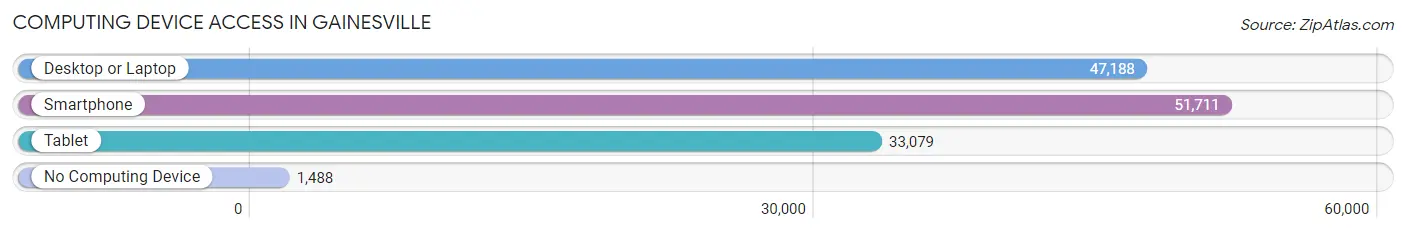
| Device Type | # Households | % Households |
| Desktop or Laptop | 47,188 | 85.5% |
| Smartphone | 51,711 | 93.7% |
| Tablet | 33,079 | 59.9% |
| No Computing Device | 1,488 | 2.7% |
| Total | 55,193 | 100.0% |
Internet Access in Gainesville
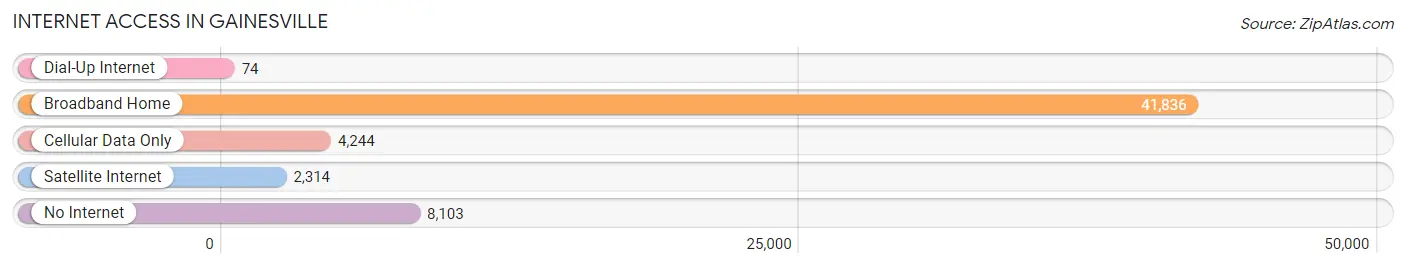
| Internet Type | # Households | % Households |
| Dial-Up Internet | 74 | 0.1% |
| Broadband Home | 41,836 | 75.8% |
| Cellular Data Only | 4,244 | 7.7% |
| Satellite Internet | 2,314 | 4.2% |
| No Internet | 8,103 | 14.7% |
| Total | 55,193 | 100.0% |
Gainesville Summary
Gainesville, Florida is a city located in Alachua County in the north-central part of the state. It is the county seat and the largest city in the county. The city is home to the University of Florida, the state’s flagship university, and Santa Fe College. Gainesville is known for its vibrant culture, diverse population, and natural beauty.
History
Gainesville was founded in 1854 by Edward B. Phillips, a cotton planter from South Carolina. The city was named after General Edmund P. Gaines, a hero of the War of 1812. The city was incorporated in 1869 and was the first city in Alachua County.
In the late 19th century, Gainesville was a major center for the citrus industry. The city was also home to several large lumber mills. In the early 20th century, the city became a major center for the phosphate industry.
In the 1950s, the University of Florida was established in Gainesville. This led to a population boom and the city’s growth as a college town.
Geography
Gainesville is located in north-central Florida, about 70 miles southwest of Jacksonville and about 90 miles northwest of Orlando. The city is situated on the banks of the Santa Fe River and is surrounded by rolling hills and forests.
The city has a humid subtropical climate, with hot, humid summers and mild winters. The average annual temperature is 68°F (20°C).
Economy
Gainesville’s economy is largely driven by the University of Florida and Santa Fe College. The city is home to several major employers, including the University of Florida, Shands Hospital, and the Gainesville Regional Airport.
The city is also home to several major industries, including healthcare, technology, and manufacturing. The city is a major center for research and development, and is home to several major research institutions, including the University of Florida’s Sid Martin Biotechnology Institute.
Demographics
As of the 2010 census, the population of Gainesville was 124,354. The city has a diverse population, with a majority of white (63.2%), followed by African American (20.2%), Hispanic (9.2%), and Asian (3.2%) residents.
The median household income in Gainesville is $37,845, and the median home value is $164,400. The city has a poverty rate of 22.3%.
Conclusion
Gainesville, Florida is a vibrant city with a diverse population and a strong economy. The city is home to the University of Florida and Santa Fe College, and is a major center for research and development. The city has a humid subtropical climate and is surrounded by rolling hills and forests. Gainesville is a great place to live, work, and play.
Common Questions
What is Per Capita Income in Gainesville?
Per Capita income in Gainesville is $27,414.
What is the Median Family Income in Gainesville?
Median Family Income in Gainesville is $72,147.
What is the Median Household income in Gainesville?
Median Household Income in Gainesville is $43,783.
What is Income or Wage Gap in Gainesville?
Income or Wage Gap in Gainesville is 16.3%.
Women in Gainesville earn 83.7 cents for every dollar earned by a man.
What is Family Income Deficit in Gainesville?
Family Income Deficit in Gainesville is $10,482.
Families that are below poverty line in Gainesville earn $10,482 less on average than the poverty threshold level.
What is Inequality or Gini Index in Gainesville?
Inequality or Gini Index in Gainesville is 0.53.
What is the Total Population of Gainesville?
Total Population of Gainesville is 142,414.
What is the Total Male Population of Gainesville?
Total Male Population of Gainesville is 67,984.
What is the Total Female Population of Gainesville?
Total Female Population of Gainesville is 74,430.
What is the Ratio of Males per 100 Females in Gainesville?
There are 91.34 Males per 100 Females in Gainesville.
What is the Ratio of Females per 100 Males in Gainesville?
There are 109.48 Females per 100 Males in Gainesville.
What is the Median Population Age in Gainesville?
Median Population Age in Gainesville is 26.0 Years.
What is the Average Family Size in Gainesville
Average Family Size in Gainesville is 3.2 People.
What is the Average Household Size in Gainesville
Average Household Size in Gainesville is 2.3 People.
How Large is the Labor Force in Gainesville?
There are 72,229 People in the Labor Forcein in Gainesville.
What is the Percentage of People in the Labor Force in Gainesville?
57.8% of People are in the Labor Force in Gainesville.
What is the Unemployment Rate in Gainesville?
Unemployment Rate in Gainesville is 5.5%.