Provo, UT Map & Demographics
Provo Map
Provo Overview
$25,228
PER CAPITA INCOME
$66,422
AVG FAMILY INCOME
$57,943
AVG HOUSEHOLD INCOME
44.0%
WAGE / INCOME GAP [ % ]
56.0¢/ $1
WAGE / INCOME GAP [ $ ]
$9,079
FAMILY INCOME DEFICIT
0.48
INEQUALITY / GINI INDEX
114,400
TOTAL POPULATION
55,782
MALE POPULATION
58,618
FEMALE POPULATION
95.16
MALES / 100 FEMALES
105.08
FEMALES / 100 MALES
23.6
MEDIAN AGE
3.2
AVG FAMILY SIZE
3.0
AVG HOUSEHOLD SIZE
69,457
LABOR FORCE [ PEOPLE ]
72.8%
PERCENT IN LABOR FORCE
4.4%
UNEMPLOYMENT RATE
Income in Provo
Income Overview in Provo
Per Capita Income in Provo is $25,228, while median incomes of families and households are $66,422 and $57,943 respectively.
| Characteristic | Number | Measure |
| Per Capita Income | 114,400 | $25,228 |
| Median Family Income | 22,721 | $66,422 |
| Mean Family Income | 22,721 | $89,195 |
| Median Household Income | 33,151 | $57,943 |
| Mean Household Income | 33,151 | $82,292 |
| Income Deficit | 22,721 | $9,079 |
| Wage / Income Gap (%) | 114,400 | 44.01% |
| Wage / Income Gap ($) | 114,400 | 55.99¢ per $1 |
| Gini / Inequality Index | 114,400 | 0.48 |
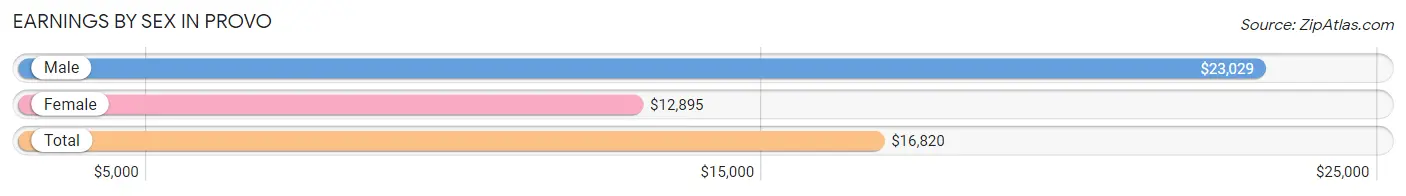
Earnings by Sex in Provo
Average Earnings in Provo are $16,820, $23,029 for men and $12,895 for women, a difference of 44.0%.
| Sex | Number | Average Earnings |
| Male | 39,854 (52.0%) | $23,029 |
| Female | 36,815 (48.0%) | $12,895 |
| Total | 76,669 (100.0%) | $16,820 |
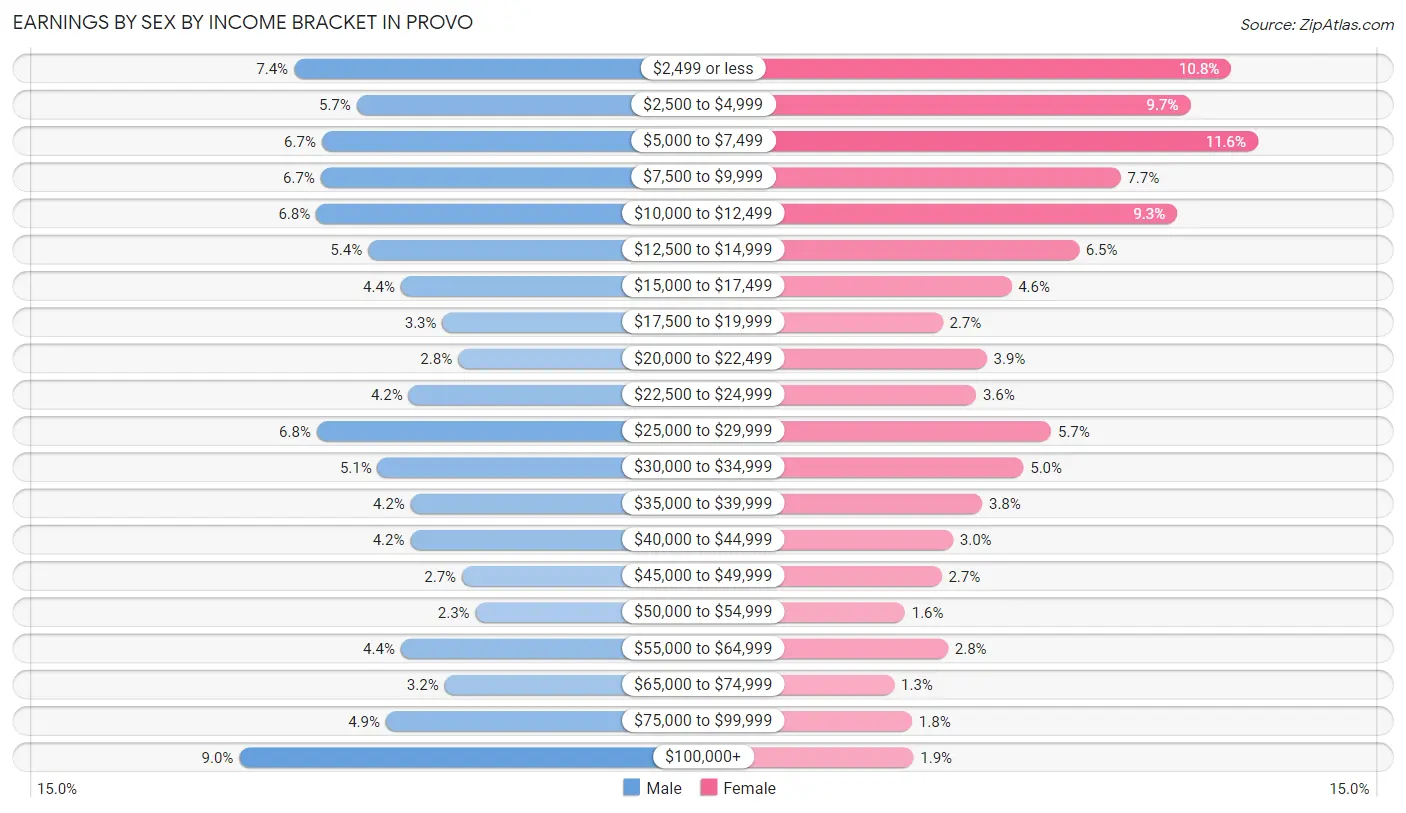
Earnings by Sex by Income Bracket in Provo
The most common earnings brackets in Provo are $100,000+ for men (3,576 | 9.0%) and $5,000 to $7,499 for women (4,251 | 11.6%).
| Income | Male | Female |
| $2,499 or less | 2,961 (7.4%) | 3,976 (10.8%) |
| $2,500 to $4,999 | 2,260 (5.7%) | 3,553 (9.7%) |
| $5,000 to $7,499 | 2,650 (6.7%) | 4,251 (11.6%) |
| $7,500 to $9,999 | 2,664 (6.7%) | 2,832 (7.7%) |
| $10,000 to $12,499 | 2,713 (6.8%) | 3,416 (9.3%) |
| $12,500 to $14,999 | 2,134 (5.3%) | 2,400 (6.5%) |
| $15,000 to $17,499 | 1,765 (4.4%) | 1,702 (4.6%) |
| $17,500 to $19,999 | 1,301 (3.3%) | 989 (2.7%) |
| $20,000 to $22,499 | 1,124 (2.8%) | 1,446 (3.9%) |
| $22,500 to $24,999 | 1,679 (4.2%) | 1,336 (3.6%) |
| $25,000 to $29,999 | 2,708 (6.8%) | 2,113 (5.7%) |
| $30,000 to $34,999 | 2,026 (5.1%) | 1,827 (5.0%) |
| $35,000 to $39,999 | 1,653 (4.2%) | 1,399 (3.8%) |
| $40,000 to $44,999 | 1,656 (4.2%) | 1,096 (3.0%) |
| $45,000 to $49,999 | 1,082 (2.7%) | 980 (2.7%) |
| $50,000 to $54,999 | 929 (2.3%) | 600 (1.6%) |
| $55,000 to $64,999 | 1,764 (4.4%) | 1,047 (2.8%) |
| $65,000 to $74,999 | 1,275 (3.2%) | 490 (1.3%) |
| $75,000 to $99,999 | 1,934 (4.9%) | 675 (1.8%) |
| $100,000+ | 3,576 (9.0%) | 687 (1.9%) |
| Total | 39,854 (100.0%) | 36,815 (100.0%) |
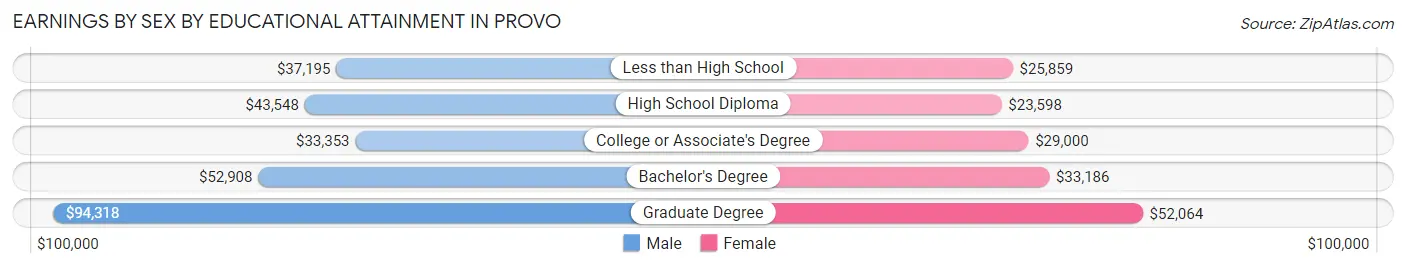
Earnings by Sex by Educational Attainment in Provo
Average earnings in Provo are $43,934 for men and $30,039 for women, a difference of 31.6%. Men with an educational attainment of graduate degree enjoy the highest average annual earnings of $94,318, while those with college or associate's degree education earn the least with $33,353. Women with an educational attainment of graduate degree earn the most with the average annual earnings of $52,064, while those with high school diploma education have the smallest earnings of $23,598.
| Educational Attainment | Male Income | Female Income |
| Less than High School | $37,195 | $25,859 |
| High School Diploma | $43,548 | $23,598 |
| College or Associate's Degree | $33,353 | $29,000 |
| Bachelor's Degree | $52,908 | $33,186 |
| Graduate Degree | $94,318 | $52,064 |
| Total | $43,934 | $30,039 |
Family Income in Provo
Family Income Brackets in Provo
According to the Provo family income data, there are 3,772 families falling into the $50,000 to $74,999 income range, which is the most common income bracket and makes up 16.6% of all families. Conversely, the $10,000 to $14,999 income bracket is the least frequent group with only 977 families (4.3%) belonging to this category.
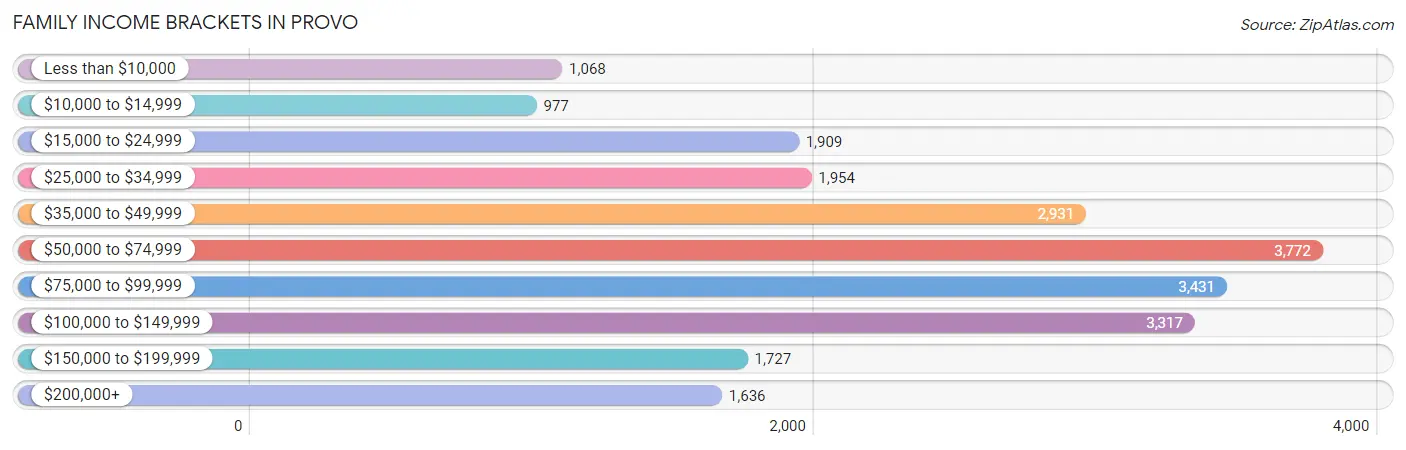
| Income Bracket | # Families | % Families |
| Less than $10,000 | 1,068 | 4.7% |
| $10,000 to $14,999 | 977 | 4.3% |
| $15,000 to $24,999 | 1,909 | 8.4% |
| $25,000 to $34,999 | 1,954 | 8.6% |
| $35,000 to $49,999 | 2,931 | 12.9% |
| $50,000 to $74,999 | 3,772 | 16.6% |
| $75,000 to $99,999 | 3,431 | 15.1% |
| $100,000 to $149,999 | 3,317 | 14.6% |
| $150,000 to $199,999 | 1,727 | 7.6% |
| $200,000+ | 1,636 | 7.2% |
Family Income by Famaliy Size in Provo
7+ person families (1,003 | 4.4%) account for the highest median family income in Provo with $120,625 per family, while 3-person families (4,135 | 18.2%) have the highest median income of $26,951 per family member.
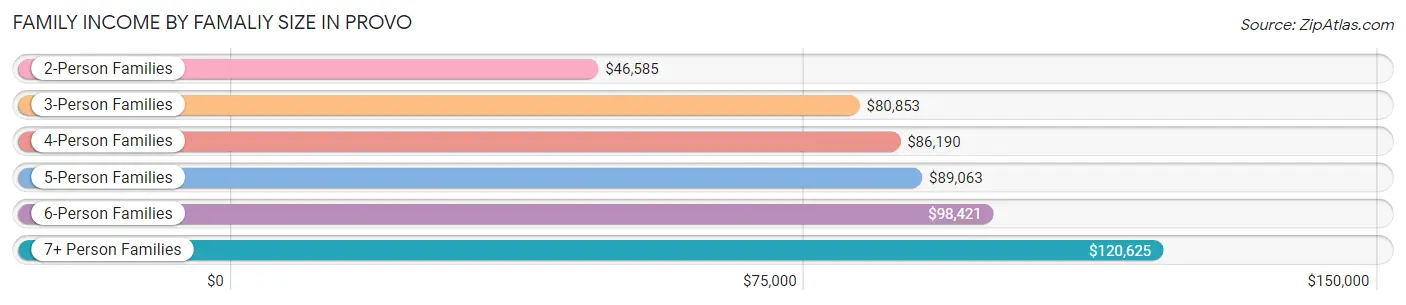
| Income Bracket | # Families | Median Income |
| 2-Person Families | 11,183 (49.2%) | $46,585 |
| 3-Person Families | 4,135 (18.2%) | $80,853 |
| 4-Person Families | 3,082 (13.6%) | $86,190 |
| 5-Person Families | 2,040 (9.0%) | $89,063 |
| 6-Person Families | 1,278 (5.6%) | $98,421 |
| 7+ Person Families | 1,003 (4.4%) | $120,625 |
| Total | 22,721 (100.0%) | $66,422 |
Family Income by Number of Earners in Provo
The median family income in Provo is $66,422, with families comprising 3+ earners (3,419) having the highest median family income of $129,608, while families with 1 earner (5,759) have the lowest median family income of $54,085, accounting for 15.0% and 25.4% of families, respectively.
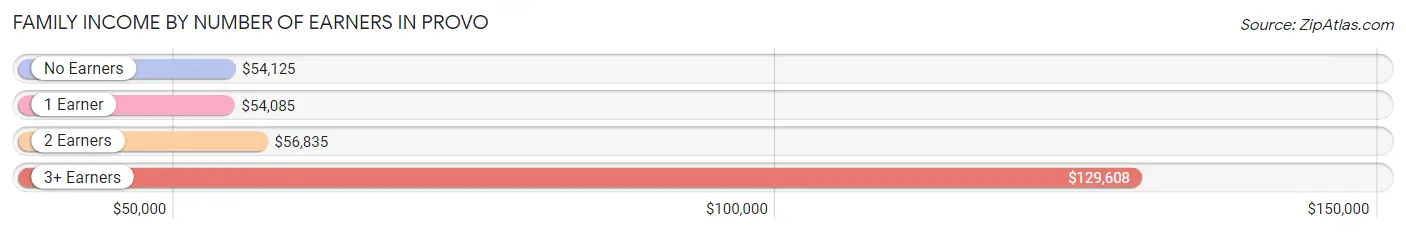
| Number of Earners | # Families | Median Income |
| No Earners | 1,484 (6.5%) | $54,125 |
| 1 Earner | 5,759 (25.4%) | $54,085 |
| 2 Earners | 12,059 (53.1%) | $56,835 |
| 3+ Earners | 3,419 (15.0%) | $129,608 |
| Total | 22,721 (100.0%) | $66,422 |
Household Income in Provo
Household Income Brackets in Provo
With 5,934 households falling in the category, the $50,000 to $74,999 income range is the most frequent in Provo, accounting for 17.9% of all households. In contrast, only 1,790 households (5.4%) fall into the less than $10,000 income bracket, making it the least populous group.
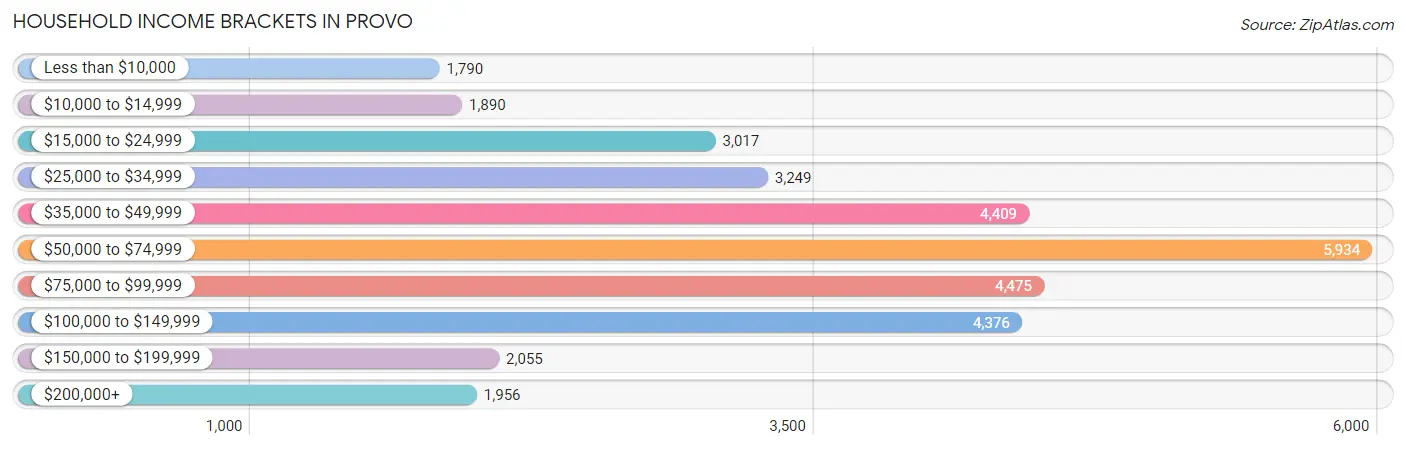
| Income Bracket | # Households | % Households |
| Less than $10,000 | 1,790 | 5.4% |
| $10,000 to $14,999 | 1,890 | 5.7% |
| $15,000 to $24,999 | 3,017 | 9.1% |
| $25,000 to $34,999 | 3,249 | 9.8% |
| $35,000 to $49,999 | 4,409 | 13.3% |
| $50,000 to $74,999 | 5,934 | 17.9% |
| $75,000 to $99,999 | 4,475 | 13.5% |
| $100,000 to $149,999 | 4,376 | 13.2% |
| $150,000 to $199,999 | 2,055 | 6.2% |
| $200,000+ | 1,956 | 5.9% |
Household Income by Householder Age in Provo
The median household income in Provo is $57,943, with the highest median household income of $97,971 found in the 45 to 64 years age bracket for the primary householder. A total of 6,409 households (19.3%) fall into this category. Meanwhile, the 15 to 24 years age bracket for the primary householder has the lowest median household income of $35,750, with 10,356 households (31.2%) in this group.
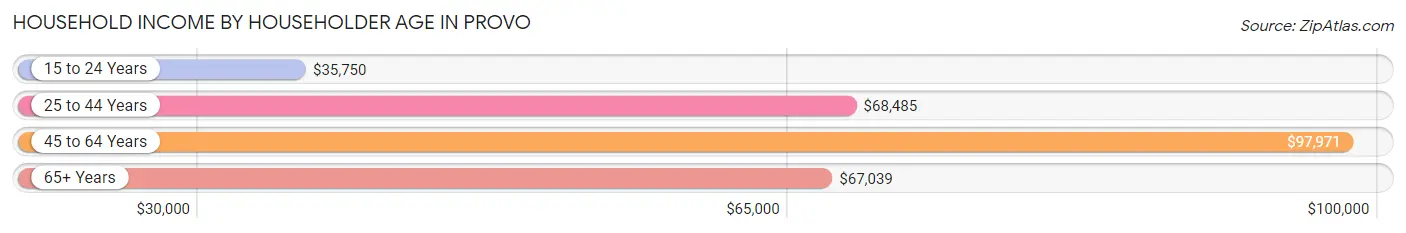
| Income Bracket | # Households | Median Income |
| 15 to 24 Years | 10,356 (31.2%) | $35,750 |
| 25 to 44 Years | 12,075 (36.4%) | $68,485 |
| 45 to 64 Years | 6,409 (19.3%) | $97,971 |
| 65+ Years | 4,311 (13.0%) | $67,039 |
| Total | 33,151 (100.0%) | $57,943 |
Poverty in Provo
Income Below Poverty by Sex and Age in Provo
With 22.5% poverty level for males and 27.2% for females among the residents of Provo, 18 to 24 year old males and 18 to 24 year old females are the most vulnerable to poverty, with 6,671 males (40.3%) and 8,796 females (47.3%) in their respective age groups living below the poverty level.
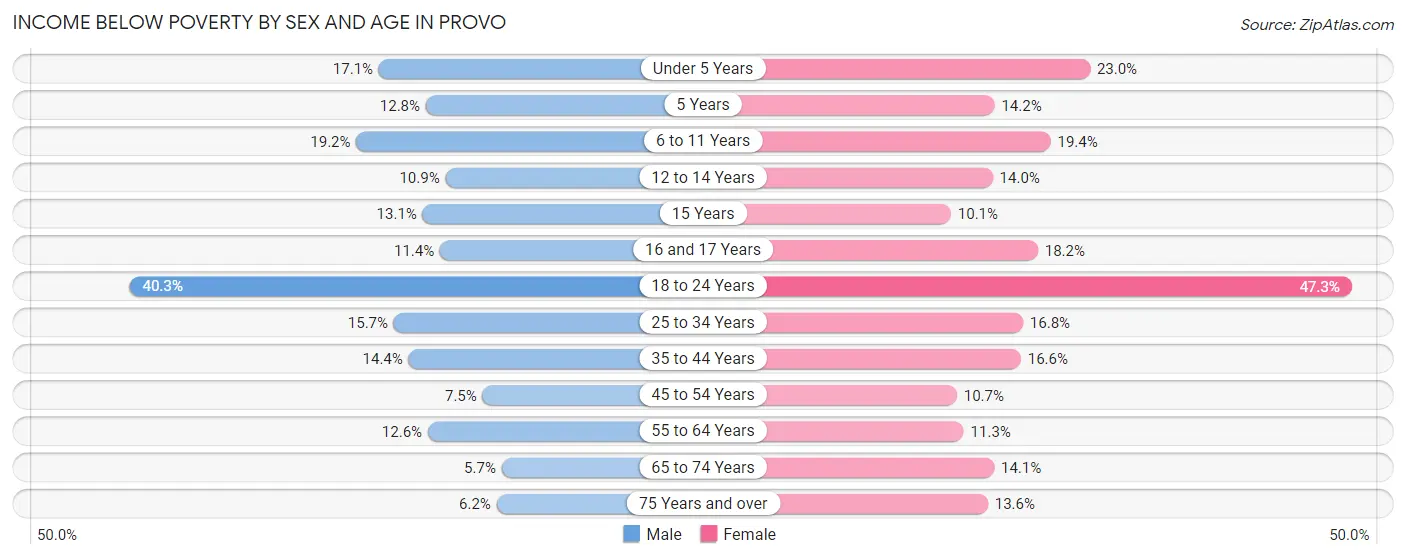
| Age Bracket | Male | Female |
| Under 5 Years | 564 (17.1%) | 776 (23.0%) |
| 5 Years | 49 (12.8%) | 72 (14.2%) |
| 6 to 11 Years | 620 (19.2%) | 656 (19.4%) |
| 12 to 14 Years | 187 (10.9%) | 216 (14.0%) |
| 15 Years | 81 (13.1%) | 60 (10.1%) |
| 16 and 17 Years | 125 (11.4%) | 243 (18.2%) |
| 18 to 24 Years | 6,671 (40.3%) | 8,796 (47.3%) |
| 25 to 34 Years | 1,512 (15.7%) | 1,267 (16.8%) |
| 35 to 44 Years | 613 (14.4%) | 761 (16.6%) |
| 45 to 54 Years | 230 (7.5%) | 363 (10.7%) |
| 55 to 64 Years | 371 (12.6%) | 328 (11.3%) |
| 65 to 74 Years | 103 (5.7%) | 317 (14.1%) |
| 75 Years and over | 72 (6.2%) | 266 (13.6%) |
| Total | 11,198 (22.5%) | 14,121 (27.2%) |
Income Above Poverty by Sex and Age in Provo
According to the poverty statistics in Provo, males aged 65 to 74 years and females aged 15 years are the age groups that are most secure financially, with 94.3% of males and 89.9% of females in these age groups living above the poverty line.
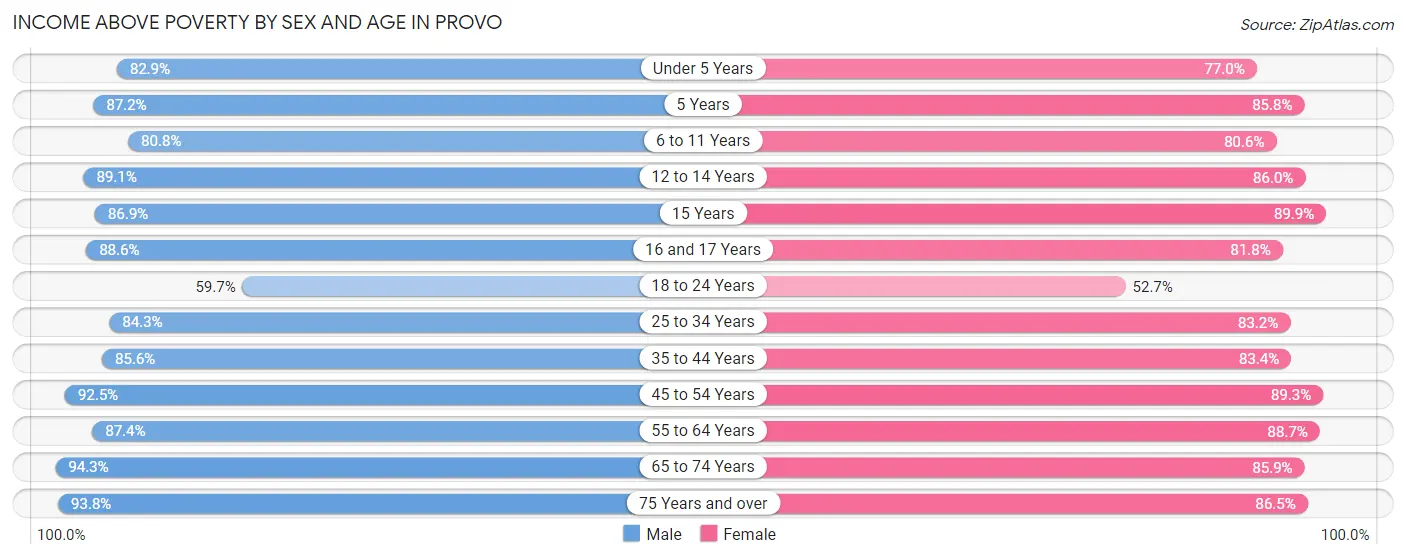
| Age Bracket | Male | Female |
| Under 5 Years | 2,730 (82.9%) | 2,593 (77.0%) |
| 5 Years | 335 (87.2%) | 436 (85.8%) |
| 6 to 11 Years | 2,607 (80.8%) | 2,731 (80.6%) |
| 12 to 14 Years | 1,523 (89.1%) | 1,327 (86.0%) |
| 15 Years | 539 (86.9%) | 533 (89.9%) |
| 16 and 17 Years | 968 (88.6%) | 1,093 (81.8%) |
| 18 to 24 Years | 9,900 (59.7%) | 9,791 (52.7%) |
| 25 to 34 Years | 8,099 (84.3%) | 6,271 (83.2%) |
| 35 to 44 Years | 3,655 (85.6%) | 3,821 (83.4%) |
| 45 to 54 Years | 2,840 (92.5%) | 3,040 (89.3%) |
| 55 to 64 Years | 2,581 (87.4%) | 2,572 (88.7%) |
| 65 to 74 Years | 1,699 (94.3%) | 1,926 (85.9%) |
| 75 Years and over | 1,092 (93.8%) | 1,697 (86.5%) |
| Total | 38,568 (77.5%) | 37,831 (72.8%) |
Income Below Poverty Among Married-Couple Families in Provo
The poverty statistics for married-couple families in Provo show that 13.1% or 2,416 of the total 18,397 families live below the poverty line. Families with 3 or 4 children have the highest poverty rate of 17.5%, comprising of 363 families. On the other hand, families with 5 or more children have the lowest poverty rate of 5.4%, which includes 27 families.
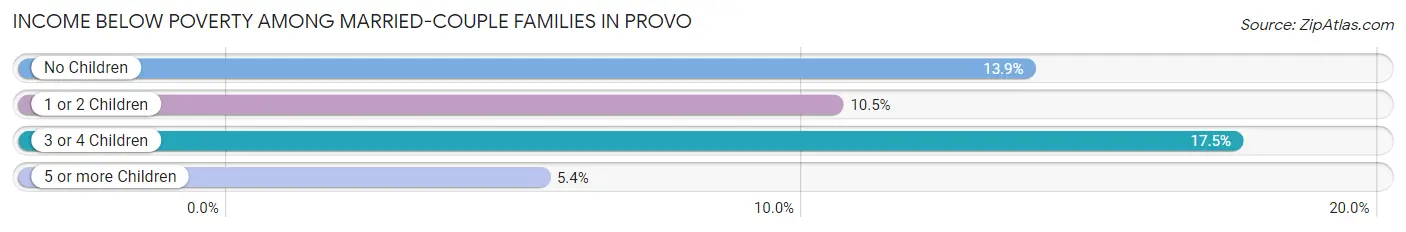
| Children | Above Poverty | Below Poverty |
| No Children | 9,225 (86.1%) | 1,487 (13.9%) |
| 1 or 2 Children | 4,574 (89.5%) | 539 (10.5%) |
| 3 or 4 Children | 1,712 (82.5%) | 363 (17.5%) |
| 5 or more Children | 470 (94.6%) | 27 (5.4%) |
| Total | 15,981 (86.9%) | 2,416 (13.1%) |
Income Below Poverty Among Single-Parent Households in Provo
According to the poverty data in Provo, 29.8% or 506 single-father households and 24.6% or 646 single-mother households are living below the poverty line. Among single-father households, those with 3 or 4 children have the highest poverty rate, with 109 households (80.1%) experiencing poverty. Likewise, among single-mother households, those with 5 or more children have the highest poverty rate, with 23 households (76.7%) falling below the poverty line.
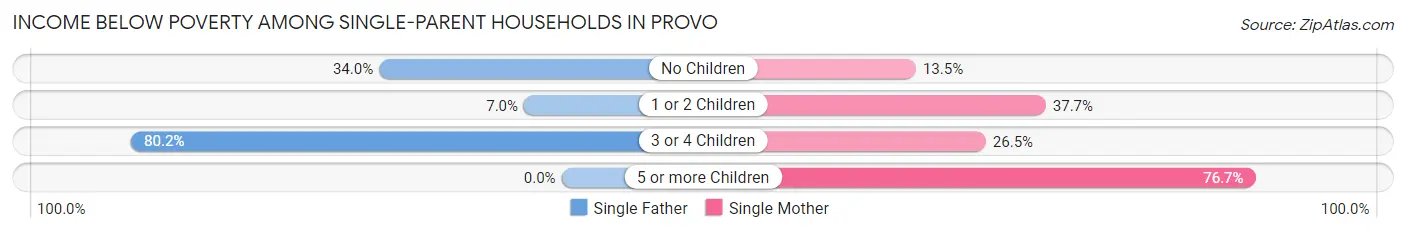
| Children | Single Father | Single Mother |
| No Children | 363 (34.0%) | 174 (13.5%) |
| 1 or 2 Children | 34 (7.0%) | 351 (37.7%) |
| 3 or 4 Children | 109 (80.1%) | 98 (26.5%) |
| 5 or more Children | 0 (0.0%) | 23 (76.7%) |
| Total | 506 (29.8%) | 646 (24.6%) |
Income Below Poverty Among Married-Couple vs Single-Parent Households in Provo
The poverty data for Provo shows that 2,416 of the married-couple family households (13.1%) and 1,152 of the single-parent households (26.6%) are living below the poverty level. Within the married-couple family households, those with 3 or 4 children have the highest poverty rate, with 363 households (17.5%) falling below the poverty line. Among the single-parent households, those with 5 or more children have the highest poverty rate, with 23 household (56.1%) living below poverty.
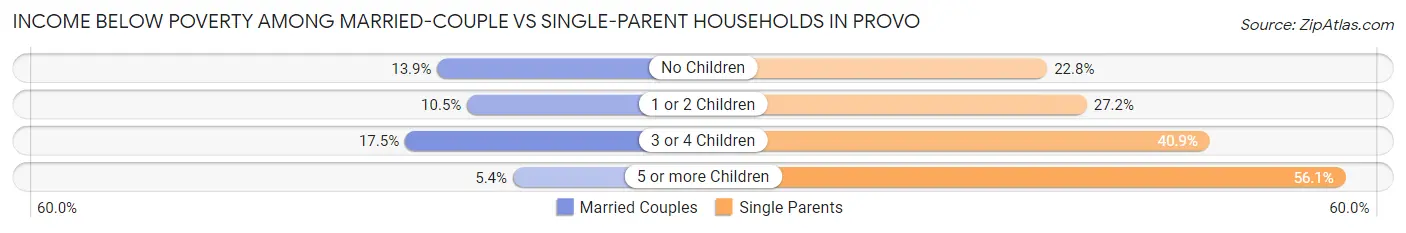
| Children | Married-Couple Families | Single-Parent Households |
| No Children | 1,487 (13.9%) | 537 (22.8%) |
| 1 or 2 Children | 539 (10.5%) | 385 (27.2%) |
| 3 or 4 Children | 363 (17.5%) | 207 (40.9%) |
| 5 or more Children | 27 (5.4%) | 23 (56.1%) |
| Total | 2,416 (13.1%) | 1,152 (26.6%) |
Race in Provo
The most populous races in Provo are White / Caucasian (93,248 | 81.5%), Hispanic or Latino (20,046 | 17.5%), and Two or more Races (10,098 | 8.8%).
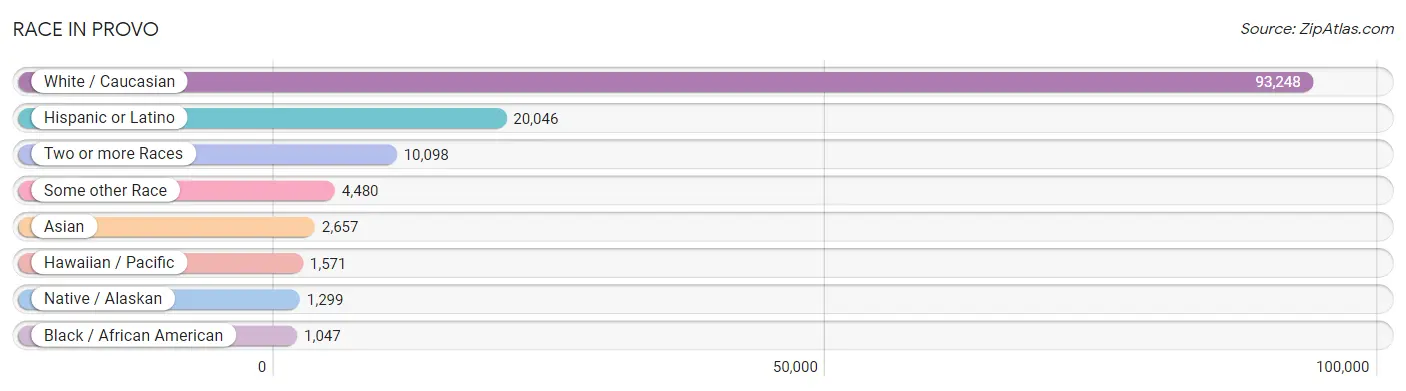
| Race | # Population | % Population |
| Asian | 2,657 | 2.3% |
| Black / African American | 1,047 | 0.9% |
| Hawaiian / Pacific | 1,571 | 1.4% |
| Hispanic or Latino | 20,046 | 17.5% |
| Native / Alaskan | 1,299 | 1.1% |
| White / Caucasian | 93,248 | 81.5% |
| Two or more Races | 10,098 | 8.8% |
| Some other Race | 4,480 | 3.9% |
| Total | 114,400 | 100.0% |
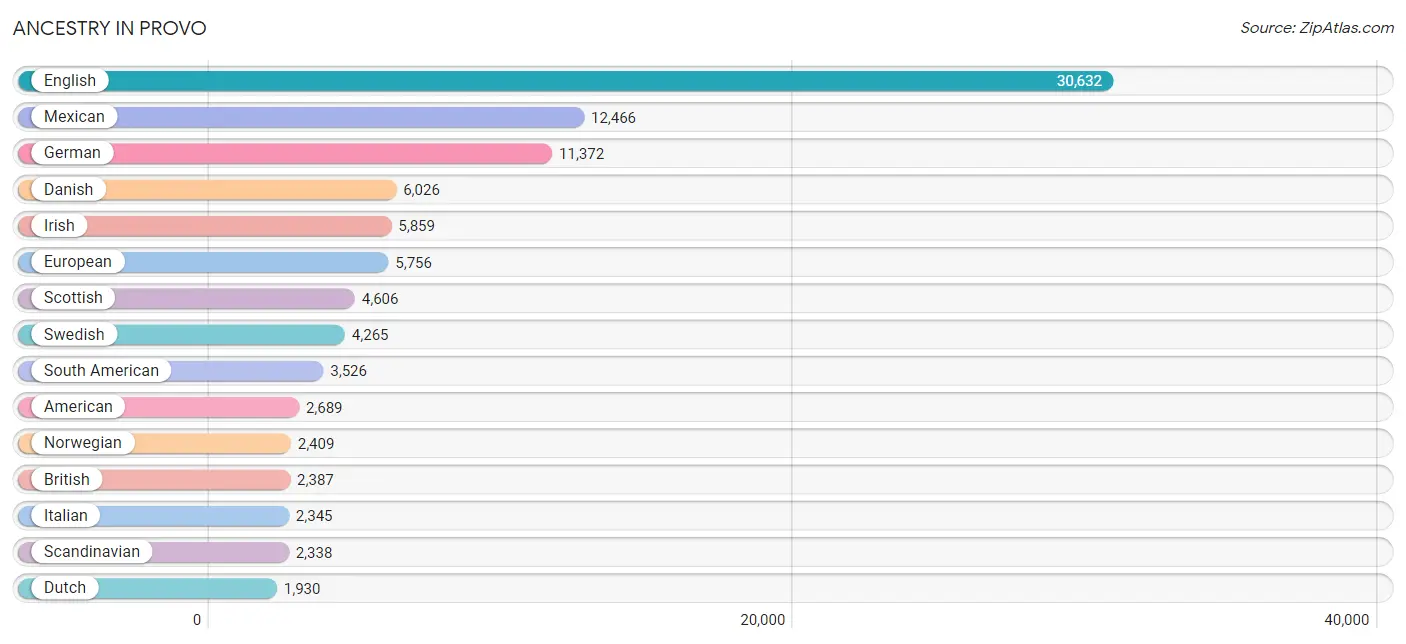
Ancestry in Provo
The most populous ancestries reported in Provo are English (30,632 | 26.8%), Mexican (12,466 | 10.9%), German (11,372 | 9.9%), Danish (6,026 | 5.3%), and Irish (5,859 | 5.1%), together accounting for 58.0% of all Provo residents.
| Ancestry | # Population | % Population |
| African | 409 | 0.4% |
| Albanian | 35 | 0.0% |
| American | 2,689 | 2.4% |
| Arab | 246 | 0.2% |
| Arapaho | 1 | 0.0% |
| Argentinean | 822 | 0.7% |
| Armenian | 84 | 0.1% |
| Australian | 95 | 0.1% |
| Austrian | 140 | 0.1% |
| Basque | 71 | 0.1% |
| Belgian | 6 | 0.0% |
| Belizean | 5 | 0.0% |
| Bhutanese | 1,094 | 1.0% |
| Blackfeet | 228 | 0.2% |
| Bolivian | 99 | 0.1% |
| Brazilian | 576 | 0.5% |
| British | 2,387 | 2.1% |
| Bulgarian | 6 | 0.0% |
| Burmese | 903 | 0.8% |
| Cambodian | 52 | 0.1% |
| Canadian | 604 | 0.5% |
| Celtic | 46 | 0.0% |
| Central American | 1,855 | 1.6% |
| Central American Indian | 159 | 0.1% |
| Cherokee | 297 | 0.3% |
| Chilean | 461 | 0.4% |
| Chippewa | 4 | 0.0% |
| Choctaw | 56 | 0.1% |
| Colombian | 354 | 0.3% |
| Costa Rican | 63 | 0.1% |
| Cree | 10 | 0.0% |
| Croatian | 150 | 0.1% |
| Cuban | 247 | 0.2% |
| Czech | 281 | 0.3% |
| Czechoslovakian | 76 | 0.1% |
| Danish | 6,026 | 5.3% |
| Dominican | 353 | 0.3% |
| Dutch | 1,930 | 1.7% |
| Eastern European | 124 | 0.1% |
| Ecuadorian | 283 | 0.3% |
| Egyptian | 13 | 0.0% |
| English | 30,632 | 26.8% |
| Ethiopian | 17 | 0.0% |
| European | 5,756 | 5.0% |
| Fijian | 68 | 0.1% |
| Filipino | 96 | 0.1% |
| Finnish | 233 | 0.2% |
| French | 1,533 | 1.3% |
| French American Indian | 25 | 0.0% |
| French Canadian | 158 | 0.1% |
| German | 11,372 | 9.9% |
| Ghanaian | 42 | 0.0% |
| Greek | 224 | 0.2% |
| Guamanian / Chamorro | 12 | 0.0% |
| Guatemalan | 854 | 0.7% |
| Haitian | 34 | 0.0% |
| Honduran | 332 | 0.3% |
| Hopi | 7 | 0.0% |
| Hungarian | 199 | 0.2% |
| Icelander | 122 | 0.1% |
| Indian (Asian) | 1,913 | 1.7% |
| Indonesian | 4 | 0.0% |
| Inupiat | 6 | 0.0% |
| Iranian | 67 | 0.1% |
| Irish | 5,859 | 5.1% |
| Iroquois | 17 | 0.0% |
| Israeli | 201 | 0.2% |
| Italian | 2,345 | 2.1% |
| Jamaican | 38 | 0.0% |
| Japanese | 43 | 0.0% |
| Kenyan | 45 | 0.0% |
| Korean | 607 | 0.5% |
| Laotian | 85 | 0.1% |
| Latvian | 17 | 0.0% |
| Lebanese | 52 | 0.1% |
| Liberian | 20 | 0.0% |
| Lithuanian | 66 | 0.1% |
| Lumbee | 3 | 0.0% |
| Malaysian | 8 | 0.0% |
| Mexican | 12,466 | 10.9% |
| Mexican American Indian | 366 | 0.3% |
| Mongolian | 8 | 0.0% |
| Native Hawaiian | 1,015 | 0.9% |
| Navajo | 540 | 0.5% |
| New Zealander | 5 | 0.0% |
| Nicaraguan | 53 | 0.1% |
| Nigerian | 28 | 0.0% |
| Northern European | 452 | 0.4% |
| Norwegian | 2,409 | 2.1% |
| Okinawan | 122 | 0.1% |
| Paiute | 9 | 0.0% |
| Pakistani | 100 | 0.1% |
| Palestinian | 59 | 0.1% |
| Peruvian | 1,105 | 1.0% |
| Polish | 831 | 0.7% |
| Portuguese | 386 | 0.3% |
| Puerto Rican | 690 | 0.6% |
| Puget Sound Salish | 11 | 0.0% |
| Romanian | 23 | 0.0% |
| Russian | 332 | 0.3% |
| Salvadoran | 553 | 0.5% |
| Samoan | 1,191 | 1.0% |
| Scandinavian | 2,338 | 2.0% |
| Scotch-Irish | 824 | 0.7% |
| Scottish | 4,606 | 4.0% |
| Serbian | 14 | 0.0% |
| Sioux | 116 | 0.1% |
| Slavic | 37 | 0.0% |
| Slovak | 25 | 0.0% |
| South American | 3,526 | 3.1% |
| South American Indian | 184 | 0.2% |
| Spaniard | 328 | 0.3% |
| Spanish | 198 | 0.2% |
| Sri Lankan | 256 | 0.2% |
| Subsaharan African | 588 | 0.5% |
| Swedish | 4,265 | 3.7% |
| Swiss | 1,675 | 1.5% |
| Syrian | 12 | 0.0% |
| Thai | 256 | 0.2% |
| Tongan | 863 | 0.7% |
| Trinidadian and Tobagonian | 69 | 0.1% |
| Tsimshian | 21 | 0.0% |
| Turkish | 66 | 0.1% |
| Ukrainian | 142 | 0.1% |
| Uruguayan | 64 | 0.1% |
| Ute | 116 | 0.1% |
| Venezuelan | 338 | 0.3% |
| Vietnamese | 12 | 0.0% |
| Welsh | 1,706 | 1.5% |
| Yugoslavian | 18 | 0.0% | View All 130 Rows |
Immigrants in Provo
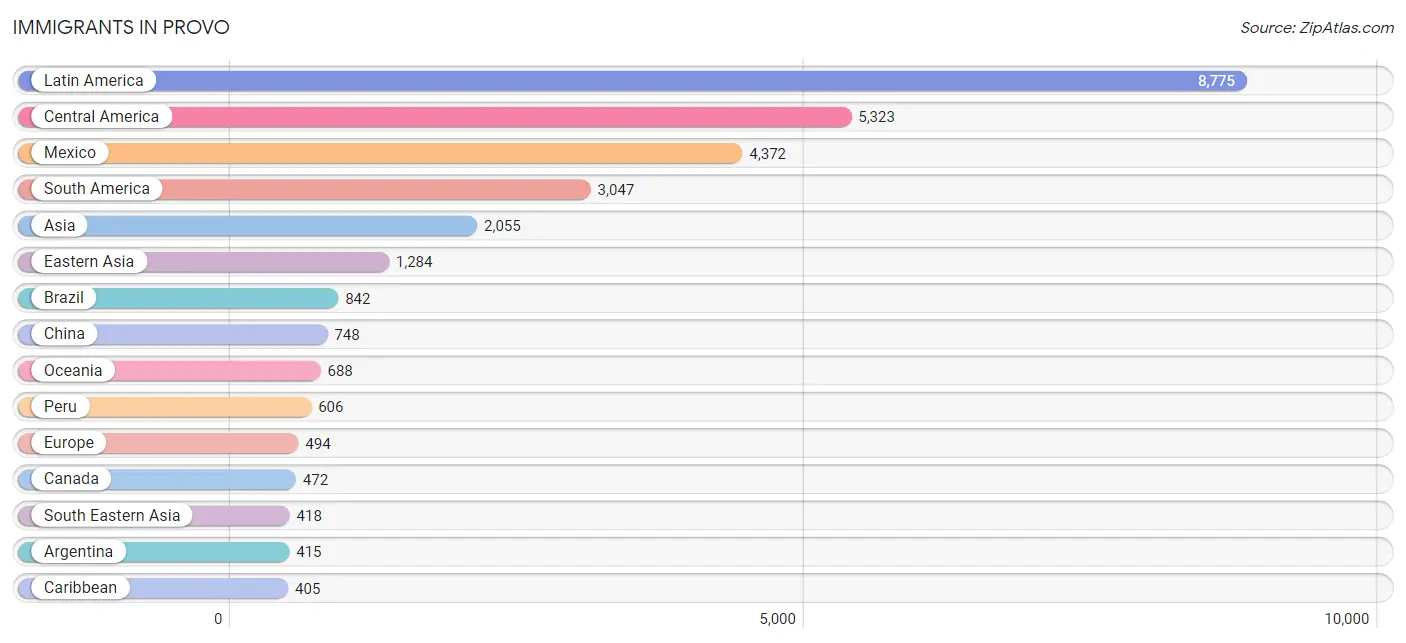
The most numerous immigrant groups reported in Provo came from Latin America (8,775 | 7.7%), Central America (5,323 | 4.6%), Mexico (4,372 | 3.8%), South America (3,047 | 2.7%), and Asia (2,055 | 1.8%), together accounting for 20.6% of all Provo residents.
| Immigration Origin | # Population | % Population |
| Africa | 337 | 0.3% |
| Argentina | 415 | 0.4% |
| Asia | 2,055 | 1.8% |
| Australia | 126 | 0.1% |
| Austria | 9 | 0.0% |
| Bangladesh | 12 | 0.0% |
| Belarus | 6 | 0.0% |
| Bolivia | 82 | 0.1% |
| Brazil | 842 | 0.7% |
| Cambodia | 22 | 0.0% |
| Canada | 472 | 0.4% |
| Caribbean | 405 | 0.4% |
| Central America | 5,323 | 4.6% |
| Chile | 376 | 0.3% |
| China | 748 | 0.6% |
| Colombia | 269 | 0.2% |
| Congo | 38 | 0.0% |
| Costa Rica | 25 | 0.0% |
| Cuba | 4 | 0.0% |
| Czechoslovakia | 6 | 0.0% |
| Dominican Republic | 348 | 0.3% |
| Eastern Africa | 53 | 0.1% |
| Eastern Asia | 1,284 | 1.1% |
| Eastern Europe | 210 | 0.2% |
| Ecuador | 177 | 0.2% |
| Egypt | 6 | 0.0% |
| El Salvador | 275 | 0.2% |
| England | 35 | 0.0% |
| Ethiopia | 17 | 0.0% |
| Europe | 494 | 0.4% |
| France | 12 | 0.0% |
| Germany | 64 | 0.1% |
| Ghana | 26 | 0.0% |
| Guatemala | 324 | 0.3% |
| Haiti | 16 | 0.0% |
| Honduras | 187 | 0.2% |
| Hong Kong | 242 | 0.2% |
| Hungary | 5 | 0.0% |
| India | 176 | 0.2% |
| Indonesia | 16 | 0.0% |
| Iran | 45 | 0.0% |
| Ireland | 11 | 0.0% |
| Israel | 19 | 0.0% |
| Italy | 18 | 0.0% |
| Jamaica | 21 | 0.0% |
| Japan | 119 | 0.1% |
| Kazakhstan | 6 | 0.0% |
| Korea | 373 | 0.3% |
| Laos | 8 | 0.0% |
| Latin America | 8,775 | 7.7% |
| Lebanon | 4 | 0.0% |
| Liberia | 20 | 0.0% |
| Mexico | 4,372 | 3.8% |
| Micronesia | 142 | 0.1% |
| Middle Africa | 88 | 0.1% |
| Netherlands | 3 | 0.0% |
| Nicaragua | 93 | 0.1% |
| Nigeria | 85 | 0.1% |
| Northern Africa | 6 | 0.0% |
| Northern Europe | 111 | 0.1% |
| Oceania | 688 | 0.6% |
| Pakistan | 6 | 0.0% |
| Panama | 47 | 0.0% |
| Peru | 606 | 0.5% |
| Philippines | 81 | 0.1% |
| Poland | 18 | 0.0% |
| Romania | 6 | 0.0% |
| Russia | 134 | 0.1% |
| Scotland | 9 | 0.0% |
| Singapore | 139 | 0.1% |
| South Africa | 37 | 0.0% |
| South America | 3,047 | 2.7% |
| South Central Asia | 300 | 0.3% |
| South Eastern Asia | 418 | 0.4% |
| Southern Europe | 61 | 0.1% |
| Spain | 43 | 0.0% |
| Sri Lanka | 55 | 0.1% |
| Switzerland | 24 | 0.0% |
| Taiwan | 105 | 0.1% |
| Thailand | 33 | 0.0% |
| Trinidad and Tobago | 16 | 0.0% |
| Turkey | 30 | 0.0% |
| Ukraine | 8 | 0.0% |
| Uruguay | 38 | 0.0% |
| Venezuela | 242 | 0.2% |
| Vietnam | 115 | 0.1% |
| Western Africa | 131 | 0.1% |
| Western Asia | 53 | 0.1% |
| Western Europe | 112 | 0.1% |
| Zaire | 45 | 0.0% |
| Zimbabwe | 30 | 0.0% | View All 91 Rows |
Sex and Age in Provo
Sex and Age in Provo
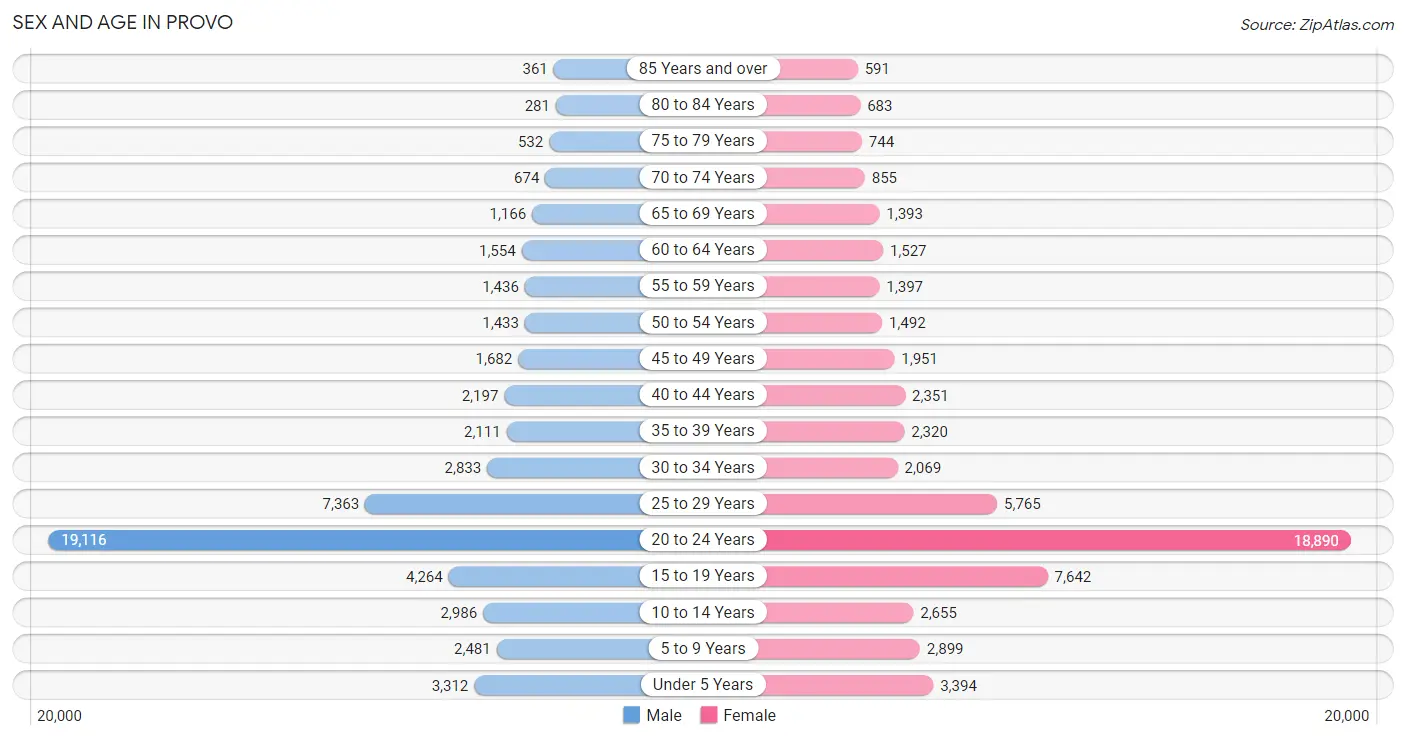
The most populous age groups in Provo are 20 to 24 Years (19,116 | 34.3%) for men and 20 to 24 Years (18,890 | 32.2%) for women.
| Age Bracket | Male | Female |
| Under 5 Years | 3,312 (5.9%) | 3,394 (5.8%) |
| 5 to 9 Years | 2,481 (4.4%) | 2,899 (5.0%) |
| 10 to 14 Years | 2,986 (5.3%) | 2,655 (4.5%) |
| 15 to 19 Years | 4,264 (7.6%) | 7,642 (13.0%) |
| 20 to 24 Years | 19,116 (34.3%) | 18,890 (32.2%) |
| 25 to 29 Years | 7,363 (13.2%) | 5,765 (9.8%) |
| 30 to 34 Years | 2,833 (5.1%) | 2,069 (3.5%) |
| 35 to 39 Years | 2,111 (3.8%) | 2,320 (4.0%) |
| 40 to 44 Years | 2,197 (3.9%) | 2,351 (4.0%) |
| 45 to 49 Years | 1,682 (3.0%) | 1,951 (3.3%) |
| 50 to 54 Years | 1,433 (2.6%) | 1,492 (2.5%) |
| 55 to 59 Years | 1,436 (2.6%) | 1,397 (2.4%) |
| 60 to 64 Years | 1,554 (2.8%) | 1,527 (2.6%) |
| 65 to 69 Years | 1,166 (2.1%) | 1,393 (2.4%) |
| 70 to 74 Years | 674 (1.2%) | 855 (1.5%) |
| 75 to 79 Years | 532 (0.9%) | 744 (1.3%) |
| 80 to 84 Years | 281 (0.5%) | 683 (1.2%) |
| 85 Years and over | 361 (0.6%) | 591 (1.0%) |
| Total | 55,782 (100.0%) | 58,618 (100.0%) |
Families and Households in Provo
Median Family Size in Provo
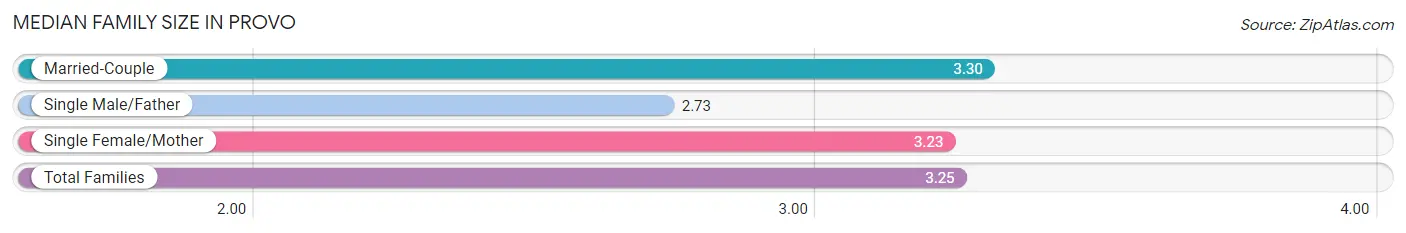
The median family size in Provo is 3.25 persons per family, with married-couple families (18,397 | 81.0%) accounting for the largest median family size of 3.3 persons per family. On the other hand, single male/father families (1,700 | 7.5%) represent the smallest median family size with 2.73 persons per family.
| Family Type | # Families | Family Size |
| Married-Couple | 18,397 (81.0%) | 3.30 |
| Single Male/Father | 1,700 (7.5%) | 2.73 |
| Single Female/Mother | 2,624 (11.6%) | 3.23 |
| Total Families | 22,721 (100.0%) | 3.25 |
Median Household Size in Provo
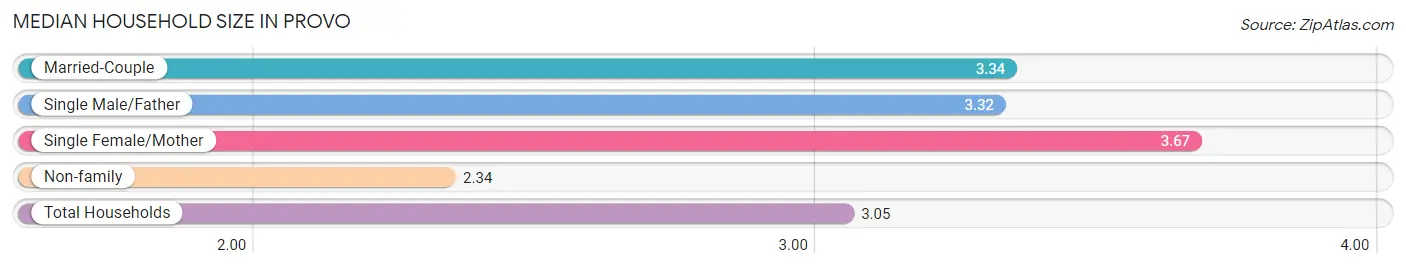
The median household size in Provo is 3.05 persons per household, with single female/mother households (2,624 | 7.9%) accounting for the largest median household size of 3.67 persons per household. non-family households (10,430 | 31.5%) represent the smallest median household size with 2.34 persons per household.
| Household Type | # Households | Household Size |
| Married-Couple | 18,397 (55.5%) | 3.34 |
| Single Male/Father | 1,700 (5.1%) | 3.32 |
| Single Female/Mother | 2,624 (7.9%) | 3.67 |
| Non-family | 10,430 (31.5%) | 2.34 |
| Total Households | 33,151 (100.0%) | 3.05 |
Household Size by Marriage Status in Provo
Out of a total of 33,151 households in Provo, 22,721 (68.5%) are family households, while 10,430 (31.5%) are nonfamily households. The most numerous type of family households are 2-person households, comprising 10,403, and the most common type of nonfamily households are 1-person households, comprising 4,708.
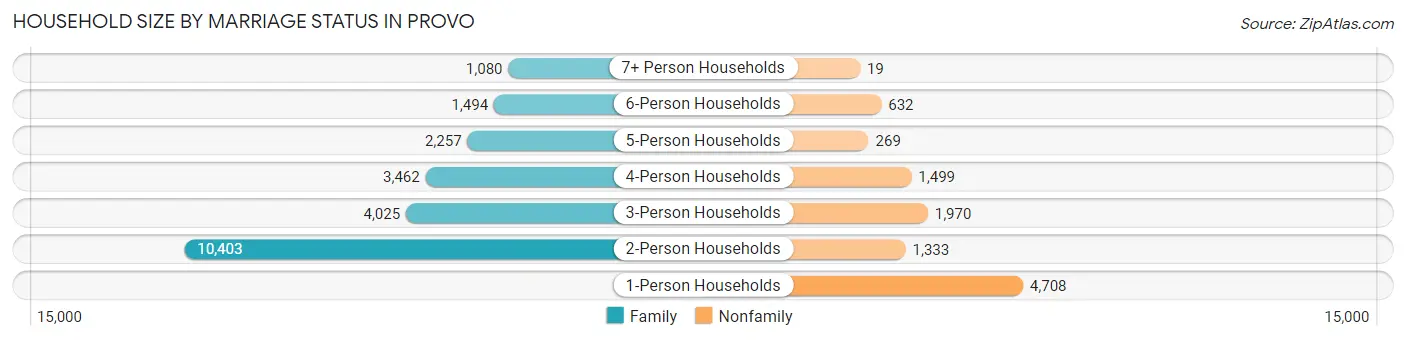
| Household Size | Family Households | Nonfamily Households |
| 1-Person Households | - | 4,708 (14.2%) |
| 2-Person Households | 10,403 (31.4%) | 1,333 (4.0%) |
| 3-Person Households | 4,025 (12.1%) | 1,970 (5.9%) |
| 4-Person Households | 3,462 (10.4%) | 1,499 (4.5%) |
| 5-Person Households | 2,257 (6.8%) | 269 (0.8%) |
| 6-Person Households | 1,494 (4.5%) | 632 (1.9%) |
| 7+ Person Households | 1,080 (3.3%) | 19 (0.1%) |
| Total | 22,721 (68.5%) | 10,430 (31.5%) |
Female Fertility in Provo
Fertility by Age in Provo
Average fertility rate in Provo is 47.0 births per 1,000 women. Women in the age bracket of 20 to 34 years have the highest fertility rate with 61.0 births per 1,000 women. Women in the age bracket of 20 to 34 years acount for 84.3% of all women with births.
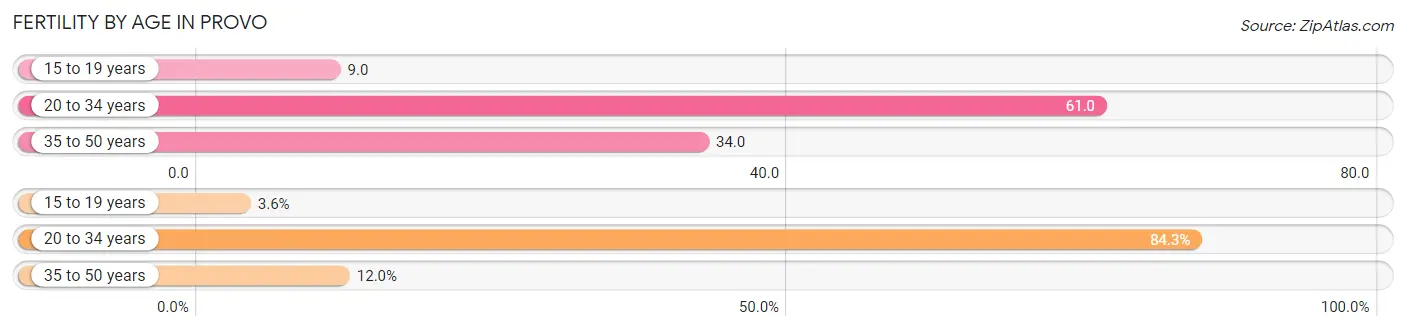
| Age Bracket | Women with Births | Births / 1,000 Women |
| 15 to 19 years | 70 (3.6%) | 9.0 |
| 20 to 34 years | 1,626 (84.3%) | 61.0 |
| 35 to 50 years | 232 (12.0%) | 34.0 |
| Total | 1,928 (100.0%) | 47.0 |
Fertility by Age by Marriage Status in Provo
84.9% of women with births (1,928) in Provo are married. The highest percentage of unmarried women with births falls into 15 to 19 years age bracket with 100.0% of them unmarried at the time of birth, while the lowest percentage of unmarried women with births belong to 35 to 50 years age bracket with 10.8% of them unmarried.
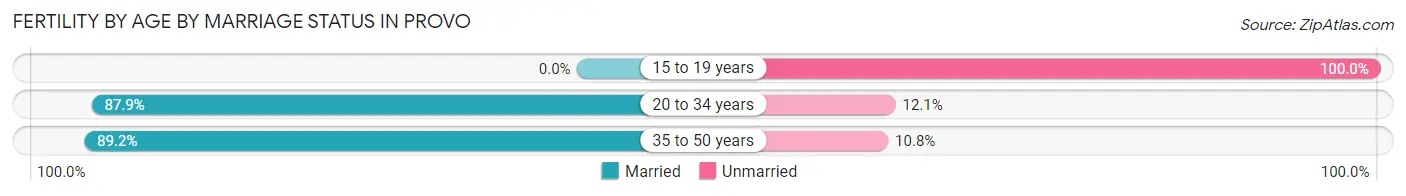
| Age Bracket | Married | Unmarried |
| 15 to 19 years | 0 (0.0%) | 70 (100.0%) |
| 20 to 34 years | 1,429 (87.9%) | 197 (12.1%) |
| 35 to 50 years | 207 (89.2%) | 25 (10.8%) |
| Total | 1,637 (84.9%) | 291 (15.1%) |
Fertility by Education in Provo
Average fertility rate in Provo is 47.0 births per 1,000 women. Women with the education attainment of bachelor's degree have the highest fertility rate of 101.0 births per 1,000 women, while women with the education attainment of less than high school have the lowest fertility at 7.0 births per 1,000 women. Women with the education attainment of bachelor's degree represent 41.8% of all women with births.
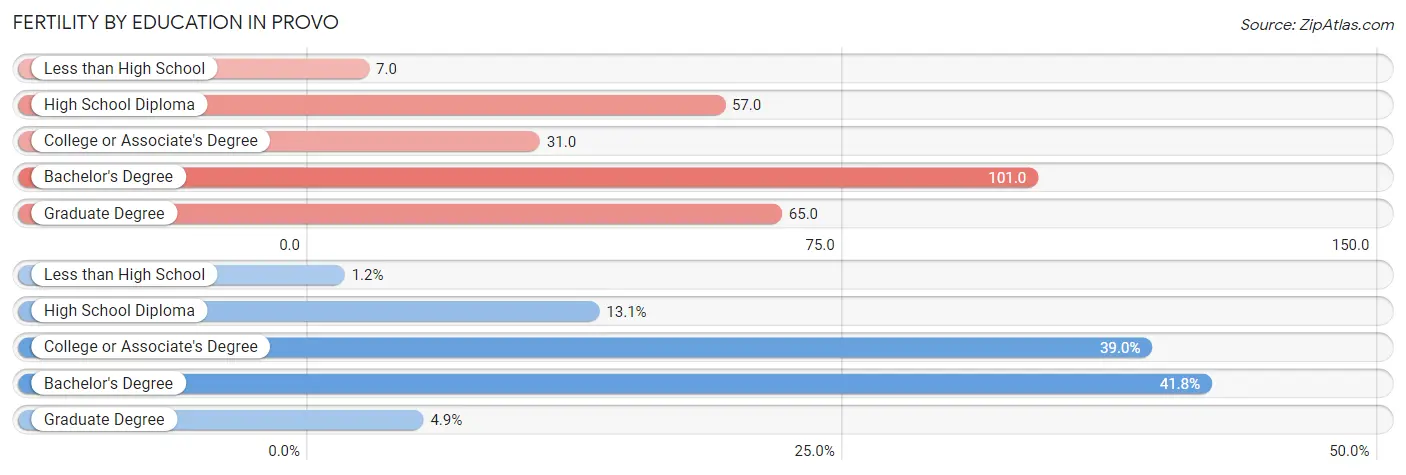
| Educational Attainment | Women with Births | Births / 1,000 Women |
| Less than High School | 23 (1.2%) | 7.0 |
| High School Diploma | 253 (13.1%) | 57.0 |
| College or Associate's Degree | 752 (39.0%) | 31.0 |
| Bachelor's Degree | 806 (41.8%) | 101.0 |
| Graduate Degree | 94 (4.9%) | 65.0 |
| Total | 1,928 (100.0%) | 47.0 |
Fertility by Education by Marriage Status in Provo
15.1% of women with births in Provo are unmarried. Women with the educational attainment of bachelor's degree are most likely to be married with 100.0% of them married at childbirth, while women with the educational attainment of college or associate's degree are least likely to be married with 30.3% of them unmarried at childbirth.
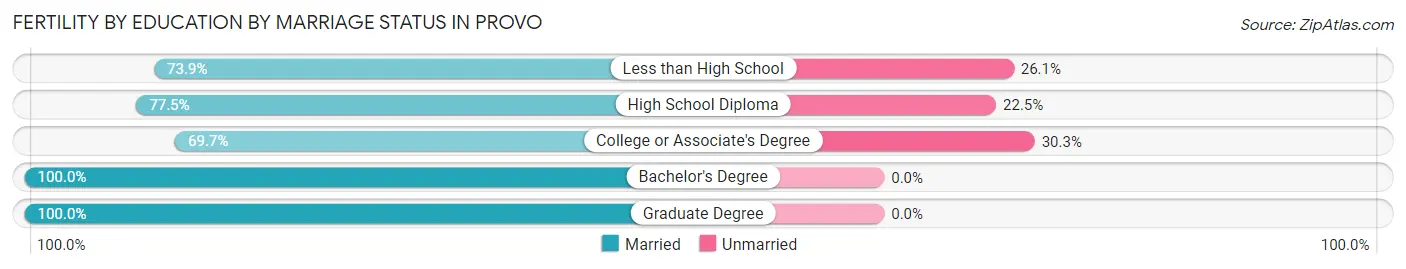
| Educational Attainment | Married | Unmarried |
| Less than High School | 17 (73.9%) | 6 (26.1%) |
| High School Diploma | 196 (77.5%) | 57 (22.5%) |
| College or Associate's Degree | 524 (69.7%) | 228 (30.3%) |
| Bachelor's Degree | 806 (100.0%) | 0 (0.0%) |
| Graduate Degree | 94 (100.0%) | 0 (0.0%) |
| Total | 1,637 (84.9%) | 291 (15.1%) |
Employment Characteristics in Provo
Employment by Class of Employer in Provo
Among the 64,542 employed individuals in Provo, private company employees (45,684 | 70.8%), not-for-profit organizations (8,807 | 13.7%), and state government employees (2,982 | 4.6%) make up the most common classes of employment.
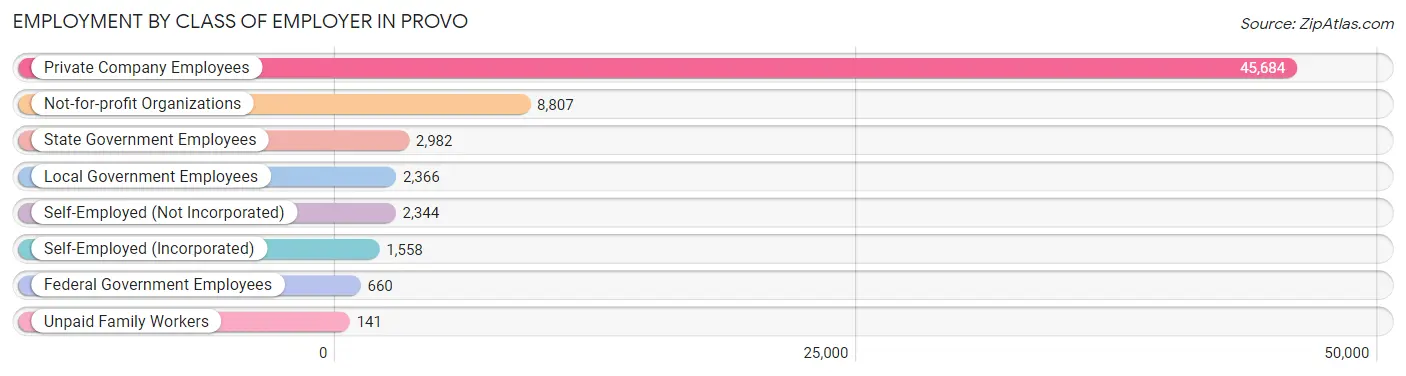
| Employer Class | # Employees | % Employees |
| Private Company Employees | 45,684 | 70.8% |
| Self-Employed (Incorporated) | 1,558 | 2.4% |
| Self-Employed (Not Incorporated) | 2,344 | 3.6% |
| Not-for-profit Organizations | 8,807 | 13.7% |
| Local Government Employees | 2,366 | 3.7% |
| State Government Employees | 2,982 | 4.6% |
| Federal Government Employees | 660 | 1.0% |
| Unpaid Family Workers | 141 | 0.2% |
| Total | 64,542 | 100.0% |
Employment Status by Age in Provo
According to the labor force statistics for Provo, out of the total population over 16 years of age (95,408), 72.8% or 69,457 individuals are in the labor force, with 4.4% or 3,056 of them unemployed. The age group with the highest labor force participation rate is 25 to 29 years, with 85.2% or 11,185 individuals in the labor force. Within the labor force, the 16 to 19 years age range has the highest percentage of unemployed individuals, with 11.8% or 778 of them being unemployed.
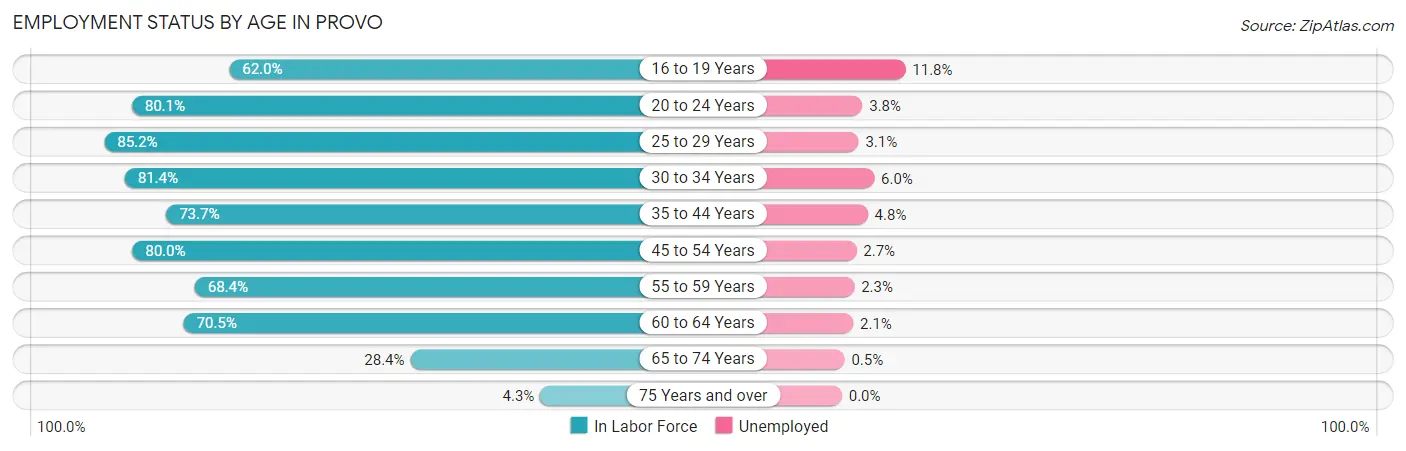
| Age Bracket | In Labor Force | Unemployed |
| 16 to 19 Years | 6,597 (62.0%) | 778 (11.8%) |
| 20 to 24 Years | 30,443 (80.1%) | 1,157 (3.8%) |
| 25 to 29 Years | 11,185 (85.2%) | 347 (3.1%) |
| 30 to 34 Years | 3,990 (81.4%) | 239 (6.0%) |
| 35 to 44 Years | 6,618 (73.7%) | 318 (4.8%) |
| 45 to 54 Years | 5,246 (80.0%) | 142 (2.7%) |
| 55 to 59 Years | 1,938 (68.4%) | 45 (2.3%) |
| 60 to 64 Years | 2,172 (70.5%) | 46 (2.1%) |
| 65 to 74 Years | 1,161 (28.4%) | 6 (0.5%) |
| 75 Years and over | 137 (4.3%) | 0 (0.0%) |
| Total | 69,457 (72.8%) | 3,056 (4.4%) |
Employment Status by Educational Attainment in Provo
According to labor force statistics for Provo, 78.9% of individuals (31,151) out of the total population between 25 and 64 years of age (39,481) are in the labor force, with 3.6% or 1,121 of them being unemployed. The group with the highest labor force participation rate are those with the educational attainment of bachelor's degree or higher, with 81.6% or 14,136 individuals in the labor force. Within the labor force, individuals with bachelor's degree or higher education have the highest percentage of unemployment, with 3.8% or 537 of them being unemployed.
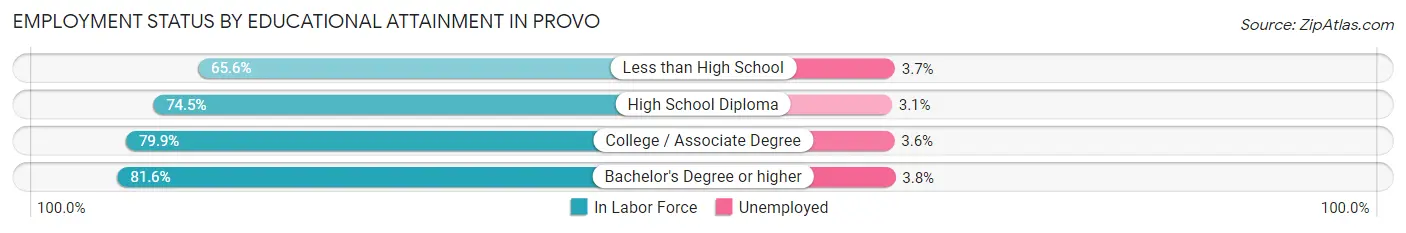
| Educational Attainment | In Labor Force | Unemployed |
| Less than High School | 1,719 (65.6%) | 97 (3.7%) |
| High School Diploma | 4,224 (74.5%) | 176 (3.1%) |
| College / Associate Degree | 11,080 (79.9%) | 499 (3.6%) |
| Bachelor's Degree or higher | 14,136 (81.6%) | 658 (3.8%) |
| Total | 31,151 (78.9%) | 1,421 (3.6%) |
Employment Occupations by Sex in Provo
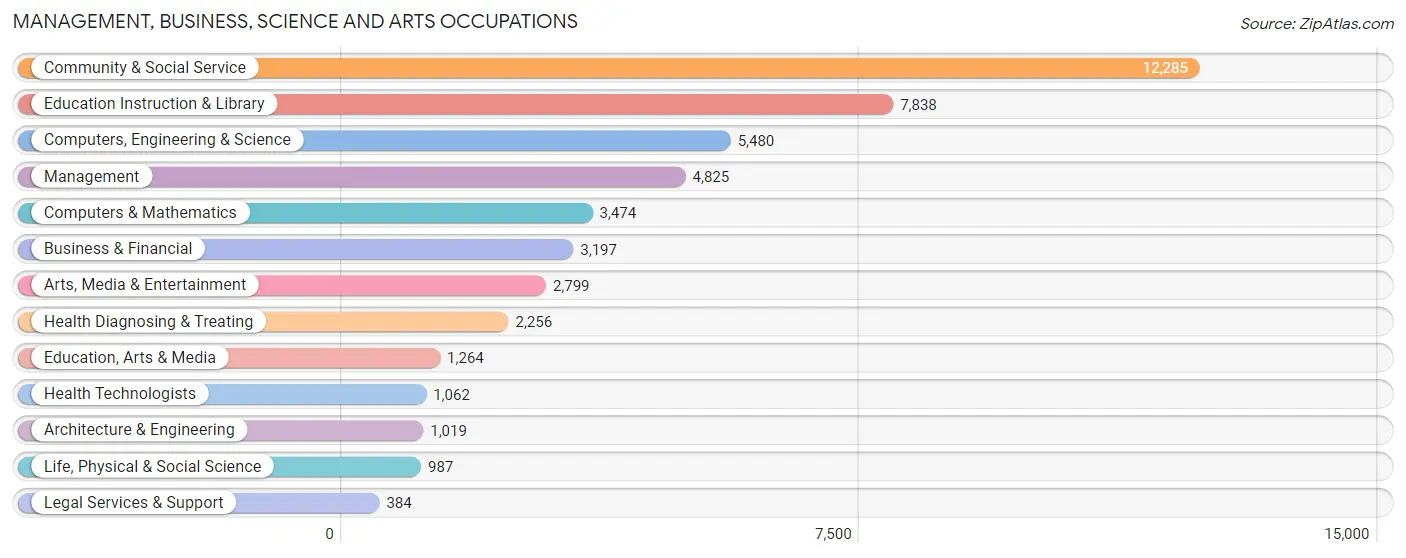
Management, Business, Science and Arts Occupations
The most common Management, Business, Science and Arts occupations in Provo are Community & Social Service (12,285 | 18.5%), Education Instruction & Library (7,838 | 11.8%), Computers, Engineering & Science (5,480 | 8.3%), Management (4,825 | 7.3%), and Computers & Mathematics (3,474 | 5.2%).
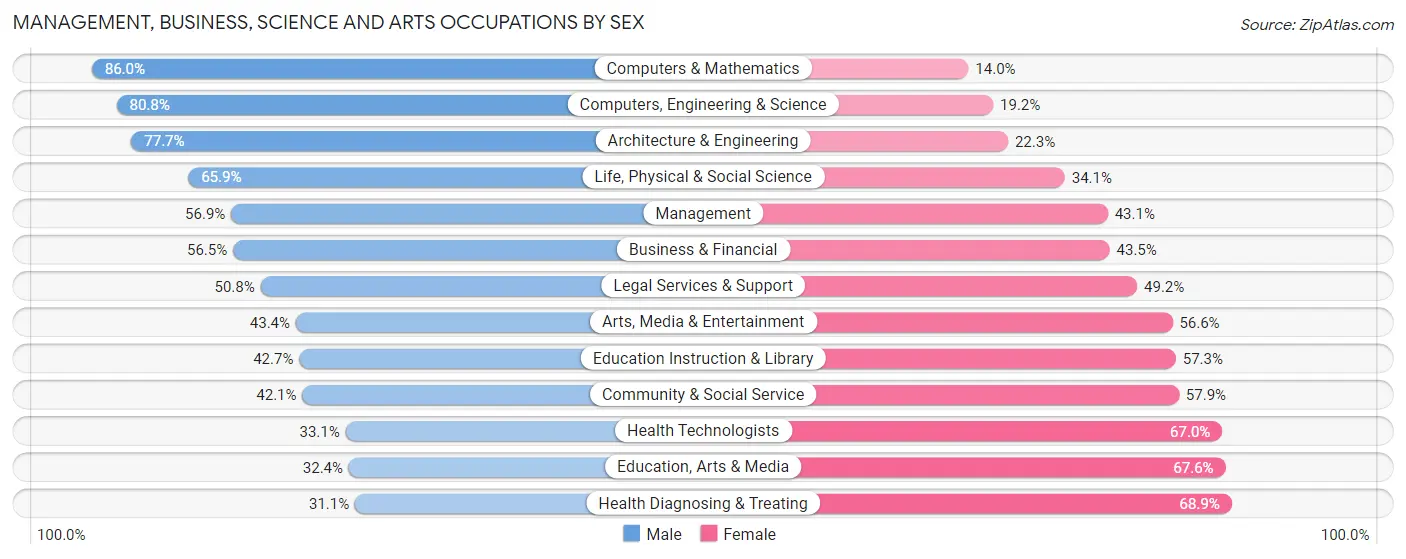
Management, Business, Science and Arts Occupations by Sex
Within the Management, Business, Science and Arts occupations in Provo, the most male-oriented occupations are Computers & Mathematics (86.0%), Computers, Engineering & Science (80.8%), and Architecture & Engineering (77.7%), while the most female-oriented occupations are Health Diagnosing & Treating (68.9%), Education, Arts & Media (67.6%), and Health Technologists (66.9%).
| Occupation | Male | Female |
| Management | 2,746 (56.9%) | 2,079 (43.1%) |
| Business & Financial | 1,807 (56.5%) | 1,390 (43.5%) |
| Computers, Engineering & Science | 4,429 (80.8%) | 1,051 (19.2%) |
| Computers & Mathematics | 2,987 (86.0%) | 487 (14.0%) |
| Architecture & Engineering | 792 (77.7%) | 227 (22.3%) |
| Life, Physical & Social Science | 650 (65.9%) | 337 (34.1%) |
| Community & Social Service | 5,167 (42.1%) | 7,118 (57.9%) |
| Education, Arts & Media | 409 (32.4%) | 855 (67.6%) |
| Legal Services & Support | 195 (50.8%) | 189 (49.2%) |
| Education Instruction & Library | 3,348 (42.7%) | 4,490 (57.3%) |
| Arts, Media & Entertainment | 1,215 (43.4%) | 1,584 (56.6%) |
| Health Diagnosing & Treating | 701 (31.1%) | 1,555 (68.9%) |
| Health Technologists | 351 (33.1%) | 711 (66.9%) |
| Total (Category) | 14,850 (52.9%) | 13,193 (47.0%) |
| Total (Overall) | 34,759 (52.4%) | 31,591 (47.6%) |
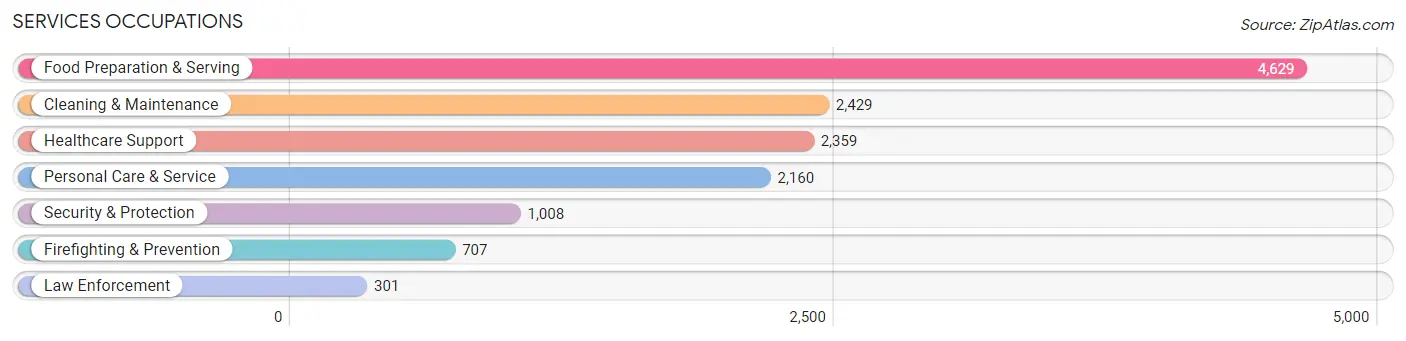
Services Occupations
The most common Services occupations in Provo are Food Preparation & Serving (4,629 | 7.0%), Cleaning & Maintenance (2,429 | 3.7%), Healthcare Support (2,359 | 3.6%), Personal Care & Service (2,160 | 3.3%), and Security & Protection (1,008 | 1.5%).
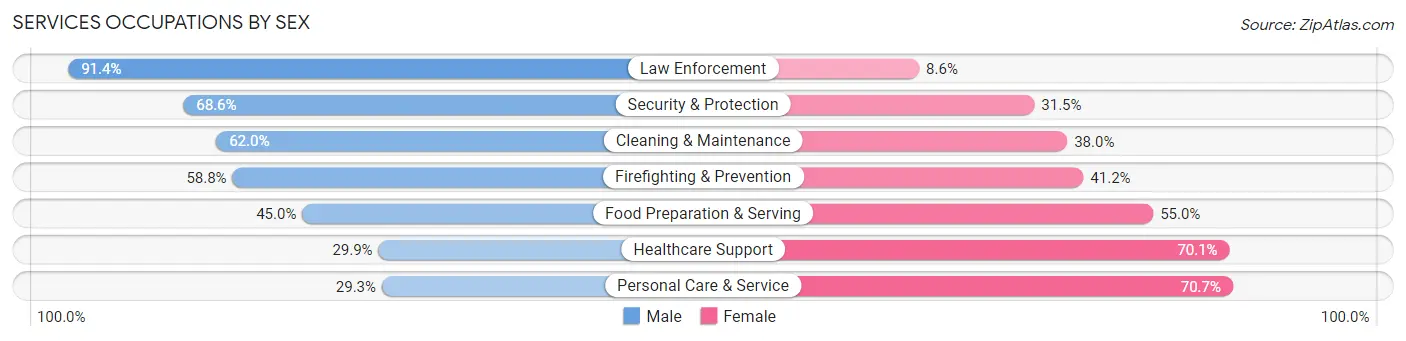
Services Occupations by Sex
Within the Services occupations in Provo, the most male-oriented occupations are Law Enforcement (91.4%), Security & Protection (68.5%), and Cleaning & Maintenance (62.0%), while the most female-oriented occupations are Personal Care & Service (70.7%), Healthcare Support (70.1%), and Food Preparation & Serving (55.0%).
| Occupation | Male | Female |
| Healthcare Support | 706 (29.9%) | 1,653 (70.1%) |
| Security & Protection | 691 (68.5%) | 317 (31.5%) |
| Firefighting & Prevention | 416 (58.8%) | 291 (41.2%) |
| Law Enforcement | 275 (91.4%) | 26 (8.6%) |
| Food Preparation & Serving | 2,084 (45.0%) | 2,545 (55.0%) |
| Cleaning & Maintenance | 1,507 (62.0%) | 922 (38.0%) |
| Personal Care & Service | 632 (29.3%) | 1,528 (70.7%) |
| Total (Category) | 5,620 (44.7%) | 6,965 (55.3%) |
| Total (Overall) | 34,759 (52.4%) | 31,591 (47.6%) |
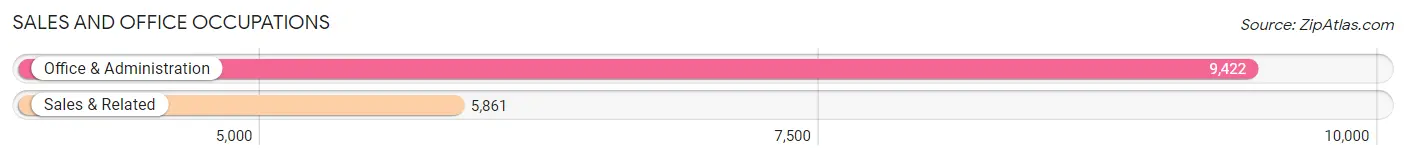
Sales and Office Occupations
The most common Sales and Office occupations in Provo are Office & Administration (9,422 | 14.2%), and Sales & Related (5,861 | 8.8%).
Sales and Office Occupations by Sex
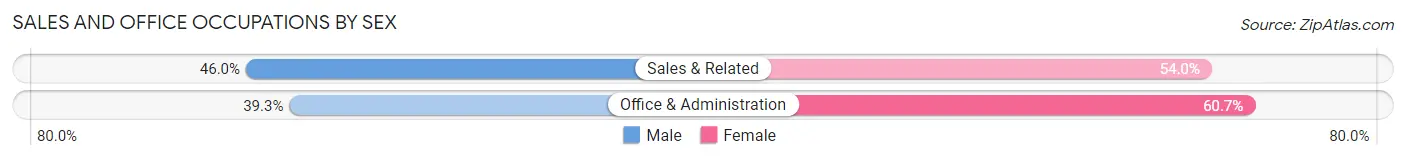
| Occupation | Male | Female |
| Sales & Related | 2,694 (46.0%) | 3,167 (54.0%) |
| Office & Administration | 3,702 (39.3%) | 5,720 (60.7%) |
| Total (Category) | 6,396 (41.8%) | 8,887 (58.2%) |
| Total (Overall) | 34,759 (52.4%) | 31,591 (47.6%) |
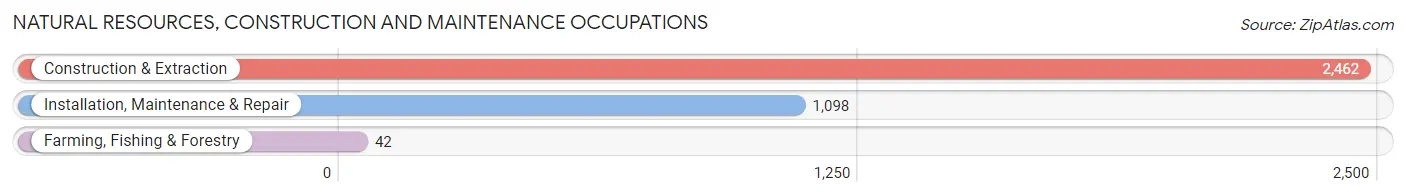
Natural Resources, Construction and Maintenance Occupations
The most common Natural Resources, Construction and Maintenance occupations in Provo are Construction & Extraction (2,462 | 3.7%), Installation, Maintenance & Repair (1,098 | 1.7%), and Farming, Fishing & Forestry (42 | 0.1%).
Natural Resources, Construction and Maintenance Occupations by Sex
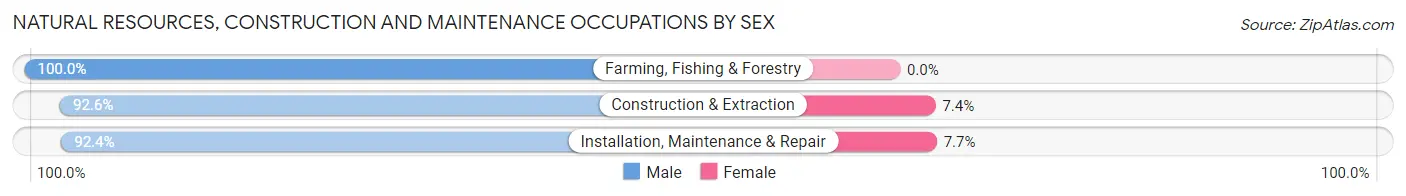
| Occupation | Male | Female |
| Farming, Fishing & Forestry | 42 (100.0%) | 0 (0.0%) |
| Construction & Extraction | 2,280 (92.6%) | 182 (7.4%) |
| Installation, Maintenance & Repair | 1,014 (92.3%) | 84 (7.6%) |
| Total (Category) | 3,336 (92.6%) | 266 (7.4%) |
| Total (Overall) | 34,759 (52.4%) | 31,591 (47.6%) |
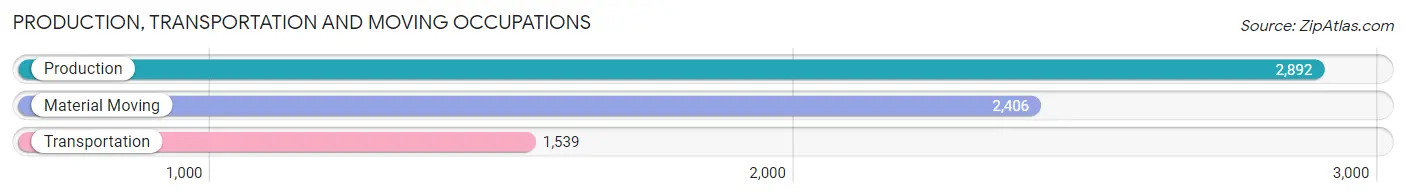
Production, Transportation and Moving Occupations
The most common Production, Transportation and Moving occupations in Provo are Production (2,892 | 4.4%), Material Moving (2,406 | 3.6%), and Transportation (1,539 | 2.3%).
Production, Transportation and Moving Occupations by Sex
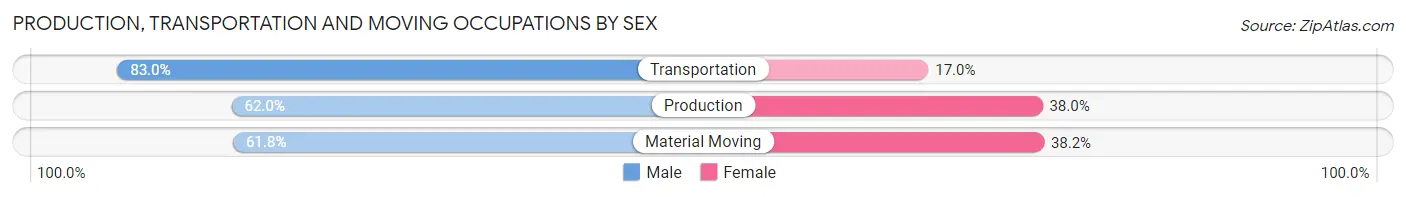
| Occupation | Male | Female |
| Production | 1,794 (62.0%) | 1,098 (38.0%) |
| Transportation | 1,277 (83.0%) | 262 (17.0%) |
| Material Moving | 1,486 (61.8%) | 920 (38.2%) |
| Total (Category) | 4,557 (66.6%) | 2,280 (33.4%) |
| Total (Overall) | 34,759 (52.4%) | 31,591 (47.6%) |
Employment Industries by Sex in Provo
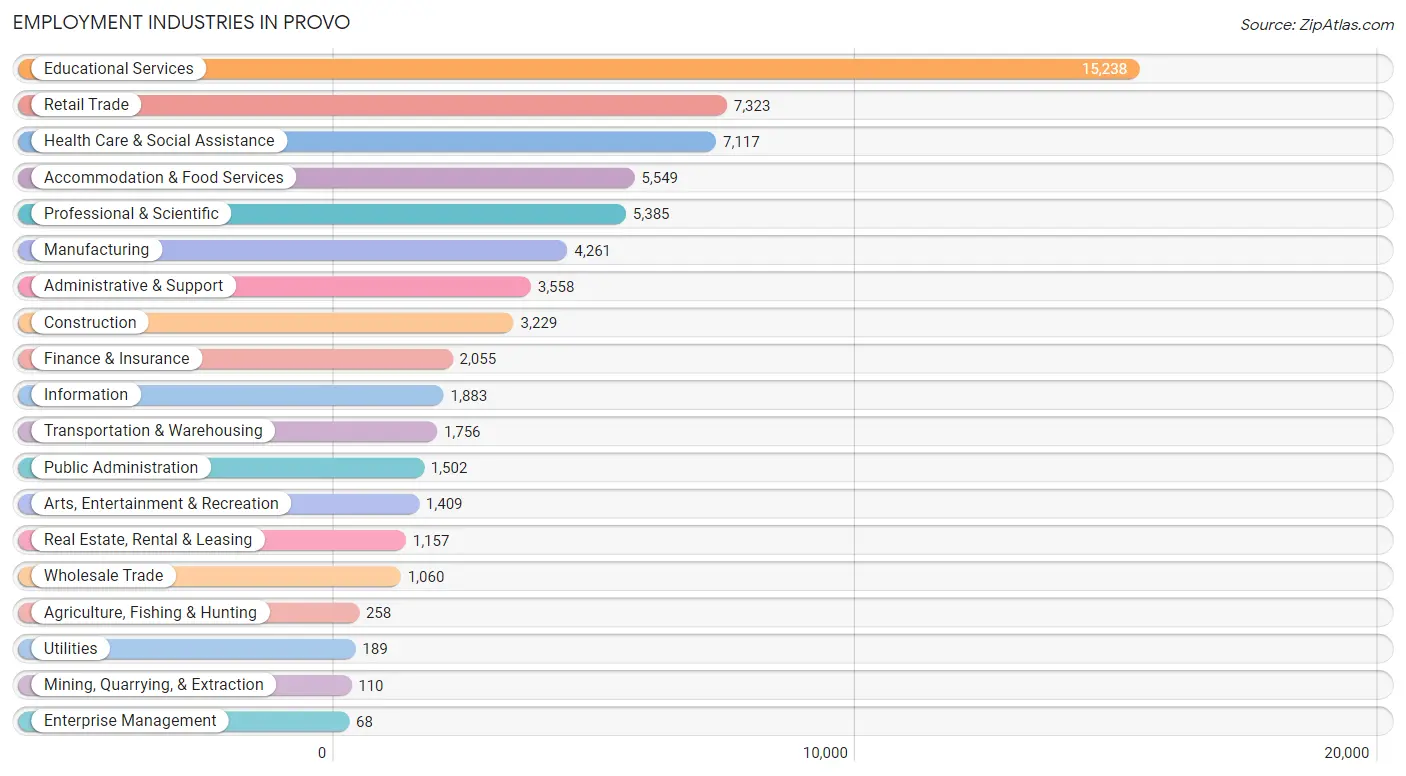
Employment Industries in Provo
The major employment industries in Provo include Educational Services (15,238 | 23.0%), Retail Trade (7,323 | 11.0%), Health Care & Social Assistance (7,117 | 10.7%), Accommodation & Food Services (5,549 | 8.4%), and Professional & Scientific (5,385 | 8.1%).
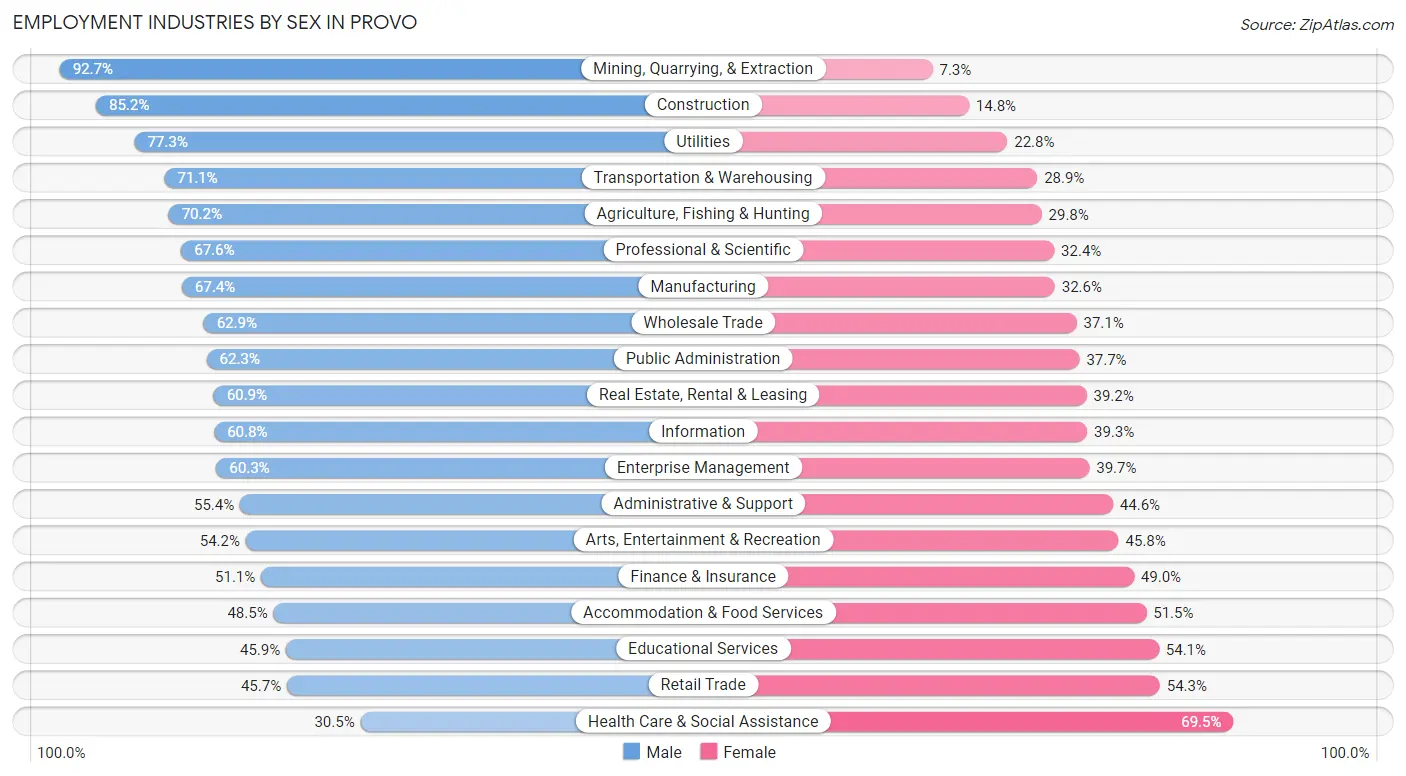
Employment Industries by Sex in Provo
The Provo industries that see more men than women are Mining, Quarrying, & Extraction (92.7%), Construction (85.2%), and Utilities (77.2%), whereas the industries that tend to have a higher number of women are Health Care & Social Assistance (69.5%), Retail Trade (54.3%), and Educational Services (54.1%).
| Industry | Male | Female |
| Agriculture, Fishing & Hunting | 181 (70.2%) | 77 (29.8%) |
| Mining, Quarrying, & Extraction | 102 (92.7%) | 8 (7.3%) |
| Construction | 2,751 (85.2%) | 478 (14.8%) |
| Manufacturing | 2,873 (67.4%) | 1,388 (32.6%) |
| Wholesale Trade | 667 (62.9%) | 393 (37.1%) |
| Retail Trade | 3,346 (45.7%) | 3,977 (54.3%) |
| Transportation & Warehousing | 1,248 (71.1%) | 508 (28.9%) |
| Utilities | 146 (77.2%) | 43 (22.8%) |
| Information | 1,144 (60.8%) | 739 (39.3%) |
| Finance & Insurance | 1,049 (51.0%) | 1,006 (48.9%) |
| Real Estate, Rental & Leasing | 704 (60.9%) | 453 (39.2%) |
| Professional & Scientific | 3,638 (67.6%) | 1,747 (32.4%) |
| Enterprise Management | 41 (60.3%) | 27 (39.7%) |
| Administrative & Support | 1,971 (55.4%) | 1,587 (44.6%) |
| Educational Services | 6,992 (45.9%) | 8,246 (54.1%) |
| Health Care & Social Assistance | 2,169 (30.5%) | 4,948 (69.5%) |
| Arts, Entertainment & Recreation | 764 (54.2%) | 645 (45.8%) |
| Accommodation & Food Services | 2,690 (48.5%) | 2,859 (51.5%) |
| Public Administration | 936 (62.3%) | 566 (37.7%) |
| Total | 34,759 (52.4%) | 31,591 (47.6%) |
Education in Provo
School Enrollment in Provo
The most common levels of schooling among the 59,438 students in Provo are college / undergraduate (40,748 | 68.6%), high school (5,138 | 8.6%), and elementary school (4,266 | 7.2%).
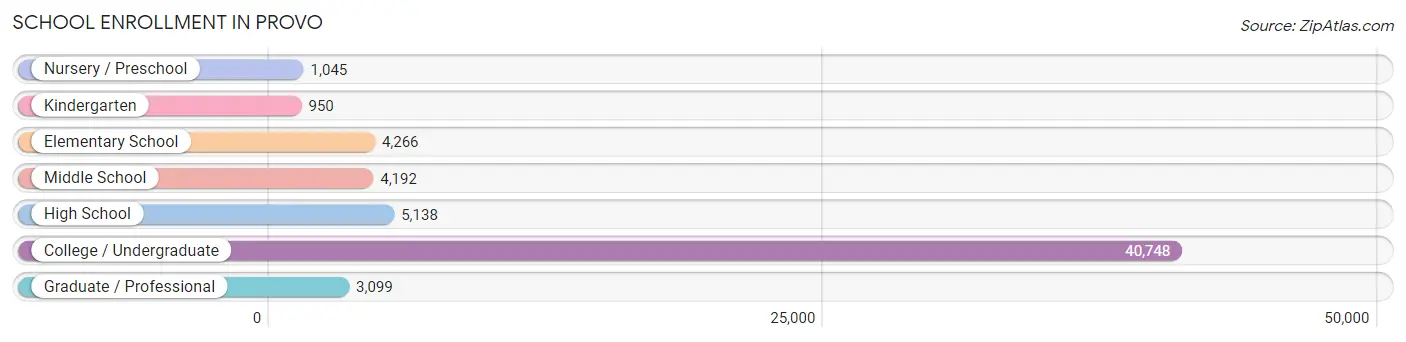
| School Level | # Students | % Students |
| Nursery / Preschool | 1,045 | 1.8% |
| Kindergarten | 950 | 1.6% |
| Elementary School | 4,266 | 7.2% |
| Middle School | 4,192 | 7.0% |
| High School | 5,138 | 8.6% |
| College / Undergraduate | 40,748 | 68.6% |
| Graduate / Professional | 3,099 | 5.2% |
| Total | 59,438 | 100.0% |
School Enrollment by Age by Funding Source in Provo
Out of a total of 59,438 students who are enrolled in schools in Provo, 31,264 (52.6%) attend a private institution, while the remaining 28,174 (47.4%) are enrolled in public schools. The age group of 20 to 24 year olds has the highest likelihood of being enrolled in private schools, with 21,830 (72.7% in the age bracket) enrolled. Conversely, the age group of 10 to 14 year olds has the lowest likelihood of being enrolled in a private school, with 5,293 (96.7% in the age bracket) attending a public institution.
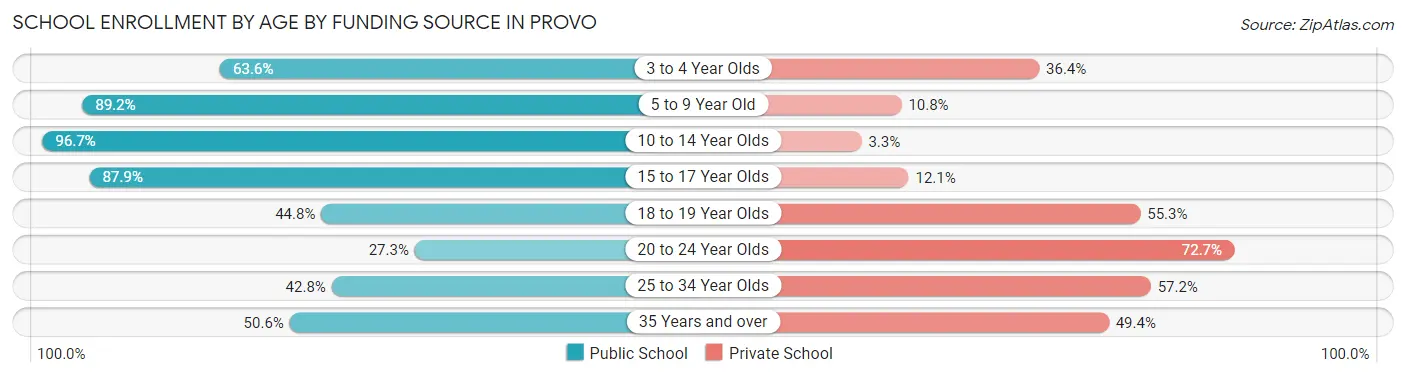
| Age Bracket | Public School | Private School |
| 3 to 4 Year Olds | 491 (63.6%) | 281 (36.4%) |
| 5 to 9 Year Old | 4,489 (89.2%) | 541 (10.8%) |
| 10 to 14 Year Olds | 5,293 (96.7%) | 182 (3.3%) |
| 15 to 17 Year Olds | 3,337 (87.9%) | 459 (12.1%) |
| 18 to 19 Year Olds | 2,977 (44.8%) | 3,675 (55.2%) |
| 20 to 24 Year Olds | 8,208 (27.3%) | 21,830 (72.7%) |
| 25 to 34 Year Olds | 2,775 (42.8%) | 3,707 (57.2%) |
| 35 Years and over | 604 (50.6%) | 589 (49.4%) |
| Total | 28,174 (47.4%) | 31,264 (52.6%) |
Educational Attainment by Field of Study in Provo
Business (2,889 | 13.0%), education (2,744 | 12.3%), arts & humanities (2,156 | 9.7%), literature & languages (1,862 | 8.4%), and science & technology (1,849 | 8.3%) are the most common fields of study among 22,274 individuals in Provo who have obtained a bachelor's degree or higher.
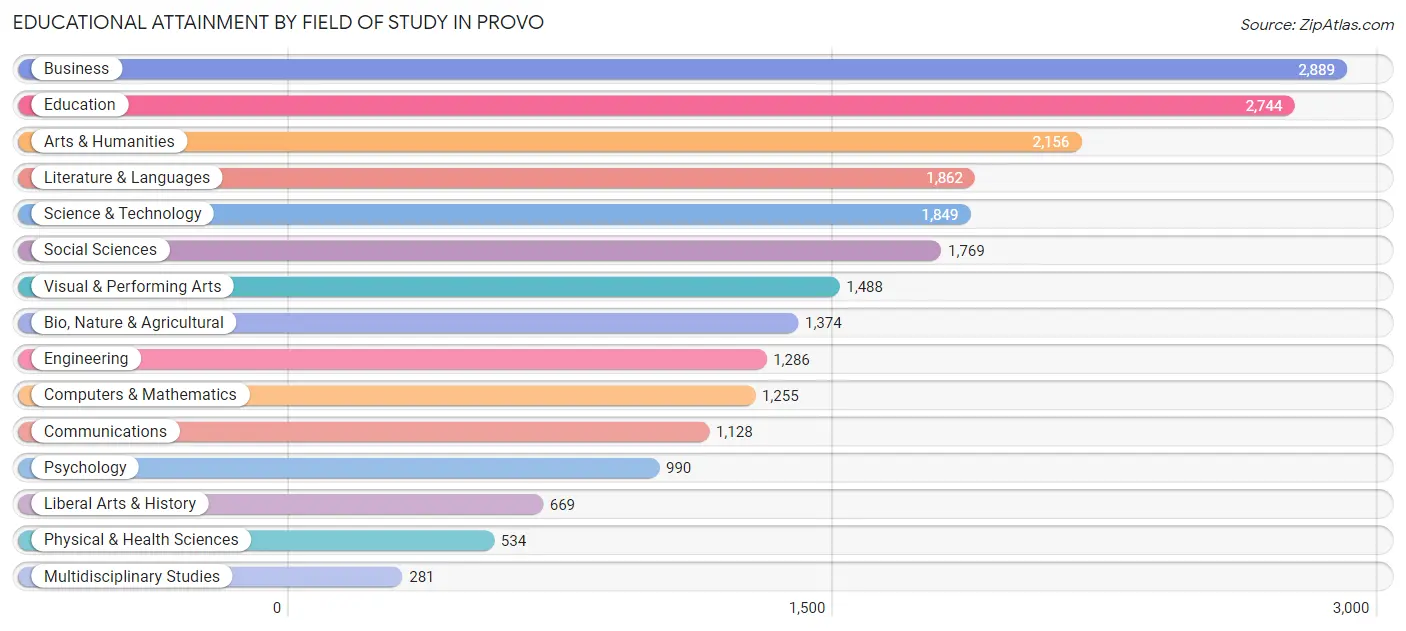
| Field of Study | # Graduates | % Graduates |
| Computers & Mathematics | 1,255 | 5.6% |
| Bio, Nature & Agricultural | 1,374 | 6.2% |
| Physical & Health Sciences | 534 | 2.4% |
| Psychology | 990 | 4.4% |
| Social Sciences | 1,769 | 7.9% |
| Engineering | 1,286 | 5.8% |
| Multidisciplinary Studies | 281 | 1.3% |
| Science & Technology | 1,849 | 8.3% |
| Business | 2,889 | 13.0% |
| Education | 2,744 | 12.3% |
| Literature & Languages | 1,862 | 8.4% |
| Liberal Arts & History | 669 | 3.0% |
| Visual & Performing Arts | 1,488 | 6.7% |
| Communications | 1,128 | 5.1% |
| Arts & Humanities | 2,156 | 9.7% |
| Total | 22,274 | 100.0% |
Transportation & Commute in Provo
Vehicle Availability by Sex in Provo
The most prevalent vehicle ownership categories in Provo are males with 2 vehicles (9,685, accounting for 32.1%) and females with 2 vehicles (8,704, making up 36.3%).
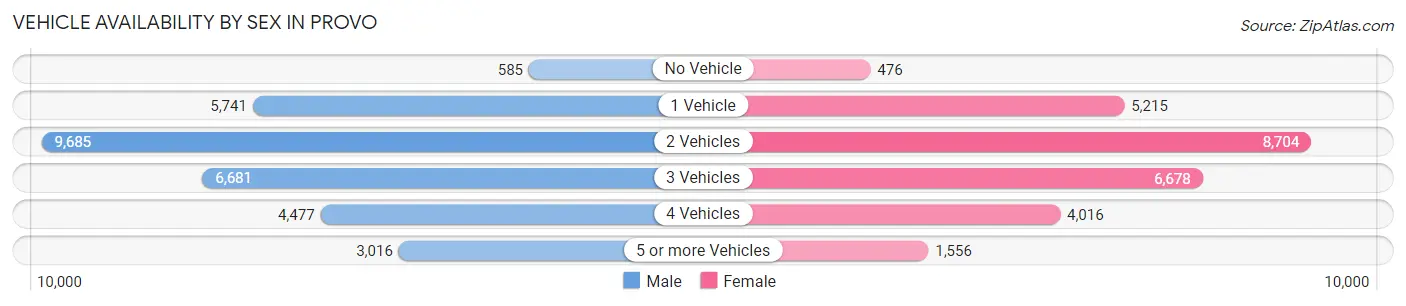
| Vehicles Available | Male | Female |
| No Vehicle | 585 (1.9%) | 476 (1.8%) |
| 1 Vehicle | 5,741 (19.0%) | 5,215 (19.6%) |
| 2 Vehicles | 9,685 (32.1%) | 8,704 (32.7%) |
| 3 Vehicles | 6,681 (22.1%) | 6,678 (25.1%) |
| 4 Vehicles | 4,477 (14.8%) | 4,016 (15.1%) |
| 5 or more Vehicles | 3,016 (10.0%) | 1,556 (5.8%) |
| Total | 30,185 (100.0%) | 26,645 (100.0%) |
Commute Time in Provo
The most frequently occuring commute durations in Provo are 10 to 14 minutes (13,529 commuters, 23.9%), 15 to 19 minutes (11,883 commuters, 21.0%), and 5 to 9 minutes (9,754 commuters, 17.3%).
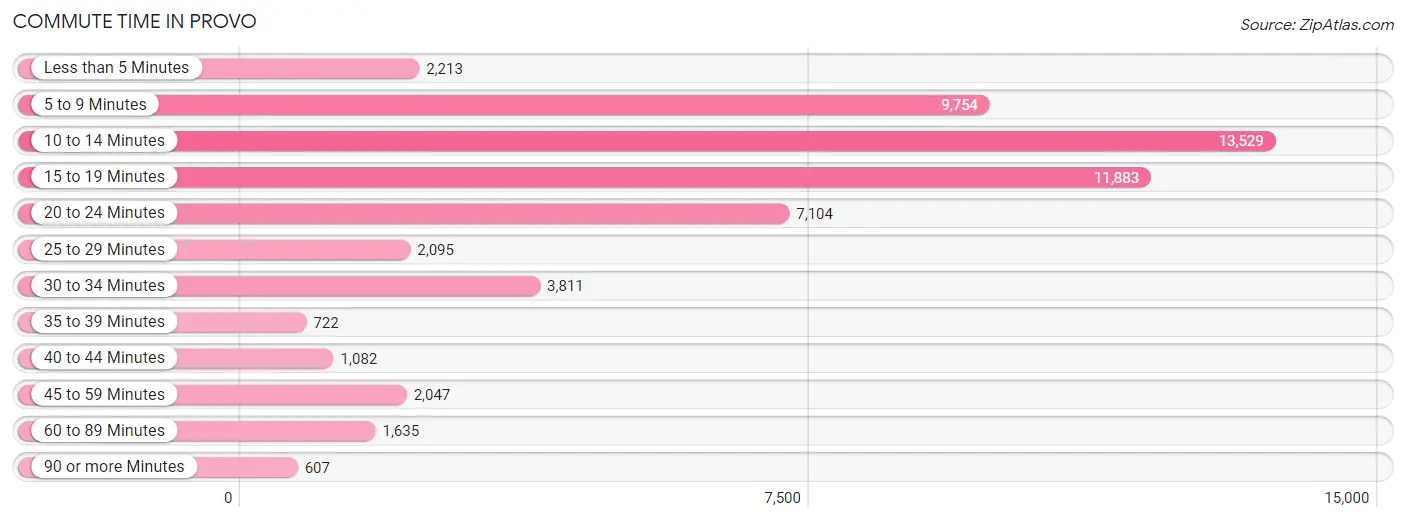
| Commute Time | # Commuters | % Commuters |
| Less than 5 Minutes | 2,213 | 3.9% |
| 5 to 9 Minutes | 9,754 | 17.3% |
| 10 to 14 Minutes | 13,529 | 23.9% |
| 15 to 19 Minutes | 11,883 | 21.0% |
| 20 to 24 Minutes | 7,104 | 12.6% |
| 25 to 29 Minutes | 2,095 | 3.7% |
| 30 to 34 Minutes | 3,811 | 6.8% |
| 35 to 39 Minutes | 722 | 1.3% |
| 40 to 44 Minutes | 1,082 | 1.9% |
| 45 to 59 Minutes | 2,047 | 3.6% |
| 60 to 89 Minutes | 1,635 | 2.9% |
| 90 or more Minutes | 607 | 1.1% |
Commute Time by Sex in Provo
The most common commute times in Provo are 10 to 14 minutes (6,629 commuters, 22.2%) for males and 10 to 14 minutes (6,900 commuters, 26.0%) for females.
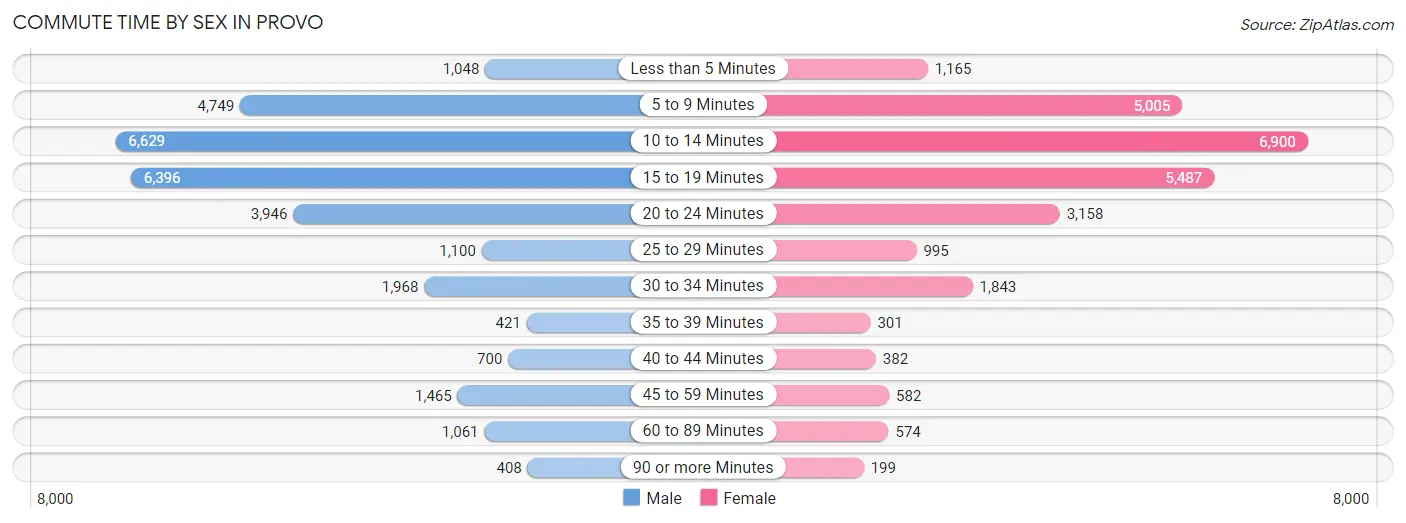
| Commute Time | Male | Female |
| Less than 5 Minutes | 1,048 (3.5%) | 1,165 (4.4%) |
| 5 to 9 Minutes | 4,749 (15.9%) | 5,005 (18.8%) |
| 10 to 14 Minutes | 6,629 (22.2%) | 6,900 (26.0%) |
| 15 to 19 Minutes | 6,396 (21.4%) | 5,487 (20.6%) |
| 20 to 24 Minutes | 3,946 (13.2%) | 3,158 (11.9%) |
| 25 to 29 Minutes | 1,100 (3.7%) | 995 (3.7%) |
| 30 to 34 Minutes | 1,968 (6.6%) | 1,843 (6.9%) |
| 35 to 39 Minutes | 421 (1.4%) | 301 (1.1%) |
| 40 to 44 Minutes | 700 (2.3%) | 382 (1.4%) |
| 45 to 59 Minutes | 1,465 (4.9%) | 582 (2.2%) |
| 60 to 89 Minutes | 1,061 (3.5%) | 574 (2.2%) |
| 90 or more Minutes | 408 (1.4%) | 199 (0.7%) |
Time of Departure to Work by Sex in Provo
The most frequent times of departure to work in Provo are 7:30 AM to 7:59 AM (4,108, 13.7%) for males and 12:00 PM to 3:59 PM (4,214, 15.9%) for females.
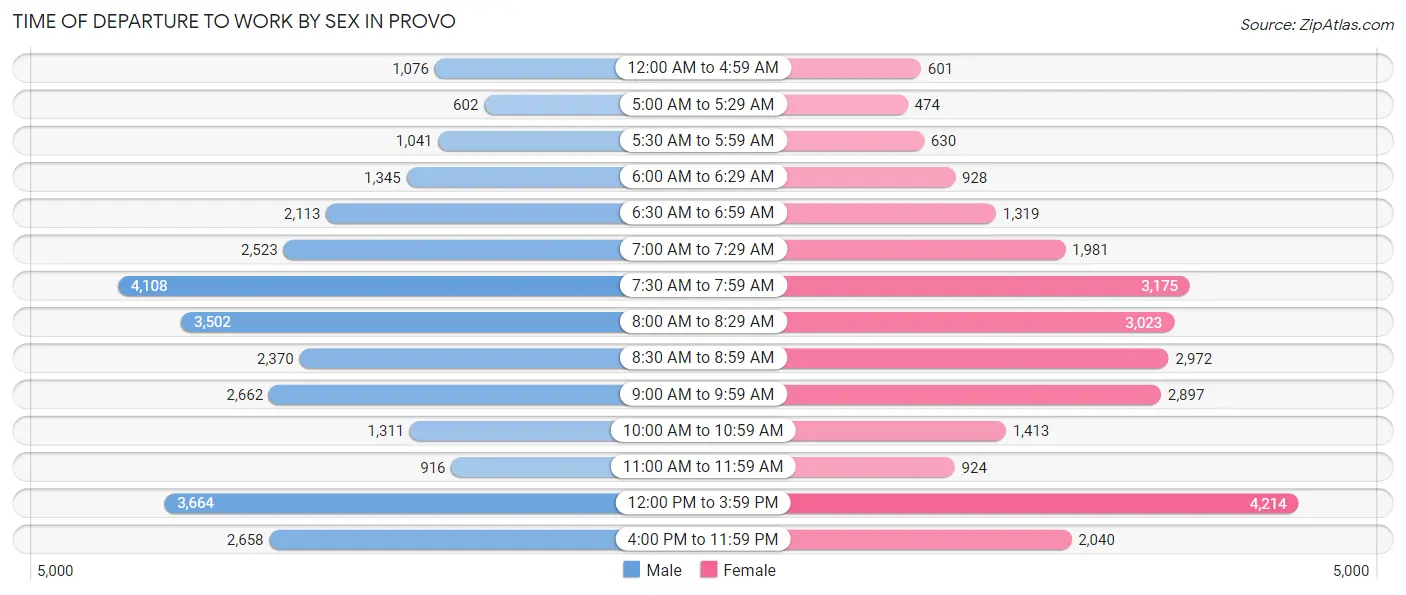
| Time of Departure | Male | Female |
| 12:00 AM to 4:59 AM | 1,076 (3.6%) | 601 (2.3%) |
| 5:00 AM to 5:29 AM | 602 (2.0%) | 474 (1.8%) |
| 5:30 AM to 5:59 AM | 1,041 (3.5%) | 630 (2.4%) |
| 6:00 AM to 6:29 AM | 1,345 (4.5%) | 928 (3.5%) |
| 6:30 AM to 6:59 AM | 2,113 (7.1%) | 1,319 (5.0%) |
| 7:00 AM to 7:29 AM | 2,523 (8.4%) | 1,981 (7.4%) |
| 7:30 AM to 7:59 AM | 4,108 (13.7%) | 3,175 (11.9%) |
| 8:00 AM to 8:29 AM | 3,502 (11.7%) | 3,023 (11.4%) |
| 8:30 AM to 8:59 AM | 2,370 (7.9%) | 2,972 (11.2%) |
| 9:00 AM to 9:59 AM | 2,662 (8.9%) | 2,897 (10.9%) |
| 10:00 AM to 10:59 AM | 1,311 (4.4%) | 1,413 (5.3%) |
| 11:00 AM to 11:59 AM | 916 (3.1%) | 924 (3.5%) |
| 12:00 PM to 3:59 PM | 3,664 (12.3%) | 4,214 (15.9%) |
| 4:00 PM to 11:59 PM | 2,658 (8.9%) | 2,040 (7.7%) |
| Total | 29,891 (100.0%) | 26,591 (100.0%) |
Housing Occupancy in Provo
Occupancy by Ownership in Provo
Of the total 33,151 dwellings in Provo, owner-occupied units account for 12,957 (39.1%), while renter-occupied units make up 20,194 (60.9%).
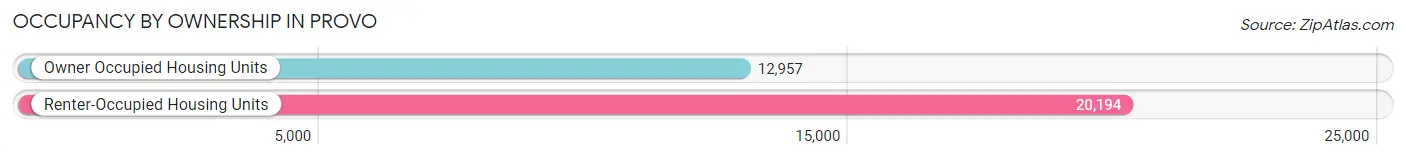
| Occupancy | # Housing Units | % Housing Units |
| Owner Occupied Housing Units | 12,957 | 39.1% |
| Renter-Occupied Housing Units | 20,194 | 60.9% |
| Total Occupied Housing Units | 33,151 | 100.0% |
Occupancy by Household Size in Provo
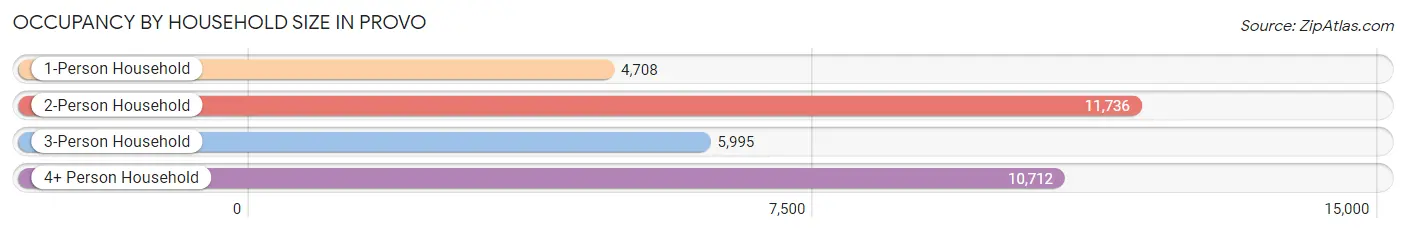
| Household Size | # Housing Units | % Housing Units |
| 1-Person Household | 4,708 | 14.2% |
| 2-Person Household | 11,736 | 35.4% |
| 3-Person Household | 5,995 | 18.1% |
| 4+ Person Household | 10,712 | 32.3% |
| Total Housing Units | 33,151 | 100.0% |
Occupancy by Ownership by Household Size in Provo
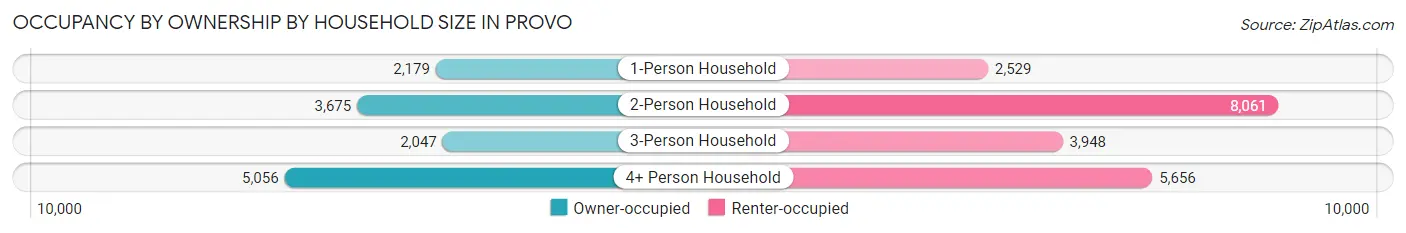
| Household Size | Owner-occupied | Renter-occupied |
| 1-Person Household | 2,179 (46.3%) | 2,529 (53.7%) |
| 2-Person Household | 3,675 (31.3%) | 8,061 (68.7%) |
| 3-Person Household | 2,047 (34.2%) | 3,948 (65.8%) |
| 4+ Person Household | 5,056 (47.2%) | 5,656 (52.8%) |
| Total Housing Units | 12,957 (39.1%) | 20,194 (60.9%) |
Occupancy by Educational Attainment in Provo
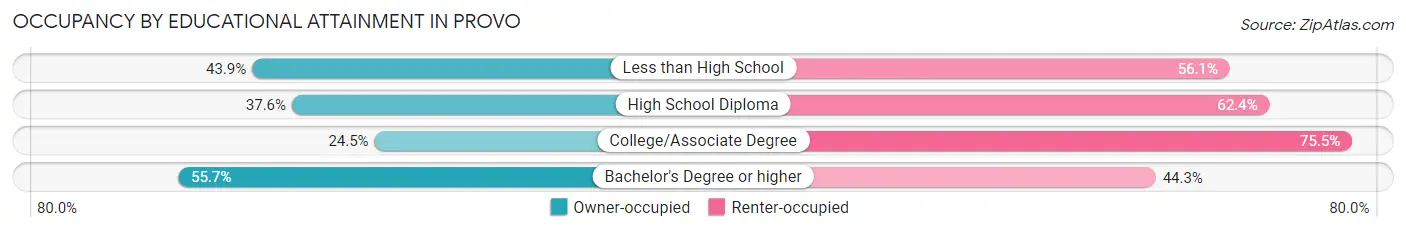
| Household Size | Owner-occupied | Renter-occupied |
| Less than High School | 567 (43.9%) | 724 (56.1%) |
| High School Diploma | 1,468 (37.6%) | 2,435 (62.4%) |
| College/Associate Degree | 3,649 (24.5%) | 11,240 (75.5%) |
| Bachelor's Degree or higher | 7,273 (55.7%) | 5,795 (44.3%) |
Occupancy by Age of Householder in Provo
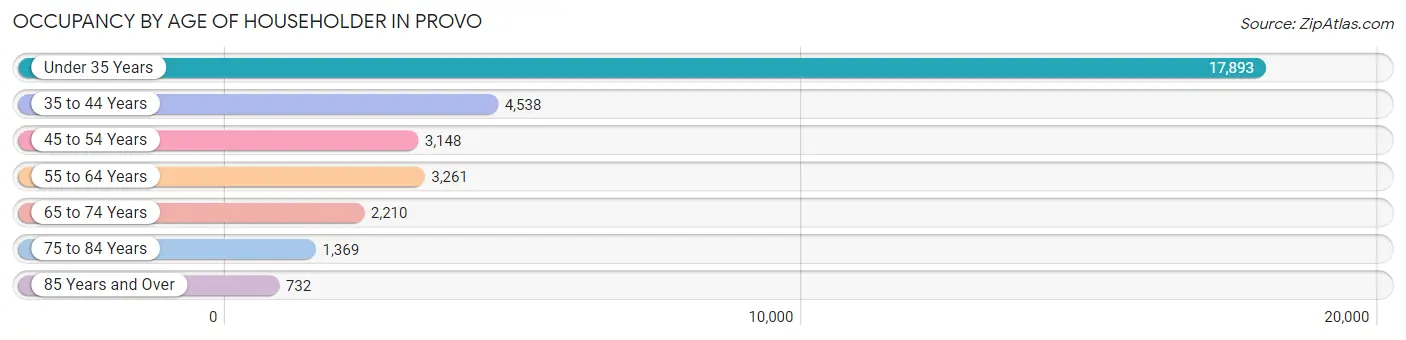
| Age Bracket | # Households | % Households |
| Under 35 Years | 17,893 | 54.0% |
| 35 to 44 Years | 4,538 | 13.7% |
| 45 to 54 Years | 3,148 | 9.5% |
| 55 to 64 Years | 3,261 | 9.8% |
| 65 to 74 Years | 2,210 | 6.7% |
| 75 to 84 Years | 1,369 | 4.1% |
| 85 Years and Over | 732 | 2.2% |
| Total | 33,151 | 100.0% |
Housing Finances in Provo
Median Income by Occupancy in Provo
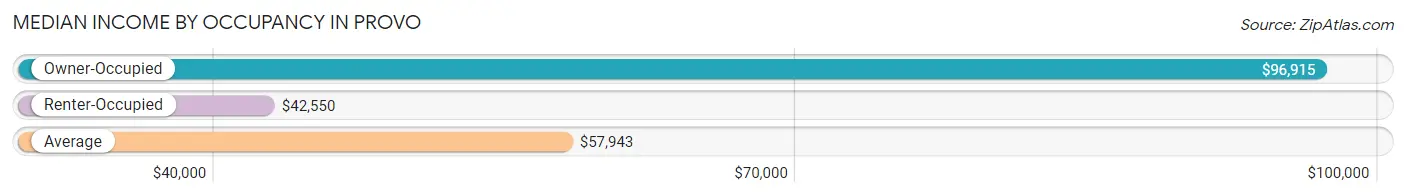
| Occupancy Type | # Households | Median Income |
| Owner-Occupied | 12,957 (39.1%) | $96,915 |
| Renter-Occupied | 20,194 (60.9%) | $42,550 |
| Average | 33,151 (100.0%) | $57,943 |
Occupancy by Householder Income Bracket in Provo
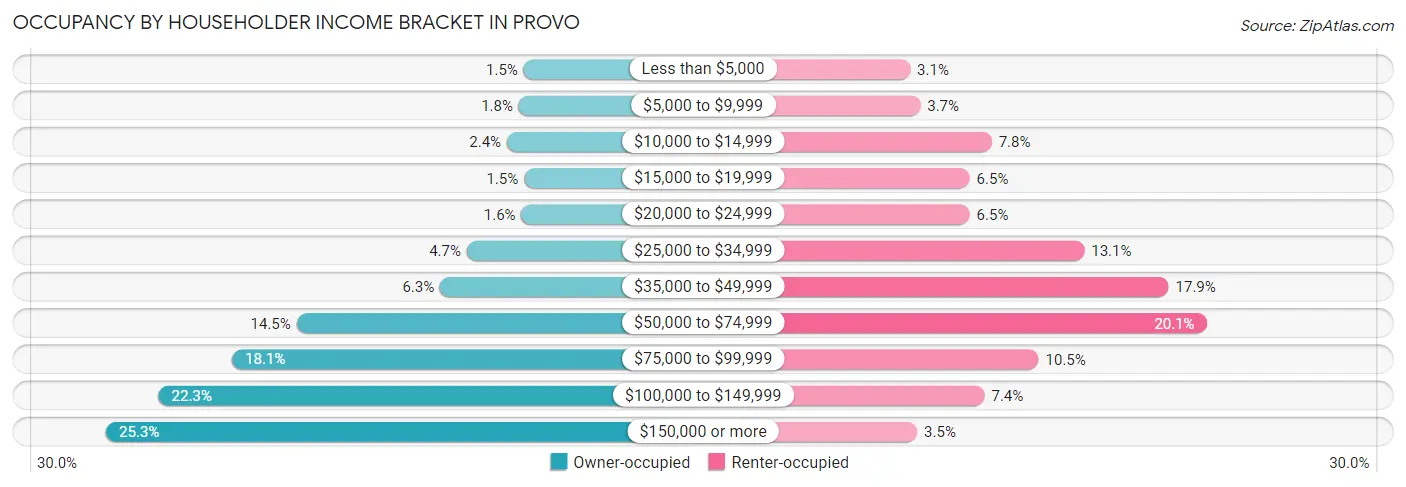
| Income Bracket | Owner-occupied | Renter-occupied |
| Less than $5,000 | 192 (1.5%) | 630 (3.1%) |
| $5,000 to $9,999 | 228 (1.8%) | 748 (3.7%) |
| $10,000 to $14,999 | 316 (2.4%) | 1,571 (7.8%) |
| $15,000 to $19,999 | 189 (1.5%) | 1,317 (6.5%) |
| $20,000 to $24,999 | 208 (1.6%) | 1,316 (6.5%) |
| $25,000 to $34,999 | 613 (4.7%) | 2,640 (13.1%) |
| $35,000 to $49,999 | 811 (6.3%) | 3,612 (17.9%) |
| $50,000 to $74,999 | 1,873 (14.5%) | 4,048 (20.1%) |
| $75,000 to $99,999 | 2,350 (18.1%) | 2,113 (10.5%) |
| $100,000 to $149,999 | 2,894 (22.3%) | 1,489 (7.4%) |
| $150,000 or more | 3,283 (25.3%) | 710 (3.5%) |
| Total | 12,957 (100.0%) | 20,194 (100.0%) |
Monthly Housing Cost Tiers in Provo
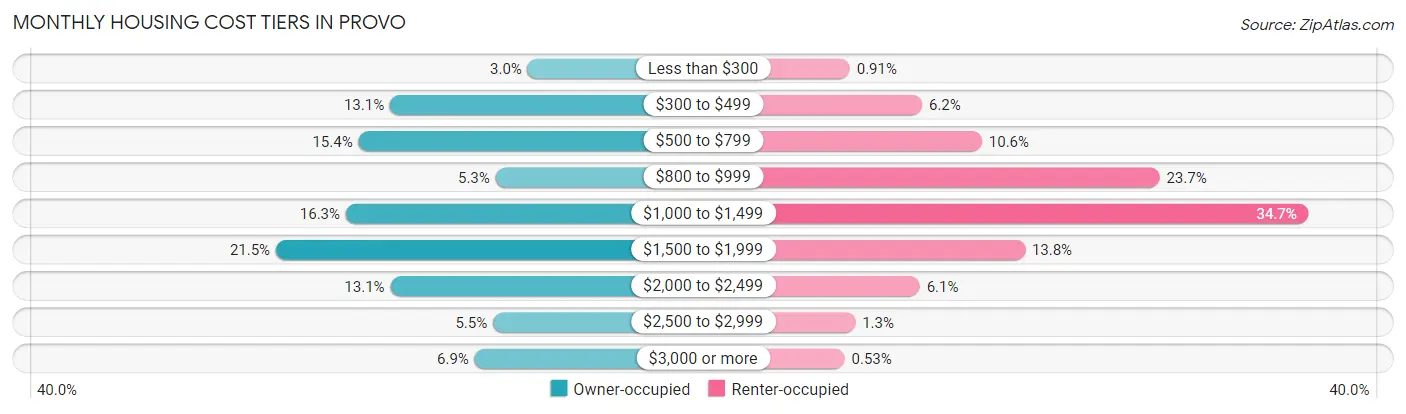
| Monthly Cost | Owner-occupied | Renter-occupied |
| Less than $300 | 382 (2.9%) | 183 (0.9%) |
| $300 to $499 | 1,696 (13.1%) | 1,259 (6.2%) |
| $500 to $799 | 1,997 (15.4%) | 2,149 (10.6%) |
| $800 to $999 | 688 (5.3%) | 4,790 (23.7%) |
| $1,000 to $1,499 | 2,117 (16.3%) | 7,007 (34.7%) |
| $1,500 to $1,999 | 2,785 (21.5%) | 2,788 (13.8%) |
| $2,000 to $2,499 | 1,692 (13.1%) | 1,224 (6.1%) |
| $2,500 to $2,999 | 713 (5.5%) | 265 (1.3%) |
| $3,000 or more | 887 (6.9%) | 108 (0.5%) |
| Total | 12,957 (100.0%) | 20,194 (100.0%) |
Physical Housing Characteristics in Provo
Housing Structures in Provo
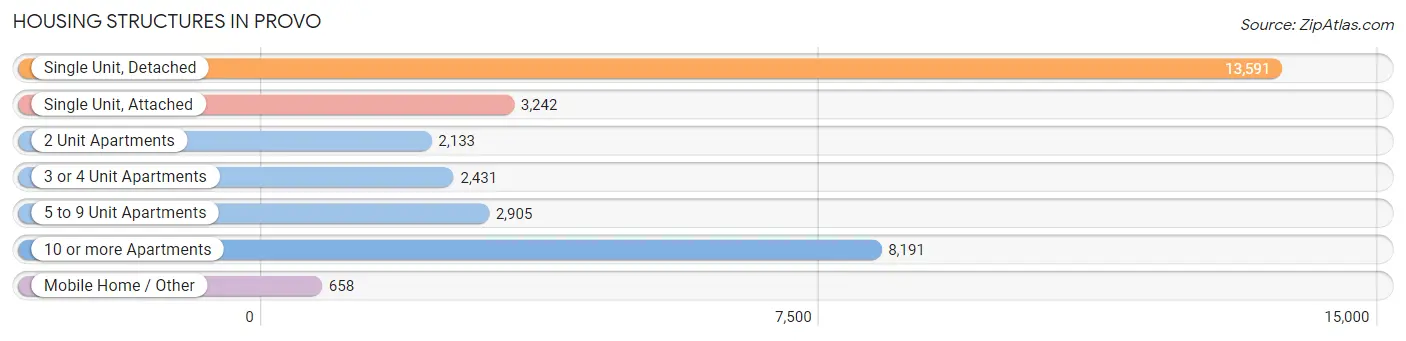
| Structure Type | # Housing Units | % Housing Units |
| Single Unit, Detached | 13,591 | 41.0% |
| Single Unit, Attached | 3,242 | 9.8% |
| 2 Unit Apartments | 2,133 | 6.4% |
| 3 or 4 Unit Apartments | 2,431 | 7.3% |
| 5 to 9 Unit Apartments | 2,905 | 8.8% |
| 10 or more Apartments | 8,191 | 24.7% |
| Mobile Home / Other | 658 | 2.0% |
| Total | 33,151 | 100.0% |
Housing Structures by Occupancy in Provo
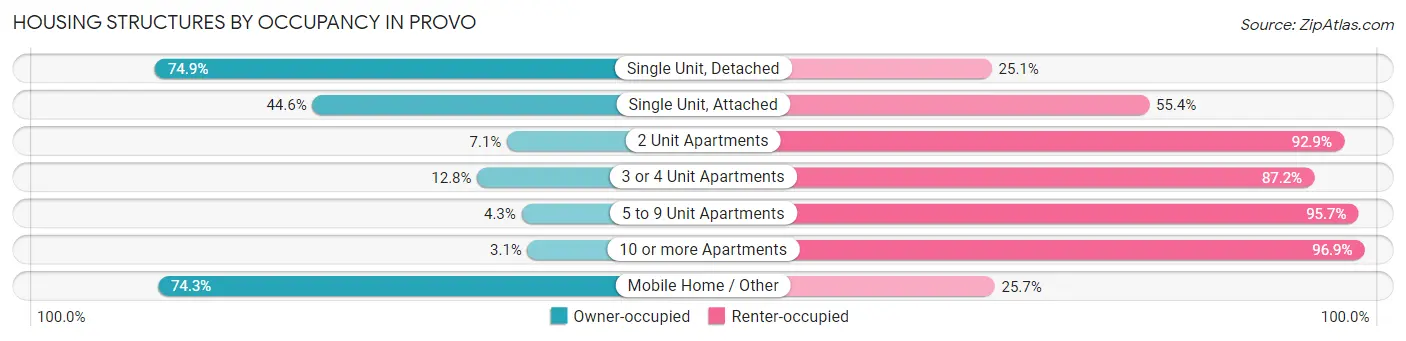
| Structure Type | Owner-occupied | Renter-occupied |
| Single Unit, Detached | 10,178 (74.9%) | 3,413 (25.1%) |
| Single Unit, Attached | 1,445 (44.6%) | 1,797 (55.4%) |
| 2 Unit Apartments | 151 (7.1%) | 1,982 (92.9%) |
| 3 or 4 Unit Apartments | 312 (12.8%) | 2,119 (87.2%) |
| 5 to 9 Unit Apartments | 125 (4.3%) | 2,780 (95.7%) |
| 10 or more Apartments | 257 (3.1%) | 7,934 (96.9%) |
| Mobile Home / Other | 489 (74.3%) | 169 (25.7%) |
| Total | 12,957 (39.1%) | 20,194 (60.9%) |
Housing Structures by Number of Rooms in Provo
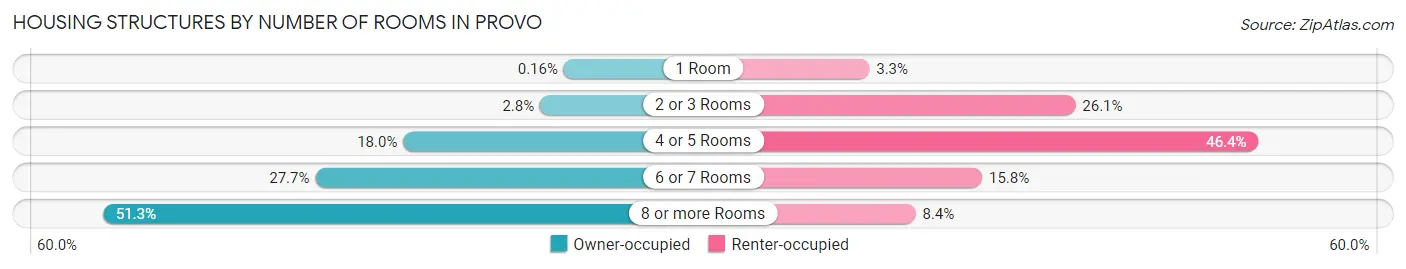
| Number of Rooms | Owner-occupied | Renter-occupied |
| 1 Room | 21 (0.2%) | 658 (3.3%) |
| 2 or 3 Rooms | 362 (2.8%) | 5,277 (26.1%) |
| 4 or 5 Rooms | 2,330 (18.0%) | 9,379 (46.4%) |
| 6 or 7 Rooms | 3,594 (27.7%) | 3,185 (15.8%) |
| 8 or more Rooms | 6,650 (51.3%) | 1,695 (8.4%) |
| Total | 12,957 (100.0%) | 20,194 (100.0%) |
Housing Structure by Heating Type in Provo
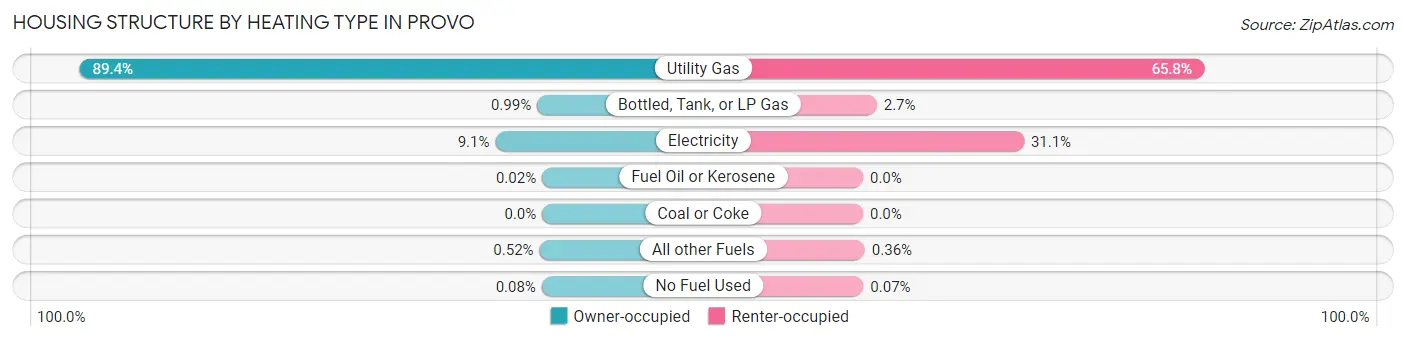
| Heating Type | Owner-occupied | Renter-occupied |
| Utility Gas | 11,577 (89.3%) | 13,293 (65.8%) |
| Bottled, Tank, or LP Gas | 128 (1.0%) | 536 (2.6%) |
| Electricity | 1,173 (9.0%) | 6,278 (31.1%) |
| Fuel Oil or Kerosene | 2 (0.0%) | 0 (0.0%) |
| Coal or Coke | 0 (0.0%) | 0 (0.0%) |
| All other Fuels | 67 (0.5%) | 72 (0.4%) |
| No Fuel Used | 10 (0.1%) | 15 (0.1%) |
| Total | 12,957 (100.0%) | 20,194 (100.0%) |
Household Vehicle Usage in Provo
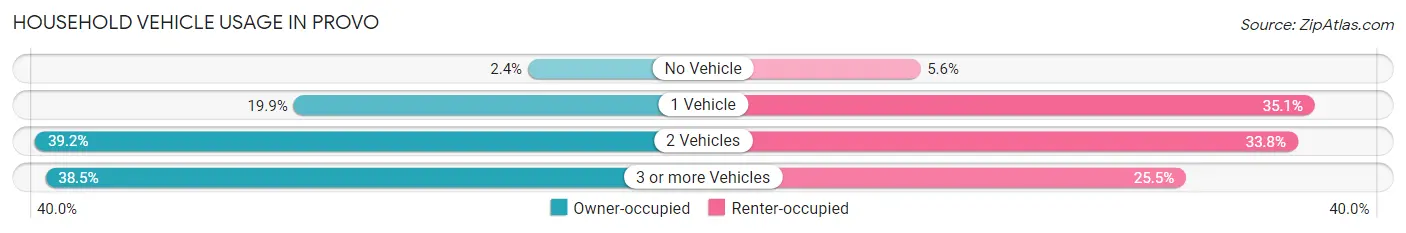
| Vehicles per Household | Owner-occupied | Renter-occupied |
| No Vehicle | 312 (2.4%) | 1,134 (5.6%) |
| 1 Vehicle | 2,581 (19.9%) | 7,087 (35.1%) |
| 2 Vehicles | 5,082 (39.2%) | 6,830 (33.8%) |
| 3 or more Vehicles | 4,982 (38.5%) | 5,143 (25.5%) |
| Total | 12,957 (100.0%) | 20,194 (100.0%) |
Real Estate & Mortgages in Provo
Real Estate and Mortgage Overview in Provo
| Characteristic | Without Mortgage | With Mortgage |
| Housing Units | 4,622 | 8,335 |
| Median Property Value | $383,000 | $395,800 |
| Median Household Income | $77,913 | $2,300 |
| Monthly Housing Costs | $542 | $887 |
| Real Estate Taxes | $1,948 | $211 |
Property Value by Mortgage Status in Provo
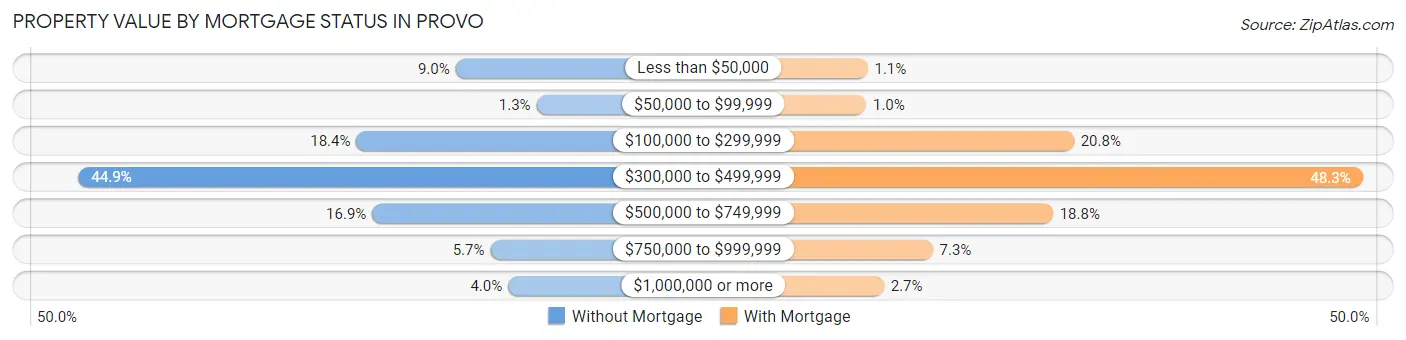
| Property Value | Without Mortgage | With Mortgage |
| Less than $50,000 | 414 (9.0%) | 95 (1.1%) |
| $50,000 to $99,999 | 58 (1.3%) | 83 (1.0%) |
| $100,000 to $299,999 | 851 (18.4%) | 1,732 (20.8%) |
| $300,000 to $499,999 | 2,074 (44.9%) | 4,024 (48.3%) |
| $500,000 to $749,999 | 781 (16.9%) | 1,565 (18.8%) |
| $750,000 to $999,999 | 261 (5.7%) | 612 (7.3%) |
| $1,000,000 or more | 183 (4.0%) | 224 (2.7%) |
| Total | 4,622 (100.0%) | 8,335 (100.0%) |
Household Income by Mortgage Status in Provo
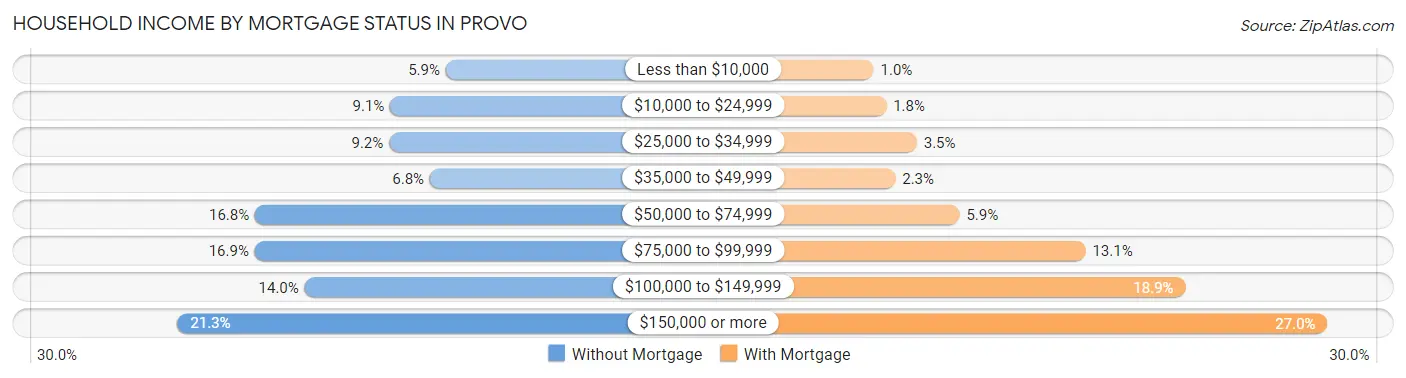
| Household Income | Without Mortgage | With Mortgage |
| Less than $10,000 | 274 (5.9%) | 86 (1.0%) |
| $10,000 to $24,999 | 421 (9.1%) | 146 (1.8%) |
| $25,000 to $34,999 | 424 (9.2%) | 292 (3.5%) |
| $35,000 to $49,999 | 316 (6.8%) | 189 (2.3%) |
| $50,000 to $74,999 | 778 (16.8%) | 495 (5.9%) |
| $75,000 to $99,999 | 779 (16.9%) | 1,095 (13.1%) |
| $100,000 to $149,999 | 647 (14.0%) | 1,571 (18.9%) |
| $150,000 or more | 983 (21.3%) | 2,247 (27.0%) |
| Total | 4,622 (100.0%) | 8,335 (100.0%) |
Property Value to Household Income Ratio in Provo
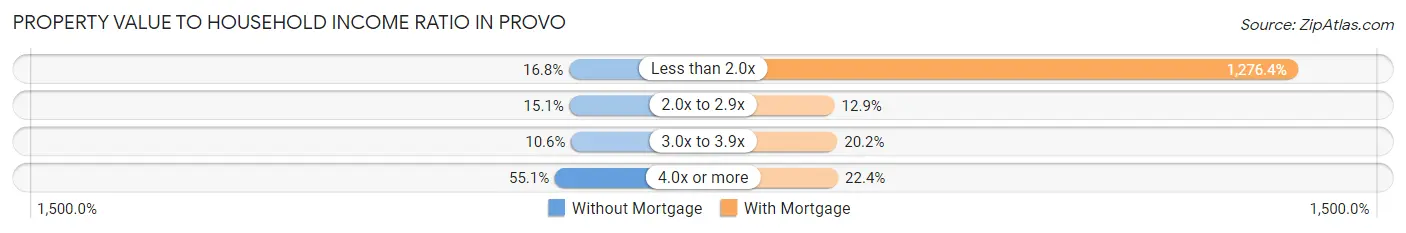
| Value-to-Income Ratio | Without Mortgage | With Mortgage |
| Less than 2.0x | 777 (16.8%) | 106,385 (1,276.4%) |
| 2.0x to 2.9x | 700 (15.1%) | 1,077 (12.9%) |
| 3.0x to 3.9x | 490 (10.6%) | 1,683 (20.2%) |
| 4.0x or more | 2,545 (55.1%) | 1,870 (22.4%) |
| Total | 4,622 (100.0%) | 8,335 (100.0%) |
Real Estate Taxes by Mortgage Status in Provo
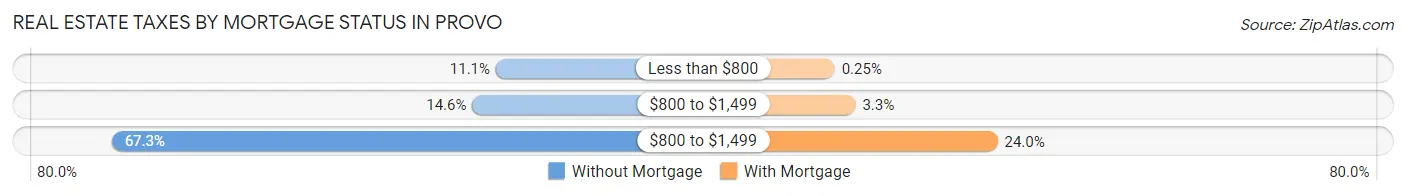
| Property Taxes | Without Mortgage | With Mortgage |
| Less than $800 | 515 (11.1%) | 21 (0.3%) |
| $800 to $1,499 | 674 (14.6%) | 273 (3.3%) |
| $800 to $1,499 | 3,109 (67.3%) | 2,003 (24.0%) |
| Total | 4,622 (100.0%) | 8,335 (100.0%) |
Health & Disability in Provo
Health Insurance Coverage by Age in Provo
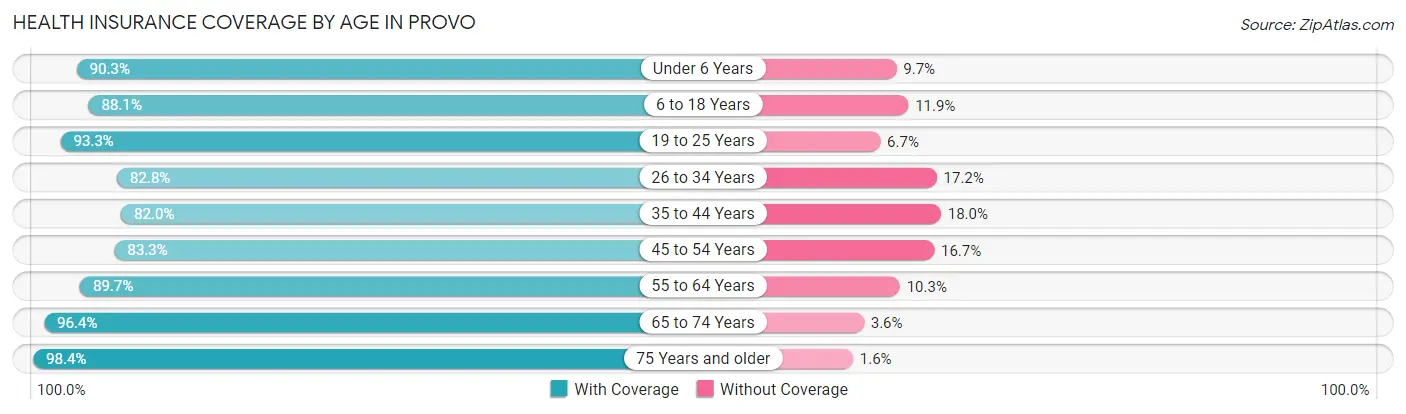
| Age Bracket | With Coverage | Without Coverage |
| Under 6 Years | 6,907 (90.3%) | 742 (9.7%) |
| 6 to 18 Years | 15,449 (88.1%) | 2,091 (11.9%) |
| 19 to 25 Years | 43,608 (93.3%) | 3,127 (6.7%) |
| 26 to 34 Years | 11,005 (82.8%) | 2,289 (17.2%) |
| 35 to 44 Years | 7,304 (82.0%) | 1,603 (18.0%) |
| 45 to 54 Years | 5,385 (83.3%) | 1,083 (16.7%) |
| 55 to 64 Years | 5,247 (89.7%) | 605 (10.3%) |
| 65 to 74 Years | 3,898 (96.4%) | 147 (3.6%) |
| 75 Years and older | 3,077 (98.4%) | 50 (1.6%) |
| Total | 101,880 (89.7%) | 11,737 (10.3%) |
Health Insurance Coverage by Citizenship Status in Provo
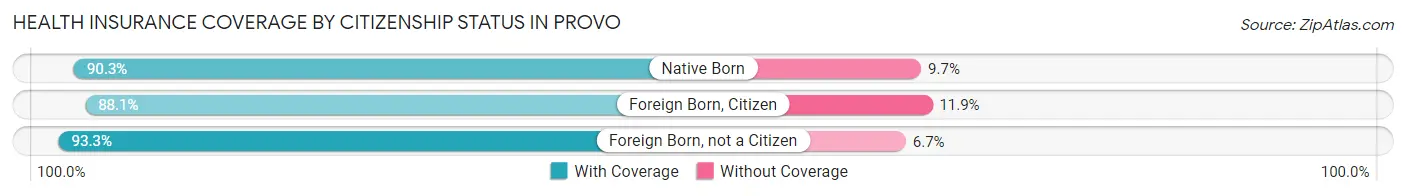
| Citizenship Status | With Coverage | Without Coverage |
| Native Born | 6,907 (90.3%) | 742 (9.7%) |
| Foreign Born, Citizen | 15,449 (88.1%) | 2,091 (11.9%) |
| Foreign Born, not a Citizen | 43,608 (93.3%) | 3,127 (6.7%) |
Health Insurance Coverage by Household Income in Provo
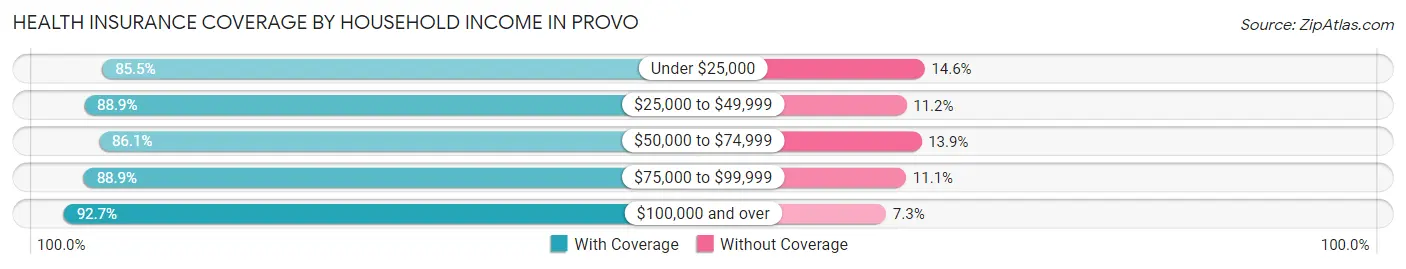
| Household Income | With Coverage | Without Coverage |
| Under $25,000 | 12,763 (85.5%) | 2,173 (14.5%) |
| $25,000 to $49,999 | 18,894 (88.8%) | 2,370 (11.2%) |
| $50,000 to $74,999 | 14,624 (86.1%) | 2,368 (13.9%) |
| $75,000 to $99,999 | 13,102 (88.9%) | 1,632 (11.1%) |
| $100,000 and over | 30,738 (92.7%) | 2,432 (7.3%) |
Public vs Private Health Insurance Coverage by Age in Provo
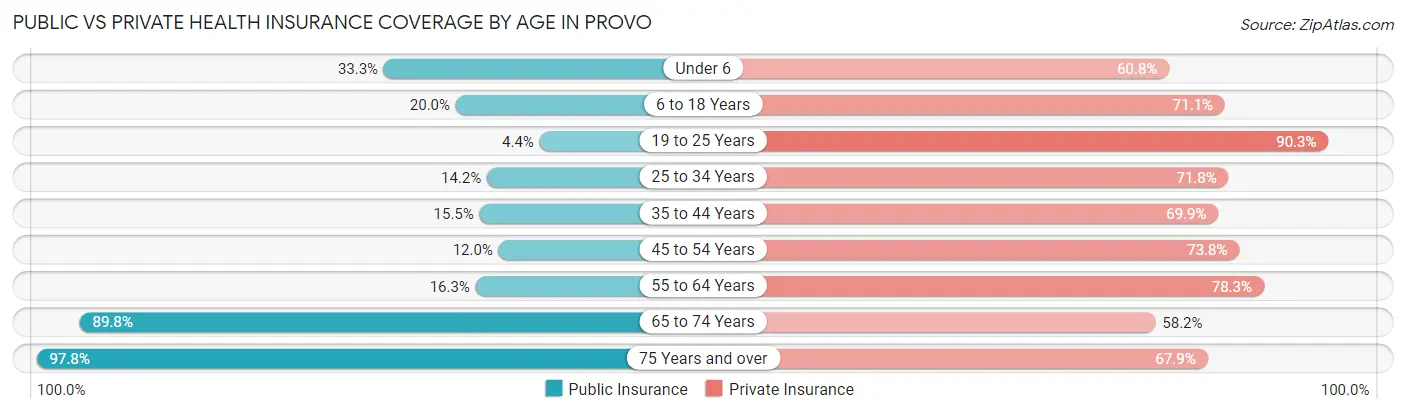
| Age Bracket | Public Insurance | Private Insurance |
| Under 6 | 2,547 (33.3%) | 4,648 (60.8%) |
| 6 to 18 Years | 3,500 (20.0%) | 12,472 (71.1%) |
| 19 to 25 Years | 2,051 (4.4%) | 42,196 (90.3%) |
| 25 to 34 Years | 1,884 (14.2%) | 9,542 (71.8%) |
| 35 to 44 Years | 1,384 (15.5%) | 6,224 (69.9%) |
| 45 to 54 Years | 776 (12.0%) | 4,772 (73.8%) |
| 55 to 64 Years | 952 (16.3%) | 4,583 (78.3%) |
| 65 to 74 Years | 3,632 (89.8%) | 2,354 (58.2%) |
| 75 Years and over | 3,058 (97.8%) | 2,123 (67.9%) |
| Total | 19,784 (17.4%) | 88,914 (78.3%) |
Disability Status by Sex by Age in Provo
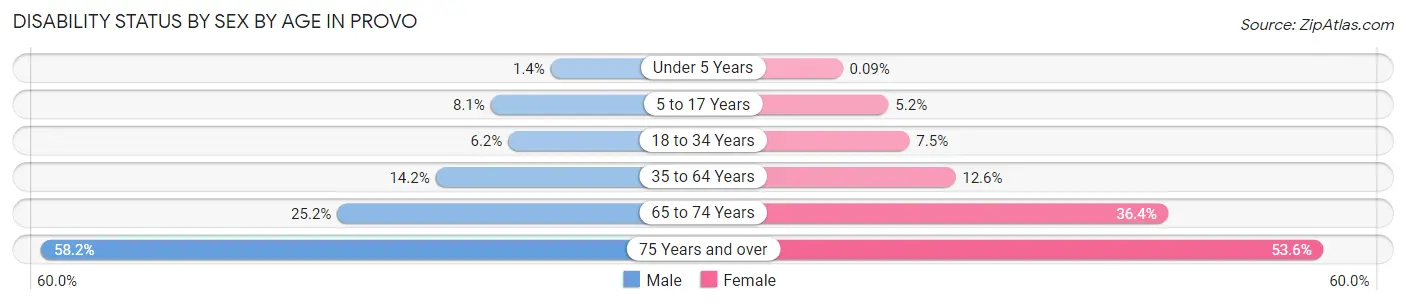
| Age Bracket | Male | Female |
| Under 5 Years | 47 (1.4%) | 3 (0.1%) |
| 5 to 17 Years | 581 (8.1%) | 390 (5.2%) |
| 18 to 34 Years | 1,941 (6.1%) | 2,429 (7.5%) |
| 35 to 64 Years | 1,462 (14.2%) | 1,385 (12.6%) |
| 65 to 74 Years | 454 (25.2%) | 816 (36.4%) |
| 75 Years and over | 677 (58.2%) | 1,053 (53.6%) |
Disability Class by Sex by Age in Provo
Disability Class: Hearing Difficulty
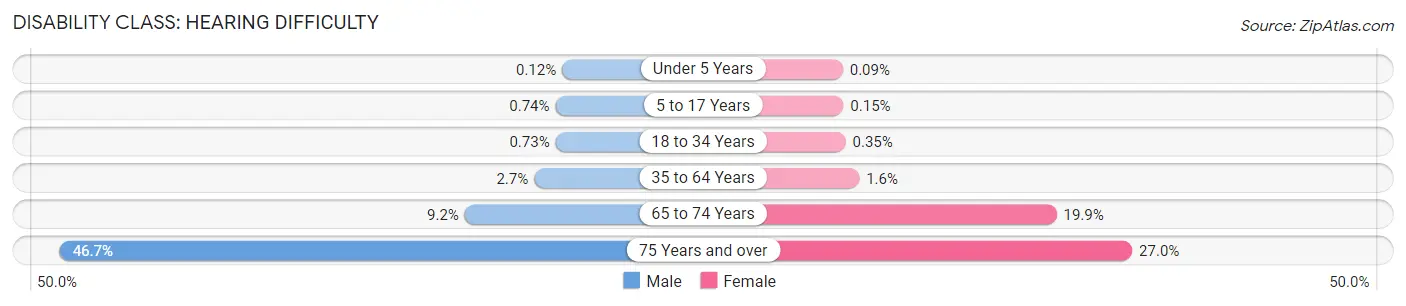
| Age Bracket | Male | Female |
| Under 5 Years | 4 (0.1%) | 3 (0.1%) |
| 5 to 17 Years | 53 (0.7%) | 11 (0.2%) |
| 18 to 34 Years | 232 (0.7%) | 114 (0.4%) |
| 35 to 64 Years | 279 (2.7%) | 178 (1.6%) |
| 65 to 74 Years | 165 (9.2%) | 447 (19.9%) |
| 75 Years and over | 544 (46.7%) | 529 (27.0%) |
Disability Class: Vision Difficulty
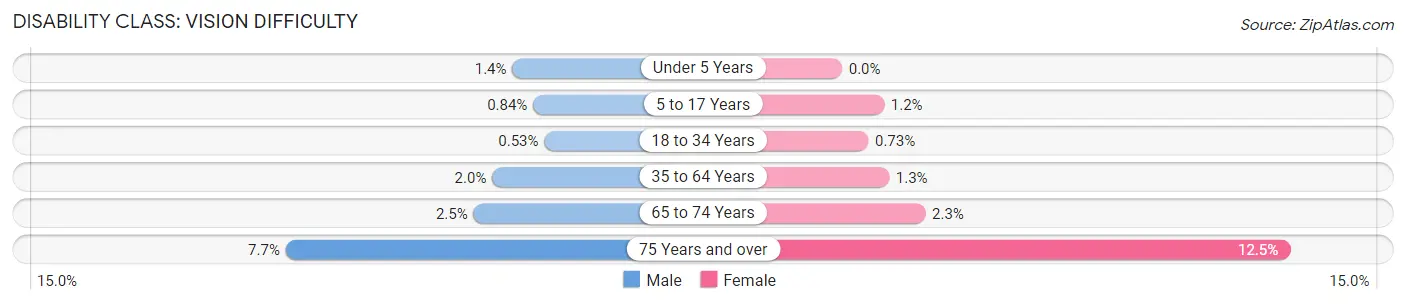
| Age Bracket | Male | Female |
| Under 5 Years | 47 (1.4%) | 0 (0.0%) |
| 5 to 17 Years | 60 (0.8%) | 88 (1.2%) |
| 18 to 34 Years | 167 (0.5%) | 235 (0.7%) |
| 35 to 64 Years | 203 (2.0%) | 144 (1.3%) |
| 65 to 74 Years | 45 (2.5%) | 52 (2.3%) |
| 75 Years and over | 90 (7.7%) | 245 (12.5%) |
Disability Class: Cognitive Difficulty
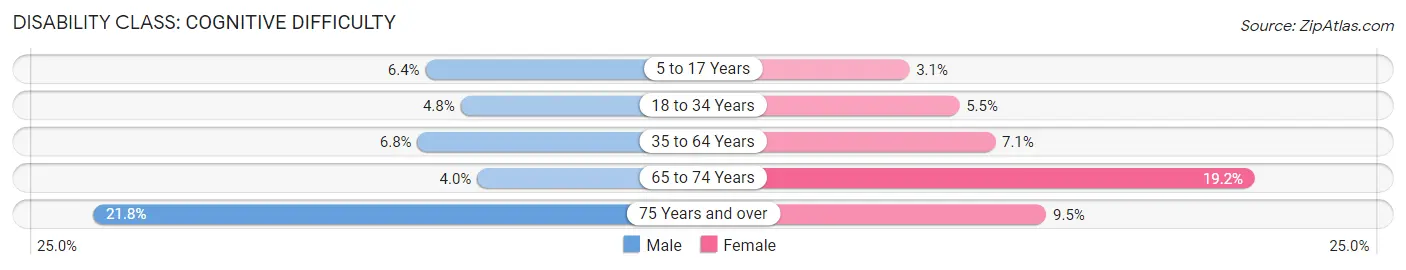
| Age Bracket | Male | Female |
| 5 to 17 Years | 459 (6.4%) | 235 (3.1%) |
| 18 to 34 Years | 1,505 (4.8%) | 1,757 (5.4%) |
| 35 to 64 Years | 695 (6.8%) | 779 (7.1%) |
| 65 to 74 Years | 72 (4.0%) | 430 (19.2%) |
| 75 Years and over | 254 (21.8%) | 186 (9.5%) |
Disability Class: Ambulatory Difficulty
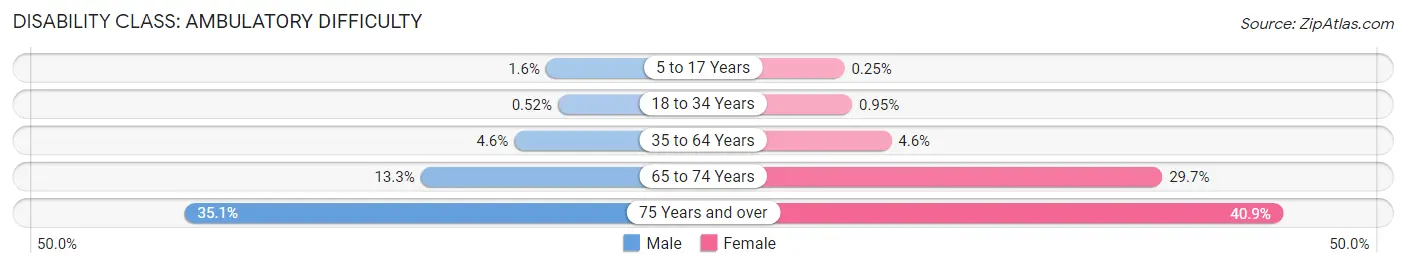
| Age Bracket | Male | Female |
| 5 to 17 Years | 117 (1.6%) | 19 (0.3%) |
| 18 to 34 Years | 163 (0.5%) | 306 (0.9%) |
| 35 to 64 Years | 469 (4.6%) | 504 (4.6%) |
| 65 to 74 Years | 239 (13.3%) | 667 (29.7%) |
| 75 Years and over | 409 (35.1%) | 803 (40.9%) |
Disability Class: Self-Care Difficulty
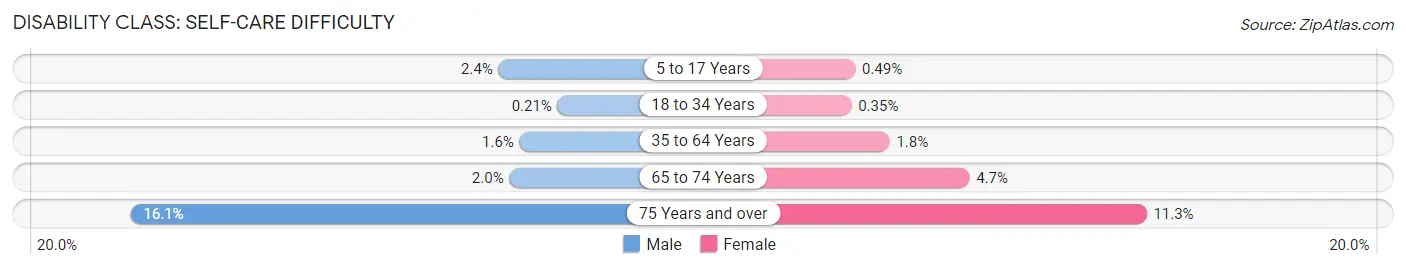
| Age Bracket | Male | Female |
| 5 to 17 Years | 172 (2.4%) | 37 (0.5%) |
| 18 to 34 Years | 65 (0.2%) | 114 (0.4%) |
| 35 to 64 Years | 166 (1.6%) | 194 (1.8%) |
| 65 to 74 Years | 36 (2.0%) | 106 (4.7%) |
| 75 Years and over | 187 (16.1%) | 222 (11.3%) |
Technology Access in Provo
Computing Device Access in Provo
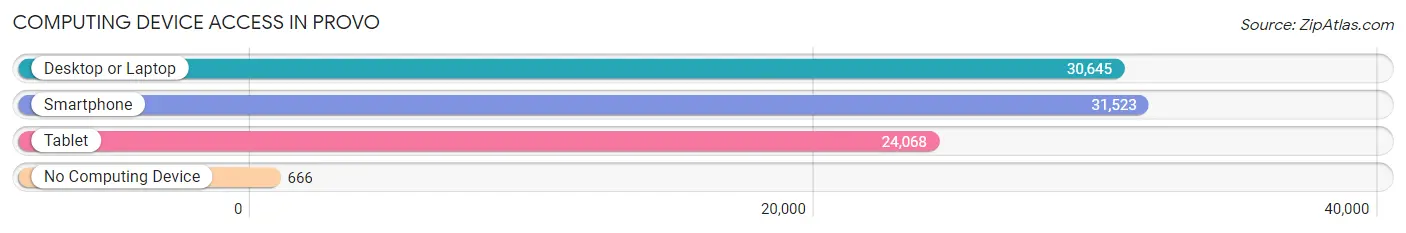
| Device Type | # Households | % Households |
| Desktop or Laptop | 30,645 | 92.4% |
| Smartphone | 31,523 | 95.1% |
| Tablet | 24,068 | 72.6% |
| No Computing Device | 666 | 2.0% |
| Total | 33,151 | 100.0% |
Internet Access in Provo
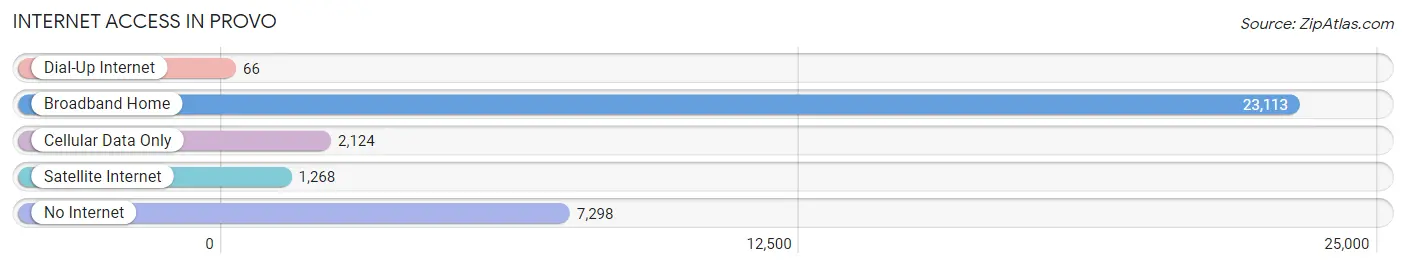
| Internet Type | # Households | % Households |
| Dial-Up Internet | 66 | 0.2% |
| Broadband Home | 23,113 | 69.7% |
| Cellular Data Only | 2,124 | 6.4% |
| Satellite Internet | 1,268 | 3.8% |
| No Internet | 7,298 | 22.0% |
| Total | 33,151 | 100.0% |
Provo Summary
Provo is a city located in the state of Utah, in the United States of America. It is the county seat of Utah County and the third-largest city in the state. The city is situated in the Wasatch Mountains at the base of the Provo Canyon, and is home to Brigham Young University (BYU). Provo is known for its strong religious culture, its outdoor recreation opportunities, and its vibrant economy.
History
Provo was first settled in 1849 by a group of Mormon pioneers led by Ebenezer Brown. The city was named after Etienne Provost, a French-Canadian fur trapper who had explored the area in the early 1800s. The pioneers established a fort and began to build a city. In 1850, the city was incorporated and the first mayor was elected.
In 1875, the Utah Central Railroad was built through Provo, connecting the city to Salt Lake City and other cities in the region. This allowed Provo to become an important transportation hub and helped to spur economic growth.
In the late 19th century, Provo became a center of education, with the founding of Brigham Young Academy (now BYU) in 1875 and the Utah State Agricultural College (now Utah State University) in 1888.
Geography
Provo is located in the Wasatch Mountains at the base of the Provo Canyon. The city is situated at an elevation of 4,549 feet (1,387 m). The city is bordered by the Provo River to the east and the Wasatch Mountains to the west.
The city covers an area of 44.2 square miles (114.3 km2). The climate is semi-arid, with hot summers and cold winters. The average annual precipitation is 17.2 inches (437 mm).
Economy
Provo has a strong and diverse economy. The city is home to several major employers, including Brigham Young University, Novell, Vivint, and Ancestry.com. The city is also home to a number of technology companies, including Qualtrics, Vivint, and Pluralsight.
The city is also a major tourist destination, with attractions such as the Provo River Parkway, the Provo City Center Temple, and the Utah Valley Convention Center.
Demographics
As of the 2010 census, the population of Provo was 115,264. The racial makeup of the city was 87.2% White, 1.3% African American, 0.7% Native American, 2.2% Asian, 0.2% Pacific Islander, 5.7% from other races, and 2.7% from two or more races. Hispanic or Latino of any race were 11.7% of the population.
The median income for a household in the city was $41,919, and the median income for a family was $50,919. The per capita income for the city was $20,919. About 11.2% of families and 15.3% of the population were below the poverty line, including 19.2% of those under age 18 and 8.2% of those age 65 or over.
Common Questions
What is Per Capita Income in Provo?
Per Capita income in Provo is $25,228.
What is the Median Family Income in Provo?
Median Family Income in Provo is $66,422.
What is the Median Household income in Provo?
Median Household Income in Provo is $57,943.
What is Income or Wage Gap in Provo?
Income or Wage Gap in Provo is 44.0%.
Women in Provo earn 56.0 cents for every dollar earned by a man.
What is Family Income Deficit in Provo?
Family Income Deficit in Provo is $9,079.
Families that are below poverty line in Provo earn $9,079 less on average than the poverty threshold level.
What is Inequality or Gini Index in Provo?
Inequality or Gini Index in Provo is 0.48.
What is the Total Population of Provo?
Total Population of Provo is 114,400.
What is the Total Male Population of Provo?
Total Male Population of Provo is 55,782.
What is the Total Female Population of Provo?
Total Female Population of Provo is 58,618.
What is the Ratio of Males per 100 Females in Provo?
There are 95.16 Males per 100 Females in Provo.
What is the Ratio of Females per 100 Males in Provo?
There are 105.08 Females per 100 Males in Provo.
What is the Median Population Age in Provo?
Median Population Age in Provo is 23.6 Years.
What is the Average Family Size in Provo
Average Family Size in Provo is 3.2 People.
What is the Average Household Size in Provo
Average Household Size in Provo is 3.0 People.
How Large is the Labor Force in Provo?
There are 69,457 People in the Labor Forcein in Provo.
What is the Percentage of People in the Labor Force in Provo?
72.8% of People are in the Labor Force in Provo.
What is the Unemployment Rate in Provo?
Unemployment Rate in Provo is 4.4%.