Bull Shoals, AR Map & Demographics
Bull Shoals Map
Bull Shoals Overview
$33,238
PER CAPITA INCOME
$58,304
AVG FAMILY INCOME
$45,144
AVG HOUSEHOLD INCOME
47.1%
WAGE / INCOME GAP [ % ]
52.9¢/ $1
WAGE / INCOME GAP [ $ ]
0.48
INEQUALITY / GINI INDEX
1,790
TOTAL POPULATION
824
MALE POPULATION
966
FEMALE POPULATION
85.30
MALES / 100 FEMALES
117.23
FEMALES / 100 MALES
58.6
MEDIAN AGE
3.2
AVG FAMILY SIZE
2.2
AVG HOUSEHOLD SIZE
627
LABOR FORCE [ PEOPLE ]
41.4%
PERCENT IN LABOR FORCE
11.0%
UNEMPLOYMENT RATE
Bull Shoals Zip Codes
Bull Shoals Area Codes
Income in Bull Shoals
Income Overview in Bull Shoals
Per Capita Income in Bull Shoals is $33,238, while median incomes of families and households are $58,304 and $45,144 respectively.
| Characteristic | Number | Measure |
| Per Capita Income | 1,790 | $33,238 |
| Median Family Income | 412 | $58,304 |
| Mean Family Income | 412 | $95,757 |
| Median Household Income | 803 | $45,144 |
| Mean Household Income | 803 | $68,986 |
| Income Deficit | 412 | $0 |
| Wage / Income Gap (%) | 1,790 | 47.08% |
| Wage / Income Gap ($) | 1,790 | 52.92¢ per $1 |
| Gini / Inequality Index | 1,790 | 0.48 |
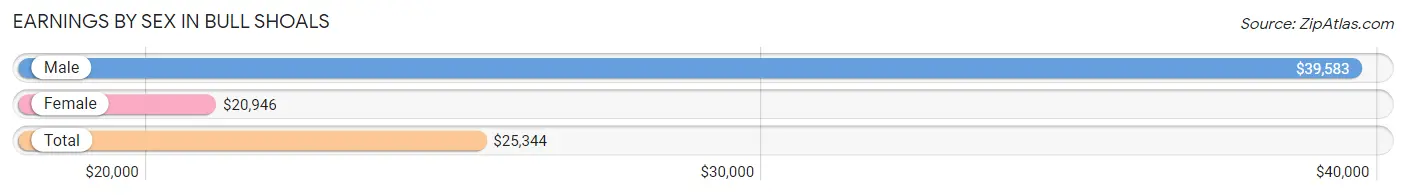
Earnings by Sex in Bull Shoals
Average Earnings in Bull Shoals are $25,344, $39,583 for men and $20,946 for women, a difference of 47.1%.
| Sex | Number | Average Earnings |
| Male | 357 (54.2%) | $39,583 |
| Female | 302 (45.8%) | $20,946 |
| Total | 659 (100.0%) | $25,344 |
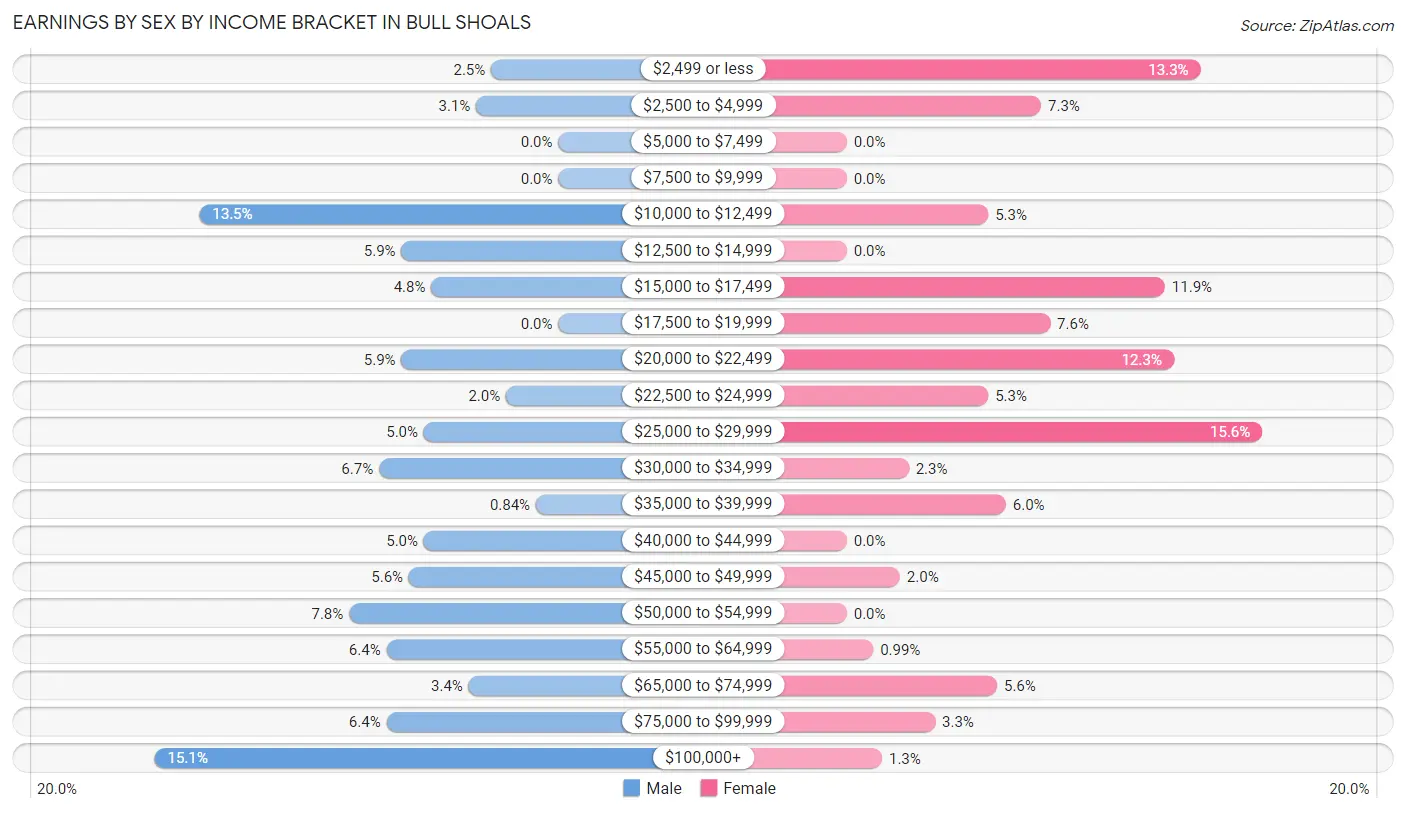
Earnings by Sex by Income Bracket in Bull Shoals
The most common earnings brackets in Bull Shoals are $100,000+ for men (54 | 15.1%) and $25,000 to $29,999 for women (47 | 15.6%).
| Income | Male | Female |
| $2,499 or less | 9 (2.5%) | 40 (13.3%) |
| $2,500 to $4,999 | 11 (3.1%) | 22 (7.3%) |
| $5,000 to $7,499 | 0 (0.0%) | 0 (0.0%) |
| $7,500 to $9,999 | 0 (0.0%) | 0 (0.0%) |
| $10,000 to $12,499 | 48 (13.5%) | 16 (5.3%) |
| $12,500 to $14,999 | 21 (5.9%) | 0 (0.0%) |
| $15,000 to $17,499 | 17 (4.8%) | 36 (11.9%) |
| $17,500 to $19,999 | 0 (0.0%) | 23 (7.6%) |
| $20,000 to $22,499 | 21 (5.9%) | 37 (12.2%) |
| $22,500 to $24,999 | 7 (2.0%) | 16 (5.3%) |
| $25,000 to $29,999 | 18 (5.0%) | 47 (15.6%) |
| $30,000 to $34,999 | 24 (6.7%) | 7 (2.3%) |
| $35,000 to $39,999 | 3 (0.8%) | 18 (6.0%) |
| $40,000 to $44,999 | 18 (5.0%) | 0 (0.0%) |
| $45,000 to $49,999 | 20 (5.6%) | 6 (2.0%) |
| $50,000 to $54,999 | 28 (7.8%) | 0 (0.0%) |
| $55,000 to $64,999 | 23 (6.4%) | 3 (1.0%) |
| $65,000 to $74,999 | 12 (3.4%) | 17 (5.6%) |
| $75,000 to $99,999 | 23 (6.4%) | 10 (3.3%) |
| $100,000+ | 54 (15.1%) | 4 (1.3%) |
| Total | 357 (100.0%) | 302 (100.0%) |
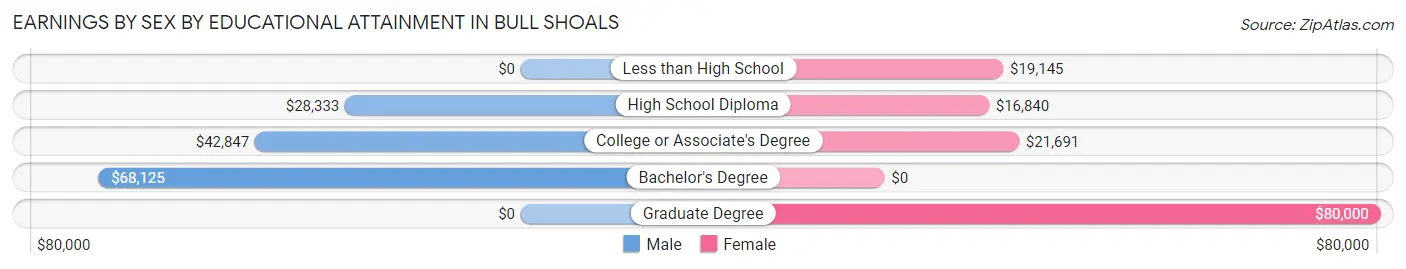
Earnings by Sex by Educational Attainment in Bull Shoals
Average earnings in Bull Shoals are $43,472 for men and $21,250 for women, a difference of 51.1%. Men with an educational attainment of bachelor's degree enjoy the highest average annual earnings of $68,125, while those with high school diploma education earn the least with $28,333. Women with an educational attainment of graduate degree earn the most with the average annual earnings of $80,000, while those with high school diploma education have the smallest earnings of $16,840.
| Educational Attainment | Male Income | Female Income |
| Less than High School | - | - |
| High School Diploma | $28,333 | $16,840 |
| College or Associate's Degree | $42,847 | $21,691 |
| Bachelor's Degree | $68,125 | $0 |
| Graduate Degree | - | - |
| Total | $43,472 | $21,250 |
Family Income in Bull Shoals
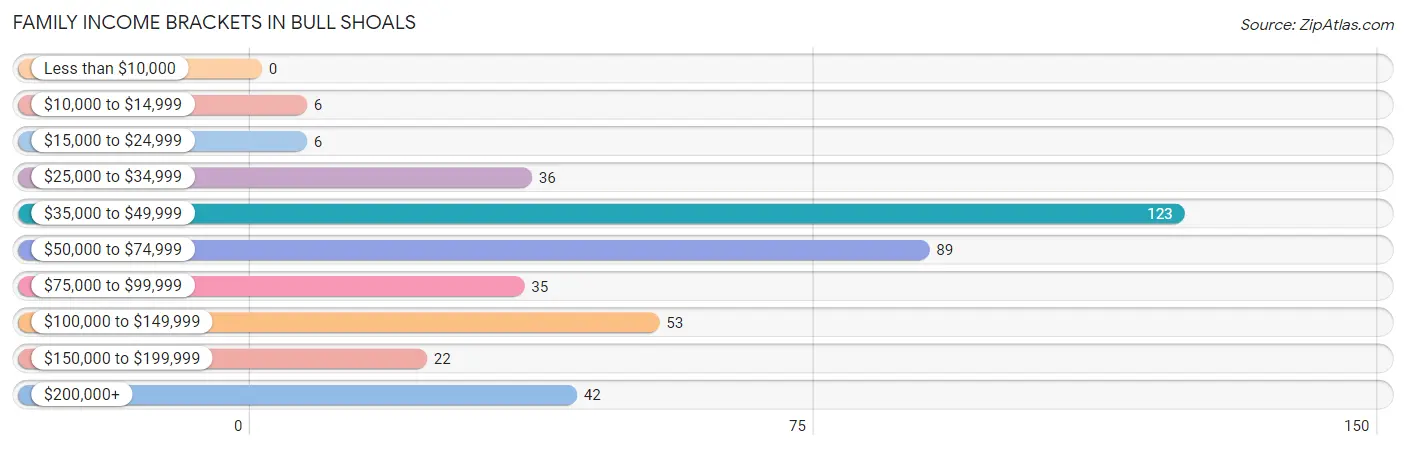
Family Income Brackets in Bull Shoals
According to the Bull Shoals family income data, there are 123 families falling into the $35,000 to $49,999 income range, which is the most common income bracket and makes up 29.8% of all families.
| Income Bracket | # Families | % Families |
| Less than $10,000 | 0 | 0.0% |
| $10,000 to $14,999 | 6 | 1.5% |
| $15,000 to $24,999 | 6 | 1.5% |
| $25,000 to $34,999 | 36 | 8.7% |
| $35,000 to $49,999 | 123 | 29.9% |
| $50,000 to $74,999 | 89 | 21.6% |
| $75,000 to $99,999 | 35 | 8.5% |
| $100,000 to $149,999 | 53 | 12.9% |
| $150,000 to $199,999 | 22 | 5.3% |
| $200,000+ | 42 | 10.2% |
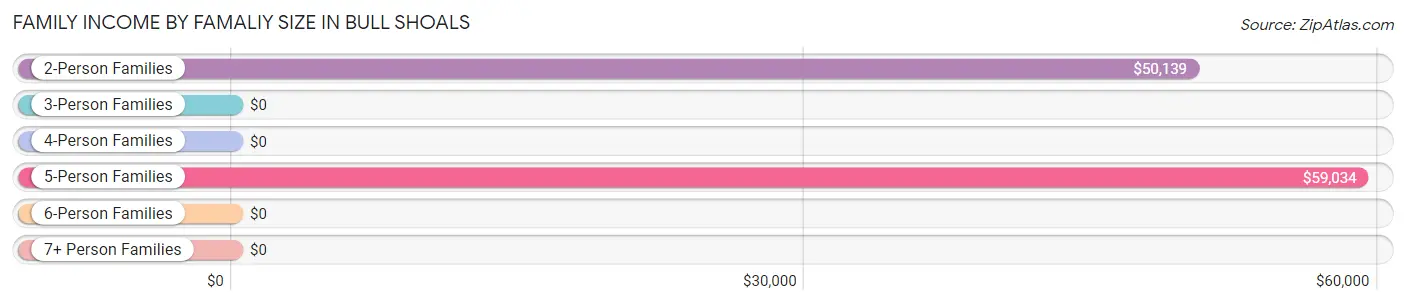
Family Income by Famaliy Size in Bull Shoals
5-person families (39 | 9.5%) account for the highest median family income in Bull Shoals with $59,034 per family, while 2-person families (243 | 59.0%) have the highest median income of $25,070 per family member.
| Income Bracket | # Families | Median Income |
| 2-Person Families | 243 (59.0%) | $50,139 |
| 3-Person Families | 73 (17.7%) | $0 |
| 4-Person Families | 45 (10.9%) | $0 |
| 5-Person Families | 39 (9.5%) | $59,034 |
| 6-Person Families | 12 (2.9%) | $0 |
| 7+ Person Families | 0 (0.0%) | $0 |
| Total | 412 (100.0%) | $58,304 |
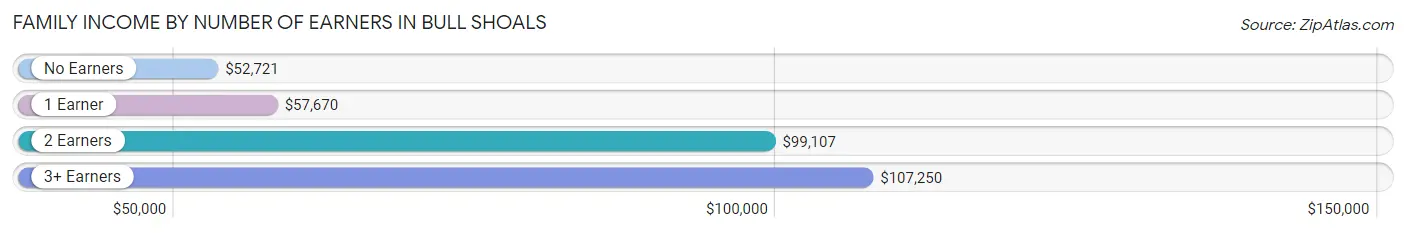
Family Income by Number of Earners in Bull Shoals
The median family income in Bull Shoals is $58,304, with families comprising 3+ earners (27) having the highest median family income of $107,250, while families with no earners (153) have the lowest median family income of $52,721, accounting for 6.6% and 37.1% of families, respectively.
| Number of Earners | # Families | Median Income |
| No Earners | 153 (37.1%) | $52,721 |
| 1 Earner | 145 (35.2%) | $57,670 |
| 2 Earners | 87 (21.1%) | $99,107 |
| 3+ Earners | 27 (6.6%) | $107,250 |
| Total | 412 (100.0%) | $58,304 |
Household Income in Bull Shoals
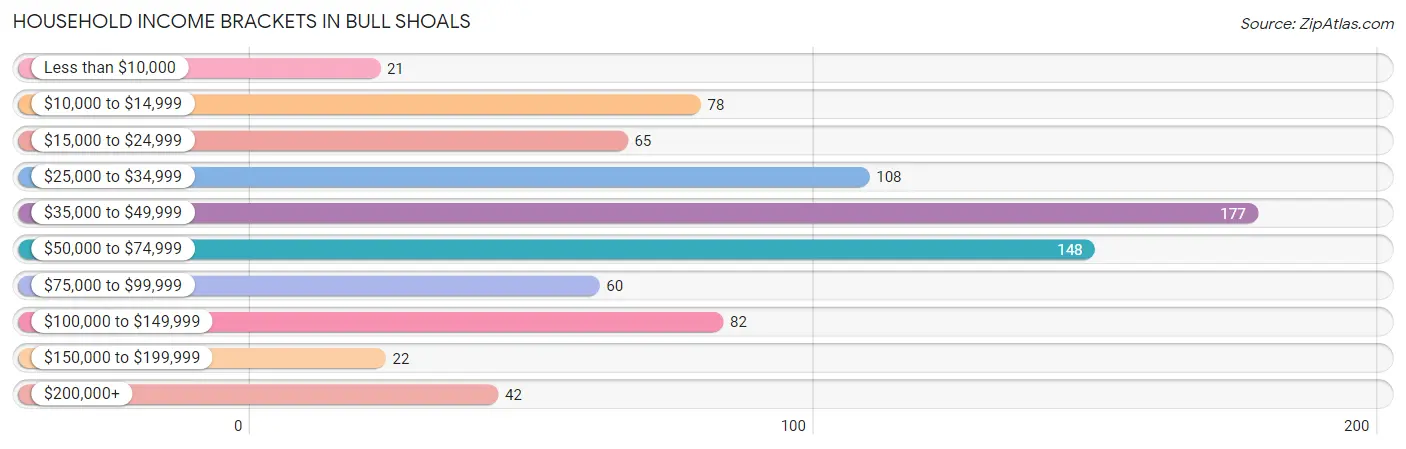
Household Income Brackets in Bull Shoals
With 177 households falling in the category, the $35,000 to $49,999 income range is the most frequent in Bull Shoals, accounting for 22.0% of all households. In contrast, only 21 households (2.6%) fall into the less than $10,000 income bracket, making it the least populous group.
| Income Bracket | # Households | % Households |
| Less than $10,000 | 21 | 2.6% |
| $10,000 to $14,999 | 78 | 9.7% |
| $15,000 to $24,999 | 65 | 8.1% |
| $25,000 to $34,999 | 108 | 13.4% |
| $35,000 to $49,999 | 177 | 22.0% |
| $50,000 to $74,999 | 148 | 18.4% |
| $75,000 to $99,999 | 60 | 7.5% |
| $100,000 to $149,999 | 82 | 10.2% |
| $150,000 to $199,999 | 22 | 2.7% |
| $200,000+ | 42 | 5.2% |
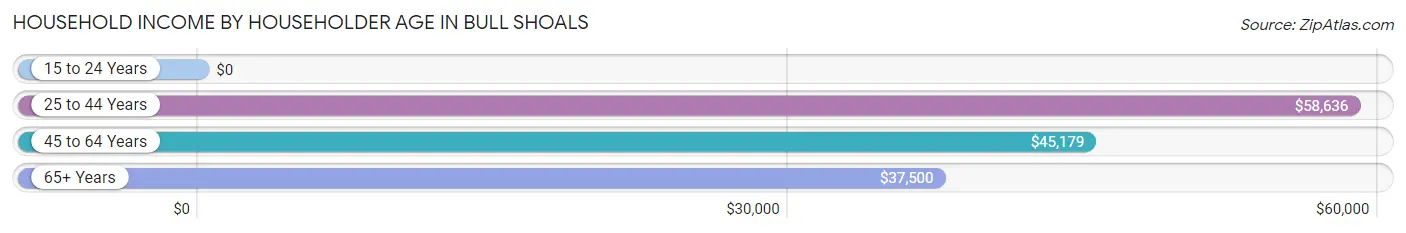
Household Income by Householder Age in Bull Shoals
The median household income in Bull Shoals is $45,144, with the highest median household income of $58,636 found in the 25 to 44 years age bracket for the primary householder. A total of 160 households (19.9%) fall into this category. Meanwhile, the 15 to 24 years age bracket for the primary householder has the lowest median household income of $0, with 13 households (1.6%) in this group.
| Income Bracket | # Households | Median Income |
| 15 to 24 Years | 13 (1.6%) | $0 |
| 25 to 44 Years | 160 (19.9%) | $58,636 |
| 45 to 64 Years | 214 (26.7%) | $45,179 |
| 65+ Years | 416 (51.8%) | $37,500 |
| Total | 803 (100.0%) | $45,144 |
Poverty in Bull Shoals
Income Below Poverty by Sex and Age in Bull Shoals
With 9.2% poverty level for males and 5.2% for females among the residents of Bull Shoals, 18 to 24 year old males and 65 to 74 year old females are the most vulnerable to poverty, with 5 males (38.5%) and 33 females (17.8%) in their respective age groups living below the poverty level.
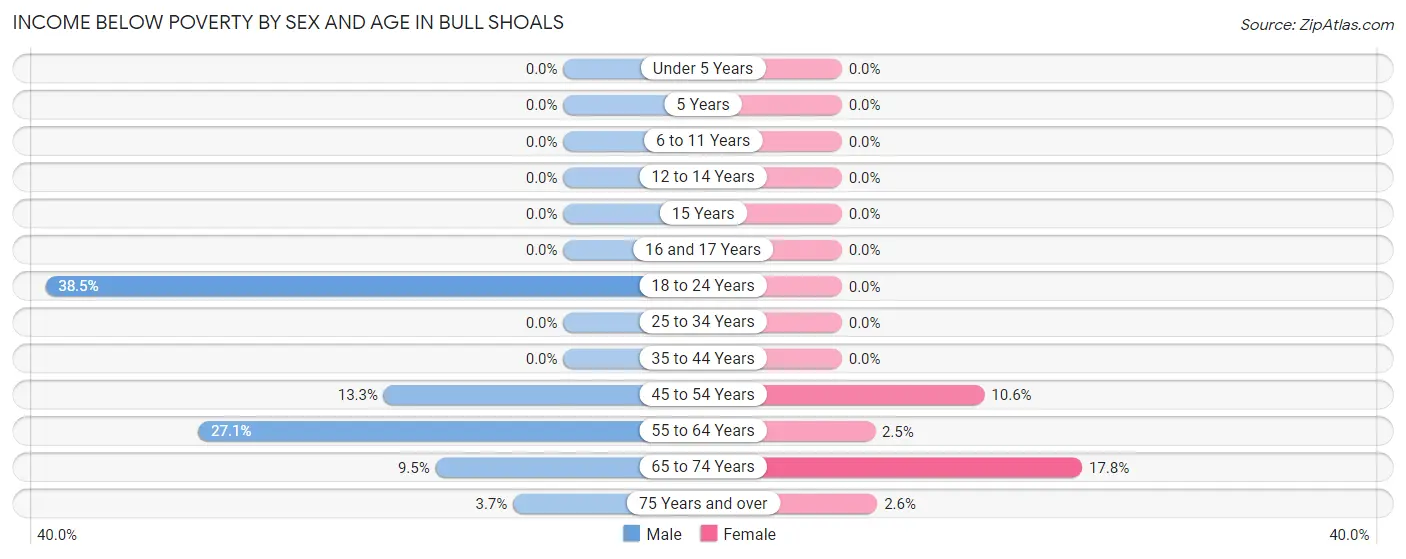
| Age Bracket | Male | Female |
| Under 5 Years | 0 (0.0%) | 0 (0.0%) |
| 5 Years | 0 (0.0%) | 0 (0.0%) |
| 6 to 11 Years | 0 (0.0%) | 0 (0.0%) |
| 12 to 14 Years | 0 (0.0%) | 0 (0.0%) |
| 15 Years | 0 (0.0%) | 0 (0.0%) |
| 16 and 17 Years | 0 (0.0%) | 0 (0.0%) |
| 18 to 24 Years | 5 (38.5%) | 0 (0.0%) |
| 25 to 34 Years | 0 (0.0%) | 0 (0.0%) |
| 35 to 44 Years | 0 (0.0%) | 0 (0.0%) |
| 45 to 54 Years | 6 (13.3%) | 9 (10.6%) |
| 55 to 64 Years | 45 (27.1%) | 3 (2.5%) |
| 65 to 74 Years | 15 (9.5%) | 33 (17.8%) |
| 75 Years and over | 5 (3.7%) | 5 (2.6%) |
| Total | 76 (9.2%) | 50 (5.2%) |
Income Above Poverty by Sex and Age in Bull Shoals
According to the poverty statistics in Bull Shoals, males aged under 5 years and females aged under 5 years are the age groups that are most secure financially, with 100.0% of males and 100.0% of females in these age groups living above the poverty line.
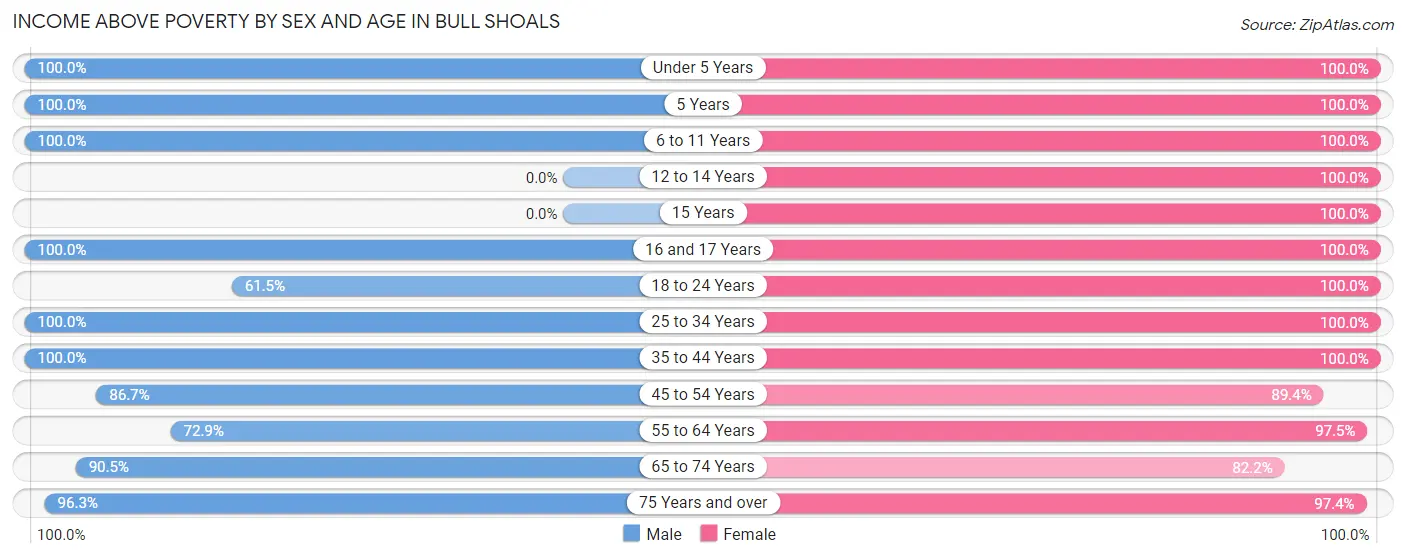
| Age Bracket | Male | Female |
| Under 5 Years | 53 (100.0%) | 35 (100.0%) |
| 5 Years | 12 (100.0%) | 28 (100.0%) |
| 6 to 11 Years | 53 (100.0%) | 56 (100.0%) |
| 12 to 14 Years | 0 (0.0%) | 24 (100.0%) |
| 15 Years | 0 (0.0%) | 14 (100.0%) |
| 16 and 17 Years | 7 (100.0%) | 10 (100.0%) |
| 18 to 24 Years | 8 (61.5%) | 28 (100.0%) |
| 25 to 34 Years | 102 (100.0%) | 90 (100.0%) |
| 35 to 44 Years | 79 (100.0%) | 98 (100.0%) |
| 45 to 54 Years | 39 (86.7%) | 76 (89.4%) |
| 55 to 64 Years | 121 (72.9%) | 119 (97.5%) |
| 65 to 74 Years | 143 (90.5%) | 152 (82.2%) |
| 75 Years and over | 129 (96.3%) | 185 (97.4%) |
| Total | 746 (90.7%) | 915 (94.8%) |
Income Below Poverty Among Married-Couple Families in Bull Shoals
The poverty statistics for married-couple families in Bull Shoals show that 1.7% or 6 of the total 361 families live below the poverty line. Families with no children have the highest poverty rate of 2.3%, comprising of 6 families. On the other hand, families with 1 or 2 children have the lowest poverty rate of 0.0%, which includes 0 families.
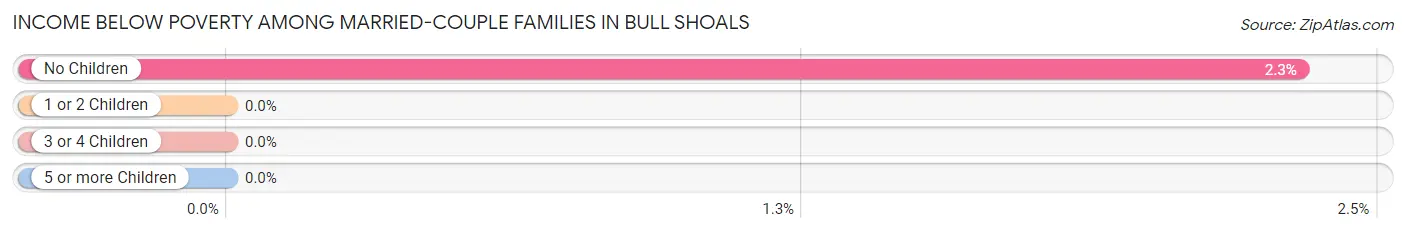
| Children | Above Poverty | Below Poverty |
| No Children | 252 (97.7%) | 6 (2.3%) |
| 1 or 2 Children | 67 (100.0%) | 0 (0.0%) |
| 3 or 4 Children | 36 (100.0%) | 0 (0.0%) |
| 5 or more Children | 0 (0.0%) | 0 (0.0%) |
| Total | 355 (98.3%) | 6 (1.7%) |
Income Below Poverty Among Single-Parent Households in Bull Shoals
| Children | Single Father | Single Mother |
| No Children | 0 (0.0%) | 0 (0.0%) |
| 1 or 2 Children | 0 (0.0%) | 0 (0.0%) |
| 3 or 4 Children | 0 (0.0%) | 0 (0.0%) |
| 5 or more Children | 0 (0.0%) | 0 (0.0%) |
| Total | 0 (0.0%) | 0 (0.0%) |
Income Below Poverty Among Married-Couple vs Single-Parent Households in Bull Shoals
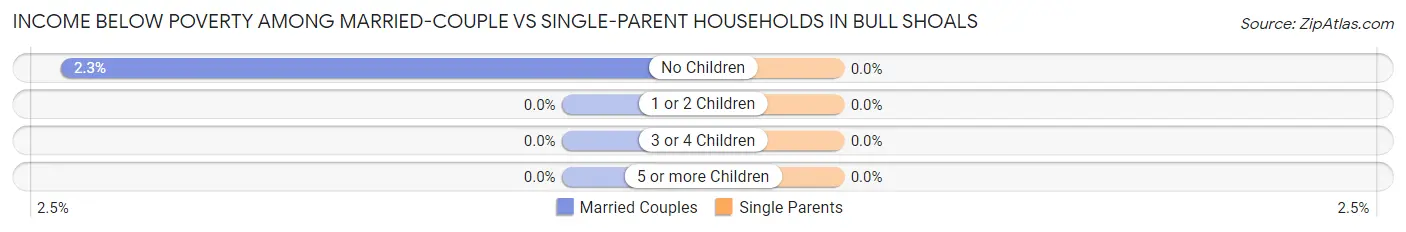
| Children | Married-Couple Families | Single-Parent Households |
| No Children | 6 (2.3%) | 0 (0.0%) |
| 1 or 2 Children | 0 (0.0%) | 0 (0.0%) |
| 3 or 4 Children | 0 (0.0%) | 0 (0.0%) |
| 5 or more Children | 0 (0.0%) | 0 (0.0%) |
| Total | 6 (1.7%) | 0 (0.0%) |
Race in Bull Shoals
The most populous races in Bull Shoals are White / Caucasian (1,669 | 93.2%), Hispanic or Latino (95 | 5.3%), and Asian (53 | 3.0%).
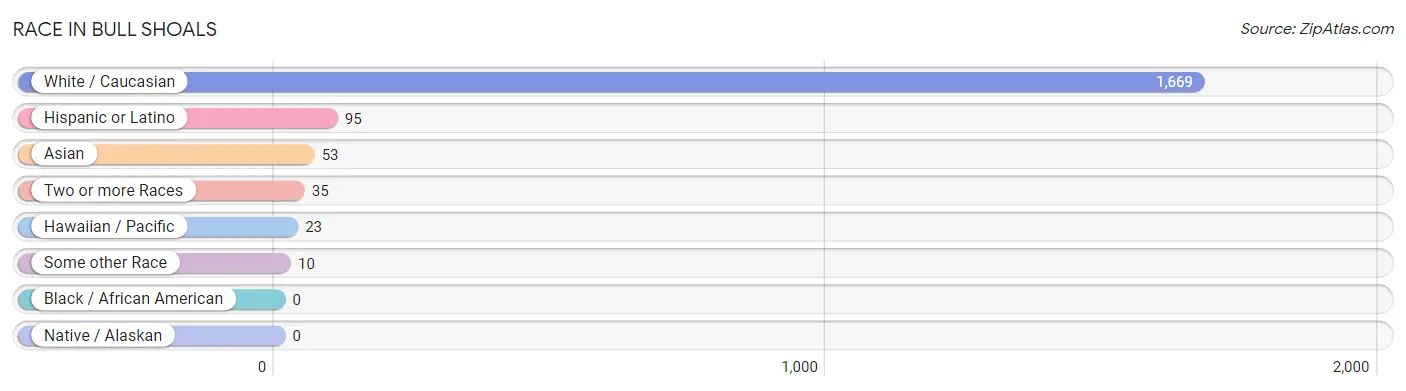
| Race | # Population | % Population |
| Asian | 53 | 3.0% |
| Black / African American | 0 | 0.0% |
| Hawaiian / Pacific | 23 | 1.3% |
| Hispanic or Latino | 95 | 5.3% |
| Native / Alaskan | 0 | 0.0% |
| White / Caucasian | 1,669 | 93.2% |
| Two or more Races | 35 | 2.0% |
| Some other Race | 10 | 0.6% |
| Total | 1,790 | 100.0% |
Ancestry in Bull Shoals
The most populous ancestries reported in Bull Shoals are German (389 | 21.7%), English (326 | 18.2%), Irish (326 | 18.2%), American (159 | 8.9%), and Slovene (85 | 4.8%), together accounting for 71.8% of all Bull Shoals residents.
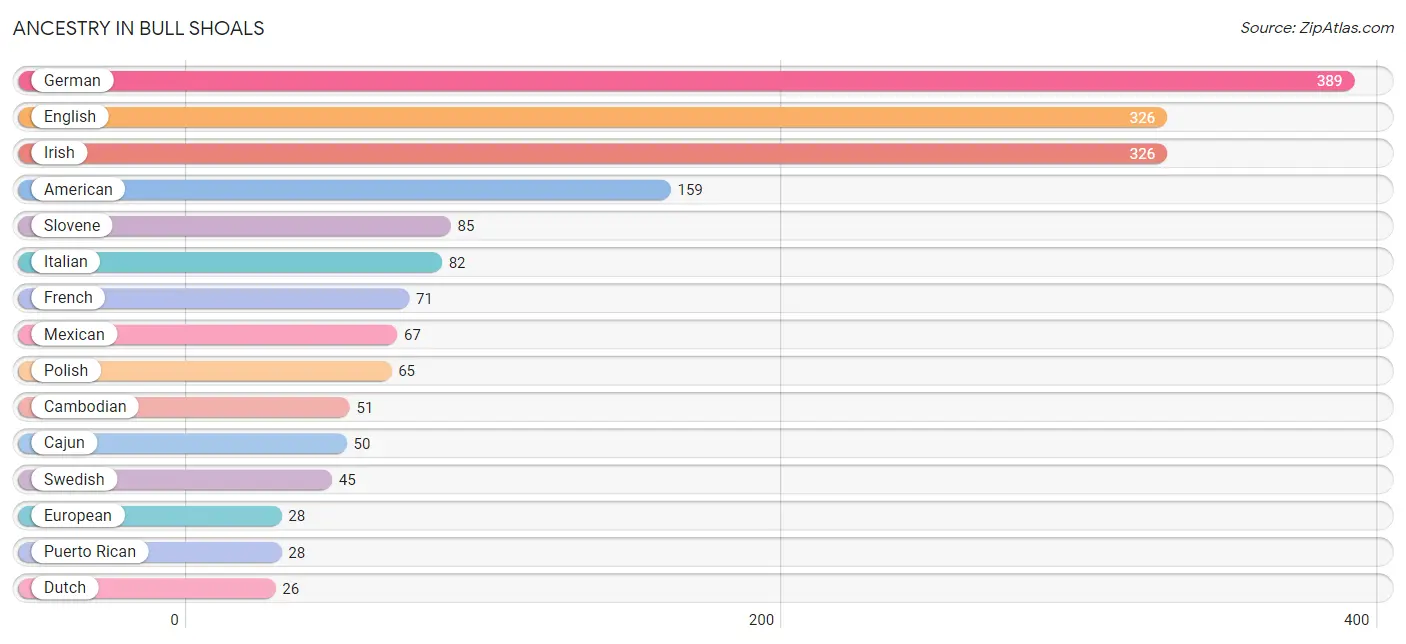
| Ancestry | # Population | % Population |
| American | 159 | 8.9% |
| Armenian | 4 | 0.2% |
| British | 12 | 0.7% |
| Cajun | 50 | 2.8% |
| Cambodian | 51 | 2.9% |
| Cherokee | 2 | 0.1% |
| Croatian | 15 | 0.8% |
| Danish | 5 | 0.3% |
| Dutch | 26 | 1.5% |
| English | 326 | 18.2% |
| European | 28 | 1.6% |
| Fijian | 23 | 1.3% |
| French | 71 | 4.0% |
| French Canadian | 8 | 0.4% |
| German | 389 | 21.7% |
| Irish | 326 | 18.2% |
| Italian | 82 | 4.6% |
| Korean | 6 | 0.3% |
| Luxembourger | 6 | 0.3% |
| Mexican | 67 | 3.7% |
| Norwegian | 10 | 0.6% |
| Polish | 65 | 3.6% |
| Puerto Rican | 28 | 1.6% |
| Russian | 11 | 0.6% |
| Scandinavian | 21 | 1.2% |
| Scotch-Irish | 16 | 0.9% |
| Scottish | 23 | 1.3% |
| Sioux | 12 | 0.7% |
| Slovene | 85 | 4.8% |
| Swedish | 45 | 2.5% |
| Swiss | 5 | 0.3% |
| Ukrainian | 5 | 0.3% |
| Welsh | 5 | 0.3% | View All 33 Rows |
Immigrants in Bull Shoals
The most numerous immigrant groups reported in Bull Shoals came from Asia (33 | 1.8%), China (31 | 1.7%), Eastern Asia (31 | 1.7%), Europe (23 | 1.3%), and Germany (16 | 0.9%), together accounting for 7.5% of all Bull Shoals residents.
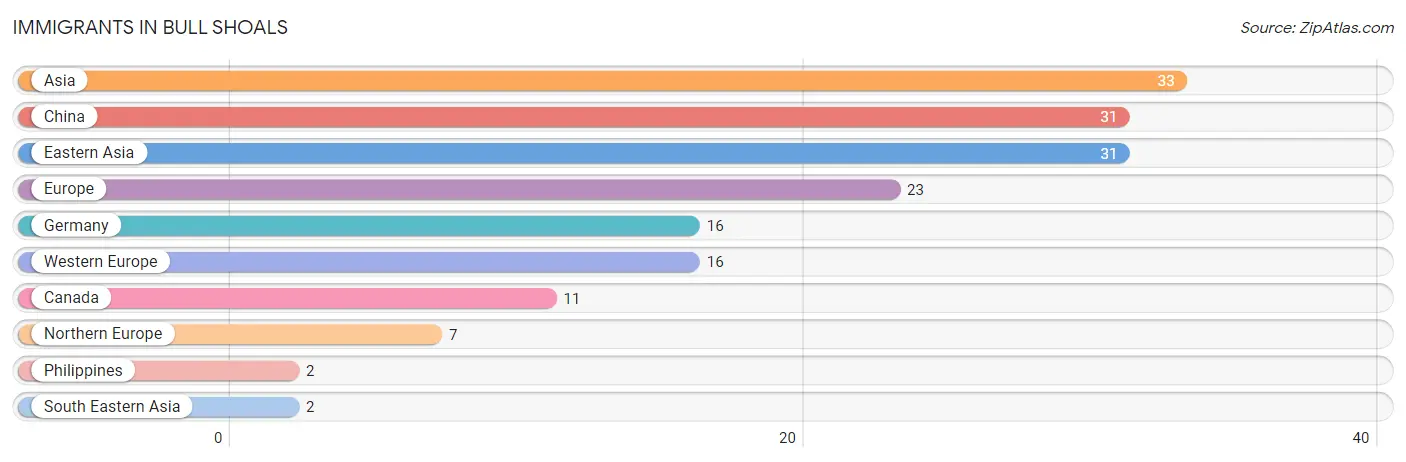
| Immigration Origin | # Population | % Population |
| Asia | 33 | 1.8% |
| Canada | 11 | 0.6% |
| China | 31 | 1.7% |
| Eastern Asia | 31 | 1.7% |
| Europe | 23 | 1.3% |
| Germany | 16 | 0.9% |
| Northern Europe | 7 | 0.4% |
| Philippines | 2 | 0.1% |
| South Eastern Asia | 2 | 0.1% |
| Western Europe | 16 | 0.9% | View All 10 Rows |
Sex and Age in Bull Shoals
Sex and Age in Bull Shoals
The most populous age groups in Bull Shoals are 60 to 64 Years (119 | 14.4%) for men and 70 to 74 Years (133 | 13.8%) for women.
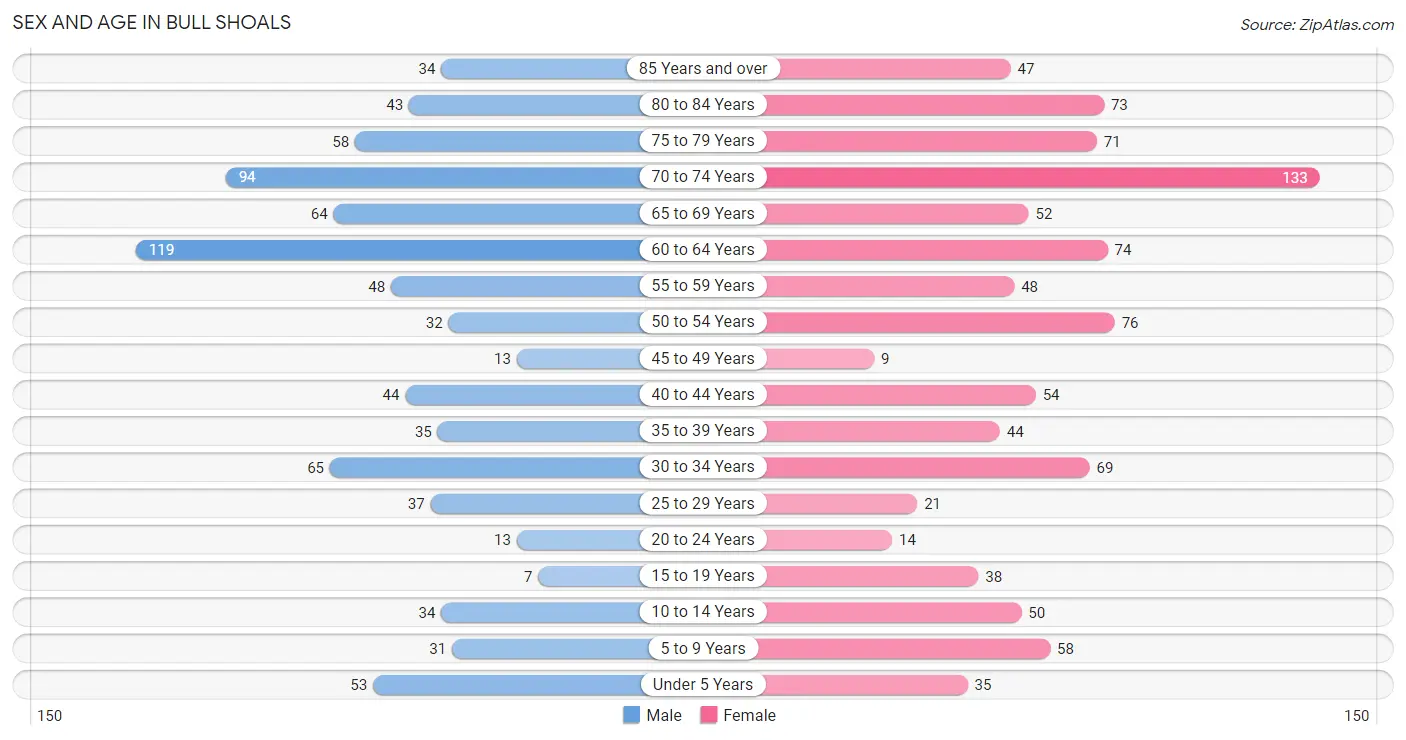
| Age Bracket | Male | Female |
| Under 5 Years | 53 (6.4%) | 35 (3.6%) |
| 5 to 9 Years | 31 (3.8%) | 58 (6.0%) |
| 10 to 14 Years | 34 (4.1%) | 50 (5.2%) |
| 15 to 19 Years | 7 (0.9%) | 38 (3.9%) |
| 20 to 24 Years | 13 (1.6%) | 14 (1.5%) |
| 25 to 29 Years | 37 (4.5%) | 21 (2.2%) |
| 30 to 34 Years | 65 (7.9%) | 69 (7.1%) |
| 35 to 39 Years | 35 (4.3%) | 44 (4.5%) |
| 40 to 44 Years | 44 (5.3%) | 54 (5.6%) |
| 45 to 49 Years | 13 (1.6%) | 9 (0.9%) |
| 50 to 54 Years | 32 (3.9%) | 76 (7.9%) |
| 55 to 59 Years | 48 (5.8%) | 48 (5.0%) |
| 60 to 64 Years | 119 (14.4%) | 74 (7.7%) |
| 65 to 69 Years | 64 (7.8%) | 52 (5.4%) |
| 70 to 74 Years | 94 (11.4%) | 133 (13.8%) |
| 75 to 79 Years | 58 (7.0%) | 71 (7.3%) |
| 80 to 84 Years | 43 (5.2%) | 73 (7.6%) |
| 85 Years and over | 34 (4.1%) | 47 (4.9%) |
| Total | 824 (100.0%) | 966 (100.0%) |
Families and Households in Bull Shoals
Median Family Size in Bull Shoals
The median family size in Bull Shoals is 3.16 persons per family, with single male/father families (9 | 2.2%) accounting for the largest median family size of 4.11 persons per family. On the other hand, single female/mother families (42 | 10.2%) represent the smallest median family size with 2.86 persons per family.
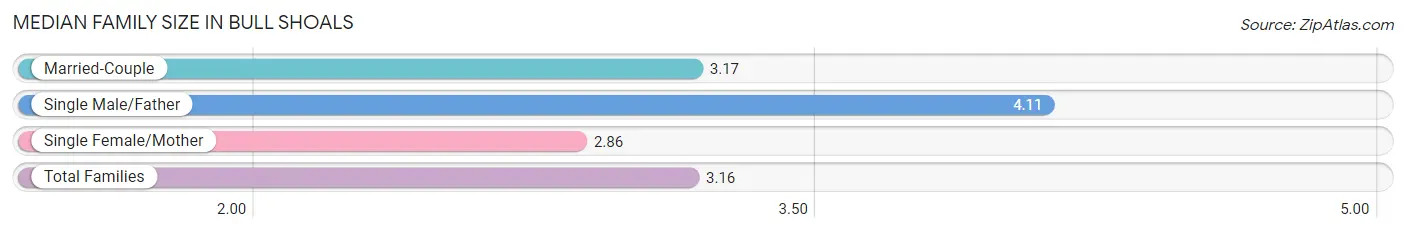
| Family Type | # Families | Family Size |
| Married-Couple | 361 (87.6%) | 3.17 |
| Single Male/Father | 9 (2.2%) | 4.11 |
| Single Female/Mother | 42 (10.2%) | 2.86 |
| Total Families | 412 (100.0%) | 3.16 |
Median Household Size in Bull Shoals
The median household size in Bull Shoals is 2.23 persons per household, with single male/father households (9 | 1.1%) accounting for the largest median household size of 4.11 persons per household. non-family households (391 | 48.7%) represent the smallest median household size with 1.24 persons per household.
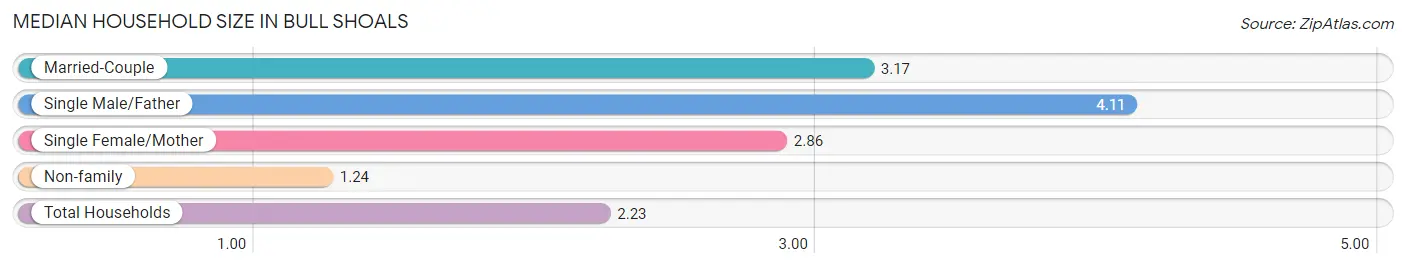
| Household Type | # Households | Household Size |
| Married-Couple | 361 (45.0%) | 3.17 |
| Single Male/Father | 9 (1.1%) | 4.11 |
| Single Female/Mother | 42 (5.2%) | 2.86 |
| Non-family | 391 (48.7%) | 1.24 |
| Total Households | 803 (100.0%) | 2.23 |
Household Size by Marriage Status in Bull Shoals
Out of a total of 803 households in Bull Shoals, 412 (51.3%) are family households, while 391 (48.7%) are nonfamily households. The most numerous type of family households are 2-person households, comprising 243, and the most common type of nonfamily households are 1-person households, comprising 331.
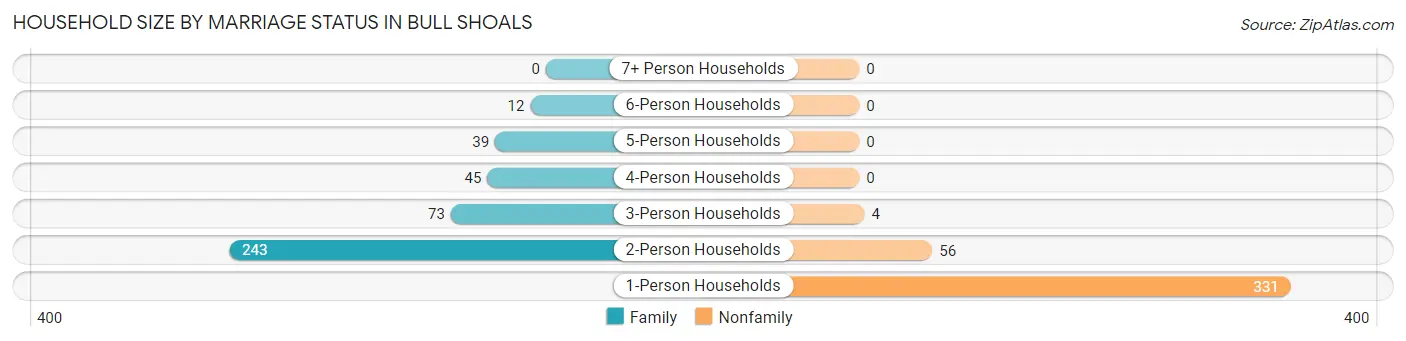
| Household Size | Family Households | Nonfamily Households |
| 1-Person Households | - | 331 (41.2%) |
| 2-Person Households | 243 (30.3%) | 56 (7.0%) |
| 3-Person Households | 73 (9.1%) | 4 (0.5%) |
| 4-Person Households | 45 (5.6%) | 0 (0.0%) |
| 5-Person Households | 39 (4.9%) | 0 (0.0%) |
| 6-Person Households | 12 (1.5%) | 0 (0.0%) |
| 7+ Person Households | 0 (0.0%) | 0 (0.0%) |
| Total | 412 (51.3%) | 391 (48.7%) |
Female Fertility in Bull Shoals
Fertility by Age in Bull Shoals
Average fertility rate in Bull Shoals is 74.0 births per 1,000 women. Women in the age bracket of 20 to 34 years have the highest fertility rate with 202.0 births per 1,000 women. Women in the age bracket of 20 to 34 years acount for 100.0% of all women with births.
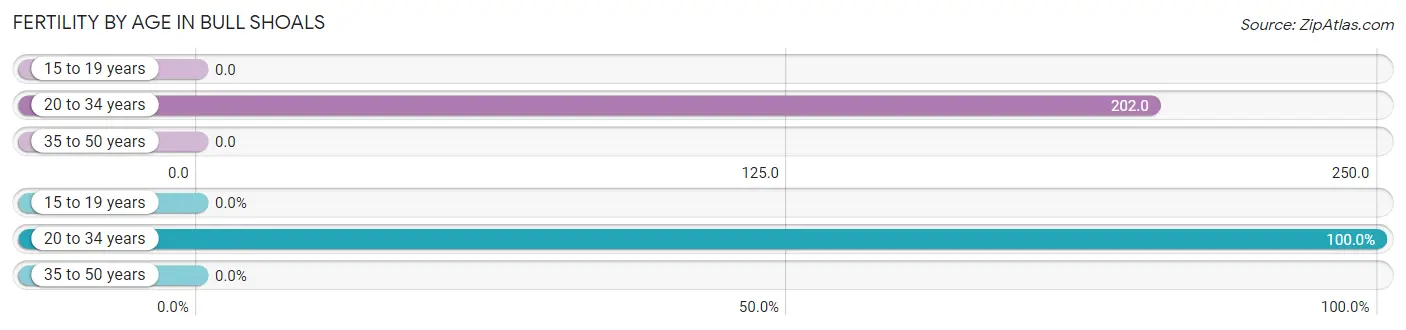
| Age Bracket | Women with Births | Births / 1,000 Women |
| 15 to 19 years | 0 (0.0%) | 0.0 |
| 20 to 34 years | 21 (100.0%) | 202.0 |
| 35 to 50 years | 0 (0.0%) | 0.0 |
| Total | 21 (100.0%) | 74.0 |
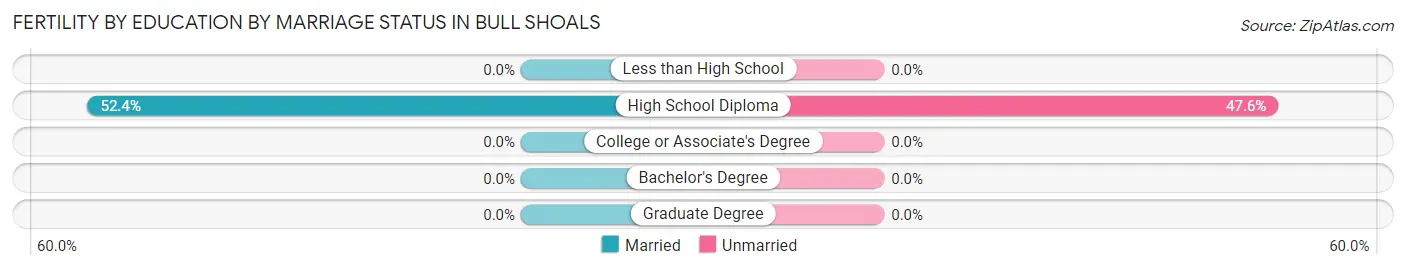
Fertility by Age by Marriage Status in Bull Shoals
52.4% of women with births (21) in Bull Shoals are married. The highest percentage of unmarried women with births falls into 20 to 34 years age bracket with 47.6% of them unmarried at the time of birth, while the lowest percentage of unmarried women with births belong to 20 to 34 years age bracket with 47.6% of them unmarried.
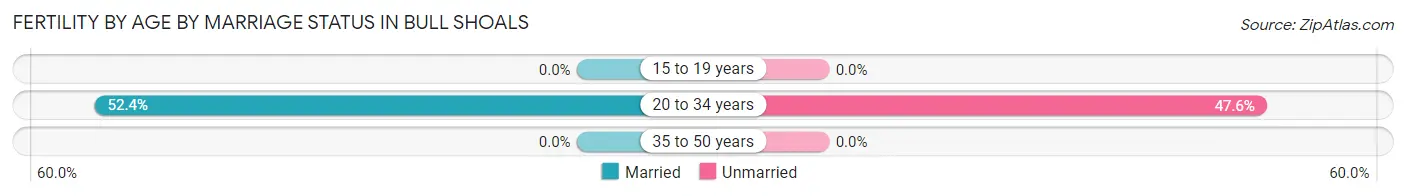
| Age Bracket | Married | Unmarried |
| 15 to 19 years | 0 (0.0%) | 0 (0.0%) |
| 20 to 34 years | 11 (52.4%) | 10 (47.6%) |
| 35 to 50 years | 0 (0.0%) | 0 (0.0%) |
| Total | 11 (52.4%) | 10 (47.6%) |
Fertility by Education in Bull Shoals
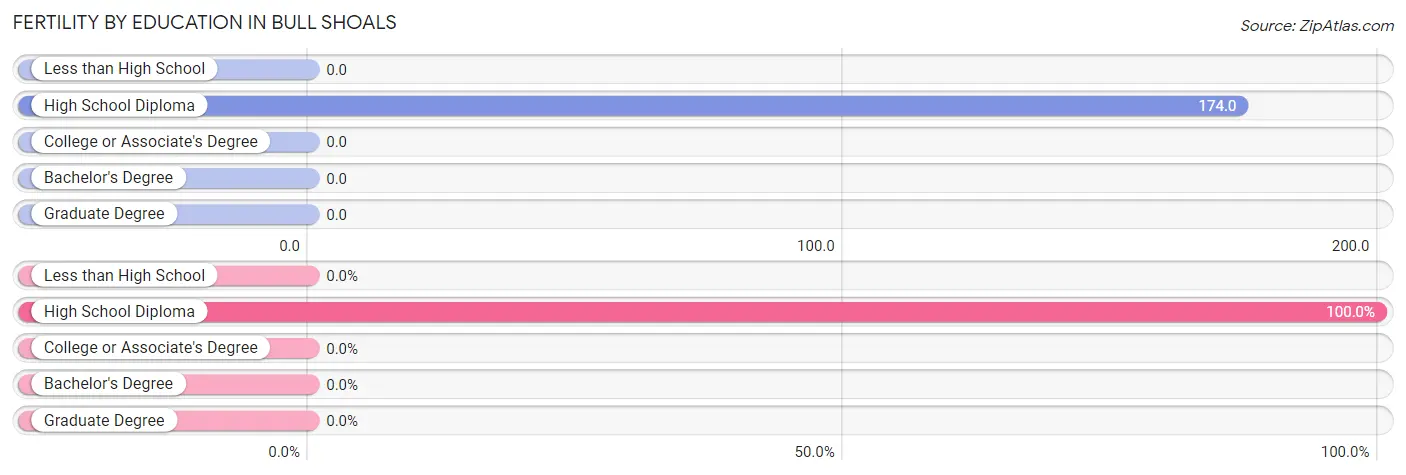
| Educational Attainment | Women with Births | Births / 1,000 Women |
| Less than High School | 0 (0.0%) | 0.0 |
| High School Diploma | 21 (100.0%) | 174.0 |
| College or Associate's Degree | 0 (0.0%) | 0.0 |
| Bachelor's Degree | 0 (0.0%) | 0.0 |
| Graduate Degree | 0 (0.0%) | 0.0 |
| Total | 21 (100.0%) | 74.0 |
Fertility by Education by Marriage Status in Bull Shoals
47.6% of women with births in Bull Shoals are unmarried. Women with the educational attainment of high school diploma are most likely to be married with 52.4% of them married at childbirth, while women with the educational attainment of high school diploma are least likely to be married with 47.6% of them unmarried at childbirth.
| Educational Attainment | Married | Unmarried |
| Less than High School | 0 (0.0%) | 0 (0.0%) |
| High School Diploma | 11 (52.4%) | 10 (47.6%) |
| College or Associate's Degree | 0 (0.0%) | 0 (0.0%) |
| Bachelor's Degree | 0 (0.0%) | 0 (0.0%) |
| Graduate Degree | 0 (0.0%) | 0 (0.0%) |
| Total | 11 (52.4%) | 10 (47.6%) |
Employment Characteristics in Bull Shoals
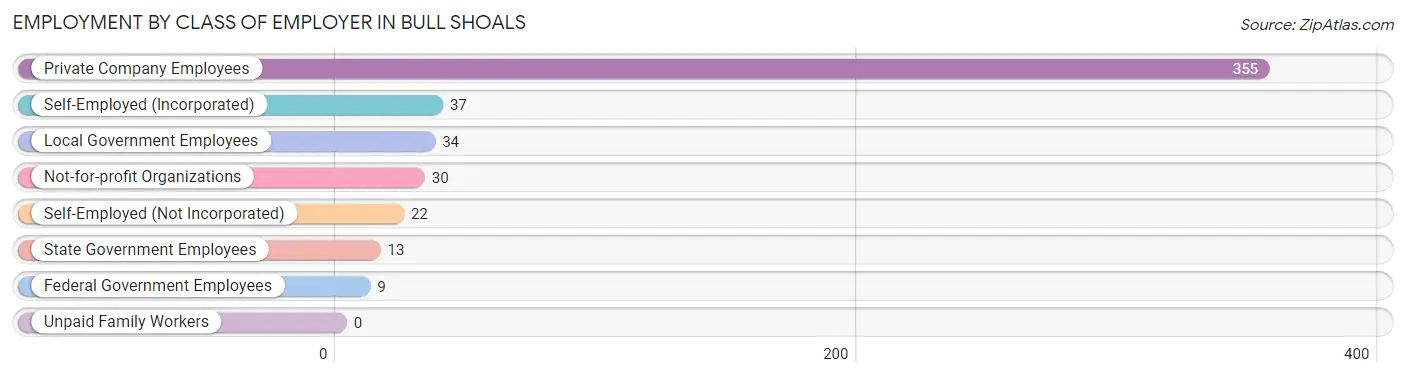
Employment by Class of Employer in Bull Shoals
Among the 500 employed individuals in Bull Shoals, private company employees (355 | 71.0%), self-employed (incorporated) (37 | 7.4%), and local government employees (34 | 6.8%) make up the most common classes of employment.
| Employer Class | # Employees | % Employees |
| Private Company Employees | 355 | 71.0% |
| Self-Employed (Incorporated) | 37 | 7.4% |
| Self-Employed (Not Incorporated) | 22 | 4.4% |
| Not-for-profit Organizations | 30 | 6.0% |
| Local Government Employees | 34 | 6.8% |
| State Government Employees | 13 | 2.6% |
| Federal Government Employees | 9 | 1.8% |
| Unpaid Family Workers | 0 | 0.0% |
| Total | 500 | 100.0% |
Employment Status by Age in Bull Shoals
According to the labor force statistics for Bull Shoals, out of the total population over 16 years of age (1,515), 41.4% or 627 individuals are in the labor force, with 11.0% or 69 of them unemployed. The age group with the highest labor force participation rate is 25 to 29 years, with 100.0% or 58 individuals in the labor force. Within the labor force, the 65 to 74 years age range has the highest percentage of unemployed individuals, with 56.5% or 13 of them being unemployed.
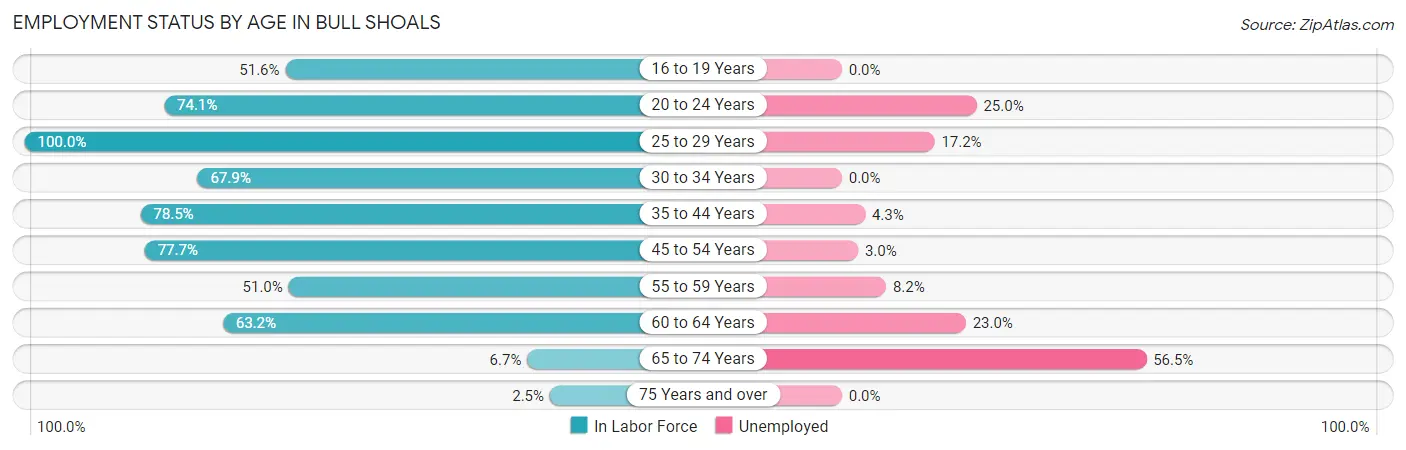
| Age Bracket | In Labor Force | Unemployed |
| 16 to 19 Years | 16 (51.6%) | 0 (0.0%) |
| 20 to 24 Years | 20 (74.1%) | 5 (25.0%) |
| 25 to 29 Years | 58 (100.0%) | 10 (17.2%) |
| 30 to 34 Years | 91 (67.9%) | 0 (0.0%) |
| 35 to 44 Years | 139 (78.5%) | 6 (4.3%) |
| 45 to 54 Years | 101 (77.7%) | 3 (3.0%) |
| 55 to 59 Years | 49 (51.0%) | 4 (8.2%) |
| 60 to 64 Years | 122 (63.2%) | 28 (23.0%) |
| 65 to 74 Years | 23 (6.7%) | 13 (56.5%) |
| 75 Years and over | 8 (2.5%) | 0 (0.0%) |
| Total | 627 (41.4%) | 69 (11.0%) |
Employment Status by Educational Attainment in Bull Shoals
According to labor force statistics for Bull Shoals, 71.1% of individuals (560) out of the total population between 25 and 64 years of age (788) are in the labor force, with 9.1% or 51 of them being unemployed. The group with the highest labor force participation rate are those with the educational attainment of bachelor's degree or higher, with 97.1% or 102 individuals in the labor force. Within the labor force, individuals with less than high school education have the highest percentage of unemployment, with 39.7% or 23 of them being unemployed.
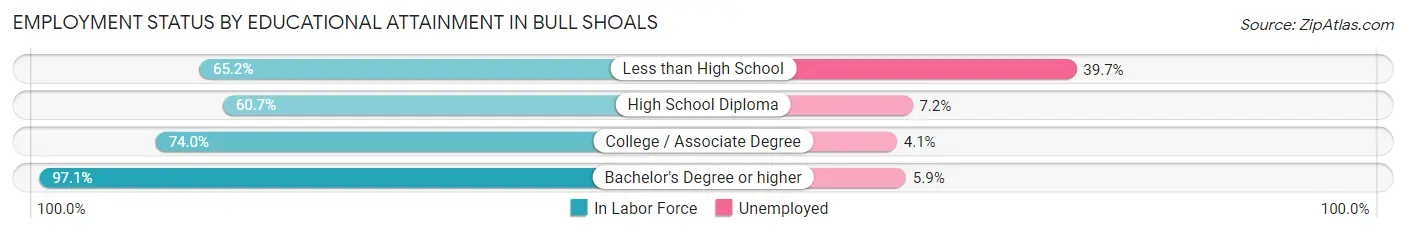
| Educational Attainment | In Labor Force | Unemployed |
| Less than High School | 58 (65.2%) | 35 (39.7%) |
| High School Diploma | 181 (60.7%) | 21 (7.2%) |
| College / Associate Degree | 219 (74.0%) | 12 (4.1%) |
| Bachelor's Degree or higher | 102 (97.1%) | 6 (5.9%) |
| Total | 560 (71.1%) | 72 (9.1%) |
Employment Occupations by Sex in Bull Shoals
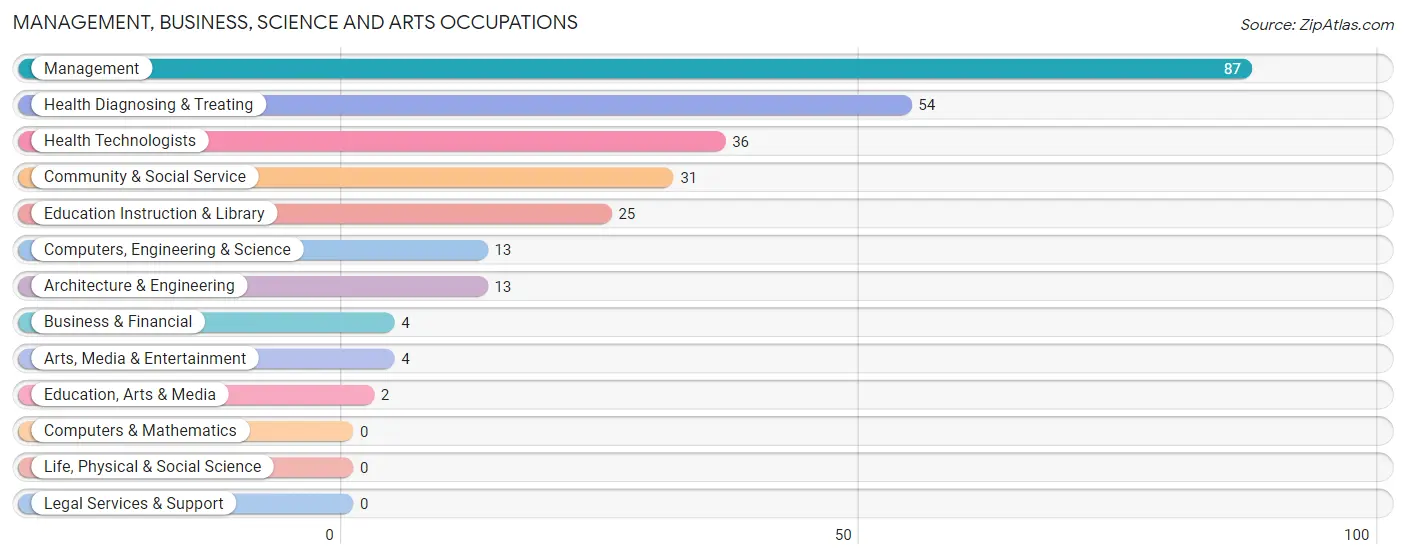
Management, Business, Science and Arts Occupations
The most common Management, Business, Science and Arts occupations in Bull Shoals are Management (87 | 15.6%), Health Diagnosing & Treating (54 | 9.7%), Health Technologists (36 | 6.5%), Community & Social Service (31 | 5.6%), and Education Instruction & Library (25 | 4.5%).
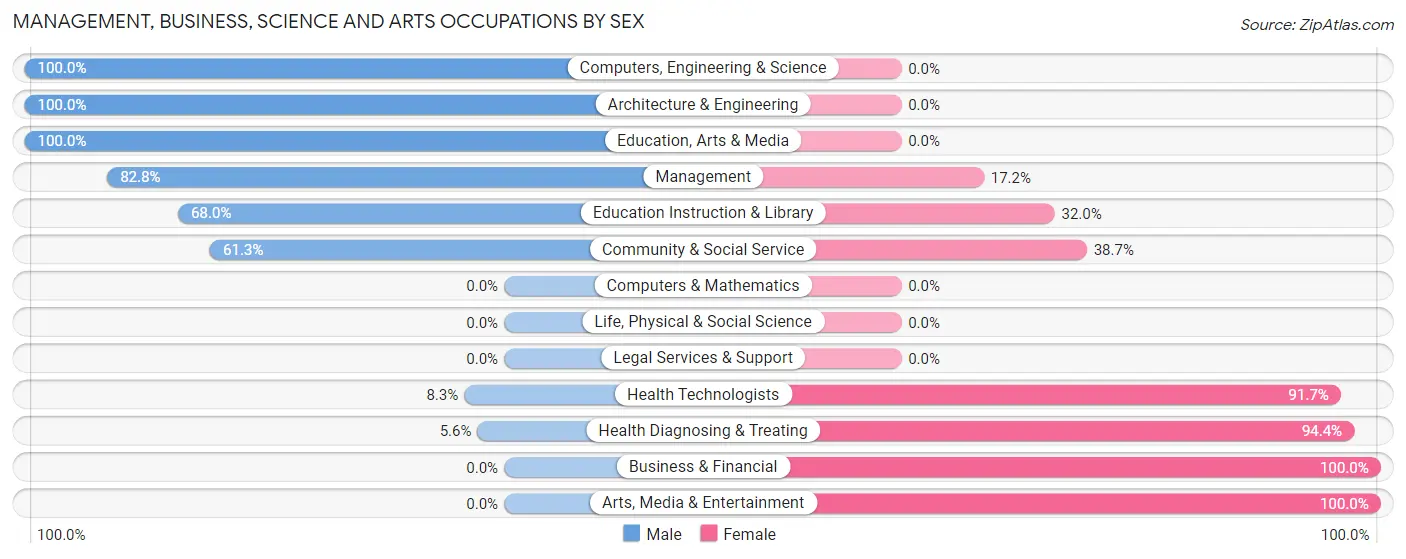
Management, Business, Science and Arts Occupations by Sex
Within the Management, Business, Science and Arts occupations in Bull Shoals, the most male-oriented occupations are Computers, Engineering & Science (100.0%), Architecture & Engineering (100.0%), and Education, Arts & Media (100.0%), while the most female-oriented occupations are Business & Financial (100.0%), Arts, Media & Entertainment (100.0%), and Health Diagnosing & Treating (94.4%).
| Occupation | Male | Female |
| Management | 72 (82.8%) | 15 (17.2%) |
| Business & Financial | 0 (0.0%) | 4 (100.0%) |
| Computers, Engineering & Science | 13 (100.0%) | 0 (0.0%) |
| Computers & Mathematics | 0 (0.0%) | 0 (0.0%) |
| Architecture & Engineering | 13 (100.0%) | 0 (0.0%) |
| Life, Physical & Social Science | 0 (0.0%) | 0 (0.0%) |
| Community & Social Service | 19 (61.3%) | 12 (38.7%) |
| Education, Arts & Media | 2 (100.0%) | 0 (0.0%) |
| Legal Services & Support | 0 (0.0%) | 0 (0.0%) |
| Education Instruction & Library | 17 (68.0%) | 8 (32.0%) |
| Arts, Media & Entertainment | 0 (0.0%) | 4 (100.0%) |
| Health Diagnosing & Treating | 3 (5.6%) | 51 (94.4%) |
| Health Technologists | 3 (8.3%) | 33 (91.7%) |
| Total (Category) | 107 (56.6%) | 82 (43.4%) |
| Total (Overall) | 279 (50.0%) | 279 (50.0%) |
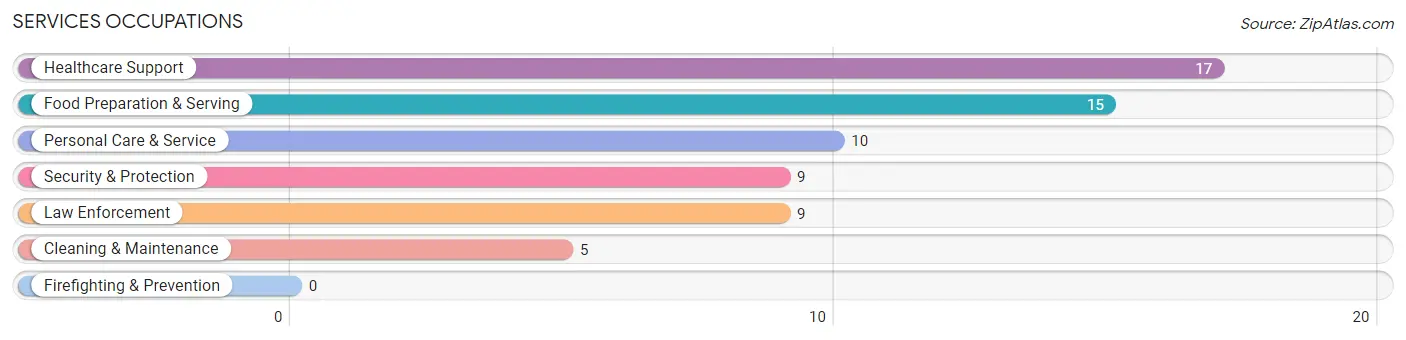
Services Occupations
The most common Services occupations in Bull Shoals are Healthcare Support (17 | 3.0%), Food Preparation & Serving (15 | 2.7%), Personal Care & Service (10 | 1.8%), Security & Protection (9 | 1.6%), and Law Enforcement (9 | 1.6%).
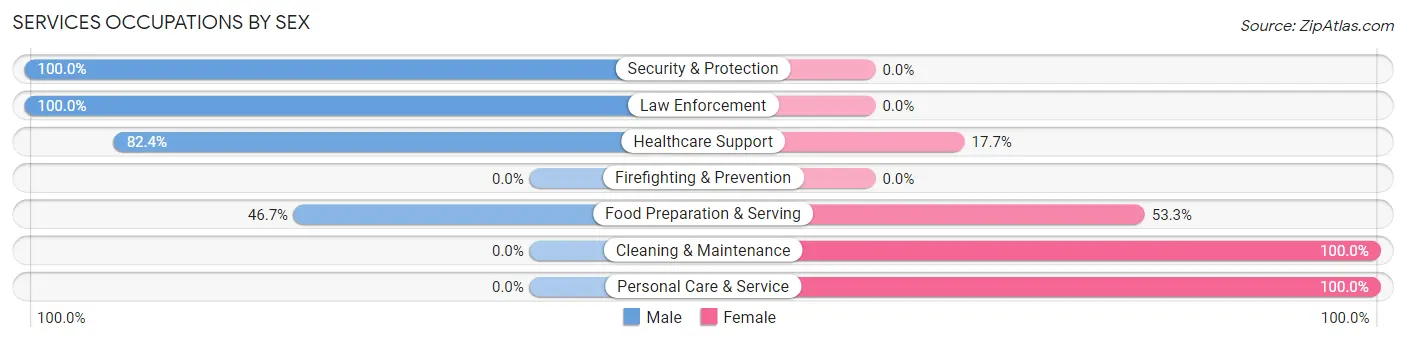
Services Occupations by Sex
Within the Services occupations in Bull Shoals, the most male-oriented occupations are Security & Protection (100.0%), Law Enforcement (100.0%), and Healthcare Support (82.4%), while the most female-oriented occupations are Cleaning & Maintenance (100.0%), Personal Care & Service (100.0%), and Food Preparation & Serving (53.3%).
| Occupation | Male | Female |
| Healthcare Support | 14 (82.4%) | 3 (17.6%) |
| Security & Protection | 9 (100.0%) | 0 (0.0%) |
| Firefighting & Prevention | 0 (0.0%) | 0 (0.0%) |
| Law Enforcement | 9 (100.0%) | 0 (0.0%) |
| Food Preparation & Serving | 7 (46.7%) | 8 (53.3%) |
| Cleaning & Maintenance | 0 (0.0%) | 5 (100.0%) |
| Personal Care & Service | 0 (0.0%) | 10 (100.0%) |
| Total (Category) | 30 (53.6%) | 26 (46.4%) |
| Total (Overall) | 279 (50.0%) | 279 (50.0%) |
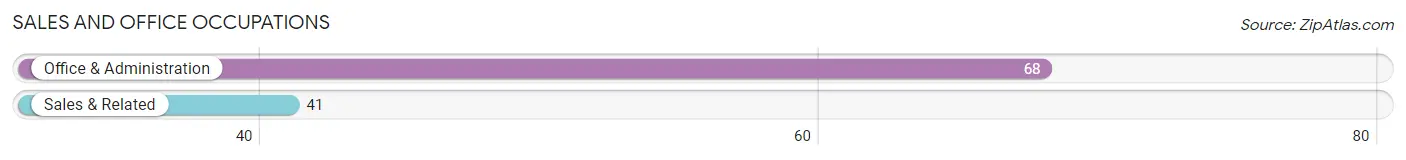
Sales and Office Occupations
The most common Sales and Office occupations in Bull Shoals are Office & Administration (68 | 12.2%), and Sales & Related (41 | 7.3%).
Sales and Office Occupations by Sex
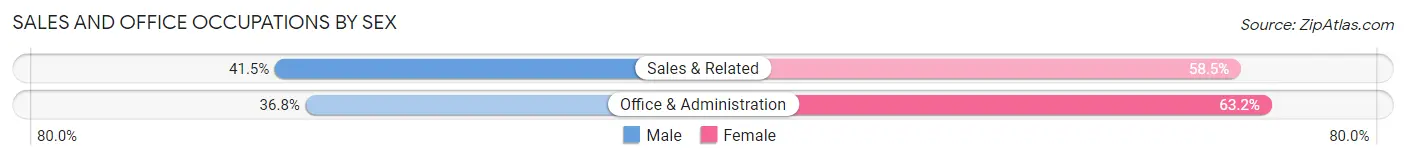
| Occupation | Male | Female |
| Sales & Related | 17 (41.5%) | 24 (58.5%) |
| Office & Administration | 25 (36.8%) | 43 (63.2%) |
| Total (Category) | 42 (38.5%) | 67 (61.5%) |
| Total (Overall) | 279 (50.0%) | 279 (50.0%) |
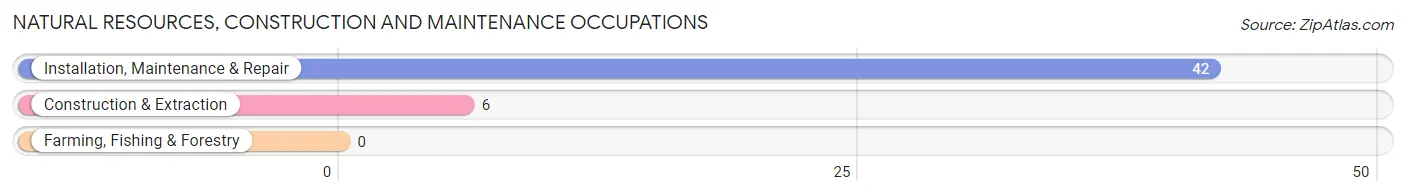
Natural Resources, Construction and Maintenance Occupations
The most common Natural Resources, Construction and Maintenance occupations in Bull Shoals are Installation, Maintenance & Repair (42 | 7.5%), and Construction & Extraction (6 | 1.1%).
Natural Resources, Construction and Maintenance Occupations by Sex
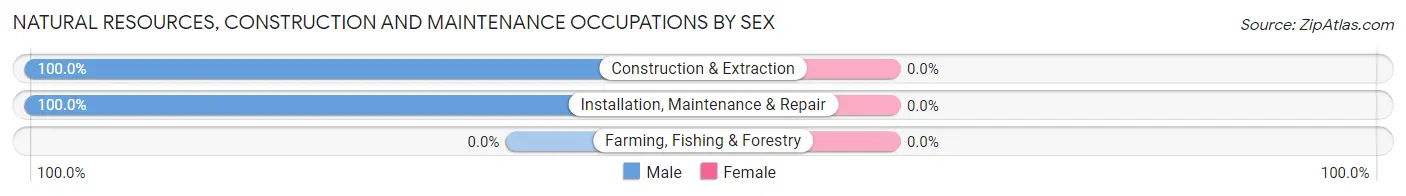
| Occupation | Male | Female |
| Farming, Fishing & Forestry | 0 (0.0%) | 0 (0.0%) |
| Construction & Extraction | 6 (100.0%) | 0 (0.0%) |
| Installation, Maintenance & Repair | 42 (100.0%) | 0 (0.0%) |
| Total (Category) | 48 (100.0%) | 0 (0.0%) |
| Total (Overall) | 279 (50.0%) | 279 (50.0%) |
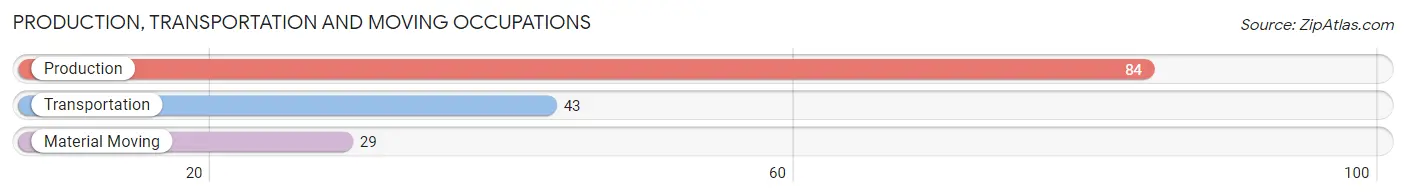
Production, Transportation and Moving Occupations
The most common Production, Transportation and Moving occupations in Bull Shoals are Production (84 | 15.0%), Transportation (43 | 7.7%), and Material Moving (29 | 5.2%).
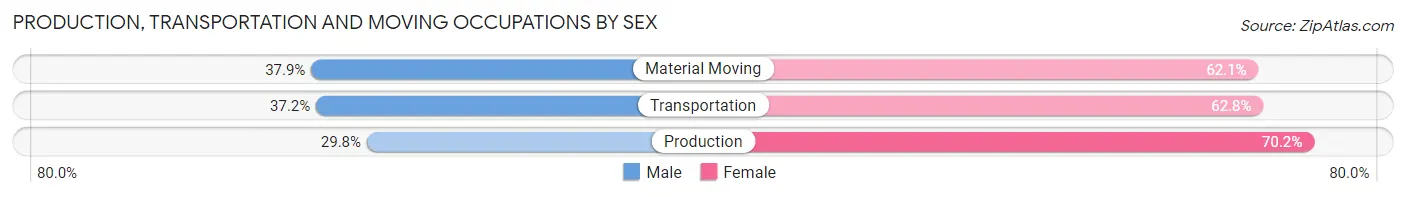
Production, Transportation and Moving Occupations by Sex
| Occupation | Male | Female |
| Production | 25 (29.8%) | 59 (70.2%) |
| Transportation | 16 (37.2%) | 27 (62.8%) |
| Material Moving | 11 (37.9%) | 18 (62.1%) |
| Total (Category) | 52 (33.3%) | 104 (66.7%) |
| Total (Overall) | 279 (50.0%) | 279 (50.0%) |
Employment Industries by Sex in Bull Shoals
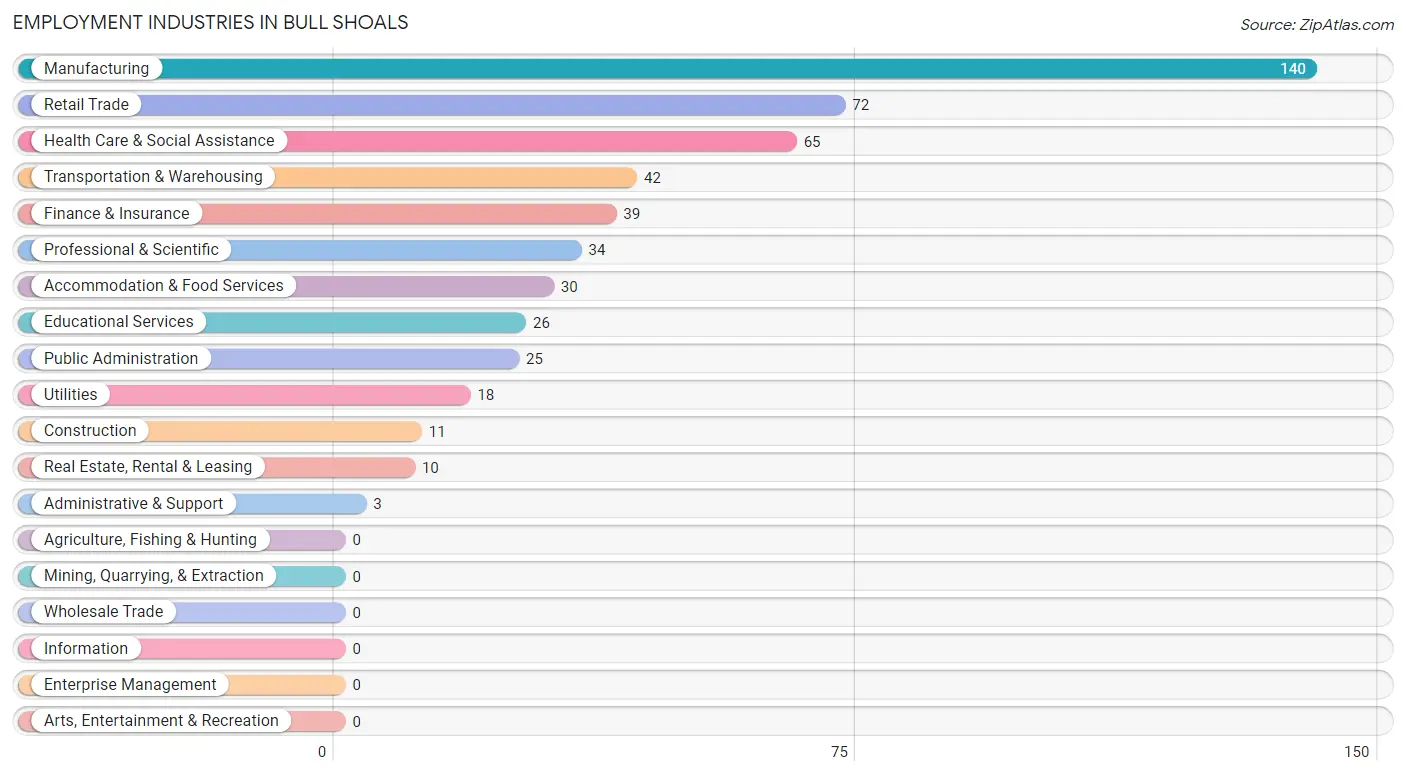
Employment Industries in Bull Shoals
The major employment industries in Bull Shoals include Manufacturing (140 | 25.1%), Retail Trade (72 | 12.9%), Health Care & Social Assistance (65 | 11.7%), Transportation & Warehousing (42 | 7.5%), and Finance & Insurance (39 | 7.0%).
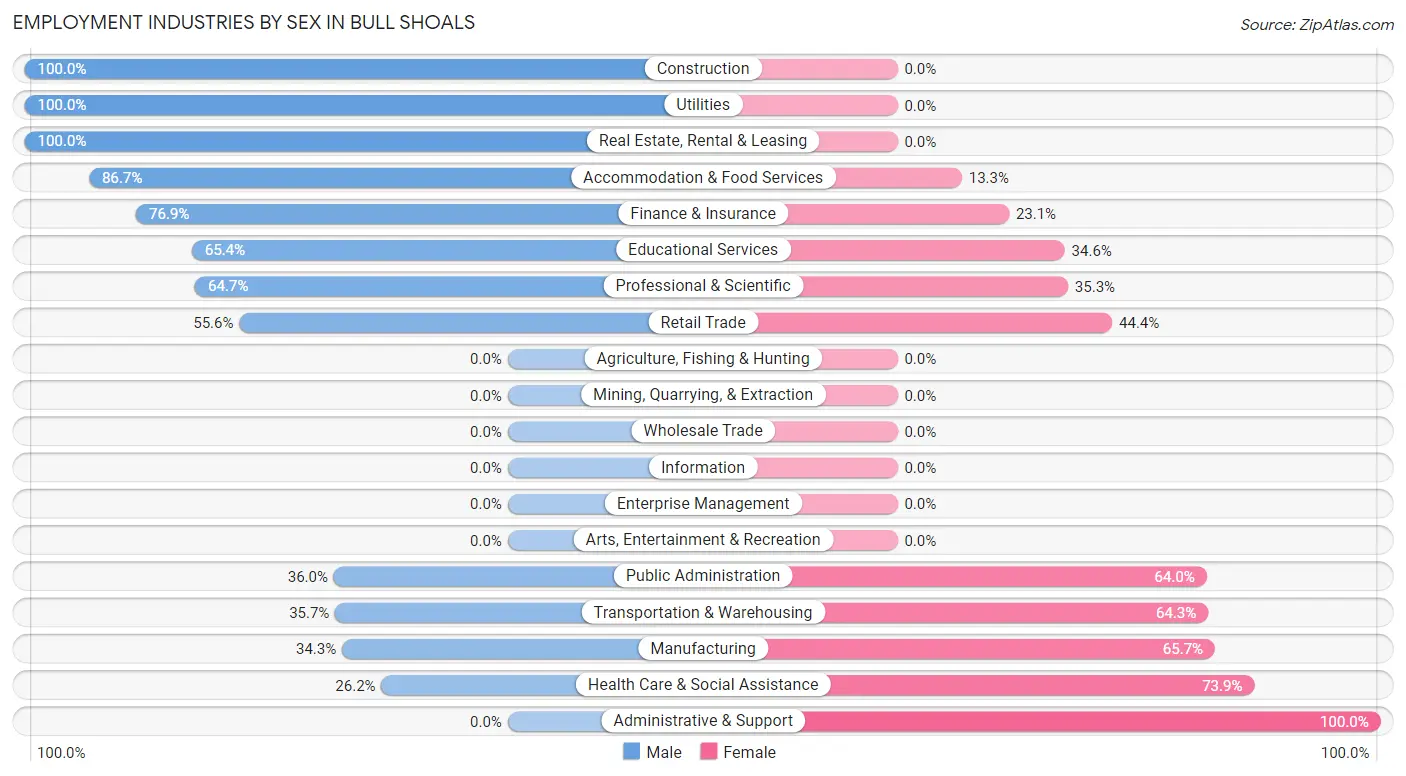
Employment Industries by Sex in Bull Shoals
The Bull Shoals industries that see more men than women are Construction (100.0%), Utilities (100.0%), and Real Estate, Rental & Leasing (100.0%), whereas the industries that tend to have a higher number of women are Administrative & Support (100.0%), Health Care & Social Assistance (73.9%), and Manufacturing (65.7%).
| Industry | Male | Female |
| Agriculture, Fishing & Hunting | 0 (0.0%) | 0 (0.0%) |
| Mining, Quarrying, & Extraction | 0 (0.0%) | 0 (0.0%) |
| Construction | 11 (100.0%) | 0 (0.0%) |
| Manufacturing | 48 (34.3%) | 92 (65.7%) |
| Wholesale Trade | 0 (0.0%) | 0 (0.0%) |
| Retail Trade | 40 (55.6%) | 32 (44.4%) |
| Transportation & Warehousing | 15 (35.7%) | 27 (64.3%) |
| Utilities | 18 (100.0%) | 0 (0.0%) |
| Information | 0 (0.0%) | 0 (0.0%) |
| Finance & Insurance | 30 (76.9%) | 9 (23.1%) |
| Real Estate, Rental & Leasing | 10 (100.0%) | 0 (0.0%) |
| Professional & Scientific | 22 (64.7%) | 12 (35.3%) |
| Enterprise Management | 0 (0.0%) | 0 (0.0%) |
| Administrative & Support | 0 (0.0%) | 3 (100.0%) |
| Educational Services | 17 (65.4%) | 9 (34.6%) |
| Health Care & Social Assistance | 17 (26.2%) | 48 (73.9%) |
| Arts, Entertainment & Recreation | 0 (0.0%) | 0 (0.0%) |
| Accommodation & Food Services | 26 (86.7%) | 4 (13.3%) |
| Public Administration | 9 (36.0%) | 16 (64.0%) |
| Total | 279 (50.0%) | 279 (50.0%) |
Education in Bull Shoals
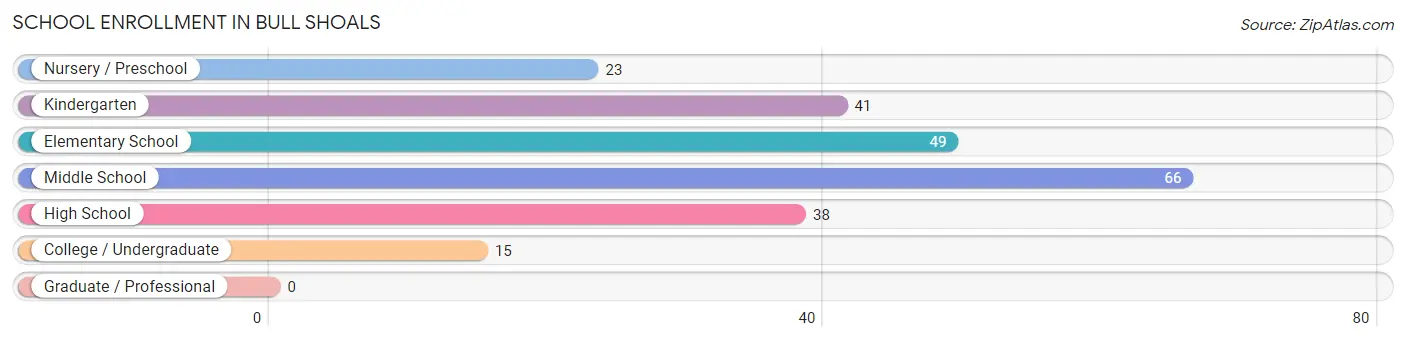
School Enrollment in Bull Shoals
The most common levels of schooling among the 232 students in Bull Shoals are middle school (66 | 28.4%), elementary school (49 | 21.1%), and kindergarten (41 | 17.7%).
| School Level | # Students | % Students |
| Nursery / Preschool | 23 | 9.9% |
| Kindergarten | 41 | 17.7% |
| Elementary School | 49 | 21.1% |
| Middle School | 66 | 28.4% |
| High School | 38 | 16.4% |
| College / Undergraduate | 15 | 6.5% |
| Graduate / Professional | 0 | 0.0% |
| Total | 232 | 100.0% |
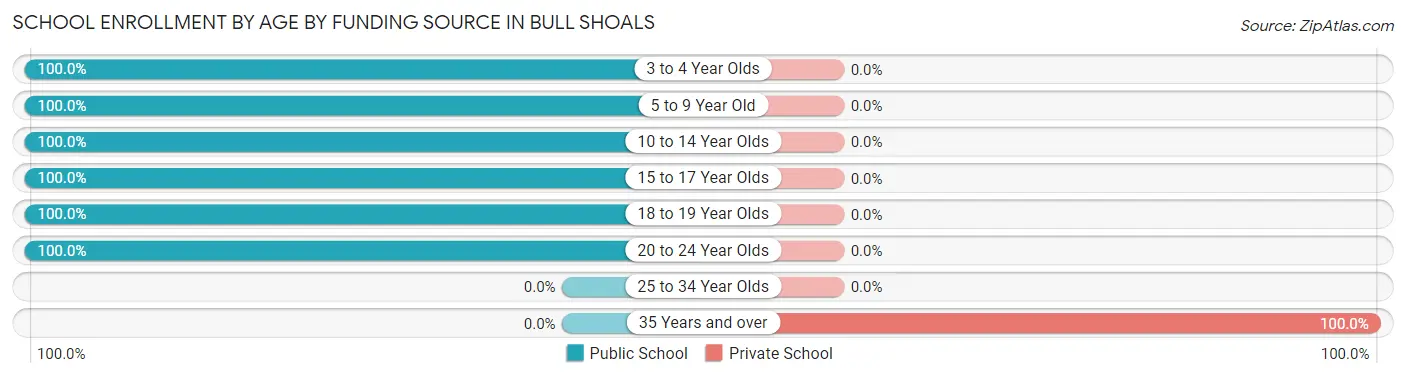
School Enrollment by Age by Funding Source in Bull Shoals
Out of a total of 232 students who are enrolled in schools in Bull Shoals, 7 (3.0%) attend a private institution, while the remaining 225 (97.0%) are enrolled in public schools. The age group of 35 years and over has the highest likelihood of being enrolled in private schools, with 7 (100.0% in the age bracket) enrolled. Conversely, the age group of 3 to 4 year olds has the lowest likelihood of being enrolled in a private school, with 23 (100.0% in the age bracket) attending a public institution.
| Age Bracket | Public School | Private School |
| 3 to 4 Year Olds | 23 (100.0%) | 0 (0.0%) |
| 5 to 9 Year Old | 77 (100.0%) | 0 (0.0%) |
| 10 to 14 Year Olds | 79 (100.0%) | 0 (0.0%) |
| 15 to 17 Year Olds | 31 (100.0%) | 0 (0.0%) |
| 18 to 19 Year Olds | 7 (100.0%) | 0 (0.0%) |
| 20 to 24 Year Olds | 8 (100.0%) | 0 (0.0%) |
| 25 to 34 Year Olds | 0 (0.0%) | 0 (0.0%) |
| 35 Years and over | 0 (0.0%) | 7 (100.0%) |
| Total | 225 (97.0%) | 7 (3.0%) |
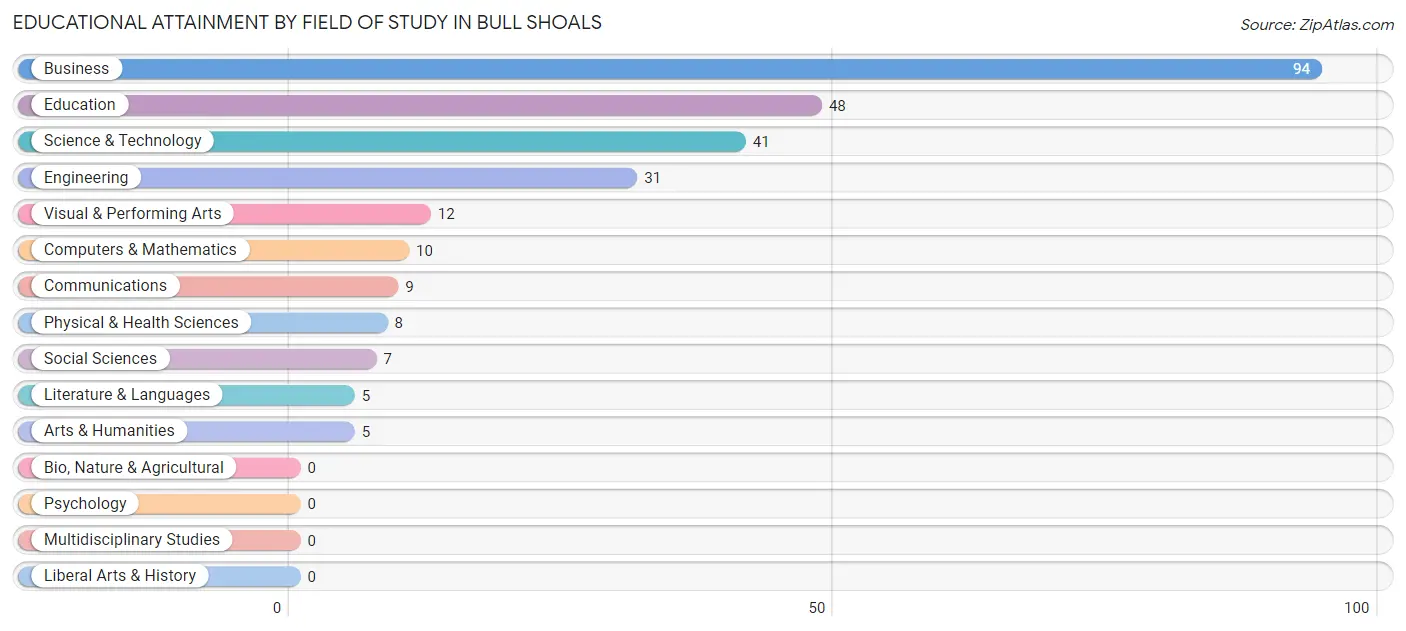
Educational Attainment by Field of Study in Bull Shoals
Business (94 | 34.8%), education (48 | 17.8%), science & technology (41 | 15.2%), engineering (31 | 11.5%), and visual & performing arts (12 | 4.4%) are the most common fields of study among 270 individuals in Bull Shoals who have obtained a bachelor's degree or higher.
| Field of Study | # Graduates | % Graduates |
| Computers & Mathematics | 10 | 3.7% |
| Bio, Nature & Agricultural | 0 | 0.0% |
| Physical & Health Sciences | 8 | 3.0% |
| Psychology | 0 | 0.0% |
| Social Sciences | 7 | 2.6% |
| Engineering | 31 | 11.5% |
| Multidisciplinary Studies | 0 | 0.0% |
| Science & Technology | 41 | 15.2% |
| Business | 94 | 34.8% |
| Education | 48 | 17.8% |
| Literature & Languages | 5 | 1.8% |
| Liberal Arts & History | 0 | 0.0% |
| Visual & Performing Arts | 12 | 4.4% |
| Communications | 9 | 3.3% |
| Arts & Humanities | 5 | 1.8% |
| Total | 270 | 100.0% |
Transportation & Commute in Bull Shoals
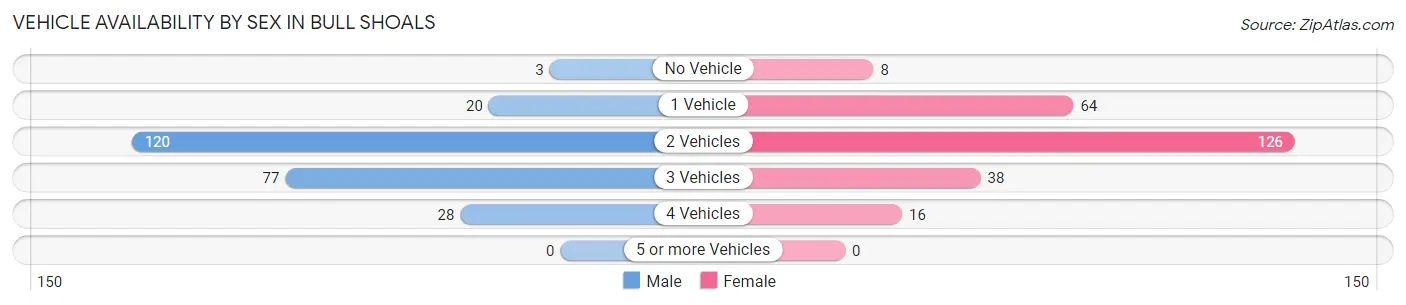
Vehicle Availability by Sex in Bull Shoals
The most prevalent vehicle ownership categories in Bull Shoals are males with 2 vehicles (120, accounting for 48.4%) and females with 2 vehicles (126, making up 47.6%).
| Vehicles Available | Male | Female |
| No Vehicle | 3 (1.2%) | 8 (3.2%) |
| 1 Vehicle | 20 (8.1%) | 64 (25.4%) |
| 2 Vehicles | 120 (48.4%) | 126 (50.0%) |
| 3 Vehicles | 77 (31.0%) | 38 (15.1%) |
| 4 Vehicles | 28 (11.3%) | 16 (6.4%) |
| 5 or more Vehicles | 0 (0.0%) | 0 (0.0%) |
| Total | 248 (100.0%) | 252 (100.0%) |
Commute Time in Bull Shoals
The most frequently occuring commute durations in Bull Shoals are 30 to 34 minutes (121 commuters, 26.2%), 15 to 19 minutes (98 commuters, 21.2%), and 20 to 24 minutes (53 commuters, 11.5%).
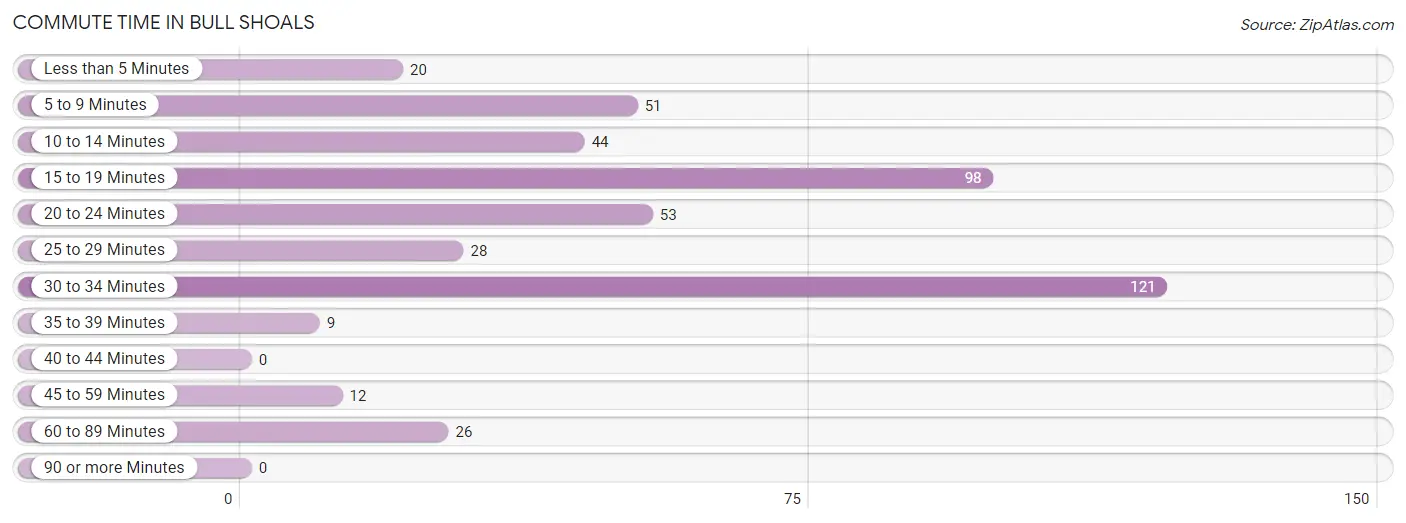
| Commute Time | # Commuters | % Commuters |
| Less than 5 Minutes | 20 | 4.3% |
| 5 to 9 Minutes | 51 | 11.0% |
| 10 to 14 Minutes | 44 | 9.5% |
| 15 to 19 Minutes | 98 | 21.2% |
| 20 to 24 Minutes | 53 | 11.5% |
| 25 to 29 Minutes | 28 | 6.1% |
| 30 to 34 Minutes | 121 | 26.2% |
| 35 to 39 Minutes | 9 | 1.9% |
| 40 to 44 Minutes | 0 | 0.0% |
| 45 to 59 Minutes | 12 | 2.6% |
| 60 to 89 Minutes | 26 | 5.6% |
| 90 or more Minutes | 0 | 0.0% |
Commute Time by Sex in Bull Shoals
The most common commute times in Bull Shoals are 30 to 34 minutes (60 commuters, 27.7%) for males and 30 to 34 minutes (61 commuters, 24.9%) for females.
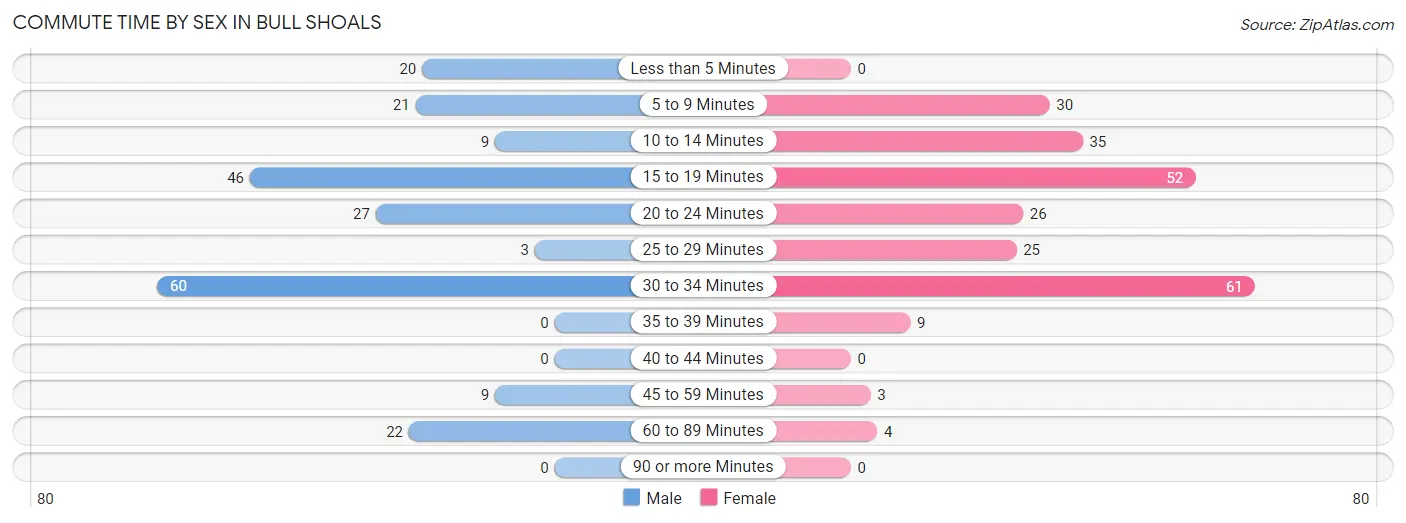
| Commute Time | Male | Female |
| Less than 5 Minutes | 20 (9.2%) | 0 (0.0%) |
| 5 to 9 Minutes | 21 (9.7%) | 30 (12.2%) |
| 10 to 14 Minutes | 9 (4.2%) | 35 (14.3%) |
| 15 to 19 Minutes | 46 (21.2%) | 52 (21.2%) |
| 20 to 24 Minutes | 27 (12.4%) | 26 (10.6%) |
| 25 to 29 Minutes | 3 (1.4%) | 25 (10.2%) |
| 30 to 34 Minutes | 60 (27.7%) | 61 (24.9%) |
| 35 to 39 Minutes | 0 (0.0%) | 9 (3.7%) |
| 40 to 44 Minutes | 0 (0.0%) | 0 (0.0%) |
| 45 to 59 Minutes | 9 (4.2%) | 3 (1.2%) |
| 60 to 89 Minutes | 22 (10.1%) | 4 (1.6%) |
| 90 or more Minutes | 0 (0.0%) | 0 (0.0%) |
Time of Departure to Work by Sex in Bull Shoals
The most frequent times of departure to work in Bull Shoals are 7:30 AM to 7:59 AM (72, 33.2%) for males and 7:30 AM to 7:59 AM (44, 18.0%) for females.
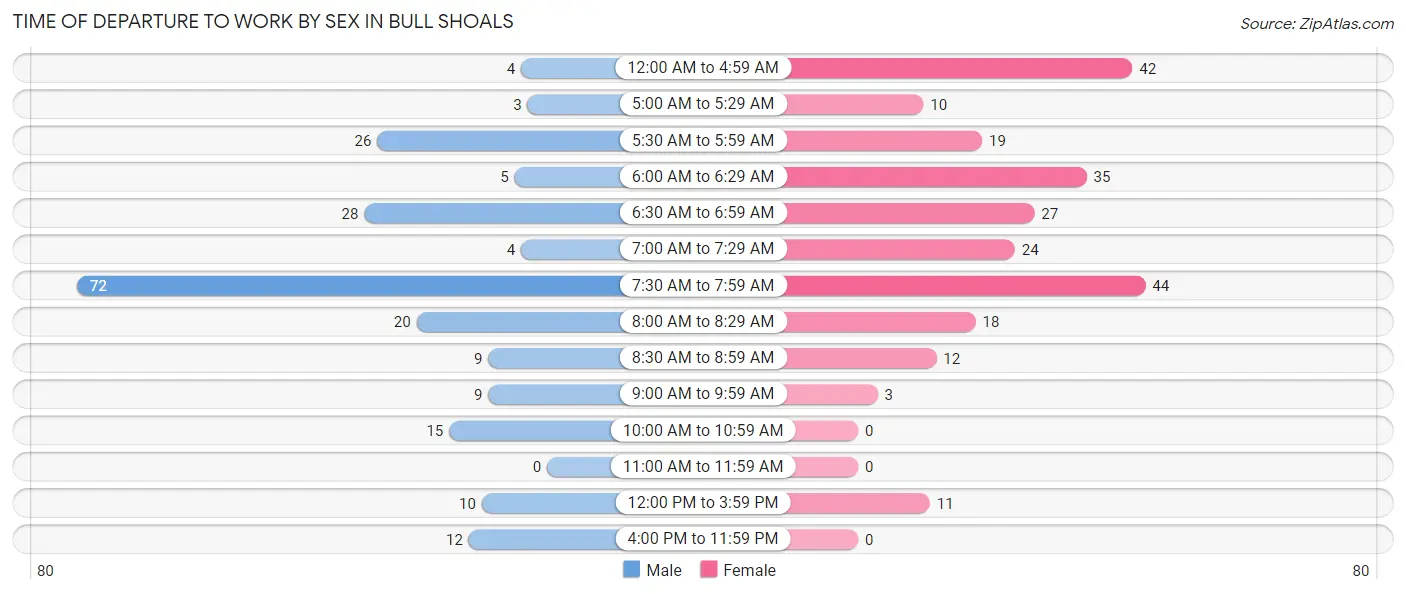
| Time of Departure | Male | Female |
| 12:00 AM to 4:59 AM | 4 (1.8%) | 42 (17.1%) |
| 5:00 AM to 5:29 AM | 3 (1.4%) | 10 (4.1%) |
| 5:30 AM to 5:59 AM | 26 (12.0%) | 19 (7.8%) |
| 6:00 AM to 6:29 AM | 5 (2.3%) | 35 (14.3%) |
| 6:30 AM to 6:59 AM | 28 (12.9%) | 27 (11.0%) |
| 7:00 AM to 7:29 AM | 4 (1.8%) | 24 (9.8%) |
| 7:30 AM to 7:59 AM | 72 (33.2%) | 44 (18.0%) |
| 8:00 AM to 8:29 AM | 20 (9.2%) | 18 (7.3%) |
| 8:30 AM to 8:59 AM | 9 (4.2%) | 12 (4.9%) |
| 9:00 AM to 9:59 AM | 9 (4.2%) | 3 (1.2%) |
| 10:00 AM to 10:59 AM | 15 (6.9%) | 0 (0.0%) |
| 11:00 AM to 11:59 AM | 0 (0.0%) | 0 (0.0%) |
| 12:00 PM to 3:59 PM | 10 (4.6%) | 11 (4.5%) |
| 4:00 PM to 11:59 PM | 12 (5.5%) | 0 (0.0%) |
| Total | 217 (100.0%) | 245 (100.0%) |
Housing Occupancy in Bull Shoals
Occupancy by Ownership in Bull Shoals
Of the total 803 dwellings in Bull Shoals, owner-occupied units account for 596 (74.2%), while renter-occupied units make up 207 (25.8%).
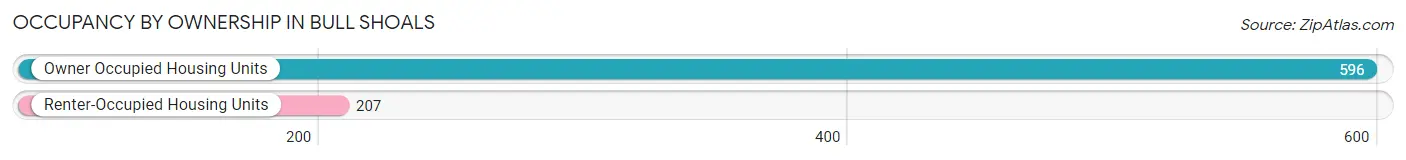
| Occupancy | # Housing Units | % Housing Units |
| Owner Occupied Housing Units | 596 | 74.2% |
| Renter-Occupied Housing Units | 207 | 25.8% |
| Total Occupied Housing Units | 803 | 100.0% |
Occupancy by Household Size in Bull Shoals
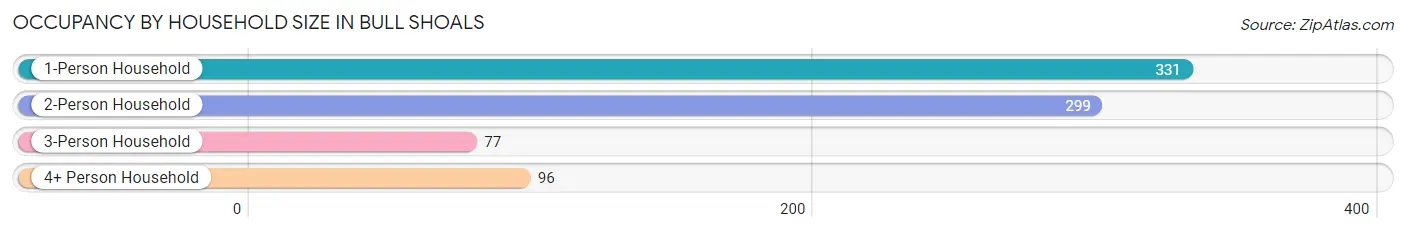
| Household Size | # Housing Units | % Housing Units |
| 1-Person Household | 331 | 41.2% |
| 2-Person Household | 299 | 37.2% |
| 3-Person Household | 77 | 9.6% |
| 4+ Person Household | 96 | 12.0% |
| Total Housing Units | 803 | 100.0% |
Occupancy by Ownership by Household Size in Bull Shoals
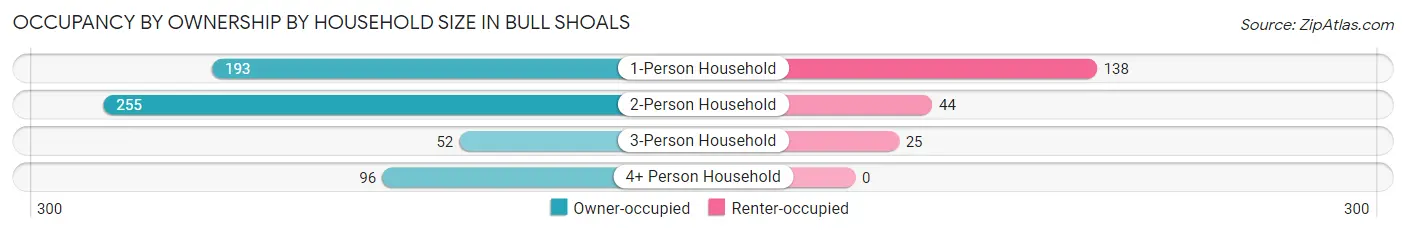
| Household Size | Owner-occupied | Renter-occupied |
| 1-Person Household | 193 (58.3%) | 138 (41.7%) |
| 2-Person Household | 255 (85.3%) | 44 (14.7%) |
| 3-Person Household | 52 (67.5%) | 25 (32.5%) |
| 4+ Person Household | 96 (100.0%) | 0 (0.0%) |
| Total Housing Units | 596 (74.2%) | 207 (25.8%) |
Occupancy by Educational Attainment in Bull Shoals
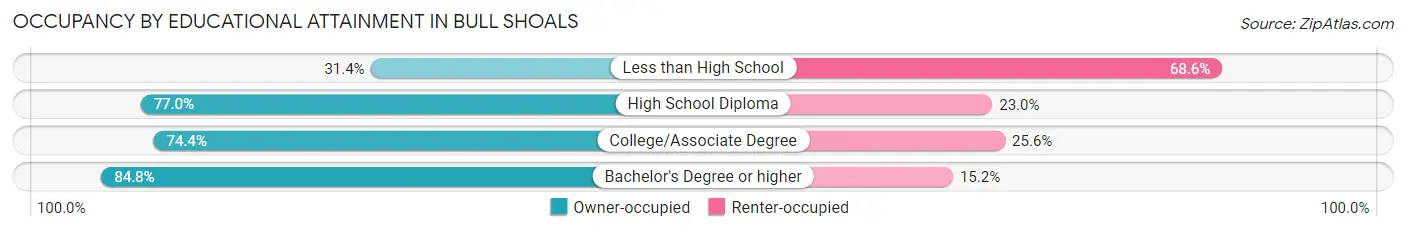
| Household Size | Owner-occupied | Renter-occupied |
| Less than High School | 22 (31.4%) | 48 (68.6%) |
| High School Diploma | 244 (77.0%) | 73 (23.0%) |
| College/Associate Degree | 163 (74.4%) | 56 (25.6%) |
| Bachelor's Degree or higher | 167 (84.8%) | 30 (15.2%) |
Occupancy by Age of Householder in Bull Shoals
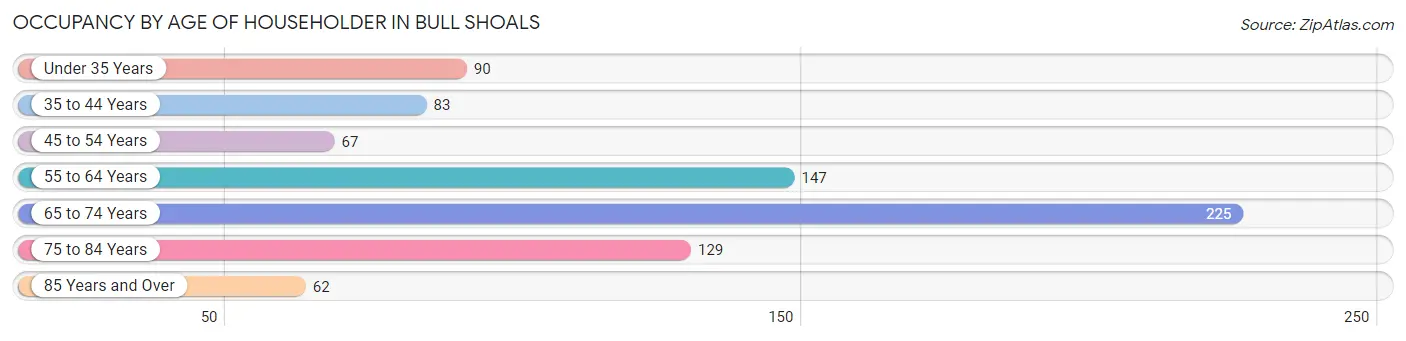
| Age Bracket | # Households | % Households |
| Under 35 Years | 90 | 11.2% |
| 35 to 44 Years | 83 | 10.3% |
| 45 to 54 Years | 67 | 8.3% |
| 55 to 64 Years | 147 | 18.3% |
| 65 to 74 Years | 225 | 28.0% |
| 75 to 84 Years | 129 | 16.1% |
| 85 Years and Over | 62 | 7.7% |
| Total | 803 | 100.0% |
Housing Finances in Bull Shoals
Median Income by Occupancy in Bull Shoals
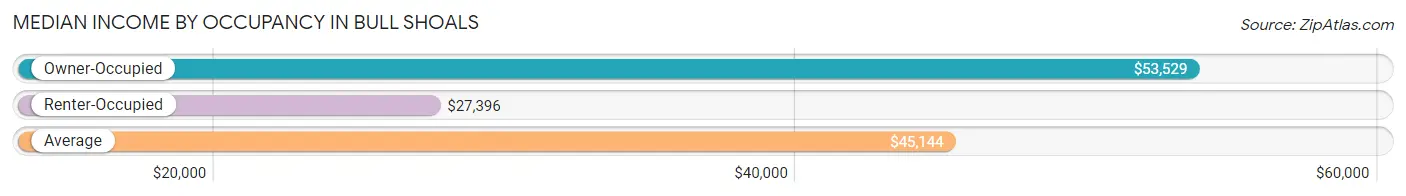
| Occupancy Type | # Households | Median Income |
| Owner-Occupied | 596 (74.2%) | $53,529 |
| Renter-Occupied | 207 (25.8%) | $27,396 |
| Average | 803 (100.0%) | $45,144 |
Occupancy by Householder Income Bracket in Bull Shoals
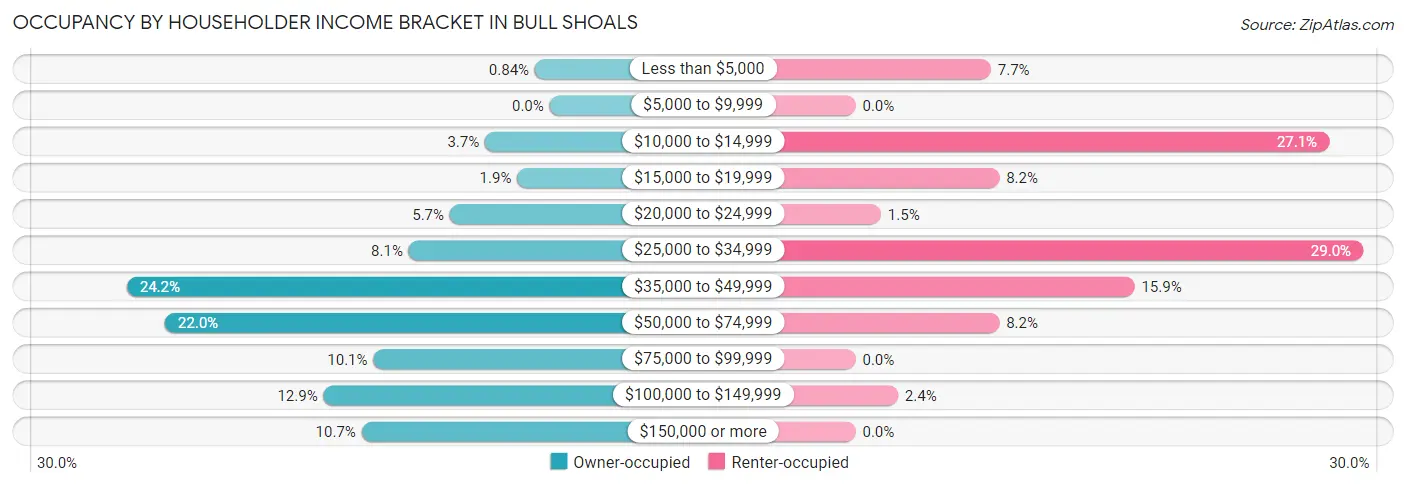
| Income Bracket | Owner-occupied | Renter-occupied |
| Less than $5,000 | 5 (0.8%) | 16 (7.7%) |
| $5,000 to $9,999 | 0 (0.0%) | 0 (0.0%) |
| $10,000 to $14,999 | 22 (3.7%) | 56 (27.1%) |
| $15,000 to $19,999 | 11 (1.8%) | 17 (8.2%) |
| $20,000 to $24,999 | 34 (5.7%) | 3 (1.5%) |
| $25,000 to $34,999 | 48 (8.1%) | 60 (29.0%) |
| $35,000 to $49,999 | 144 (24.2%) | 33 (15.9%) |
| $50,000 to $74,999 | 131 (22.0%) | 17 (8.2%) |
| $75,000 to $99,999 | 60 (10.1%) | 0 (0.0%) |
| $100,000 to $149,999 | 77 (12.9%) | 5 (2.4%) |
| $150,000 or more | 64 (10.7%) | 0 (0.0%) |
| Total | 596 (100.0%) | 207 (100.0%) |
Monthly Housing Cost Tiers in Bull Shoals
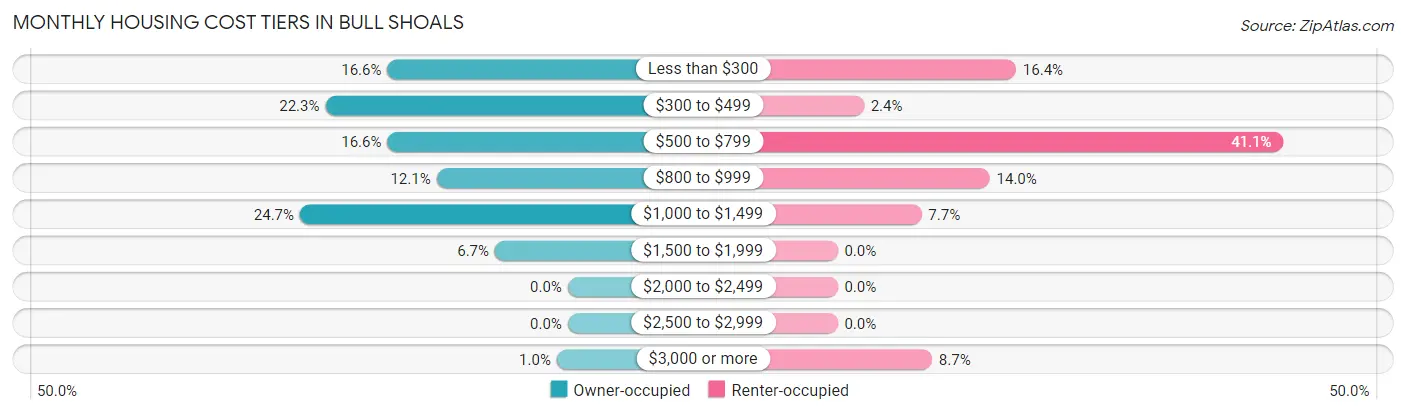
| Monthly Cost | Owner-occupied | Renter-occupied |
| Less than $300 | 99 (16.6%) | 34 (16.4%) |
| $300 to $499 | 133 (22.3%) | 5 (2.4%) |
| $500 to $799 | 99 (16.6%) | 85 (41.1%) |
| $800 to $999 | 72 (12.1%) | 29 (14.0%) |
| $1,000 to $1,499 | 147 (24.7%) | 16 (7.7%) |
| $1,500 to $1,999 | 40 (6.7%) | 0 (0.0%) |
| $2,000 to $2,499 | 0 (0.0%) | 0 (0.0%) |
| $2,500 to $2,999 | 0 (0.0%) | 0 (0.0%) |
| $3,000 or more | 6 (1.0%) | 18 (8.7%) |
| Total | 596 (100.0%) | 207 (100.0%) |
Physical Housing Characteristics in Bull Shoals
Housing Structures in Bull Shoals
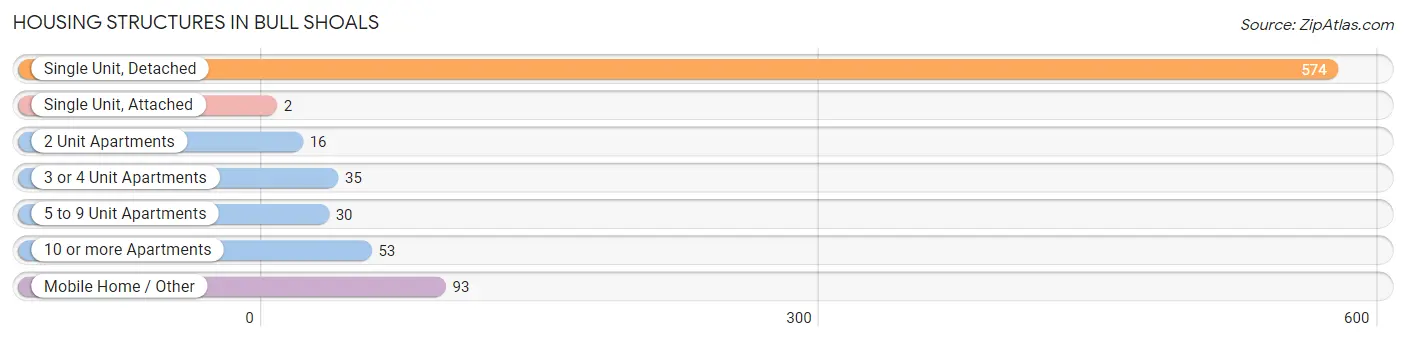
| Structure Type | # Housing Units | % Housing Units |
| Single Unit, Detached | 574 | 71.5% |
| Single Unit, Attached | 2 | 0.3% |
| 2 Unit Apartments | 16 | 2.0% |
| 3 or 4 Unit Apartments | 35 | 4.4% |
| 5 to 9 Unit Apartments | 30 | 3.7% |
| 10 or more Apartments | 53 | 6.6% |
| Mobile Home / Other | 93 | 11.6% |
| Total | 803 | 100.0% |
Housing Structures by Occupancy in Bull Shoals
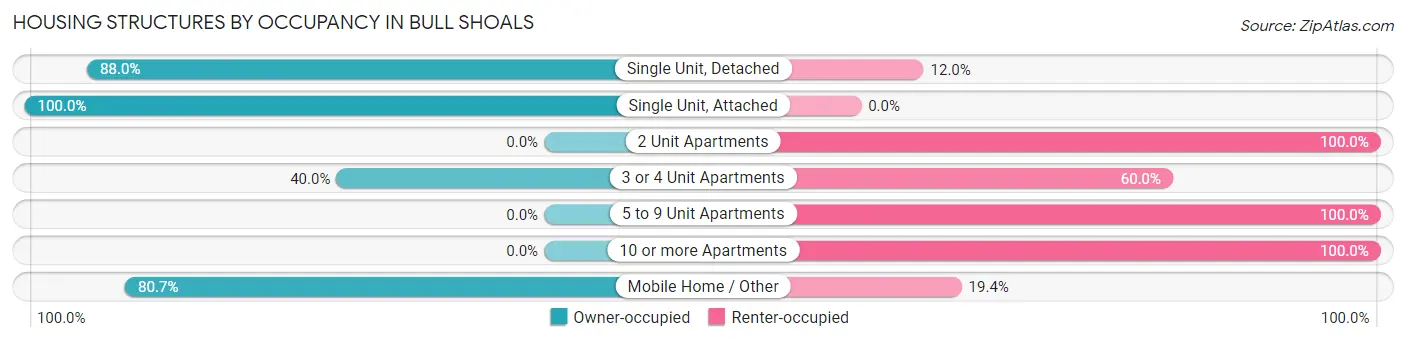
| Structure Type | Owner-occupied | Renter-occupied |
| Single Unit, Detached | 505 (88.0%) | 69 (12.0%) |
| Single Unit, Attached | 2 (100.0%) | 0 (0.0%) |
| 2 Unit Apartments | 0 (0.0%) | 16 (100.0%) |
| 3 or 4 Unit Apartments | 14 (40.0%) | 21 (60.0%) |
| 5 to 9 Unit Apartments | 0 (0.0%) | 30 (100.0%) |
| 10 or more Apartments | 0 (0.0%) | 53 (100.0%) |
| Mobile Home / Other | 75 (80.6%) | 18 (19.4%) |
| Total | 596 (74.2%) | 207 (25.8%) |
Housing Structures by Number of Rooms in Bull Shoals

| Number of Rooms | Owner-occupied | Renter-occupied |
| 1 Room | 0 (0.0%) | 17 (8.2%) |
| 2 or 3 Rooms | 33 (5.5%) | 79 (38.2%) |
| 4 or 5 Rooms | 241 (40.4%) | 102 (49.3%) |
| 6 or 7 Rooms | 207 (34.7%) | 0 (0.0%) |
| 8 or more Rooms | 115 (19.3%) | 9 (4.3%) |
| Total | 596 (100.0%) | 207 (100.0%) |
Housing Structure by Heating Type in Bull Shoals
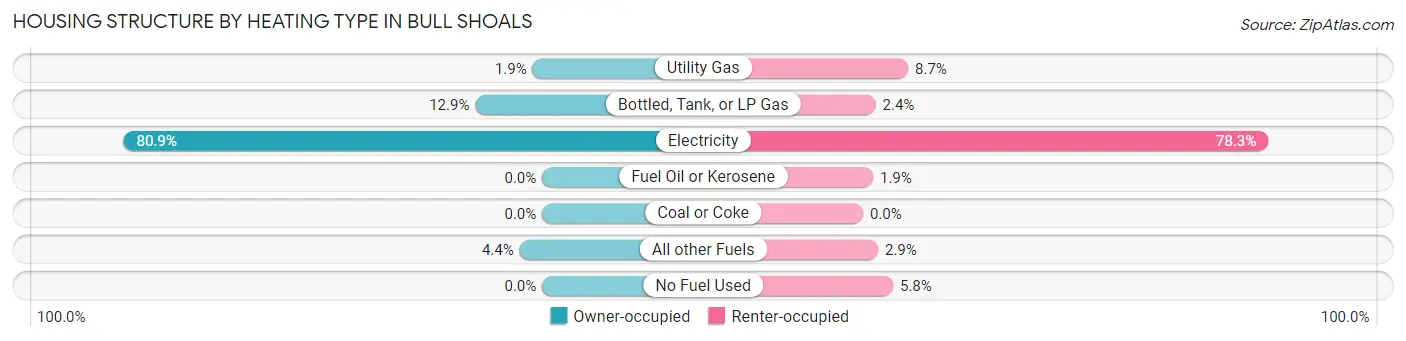
| Heating Type | Owner-occupied | Renter-occupied |
| Utility Gas | 11 (1.8%) | 18 (8.7%) |
| Bottled, Tank, or LP Gas | 77 (12.9%) | 5 (2.4%) |
| Electricity | 482 (80.9%) | 162 (78.3%) |
| Fuel Oil or Kerosene | 0 (0.0%) | 4 (1.9%) |
| Coal or Coke | 0 (0.0%) | 0 (0.0%) |
| All other Fuels | 26 (4.4%) | 6 (2.9%) |
| No Fuel Used | 0 (0.0%) | 12 (5.8%) |
| Total | 596 (100.0%) | 207 (100.0%) |
Household Vehicle Usage in Bull Shoals
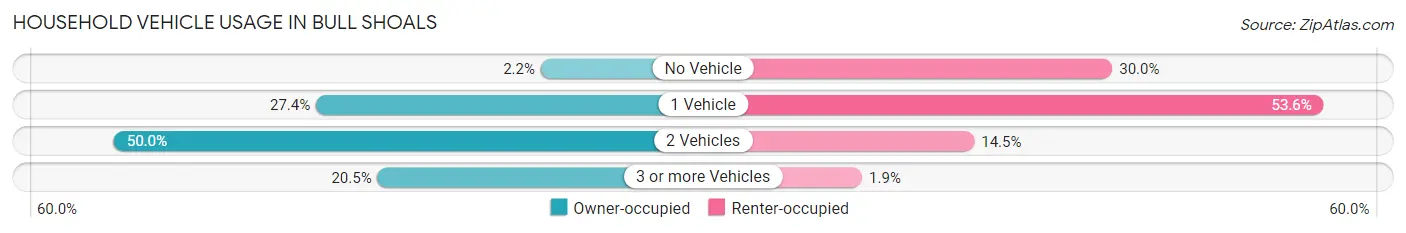
| Vehicles per Household | Owner-occupied | Renter-occupied |
| No Vehicle | 13 (2.2%) | 62 (29.9%) |
| 1 Vehicle | 163 (27.4%) | 111 (53.6%) |
| 2 Vehicles | 298 (50.0%) | 30 (14.5%) |
| 3 or more Vehicles | 122 (20.5%) | 4 (1.9%) |
| Total | 596 (100.0%) | 207 (100.0%) |
Real Estate & Mortgages in Bull Shoals
Real Estate and Mortgage Overview in Bull Shoals
| Characteristic | Without Mortgage | With Mortgage |
| Housing Units | 298 | 298 |
| Median Property Value | $119,000 | $166,500 |
| Median Household Income | $52,647 | $45 |
| Monthly Housing Costs | $371 | $6 |
| Real Estate Taxes | $776 | $0 |
Property Value by Mortgage Status in Bull Shoals
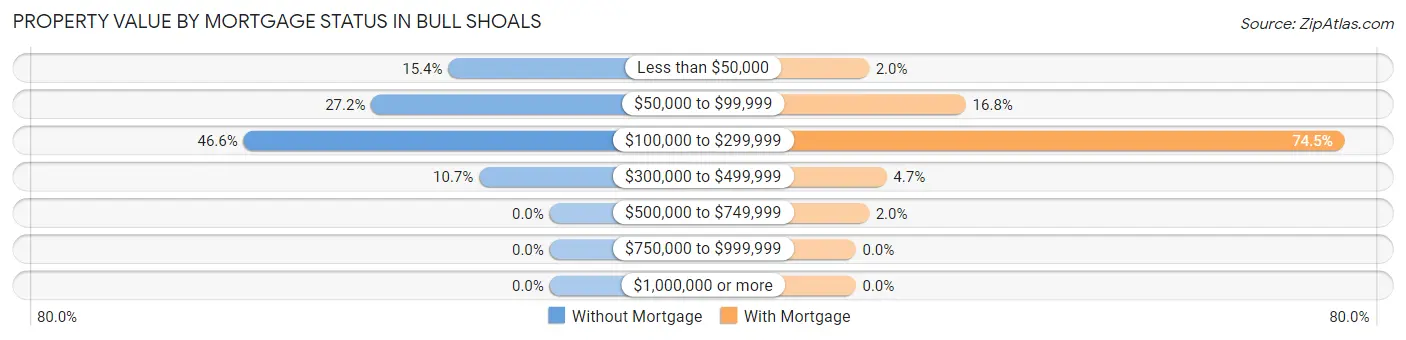
| Property Value | Without Mortgage | With Mortgage |
| Less than $50,000 | 46 (15.4%) | 6 (2.0%) |
| $50,000 to $99,999 | 81 (27.2%) | 50 (16.8%) |
| $100,000 to $299,999 | 139 (46.6%) | 222 (74.5%) |
| $300,000 to $499,999 | 32 (10.7%) | 14 (4.7%) |
| $500,000 to $749,999 | 0 (0.0%) | 6 (2.0%) |
| $750,000 to $999,999 | 0 (0.0%) | 0 (0.0%) |
| $1,000,000 or more | 0 (0.0%) | 0 (0.0%) |
| Total | 298 (100.0%) | 298 (100.0%) |
Household Income by Mortgage Status in Bull Shoals
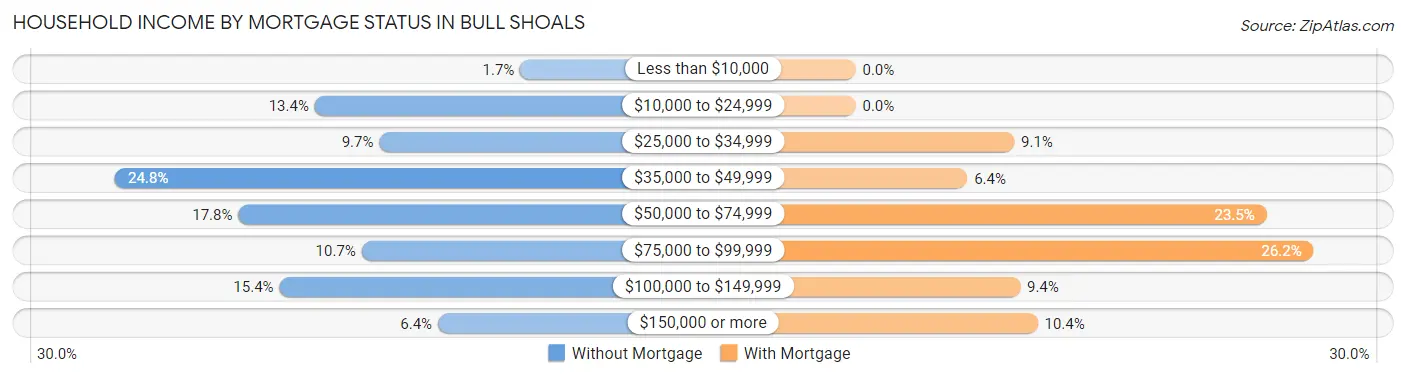
| Household Income | Without Mortgage | With Mortgage |
| Less than $10,000 | 5 (1.7%) | 0 (0.0%) |
| $10,000 to $24,999 | 40 (13.4%) | 0 (0.0%) |
| $25,000 to $34,999 | 29 (9.7%) | 27 (9.1%) |
| $35,000 to $49,999 | 74 (24.8%) | 19 (6.4%) |
| $50,000 to $74,999 | 53 (17.8%) | 70 (23.5%) |
| $75,000 to $99,999 | 32 (10.7%) | 78 (26.2%) |
| $100,000 to $149,999 | 46 (15.4%) | 28 (9.4%) |
| $150,000 or more | 19 (6.4%) | 31 (10.4%) |
| Total | 298 (100.0%) | 298 (100.0%) |
Property Value to Household Income Ratio in Bull Shoals
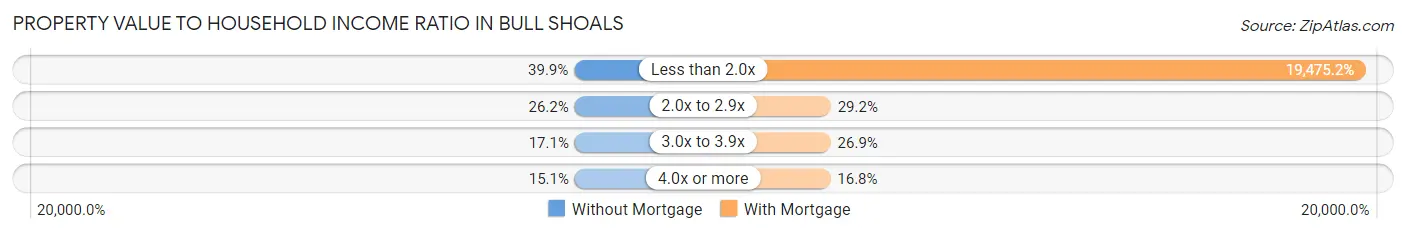
| Value-to-Income Ratio | Without Mortgage | With Mortgage |
| Less than 2.0x | 119 (39.9%) | 58,036 (19,475.2%) |
| 2.0x to 2.9x | 78 (26.2%) | 87 (29.2%) |
| 3.0x to 3.9x | 51 (17.1%) | 80 (26.9%) |
| 4.0x or more | 45 (15.1%) | 50 (16.8%) |
| Total | 298 (100.0%) | 298 (100.0%) |
Real Estate Taxes by Mortgage Status in Bull Shoals
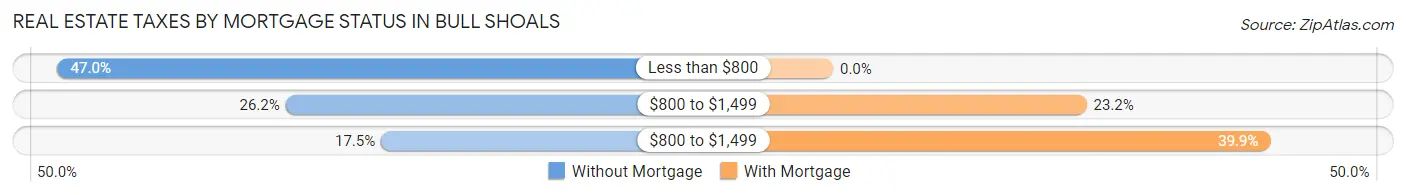
| Property Taxes | Without Mortgage | With Mortgage |
| Less than $800 | 140 (47.0%) | 0 (0.0%) |
| $800 to $1,499 | 78 (26.2%) | 69 (23.2%) |
| $800 to $1,499 | 52 (17.4%) | 119 (39.9%) |
| Total | 298 (100.0%) | 298 (100.0%) |
Health & Disability in Bull Shoals
Health Insurance Coverage by Age in Bull Shoals
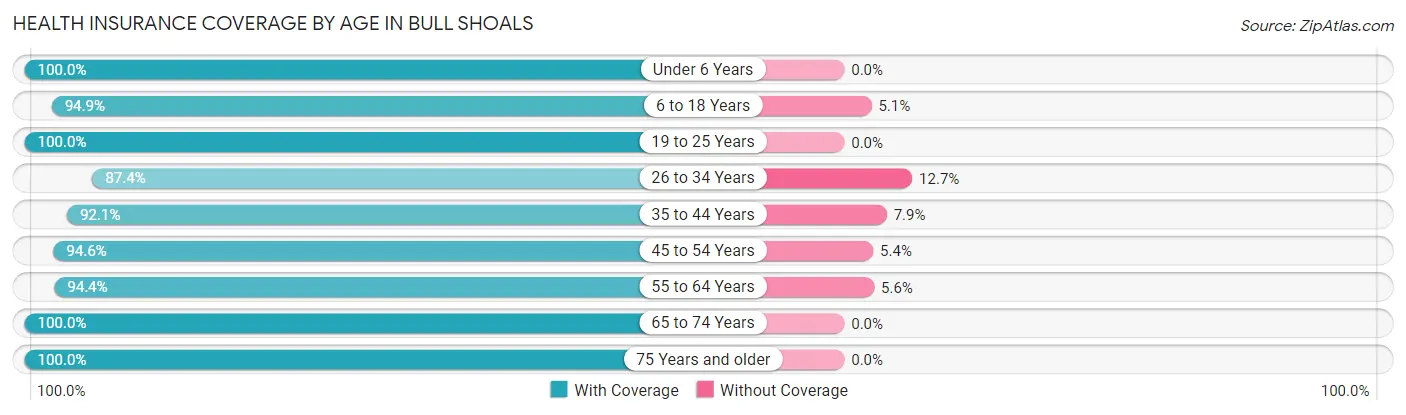
| Age Bracket | With Coverage | Without Coverage |
| Under 6 Years | 128 (100.0%) | 0 (0.0%) |
| 6 to 18 Years | 169 (94.9%) | 9 (5.1%) |
| 19 to 25 Years | 53 (100.0%) | 0 (0.0%) |
| 26 to 34 Years | 145 (87.4%) | 21 (12.7%) |
| 35 to 44 Years | 163 (92.1%) | 14 (7.9%) |
| 45 to 54 Years | 123 (94.6%) | 7 (5.4%) |
| 55 to 64 Years | 272 (94.4%) | 16 (5.6%) |
| 65 to 74 Years | 343 (100.0%) | 0 (0.0%) |
| 75 Years and older | 324 (100.0%) | 0 (0.0%) |
| Total | 1,720 (96.3%) | 67 (3.7%) |
Health Insurance Coverage by Citizenship Status in Bull Shoals
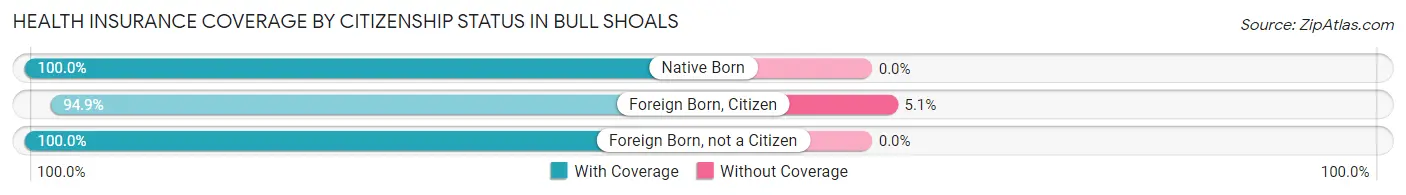
| Citizenship Status | With Coverage | Without Coverage |
| Native Born | 128 (100.0%) | 0 (0.0%) |
| Foreign Born, Citizen | 169 (94.9%) | 9 (5.1%) |
| Foreign Born, not a Citizen | 53 (100.0%) | 0 (0.0%) |
Health Insurance Coverage by Household Income in Bull Shoals
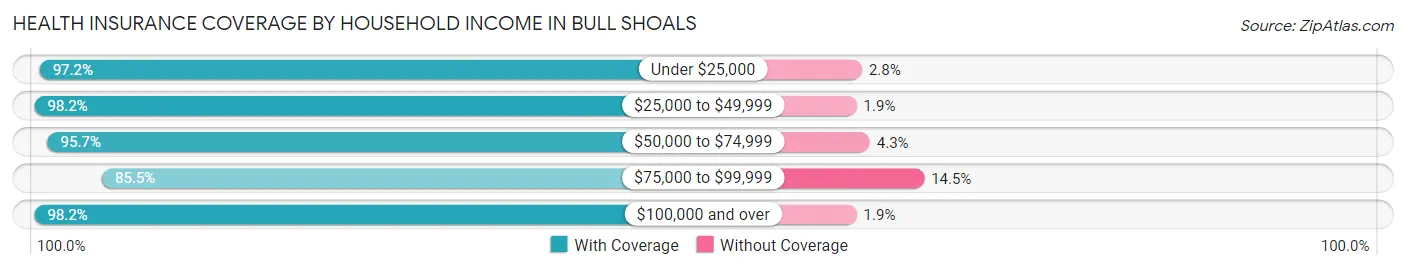
| Household Income | With Coverage | Without Coverage |
| Under $25,000 | 171 (97.2%) | 5 (2.8%) |
| $25,000 to $49,999 | 582 (98.2%) | 11 (1.8%) |
| $50,000 to $74,999 | 266 (95.7%) | 12 (4.3%) |
| $75,000 to $99,999 | 171 (85.5%) | 29 (14.5%) |
| $100,000 and over | 530 (98.2%) | 10 (1.8%) |
Public vs Private Health Insurance Coverage by Age in Bull Shoals
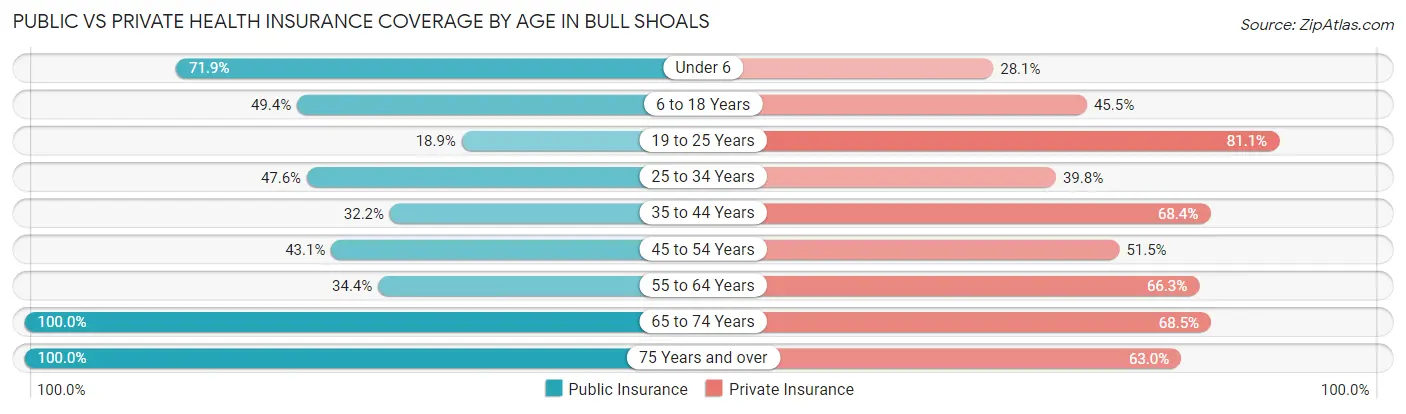
| Age Bracket | Public Insurance | Private Insurance |
| Under 6 | 92 (71.9%) | 36 (28.1%) |
| 6 to 18 Years | 88 (49.4%) | 81 (45.5%) |
| 19 to 25 Years | 10 (18.9%) | 43 (81.1%) |
| 25 to 34 Years | 79 (47.6%) | 66 (39.8%) |
| 35 to 44 Years | 57 (32.2%) | 121 (68.4%) |
| 45 to 54 Years | 56 (43.1%) | 67 (51.5%) |
| 55 to 64 Years | 99 (34.4%) | 191 (66.3%) |
| 65 to 74 Years | 343 (100.0%) | 235 (68.5%) |
| 75 Years and over | 324 (100.0%) | 204 (63.0%) |
| Total | 1,148 (64.2%) | 1,044 (58.4%) |
Disability Status by Sex by Age in Bull Shoals
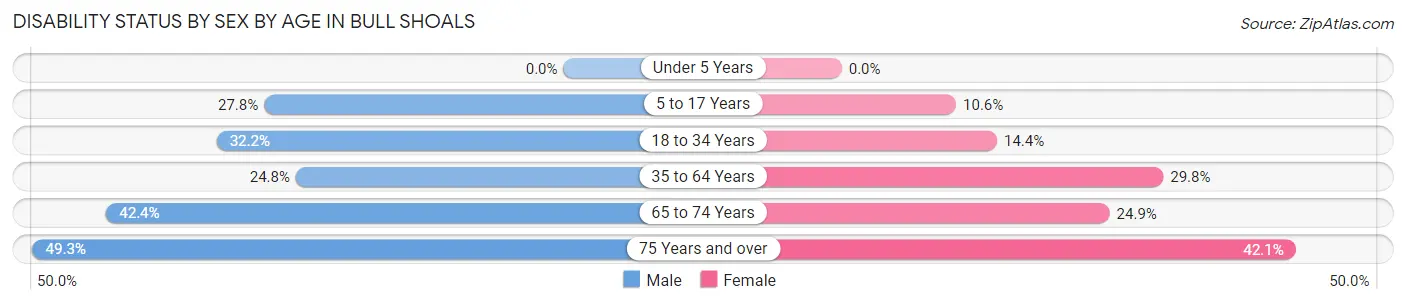
| Age Bracket | Male | Female |
| Under 5 Years | 0 (0.0%) | 0 (0.0%) |
| 5 to 17 Years | 20 (27.8%) | 14 (10.6%) |
| 18 to 34 Years | 37 (32.2%) | 17 (14.4%) |
| 35 to 64 Years | 72 (24.8%) | 91 (29.8%) |
| 65 to 74 Years | 67 (42.4%) | 46 (24.9%) |
| 75 Years and over | 66 (49.2%) | 80 (42.1%) |
Disability Class by Sex by Age in Bull Shoals
Disability Class: Hearing Difficulty
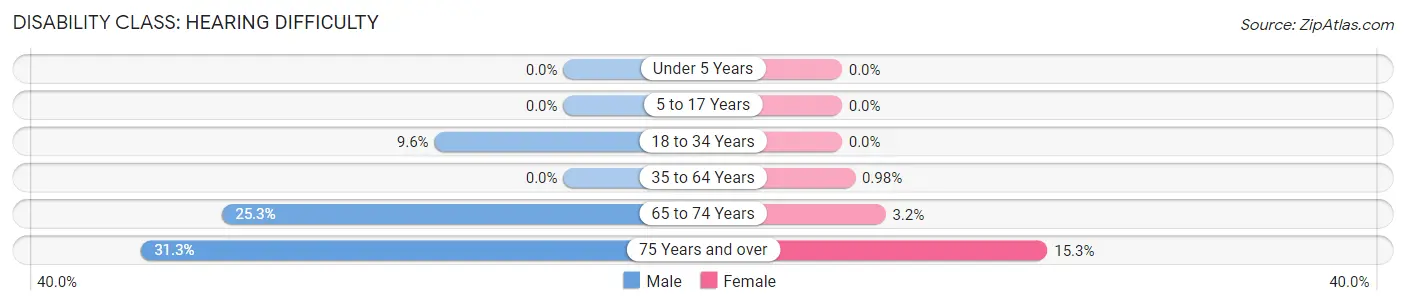
| Age Bracket | Male | Female |
| Under 5 Years | 0 (0.0%) | 0 (0.0%) |
| 5 to 17 Years | 0 (0.0%) | 0 (0.0%) |
| 18 to 34 Years | 11 (9.6%) | 0 (0.0%) |
| 35 to 64 Years | 0 (0.0%) | 3 (1.0%) |
| 65 to 74 Years | 40 (25.3%) | 6 (3.2%) |
| 75 Years and over | 42 (31.3%) | 29 (15.3%) |
Disability Class: Vision Difficulty
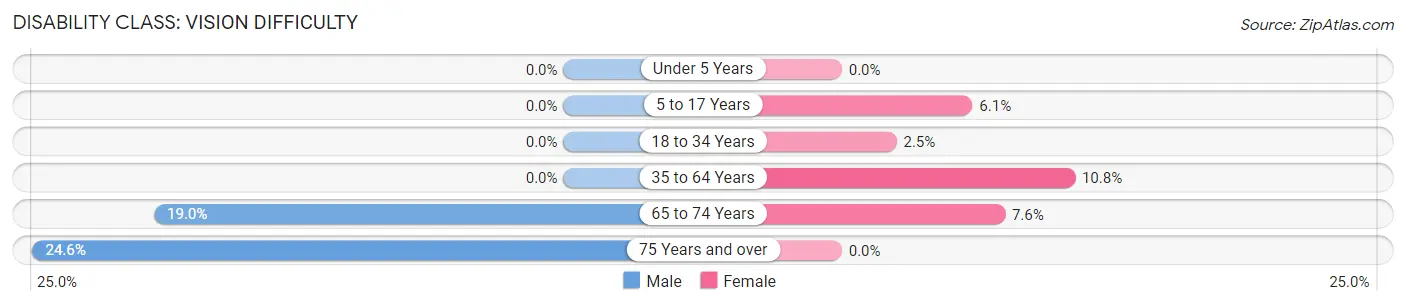
| Age Bracket | Male | Female |
| Under 5 Years | 0 (0.0%) | 0 (0.0%) |
| 5 to 17 Years | 0 (0.0%) | 8 (6.1%) |
| 18 to 34 Years | 0 (0.0%) | 3 (2.5%) |
| 35 to 64 Years | 0 (0.0%) | 33 (10.8%) |
| 65 to 74 Years | 30 (19.0%) | 14 (7.6%) |
| 75 Years and over | 33 (24.6%) | 0 (0.0%) |
Disability Class: Cognitive Difficulty
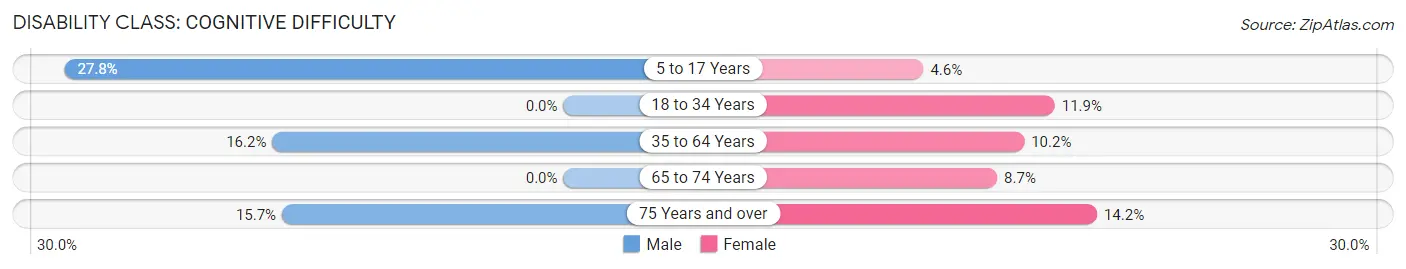
| Age Bracket | Male | Female |
| 5 to 17 Years | 20 (27.8%) | 6 (4.5%) |
| 18 to 34 Years | 0 (0.0%) | 14 (11.9%) |
| 35 to 64 Years | 47 (16.2%) | 31 (10.2%) |
| 65 to 74 Years | 0 (0.0%) | 16 (8.6%) |
| 75 Years and over | 21 (15.7%) | 27 (14.2%) |
Disability Class: Ambulatory Difficulty
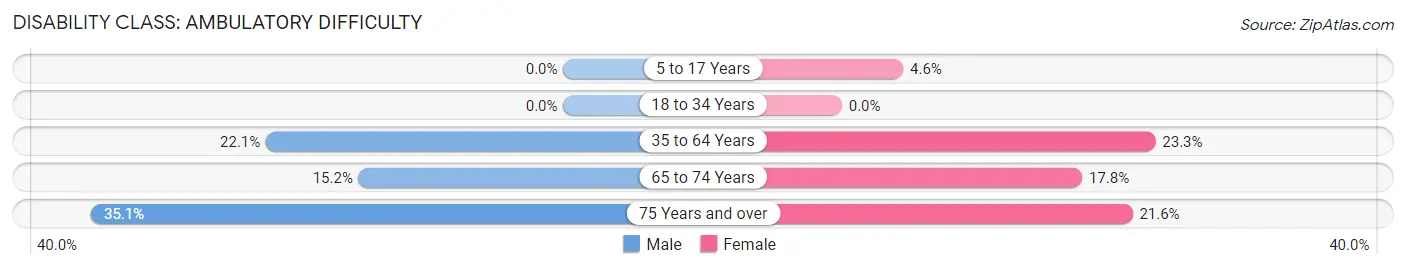
| Age Bracket | Male | Female |
| 5 to 17 Years | 0 (0.0%) | 6 (4.5%) |
| 18 to 34 Years | 0 (0.0%) | 0 (0.0%) |
| 35 to 64 Years | 64 (22.1%) | 71 (23.3%) |
| 65 to 74 Years | 24 (15.2%) | 33 (17.8%) |
| 75 Years and over | 47 (35.1%) | 41 (21.6%) |
Disability Class: Self-Care Difficulty
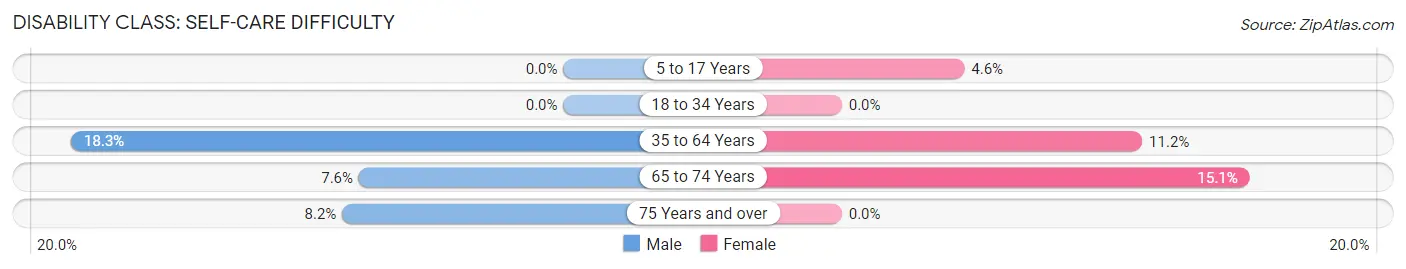
| Age Bracket | Male | Female |
| 5 to 17 Years | 0 (0.0%) | 6 (4.5%) |
| 18 to 34 Years | 0 (0.0%) | 0 (0.0%) |
| 35 to 64 Years | 53 (18.3%) | 34 (11.2%) |
| 65 to 74 Years | 12 (7.6%) | 28 (15.1%) |
| 75 Years and over | 11 (8.2%) | 0 (0.0%) |
Technology Access in Bull Shoals
Computing Device Access in Bull Shoals
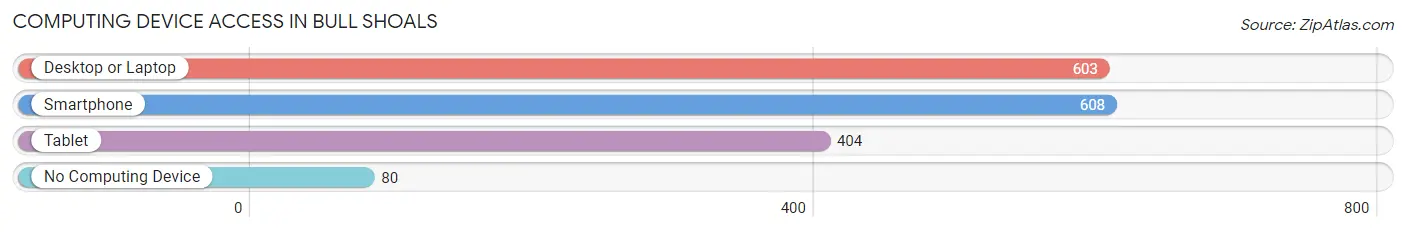
| Device Type | # Households | % Households |
| Desktop or Laptop | 603 | 75.1% |
| Smartphone | 608 | 75.7% |
| Tablet | 404 | 50.3% |
| No Computing Device | 80 | 10.0% |
| Total | 803 | 100.0% |
Internet Access in Bull Shoals
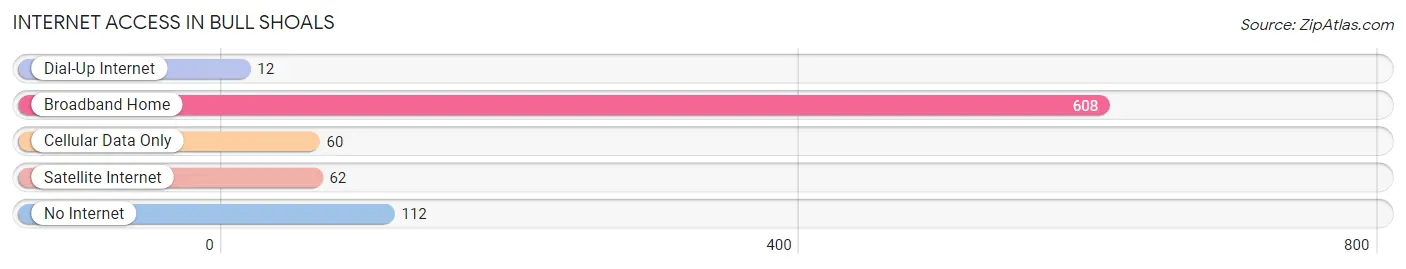
| Internet Type | # Households | % Households |
| Dial-Up Internet | 12 | 1.5% |
| Broadband Home | 608 | 75.7% |
| Cellular Data Only | 60 | 7.5% |
| Satellite Internet | 62 | 7.7% |
| No Internet | 112 | 14.0% |
| Total | 803 | 100.0% |
Bull Shoals Summary
Bull Shoals, Arkansas is a small city located in Marion County, Arkansas. It is situated on the White River, which is a tributary of the Arkansas River. The city is located in the Ozark Mountains and is known for its beautiful scenery and outdoor activities.
History
The area that is now Bull Shoals was first inhabited by Native Americans, including the Osage, Quapaw, and Caddo tribes. The first European settlers arrived in the area in the early 1800s. The city was founded in 1883 by William Bull, who was a prominent businessman from Little Rock. He purchased the land and built a dam on the White River, which created Bull Shoals Lake. The lake was named after Bull and the city was named after the lake.
The city was incorporated in 1941 and has since grown to a population of over 2,000 people. The city is known for its outdoor activities, such as fishing, boating, and camping. It is also home to Bull Shoals State Park, which is a popular destination for visitors.
Geography
Bull Shoals is located in the Ozark Mountains of northern Arkansas. It is situated on the White River, which is a tributary of the Arkansas River. The city is surrounded by the Bull Shoals Lake, which was created by the dam built by William Bull in 1883. The lake is a popular destination for fishing, boating, and other outdoor activities.
The city has a total area of 4.2 square miles, all of which is land. The elevation of the city is 845 feet above sea level. The climate is humid subtropical, with hot summers and mild winters.
Economy
The economy of Bull Shoals is largely based on tourism and outdoor recreation. The city is home to Bull Shoals State Park, which is a popular destination for visitors. The park offers camping, fishing, boating, and other outdoor activities.
The city is also home to several businesses, including restaurants, retail stores, and other services. The city is also home to a number of manufacturing companies, including a furniture factory and a plastics factory.
Demographics
As of the 2010 census, the population of Bull Shoals was 2,068. The racial makeup of the city was 97.2% White, 0.7% African American, 0.3% Native American, 0.2% Asian, 0.1% Pacific Islander, 0.3% from other races, and 1.3% from two or more races. Hispanic or Latino of any race were 1.3% of the population.
The median household income in Bull Shoals was $35,938, and the median family income was $41,250. The per capita income for the city was $19,945. About 11.2% of families and 14.2% of the population were below the poverty line, including 19.2% of those under age 18 and 8.3% of those age 65 or over.
Common Questions
What is Per Capita Income in Bull Shoals?
Per Capita income in Bull Shoals is $33,238.
What is the Median Family Income in Bull Shoals?
Median Family Income in Bull Shoals is $58,304.
What is the Median Household income in Bull Shoals?
Median Household Income in Bull Shoals is $45,144.
What is Income or Wage Gap in Bull Shoals?
Income or Wage Gap in Bull Shoals is 47.1%.
Women in Bull Shoals earn 52.9 cents for every dollar earned by a man.
What is Inequality or Gini Index in Bull Shoals?
Inequality or Gini Index in Bull Shoals is 0.48.
What is the Total Population of Bull Shoals?
Total Population of Bull Shoals is 1,790.
What is the Total Male Population of Bull Shoals?
Total Male Population of Bull Shoals is 824.
What is the Total Female Population of Bull Shoals?
Total Female Population of Bull Shoals is 966.
What is the Ratio of Males per 100 Females in Bull Shoals?
There are 85.30 Males per 100 Females in Bull Shoals.
What is the Ratio of Females per 100 Males in Bull Shoals?
There are 117.23 Females per 100 Males in Bull Shoals.
What is the Median Population Age in Bull Shoals?
Median Population Age in Bull Shoals is 58.6 Years.
What is the Average Family Size in Bull Shoals
Average Family Size in Bull Shoals is 3.2 People.
What is the Average Household Size in Bull Shoals
Average Household Size in Bull Shoals is 2.2 People.
How Large is the Labor Force in Bull Shoals?
There are 627 People in the Labor Forcein in Bull Shoals.
What is the Percentage of People in the Labor Force in Bull Shoals?
41.4% of People are in the Labor Force in Bull Shoals.
What is the Unemployment Rate in Bull Shoals?
Unemployment Rate in Bull Shoals is 11.0%.