Thorsby, AL
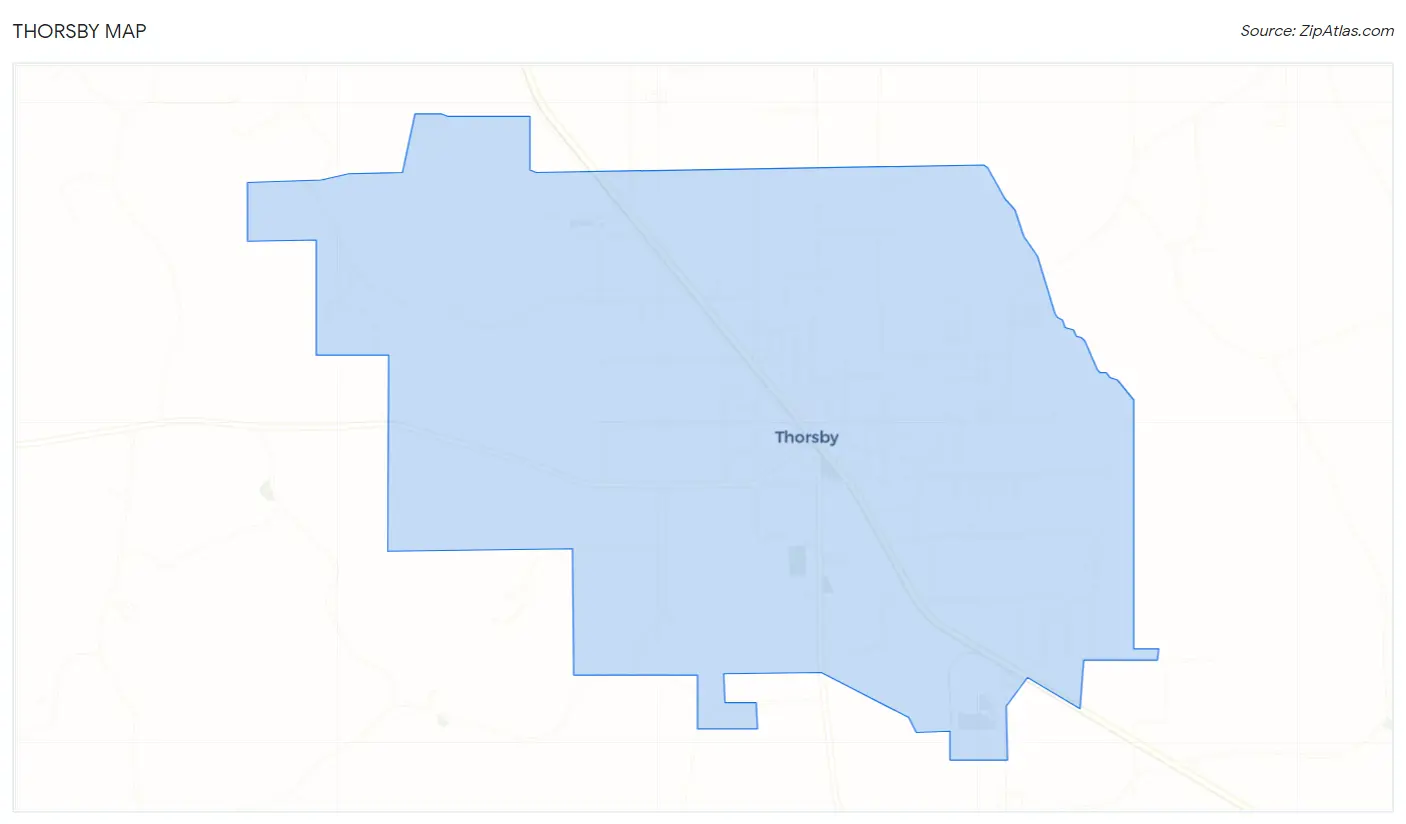
Thorsby Map
Thorsby Overview
2,552
TOTAL POPULATION
1,241
MALE POPULATION
1,311
FEMALE POPULATION
94.66
MALES / 100 FEMALES
105.64
FEMALES / 100 MALES
37.9
MEDIAN AGE
3.5
AVG FAMILY SIZE
3.1
AVG HOUSEHOLD SIZE
$26,348
PER CAPITA INCOME
$80,338
AVG FAMILY INCOME
$72,188
AVG HOUSEHOLD INCOME
52.7%
WAGE / INCOME GAP [ % ]
47.3¢/ $1
WAGE / INCOME GAP [ $ ]
0.37
INEQUALITY / GINI INDEX
1,022
LABOR FORCE [ PEOPLE ]
51.1%
PERCENT IN LABOR FORCE
5.3%
UNEMPLOYMENT RATE
Thorsby Zip Codes
Thorsby Area Codes
Race in Thorsby
The most populous races in Thorsby are White / Caucasian (2,165 | 84.8%), Hispanic or Latino (213 | 8.4%), and Two or more Races (126 | 4.9%).
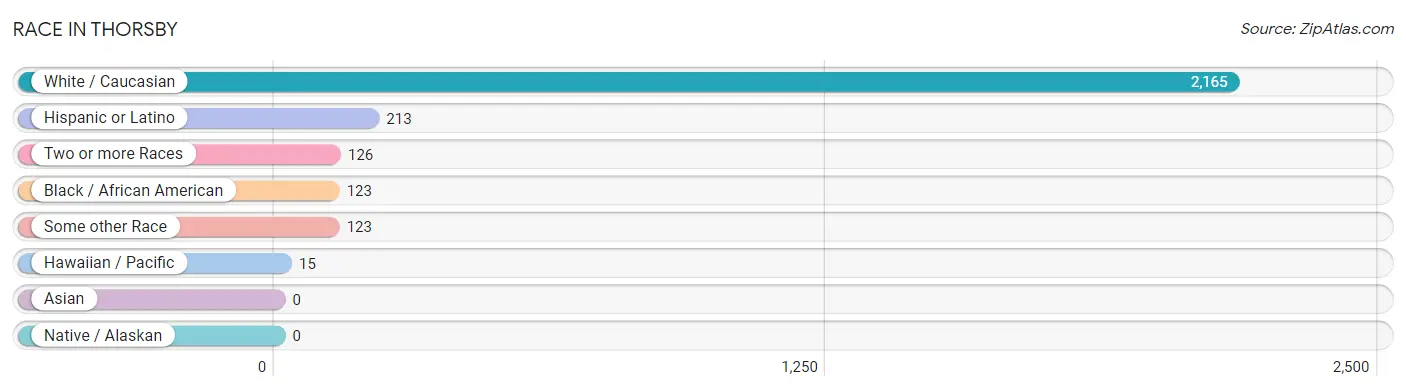
| Race | # Population | % Population |
| Asian | 0 | 0.0% |
| Black / African American | 123 | 4.8% |
| Hawaiian / Pacific | 15 | 0.6% |
| Hispanic or Latino | 213 | 8.4% |
| Native / Alaskan | 0 | 0.0% |
| White / Caucasian | 2,165 | 84.8% |
| Two or more Races | 126 | 4.9% |
| Some other Race | 123 | 4.8% |
| Total | 2,552 | 100.0% |
Ancestry in Thorsby
The most populous ancestries reported in Thorsby are English (254 | 10.0%), American (159 | 6.2%), Mexican (155 | 6.1%), German (139 | 5.4%), and European (131 | 5.1%), together accounting for 32.8% of all Thorsby residents.
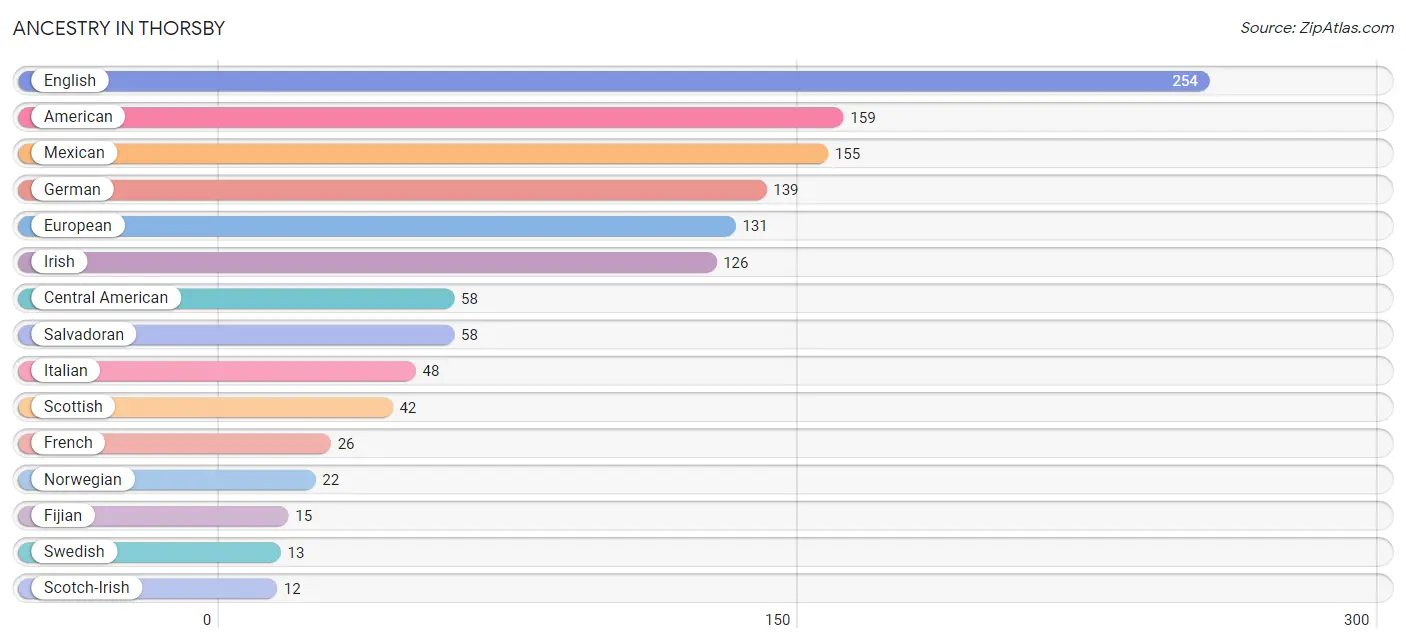
| Ancestry | # Population | % Population |
| American | 159 | 6.2% |
| Arab | 6 | 0.2% |
| British | 8 | 0.3% |
| Central American | 58 | 2.3% |
| English | 254 | 10.0% |
| European | 131 | 5.1% |
| Fijian | 15 | 0.6% |
| French | 26 | 1.0% |
| French Canadian | 3 | 0.1% |
| German | 139 | 5.4% |
| Irish | 126 | 4.9% |
| Italian | 48 | 1.9% |
| Lebanese | 6 | 0.2% |
| Lithuanian | 2 | 0.1% |
| Mexican | 155 | 6.1% |
| Norwegian | 22 | 0.9% |
| Polish | 9 | 0.4% |
| Russian | 5 | 0.2% |
| Salvadoran | 58 | 2.3% |
| Scotch-Irish | 12 | 0.5% |
| Scottish | 42 | 1.7% |
| Slovak | 2 | 0.1% |
| Swedish | 13 | 0.5% | View All 23 Rows |
Immigrants in Thorsby
The most numerous immigrant groups reported in Thorsby came from Central America (36 | 1.4%), Latin America (36 | 1.4%), Mexico (34 | 1.3%), England (14 | 0.5%), and Europe (14 | 0.5%), together accounting for 5.2% of all Thorsby residents.
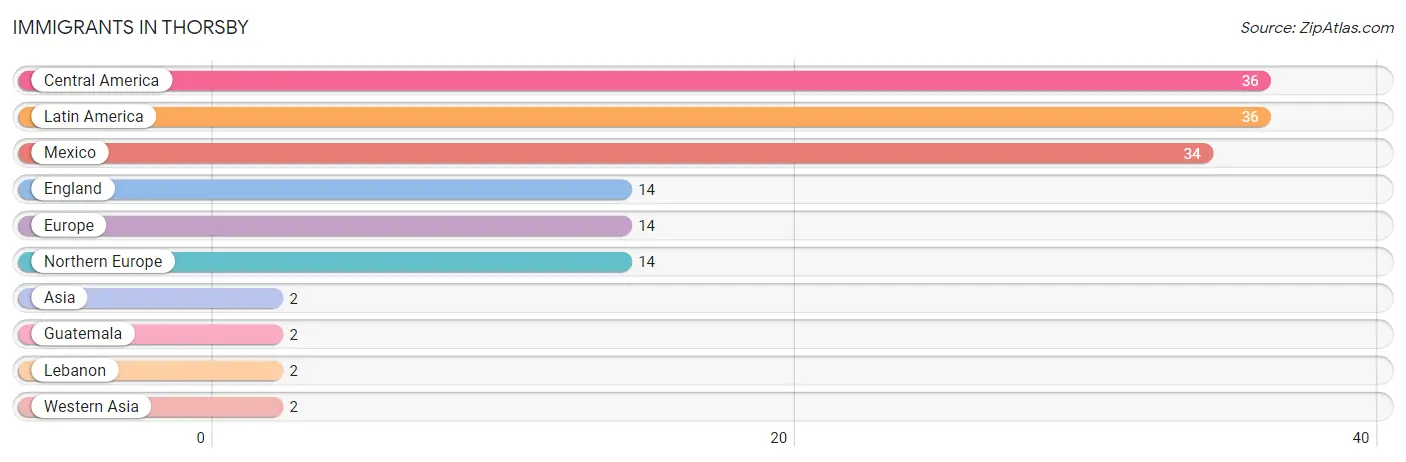
| Immigration Origin | # Population | % Population |
| Asia | 2 | 0.1% |
| Central America | 36 | 1.4% |
| England | 14 | 0.5% |
| Europe | 14 | 0.5% |
| Guatemala | 2 | 0.1% |
| Latin America | 36 | 1.4% |
| Lebanon | 2 | 0.1% |
| Mexico | 34 | 1.3% |
| Northern Europe | 14 | 0.5% |
| Western Asia | 2 | 0.1% | View All 10 Rows |
Sex and Age in Thorsby
Sex and Age in Thorsby
The most populous age groups in Thorsby are 35 to 39 Years (222 | 17.9%) for men and 35 to 39 Years (192 | 14.6%) for women.
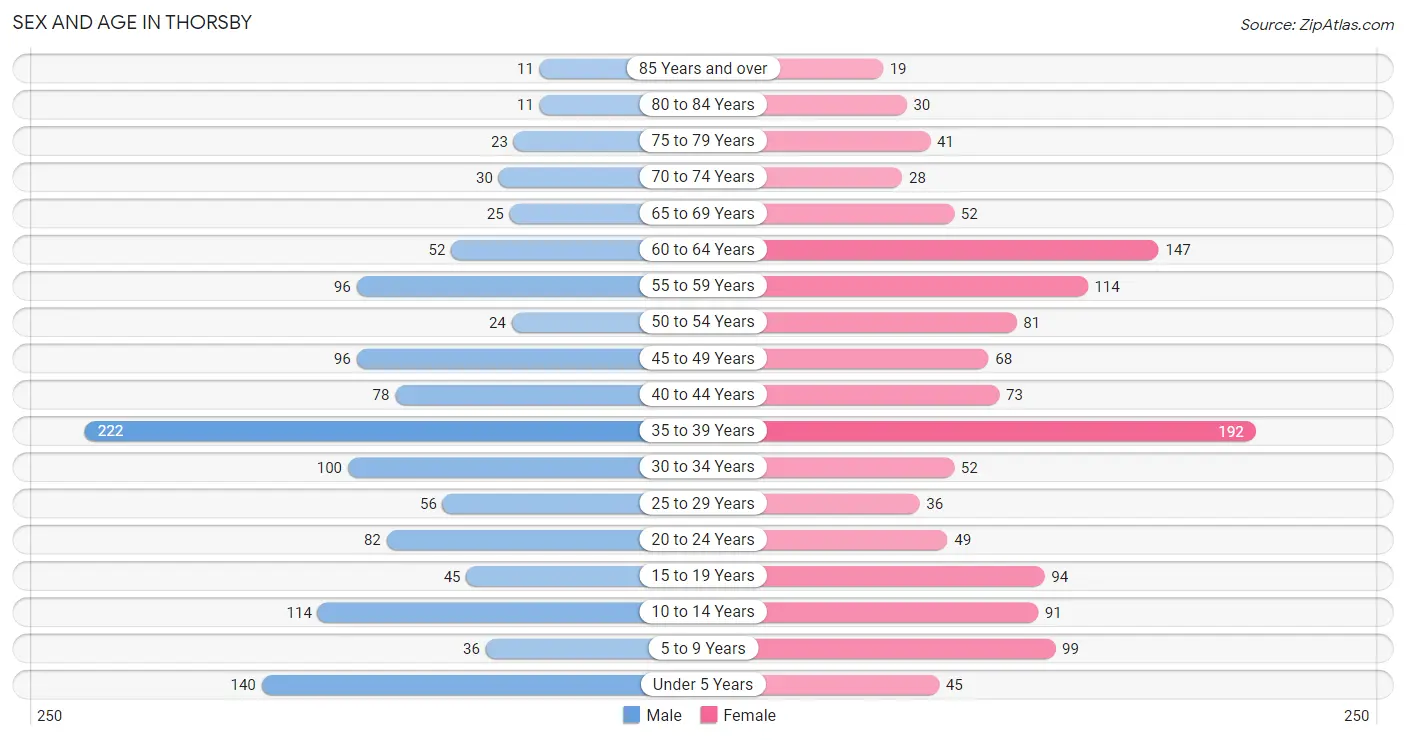
| Age Bracket | Male | Female |
| Under 5 Years | 140 (11.3%) | 45 (3.4%) |
| 5 to 9 Years | 36 (2.9%) | 99 (7.5%) |
| 10 to 14 Years | 114 (9.2%) | 91 (6.9%) |
| 15 to 19 Years | 45 (3.6%) | 94 (7.2%) |
| 20 to 24 Years | 82 (6.6%) | 49 (3.7%) |
| 25 to 29 Years | 56 (4.5%) | 36 (2.8%) |
| 30 to 34 Years | 100 (8.1%) | 52 (4.0%) |
| 35 to 39 Years | 222 (17.9%) | 192 (14.6%) |
| 40 to 44 Years | 78 (6.3%) | 73 (5.6%) |
| 45 to 49 Years | 96 (7.7%) | 68 (5.2%) |
| 50 to 54 Years | 24 (1.9%) | 81 (6.2%) |
| 55 to 59 Years | 96 (7.7%) | 114 (8.7%) |
| 60 to 64 Years | 52 (4.2%) | 147 (11.2%) |
| 65 to 69 Years | 25 (2.0%) | 52 (4.0%) |
| 70 to 74 Years | 30 (2.4%) | 28 (2.1%) |
| 75 to 79 Years | 23 (1.8%) | 41 (3.1%) |
| 80 to 84 Years | 11 (0.9%) | 30 (2.3%) |
| 85 Years and over | 11 (0.9%) | 19 (1.5%) |
| Total | 1,241 (100.0%) | 1,311 (100.0%) |
Families and Households in Thorsby
Median Family Size in Thorsby
The median family size in Thorsby is 3.53 persons per family, with single female/mother families (159 | 24.6%) accounting for the largest median family size of 3.65 persons per family. On the other hand, married-couple families (431 | 66.7%) represent the smallest median family size with 3.49 persons per family.
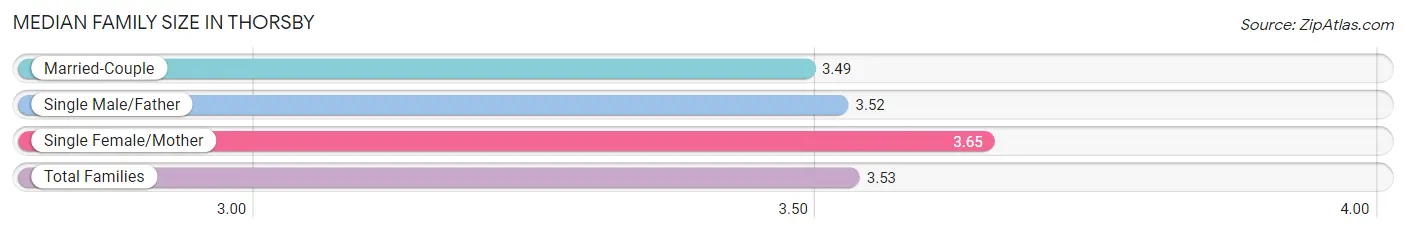
| Family Type | # Families | Family Size |
| Married-Couple | 431 (66.7%) | 3.49 |
| Single Male/Father | 56 (8.7%) | 3.52 |
| Single Female/Mother | 159 (24.6%) | 3.65 |
| Total Families | 646 (100.0%) | 3.53 |
Median Household Size in Thorsby
The median household size in Thorsby is 3.12 persons per household, with single male/father households (56 | 6.9%) accounting for the largest median household size of 4.04 persons per household. non-family households (171 | 20.9%) represent the smallest median household size with 1.26 persons per household.
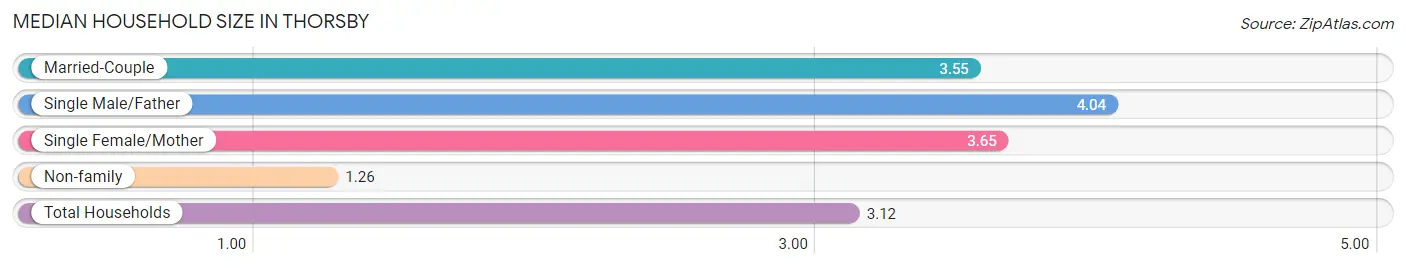
| Household Type | # Households | Household Size |
| Married-Couple | 431 (52.7%) | 3.55 |
| Single Male/Father | 56 (6.9%) | 4.04 |
| Single Female/Mother | 159 (19.5%) | 3.65 |
| Non-family | 171 (20.9%) | 1.26 |
| Total Households | 817 (100.0%) | 3.12 |
Household Size by Marriage Status in Thorsby
Out of a total of 817 households in Thorsby, 646 (79.1%) are family households, while 171 (20.9%) are nonfamily households. The most numerous type of family households are 3-person households, comprising 272, and the most common type of nonfamily households are 1-person households, comprising 154.
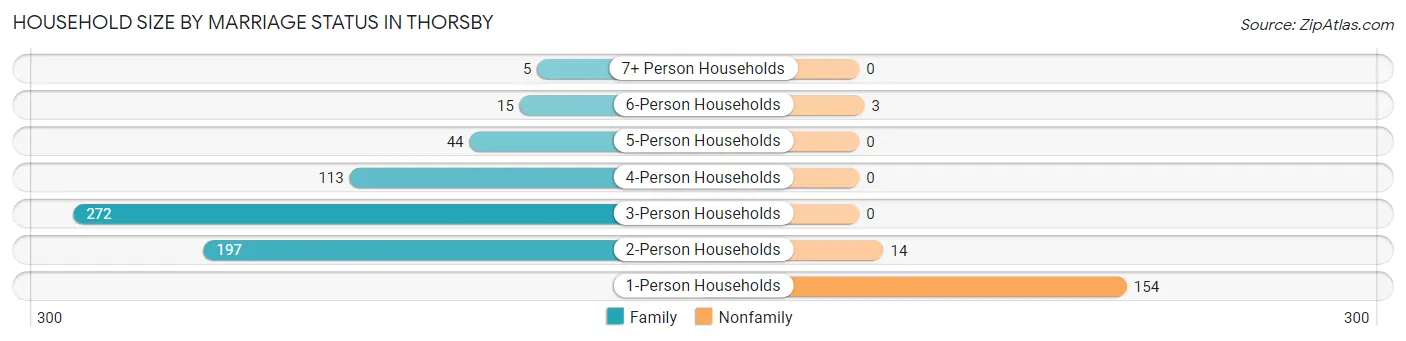
| Household Size | Family Households | Nonfamily Households |
| 1-Person Households | - | 154 (18.9%) |
| 2-Person Households | 197 (24.1%) | 14 (1.7%) |
| 3-Person Households | 272 (33.3%) | 0 (0.0%) |
| 4-Person Households | 113 (13.8%) | 0 (0.0%) |
| 5-Person Households | 44 (5.4%) | 0 (0.0%) |
| 6-Person Households | 15 (1.8%) | 3 (0.4%) |
| 7+ Person Households | 5 (0.6%) | 0 (0.0%) |
| Total | 646 (79.1%) | 171 (20.9%) |
Female Fertility in Thorsby
Fertility by Age in Thorsby
Average fertility rate in Thorsby is 47.0 births per 1,000 women. Women in the age bracket of 20 to 34 years have the highest fertility rate with 197.0 births per 1,000 women. Women in the age bracket of 20 to 34 years acount for 100.0% of all women with births.
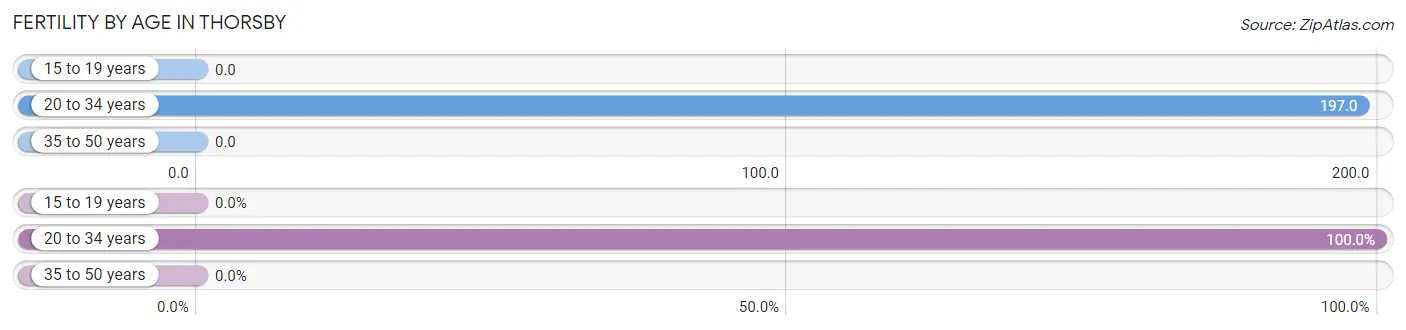
| Age Bracket | Women with Births | Births / 1,000 Women |
| 15 to 19 years | 0 (0.0%) | 0.0 |
| 20 to 34 years | 27 (100.0%) | 197.0 |
| 35 to 50 years | 0 (0.0%) | 0.0 |
| Total | 27 (100.0%) | 47.0 |
Fertility by Age by Marriage Status in Thorsby
81.5% of women with births (27) in Thorsby are married. The highest percentage of unmarried women with births falls into 20 to 34 years age bracket with 18.5% of them unmarried at the time of birth, while the lowest percentage of unmarried women with births belong to 20 to 34 years age bracket with 18.5% of them unmarried.
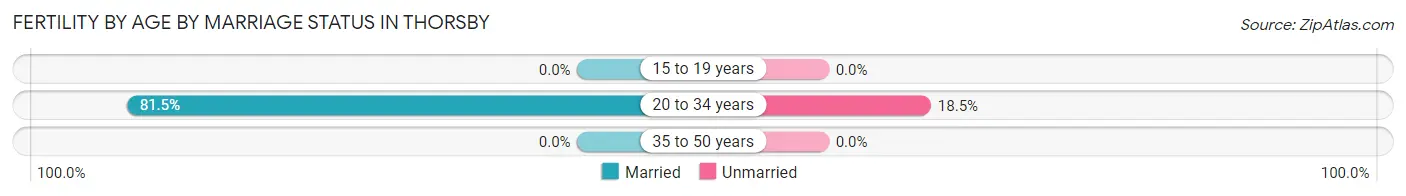
| Age Bracket | Married | Unmarried |
| 15 to 19 years | 0 (0.0%) | 0 (0.0%) |
| 20 to 34 years | 22 (81.5%) | 5 (18.5%) |
| 35 to 50 years | 0 (0.0%) | 0 (0.0%) |
| Total | 22 (81.5%) | 5 (18.5%) |
Fertility by Education in Thorsby
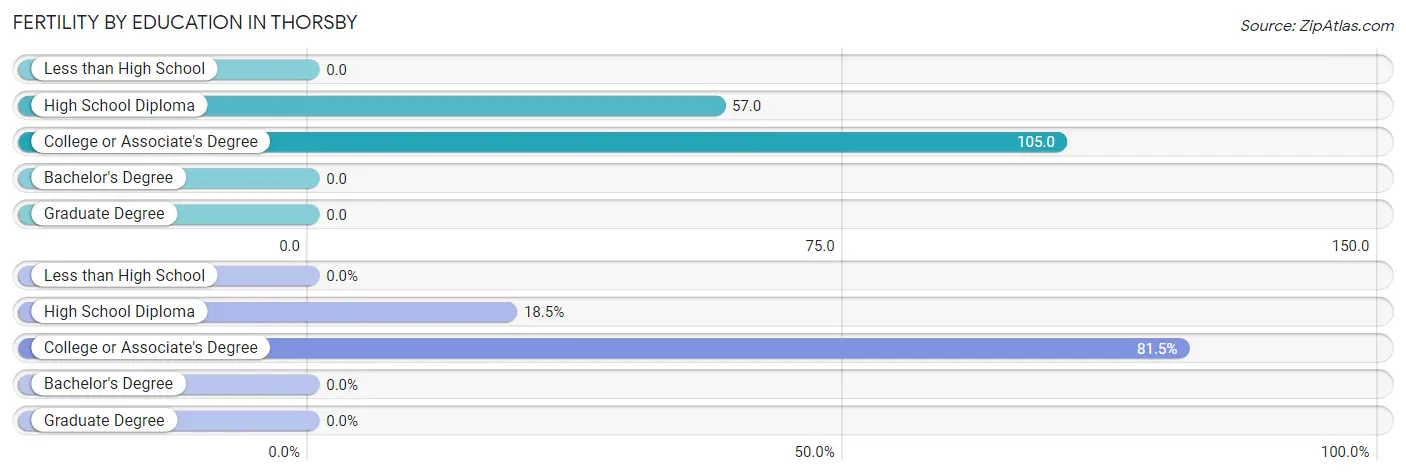
| Educational Attainment | Women with Births | Births / 1,000 Women |
| Less than High School | 0 (0.0%) | 0.0 |
| High School Diploma | 5 (18.5%) | 57.0 |
| College or Associate's Degree | 22 (81.5%) | 105.0 |
| Bachelor's Degree | 0 (0.0%) | 0.0 |
| Graduate Degree | 0 (0.0%) | 0.0 |
| Total | 27 (100.0%) | 47.0 |
Fertility by Education by Marriage Status in Thorsby
18.5% of women with births in Thorsby are unmarried. Women with the educational attainment of college or associate's degree are most likely to be married with 100.0% of them married at childbirth, while women with the educational attainment of high school diploma are least likely to be married with 100.0% of them unmarried at childbirth.
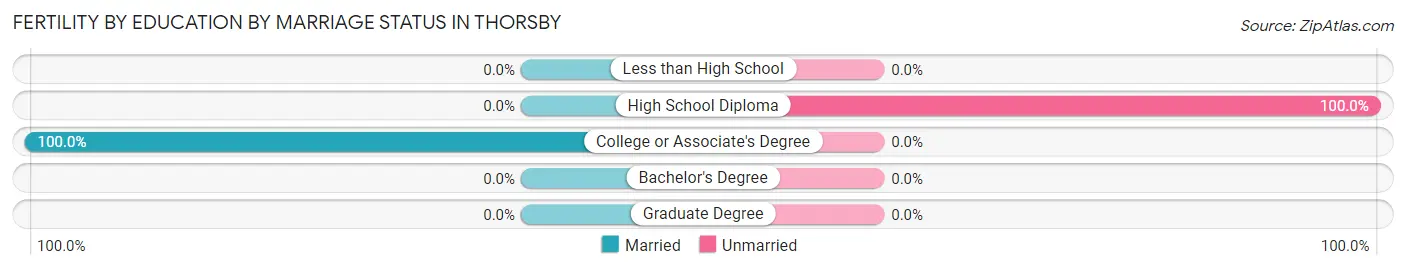
| Educational Attainment | Married | Unmarried |
| Less than High School | 0 (0.0%) | 0 (0.0%) |
| High School Diploma | 0 (0.0%) | 5 (100.0%) |
| College or Associate's Degree | 22 (100.0%) | 0 (0.0%) |
| Bachelor's Degree | 0 (0.0%) | 0 (0.0%) |
| Graduate Degree | 0 (0.0%) | 0 (0.0%) |
| Total | 22 (81.5%) | 5 (18.5%) |
Income in Thorsby
Income Overview in Thorsby
Per Capita Income in Thorsby is $26,348, while median incomes of families and households are $80,338 and $72,188 respectively.
| Characteristic | Number | Measure |
| Per Capita Income | 2,552 | $26,348 |
| Median Family Income | 646 | $80,338 |
| Mean Family Income | 646 | $84,268 |
| Median Household Income | 817 | $72,188 |
| Mean Household Income | 817 | $76,807 |
| Income Deficit | 646 | $0 |
| Wage / Income Gap (%) | 2,552 | 52.68% |
| Wage / Income Gap ($) | 2,552 | 47.32¢ per $1 |
| Gini / Inequality Index | 2,552 | 0.37 |
Earnings by Sex in Thorsby
Average Earnings in Thorsby are $40,991, $56,055 for men and $26,528 for women, a difference of 52.7%.
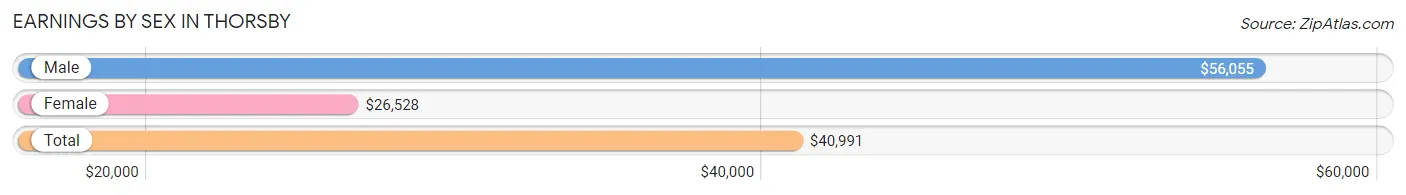
| Sex | Number | Average Earnings |
| Male | 605 (55.3%) | $56,055 |
| Female | 489 (44.7%) | $26,528 |
| Total | 1,094 (100.0%) | $40,991 |
Earnings by Sex by Income Bracket in Thorsby
The most common earnings brackets in Thorsby are $75,000 to $99,999 for men (89 | 14.7%) and $2,499 or less for women (94 | 19.2%).
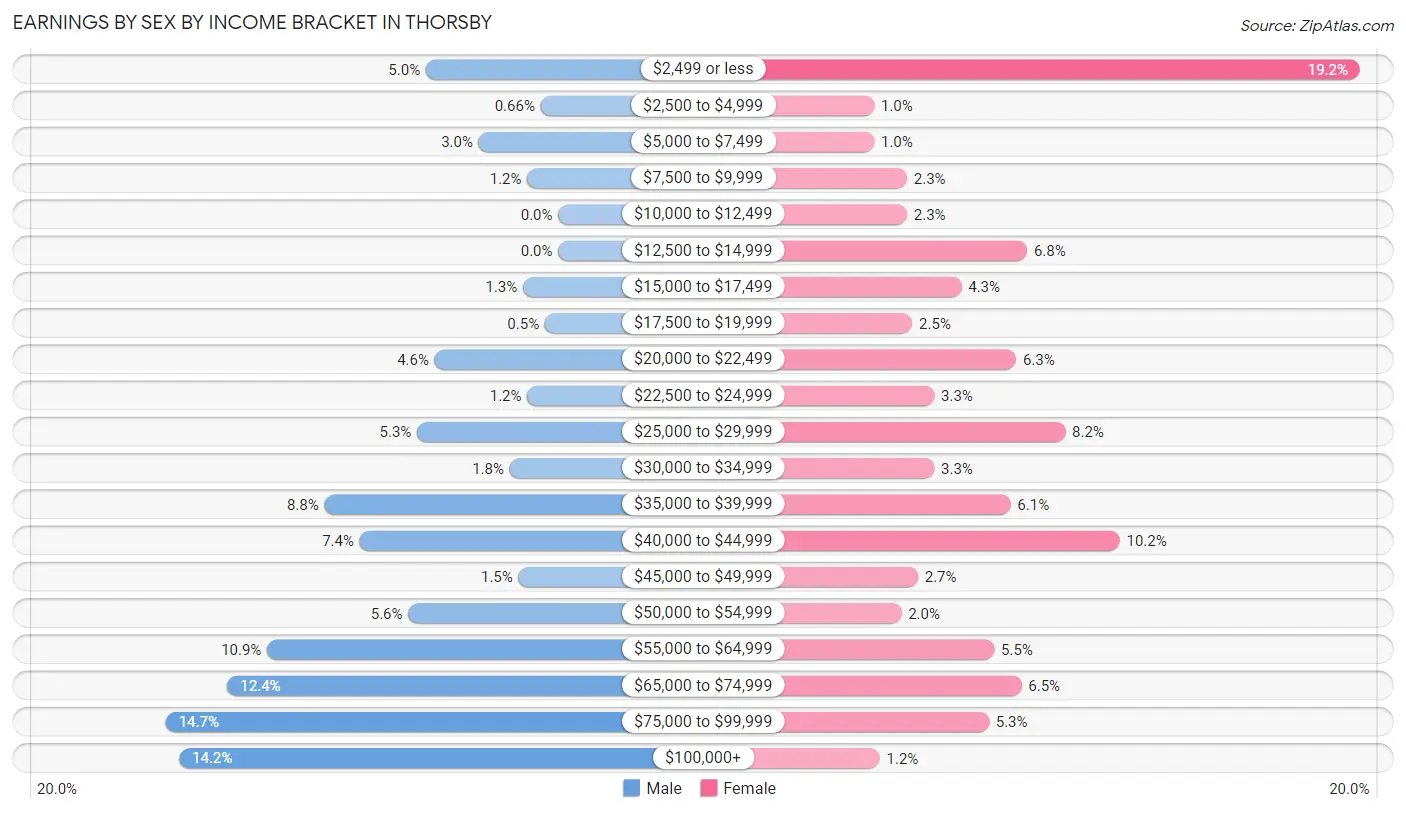
| Income | Male | Female |
| $2,499 or less | 30 (5.0%) | 94 (19.2%) |
| $2,500 to $4,999 | 4 (0.7%) | 5 (1.0%) |
| $5,000 to $7,499 | 18 (3.0%) | 5 (1.0%) |
| $7,500 to $9,999 | 7 (1.2%) | 11 (2.2%) |
| $10,000 to $12,499 | 0 (0.0%) | 11 (2.2%) |
| $12,500 to $14,999 | 0 (0.0%) | 33 (6.8%) |
| $15,000 to $17,499 | 8 (1.3%) | 21 (4.3%) |
| $17,500 to $19,999 | 3 (0.5%) | 12 (2.5%) |
| $20,000 to $22,499 | 28 (4.6%) | 31 (6.3%) |
| $22,500 to $24,999 | 7 (1.2%) | 16 (3.3%) |
| $25,000 to $29,999 | 32 (5.3%) | 40 (8.2%) |
| $30,000 to $34,999 | 11 (1.8%) | 16 (3.3%) |
| $35,000 to $39,999 | 53 (8.8%) | 30 (6.1%) |
| $40,000 to $44,999 | 45 (7.4%) | 50 (10.2%) |
| $45,000 to $49,999 | 9 (1.5%) | 13 (2.7%) |
| $50,000 to $54,999 | 34 (5.6%) | 10 (2.0%) |
| $55,000 to $64,999 | 66 (10.9%) | 27 (5.5%) |
| $65,000 to $74,999 | 75 (12.4%) | 32 (6.5%) |
| $75,000 to $99,999 | 89 (14.7%) | 26 (5.3%) |
| $100,000+ | 86 (14.2%) | 6 (1.2%) |
| Total | 605 (100.0%) | 489 (100.0%) |
Earnings by Sex by Educational Attainment in Thorsby
Average earnings in Thorsby are $64,107 for men and $27,702 for women, a difference of 56.8%. Men with an educational attainment of bachelor's degree enjoy the highest average annual earnings of $103,846, while those with college or associate's degree education earn the least with $57,500. Women with an educational attainment of less than high school earn the most with the average annual earnings of $36,875, while those with high school diploma education have the smallest earnings of $27,702.
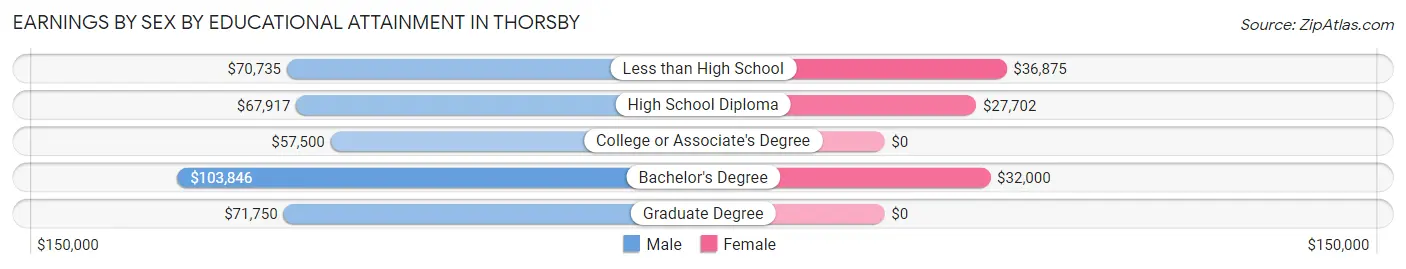
| Educational Attainment | Male Income | Female Income |
| Less than High School | $70,735 | $36,875 |
| High School Diploma | $67,917 | $27,702 |
| College or Associate's Degree | $57,500 | $0 |
| Bachelor's Degree | $103,846 | $32,000 |
| Graduate Degree | $71,750 | $0 |
| Total | $64,107 | $27,702 |
Family Income in Thorsby
Family Income Brackets in Thorsby
According to the Thorsby family income data, there are 139 families falling into the $75,000 to $99,999 income range, which is the most common income bracket and makes up 21.5% of all families.
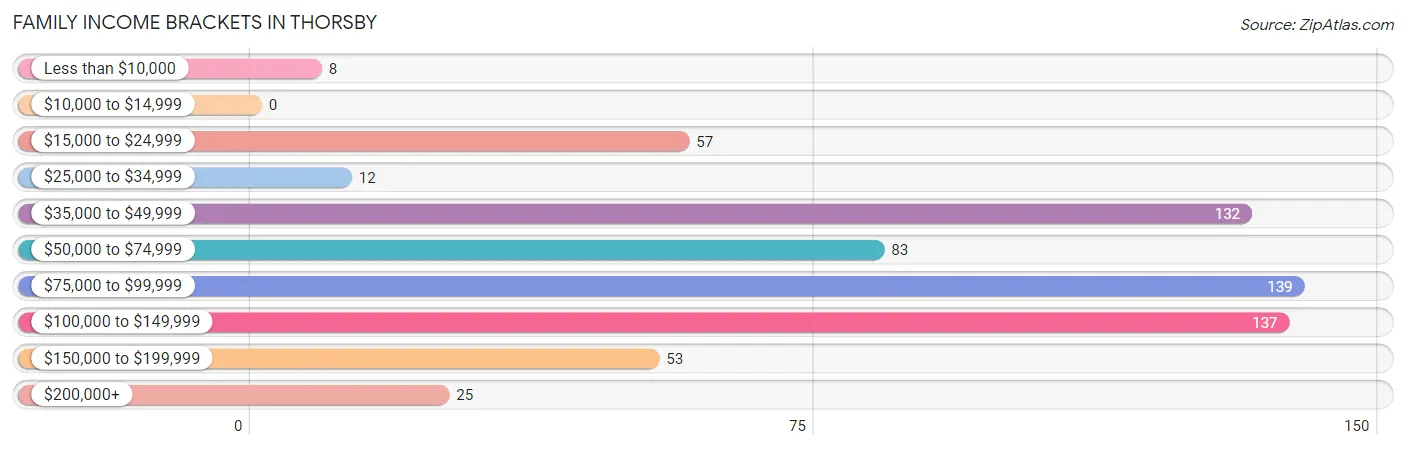
| Income Bracket | # Families | % Families |
| Less than $10,000 | 8 | 1.2% |
| $10,000 to $14,999 | 0 | 0.0% |
| $15,000 to $24,999 | 57 | 8.8% |
| $25,000 to $34,999 | 12 | 1.9% |
| $35,000 to $49,999 | 132 | 20.4% |
| $50,000 to $74,999 | 83 | 12.8% |
| $75,000 to $99,999 | 139 | 21.5% |
| $100,000 to $149,999 | 137 | 21.2% |
| $150,000 to $199,999 | 53 | 8.2% |
| $200,000+ | 25 | 3.9% |
Family Income by Famaliy Size in Thorsby
5-person families (33 | 5.1%) account for the highest median family income in Thorsby with $147,768 per family, while 2-person families (220 | 34.1%) have the highest median income of $35,446 per family member.
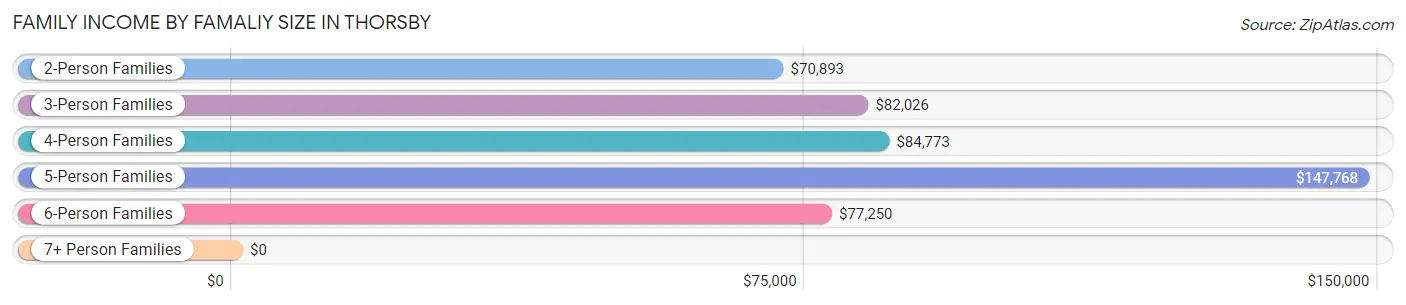
| Income Bracket | # Families | Median Income |
| 2-Person Families | 220 (34.1%) | $70,893 |
| 3-Person Families | 253 (39.2%) | $82,026 |
| 4-Person Families | 120 (18.6%) | $84,773 |
| 5-Person Families | 33 (5.1%) | $147,768 |
| 6-Person Families | 15 (2.3%) | $77,250 |
| 7+ Person Families | 5 (0.8%) | $0 |
| Total | 646 (100.0%) | $80,338 |
Family Income by Number of Earners in Thorsby
The median family income in Thorsby is $80,338, with families comprising 3+ earners (29) having the highest median family income of $185,156, while families with no earners (158) have the lowest median family income of $40,975, accounting for 4.5% and 24.5% of families, respectively.
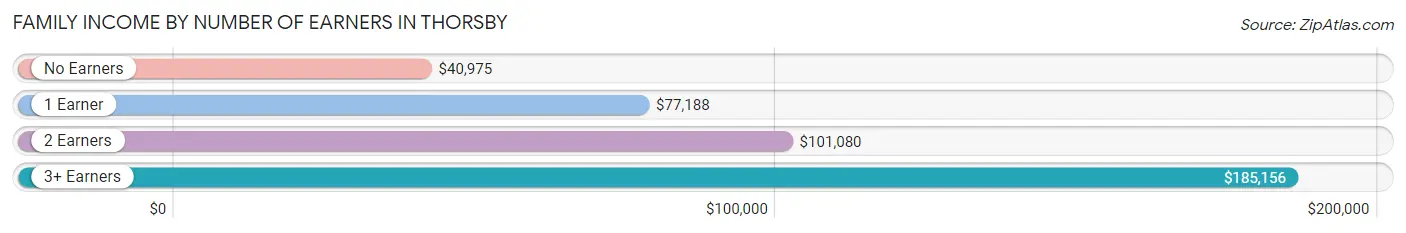
| Number of Earners | # Families | Median Income |
| No Earners | 158 (24.5%) | $40,975 |
| 1 Earner | 161 (24.9%) | $77,188 |
| 2 Earners | 298 (46.1%) | $101,080 |
| 3+ Earners | 29 (4.5%) | $185,156 |
| Total | 646 (100.0%) | $80,338 |
Household Income in Thorsby
Household Income Brackets in Thorsby
With 166 households falling in the category, the $100,000 to $149,999 income range is the most frequent in Thorsby, accounting for 20.3% of all households. In contrast, only 23 households (2.8%) fall into the less than $10,000 income bracket, making it the least populous group.
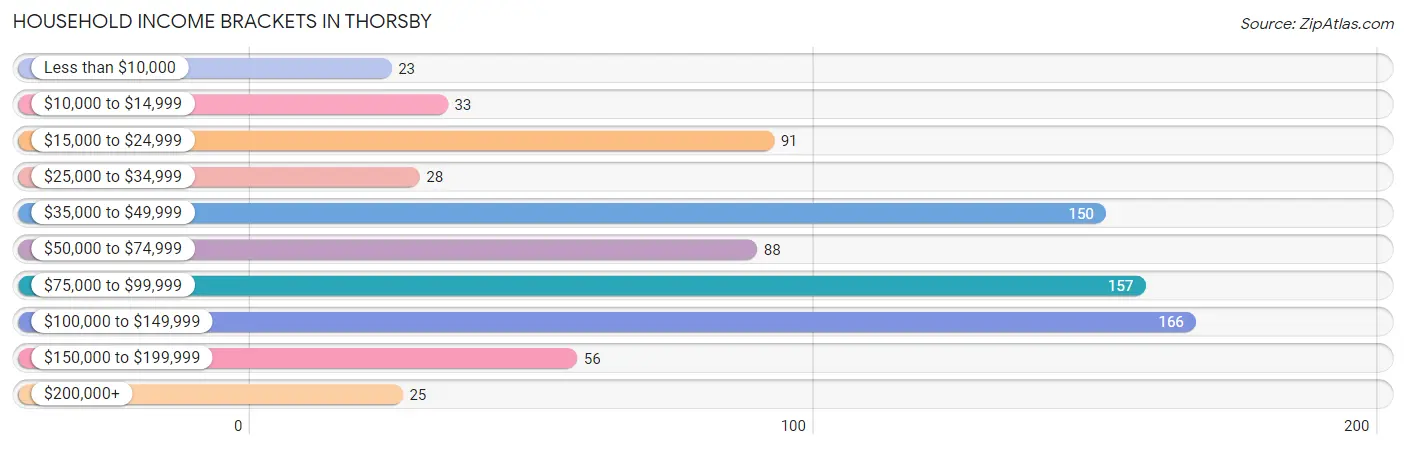
| Income Bracket | # Households | % Households |
| Less than $10,000 | 23 | 2.8% |
| $10,000 to $14,999 | 33 | 4.0% |
| $15,000 to $24,999 | 91 | 11.1% |
| $25,000 to $34,999 | 28 | 3.4% |
| $35,000 to $49,999 | 150 | 18.4% |
| $50,000 to $74,999 | 88 | 10.8% |
| $75,000 to $99,999 | 157 | 19.2% |
| $100,000 to $149,999 | 166 | 20.3% |
| $150,000 to $199,999 | 56 | 6.9% |
| $200,000+ | 25 | 3.1% |
Household Income by Householder Age in Thorsby
The median household income in Thorsby is $72,188, with the highest median household income of $100,793 found in the 25 to 44 years age bracket for the primary householder. A total of 238 households (29.1%) fall into this category. Meanwhile, the 65+ years age bracket for the primary householder has the lowest median household income of $40,833, with 176 households (21.5%) in this group.
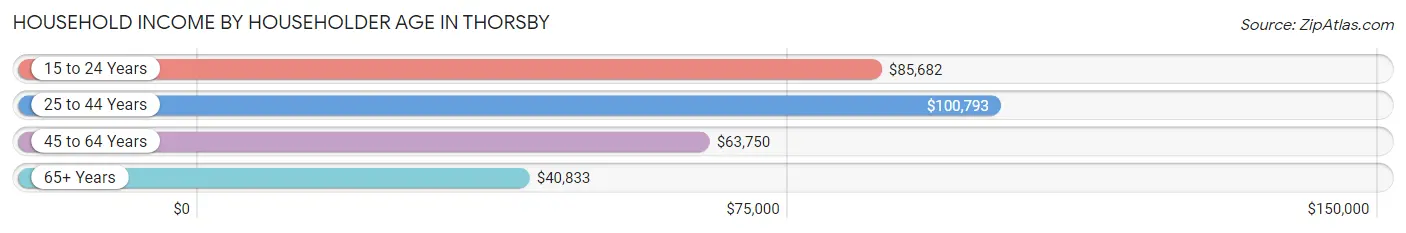
| Income Bracket | # Households | Median Income |
| 15 to 24 Years | 16 (2.0%) | $85,682 |
| 25 to 44 Years | 238 (29.1%) | $100,793 |
| 45 to 64 Years | 387 (47.4%) | $63,750 |
| 65+ Years | 176 (21.5%) | $40,833 |
| Total | 817 (100.0%) | $72,188 |
Poverty in Thorsby
Income Below Poverty by Sex and Age in Thorsby
With 9.8% poverty level for males and 13.4% for females among the residents of Thorsby, 5 year old males and 15 year old females are the most vulnerable to poverty, with 6 males (50.0%) and 19 females (70.4%) in their respective age groups living below the poverty level.
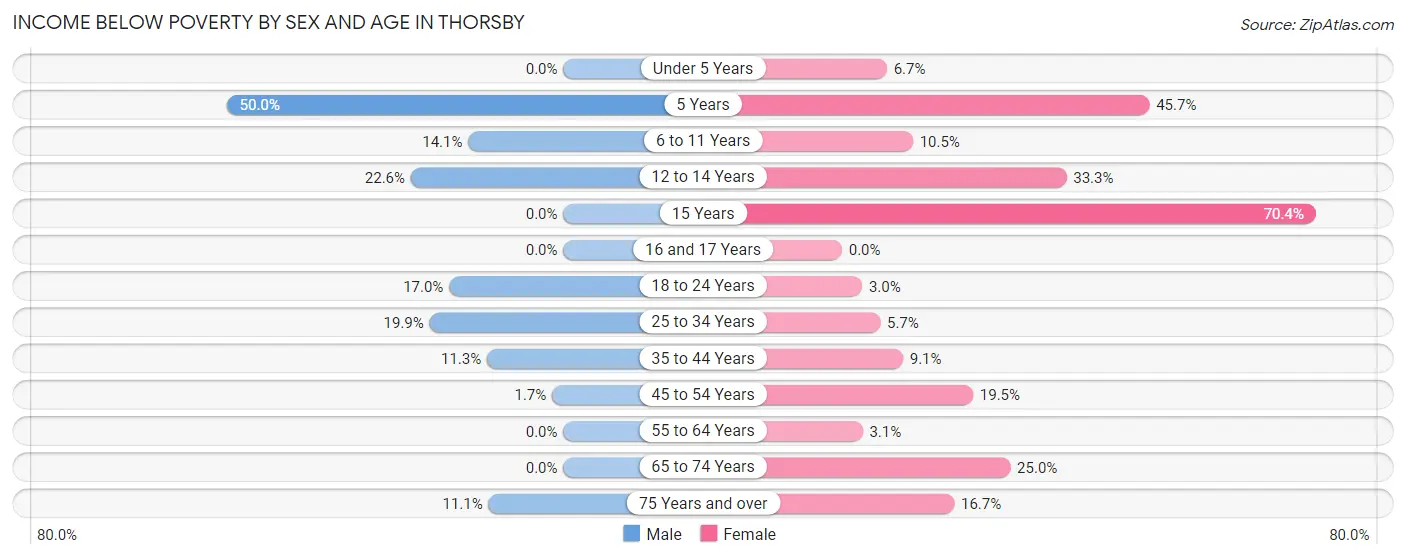
| Age Bracket | Male | Female |
| Under 5 Years | 0 (0.0%) | 3 (6.7%) |
| 5 Years | 6 (50.0%) | 21 (45.7%) |
| 6 to 11 Years | 12 (14.1%) | 8 (10.5%) |
| 12 to 14 Years | 12 (22.6%) | 19 (33.3%) |
| 15 Years | 0 (0.0%) | 19 (70.4%) |
| 16 and 17 Years | 0 (0.0%) | 0 (0.0%) |
| 18 to 24 Years | 20 (17.0%) | 3 (3.0%) |
| 25 to 34 Years | 31 (19.9%) | 5 (5.7%) |
| 35 to 44 Years | 34 (11.3%) | 24 (9.1%) |
| 45 to 54 Years | 2 (1.7%) | 29 (19.5%) |
| 55 to 64 Years | 0 (0.0%) | 8 (3.1%) |
| 65 to 74 Years | 0 (0.0%) | 20 (25.0%) |
| 75 Years and over | 5 (11.1%) | 15 (16.7%) |
| Total | 122 (9.8%) | 174 (13.4%) |
Income Above Poverty by Sex and Age in Thorsby
According to the poverty statistics in Thorsby, males aged under 5 years and females aged 16 and 17 years are the age groups that are most secure financially, with 100.0% of males and 100.0% of females in these age groups living above the poverty line.
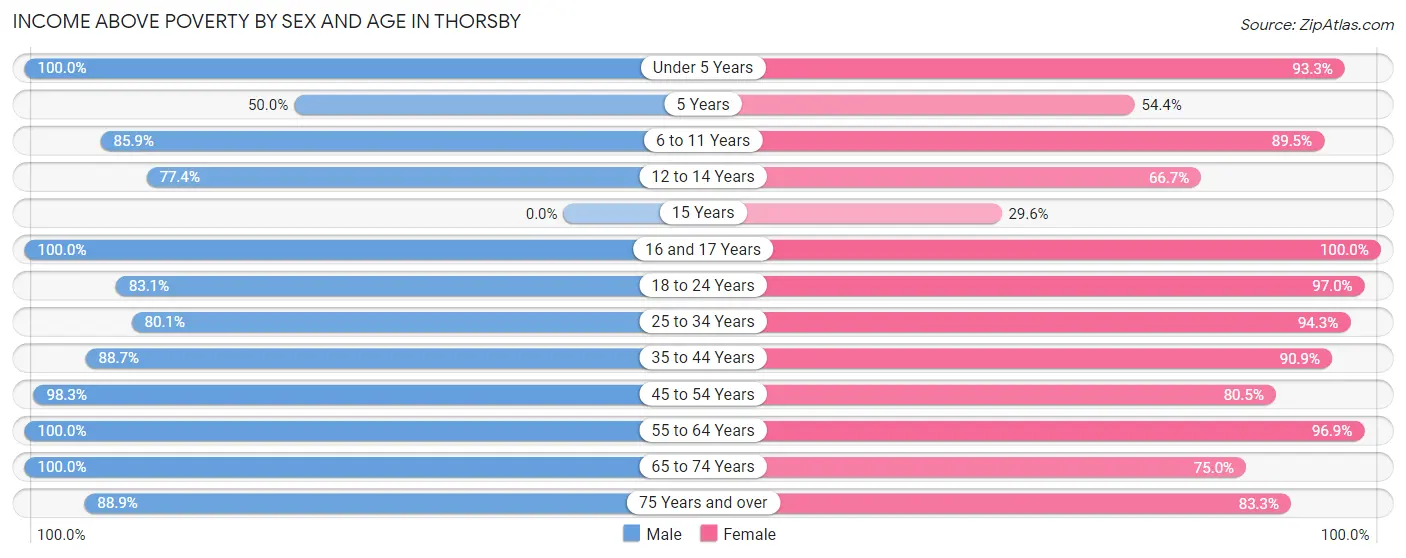
| Age Bracket | Male | Female |
| Under 5 Years | 140 (100.0%) | 42 (93.3%) |
| 5 Years | 6 (50.0%) | 25 (54.3%) |
| 6 to 11 Years | 73 (85.9%) | 68 (89.5%) |
| 12 to 14 Years | 41 (77.4%) | 38 (66.7%) |
| 15 Years | 0 (0.0%) | 8 (29.6%) |
| 16 and 17 Years | 9 (100.0%) | 16 (100.0%) |
| 18 to 24 Years | 98 (83.1%) | 97 (97.0%) |
| 25 to 34 Years | 125 (80.1%) | 83 (94.3%) |
| 35 to 44 Years | 266 (88.7%) | 241 (90.9%) |
| 45 to 54 Years | 118 (98.3%) | 120 (80.5%) |
| 55 to 64 Years | 148 (100.0%) | 253 (96.9%) |
| 65 to 74 Years | 55 (100.0%) | 60 (75.0%) |
| 75 Years and over | 40 (88.9%) | 75 (83.3%) |
| Total | 1,119 (90.2%) | 1,126 (86.6%) |
Income Below Poverty Among Married-Couple Families in Thorsby
The poverty statistics for married-couple families in Thorsby show that 4.4% or 19 of the total 431 families live below the poverty line. Families with 5 or more children have the highest poverty rate of 100.0%, comprising of 5 families. On the other hand, families with no children have the lowest poverty rate of 1.2%, which includes 3 families.
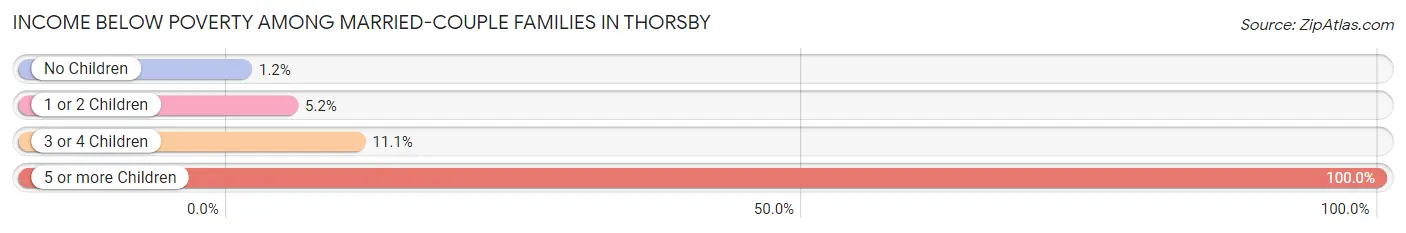
| Children | Above Poverty | Below Poverty |
| No Children | 243 (98.8%) | 3 (1.2%) |
| 1 or 2 Children | 145 (94.8%) | 8 (5.2%) |
| 3 or 4 Children | 24 (88.9%) | 3 (11.1%) |
| 5 or more Children | 0 (0.0%) | 5 (100.0%) |
| Total | 412 (95.6%) | 19 (4.4%) |
Income Below Poverty Among Single-Parent Households in Thorsby
According to the poverty data in Thorsby, 44.6% or 25 single-father households and 11.9% or 19 single-mother households are living below the poverty line. Among single-father households, those with 1 or 2 children have the highest poverty rate, with 25 households (54.3%) experiencing poverty. Likewise, among single-mother households, those with 1 or 2 children have the highest poverty rate, with 19 households (100.0%) falling below the poverty line.
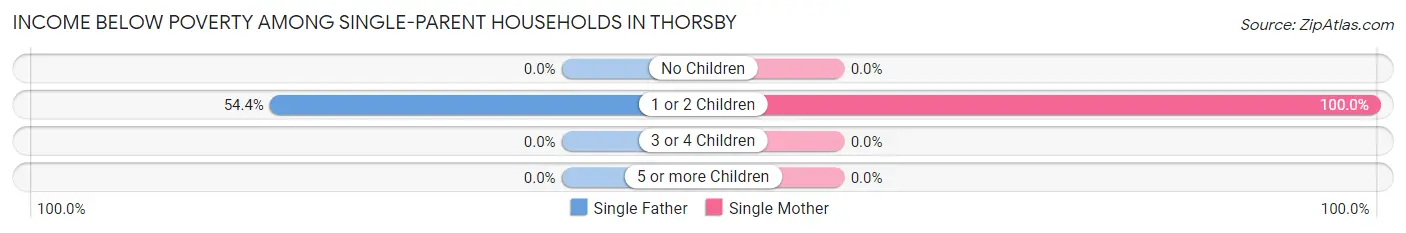
| Children | Single Father | Single Mother |
| No Children | 0 (0.0%) | 0 (0.0%) |
| 1 or 2 Children | 25 (54.3%) | 19 (100.0%) |
| 3 or 4 Children | 0 (0.0%) | 0 (0.0%) |
| 5 or more Children | 0 (0.0%) | 0 (0.0%) |
| Total | 25 (44.6%) | 19 (11.9%) |
Income Below Poverty Among Married-Couple vs Single-Parent Households in Thorsby
The poverty data for Thorsby shows that 19 of the married-couple family households (4.4%) and 44 of the single-parent households (20.5%) are living below the poverty level. Within the married-couple family households, those with 5 or more children have the highest poverty rate, with 5 households (100.0%) falling below the poverty line. Among the single-parent households, those with 1 or 2 children have the highest poverty rate, with 44 household (67.7%) living below poverty.
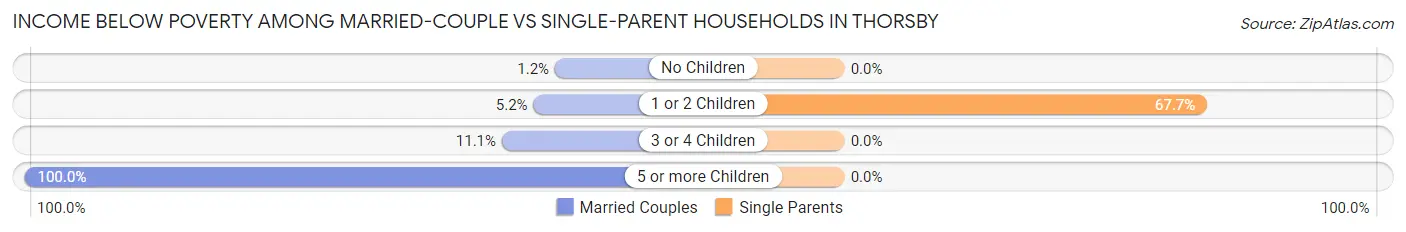
| Children | Married-Couple Families | Single-Parent Households |
| No Children | 3 (1.2%) | 0 (0.0%) |
| 1 or 2 Children | 8 (5.2%) | 44 (67.7%) |
| 3 or 4 Children | 3 (11.1%) | 0 (0.0%) |
| 5 or more Children | 5 (100.0%) | 0 (0.0%) |
| Total | 19 (4.4%) | 44 (20.5%) |
Employment Characteristics in Thorsby
Employment by Class of Employer in Thorsby
Among the 939 employed individuals in Thorsby, private company employees (601 | 64.0%), self-employed (not incorporated) (97 | 10.3%), and not-for-profit organizations (86 | 9.2%) make up the most common classes of employment.
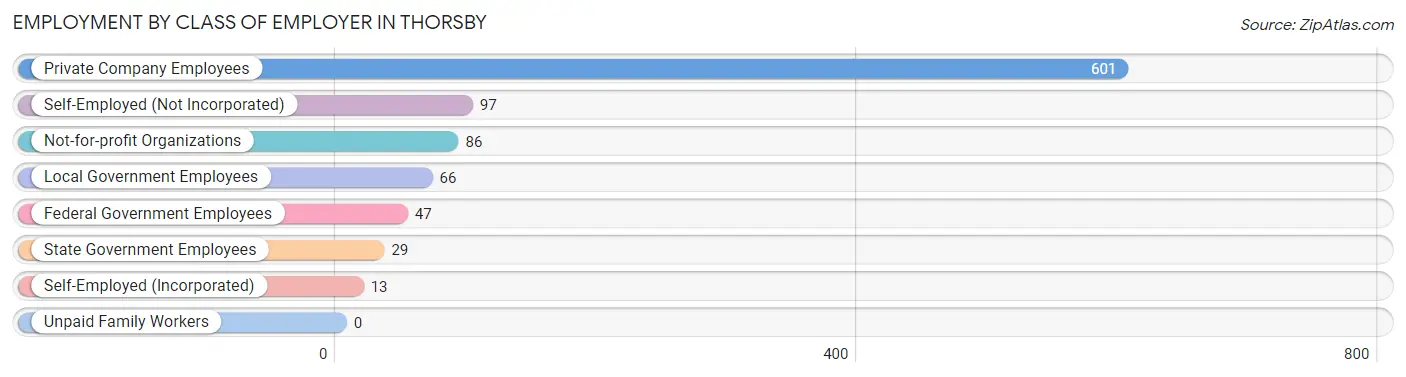
| Employer Class | # Employees | % Employees |
| Private Company Employees | 601 | 64.0% |
| Self-Employed (Incorporated) | 13 | 1.4% |
| Self-Employed (Not Incorporated) | 97 | 10.3% |
| Not-for-profit Organizations | 86 | 9.2% |
| Local Government Employees | 66 | 7.0% |
| State Government Employees | 29 | 3.1% |
| Federal Government Employees | 47 | 5.0% |
| Unpaid Family Workers | 0 | 0.0% |
| Total | 939 | 100.0% |
Employment Status by Age in Thorsby
According to the labor force statistics for Thorsby, out of the total population over 16 years of age (2,000), 51.1% or 1,022 individuals are in the labor force, with 5.3% or 54 of them unemployed. The age group with the highest labor force participation rate is 20 to 24 years, with 97.7% or 128 individuals in the labor force. Within the labor force, the 30 to 34 years age range has the highest percentage of unemployed individuals, with 20.7% or 23 of them being unemployed.
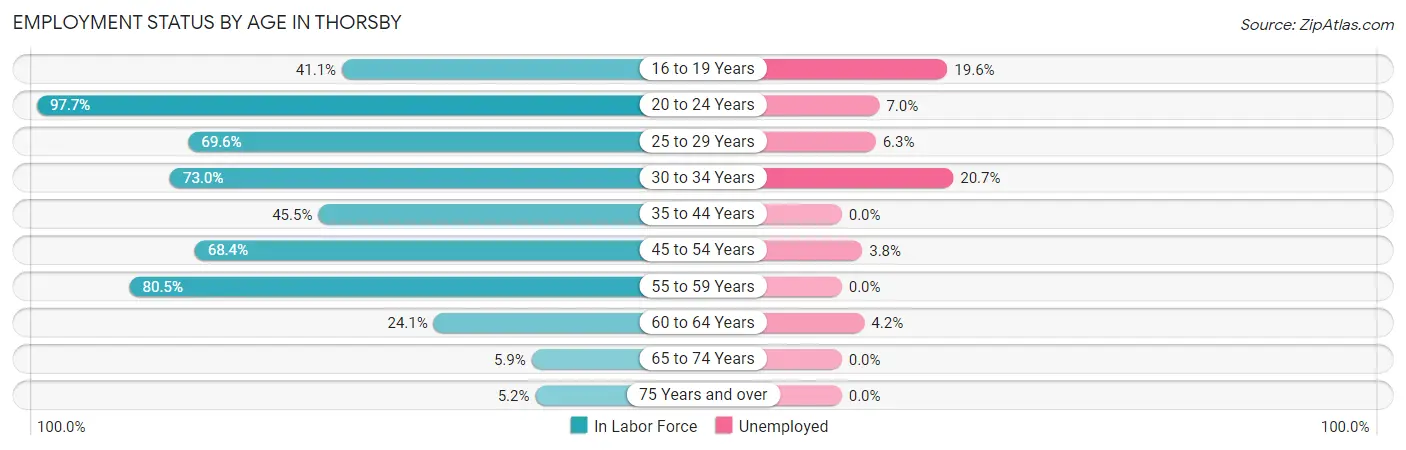
| Age Bracket | In Labor Force | Unemployed |
| 16 to 19 Years | 46 (41.1%) | 9 (19.6%) |
| 20 to 24 Years | 128 (97.7%) | 9 (7.0%) |
| 25 to 29 Years | 64 (69.6%) | 4 (6.3%) |
| 30 to 34 Years | 111 (73.0%) | 23 (20.7%) |
| 35 to 44 Years | 257 (45.5%) | 0 (0.0%) |
| 45 to 54 Years | 184 (68.4%) | 7 (3.8%) |
| 55 to 59 Years | 169 (80.5%) | 0 (0.0%) |
| 60 to 64 Years | 48 (24.1%) | 2 (4.2%) |
| 65 to 74 Years | 8 (5.9%) | 0 (0.0%) |
| 75 Years and over | 7 (5.2%) | 0 (0.0%) |
| Total | 1,022 (51.1%) | 54 (5.3%) |
Employment Status by Educational Attainment in Thorsby
According to labor force statistics for Thorsby, 56.0% of individuals (833) out of the total population between 25 and 64 years of age (1,487) are in the labor force, with 4.3% or 36 of them being unemployed. The group with the highest labor force participation rate are those with the educational attainment of bachelor's degree or higher, with 86.9% or 186 individuals in the labor force. Within the labor force, individuals with bachelor's degree or higher education have the highest percentage of unemployment, with 15.1% or 28 of them being unemployed.
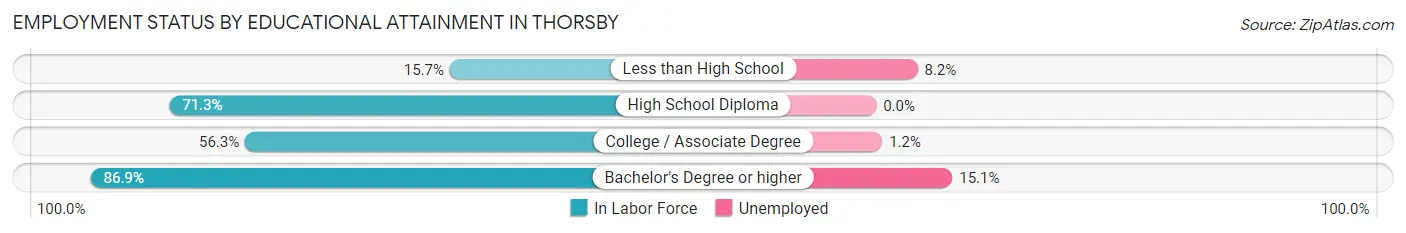
| Educational Attainment | In Labor Force | Unemployed |
| Less than High School | 49 (15.7%) | 26 (8.2%) |
| High School Diploma | 271 (71.3%) | 0 (0.0%) |
| College / Associate Degree | 327 (56.3%) | 7 (1.2%) |
| Bachelor's Degree or higher | 186 (86.9%) | 32 (15.1%) |
| Total | 833 (56.0%) | 64 (4.3%) |
Employment Occupations by Sex in Thorsby
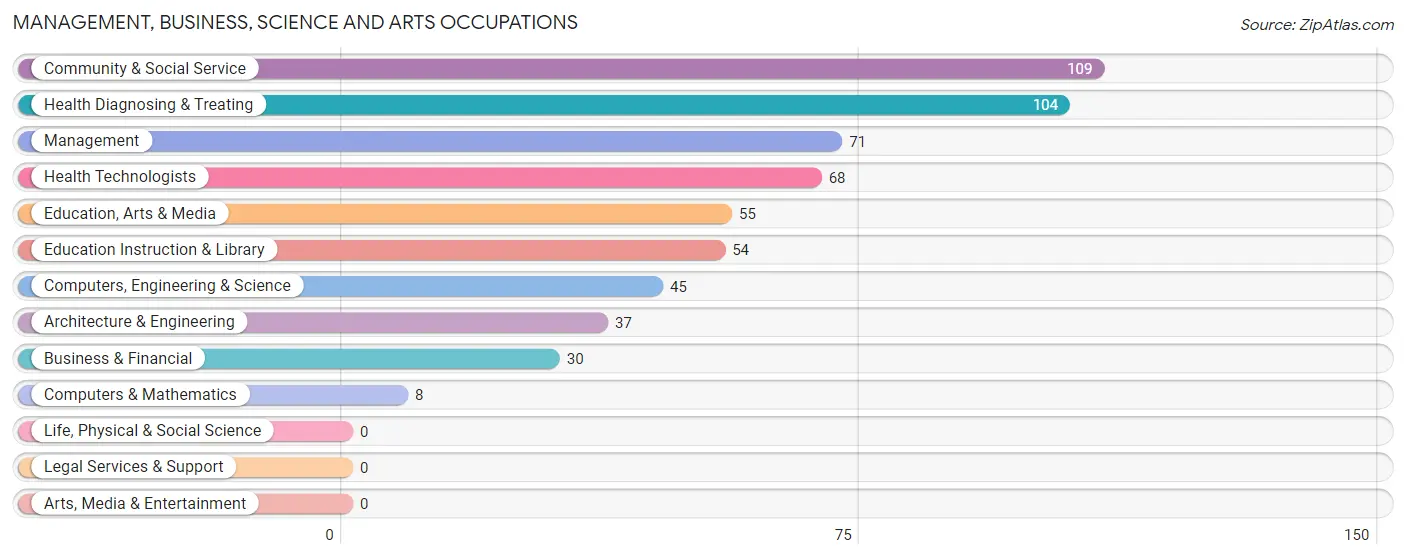
Management, Business, Science and Arts Occupations
The most common Management, Business, Science and Arts occupations in Thorsby are Community & Social Service (109 | 11.3%), Health Diagnosing & Treating (104 | 10.7%), Management (71 | 7.3%), Health Technologists (68 | 7.0%), and Education, Arts & Media (55 | 5.7%).
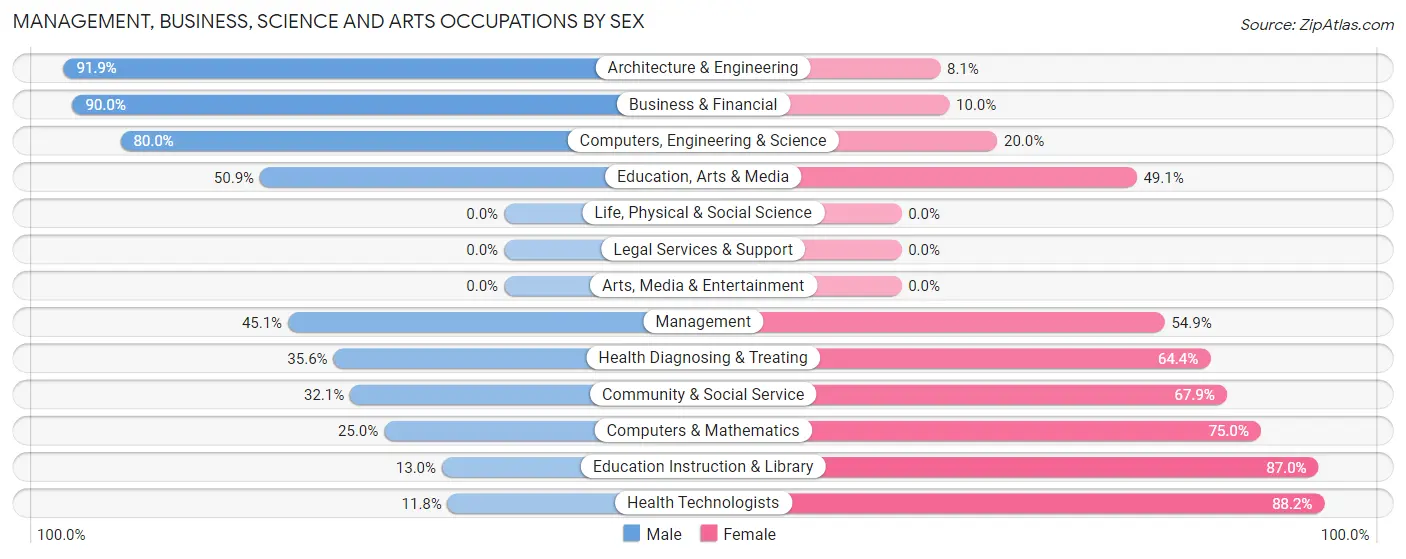
Management, Business, Science and Arts Occupations by Sex
Within the Management, Business, Science and Arts occupations in Thorsby, the most male-oriented occupations are Architecture & Engineering (91.9%), Business & Financial (90.0%), and Computers, Engineering & Science (80.0%), while the most female-oriented occupations are Health Technologists (88.2%), Education Instruction & Library (87.0%), and Computers & Mathematics (75.0%).
| Occupation | Male | Female |
| Management | 32 (45.1%) | 39 (54.9%) |
| Business & Financial | 27 (90.0%) | 3 (10.0%) |
| Computers, Engineering & Science | 36 (80.0%) | 9 (20.0%) |
| Computers & Mathematics | 2 (25.0%) | 6 (75.0%) |
| Architecture & Engineering | 34 (91.9%) | 3 (8.1%) |
| Life, Physical & Social Science | 0 (0.0%) | 0 (0.0%) |
| Community & Social Service | 35 (32.1%) | 74 (67.9%) |
| Education, Arts & Media | 28 (50.9%) | 27 (49.1%) |
| Legal Services & Support | 0 (0.0%) | 0 (0.0%) |
| Education Instruction & Library | 7 (13.0%) | 47 (87.0%) |
| Arts, Media & Entertainment | 0 (0.0%) | 0 (0.0%) |
| Health Diagnosing & Treating | 37 (35.6%) | 67 (64.4%) |
| Health Technologists | 8 (11.8%) | 60 (88.2%) |
| Total (Category) | 167 (46.5%) | 192 (53.5%) |
| Total (Overall) | 574 (59.3%) | 394 (40.7%) |
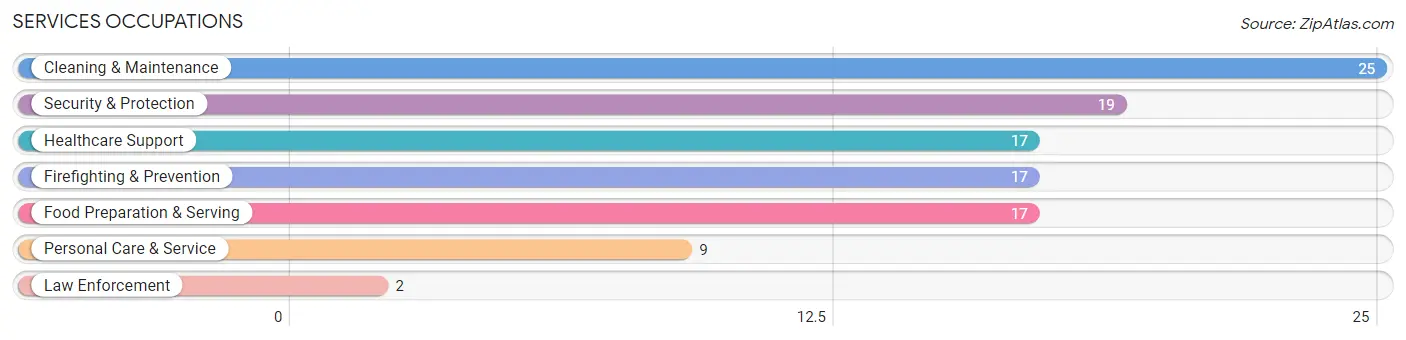
Services Occupations
The most common Services occupations in Thorsby are Cleaning & Maintenance (25 | 2.6%), Security & Protection (19 | 2.0%), Healthcare Support (17 | 1.8%), Firefighting & Prevention (17 | 1.8%), and Food Preparation & Serving (17 | 1.8%).
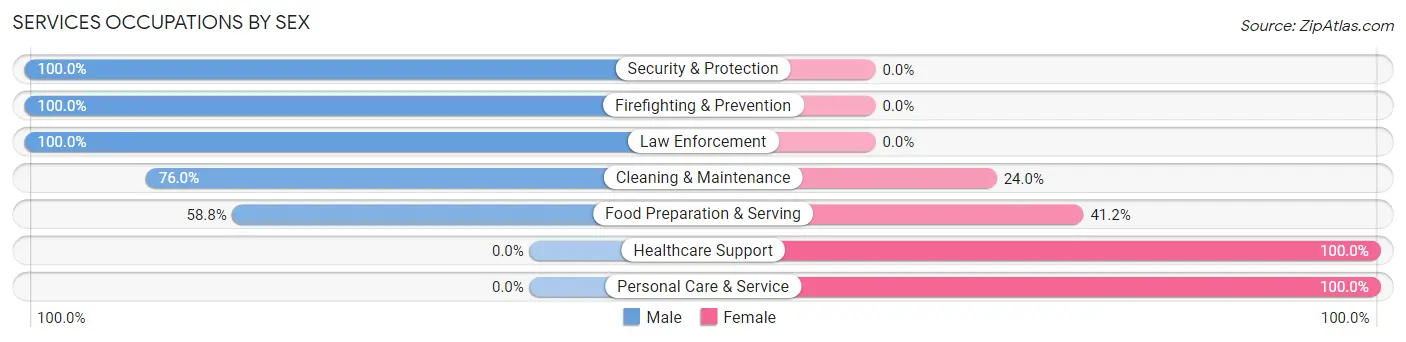
Services Occupations by Sex
Within the Services occupations in Thorsby, the most male-oriented occupations are Security & Protection (100.0%), Firefighting & Prevention (100.0%), and Law Enforcement (100.0%), while the most female-oriented occupations are Healthcare Support (100.0%), Personal Care & Service (100.0%), and Food Preparation & Serving (41.2%).
| Occupation | Male | Female |
| Healthcare Support | 0 (0.0%) | 17 (100.0%) |
| Security & Protection | 19 (100.0%) | 0 (0.0%) |
| Firefighting & Prevention | 17 (100.0%) | 0 (0.0%) |
| Law Enforcement | 2 (100.0%) | 0 (0.0%) |
| Food Preparation & Serving | 10 (58.8%) | 7 (41.2%) |
| Cleaning & Maintenance | 19 (76.0%) | 6 (24.0%) |
| Personal Care & Service | 0 (0.0%) | 9 (100.0%) |
| Total (Category) | 48 (55.2%) | 39 (44.8%) |
| Total (Overall) | 574 (59.3%) | 394 (40.7%) |
Sales and Office Occupations
The most common Sales and Office occupations in Thorsby are Office & Administration (100 | 10.3%), and Sales & Related (85 | 8.8%).
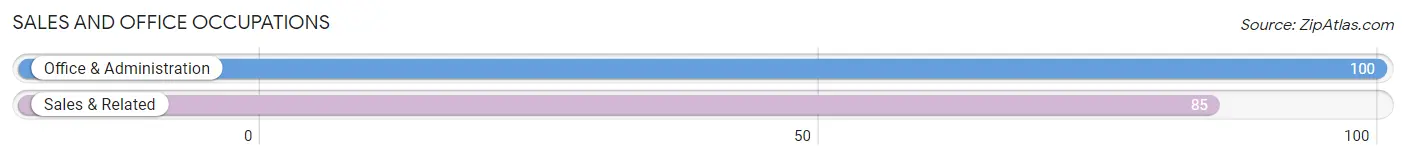
Sales and Office Occupations by Sex
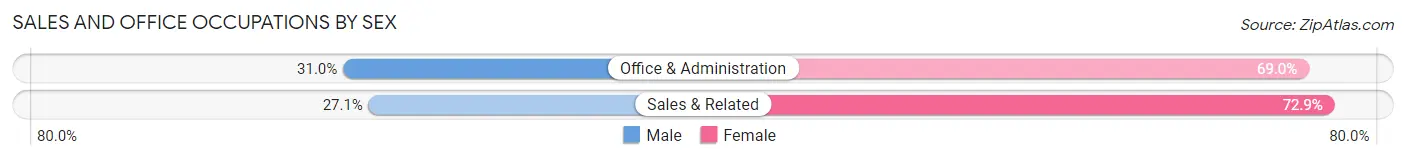
| Occupation | Male | Female |
| Sales & Related | 23 (27.1%) | 62 (72.9%) |
| Office & Administration | 31 (31.0%) | 69 (69.0%) |
| Total (Category) | 54 (29.2%) | 131 (70.8%) |
| Total (Overall) | 574 (59.3%) | 394 (40.7%) |
Natural Resources, Construction and Maintenance Occupations
The most common Natural Resources, Construction and Maintenance occupations in Thorsby are Construction & Extraction (126 | 13.0%), Installation, Maintenance & Repair (108 | 11.2%), and Farming, Fishing & Forestry (6 | 0.6%).
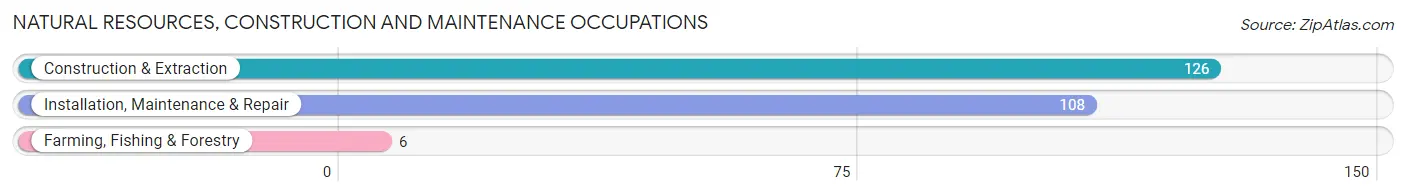
Natural Resources, Construction and Maintenance Occupations by Sex
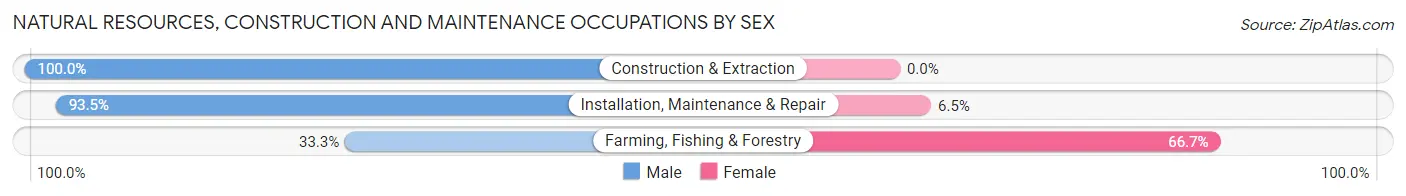
| Occupation | Male | Female |
| Farming, Fishing & Forestry | 2 (33.3%) | 4 (66.7%) |
| Construction & Extraction | 126 (100.0%) | 0 (0.0%) |
| Installation, Maintenance & Repair | 101 (93.5%) | 7 (6.5%) |
| Total (Category) | 229 (95.4%) | 11 (4.6%) |
| Total (Overall) | 574 (59.3%) | 394 (40.7%) |
Production, Transportation and Moving Occupations
The most common Production, Transportation and Moving occupations in Thorsby are Production (54 | 5.6%), Material Moving (25 | 2.6%), and Transportation (18 | 1.9%).
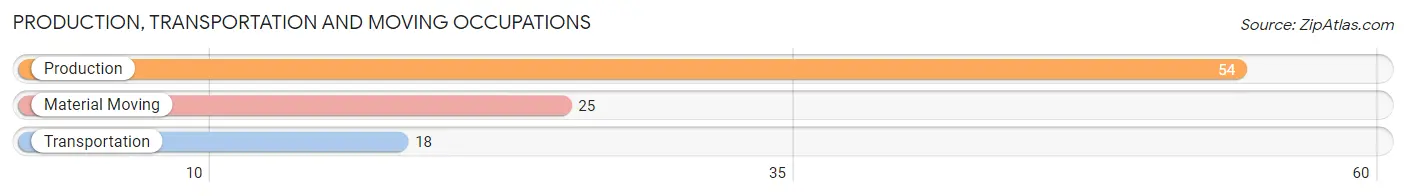
Production, Transportation and Moving Occupations by Sex
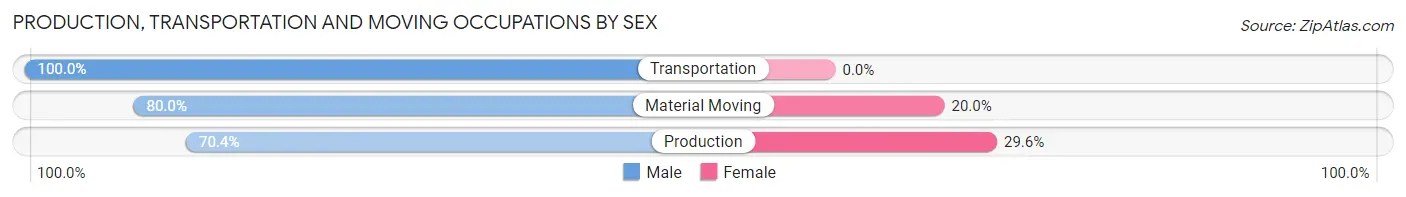
| Occupation | Male | Female |
| Production | 38 (70.4%) | 16 (29.6%) |
| Transportation | 18 (100.0%) | 0 (0.0%) |
| Material Moving | 20 (80.0%) | 5 (20.0%) |
| Total (Category) | 76 (78.3%) | 21 (21.6%) |
| Total (Overall) | 574 (59.3%) | 394 (40.7%) |
Employment Industries by Sex in Thorsby
Employment Industries in Thorsby
The major employment industries in Thorsby include Construction (168 | 17.4%), Educational Services (116 | 12.0%), Health Care & Social Assistance (114 | 11.8%), Retail Trade (103 | 10.6%), and Manufacturing (93 | 9.6%).
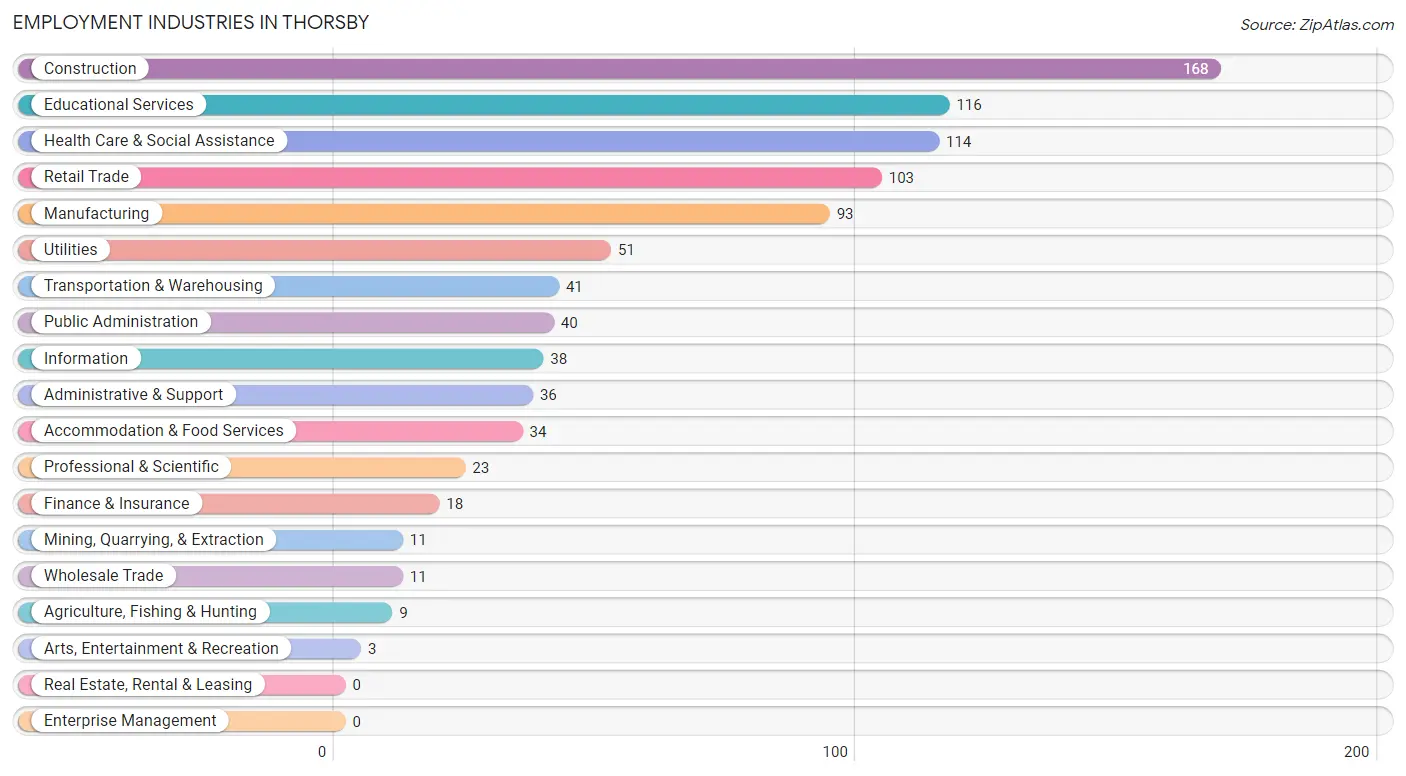
Employment Industries by Sex in Thorsby
The Thorsby industries that see more men than women are Mining, Quarrying, & Extraction (100.0%), Information (100.0%), and Utilities (94.1%), whereas the industries that tend to have a higher number of women are Arts, Entertainment & Recreation (100.0%), Professional & Scientific (87.0%), and Retail Trade (79.6%).
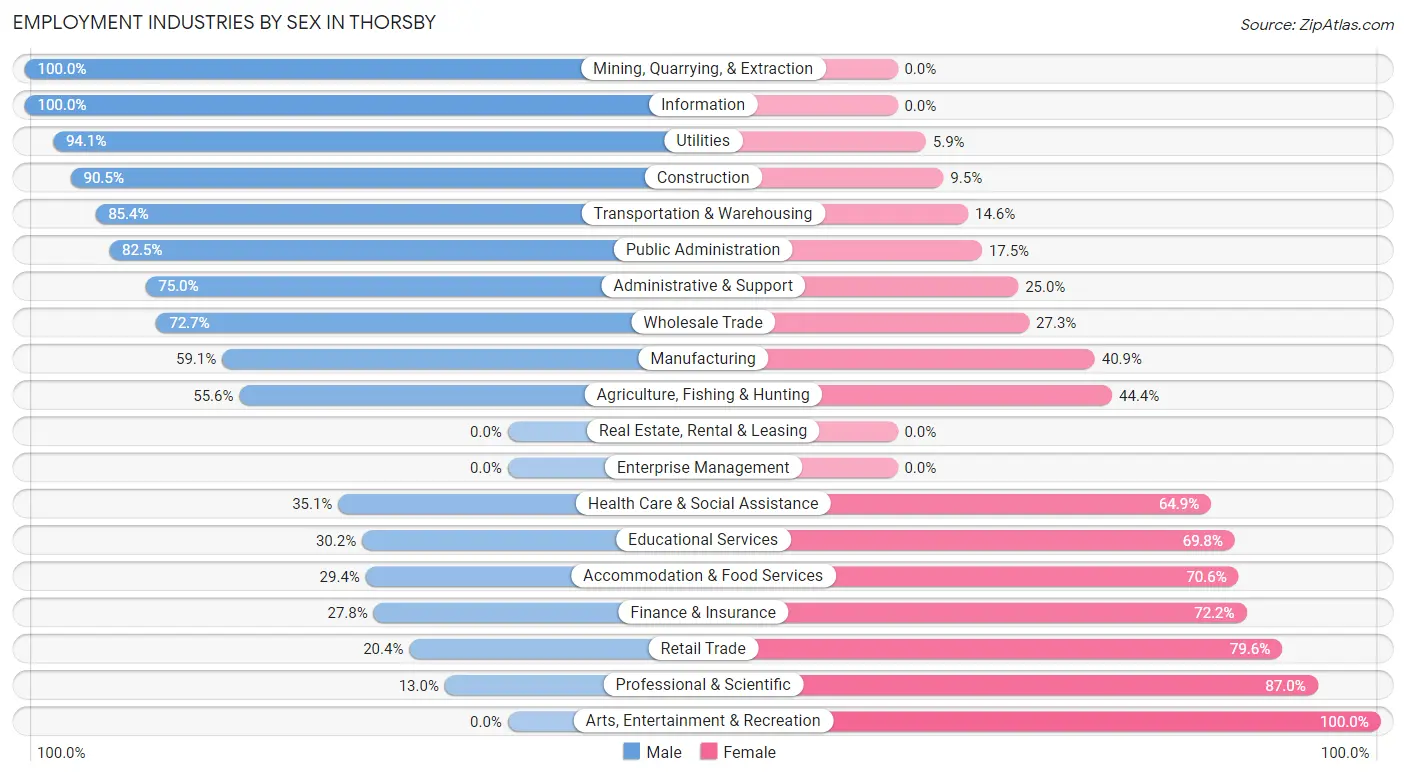
| Industry | Male | Female |
| Agriculture, Fishing & Hunting | 5 (55.6%) | 4 (44.4%) |
| Mining, Quarrying, & Extraction | 11 (100.0%) | 0 (0.0%) |
| Construction | 152 (90.5%) | 16 (9.5%) |
| Manufacturing | 55 (59.1%) | 38 (40.9%) |
| Wholesale Trade | 8 (72.7%) | 3 (27.3%) |
| Retail Trade | 21 (20.4%) | 82 (79.6%) |
| Transportation & Warehousing | 35 (85.4%) | 6 (14.6%) |
| Utilities | 48 (94.1%) | 3 (5.9%) |
| Information | 38 (100.0%) | 0 (0.0%) |
| Finance & Insurance | 5 (27.8%) | 13 (72.2%) |
| Real Estate, Rental & Leasing | 0 (0.0%) | 0 (0.0%) |
| Professional & Scientific | 3 (13.0%) | 20 (87.0%) |
| Enterprise Management | 0 (0.0%) | 0 (0.0%) |
| Administrative & Support | 27 (75.0%) | 9 (25.0%) |
| Educational Services | 35 (30.2%) | 81 (69.8%) |
| Health Care & Social Assistance | 40 (35.1%) | 74 (64.9%) |
| Arts, Entertainment & Recreation | 0 (0.0%) | 3 (100.0%) |
| Accommodation & Food Services | 10 (29.4%) | 24 (70.6%) |
| Public Administration | 33 (82.5%) | 7 (17.5%) |
| Total | 574 (59.3%) | 394 (40.7%) |
Education in Thorsby
School Enrollment in Thorsby
The most common levels of schooling among the 407 students in Thorsby are high school (105 | 25.8%), middle school (101 | 24.8%), and elementary school (63 | 15.5%).
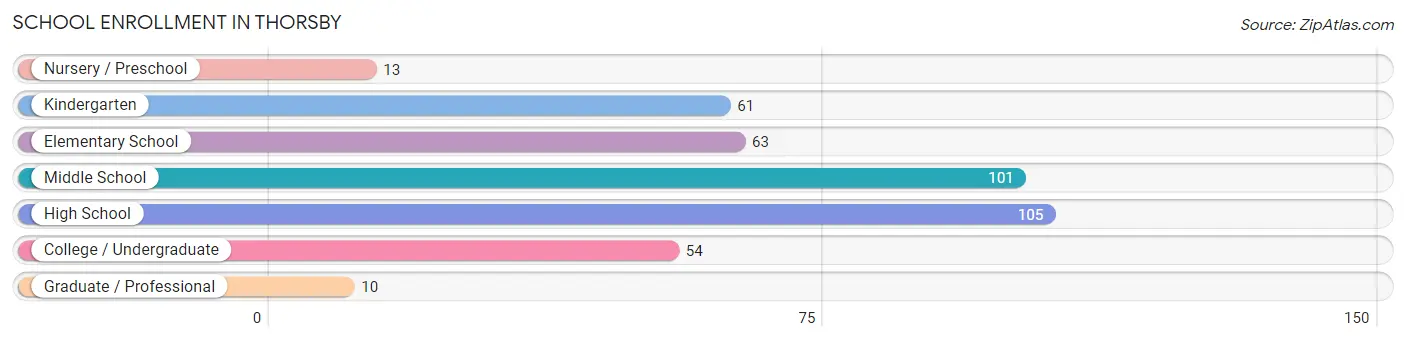
| School Level | # Students | % Students |
| Nursery / Preschool | 13 | 3.2% |
| Kindergarten | 61 | 15.0% |
| Elementary School | 63 | 15.5% |
| Middle School | 101 | 24.8% |
| High School | 105 | 25.8% |
| College / Undergraduate | 54 | 13.3% |
| Graduate / Professional | 10 | 2.5% |
| Total | 407 | 100.0% |
School Enrollment by Age by Funding Source in Thorsby
Out of a total of 407 students who are enrolled in schools in Thorsby, 108 (26.5%) attend a private institution, while the remaining 299 (73.5%) are enrolled in public schools. The age group of 3 to 4 year olds has the highest likelihood of being enrolled in private schools, with 13 (100.0% in the age bracket) enrolled. Conversely, the age group of 10 to 14 year olds has the lowest likelihood of being enrolled in a private school, with 122 (92.4% in the age bracket) attending a public institution.
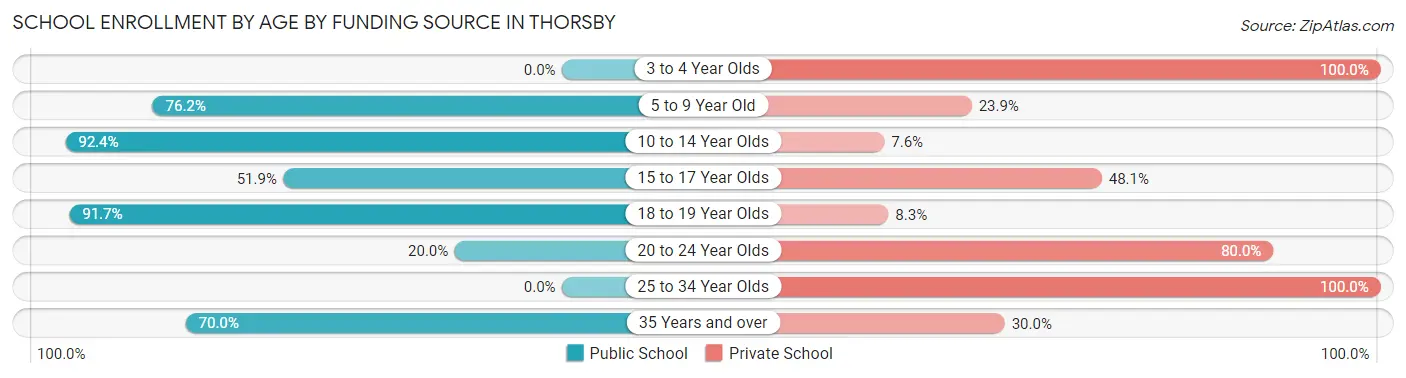
| Age Bracket | Public School | Private School |
| 3 to 4 Year Olds | 0 (0.0%) | 13 (100.0%) |
| 5 to 9 Year Old | 83 (76.1%) | 26 (23.8%) |
| 10 to 14 Year Olds | 122 (92.4%) | 10 (7.6%) |
| 15 to 17 Year Olds | 27 (51.9%) | 25 (48.1%) |
| 18 to 19 Year Olds | 55 (91.7%) | 5 (8.3%) |
| 20 to 24 Year Olds | 5 (20.0%) | 20 (80.0%) |
| 25 to 34 Year Olds | 0 (0.0%) | 6 (100.0%) |
| 35 Years and over | 7 (70.0%) | 3 (30.0%) |
| Total | 299 (73.5%) | 108 (26.5%) |
Educational Attainment by Field of Study in Thorsby
Arts & humanities (46 | 17.5%), liberal arts & history (36 | 13.7%), education (29 | 11.0%), visual & performing arts (27 | 10.3%), and social sciences (25 | 9.5%) are the most common fields of study among 263 individuals in Thorsby who have obtained a bachelor's degree or higher.
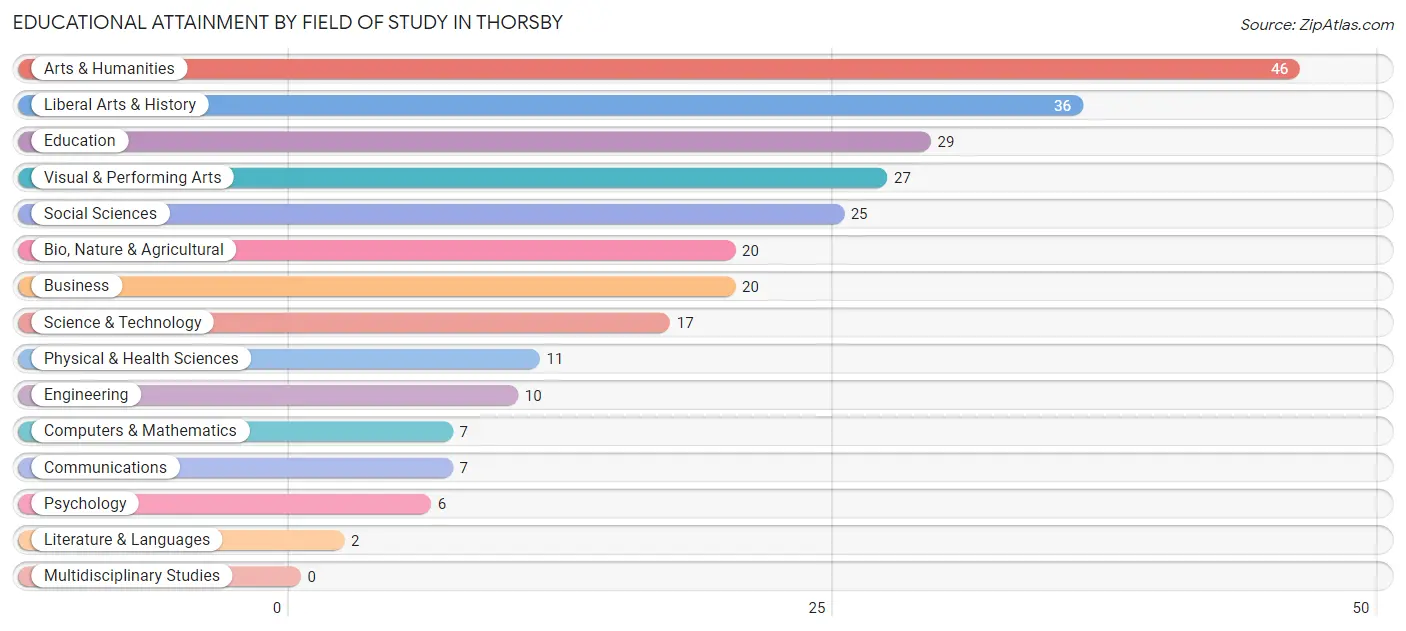
| Field of Study | # Graduates | % Graduates |
| Computers & Mathematics | 7 | 2.7% |
| Bio, Nature & Agricultural | 20 | 7.6% |
| Physical & Health Sciences | 11 | 4.2% |
| Psychology | 6 | 2.3% |
| Social Sciences | 25 | 9.5% |
| Engineering | 10 | 3.8% |
| Multidisciplinary Studies | 0 | 0.0% |
| Science & Technology | 17 | 6.5% |
| Business | 20 | 7.6% |
| Education | 29 | 11.0% |
| Literature & Languages | 2 | 0.8% |
| Liberal Arts & History | 36 | 13.7% |
| Visual & Performing Arts | 27 | 10.3% |
| Communications | 7 | 2.7% |
| Arts & Humanities | 46 | 17.5% |
| Total | 263 | 100.0% |
Transportation & Commute in Thorsby
Vehicle Availability by Sex in Thorsby
The most prevalent vehicle ownership categories in Thorsby are males with 2 vehicles (202, accounting for 36.4%) and females with 2 vehicles (151, making up 52.6%).
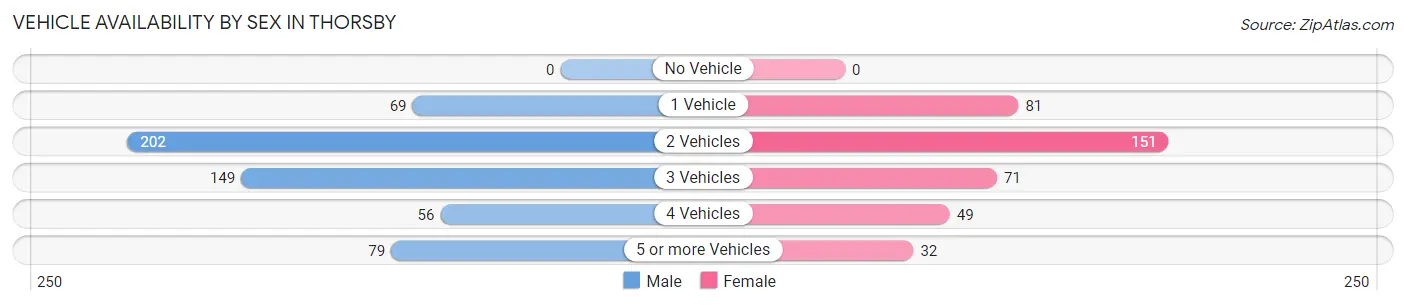
| Vehicles Available | Male | Female |
| No Vehicle | 0 (0.0%) | 0 (0.0%) |
| 1 Vehicle | 69 (12.4%) | 81 (21.1%) |
| 2 Vehicles | 202 (36.4%) | 151 (39.3%) |
| 3 Vehicles | 149 (26.9%) | 71 (18.5%) |
| 4 Vehicles | 56 (10.1%) | 49 (12.8%) |
| 5 or more Vehicles | 79 (14.2%) | 32 (8.3%) |
| Total | 555 (100.0%) | 384 (100.0%) |
Commute Time in Thorsby
The most frequently occuring commute durations in Thorsby are 60 to 89 minutes (166 commuters, 20.2%), 45 to 59 minutes (163 commuters, 19.9%), and 15 to 19 minutes (88 commuters, 10.7%).
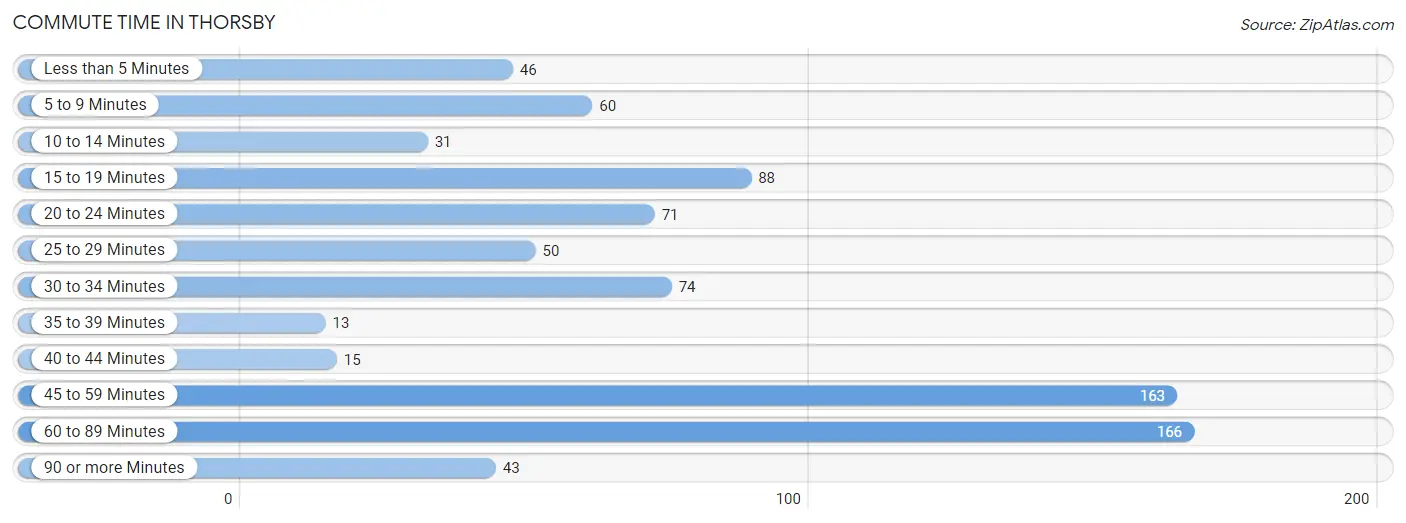
| Commute Time | # Commuters | % Commuters |
| Less than 5 Minutes | 46 | 5.6% |
| 5 to 9 Minutes | 60 | 7.3% |
| 10 to 14 Minutes | 31 | 3.8% |
| 15 to 19 Minutes | 88 | 10.7% |
| 20 to 24 Minutes | 71 | 8.7% |
| 25 to 29 Minutes | 50 | 6.1% |
| 30 to 34 Minutes | 74 | 9.0% |
| 35 to 39 Minutes | 13 | 1.6% |
| 40 to 44 Minutes | 15 | 1.8% |
| 45 to 59 Minutes | 163 | 19.9% |
| 60 to 89 Minutes | 166 | 20.2% |
| 90 or more Minutes | 43 | 5.2% |
Commute Time by Sex in Thorsby
The most common commute times in Thorsby are 60 to 89 minutes (122 commuters, 24.4%) for males and 45 to 59 minutes (69 commuters, 21.6%) for females.
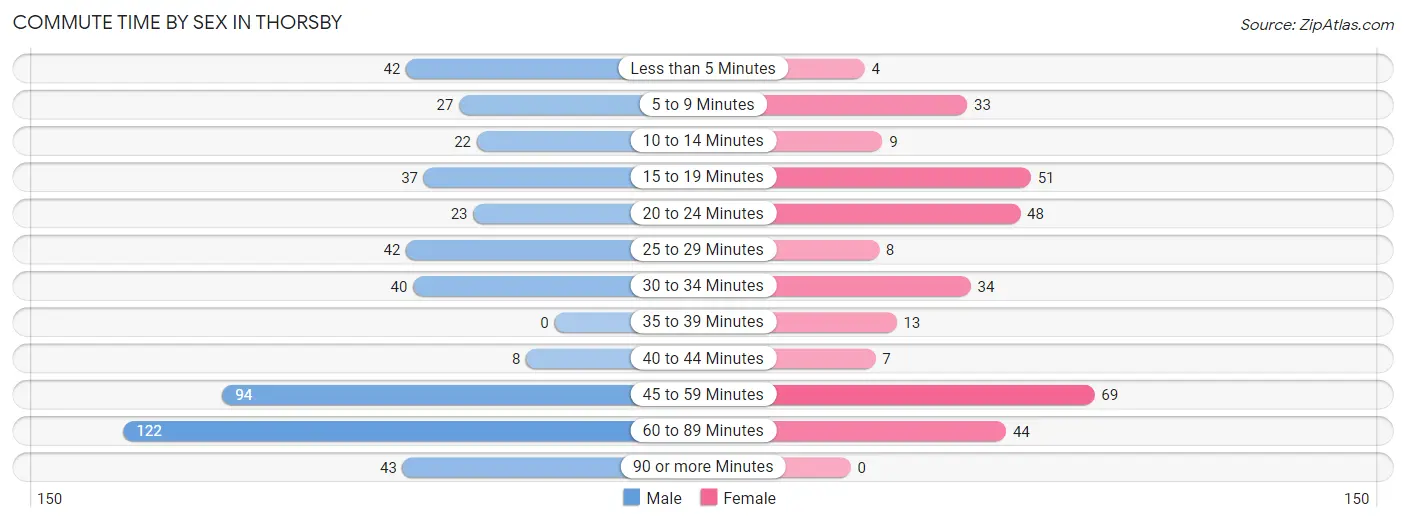
| Commute Time | Male | Female |
| Less than 5 Minutes | 42 (8.4%) | 4 (1.3%) |
| 5 to 9 Minutes | 27 (5.4%) | 33 (10.3%) |
| 10 to 14 Minutes | 22 (4.4%) | 9 (2.8%) |
| 15 to 19 Minutes | 37 (7.4%) | 51 (15.9%) |
| 20 to 24 Minutes | 23 (4.6%) | 48 (15.0%) |
| 25 to 29 Minutes | 42 (8.4%) | 8 (2.5%) |
| 30 to 34 Minutes | 40 (8.0%) | 34 (10.6%) |
| 35 to 39 Minutes | 0 (0.0%) | 13 (4.1%) |
| 40 to 44 Minutes | 8 (1.6%) | 7 (2.2%) |
| 45 to 59 Minutes | 94 (18.8%) | 69 (21.6%) |
| 60 to 89 Minutes | 122 (24.4%) | 44 (13.8%) |
| 90 or more Minutes | 43 (8.6%) | 0 (0.0%) |
Time of Departure to Work by Sex in Thorsby
The most frequent times of departure to work in Thorsby are 12:00 AM to 4:59 AM (97, 19.4%) for males and 7:00 AM to 7:29 AM (62, 19.4%) for females.
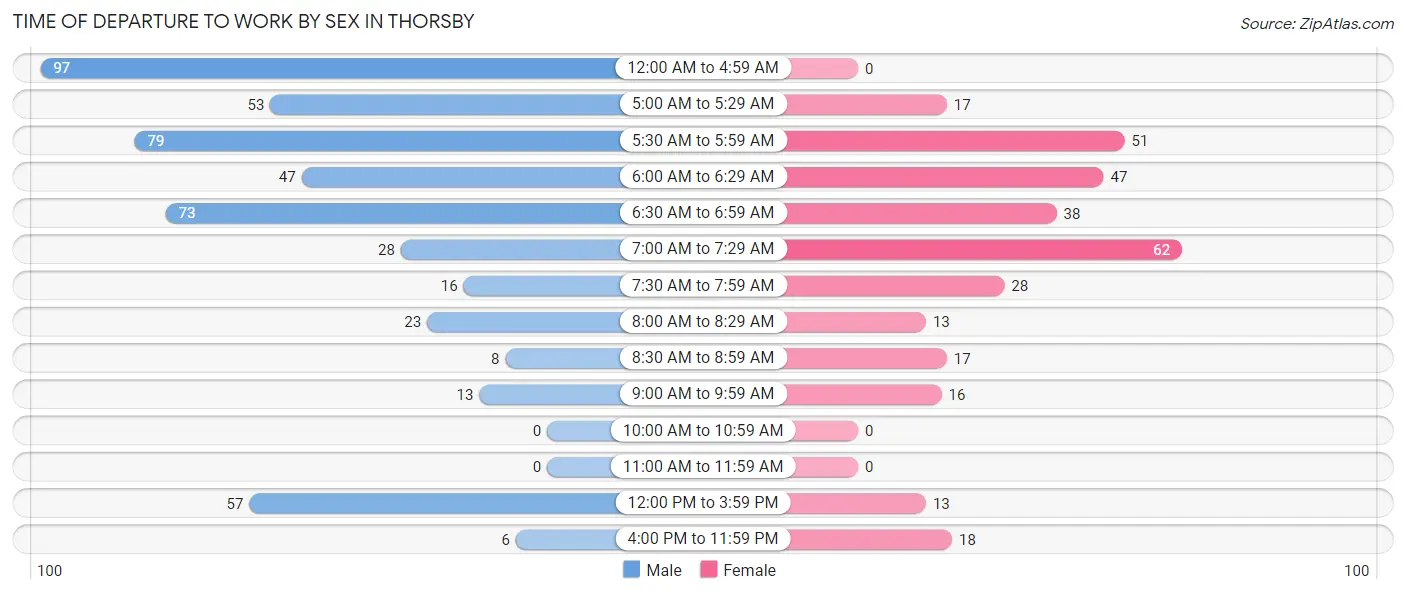
| Time of Departure | Male | Female |
| 12:00 AM to 4:59 AM | 97 (19.4%) | 0 (0.0%) |
| 5:00 AM to 5:29 AM | 53 (10.6%) | 17 (5.3%) |
| 5:30 AM to 5:59 AM | 79 (15.8%) | 51 (15.9%) |
| 6:00 AM to 6:29 AM | 47 (9.4%) | 47 (14.7%) |
| 6:30 AM to 6:59 AM | 73 (14.6%) | 38 (11.9%) |
| 7:00 AM to 7:29 AM | 28 (5.6%) | 62 (19.4%) |
| 7:30 AM to 7:59 AM | 16 (3.2%) | 28 (8.7%) |
| 8:00 AM to 8:29 AM | 23 (4.6%) | 13 (4.1%) |
| 8:30 AM to 8:59 AM | 8 (1.6%) | 17 (5.3%) |
| 9:00 AM to 9:59 AM | 13 (2.6%) | 16 (5.0%) |
| 10:00 AM to 10:59 AM | 0 (0.0%) | 0 (0.0%) |
| 11:00 AM to 11:59 AM | 0 (0.0%) | 0 (0.0%) |
| 12:00 PM to 3:59 PM | 57 (11.4%) | 13 (4.1%) |
| 4:00 PM to 11:59 PM | 6 (1.2%) | 18 (5.6%) |
| Total | 500 (100.0%) | 320 (100.0%) |
Housing Occupancy in Thorsby
Occupancy by Ownership in Thorsby
Of the total 817 dwellings in Thorsby, owner-occupied units account for 602 (73.7%), while renter-occupied units make up 215 (26.3%).
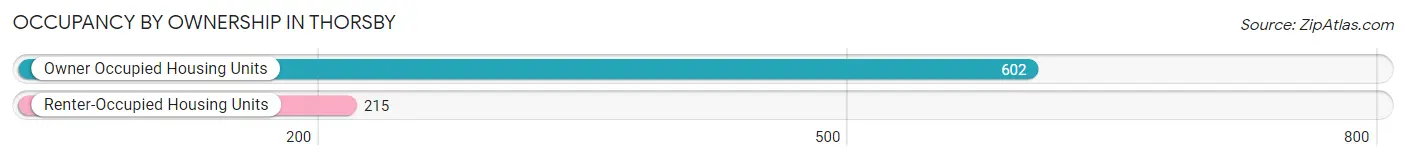
| Occupancy | # Housing Units | % Housing Units |
| Owner Occupied Housing Units | 602 | 73.7% |
| Renter-Occupied Housing Units | 215 | 26.3% |
| Total Occupied Housing Units | 817 | 100.0% |
Occupancy by Household Size in Thorsby
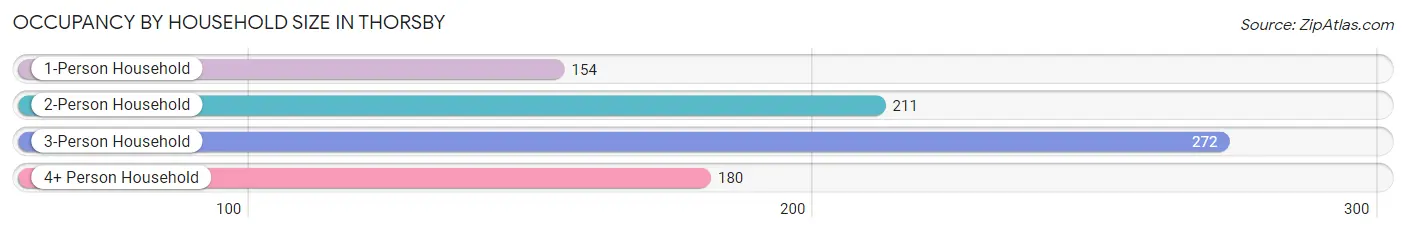
| Household Size | # Housing Units | % Housing Units |
| 1-Person Household | 154 | 18.9% |
| 2-Person Household | 211 | 25.8% |
| 3-Person Household | 272 | 33.3% |
| 4+ Person Household | 180 | 22.0% |
| Total Housing Units | 817 | 100.0% |
Occupancy by Ownership by Household Size in Thorsby
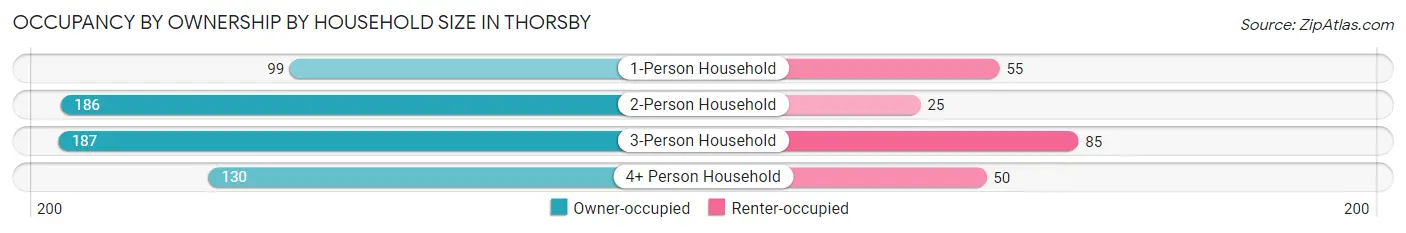
| Household Size | Owner-occupied | Renter-occupied |
| 1-Person Household | 99 (64.3%) | 55 (35.7%) |
| 2-Person Household | 186 (88.1%) | 25 (11.8%) |
| 3-Person Household | 187 (68.8%) | 85 (31.2%) |
| 4+ Person Household | 130 (72.2%) | 50 (27.8%) |
| Total Housing Units | 602 (73.7%) | 215 (26.3%) |
Occupancy by Educational Attainment in Thorsby
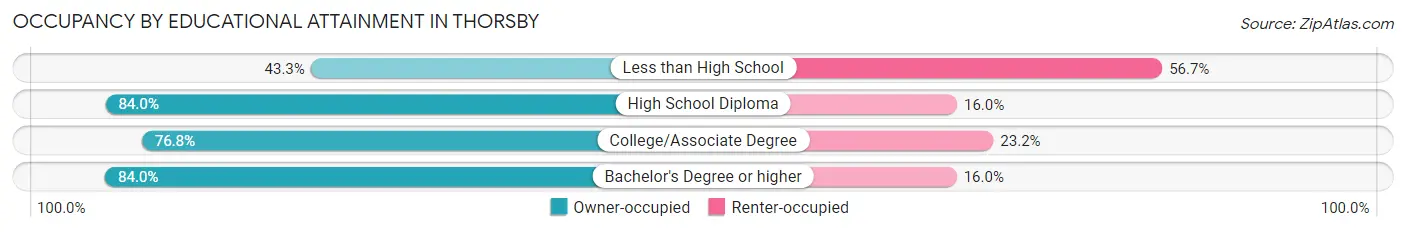
| Household Size | Owner-occupied | Renter-occupied |
| Less than High School | 71 (43.3%) | 93 (56.7%) |
| High School Diploma | 225 (84.0%) | 43 (16.0%) |
| College/Associate Degree | 185 (76.8%) | 56 (23.2%) |
| Bachelor's Degree or higher | 121 (84.0%) | 23 (16.0%) |
Occupancy by Age of Householder in Thorsby
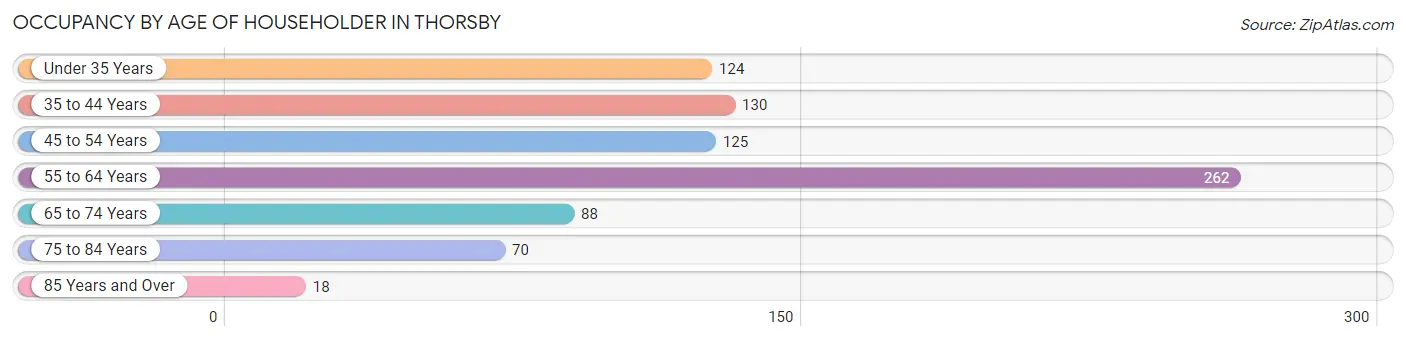
| Age Bracket | # Households | % Households |
| Under 35 Years | 124 | 15.2% |
| 35 to 44 Years | 130 | 15.9% |
| 45 to 54 Years | 125 | 15.3% |
| 55 to 64 Years | 262 | 32.1% |
| 65 to 74 Years | 88 | 10.8% |
| 75 to 84 Years | 70 | 8.6% |
| 85 Years and Over | 18 | 2.2% |
| Total | 817 | 100.0% |
Housing Finances in Thorsby
Median Income by Occupancy in Thorsby
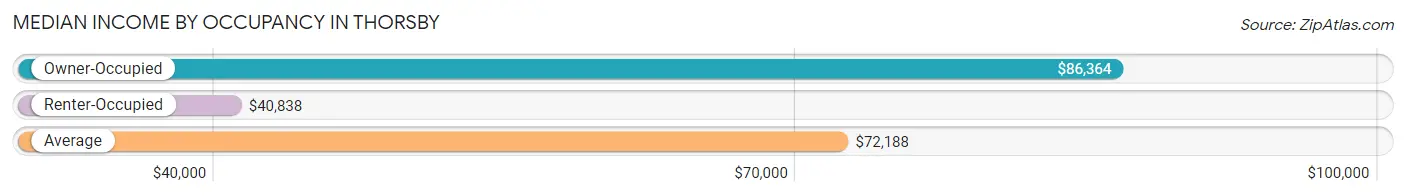
| Occupancy Type | # Households | Median Income |
| Owner-Occupied | 602 (73.7%) | $86,364 |
| Renter-Occupied | 215 (26.3%) | $40,838 |
| Average | 817 (100.0%) | $72,188 |
Occupancy by Householder Income Bracket in Thorsby
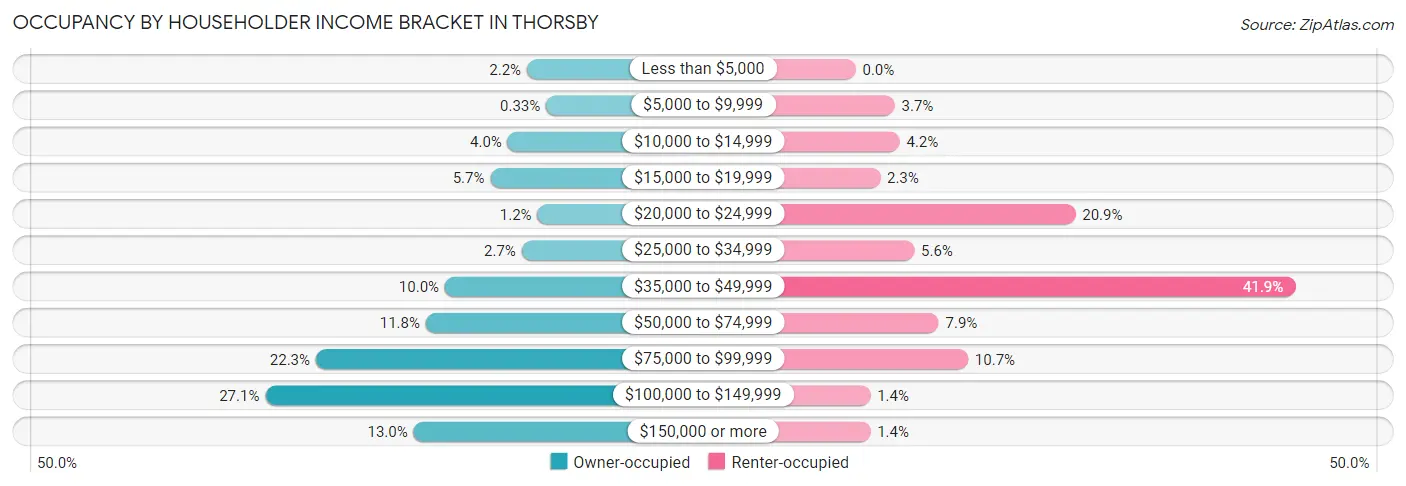
| Income Bracket | Owner-occupied | Renter-occupied |
| Less than $5,000 | 13 (2.2%) | 0 (0.0%) |
| $5,000 to $9,999 | 2 (0.3%) | 8 (3.7%) |
| $10,000 to $14,999 | 24 (4.0%) | 9 (4.2%) |
| $15,000 to $19,999 | 34 (5.7%) | 5 (2.3%) |
| $20,000 to $24,999 | 7 (1.2%) | 45 (20.9%) |
| $25,000 to $34,999 | 16 (2.7%) | 12 (5.6%) |
| $35,000 to $49,999 | 60 (10.0%) | 90 (41.9%) |
| $50,000 to $74,999 | 71 (11.8%) | 17 (7.9%) |
| $75,000 to $99,999 | 134 (22.3%) | 23 (10.7%) |
| $100,000 to $149,999 | 163 (27.1%) | 3 (1.4%) |
| $150,000 or more | 78 (13.0%) | 3 (1.4%) |
| Total | 602 (100.0%) | 215 (100.0%) |
Monthly Housing Cost Tiers in Thorsby
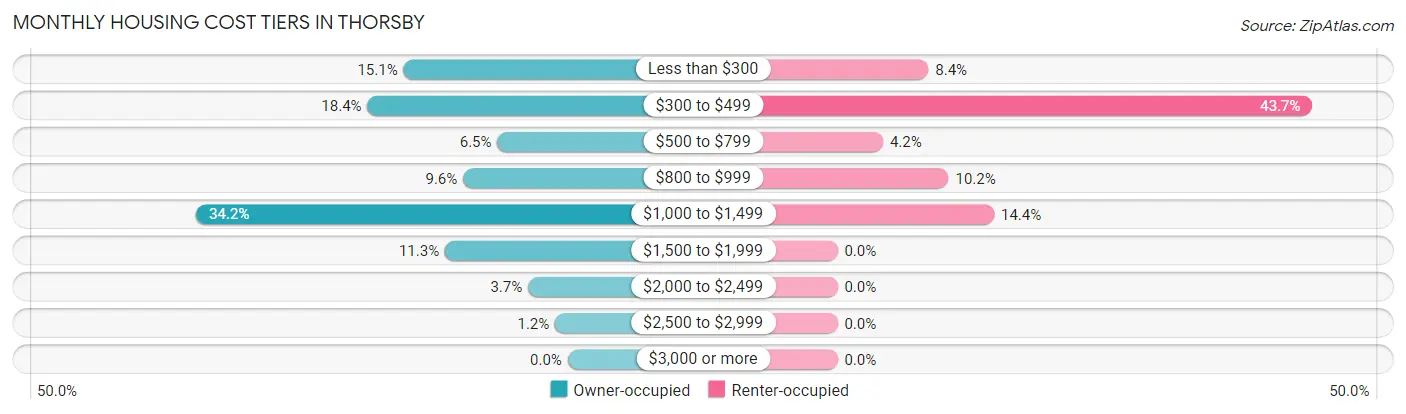
| Monthly Cost | Owner-occupied | Renter-occupied |
| Less than $300 | 91 (15.1%) | 18 (8.4%) |
| $300 to $499 | 111 (18.4%) | 94 (43.7%) |
| $500 to $799 | 39 (6.5%) | 9 (4.2%) |
| $800 to $999 | 58 (9.6%) | 22 (10.2%) |
| $1,000 to $1,499 | 206 (34.2%) | 31 (14.4%) |
| $1,500 to $1,999 | 68 (11.3%) | 0 (0.0%) |
| $2,000 to $2,499 | 22 (3.6%) | 0 (0.0%) |
| $2,500 to $2,999 | 7 (1.2%) | 0 (0.0%) |
| $3,000 or more | 0 (0.0%) | 0 (0.0%) |
| Total | 602 (100.0%) | 215 (100.0%) |
Physical Housing Characteristics in Thorsby
Housing Structures in Thorsby
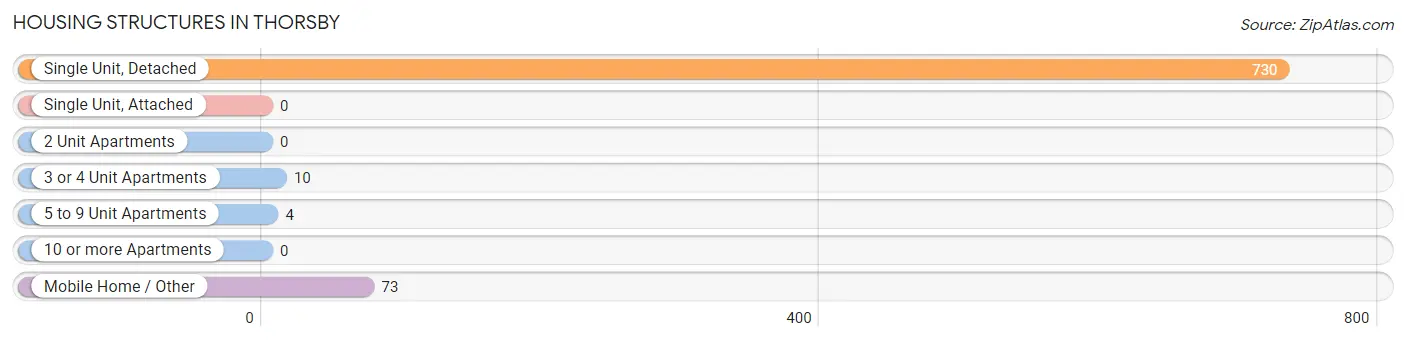
| Structure Type | # Housing Units | % Housing Units |
| Single Unit, Detached | 730 | 89.3% |
| Single Unit, Attached | 0 | 0.0% |
| 2 Unit Apartments | 0 | 0.0% |
| 3 or 4 Unit Apartments | 10 | 1.2% |
| 5 to 9 Unit Apartments | 4 | 0.5% |
| 10 or more Apartments | 0 | 0.0% |
| Mobile Home / Other | 73 | 8.9% |
| Total | 817 | 100.0% |
Housing Structures by Occupancy in Thorsby
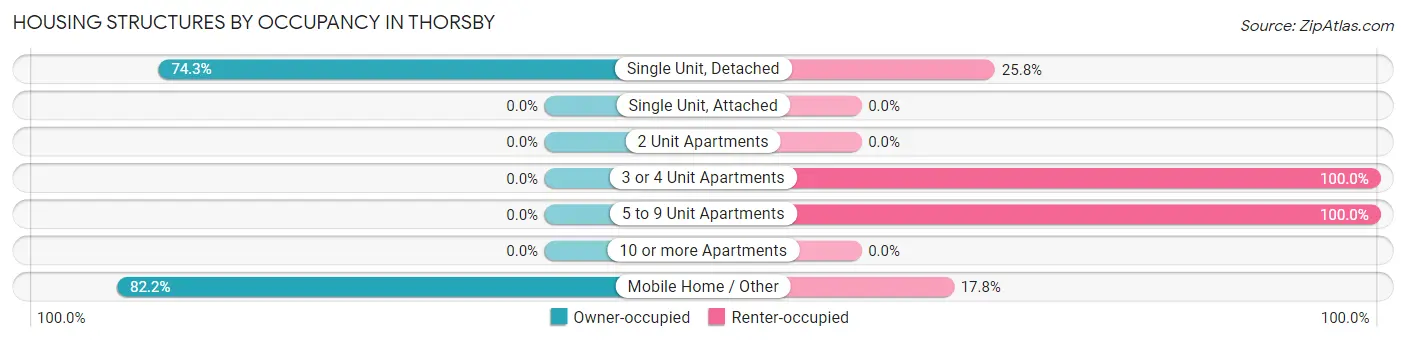
| Structure Type | Owner-occupied | Renter-occupied |
| Single Unit, Detached | 542 (74.3%) | 188 (25.8%) |
| Single Unit, Attached | 0 (0.0%) | 0 (0.0%) |
| 2 Unit Apartments | 0 (0.0%) | 0 (0.0%) |
| 3 or 4 Unit Apartments | 0 (0.0%) | 10 (100.0%) |
| 5 to 9 Unit Apartments | 0 (0.0%) | 4 (100.0%) |
| 10 or more Apartments | 0 (0.0%) | 0 (0.0%) |
| Mobile Home / Other | 60 (82.2%) | 13 (17.8%) |
| Total | 602 (73.7%) | 215 (26.3%) |
Housing Structures by Number of Rooms in Thorsby
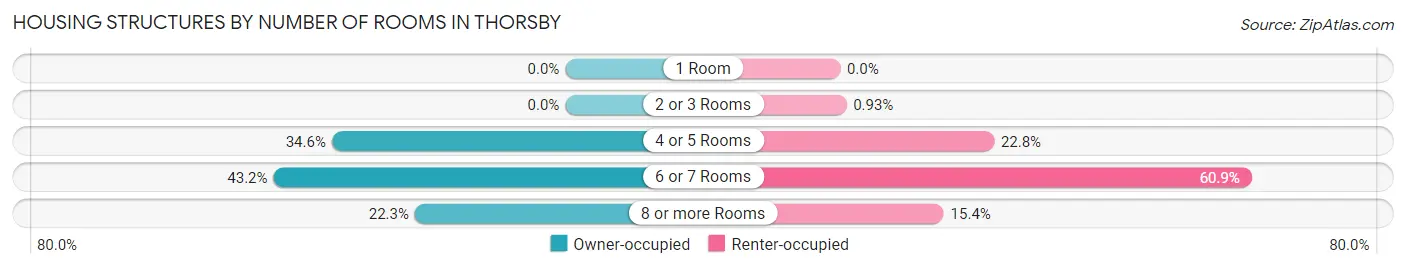
| Number of Rooms | Owner-occupied | Renter-occupied |
| 1 Room | 0 (0.0%) | 0 (0.0%) |
| 2 or 3 Rooms | 0 (0.0%) | 2 (0.9%) |
| 4 or 5 Rooms | 208 (34.5%) | 49 (22.8%) |
| 6 or 7 Rooms | 260 (43.2%) | 131 (60.9%) |
| 8 or more Rooms | 134 (22.3%) | 33 (15.3%) |
| Total | 602 (100.0%) | 215 (100.0%) |
Housing Structure by Heating Type in Thorsby
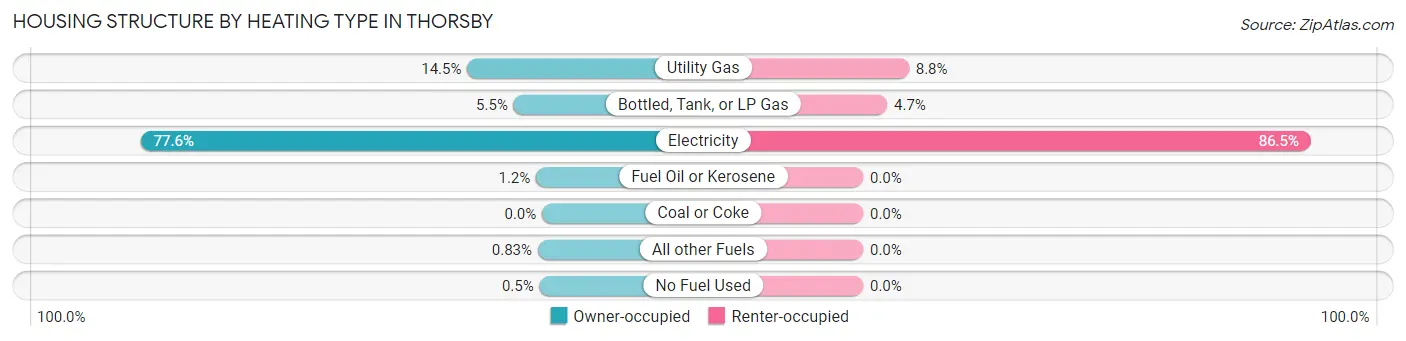
| Heating Type | Owner-occupied | Renter-occupied |
| Utility Gas | 87 (14.4%) | 19 (8.8%) |
| Bottled, Tank, or LP Gas | 33 (5.5%) | 10 (4.6%) |
| Electricity | 467 (77.6%) | 186 (86.5%) |
| Fuel Oil or Kerosene | 7 (1.2%) | 0 (0.0%) |
| Coal or Coke | 0 (0.0%) | 0 (0.0%) |
| All other Fuels | 5 (0.8%) | 0 (0.0%) |
| No Fuel Used | 3 (0.5%) | 0 (0.0%) |
| Total | 602 (100.0%) | 215 (100.0%) |
Household Vehicle Usage in Thorsby
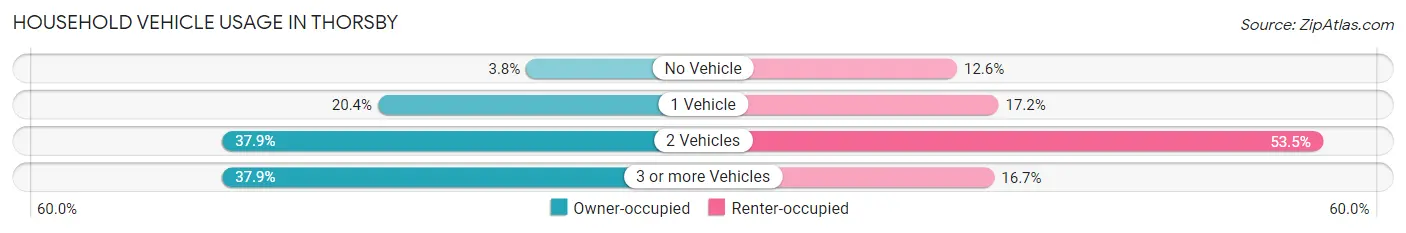
| Vehicles per Household | Owner-occupied | Renter-occupied |
| No Vehicle | 23 (3.8%) | 27 (12.6%) |
| 1 Vehicle | 123 (20.4%) | 37 (17.2%) |
| 2 Vehicles | 228 (37.9%) | 115 (53.5%) |
| 3 or more Vehicles | 228 (37.9%) | 36 (16.7%) |
| Total | 602 (100.0%) | 215 (100.0%) |
Real Estate & Mortgages in Thorsby
Real Estate and Mortgage Overview in Thorsby
| Characteristic | Without Mortgage | With Mortgage |
| Housing Units | 244 | 358 |
| Median Property Value | $125,000 | $188,200 |
| Median Household Income | $58,125 | $60 |
| Monthly Housing Costs | $334 | $0 |
| Real Estate Taxes | $742 | $23 |
Property Value by Mortgage Status in Thorsby
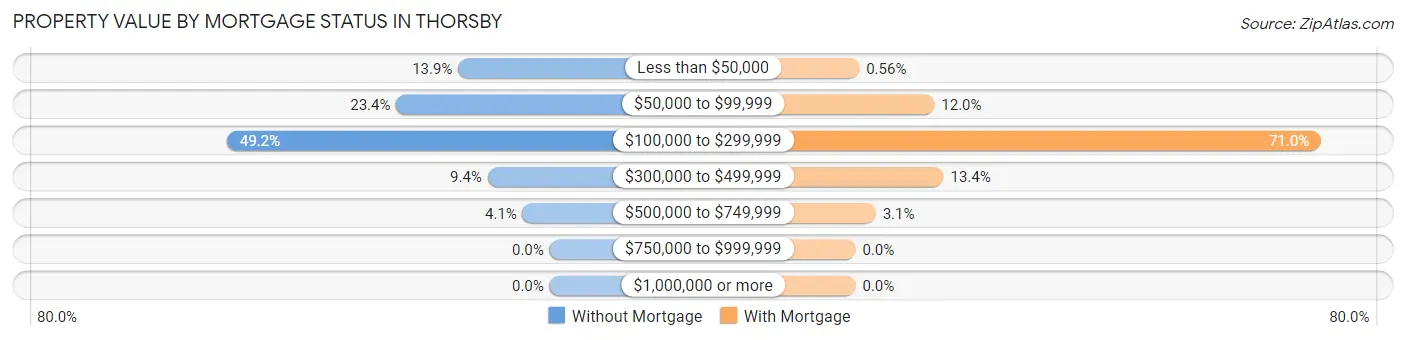
| Property Value | Without Mortgage | With Mortgage |
| Less than $50,000 | 34 (13.9%) | 2 (0.6%) |
| $50,000 to $99,999 | 57 (23.4%) | 43 (12.0%) |
| $100,000 to $299,999 | 120 (49.2%) | 254 (71.0%) |
| $300,000 to $499,999 | 23 (9.4%) | 48 (13.4%) |
| $500,000 to $749,999 | 10 (4.1%) | 11 (3.1%) |
| $750,000 to $999,999 | 0 (0.0%) | 0 (0.0%) |
| $1,000,000 or more | 0 (0.0%) | 0 (0.0%) |
| Total | 244 (100.0%) | 358 (100.0%) |
Household Income by Mortgage Status in Thorsby
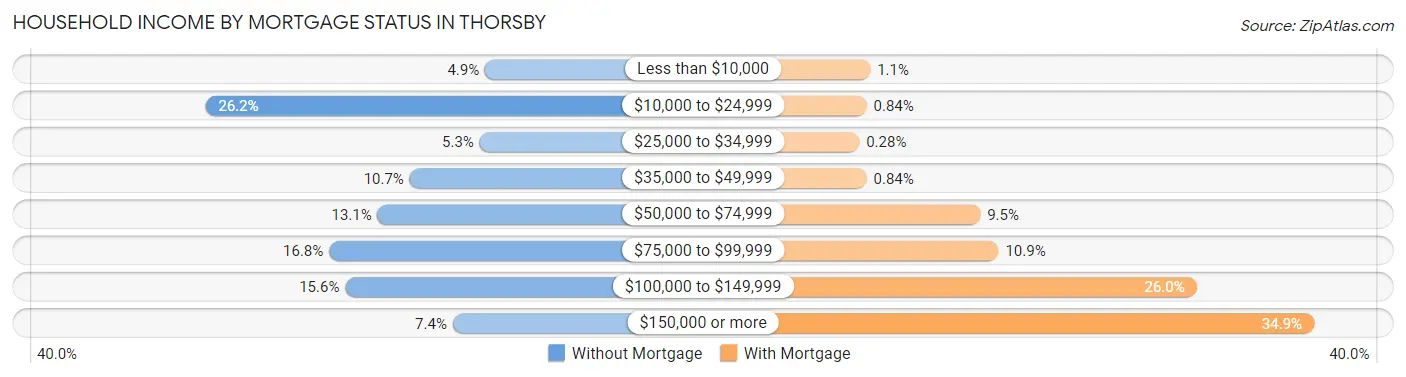
| Household Income | Without Mortgage | With Mortgage |
| Less than $10,000 | 12 (4.9%) | 4 (1.1%) |
| $10,000 to $24,999 | 64 (26.2%) | 3 (0.8%) |
| $25,000 to $34,999 | 13 (5.3%) | 1 (0.3%) |
| $35,000 to $49,999 | 26 (10.7%) | 3 (0.8%) |
| $50,000 to $74,999 | 32 (13.1%) | 34 (9.5%) |
| $75,000 to $99,999 | 41 (16.8%) | 39 (10.9%) |
| $100,000 to $149,999 | 38 (15.6%) | 93 (26.0%) |
| $150,000 or more | 18 (7.4%) | 125 (34.9%) |
| Total | 244 (100.0%) | 358 (100.0%) |
Property Value to Household Income Ratio in Thorsby
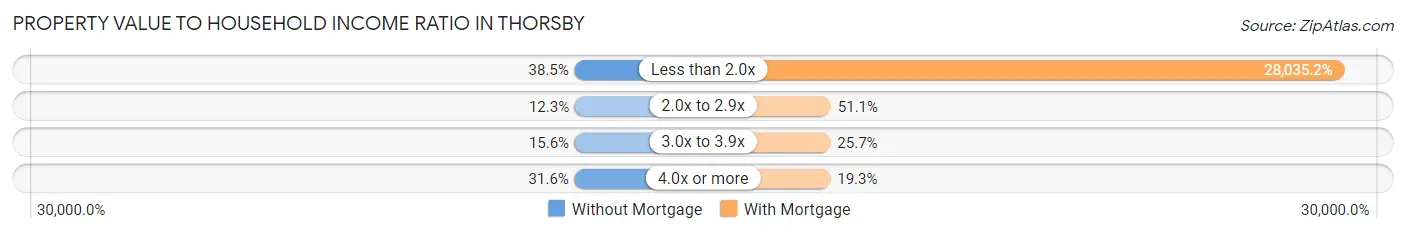
| Value-to-Income Ratio | Without Mortgage | With Mortgage |
| Less than 2.0x | 94 (38.5%) | 100,366 (28,035.2%) |
| 2.0x to 2.9x | 30 (12.3%) | 183 (51.1%) |
| 3.0x to 3.9x | 38 (15.6%) | 92 (25.7%) |
| 4.0x or more | 77 (31.6%) | 69 (19.3%) |
| Total | 244 (100.0%) | 358 (100.0%) |
Real Estate Taxes by Mortgage Status in Thorsby
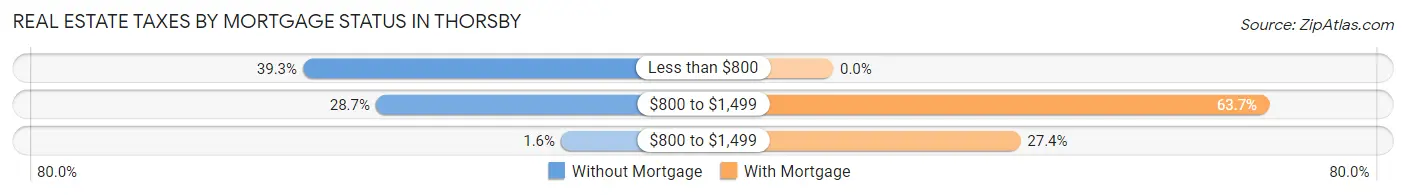
| Property Taxes | Without Mortgage | With Mortgage |
| Less than $800 | 96 (39.3%) | 0 (0.0%) |
| $800 to $1,499 | 70 (28.7%) | 228 (63.7%) |
| $800 to $1,499 | 4 (1.6%) | 98 (27.4%) |
| Total | 244 (100.0%) | 358 (100.0%) |
Health & Disability in Thorsby
Health Insurance Coverage by Age in Thorsby
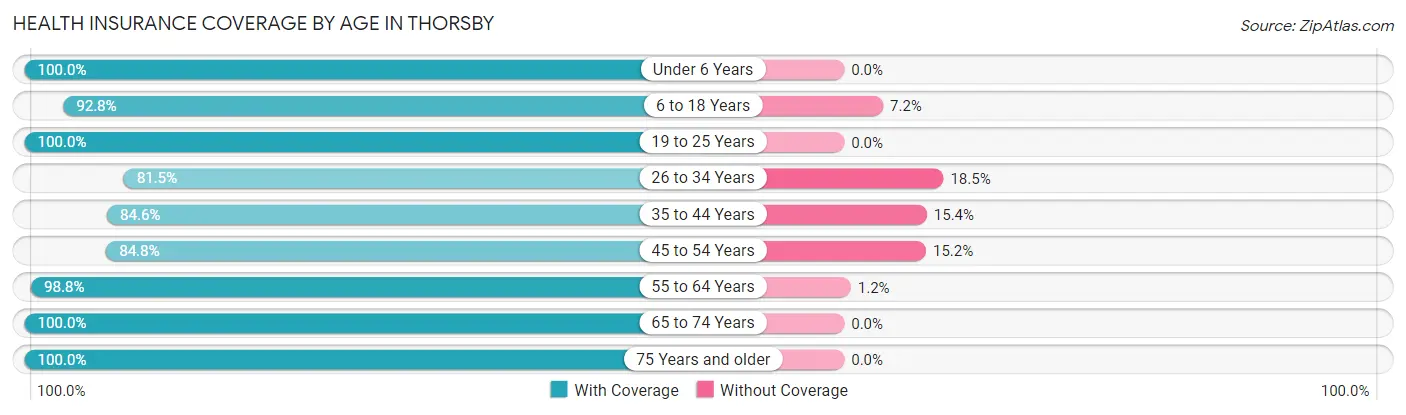
| Age Bracket | With Coverage | Without Coverage |
| Under 6 Years | 243 (100.0%) | 0 (0.0%) |
| 6 to 18 Years | 333 (92.8%) | 26 (7.2%) |
| 19 to 25 Years | 210 (100.0%) | 0 (0.0%) |
| 26 to 34 Years | 185 (81.5%) | 42 (18.5%) |
| 35 to 44 Years | 478 (84.6%) | 87 (15.4%) |
| 45 to 54 Years | 228 (84.8%) | 41 (15.2%) |
| 55 to 64 Years | 404 (98.8%) | 5 (1.2%) |
| 65 to 74 Years | 135 (100.0%) | 0 (0.0%) |
| 75 Years and older | 135 (100.0%) | 0 (0.0%) |
| Total | 2,351 (92.1%) | 201 (7.9%) |
Health Insurance Coverage by Citizenship Status in Thorsby
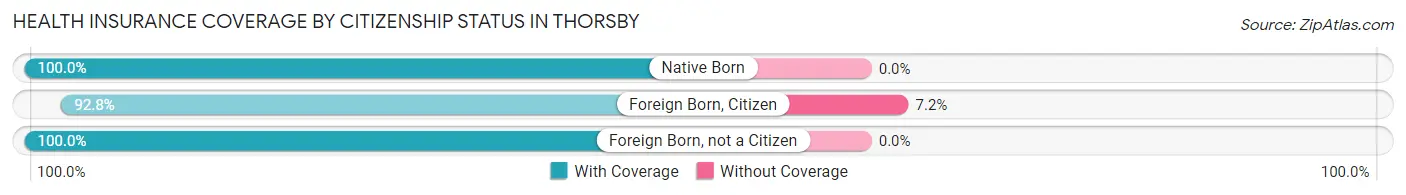
| Citizenship Status | With Coverage | Without Coverage |
| Native Born | 243 (100.0%) | 0 (0.0%) |
| Foreign Born, Citizen | 333 (92.8%) | 26 (7.2%) |
| Foreign Born, not a Citizen | 210 (100.0%) | 0 (0.0%) |
Health Insurance Coverage by Household Income in Thorsby
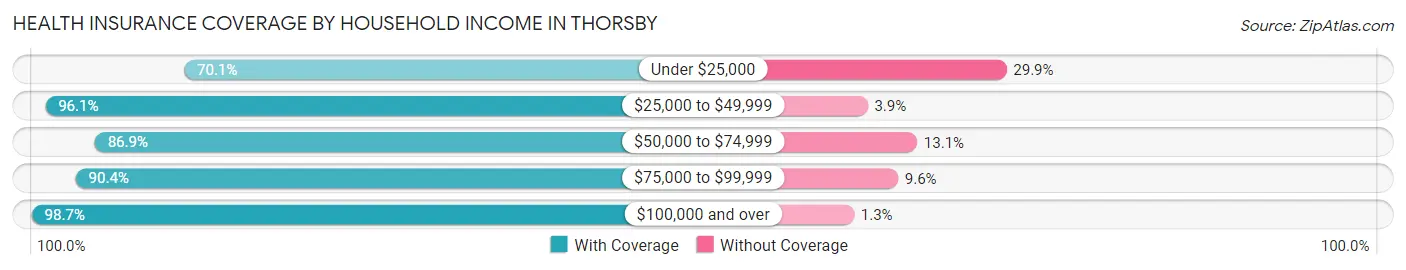
| Household Income | With Coverage | Without Coverage |
| Under $25,000 | 197 (70.1%) | 84 (29.9%) |
| $25,000 to $49,999 | 571 (96.1%) | 23 (3.9%) |
| $50,000 to $74,999 | 205 (86.9%) | 31 (13.1%) |
| $75,000 to $99,999 | 482 (90.4%) | 51 (9.6%) |
| $100,000 and over | 896 (98.7%) | 12 (1.3%) |
Public vs Private Health Insurance Coverage by Age in Thorsby
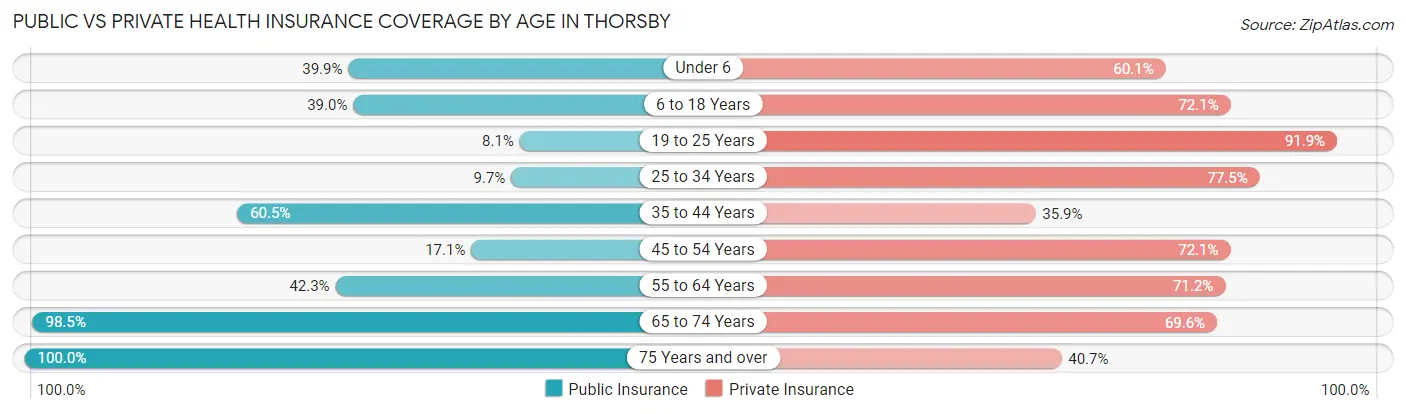
| Age Bracket | Public Insurance | Private Insurance |
| Under 6 | 97 (39.9%) | 146 (60.1%) |
| 6 to 18 Years | 140 (39.0%) | 259 (72.1%) |
| 19 to 25 Years | 17 (8.1%) | 193 (91.9%) |
| 25 to 34 Years | 22 (9.7%) | 176 (77.5%) |
| 35 to 44 Years | 342 (60.5%) | 203 (35.9%) |
| 45 to 54 Years | 46 (17.1%) | 194 (72.1%) |
| 55 to 64 Years | 173 (42.3%) | 291 (71.2%) |
| 65 to 74 Years | 133 (98.5%) | 94 (69.6%) |
| 75 Years and over | 135 (100.0%) | 55 (40.7%) |
| Total | 1,105 (43.3%) | 1,611 (63.1%) |
Disability Status by Sex by Age in Thorsby
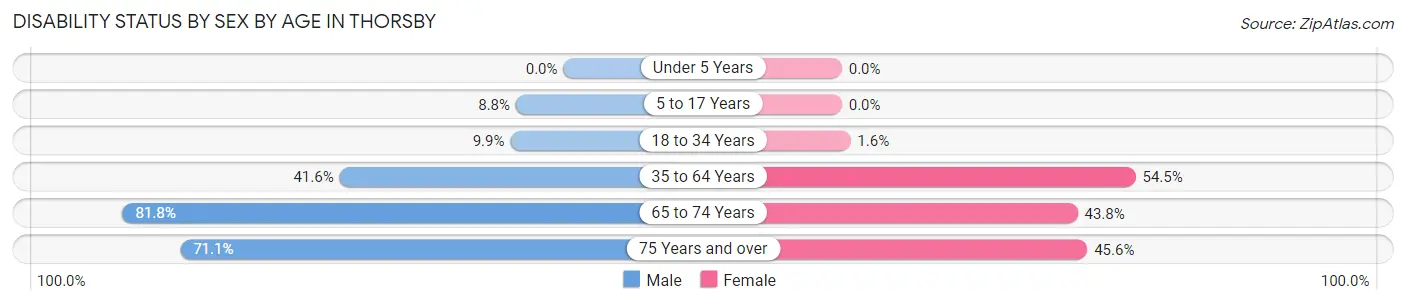
| Age Bracket | Male | Female |
| Under 5 Years | 0 (0.0%) | 0 (0.0%) |
| 5 to 17 Years | 14 (8.8%) | 0 (0.0%) |
| 18 to 34 Years | 27 (9.9%) | 3 (1.6%) |
| 35 to 64 Years | 236 (41.5%) | 368 (54.5%) |
| 65 to 74 Years | 45 (81.8%) | 35 (43.8%) |
| 75 Years and over | 32 (71.1%) | 41 (45.6%) |
Disability Class by Sex by Age in Thorsby
Disability Class: Hearing Difficulty
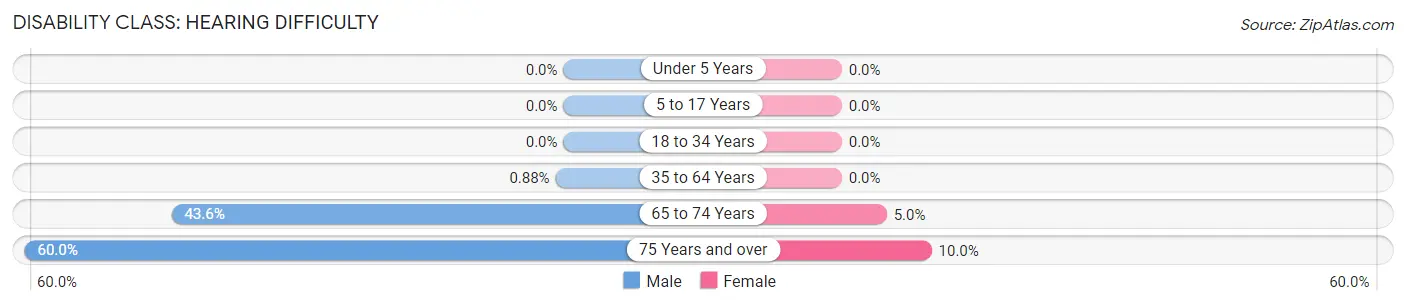
| Age Bracket | Male | Female |
| Under 5 Years | 0 (0.0%) | 0 (0.0%) |
| 5 to 17 Years | 0 (0.0%) | 0 (0.0%) |
| 18 to 34 Years | 0 (0.0%) | 0 (0.0%) |
| 35 to 64 Years | 5 (0.9%) | 0 (0.0%) |
| 65 to 74 Years | 24 (43.6%) | 4 (5.0%) |
| 75 Years and over | 27 (60.0%) | 9 (10.0%) |
Disability Class: Vision Difficulty
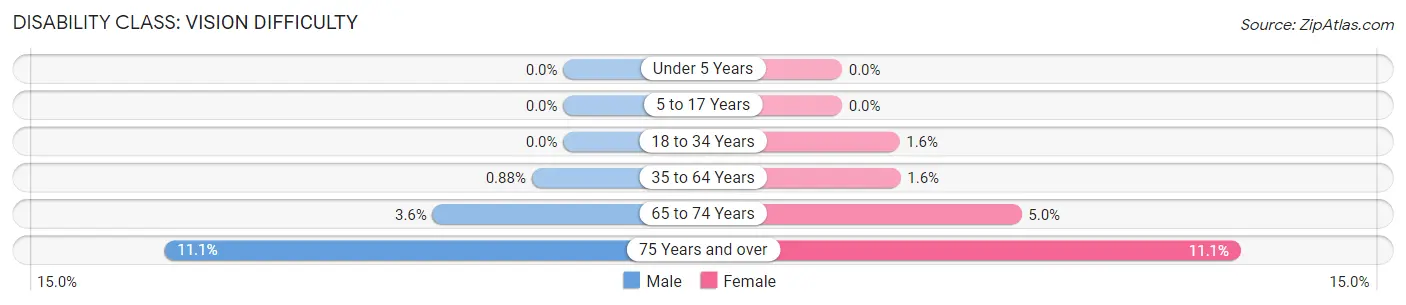
| Age Bracket | Male | Female |
| Under 5 Years | 0 (0.0%) | 0 (0.0%) |
| 5 to 17 Years | 0 (0.0%) | 0 (0.0%) |
| 18 to 34 Years | 0 (0.0%) | 3 (1.6%) |
| 35 to 64 Years | 5 (0.9%) | 11 (1.6%) |
| 65 to 74 Years | 2 (3.6%) | 4 (5.0%) |
| 75 Years and over | 5 (11.1%) | 10 (11.1%) |
Disability Class: Cognitive Difficulty
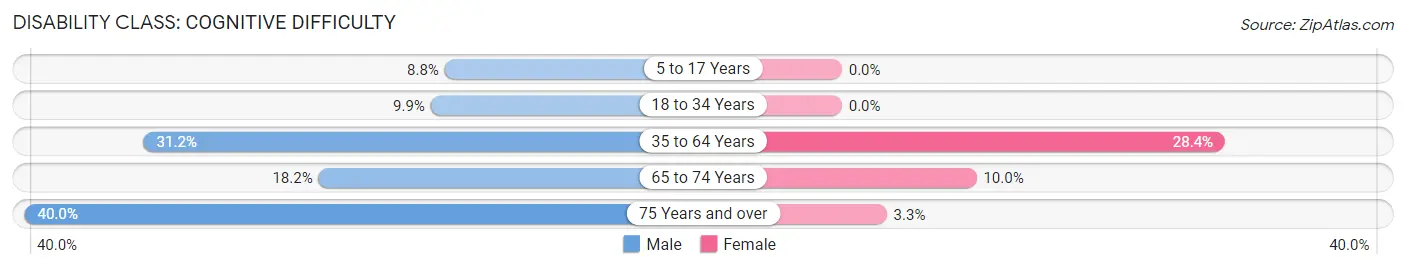
| Age Bracket | Male | Female |
| 5 to 17 Years | 14 (8.8%) | 0 (0.0%) |
| 18 to 34 Years | 27 (9.9%) | 0 (0.0%) |
| 35 to 64 Years | 177 (31.2%) | 192 (28.4%) |
| 65 to 74 Years | 10 (18.2%) | 8 (10.0%) |
| 75 Years and over | 18 (40.0%) | 3 (3.3%) |
Disability Class: Ambulatory Difficulty
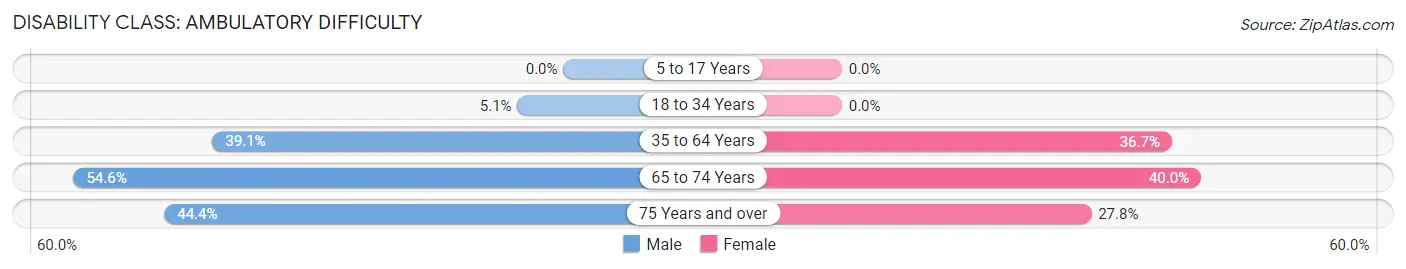
| Age Bracket | Male | Female |
| 5 to 17 Years | 0 (0.0%) | 0 (0.0%) |
| 18 to 34 Years | 14 (5.1%) | 0 (0.0%) |
| 35 to 64 Years | 222 (39.1%) | 248 (36.7%) |
| 65 to 74 Years | 30 (54.5%) | 32 (40.0%) |
| 75 Years and over | 20 (44.4%) | 25 (27.8%) |
Disability Class: Self-Care Difficulty
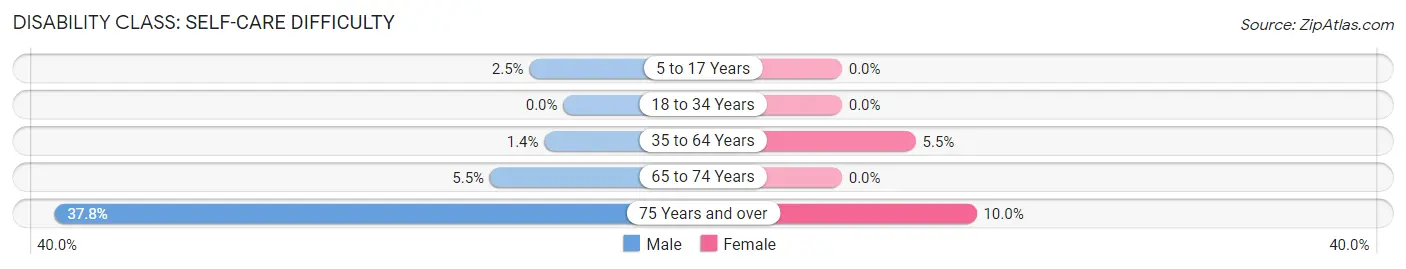
| Age Bracket | Male | Female |
| 5 to 17 Years | 4 (2.5%) | 0 (0.0%) |
| 18 to 34 Years | 0 (0.0%) | 0 (0.0%) |
| 35 to 64 Years | 8 (1.4%) | 37 (5.5%) |
| 65 to 74 Years | 3 (5.4%) | 0 (0.0%) |
| 75 Years and over | 17 (37.8%) | 9 (10.0%) |
Technology Access in Thorsby
Computing Device Access in Thorsby
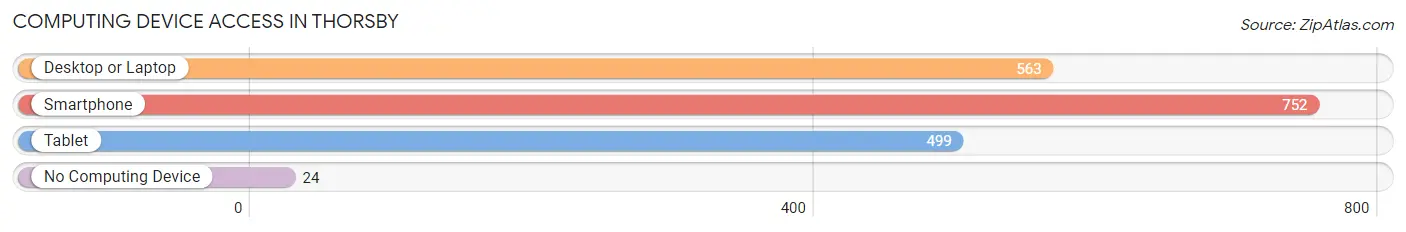
| Device Type | # Households | % Households |
| Desktop or Laptop | 563 | 68.9% |
| Smartphone | 752 | 92.0% |
| Tablet | 499 | 61.1% |
| No Computing Device | 24 | 2.9% |
| Total | 817 | 100.0% |
Internet Access in Thorsby
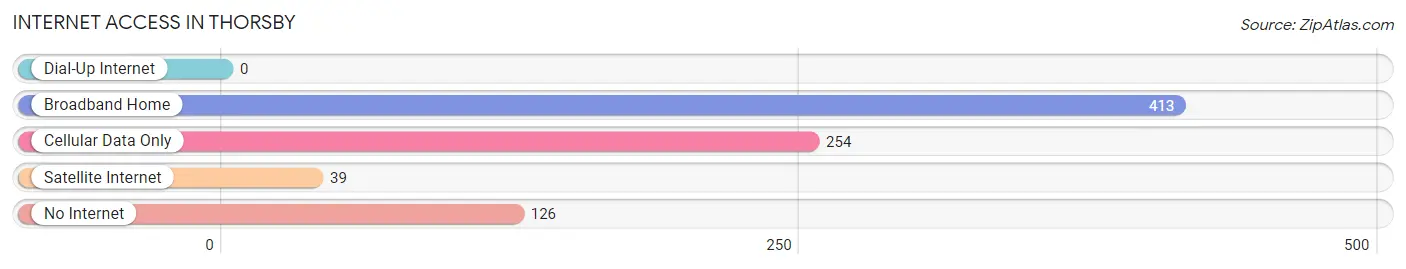
| Internet Type | # Households | % Households |
| Dial-Up Internet | 0 | 0.0% |
| Broadband Home | 413 | 50.5% |
| Cellular Data Only | 254 | 31.1% |
| Satellite Internet | 39 | 4.8% |
| No Internet | 126 | 15.4% |
| Total | 817 | 100.0% |
Thorsby Summary
Thorsby is a small town located in Chilton County, Alabama. It is situated about 25 miles south of Birmingham and is part of the Birmingham-Hoover Metropolitan Statistical Area. The town was founded in 1887 and was named after the Norse god Thor. The population of Thorsby was 1,845 as of the 2010 census.
Geography
Thorsby is located at 33°14'25"N 86°37'45"W (33.240278, -86.629167). According to the U.S. Census Bureau, the town has a total area of 4.2 square miles, all land.
The town is located in the foothills of the Appalachian Mountains and is surrounded by rolling hills and forests. The town is situated on the banks of the Little Cahaba River, which flows through the town and is a popular spot for fishing and canoeing.
Climate
Thorsby has a humid subtropical climate, with hot, humid summers and mild winters. The average annual temperature is 64°F (18°C). The average annual precipitation is 56 inches (142 cm).
Demographics
As of the 2010 census, there were 1,845 people, 717 households, and 498 families residing in the town. The population density was 441.2 people per square mile (170.3/km2). There were 790 housing units at an average density of 188.1 per square mile (72.6/km2). The racial makeup of the town was 79.2% White, 17.7% African American, 0.2% Native American, 0.4% Asian, 0.1% Pacific Islander, 1.2% from other races, and 1.2% from two or more races. Hispanic or Latino of any race were 2.7% of the population.
There were 717 households, out of which 28.7% had children under the age of 18 living with them, 48.2% were married couples living together, 14.7% had a female householder with no husband present, and 32.2% were non-families. 28.2% of all households were made up of individuals, and 13.2% had someone living alone who was 65 years of age or older. The average household size was 2.50 and the average family size was 3.06.
In the town, the population was spread out, with 24.2% under the age of 18, 8.2% from 18 to 24, 25.7% from 25 to 44, 24.2% from 45 to 64, and 17.7% who were 65 years of age or older. The median age was 38 years. For every 100 females, there were 87.2 males. For every 100 females age 18 and over, there were 83.2 males.
The median income for a household in the town was $32,500, and the median income for a family was $41,250. Males had a median income of $31,250 versus $21,250 for females. The per capita income for the town was $17,845. About 11.2% of families and 14.2% of the population were below the poverty line, including 19.2% of those under age 18 and 11.2% of those age 65 or over.
Economy
The economy of Thorsby is largely based on agriculture and manufacturing. The town is home to several poultry processing plants, as well as a number of small businesses. The town is also home to a number of antique stores and flea markets.
The town is served by the Chilton County Airport, which is located just outside of town. The airport offers general aviation services, as well as charter flights.
Education
Thorsby is served by the Chilton County School District. The town is home to Thorsby High School, which serves grades 9-12. The school has an enrollment of approximately 500 students. The town is also home to Thorsby Elementary School, which serves grades K-8.
The town is also home to the University of Alabama at Birmingham's Chilton County Extension Center, which offers a variety of educational programs and services to the community.
Conclusion
Thorsby is a small town located in Chilton County, Alabama. It is situated about 25 miles south of Birmingham and is part of the Birmingham-Hoover Metropolitan Statistical Area. The town was founded in 1887 and was named after the Norse god Thor. The population of Thorsby was 1,845 as of the 2010 census. The town is located in the foothills of the Appalachian Mountains and is surrounded by rolling hills and forests. The town is situated on the banks of the Little Cahaba River, which flows through the town and is a popular spot for fishing and canoeing. The economy of Thorsby is largely based on agriculture and manufacturing. The town is served by the Chilton County School District and is home to the University of Alabama at Birmingham's Chilton County Extension Center.
Common Questions
What is the Total Population of Thorsby?
Total Population of Thorsby is 2,552.
What is the Total Male Population of Thorsby?
Total Male Population of Thorsby is 1,241.
What is the Total Female Population of Thorsby?
Total Female Population of Thorsby is 1,311.
What is the Ratio of Males per 100 Females in Thorsby?
There are 94.66 Males per 100 Females in Thorsby.
What is the Ratio of Females per 100 Males in Thorsby?
There are 105.64 Females per 100 Males in Thorsby.
What is the Median Population Age in Thorsby?
Median Population Age in Thorsby is 37.9 Years.
What is the Average Family Size in Thorsby
Average Family Size in Thorsby is 3.5 People.
What is the Average Household Size in Thorsby
Average Household Size in Thorsby is 3.1 People.
What is Per Capita Income in Thorsby?
Per Capita income in Thorsby is $26,348.
What is the Median Family Income in Thorsby?
Median Family Income in Thorsby is $80,338.
What is the Median Household income in Thorsby?
Median Household Income in Thorsby is $72,188.
What is Income or Wage Gap in Thorsby?
Income or Wage Gap in Thorsby is 52.7%.
Women in Thorsby earn 47.3 cents for every dollar earned by a man.
What is Inequality or Gini Index in Thorsby?
Inequality or Gini Index in Thorsby is 0.37.
How Large is the Labor Force in Thorsby?
There are 1,022 People in the Labor Forcein in Thorsby.
What is the Percentage of People in the Labor Force in Thorsby?
51.1% of People are in the Labor Force in Thorsby.
What is the Unemployment Rate in Thorsby?
Unemployment Rate in Thorsby is 5.3%.