Deer Island, OR Map & Demographics
Deer Island Map
Deer Island Overview
$20,331
PER CAPITA INCOME
$80,819
AVG FAMILY INCOME
0.35
INEQUALITY / GINI INDEX
230
TOTAL POPULATION
115
MALE POPULATION
115
FEMALE POPULATION
100.00
MALES / 100 FEMALES
100.00
FEMALES / 100 MALES
40.2
MEDIAN AGE
3.8
AVG FAMILY SIZE
2.4
AVG HOUSEHOLD SIZE
64
LABOR FORCE [ PEOPLE ]
33.7%
PERCENT IN LABOR FORCE
25.0%
UNEMPLOYMENT RATE
Deer Island Zip Codes
Deer Island Area Codes
Income in Deer Island
Income Overview in Deer Island
| Characteristic | Number | Measure |
| Per Capita Income | 230 | $20,331 |
| Median Family Income | 39 | $80,819 |
| Mean Family Income | 39 | $77,954 |
| Median Household Income | 95 | $0 |
| Mean Household Income | 95 | $51,625 |
| Income Deficit | 39 | $0 |
| Wage / Income Gap (%) | 230 | 0.00% |
| Wage / Income Gap ($) | 230 | 100.00¢ per $1 |
| Gini / Inequality Index | 230 | 0.35 |
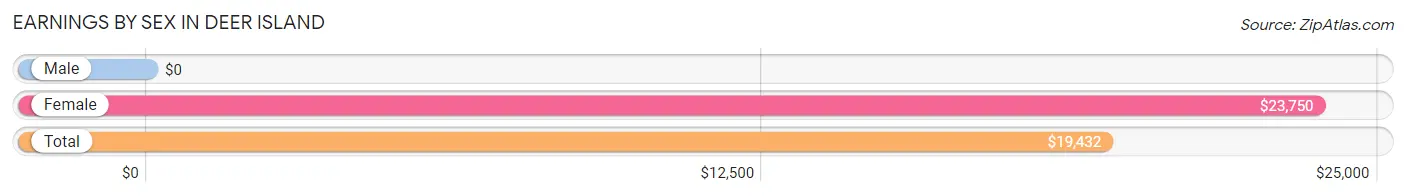
Earnings by Sex in Deer Island
| Sex | Number | Average Earnings |
| Male | 38 (46.3%) | $0 |
| Female | 44 (53.7%) | $23,750 |
| Total | 82 (100.0%) | $19,432 |
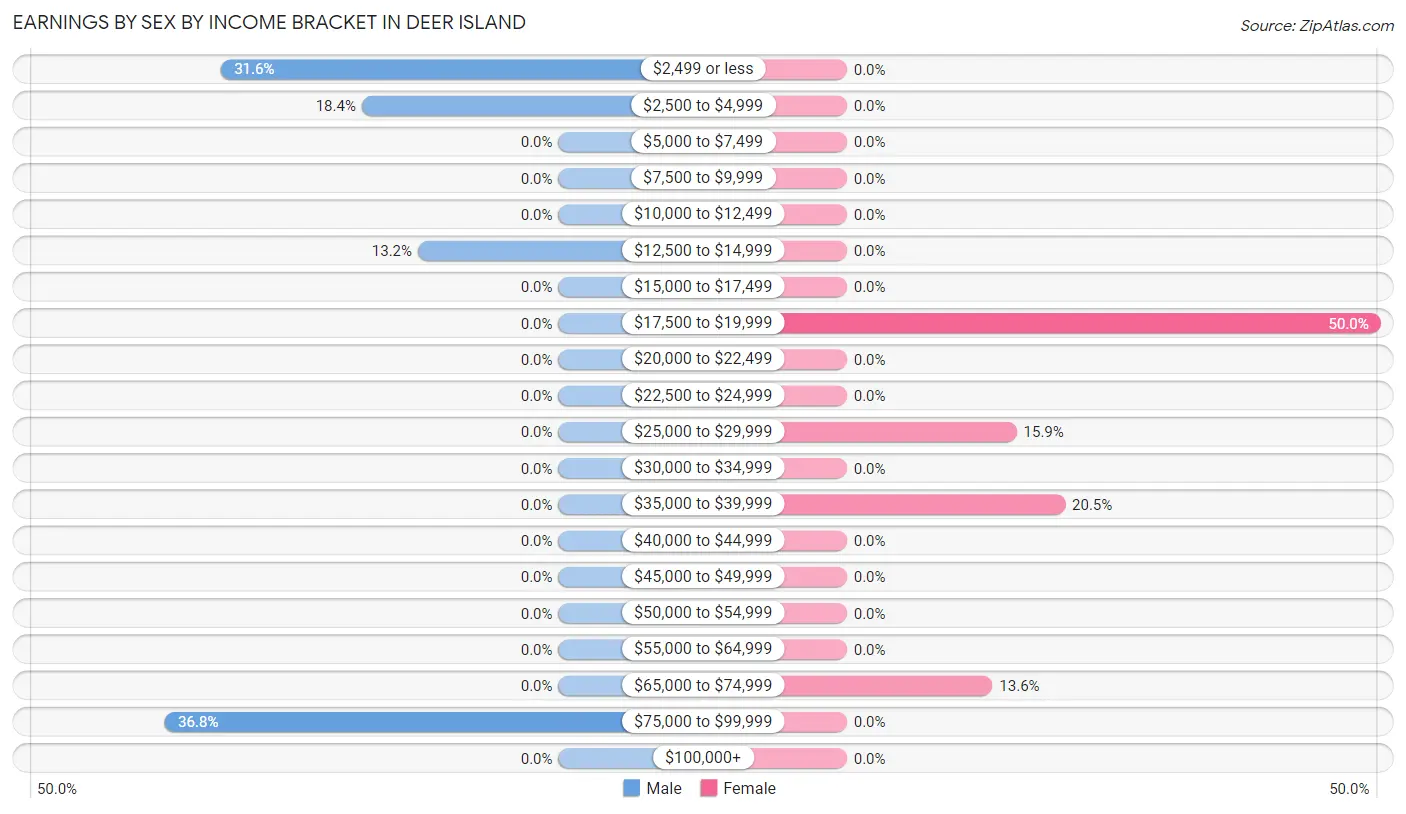
Earnings by Sex by Income Bracket in Deer Island
The most common earnings brackets in Deer Island are $75,000 to $99,999 for men (14 | 36.8%) and $17,500 to $19,999 for women (22 | 50.0%).
| Income | Male | Female |
| $2,499 or less | 12 (31.6%) | 0 (0.0%) |
| $2,500 to $4,999 | 7 (18.4%) | 0 (0.0%) |
| $5,000 to $7,499 | 0 (0.0%) | 0 (0.0%) |
| $7,500 to $9,999 | 0 (0.0%) | 0 (0.0%) |
| $10,000 to $12,499 | 0 (0.0%) | 0 (0.0%) |
| $12,500 to $14,999 | 5 (13.2%) | 0 (0.0%) |
| $15,000 to $17,499 | 0 (0.0%) | 0 (0.0%) |
| $17,500 to $19,999 | 0 (0.0%) | 22 (50.0%) |
| $20,000 to $22,499 | 0 (0.0%) | 0 (0.0%) |
| $22,500 to $24,999 | 0 (0.0%) | 0 (0.0%) |
| $25,000 to $29,999 | 0 (0.0%) | 7 (15.9%) |
| $30,000 to $34,999 | 0 (0.0%) | 0 (0.0%) |
| $35,000 to $39,999 | 0 (0.0%) | 9 (20.4%) |
| $40,000 to $44,999 | 0 (0.0%) | 0 (0.0%) |
| $45,000 to $49,999 | 0 (0.0%) | 0 (0.0%) |
| $50,000 to $54,999 | 0 (0.0%) | 0 (0.0%) |
| $55,000 to $64,999 | 0 (0.0%) | 0 (0.0%) |
| $65,000 to $74,999 | 0 (0.0%) | 6 (13.6%) |
| $75,000 to $99,999 | 14 (36.8%) | 0 (0.0%) |
| $100,000+ | 0 (0.0%) | 0 (0.0%) |
| Total | 38 (100.0%) | 44 (100.0%) |
Earnings by Sex by Educational Attainment in Deer Island
| Educational Attainment | Male Income | Female Income |
| Less than High School | - | - |
| High School Diploma | - | - |
| College or Associate's Degree | - | - |
| Bachelor's Degree | - | - |
| Graduate Degree | - | - |
| Total | - | - |
Family Income in Deer Island
Family Income Brackets in Deer Island
According to the Deer Island family income data, there are 29 families falling into the $75,000 to $99,999 income range, which is the most common income bracket and makes up 74.4% of all families.
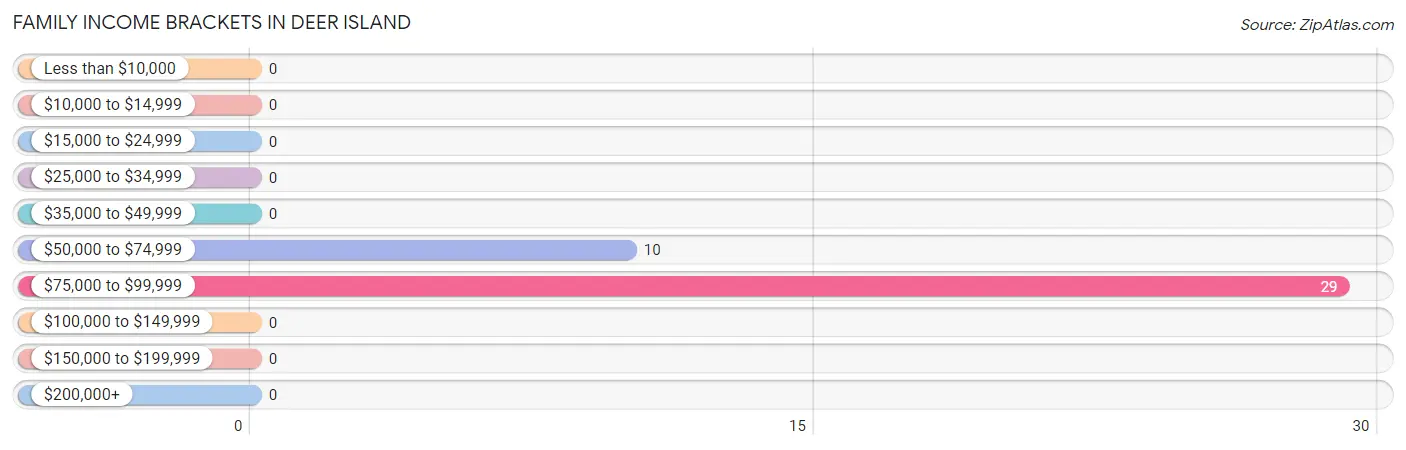
| Income Bracket | # Families | % Families |
| Less than $10,000 | 0 | 0.0% |
| $10,000 to $14,999 | 0 | 0.0% |
| $15,000 to $24,999 | 0 | 0.0% |
| $25,000 to $34,999 | 0 | 0.0% |
| $35,000 to $49,999 | 0 | 0.0% |
| $50,000 to $74,999 | 10 | 25.6% |
| $75,000 to $99,999 | 29 | 74.4% |
| $100,000 to $149,999 | 0 | 0.0% |
| $150,000 to $199,999 | 0 | 0.0% |
| $200,000+ | 0 | 0.0% |
Family Income by Famaliy Size in Deer Island

| Income Bracket | # Families | Median Income |
| 2-Person Families | 10 (25.6%) | $0 |
| 3-Person Families | 0 (0.0%) | $0 |
| 4-Person Families | 13 (33.3%) | $0 |
| 5-Person Families | 16 (41.0%) | $0 |
| 6-Person Families | 0 (0.0%) | $0 |
| 7+ Person Families | 0 (0.0%) | $0 |
| Total | 39 (100.0%) | $80,819 |
Family Income by Number of Earners in Deer Island
| Number of Earners | # Families | Median Income |
| No Earners | 4 (10.3%) | $0 |
| 1 Earner | 22 (56.4%) | $0 |
| 2 Earners | 13 (33.3%) | $0 |
| 3+ Earners | 0 (0.0%) | $0 |
| Total | 39 (100.0%) | $80,819 |
Household Income in Deer Island
Household Income Brackets in Deer Island
With 29 households falling in the category, the $15,000 to $24,999 income range is the most frequent in Deer Island, accounting for 30.5% of all households.
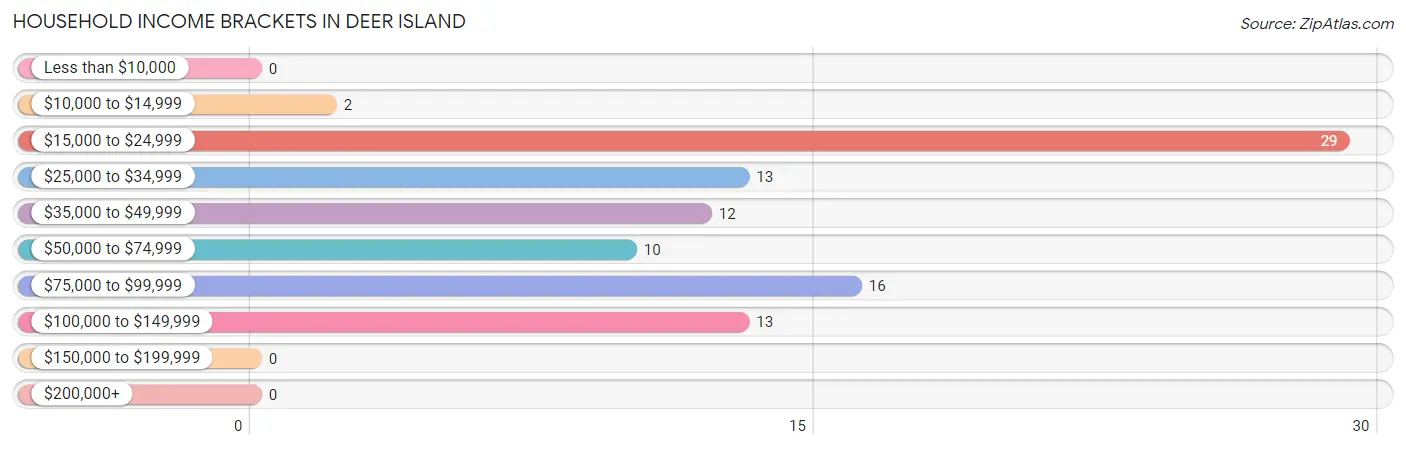
| Income Bracket | # Households | % Households |
| Less than $10,000 | 0 | 0.0% |
| $10,000 to $14,999 | 2 | 2.1% |
| $15,000 to $24,999 | 29 | 30.5% |
| $25,000 to $34,999 | 13 | 13.7% |
| $35,000 to $49,999 | 12 | 12.6% |
| $50,000 to $74,999 | 10 | 10.5% |
| $75,000 to $99,999 | 16 | 16.8% |
| $100,000 to $149,999 | 13 | 13.7% |
| $150,000 to $199,999 | 0 | 0.0% |
| $200,000+ | 0 | 0.0% |
Household Income by Householder Age in Deer Island
The median household income in Deer Island is $0, with the highest median household income of $21,484 found in the 65+ years age bracket for the primary householder. A total of 45 households (47.4%) fall into this category.
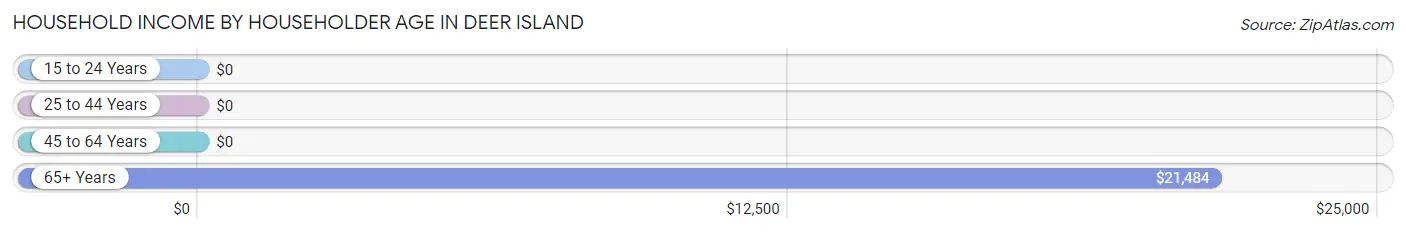
| Income Bracket | # Households | Median Income |
| 15 to 24 Years | 0 (0.0%) | $0 |
| 25 to 44 Years | 23 (24.2%) | $0 |
| 45 to 64 Years | 27 (28.4%) | $0 |
| 65+ Years | 45 (47.4%) | $21,484 |
| Total | 95 (100.0%) | $0 |
Poverty in Deer Island
Income Below Poverty by Sex and Age in Deer Island
With 6.1% poverty level for males and 7.8% for females among the residents of Deer Island, 35 to 44 year old males and 55 to 64 year old females are the most vulnerable to poverty, with 7 males (33.3%) and 9 females (32.1%) in their respective age groups living below the poverty level.
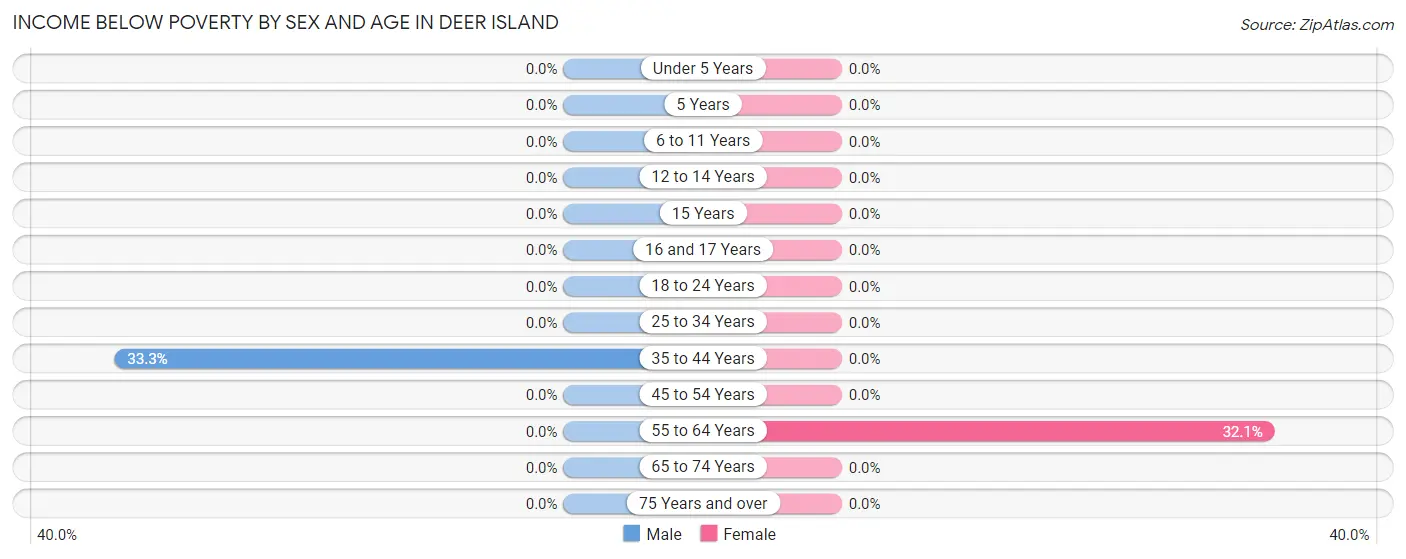
| Age Bracket | Male | Female |
| Under 5 Years | 0 (0.0%) | 0 (0.0%) |
| 5 Years | 0 (0.0%) | 0 (0.0%) |
| 6 to 11 Years | 0 (0.0%) | 0 (0.0%) |
| 12 to 14 Years | 0 (0.0%) | 0 (0.0%) |
| 15 Years | 0 (0.0%) | 0 (0.0%) |
| 16 and 17 Years | 0 (0.0%) | 0 (0.0%) |
| 18 to 24 Years | 0 (0.0%) | 0 (0.0%) |
| 25 to 34 Years | 0 (0.0%) | 0 (0.0%) |
| 35 to 44 Years | 7 (33.3%) | 0 (0.0%) |
| 45 to 54 Years | 0 (0.0%) | 0 (0.0%) |
| 55 to 64 Years | 0 (0.0%) | 9 (32.1%) |
| 65 to 74 Years | 0 (0.0%) | 0 (0.0%) |
| 75 Years and over | 0 (0.0%) | 0 (0.0%) |
| Total | 7 (6.1%) | 9 (7.8%) |
Income Above Poverty by Sex and Age in Deer Island
According to the poverty statistics in Deer Island, males aged under 5 years and females aged 18 to 24 years are the age groups that are most secure financially, with 100.0% of males and 100.0% of females in these age groups living above the poverty line.
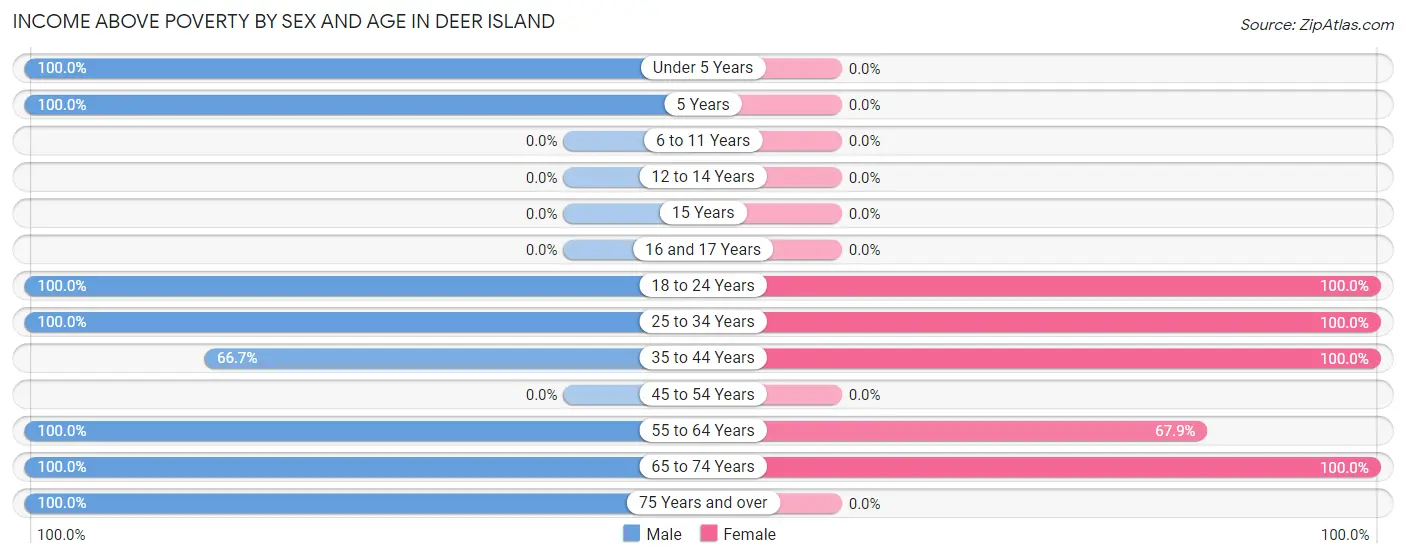
| Age Bracket | Male | Female |
| Under 5 Years | 24 (100.0%) | 0 (0.0%) |
| 5 Years | 16 (100.0%) | 0 (0.0%) |
| 6 to 11 Years | 0 (0.0%) | 0 (0.0%) |
| 12 to 14 Years | 0 (0.0%) | 0 (0.0%) |
| 15 Years | 0 (0.0%) | 0 (0.0%) |
| 16 and 17 Years | 0 (0.0%) | 0 (0.0%) |
| 18 to 24 Years | 9 (100.0%) | 22 (100.0%) |
| 25 to 34 Years | 12 (100.0%) | 7 (100.0%) |
| 35 to 44 Years | 14 (66.7%) | 25 (100.0%) |
| 45 to 54 Years | 0 (0.0%) | 0 (0.0%) |
| 55 to 64 Years | 17 (100.0%) | 19 (67.9%) |
| 65 to 74 Years | 4 (100.0%) | 33 (100.0%) |
| 75 Years and over | 12 (100.0%) | 0 (0.0%) |
| Total | 108 (93.9%) | 106 (92.2%) |
Income Below Poverty Among Married-Couple Families in Deer Island
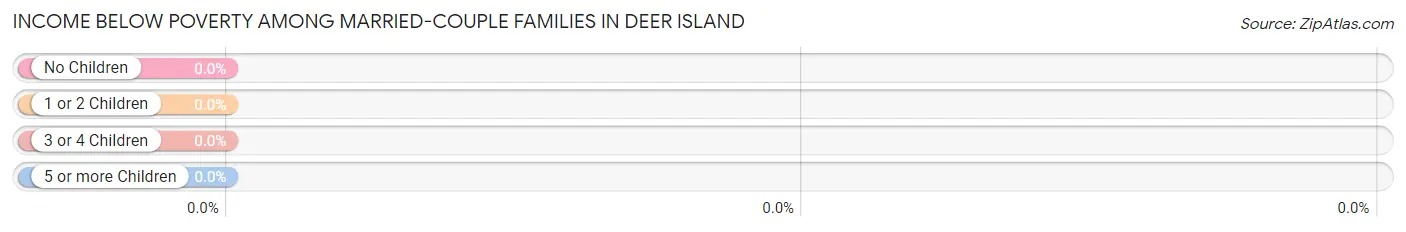
| Children | Above Poverty | Below Poverty |
| No Children | 17 (100.0%) | 0 (0.0%) |
| 1 or 2 Children | 0 (0.0%) | 0 (0.0%) |
| 3 or 4 Children | 16 (100.0%) | 0 (0.0%) |
| 5 or more Children | 0 (0.0%) | 0 (0.0%) |
| Total | 33 (100.0%) | 0 (0.0%) |
Income Below Poverty Among Single-Parent Households in Deer Island
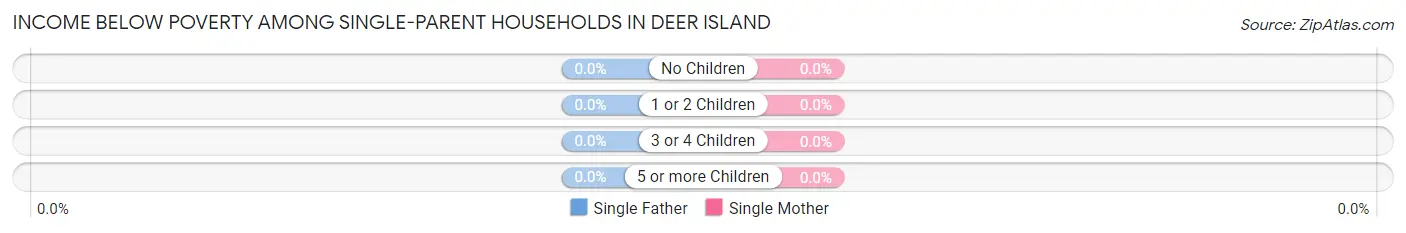
| Children | Single Father | Single Mother |
| No Children | 0 (0.0%) | 0 (0.0%) |
| 1 or 2 Children | 0 (0.0%) | 0 (0.0%) |
| 3 or 4 Children | 0 (0.0%) | 0 (0.0%) |
| 5 or more Children | 0 (0.0%) | 0 (0.0%) |
| Total | 0 (0.0%) | 0 (0.0%) |
Income Below Poverty Among Married-Couple vs Single-Parent Households in Deer Island
| Children | Married-Couple Families | Single-Parent Households |
| No Children | 0 (0.0%) | 0 (0.0%) |
| 1 or 2 Children | 0 (0.0%) | 0 (0.0%) |
| 3 or 4 Children | 0 (0.0%) | 0 (0.0%) |
| 5 or more Children | 0 (0.0%) | 0 (0.0%) |
| Total | 0 (0.0%) | 0 (0.0%) |
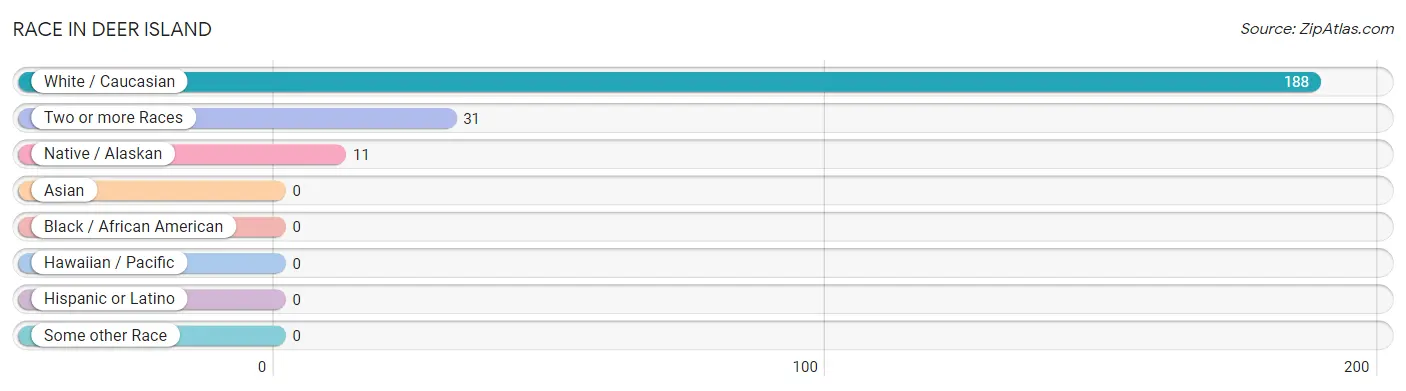
Race in Deer Island
The most populous races in Deer Island are White / Caucasian (188 | 81.7%), Two or more Races (31 | 13.5%), and Native / Alaskan (11 | 4.8%).
| Race | # Population | % Population |
| Asian | 0 | 0.0% |
| Black / African American | 0 | 0.0% |
| Hawaiian / Pacific | 0 | 0.0% |
| Hispanic or Latino | 0 | 0.0% |
| Native / Alaskan | 11 | 4.8% |
| White / Caucasian | 188 | 81.7% |
| Two or more Races | 31 | 13.5% |
| Some other Race | 0 | 0.0% |
| Total | 230 | 100.0% |
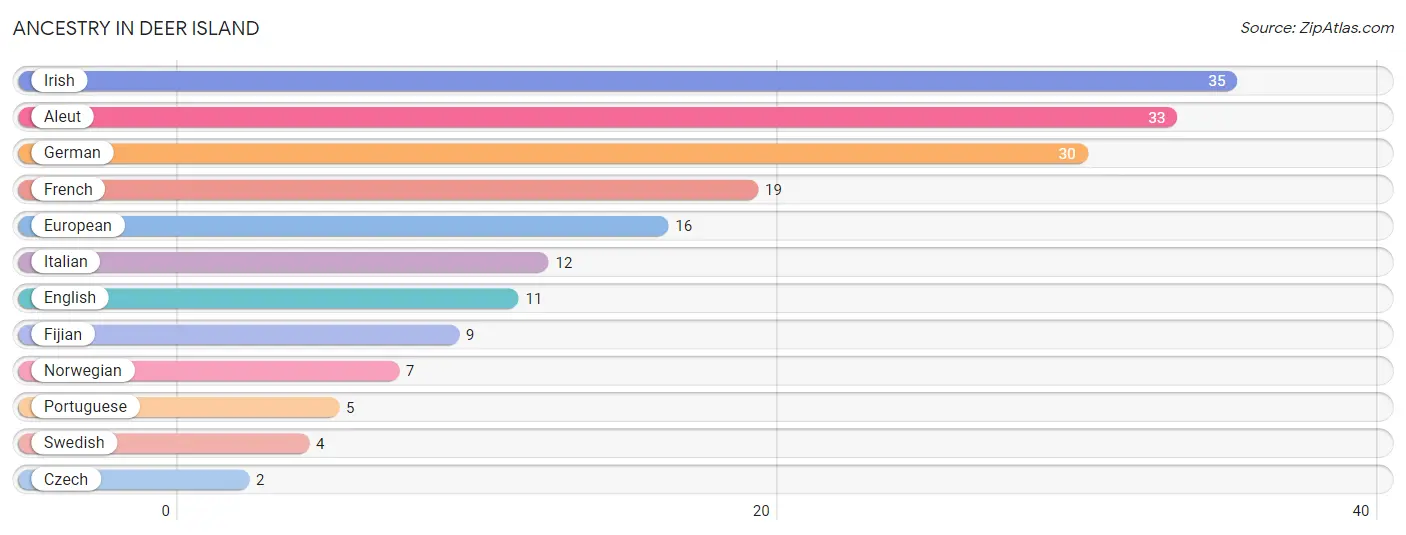
Ancestry in Deer Island
The most populous ancestries reported in Deer Island are Irish (35 | 15.2%), Aleut (33 | 14.3%), German (30 | 13.0%), French (19 | 8.3%), and European (16 | 7.0%), together accounting for 57.8% of all Deer Island residents.
| Ancestry | # Population | % Population |
| Aleut | 33 | 14.3% |
| Czech | 2 | 0.9% |
| English | 11 | 4.8% |
| European | 16 | 7.0% |
| Fijian | 9 | 3.9% |
| French | 19 | 8.3% |
| German | 30 | 13.0% |
| Irish | 35 | 15.2% |
| Italian | 12 | 5.2% |
| Norwegian | 7 | 3.0% |
| Portuguese | 5 | 2.2% |
| Swedish | 4 | 1.7% | View All 12 Rows |
Immigrants in Deer Island

| Immigration Origin | # Population | % Population | View All 0 Rows |
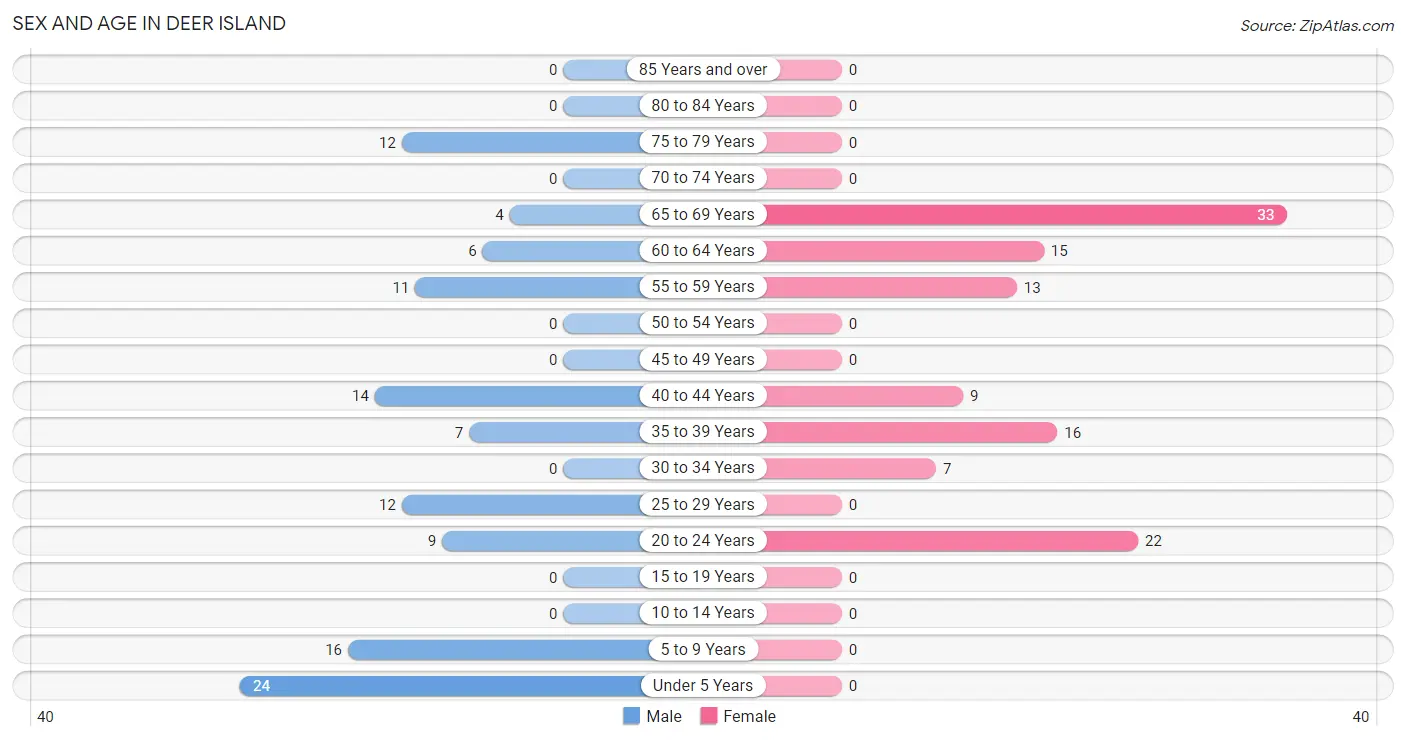
Sex and Age in Deer Island
Sex and Age in Deer Island
The most populous age groups in Deer Island are Under 5 Years (24 | 20.9%) for men and 65 to 69 Years (33 | 28.7%) for women.
| Age Bracket | Male | Female |
| Under 5 Years | 24 (20.9%) | 0 (0.0%) |
| 5 to 9 Years | 16 (13.9%) | 0 (0.0%) |
| 10 to 14 Years | 0 (0.0%) | 0 (0.0%) |
| 15 to 19 Years | 0 (0.0%) | 0 (0.0%) |
| 20 to 24 Years | 9 (7.8%) | 22 (19.1%) |
| 25 to 29 Years | 12 (10.4%) | 0 (0.0%) |
| 30 to 34 Years | 0 (0.0%) | 7 (6.1%) |
| 35 to 39 Years | 7 (6.1%) | 16 (13.9%) |
| 40 to 44 Years | 14 (12.2%) | 9 (7.8%) |
| 45 to 49 Years | 0 (0.0%) | 0 (0.0%) |
| 50 to 54 Years | 0 (0.0%) | 0 (0.0%) |
| 55 to 59 Years | 11 (9.6%) | 13 (11.3%) |
| 60 to 64 Years | 6 (5.2%) | 15 (13.0%) |
| 65 to 69 Years | 4 (3.5%) | 33 (28.7%) |
| 70 to 74 Years | 0 (0.0%) | 0 (0.0%) |
| 75 to 79 Years | 12 (10.4%) | 0 (0.0%) |
| 80 to 84 Years | 0 (0.0%) | 0 (0.0%) |
| 85 Years and over | 0 (0.0%) | 0 (0.0%) |
| Total | 115 (100.0%) | 115 (100.0%) |
Families and Households in Deer Island
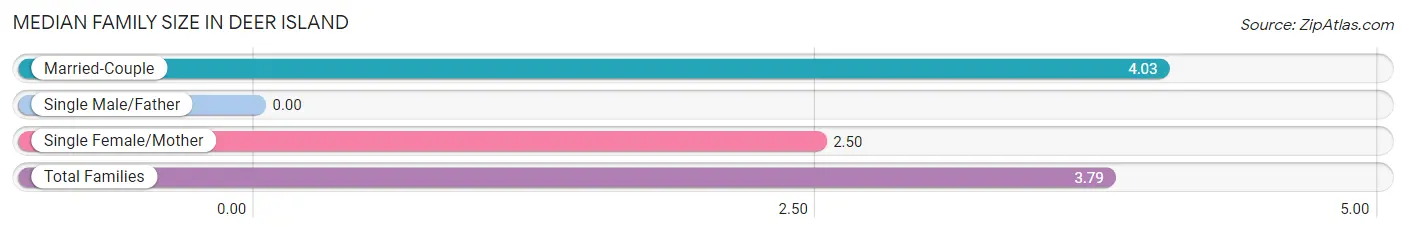
Median Family Size in Deer Island
| Family Type | # Families | Family Size |
| Married-Couple | 33 (84.6%) | 4.03 |
| Single Male/Father | 0 (0.0%) | - |
| Single Female/Mother | 6 (15.4%) | 2.50 |
| Total Families | 39 (100.0%) | 3.79 |
Median Household Size in Deer Island

| Household Type | # Households | Household Size |
| Married-Couple | 33 (34.7%) | 4.39 |
| Single Male/Father | 0 (0.0%) | - |
| Single Female/Mother | 6 (6.3%) | 2.50 |
| Non-family | 56 (59.0%) | 1.25 |
| Total Households | 95 (100.0%) | 2.42 |
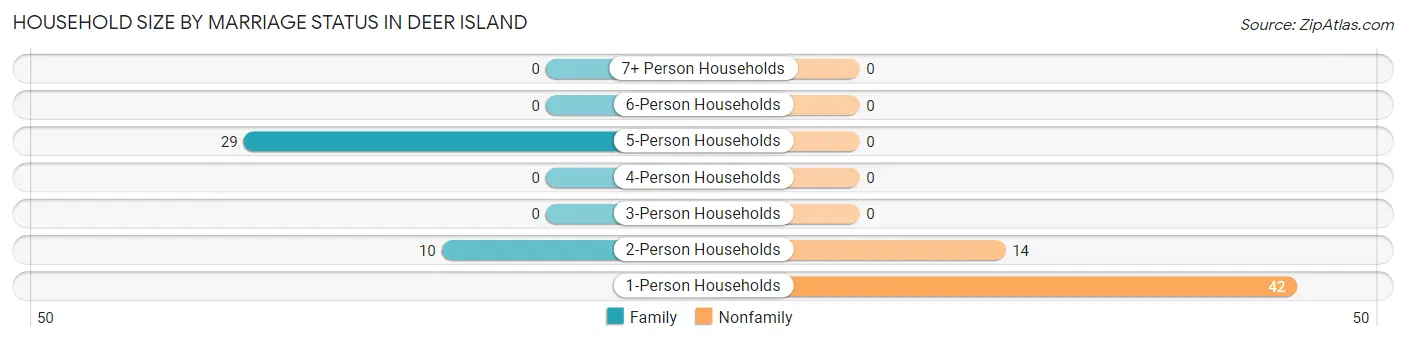
Household Size by Marriage Status in Deer Island
Out of a total of 95 households in Deer Island, 39 (41.0%) are family households, while 56 (59.0%) are nonfamily households. The most numerous type of family households are 5-person households, comprising 29, and the most common type of nonfamily households are 1-person households, comprising 42.
| Household Size | Family Households | Nonfamily Households |
| 1-Person Households | - | 42 (44.2%) |
| 2-Person Households | 10 (10.5%) | 14 (14.7%) |
| 3-Person Households | 0 (0.0%) | 0 (0.0%) |
| 4-Person Households | 0 (0.0%) | 0 (0.0%) |
| 5-Person Households | 29 (30.5%) | 0 (0.0%) |
| 6-Person Households | 0 (0.0%) | 0 (0.0%) |
| 7+ Person Households | 0 (0.0%) | 0 (0.0%) |
| Total | 39 (41.0%) | 56 (59.0%) |
Female Fertility in Deer Island
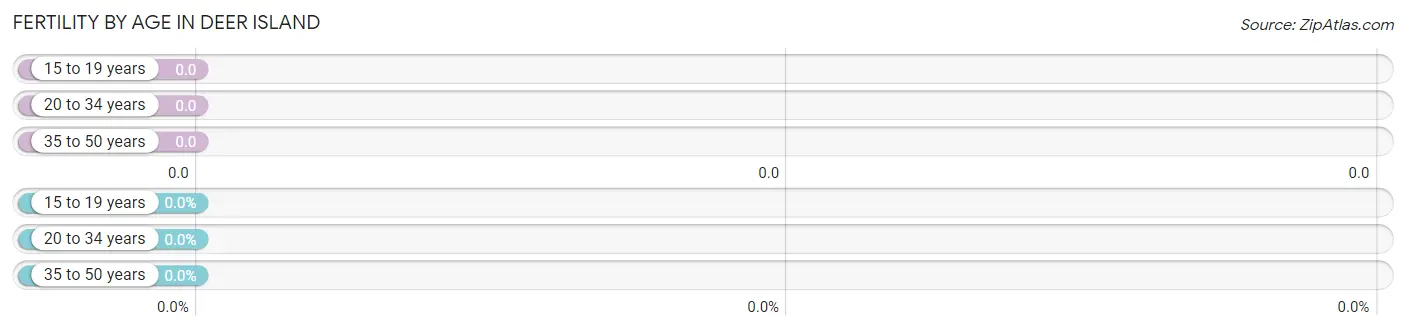
Fertility by Age in Deer Island
| Age Bracket | Women with Births | Births / 1,000 Women |
| 15 to 19 years | 0 (0.0%) | 0.0 |
| 20 to 34 years | 0 (0.0%) | 0.0 |
| 35 to 50 years | 0 (0.0%) | 0.0 |
| Total | 0 (0.0%) | 0.0 |
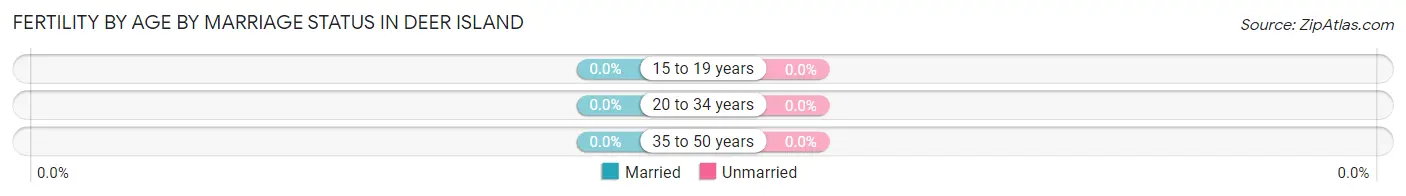
Fertility by Age by Marriage Status in Deer Island
| Age Bracket | Married | Unmarried |
| 15 to 19 years | 0 (0.0%) | 0 (0.0%) |
| 20 to 34 years | 0 (0.0%) | 0 (0.0%) |
| 35 to 50 years | 0 (0.0%) | 0 (0.0%) |
| Total | 0 (0.0%) | 0 (0.0%) |
Fertility by Education in Deer Island
| Educational Attainment | Women with Births | Births / 1,000 Women |
| Less than High School | 0 (0.0%) | 0.0 |
| High School Diploma | 0 (0.0%) | 0.0 |
| College or Associate's Degree | 0 (0.0%) | 0.0 |
| Bachelor's Degree | 0 (0.0%) | 0.0 |
| Graduate Degree | 0 (0.0%) | 0.0 |
| Total | 0 (0.0%) | 0.0 |
Fertility by Education by Marriage Status in Deer Island
| Educational Attainment | Married | Unmarried |
| Less than High School | 0 (0.0%) | 0 (0.0%) |
| High School Diploma | 0 (0.0%) | 0 (0.0%) |
| College or Associate's Degree | 0 (0.0%) | 0 (0.0%) |
| Bachelor's Degree | 0 (0.0%) | 0 (0.0%) |
| Graduate Degree | 0 (0.0%) | 0 (0.0%) |
| Total | 0 (0.0%) | 0 (0.0%) |
Employment Characteristics in Deer Island
Employment by Class of Employer in Deer Island
Among the 34 employed individuals in Deer Island, private company employees (29 | 85.3%), and self-employed (not incorporated) (5 | 14.7%) make up the most common classes of employment.
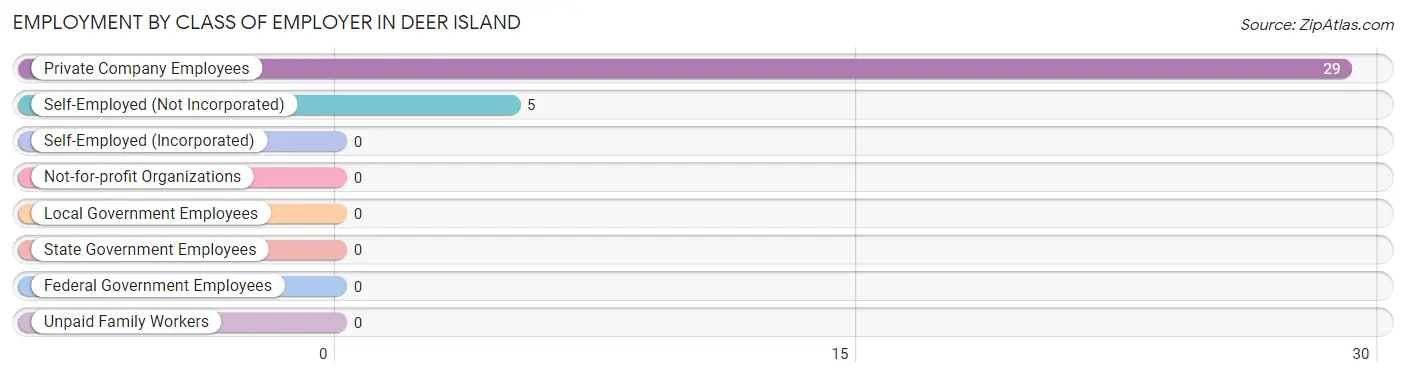
| Employer Class | # Employees | % Employees |
| Private Company Employees | 29 | 85.3% |
| Self-Employed (Incorporated) | 0 | 0.0% |
| Self-Employed (Not Incorporated) | 5 | 14.7% |
| Not-for-profit Organizations | 0 | 0.0% |
| Local Government Employees | 0 | 0.0% |
| State Government Employees | 0 | 0.0% |
| Federal Government Employees | 0 | 0.0% |
| Unpaid Family Workers | 0 | 0.0% |
| Total | 34 | 100.0% |
Employment Status by Age in Deer Island
According to the labor force statistics for Deer Island, out of the total population over 16 years of age (190), 33.7% or 64 individuals are in the labor force, with 25.0% or 16 of them unemployed. The age group with the highest labor force participation rate is 30 to 34 years, with 100.0% or 7 individuals in the labor force. Within the labor force, the 20 to 24 years age range has the highest percentage of unemployed individuals, with 100.0% or 9 of them being unemployed.
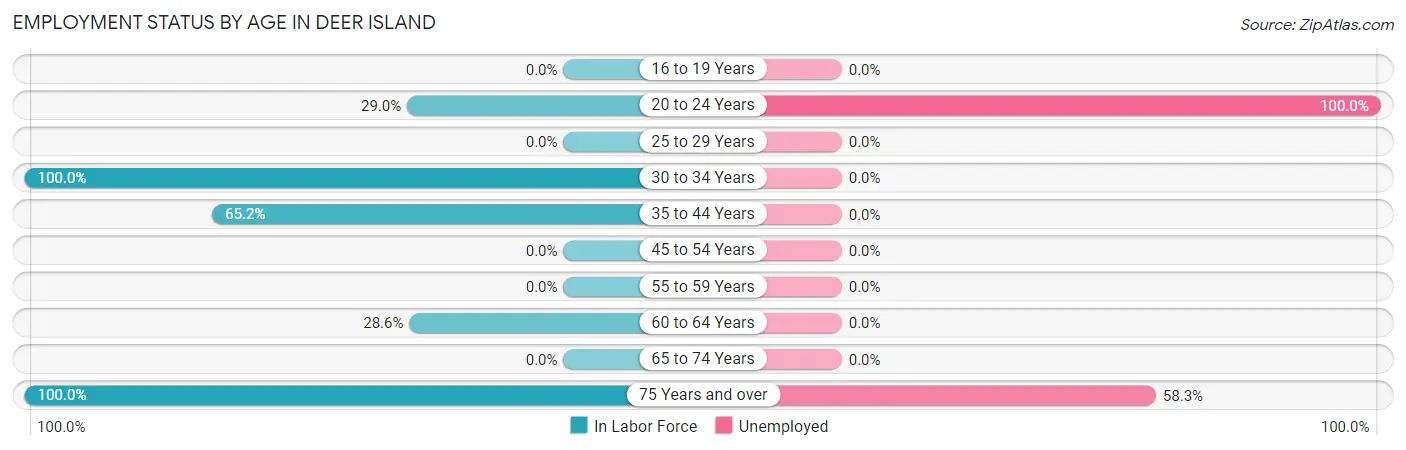
| Age Bracket | In Labor Force | Unemployed |
| 16 to 19 Years | 0 (0.0%) | 0 (0.0%) |
| 20 to 24 Years | 9 (29.0%) | 9 (100.0%) |
| 25 to 29 Years | 0 (0.0%) | 0 (0.0%) |
| 30 to 34 Years | 7 (100.0%) | 0 (0.0%) |
| 35 to 44 Years | 30 (65.2%) | 0 (0.0%) |
| 45 to 54 Years | 0 (0.0%) | 0 (0.0%) |
| 55 to 59 Years | 0 (0.0%) | 0 (0.0%) |
| 60 to 64 Years | 6 (28.6%) | 0 (0.0%) |
| 65 to 74 Years | 0 (0.0%) | 0 (0.0%) |
| 75 Years and over | 12 (100.0%) | 7 (58.3%) |
| Total | 64 (33.7%) | 16 (25.0%) |
Employment Status by Educational Attainment in Deer Island
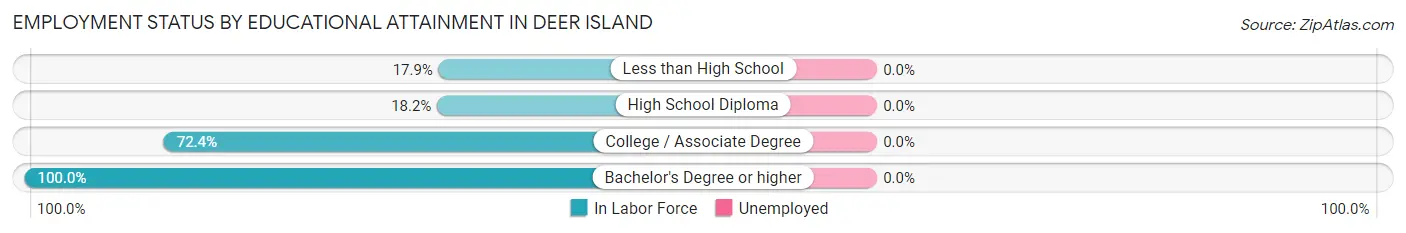
| Educational Attainment | In Labor Force | Unemployed |
| Less than High School | 7 (17.9%) | 0 (0.0%) |
| High School Diploma | 6 (18.2%) | 0 (0.0%) |
| College / Associate Degree | 21 (72.4%) | 0 (0.0%) |
| Bachelor's Degree or higher | 9 (100.0%) | 0 (0.0%) |
| Total | 43 (39.1%) | 0 (0.0%) |
Employment Occupations by Sex in Deer Island
Management, Business, Science and Arts Occupations
The most common Management, Business, Science and Arts occupations in Deer Island are , and Health Diagnosing & Treating (9 | 18.8%).
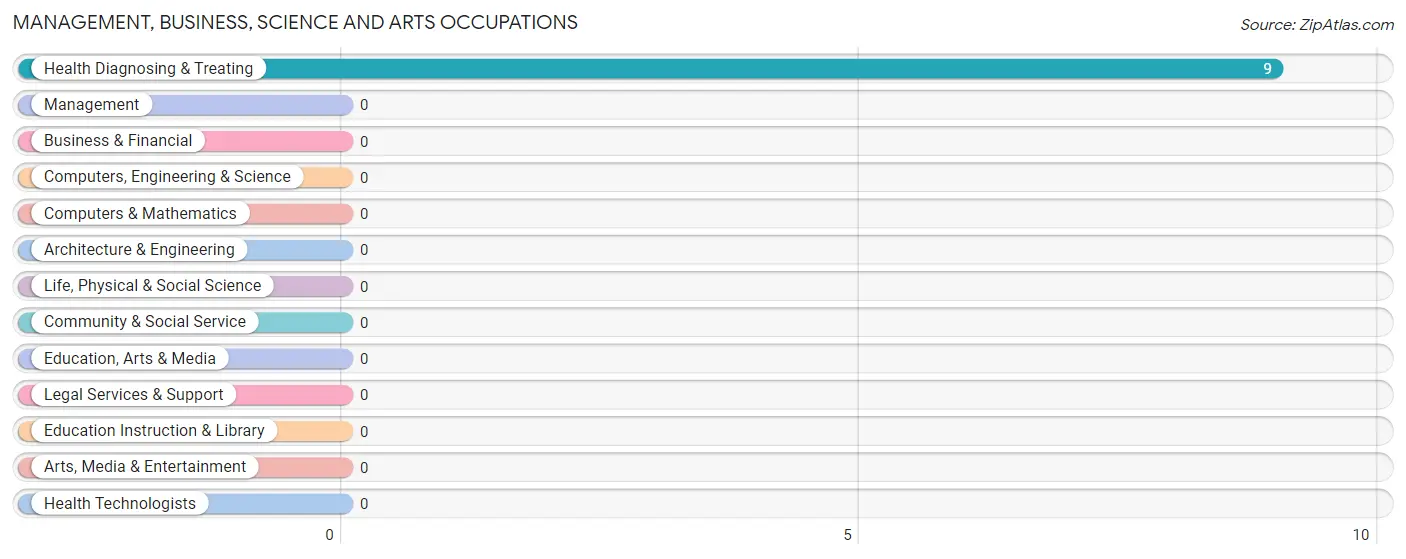
Management, Business, Science and Arts Occupations by Sex
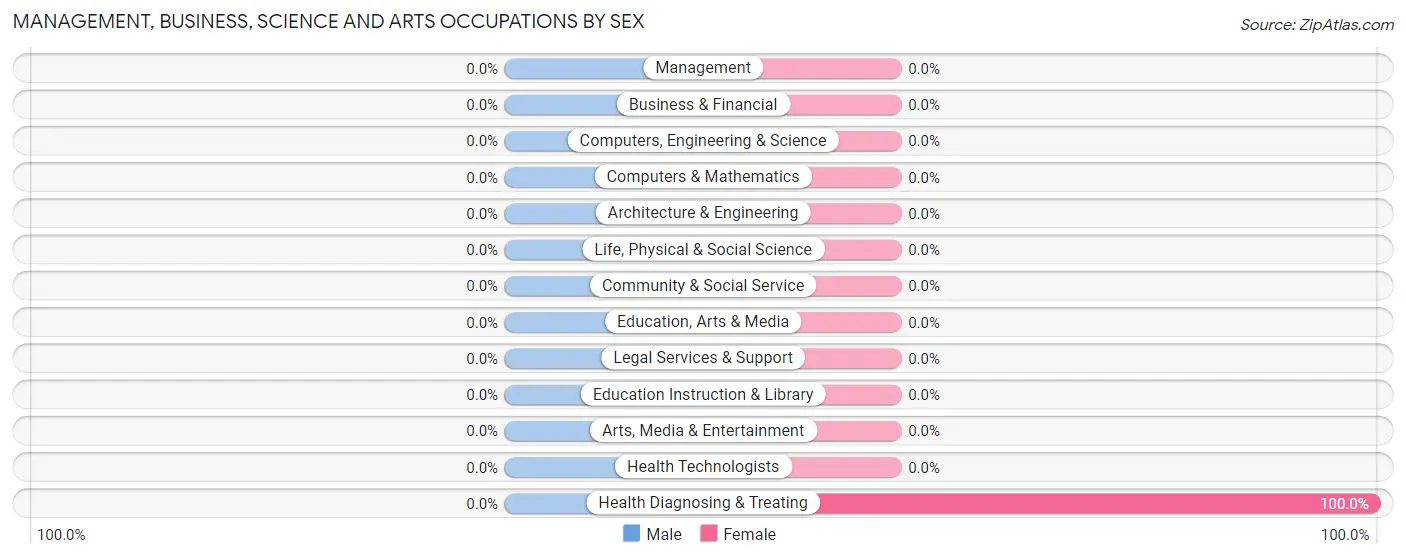
| Occupation | Male | Female |
| Management | 0 (0.0%) | 0 (0.0%) |
| Business & Financial | 0 (0.0%) | 0 (0.0%) |
| Computers, Engineering & Science | 0 (0.0%) | 0 (0.0%) |
| Computers & Mathematics | 0 (0.0%) | 0 (0.0%) |
| Architecture & Engineering | 0 (0.0%) | 0 (0.0%) |
| Life, Physical & Social Science | 0 (0.0%) | 0 (0.0%) |
| Community & Social Service | 0 (0.0%) | 0 (0.0%) |
| Education, Arts & Media | 0 (0.0%) | 0 (0.0%) |
| Legal Services & Support | 0 (0.0%) | 0 (0.0%) |
| Education Instruction & Library | 0 (0.0%) | 0 (0.0%) |
| Arts, Media & Entertainment | 0 (0.0%) | 0 (0.0%) |
| Health Diagnosing & Treating | 0 (0.0%) | 9 (100.0%) |
| Health Technologists | 0 (0.0%) | 0 (0.0%) |
| Total (Category) | 0 (0.0%) | 9 (100.0%) |
| Total (Overall) | 26 (54.2%) | 22 (45.8%) |
Services Occupations
The most common Services occupations in Deer Island are , and Cleaning & Maintenance (14 | 29.2%).
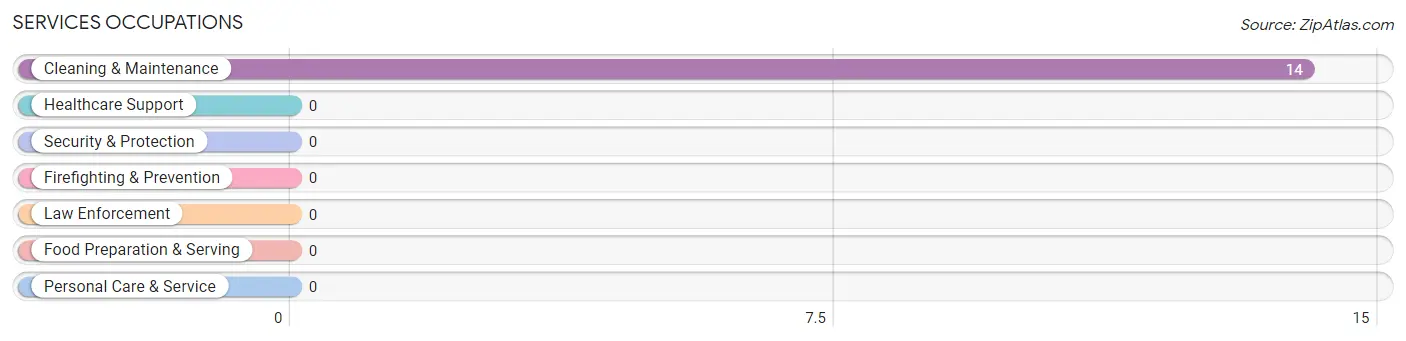
Services Occupations by Sex

| Occupation | Male | Female |
| Healthcare Support | 0 (0.0%) | 0 (0.0%) |
| Security & Protection | 0 (0.0%) | 0 (0.0%) |
| Firefighting & Prevention | 0 (0.0%) | 0 (0.0%) |
| Law Enforcement | 0 (0.0%) | 0 (0.0%) |
| Food Preparation & Serving | 0 (0.0%) | 0 (0.0%) |
| Cleaning & Maintenance | 14 (100.0%) | 0 (0.0%) |
| Personal Care & Service | 0 (0.0%) | 0 (0.0%) |
| Total (Category) | 14 (100.0%) | 0 (0.0%) |
| Total (Overall) | 26 (54.2%) | 22 (45.8%) |
Sales and Office Occupations
The most common Sales and Office occupations in Deer Island are , and Sales & Related (6 | 12.5%).
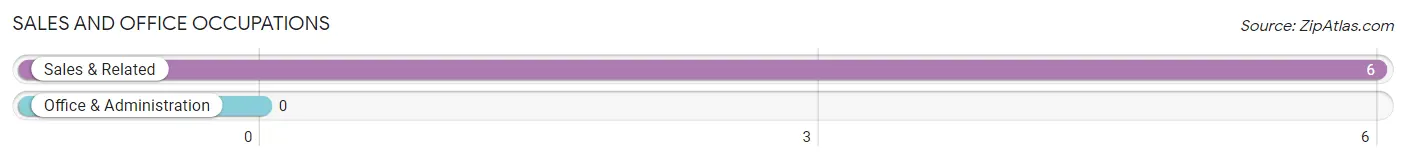
Sales and Office Occupations by Sex
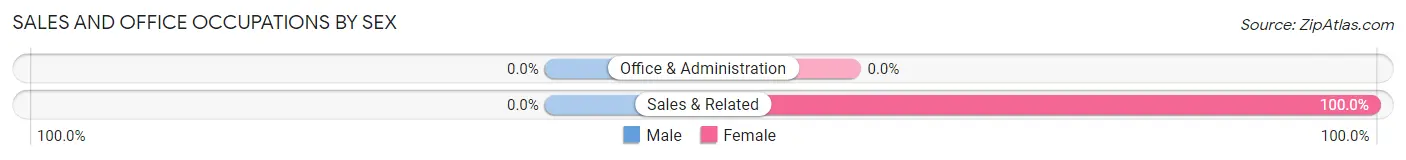
| Occupation | Male | Female |
| Sales & Related | 0 (0.0%) | 6 (100.0%) |
| Office & Administration | 0 (0.0%) | 0 (0.0%) |
| Total (Category) | 0 (0.0%) | 6 (100.0%) |
| Total (Overall) | 26 (54.2%) | 22 (45.8%) |
Natural Resources, Construction and Maintenance Occupations
The most common Natural Resources, Construction and Maintenance occupations in Deer Island are , and Construction & Extraction (5 | 10.4%).
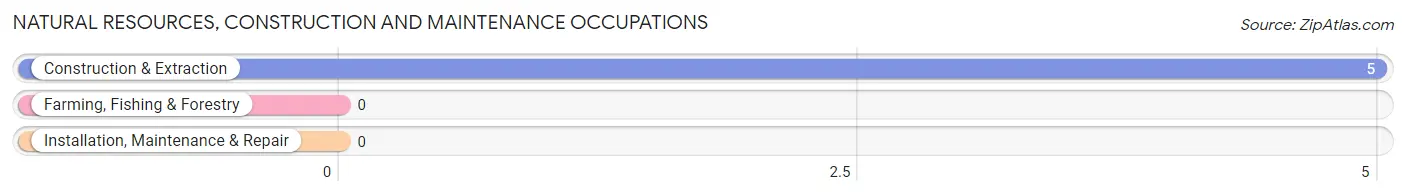
Natural Resources, Construction and Maintenance Occupations by Sex
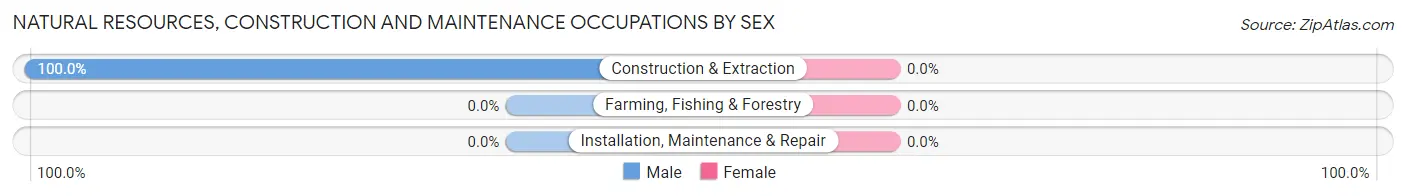
| Occupation | Male | Female |
| Farming, Fishing & Forestry | 0 (0.0%) | 0 (0.0%) |
| Construction & Extraction | 5 (100.0%) | 0 (0.0%) |
| Installation, Maintenance & Repair | 0 (0.0%) | 0 (0.0%) |
| Total (Category) | 5 (100.0%) | 0 (0.0%) |
| Total (Overall) | 26 (54.2%) | 22 (45.8%) |
Production, Transportation and Moving Occupations
The most common Production, Transportation and Moving occupations in Deer Island are Production (7 | 14.6%), and Material Moving (7 | 14.6%).
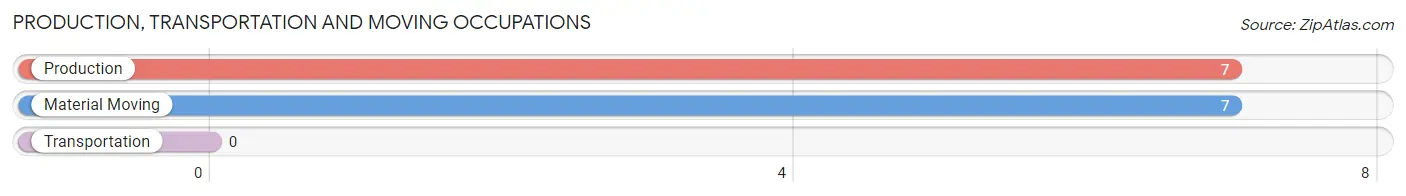
Production, Transportation and Moving Occupations by Sex
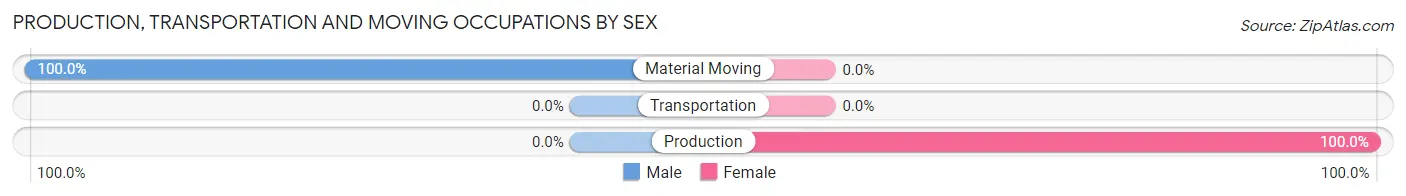
| Occupation | Male | Female |
| Production | 0 (0.0%) | 7 (100.0%) |
| Transportation | 0 (0.0%) | 0 (0.0%) |
| Material Moving | 7 (100.0%) | 0 (0.0%) |
| Total (Category) | 7 (50.0%) | 7 (50.0%) |
| Total (Overall) | 26 (54.2%) | 22 (45.8%) |
Employment Industries by Sex in Deer Island
Employment Industries in Deer Island
The major employment industries in Deer Island include Health Care & Social Assistance (16 | 33.3%), Educational Services (14 | 29.2%), Manufacturing (7 | 14.6%), Retail Trade (6 | 12.5%), and Construction (5 | 10.4%).
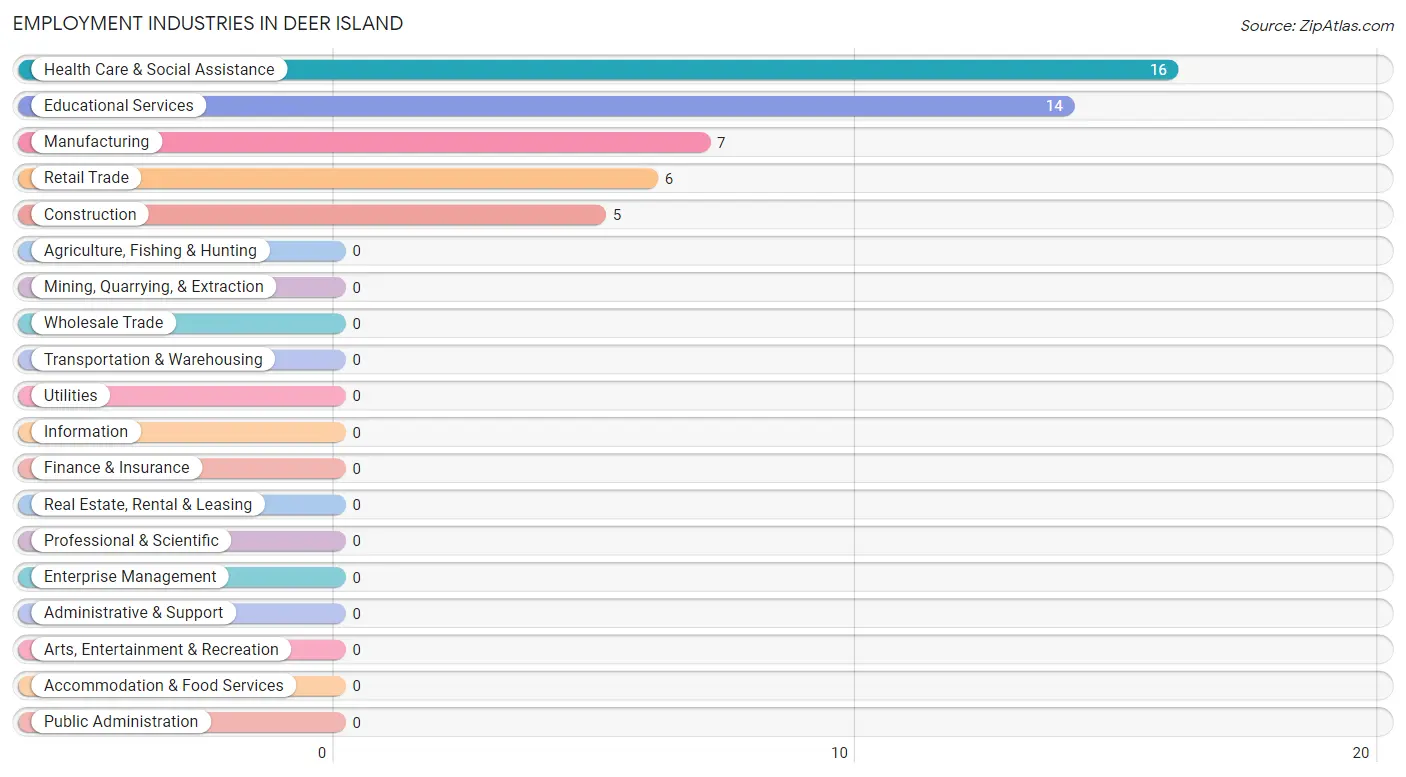
Employment Industries by Sex in Deer Island
The Deer Island industries that see more men than women are Construction (100.0%), Manufacturing (100.0%), and Educational Services (100.0%), whereas the industries that tend to have a higher number of women are Retail Trade (100.0%), and Health Care & Social Assistance (100.0%).
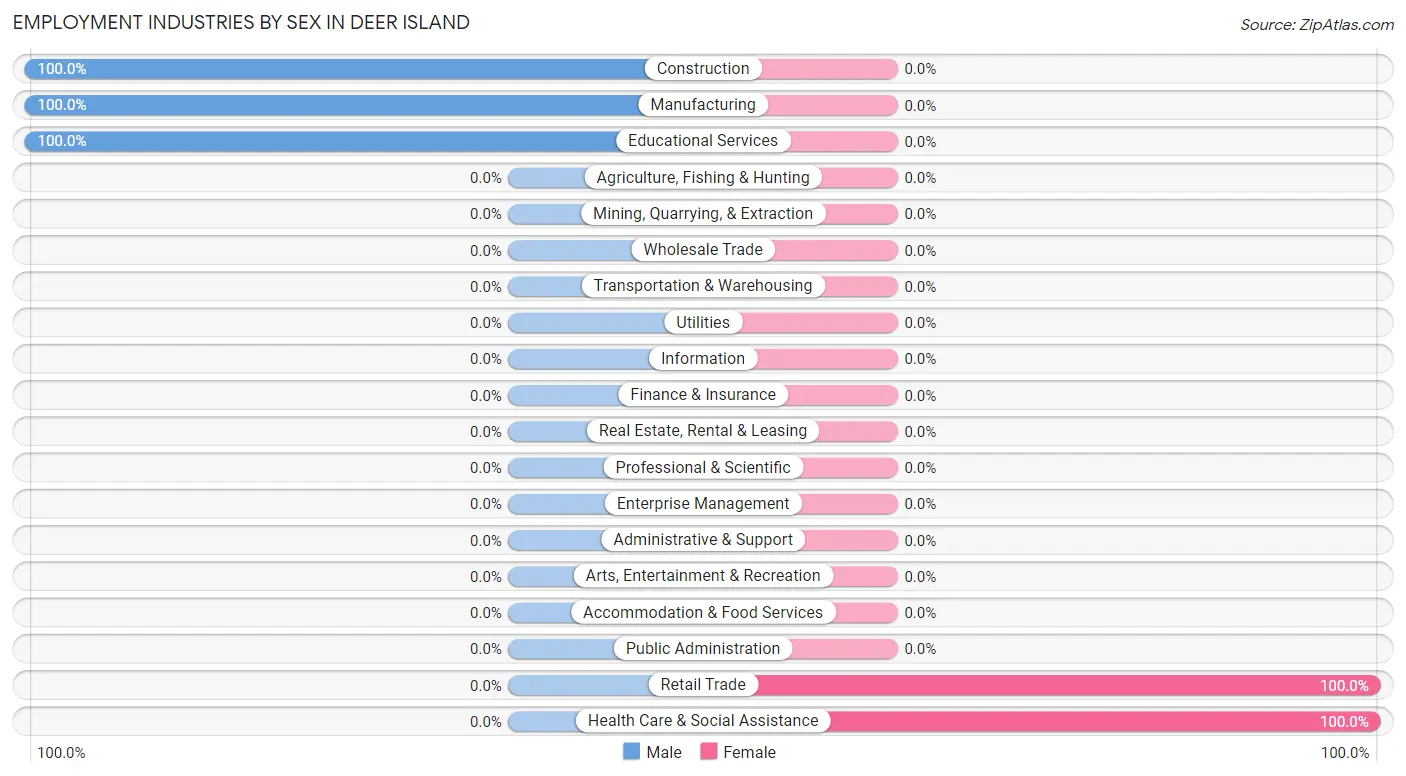
| Industry | Male | Female |
| Agriculture, Fishing & Hunting | 0 (0.0%) | 0 (0.0%) |
| Mining, Quarrying, & Extraction | 0 (0.0%) | 0 (0.0%) |
| Construction | 5 (100.0%) | 0 (0.0%) |
| Manufacturing | 7 (100.0%) | 0 (0.0%) |
| Wholesale Trade | 0 (0.0%) | 0 (0.0%) |
| Retail Trade | 0 (0.0%) | 6 (100.0%) |
| Transportation & Warehousing | 0 (0.0%) | 0 (0.0%) |
| Utilities | 0 (0.0%) | 0 (0.0%) |
| Information | 0 (0.0%) | 0 (0.0%) |
| Finance & Insurance | 0 (0.0%) | 0 (0.0%) |
| Real Estate, Rental & Leasing | 0 (0.0%) | 0 (0.0%) |
| Professional & Scientific | 0 (0.0%) | 0 (0.0%) |
| Enterprise Management | 0 (0.0%) | 0 (0.0%) |
| Administrative & Support | 0 (0.0%) | 0 (0.0%) |
| Educational Services | 14 (100.0%) | 0 (0.0%) |
| Health Care & Social Assistance | 0 (0.0%) | 16 (100.0%) |
| Arts, Entertainment & Recreation | 0 (0.0%) | 0 (0.0%) |
| Accommodation & Food Services | 0 (0.0%) | 0 (0.0%) |
| Public Administration | 0 (0.0%) | 0 (0.0%) |
| Total | 26 (54.2%) | 22 (45.8%) |
Education in Deer Island
School Enrollment in Deer Island
The most common levels of schooling among the 35 students in Deer Island are college / undergraduate (19 | 54.3%), and kindergarten (16 | 45.7%).
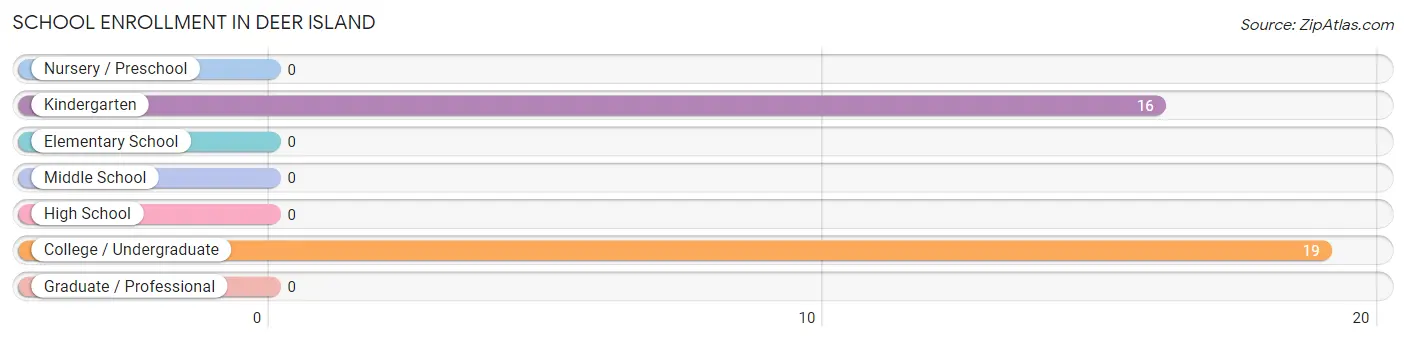
| School Level | # Students | % Students |
| Nursery / Preschool | 0 | 0.0% |
| Kindergarten | 16 | 45.7% |
| Elementary School | 0 | 0.0% |
| Middle School | 0 | 0.0% |
| High School | 0 | 0.0% |
| College / Undergraduate | 19 | 54.3% |
| Graduate / Professional | 0 | 0.0% |
| Total | 35 | 100.0% |
School Enrollment by Age by Funding Source in Deer Island
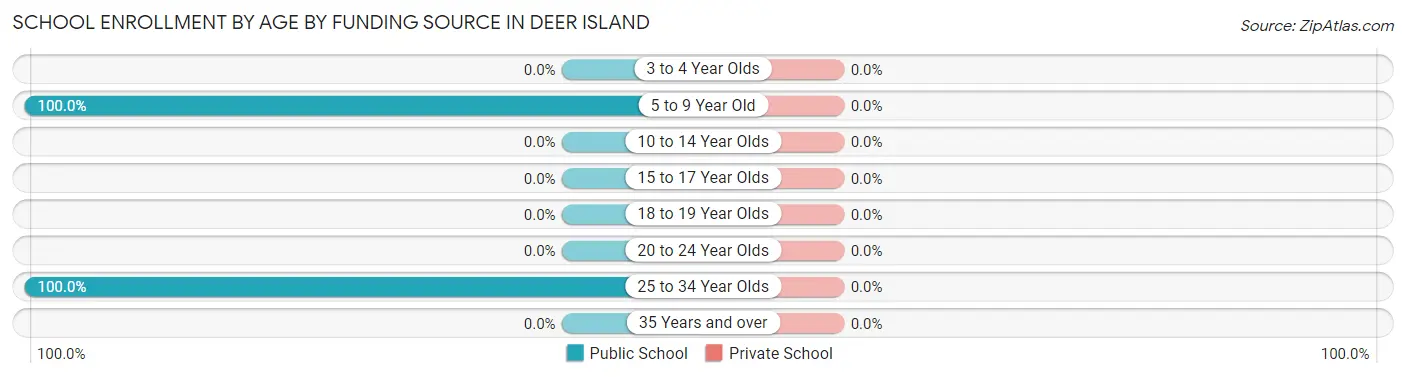
| Age Bracket | Public School | Private School |
| 3 to 4 Year Olds | 0 (0.0%) | 0 (0.0%) |
| 5 to 9 Year Old | 16 (100.0%) | 0 (0.0%) |
| 10 to 14 Year Olds | 0 (0.0%) | 0 (0.0%) |
| 15 to 17 Year Olds | 0 (0.0%) | 0 (0.0%) |
| 18 to 19 Year Olds | 0 (0.0%) | 0 (0.0%) |
| 20 to 24 Year Olds | 0 (0.0%) | 0 (0.0%) |
| 25 to 34 Year Olds | 19 (100.0%) | 0 (0.0%) |
| 35 Years and over | 0 (0.0%) | 0 (0.0%) |
| Total | 35 (100.0%) | 0 (0.0%) |
Educational Attainment by Field of Study in Deer Island
, and business (9 | 100.0%) are the most common fields of study among 9 individuals in Deer Island who have obtained a bachelor's degree or higher.
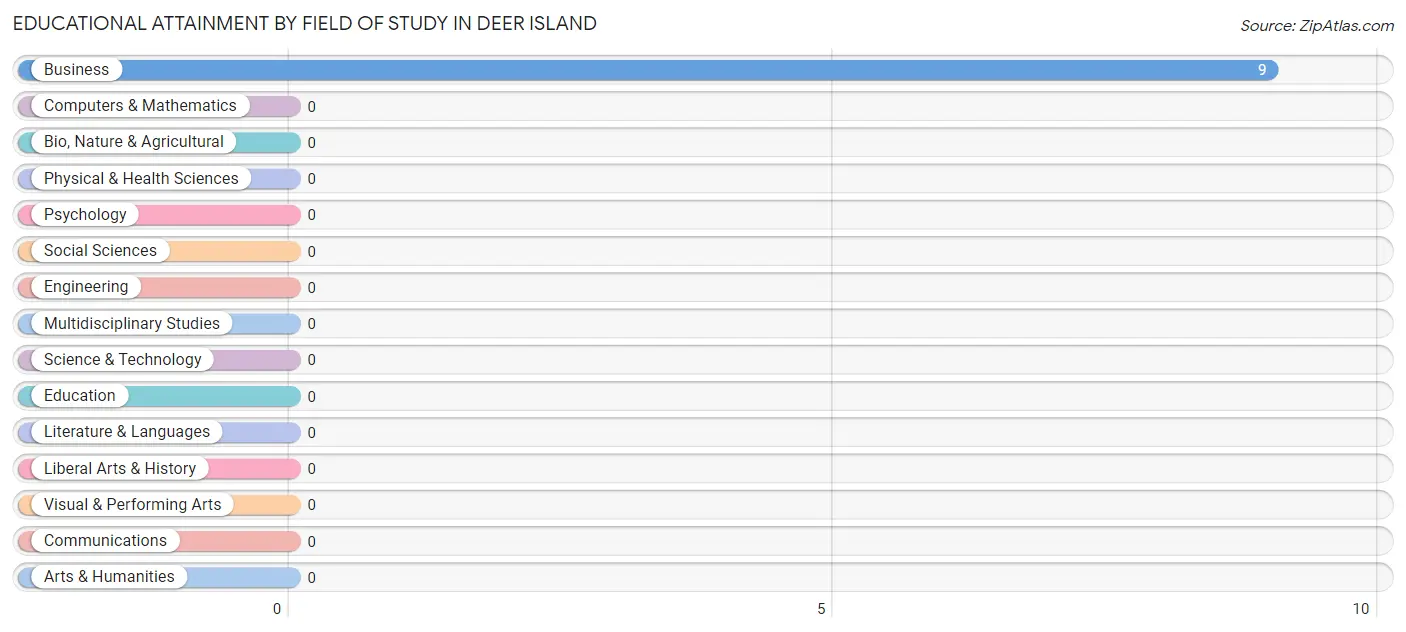
| Field of Study | # Graduates | % Graduates |
| Computers & Mathematics | 0 | 0.0% |
| Bio, Nature & Agricultural | 0 | 0.0% |
| Physical & Health Sciences | 0 | 0.0% |
| Psychology | 0 | 0.0% |
| Social Sciences | 0 | 0.0% |
| Engineering | 0 | 0.0% |
| Multidisciplinary Studies | 0 | 0.0% |
| Science & Technology | 0 | 0.0% |
| Business | 9 | 100.0% |
| Education | 0 | 0.0% |
| Literature & Languages | 0 | 0.0% |
| Liberal Arts & History | 0 | 0.0% |
| Visual & Performing Arts | 0 | 0.0% |
| Communications | 0 | 0.0% |
| Arts & Humanities | 0 | 0.0% |
| Total | 9 | 100.0% |
Transportation & Commute in Deer Island
Vehicle Availability by Sex in Deer Island
The most prevalent vehicle ownership categories in Deer Island are males with 2 vehicles (12, accounting for 100.0%) and females with 2 vehicles (13, making up 54.5%).
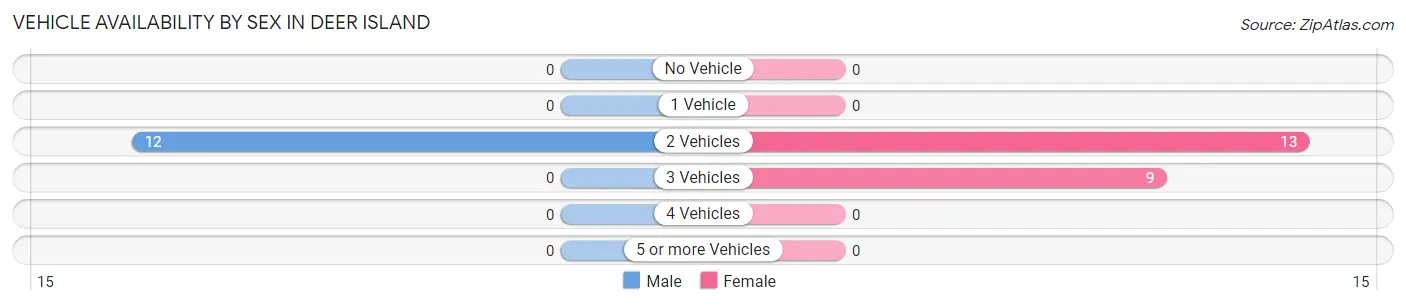
| Vehicles Available | Male | Female |
| No Vehicle | 0 (0.0%) | 0 (0.0%) |
| 1 Vehicle | 0 (0.0%) | 0 (0.0%) |
| 2 Vehicles | 12 (100.0%) | 13 (59.1%) |
| 3 Vehicles | 0 (0.0%) | 9 (40.9%) |
| 4 Vehicles | 0 (0.0%) | 0 (0.0%) |
| 5 or more Vehicles | 0 (0.0%) | 0 (0.0%) |
| Total | 12 (100.0%) | 22 (100.0%) |
Commute Time in Deer Island
The most frequently occuring commute durations in Deer Island are 10 to 14 minutes (11 commuters, 32.4%), 60 to 89 minutes (9 commuters, 26.5%), and 30 to 34 minutes (7 commuters, 20.6%).
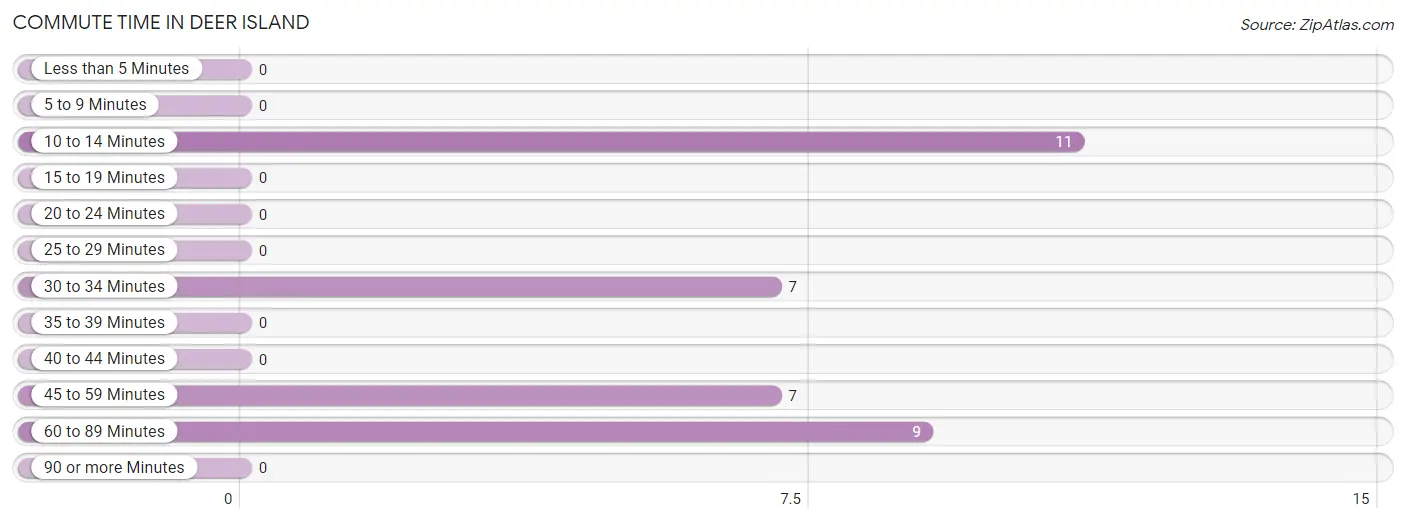
| Commute Time | # Commuters | % Commuters |
| Less than 5 Minutes | 0 | 0.0% |
| 5 to 9 Minutes | 0 | 0.0% |
| 10 to 14 Minutes | 11 | 32.4% |
| 15 to 19 Minutes | 0 | 0.0% |
| 20 to 24 Minutes | 0 | 0.0% |
| 25 to 29 Minutes | 0 | 0.0% |
| 30 to 34 Minutes | 7 | 20.6% |
| 35 to 39 Minutes | 0 | 0.0% |
| 40 to 44 Minutes | 0 | 0.0% |
| 45 to 59 Minutes | 7 | 20.6% |
| 60 to 89 Minutes | 9 | 26.5% |
| 90 or more Minutes | 0 | 0.0% |
Commute Time by Sex in Deer Island
The most common commute times in Deer Island are 45 to 59 minutes (7 commuters, 58.3%) for males and 60 to 89 minutes (9 commuters, 40.9%) for females.
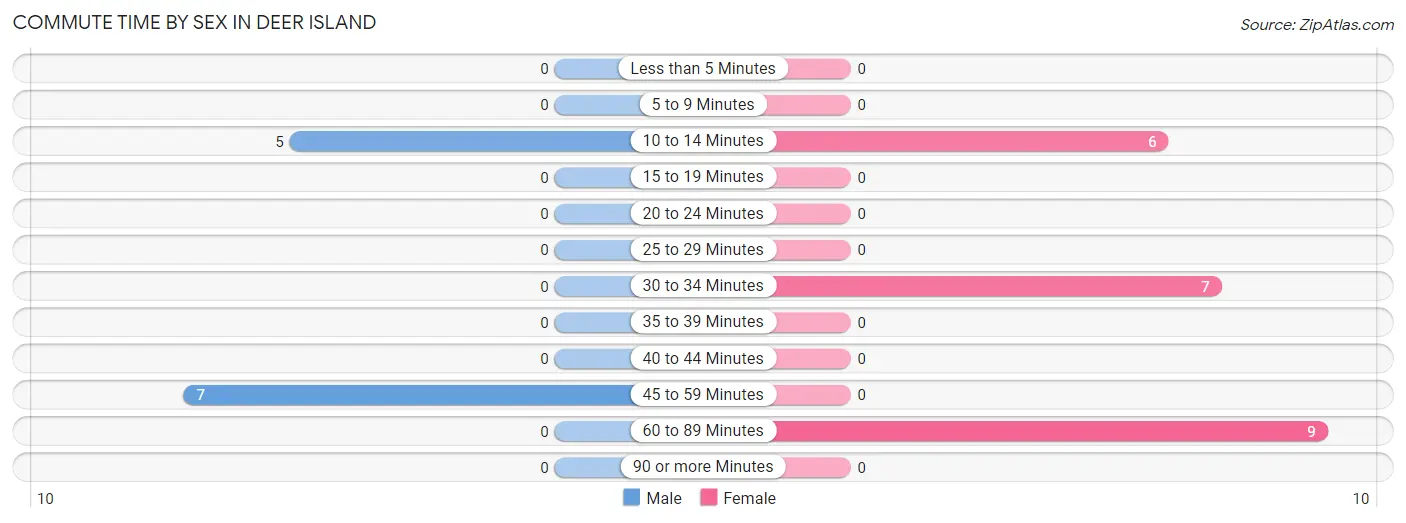
| Commute Time | Male | Female |
| Less than 5 Minutes | 0 (0.0%) | 0 (0.0%) |
| 5 to 9 Minutes | 0 (0.0%) | 0 (0.0%) |
| 10 to 14 Minutes | 5 (41.7%) | 6 (27.3%) |
| 15 to 19 Minutes | 0 (0.0%) | 0 (0.0%) |
| 20 to 24 Minutes | 0 (0.0%) | 0 (0.0%) |
| 25 to 29 Minutes | 0 (0.0%) | 0 (0.0%) |
| 30 to 34 Minutes | 0 (0.0%) | 7 (31.8%) |
| 35 to 39 Minutes | 0 (0.0%) | 0 (0.0%) |
| 40 to 44 Minutes | 0 (0.0%) | 0 (0.0%) |
| 45 to 59 Minutes | 7 (58.3%) | 0 (0.0%) |
| 60 to 89 Minutes | 0 (0.0%) | 9 (40.9%) |
| 90 or more Minutes | 0 (0.0%) | 0 (0.0%) |
Time of Departure to Work by Sex in Deer Island
The most frequent times of departure to work in Deer Island are 12:00 AM to 4:59 AM (12, 100.0%) for males and 7:30 AM to 7:59 AM (9, 40.9%) for females.
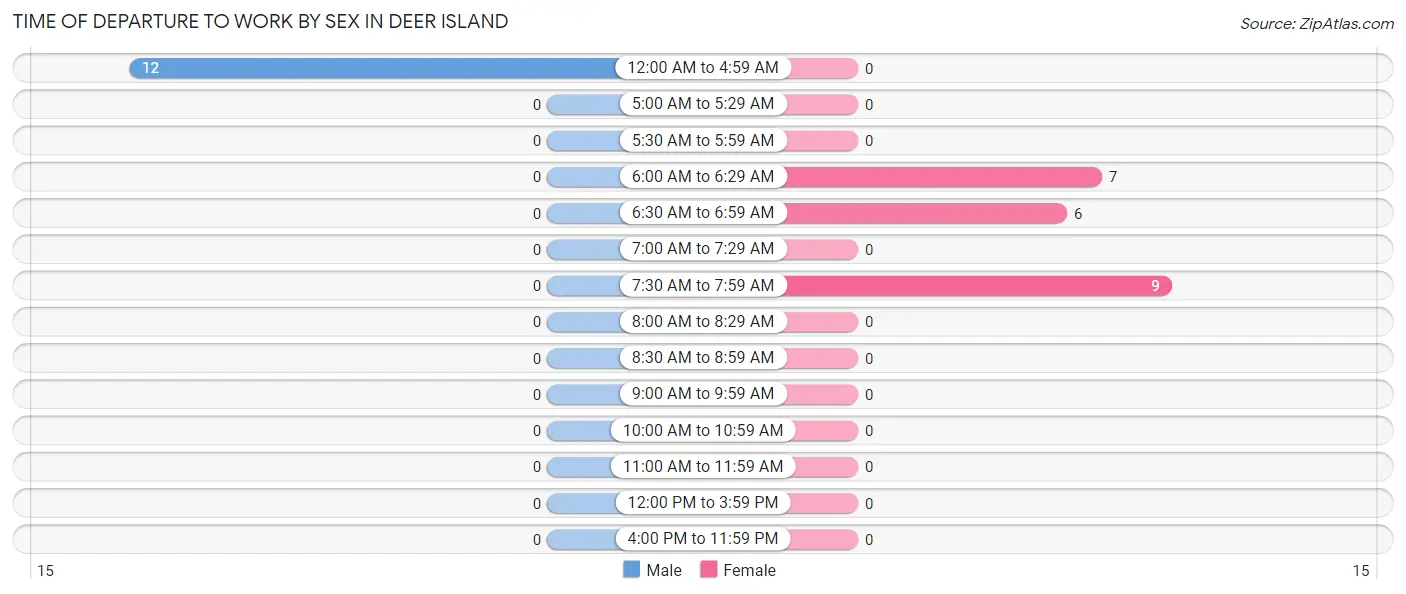
| Time of Departure | Male | Female |
| 12:00 AM to 4:59 AM | 12 (100.0%) | 0 (0.0%) |
| 5:00 AM to 5:29 AM | 0 (0.0%) | 0 (0.0%) |
| 5:30 AM to 5:59 AM | 0 (0.0%) | 0 (0.0%) |
| 6:00 AM to 6:29 AM | 0 (0.0%) | 7 (31.8%) |
| 6:30 AM to 6:59 AM | 0 (0.0%) | 6 (27.3%) |
| 7:00 AM to 7:29 AM | 0 (0.0%) | 0 (0.0%) |
| 7:30 AM to 7:59 AM | 0 (0.0%) | 9 (40.9%) |
| 8:00 AM to 8:29 AM | 0 (0.0%) | 0 (0.0%) |
| 8:30 AM to 8:59 AM | 0 (0.0%) | 0 (0.0%) |
| 9:00 AM to 9:59 AM | 0 (0.0%) | 0 (0.0%) |
| 10:00 AM to 10:59 AM | 0 (0.0%) | 0 (0.0%) |
| 11:00 AM to 11:59 AM | 0 (0.0%) | 0 (0.0%) |
| 12:00 PM to 3:59 PM | 0 (0.0%) | 0 (0.0%) |
| 4:00 PM to 11:59 PM | 0 (0.0%) | 0 (0.0%) |
| Total | 12 (100.0%) | 22 (100.0%) |
Housing Occupancy in Deer Island
Occupancy by Ownership in Deer Island
Of the total 95 dwellings in Deer Island, owner-occupied units account for 79 (83.2%), while renter-occupied units make up 16 (16.8%).
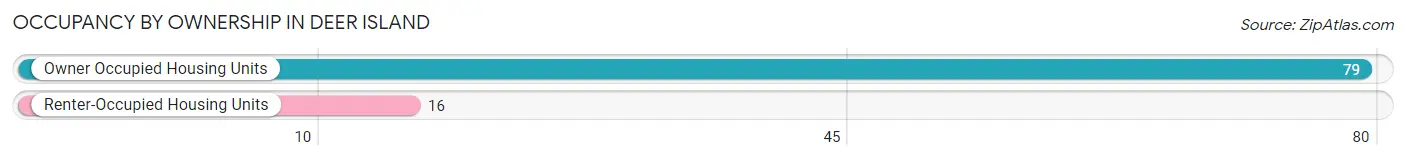
| Occupancy | # Housing Units | % Housing Units |
| Owner Occupied Housing Units | 79 | 83.2% |
| Renter-Occupied Housing Units | 16 | 16.8% |
| Total Occupied Housing Units | 95 | 100.0% |
Occupancy by Household Size in Deer Island
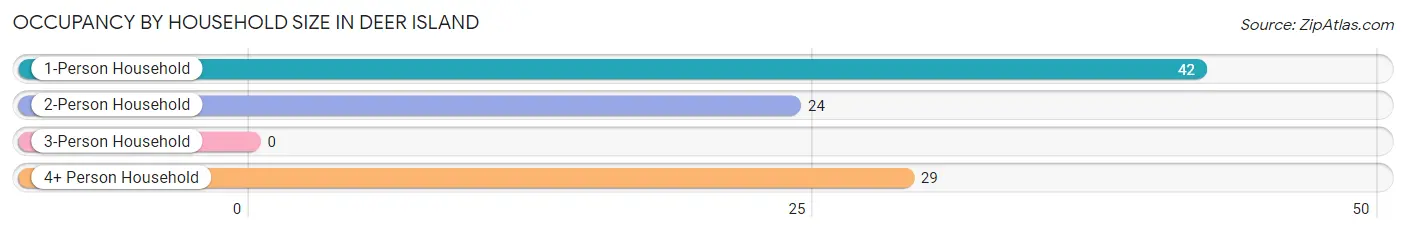
| Household Size | # Housing Units | % Housing Units |
| 1-Person Household | 42 | 44.2% |
| 2-Person Household | 24 | 25.3% |
| 3-Person Household | 0 | 0.0% |
| 4+ Person Household | 29 | 30.5% |
| Total Housing Units | 95 | 100.0% |
Occupancy by Ownership by Household Size in Deer Island
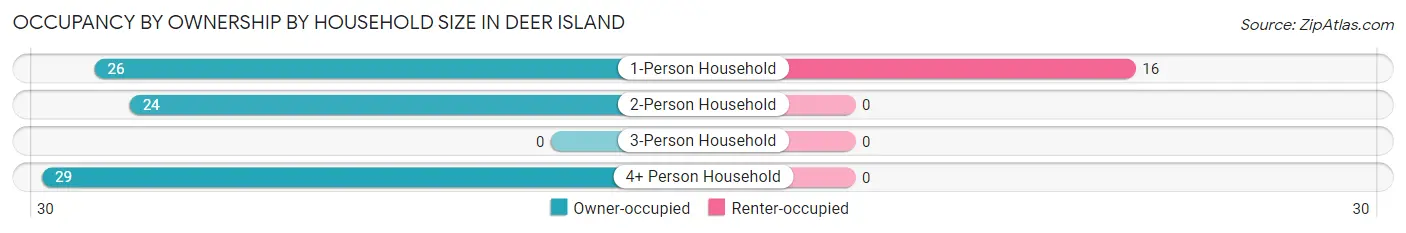
| Household Size | Owner-occupied | Renter-occupied |
| 1-Person Household | 26 (61.9%) | 16 (38.1%) |
| 2-Person Household | 24 (100.0%) | 0 (0.0%) |
| 3-Person Household | 0 (0.0%) | 0 (0.0%) |
| 4+ Person Household | 29 (100.0%) | 0 (0.0%) |
| Total Housing Units | 79 (83.2%) | 16 (16.8%) |
Occupancy by Educational Attainment in Deer Island
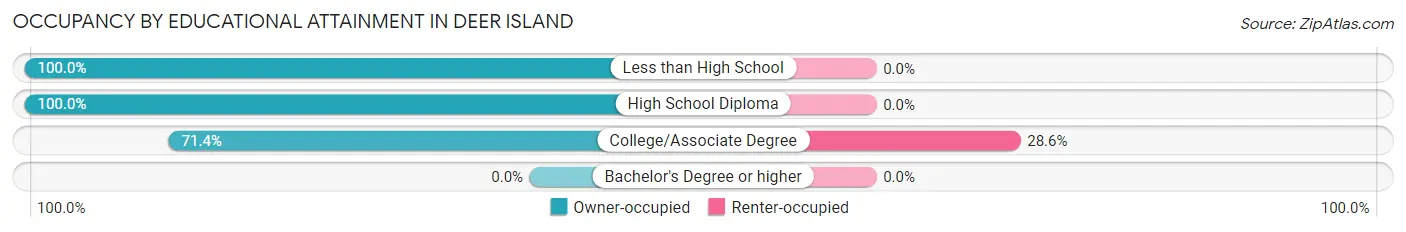
| Household Size | Owner-occupied | Renter-occupied |
| Less than High School | 13 (100.0%) | 0 (0.0%) |
| High School Diploma | 26 (100.0%) | 0 (0.0%) |
| College/Associate Degree | 40 (71.4%) | 16 (28.6%) |
| Bachelor's Degree or higher | 0 (0.0%) | 0 (0.0%) |
Occupancy by Age of Householder in Deer Island
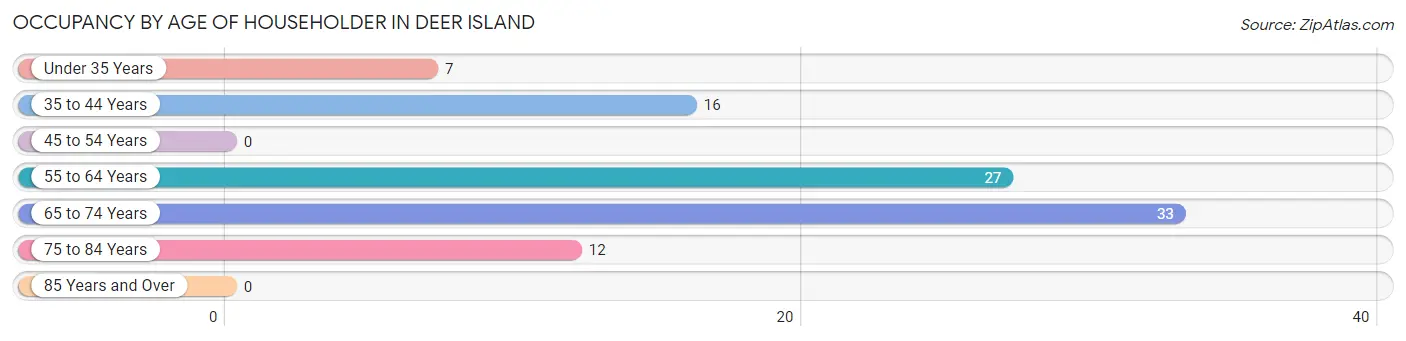
| Age Bracket | # Households | % Households |
| Under 35 Years | 7 | 7.4% |
| 35 to 44 Years | 16 | 16.8% |
| 45 to 54 Years | 0 | 0.0% |
| 55 to 64 Years | 27 | 28.4% |
| 65 to 74 Years | 33 | 34.7% |
| 75 to 84 Years | 12 | 12.6% |
| 85 Years and Over | 0 | 0.0% |
| Total | 95 | 100.0% |
Housing Finances in Deer Island
Median Income by Occupancy in Deer Island
| Occupancy Type | # Households | Median Income |
| Owner-Occupied | 79 (83.2%) | $0 |
| Renter-Occupied | 16 (16.8%) | $0 |
| Average | 95 (100.0%) | $0 |
Occupancy by Householder Income Bracket in Deer Island
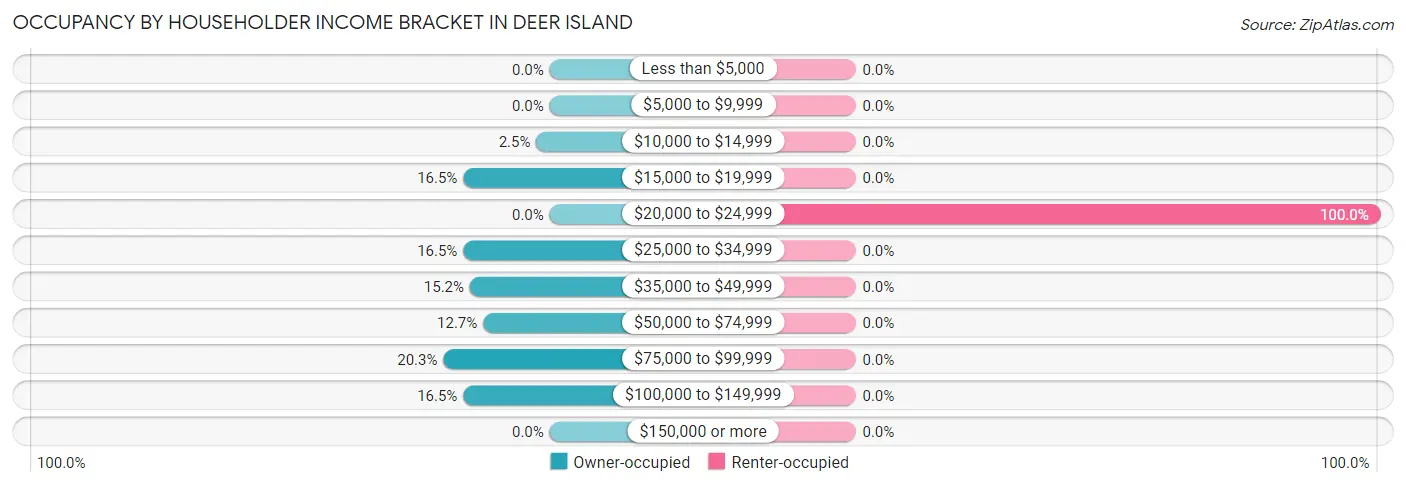
| Income Bracket | Owner-occupied | Renter-occupied |
| Less than $5,000 | 0 (0.0%) | 0 (0.0%) |
| $5,000 to $9,999 | 0 (0.0%) | 0 (0.0%) |
| $10,000 to $14,999 | 2 (2.5%) | 0 (0.0%) |
| $15,000 to $19,999 | 13 (16.5%) | 0 (0.0%) |
| $20,000 to $24,999 | 0 (0.0%) | 16 (100.0%) |
| $25,000 to $34,999 | 13 (16.5%) | 0 (0.0%) |
| $35,000 to $49,999 | 12 (15.2%) | 0 (0.0%) |
| $50,000 to $74,999 | 10 (12.7%) | 0 (0.0%) |
| $75,000 to $99,999 | 16 (20.3%) | 0 (0.0%) |
| $100,000 to $149,999 | 13 (16.5%) | 0 (0.0%) |
| $150,000 or more | 0 (0.0%) | 0 (0.0%) |
| Total | 79 (100.0%) | 16 (100.0%) |
Monthly Housing Cost Tiers in Deer Island
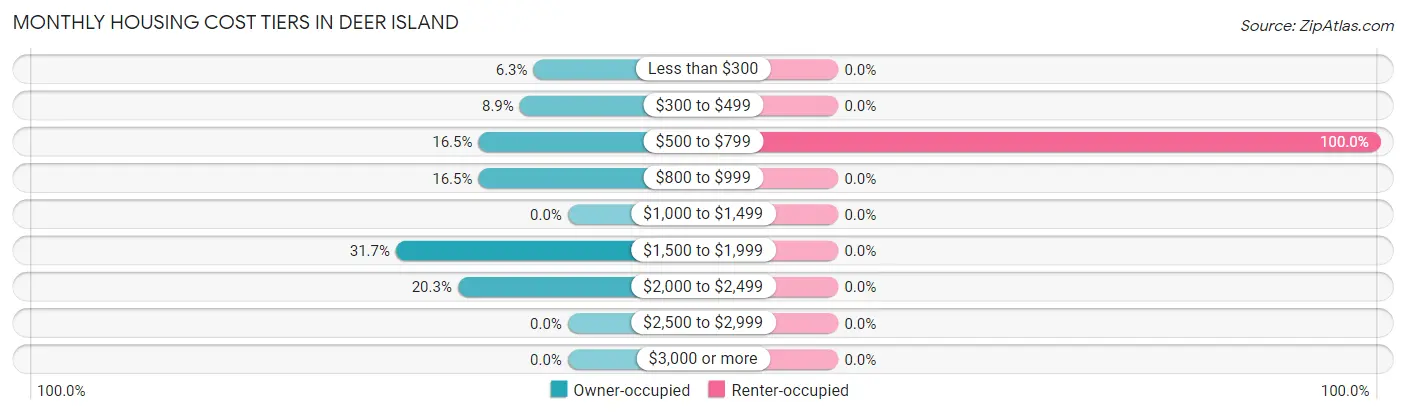
| Monthly Cost | Owner-occupied | Renter-occupied |
| Less than $300 | 5 (6.3%) | 0 (0.0%) |
| $300 to $499 | 7 (8.9%) | 0 (0.0%) |
| $500 to $799 | 13 (16.5%) | 16 (100.0%) |
| $800 to $999 | 13 (16.5%) | 0 (0.0%) |
| $1,000 to $1,499 | 0 (0.0%) | 0 (0.0%) |
| $1,500 to $1,999 | 25 (31.7%) | 0 (0.0%) |
| $2,000 to $2,499 | 16 (20.3%) | 0 (0.0%) |
| $2,500 to $2,999 | 0 (0.0%) | 0 (0.0%) |
| $3,000 or more | 0 (0.0%) | 0 (0.0%) |
| Total | 79 (100.0%) | 16 (100.0%) |
Physical Housing Characteristics in Deer Island
Housing Structures in Deer Island
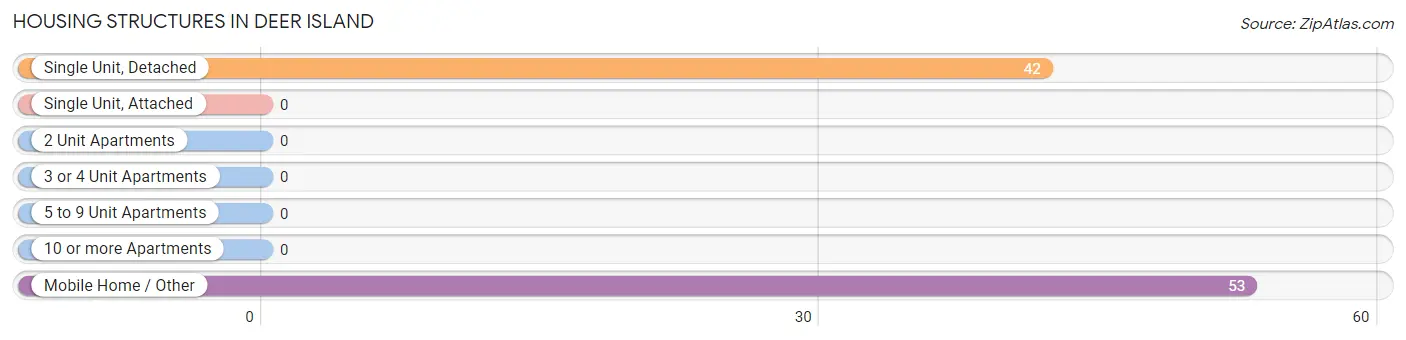
| Structure Type | # Housing Units | % Housing Units |
| Single Unit, Detached | 42 | 44.2% |
| Single Unit, Attached | 0 | 0.0% |
| 2 Unit Apartments | 0 | 0.0% |
| 3 or 4 Unit Apartments | 0 | 0.0% |
| 5 to 9 Unit Apartments | 0 | 0.0% |
| 10 or more Apartments | 0 | 0.0% |
| Mobile Home / Other | 53 | 55.8% |
| Total | 95 | 100.0% |
Housing Structures by Occupancy in Deer Island
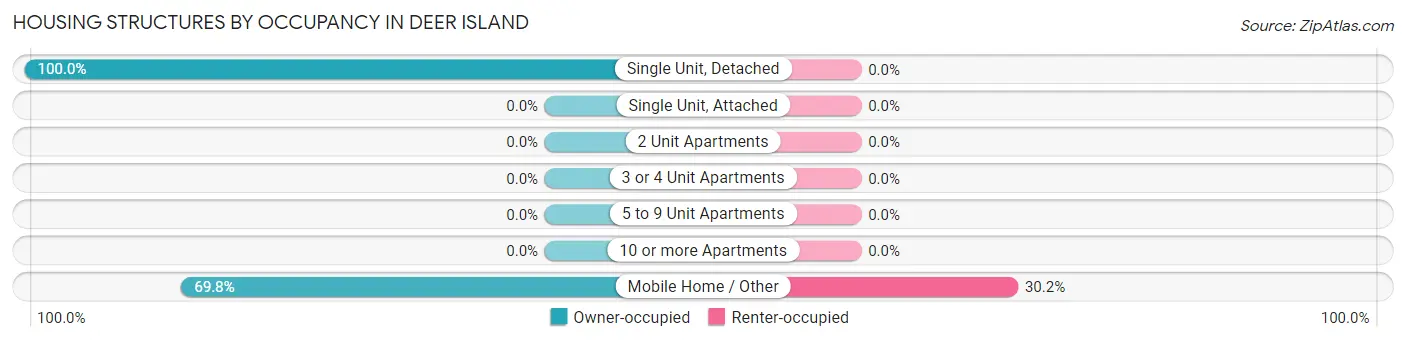
| Structure Type | Owner-occupied | Renter-occupied |
| Single Unit, Detached | 42 (100.0%) | 0 (0.0%) |
| Single Unit, Attached | 0 (0.0%) | 0 (0.0%) |
| 2 Unit Apartments | 0 (0.0%) | 0 (0.0%) |
| 3 or 4 Unit Apartments | 0 (0.0%) | 0 (0.0%) |
| 5 to 9 Unit Apartments | 0 (0.0%) | 0 (0.0%) |
| 10 or more Apartments | 0 (0.0%) | 0 (0.0%) |
| Mobile Home / Other | 37 (69.8%) | 16 (30.2%) |
| Total | 79 (83.2%) | 16 (16.8%) |
Housing Structures by Number of Rooms in Deer Island
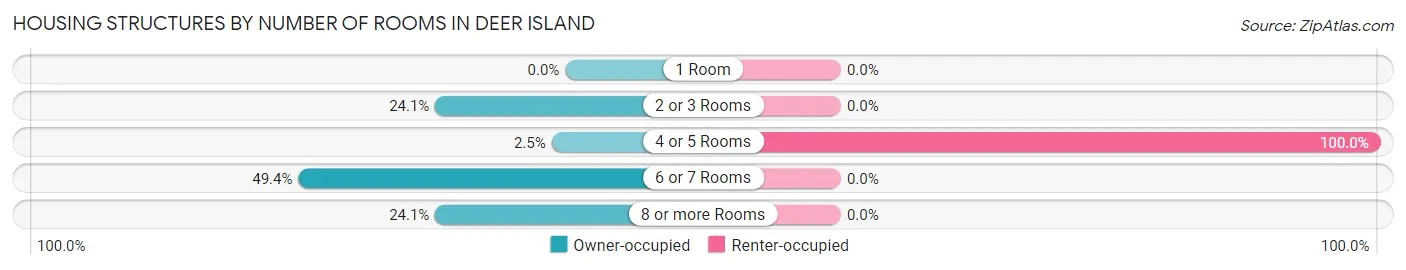
| Number of Rooms | Owner-occupied | Renter-occupied |
| 1 Room | 0 (0.0%) | 0 (0.0%) |
| 2 or 3 Rooms | 19 (24.0%) | 0 (0.0%) |
| 4 or 5 Rooms | 2 (2.5%) | 16 (100.0%) |
| 6 or 7 Rooms | 39 (49.4%) | 0 (0.0%) |
| 8 or more Rooms | 19 (24.0%) | 0 (0.0%) |
| Total | 79 (100.0%) | 16 (100.0%) |
Housing Structure by Heating Type in Deer Island
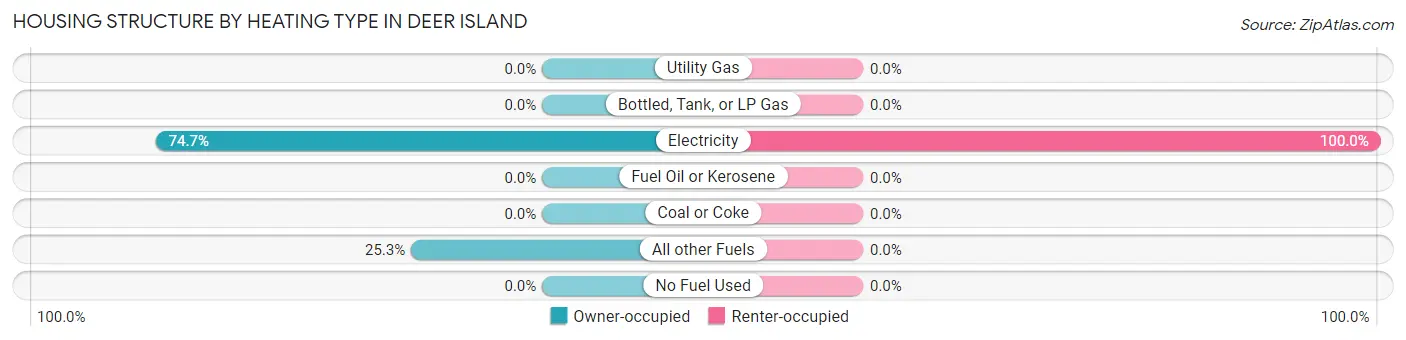
| Heating Type | Owner-occupied | Renter-occupied |
| Utility Gas | 0 (0.0%) | 0 (0.0%) |
| Bottled, Tank, or LP Gas | 0 (0.0%) | 0 (0.0%) |
| Electricity | 59 (74.7%) | 16 (100.0%) |
| Fuel Oil or Kerosene | 0 (0.0%) | 0 (0.0%) |
| Coal or Coke | 0 (0.0%) | 0 (0.0%) |
| All other Fuels | 20 (25.3%) | 0 (0.0%) |
| No Fuel Used | 0 (0.0%) | 0 (0.0%) |
| Total | 79 (100.0%) | 16 (100.0%) |
Household Vehicle Usage in Deer Island
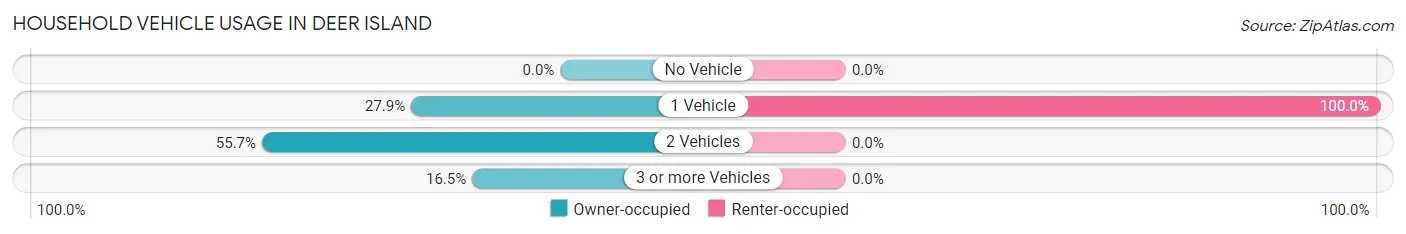
| Vehicles per Household | Owner-occupied | Renter-occupied |
| No Vehicle | 0 (0.0%) | 0 (0.0%) |
| 1 Vehicle | 22 (27.9%) | 16 (100.0%) |
| 2 Vehicles | 44 (55.7%) | 0 (0.0%) |
| 3 or more Vehicles | 13 (16.5%) | 0 (0.0%) |
| Total | 79 (100.0%) | 16 (100.0%) |
Real Estate & Mortgages in Deer Island
Real Estate and Mortgage Overview in Deer Island
| Characteristic | Without Mortgage | With Mortgage |
| Housing Units | 25 | 54 |
| Median Property Value | - | - |
| Median Household Income | $38,750 | $0 |
| Monthly Housing Costs | $606 | $0 |
| Real Estate Taxes | - | - |
Property Value by Mortgage Status in Deer Island
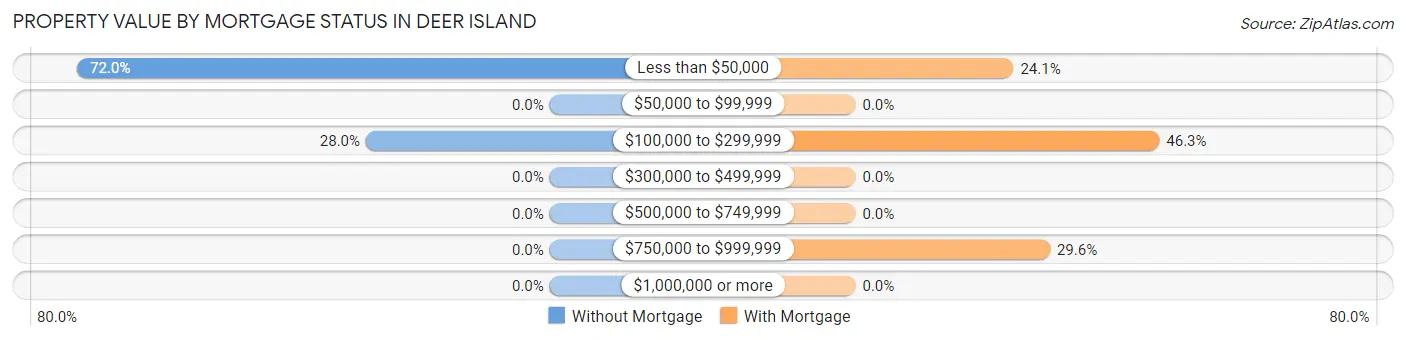
| Property Value | Without Mortgage | With Mortgage |
| Less than $50,000 | 18 (72.0%) | 13 (24.1%) |
| $50,000 to $99,999 | 0 (0.0%) | 0 (0.0%) |
| $100,000 to $299,999 | 7 (28.0%) | 25 (46.3%) |
| $300,000 to $499,999 | 0 (0.0%) | 0 (0.0%) |
| $500,000 to $749,999 | 0 (0.0%) | 0 (0.0%) |
| $750,000 to $999,999 | 0 (0.0%) | 16 (29.6%) |
| $1,000,000 or more | 0 (0.0%) | 0 (0.0%) |
| Total | 25 (100.0%) | 54 (100.0%) |
Household Income by Mortgage Status in Deer Island
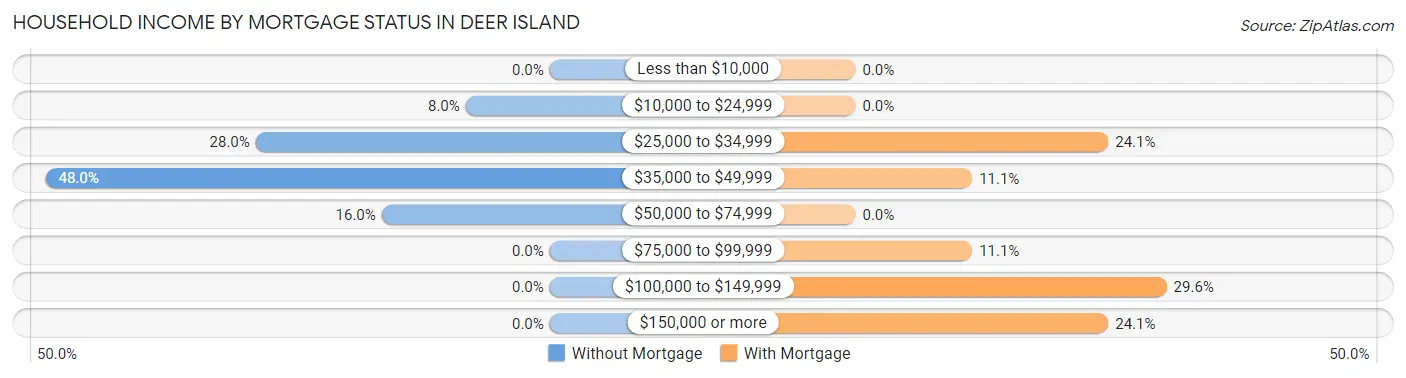
| Household Income | Without Mortgage | With Mortgage |
| Less than $10,000 | 0 (0.0%) | 0 (0.0%) |
| $10,000 to $24,999 | 2 (8.0%) | 0 (0.0%) |
| $25,000 to $34,999 | 7 (28.0%) | 13 (24.1%) |
| $35,000 to $49,999 | 12 (48.0%) | 6 (11.1%) |
| $50,000 to $74,999 | 4 (16.0%) | 0 (0.0%) |
| $75,000 to $99,999 | 0 (0.0%) | 6 (11.1%) |
| $100,000 to $149,999 | 0 (0.0%) | 16 (29.6%) |
| $150,000 or more | 0 (0.0%) | 13 (24.1%) |
| Total | 25 (100.0%) | 54 (100.0%) |
Property Value to Household Income Ratio in Deer Island
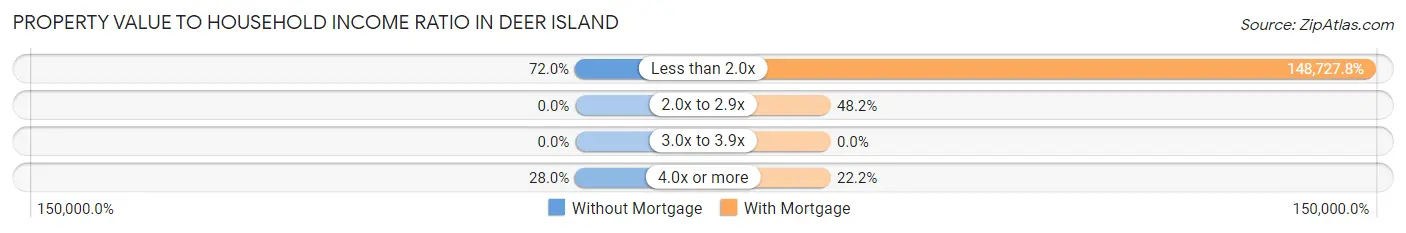
| Value-to-Income Ratio | Without Mortgage | With Mortgage |
| Less than 2.0x | 18 (72.0%) | 80,313 (148,727.8%) |
| 2.0x to 2.9x | 0 (0.0%) | 26 (48.1%) |
| 3.0x to 3.9x | 0 (0.0%) | 0 (0.0%) |
| 4.0x or more | 7 (28.0%) | 12 (22.2%) |
| Total | 25 (100.0%) | 54 (100.0%) |
Real Estate Taxes by Mortgage Status in Deer Island
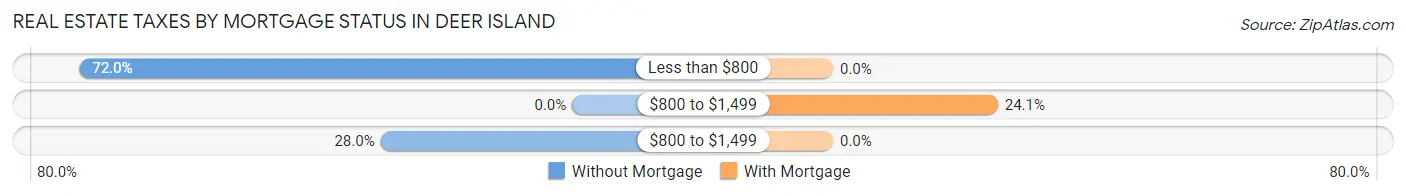
| Property Taxes | Without Mortgage | With Mortgage |
| Less than $800 | 18 (72.0%) | 0 (0.0%) |
| $800 to $1,499 | 0 (0.0%) | 13 (24.1%) |
| $800 to $1,499 | 7 (28.0%) | 0 (0.0%) |
| Total | 25 (100.0%) | 54 (100.0%) |
Health & Disability in Deer Island
Health Insurance Coverage by Age in Deer Island
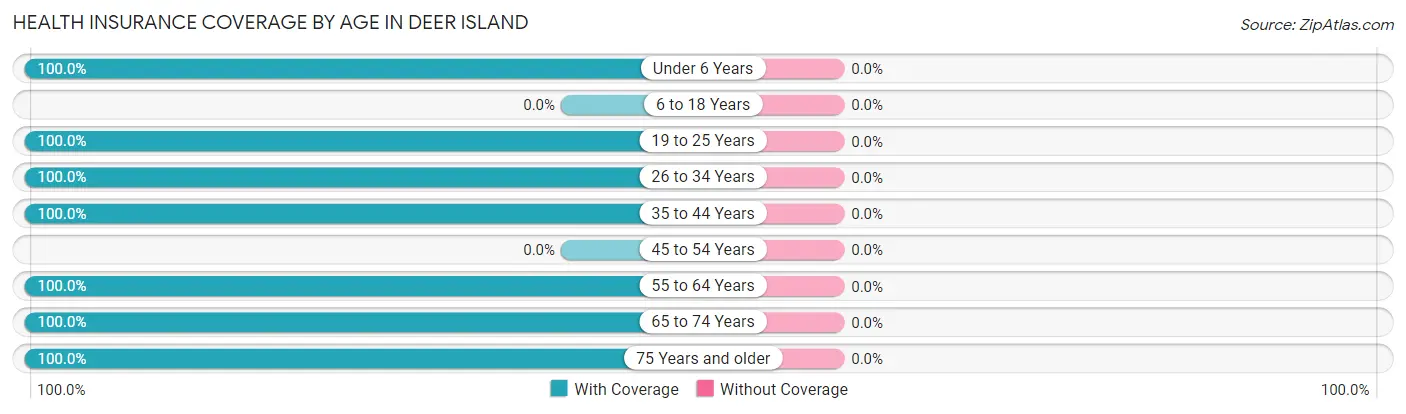
| Age Bracket | With Coverage | Without Coverage |
| Under 6 Years | 40 (100.0%) | 0 (0.0%) |
| 6 to 18 Years | 0 (0.0%) | 0 (0.0%) |
| 19 to 25 Years | 43 (100.0%) | 0 (0.0%) |
| 26 to 34 Years | 7 (100.0%) | 0 (0.0%) |
| 35 to 44 Years | 46 (100.0%) | 0 (0.0%) |
| 45 to 54 Years | 0 (0.0%) | 0 (0.0%) |
| 55 to 64 Years | 45 (100.0%) | 0 (0.0%) |
| 65 to 74 Years | 37 (100.0%) | 0 (0.0%) |
| 75 Years and older | 12 (100.0%) | 0 (0.0%) |
| Total | 230 (100.0%) | 0 (0.0%) |
Health Insurance Coverage by Citizenship Status in Deer Island
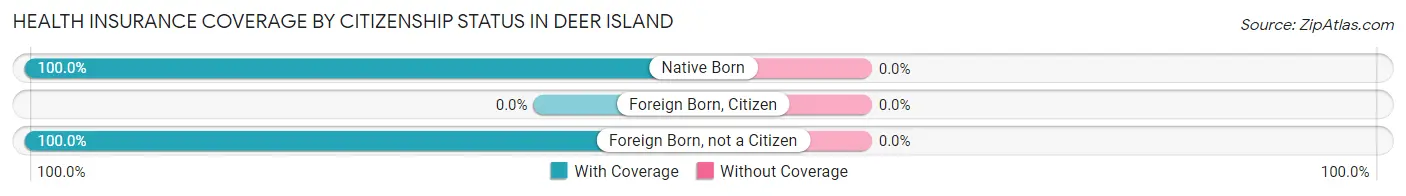
| Citizenship Status | With Coverage | Without Coverage |
| Native Born | 40 (100.0%) | 0 (0.0%) |
| Foreign Born, Citizen | 0 (0.0%) | 0 (0.0%) |
| Foreign Born, not a Citizen | 43 (100.0%) | 0 (0.0%) |
Health Insurance Coverage by Household Income in Deer Island
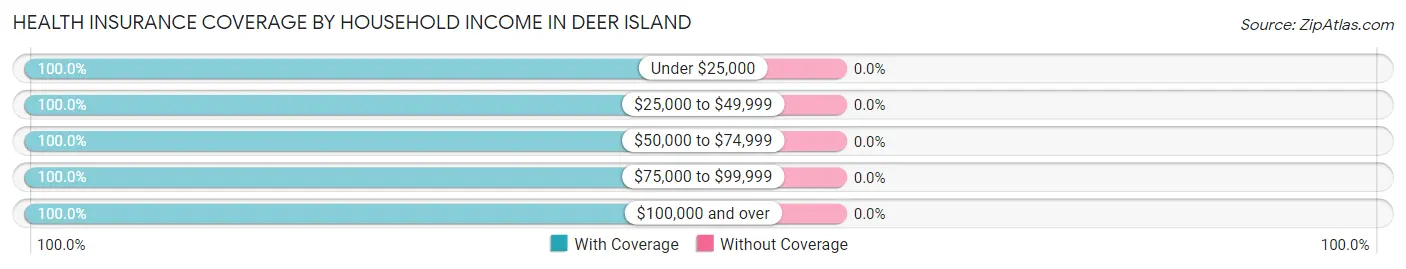
| Household Income | With Coverage | Without Coverage |
| Under $25,000 | 31 (100.0%) | 0 (0.0%) |
| $25,000 to $49,999 | 39 (100.0%) | 0 (0.0%) |
| $50,000 to $74,999 | 23 (100.0%) | 0 (0.0%) |
| $75,000 to $99,999 | 70 (100.0%) | 0 (0.0%) |
| $100,000 and over | 67 (100.0%) | 0 (0.0%) |
Public vs Private Health Insurance Coverage by Age in Deer Island
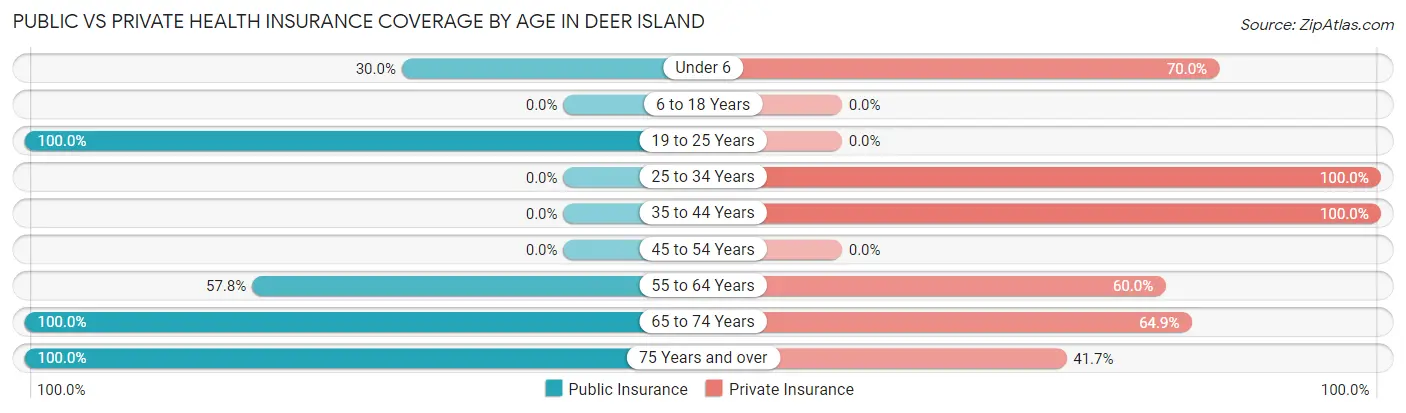
| Age Bracket | Public Insurance | Private Insurance |
| Under 6 | 12 (30.0%) | 28 (70.0%) |
| 6 to 18 Years | 0 (0.0%) | 0 (0.0%) |
| 19 to 25 Years | 43 (100.0%) | 0 (0.0%) |
| 25 to 34 Years | 0 (0.0%) | 7 (100.0%) |
| 35 to 44 Years | 0 (0.0%) | 46 (100.0%) |
| 45 to 54 Years | 0 (0.0%) | 0 (0.0%) |
| 55 to 64 Years | 26 (57.8%) | 27 (60.0%) |
| 65 to 74 Years | 37 (100.0%) | 24 (64.9%) |
| 75 Years and over | 12 (100.0%) | 5 (41.7%) |
| Total | 130 (56.5%) | 137 (59.6%) |
Disability Status by Sex by Age in Deer Island
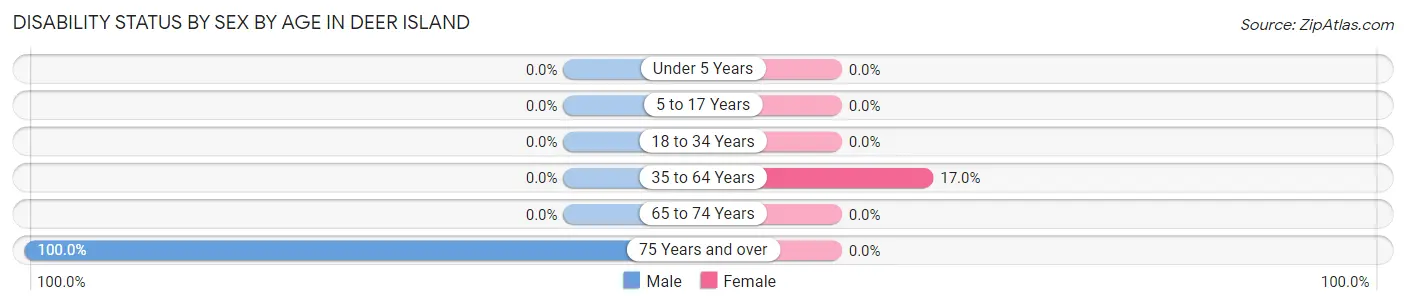
| Age Bracket | Male | Female |
| Under 5 Years | 0 (0.0%) | 0 (0.0%) |
| 5 to 17 Years | 0 (0.0%) | 0 (0.0%) |
| 18 to 34 Years | 0 (0.0%) | 0 (0.0%) |
| 35 to 64 Years | 0 (0.0%) | 9 (17.0%) |
| 65 to 74 Years | 0 (0.0%) | 0 (0.0%) |
| 75 Years and over | 12 (100.0%) | 0 (0.0%) |
Disability Class by Sex by Age in Deer Island
Disability Class: Hearing Difficulty
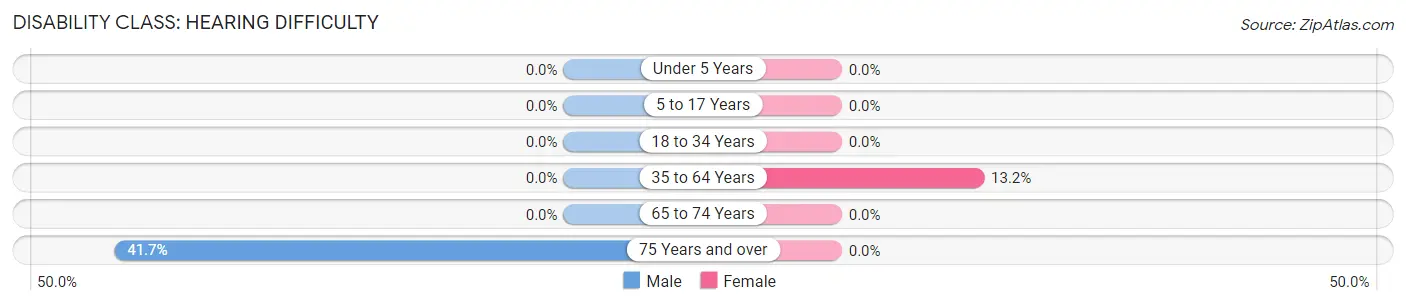
| Age Bracket | Male | Female |
| Under 5 Years | 0 (0.0%) | 0 (0.0%) |
| 5 to 17 Years | 0 (0.0%) | 0 (0.0%) |
| 18 to 34 Years | 0 (0.0%) | 0 (0.0%) |
| 35 to 64 Years | 0 (0.0%) | 7 (13.2%) |
| 65 to 74 Years | 0 (0.0%) | 0 (0.0%) |
| 75 Years and over | 5 (41.7%) | 0 (0.0%) |
Disability Class: Vision Difficulty
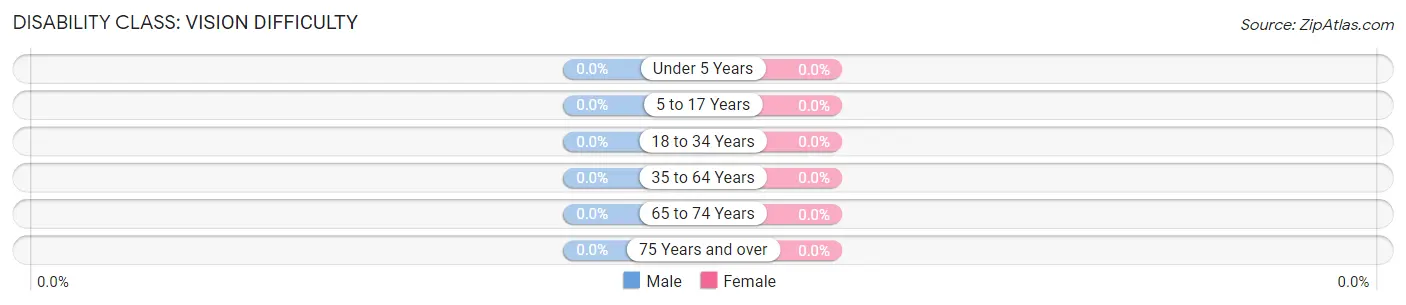
| Age Bracket | Male | Female |
| Under 5 Years | 0 (0.0%) | 0 (0.0%) |
| 5 to 17 Years | 0 (0.0%) | 0 (0.0%) |
| 18 to 34 Years | 0 (0.0%) | 0 (0.0%) |
| 35 to 64 Years | 0 (0.0%) | 0 (0.0%) |
| 65 to 74 Years | 0 (0.0%) | 0 (0.0%) |
| 75 Years and over | 0 (0.0%) | 0 (0.0%) |
Disability Class: Cognitive Difficulty
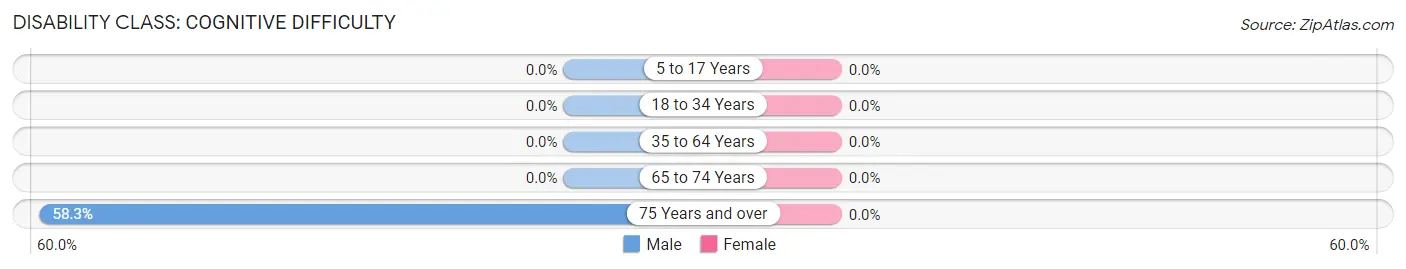
| Age Bracket | Male | Female |
| 5 to 17 Years | 0 (0.0%) | 0 (0.0%) |
| 18 to 34 Years | 0 (0.0%) | 0 (0.0%) |
| 35 to 64 Years | 0 (0.0%) | 0 (0.0%) |
| 65 to 74 Years | 0 (0.0%) | 0 (0.0%) |
| 75 Years and over | 7 (58.3%) | 0 (0.0%) |
Disability Class: Ambulatory Difficulty
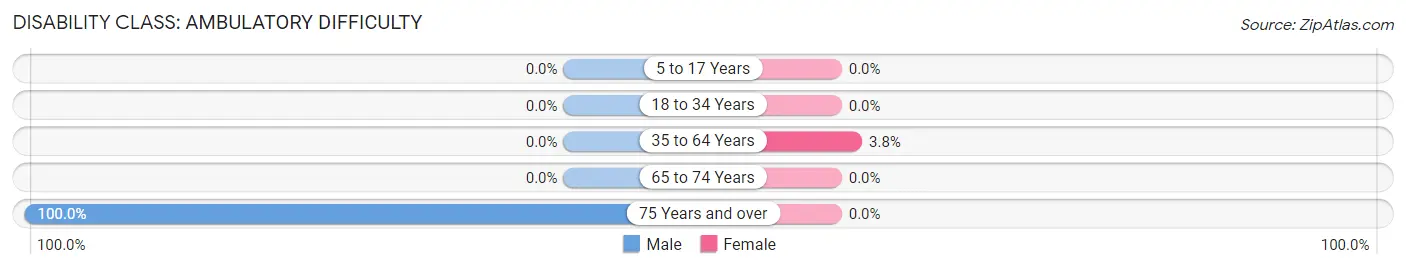
| Age Bracket | Male | Female |
| 5 to 17 Years | 0 (0.0%) | 0 (0.0%) |
| 18 to 34 Years | 0 (0.0%) | 0 (0.0%) |
| 35 to 64 Years | 0 (0.0%) | 2 (3.8%) |
| 65 to 74 Years | 0 (0.0%) | 0 (0.0%) |
| 75 Years and over | 12 (100.0%) | 0 (0.0%) |
Disability Class: Self-Care Difficulty
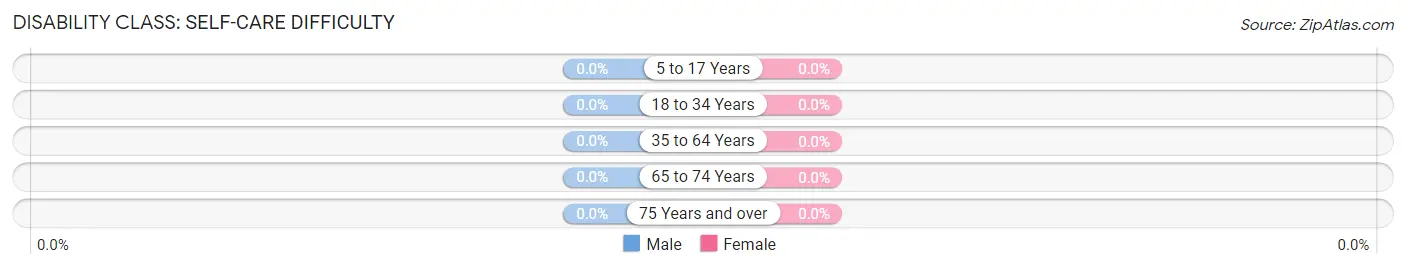
| Age Bracket | Male | Female |
| 5 to 17 Years | 0 (0.0%) | 0 (0.0%) |
| 18 to 34 Years | 0 (0.0%) | 0 (0.0%) |
| 35 to 64 Years | 0 (0.0%) | 0 (0.0%) |
| 65 to 74 Years | 0 (0.0%) | 0 (0.0%) |
| 75 Years and over | 0 (0.0%) | 0 (0.0%) |
Technology Access in Deer Island
Computing Device Access in Deer Island
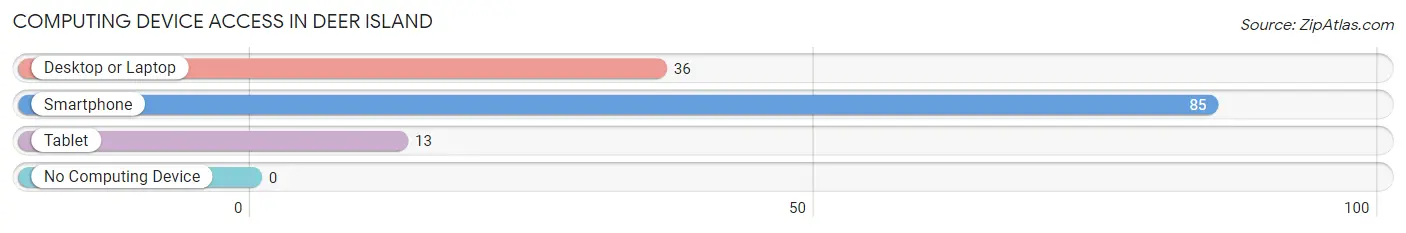
| Device Type | # Households | % Households |
| Desktop or Laptop | 36 | 37.9% |
| Smartphone | 85 | 89.5% |
| Tablet | 13 | 13.7% |
| No Computing Device | 0 | 0.0% |
| Total | 95 | 100.0% |
Internet Access in Deer Island
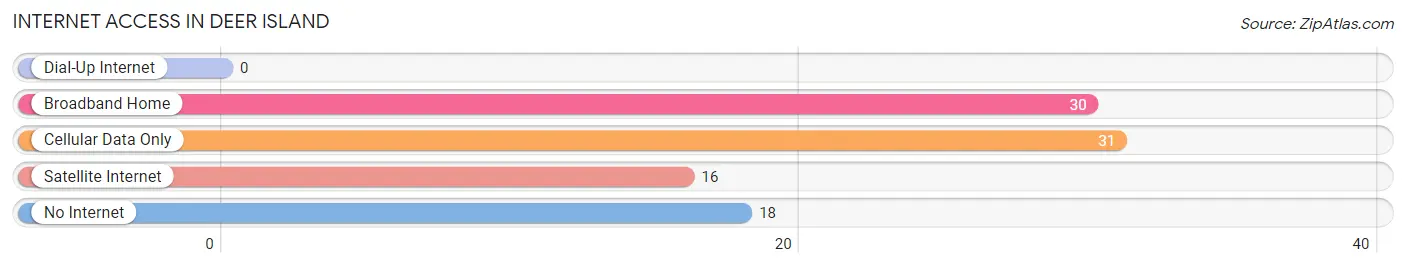
| Internet Type | # Households | % Households |
| Dial-Up Internet | 0 | 0.0% |
| Broadband Home | 30 | 31.6% |
| Cellular Data Only | 31 | 32.6% |
| Satellite Internet | 16 | 16.8% |
| No Internet | 18 | 19.0% |
| Total | 95 | 100.0% |
Deer Island Summary
Deer Island is a small unincorporated community located in Columbia County, Oregon, United States. It is situated on the north bank of the Columbia River, approximately 10 miles east of St. Helens. The community is named after the nearby island of the same name, which is located in the Columbia River.
History
Deer Island was first settled in the late 1800s by a group of settlers from the nearby town of St. Helens. The settlers were attracted to the area by the abundance of fish and wildlife in the area. The first settlers built a small dock and a few houses, and the community slowly grew. By the early 1900s, the community had grown to include a general store, a post office, a school, and a few other businesses.
In the early 1900s, the area was also home to a large number of Native American tribes, including the Chinook, Clatsop, and Cowlitz. The tribes had lived in the area for centuries, and the settlers often interacted with them.
In the early 1900s, the area was also home to a large number of loggers. The loggers harvested the abundant timber in the area, and the lumber was used to build homes and other structures in the area.
Geography
Deer Island is located in Columbia County, Oregon, on the north bank of the Columbia River. The community is situated approximately 10 miles east of St. Helens. The area is mostly flat, with some rolling hills. The climate is mild, with temperatures ranging from the mid-30s in the winter to the mid-80s in the summer.
Economy
The economy of Deer Island is largely based on fishing and tourism. The area is home to a number of commercial fishing operations, and the fish caught in the area are sold both locally and nationally. The area is also home to a number of recreational fishing operations, and the fish caught in the area are often used for sport fishing.
The area is also home to a number of tourist attractions, including the Columbia River Maritime Museum, the Columbia River Gorge National Scenic Area, and the Lewis and Clark National Historic Trail. The area is also home to a number of wineries, and the wines produced in the area are sold both locally and nationally.
Demographics
As of the 2010 census, the population of Deer Island was 1,093. The population is largely white (94.3%), with a small percentage of African Americans (2.2%), Asians (1.2%), and Native Americans (0.7%). The median household income in the area is $45,000, and the median home value is $170,000. The area is largely rural, with most of the population living in small towns and villages.
Common Questions
What is Per Capita Income in Deer Island?
Per Capita income in Deer Island is $20,331.
What is the Median Family Income in Deer Island?
Median Family Income in Deer Island is $80,819.
What is Inequality or Gini Index in Deer Island?
Inequality or Gini Index in Deer Island is 0.35.
What is the Total Population of Deer Island?
Total Population of Deer Island is 230.
What is the Total Male Population of Deer Island?
Total Male Population of Deer Island is 115.
What is the Total Female Population of Deer Island?
Total Female Population of Deer Island is 115.
What is the Ratio of Males per 100 Females in Deer Island?
There are 100.00 Males per 100 Females in Deer Island.
What is the Ratio of Females per 100 Males in Deer Island?
There are 100.00 Females per 100 Males in Deer Island.
What is the Median Population Age in Deer Island?
Median Population Age in Deer Island is 40.2 Years.
What is the Average Family Size in Deer Island
Average Family Size in Deer Island is 3.8 People.
What is the Average Household Size in Deer Island
Average Household Size in Deer Island is 2.4 People.
How Large is the Labor Force in Deer Island?
There are 64 People in the Labor Forcein in Deer Island.
What is the Percentage of People in the Labor Force in Deer Island?
33.7% of People are in the Labor Force in Deer Island.
What is the Unemployment Rate in Deer Island?
Unemployment Rate in Deer Island is 25.0%.