De Queen, AR Map & Demographics
De Queen Map
De Queen Overview
$23,247
PER CAPITA INCOME
$58,214
AVG FAMILY INCOME
$55,207
AVG HOUSEHOLD INCOME
31.1%
WAGE / INCOME GAP [ % ]
68.9¢/ $1
WAGE / INCOME GAP [ $ ]
0.44
INEQUALITY / GINI INDEX
6,132
TOTAL POPULATION
2,801
MALE POPULATION
3,331
FEMALE POPULATION
84.09
MALES / 100 FEMALES
118.92
FEMALES / 100 MALES
33.0
MEDIAN AGE
3.7
AVG FAMILY SIZE
2.9
AVG HOUSEHOLD SIZE
2,830
LABOR FORCE [ PEOPLE ]
63.4%
PERCENT IN LABOR FORCE
2.5%
UNEMPLOYMENT RATE
De Queen Zip Codes
De Queen Area Codes
Income in De Queen
Income Overview in De Queen
Per Capita Income in De Queen is $23,247, while median incomes of families and households are $58,214 and $55,207 respectively.
| Characteristic | Number | Measure |
| Per Capita Income | 6,132 | $23,247 |
| Median Family Income | 1,396 | $58,214 |
| Mean Family Income | 1,396 | $77,189 |
| Median Household Income | 2,079 | $55,207 |
| Mean Household Income | 2,079 | $64,508 |
| Income Deficit | 1,396 | $0 |
| Wage / Income Gap (%) | 6,132 | 31.08% |
| Wage / Income Gap ($) | 6,132 | 68.92¢ per $1 |
| Gini / Inequality Index | 6,132 | 0.44 |
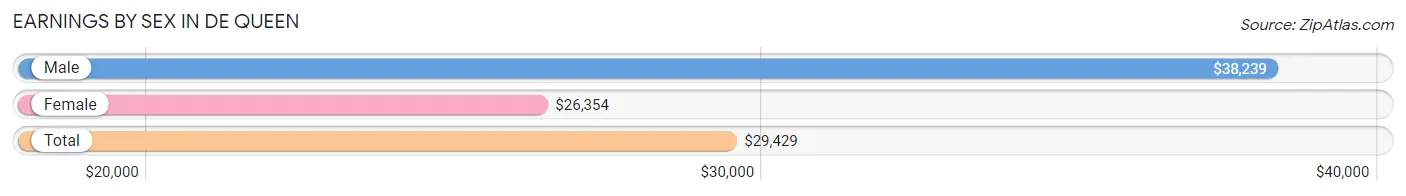
Earnings by Sex in De Queen
Average Earnings in De Queen are $29,429, $38,239 for men and $26,354 for women, a difference of 31.1%.
| Sex | Number | Average Earnings |
| Male | 1,643 (57.2%) | $38,239 |
| Female | 1,229 (42.8%) | $26,354 |
| Total | 2,872 (100.0%) | $29,429 |
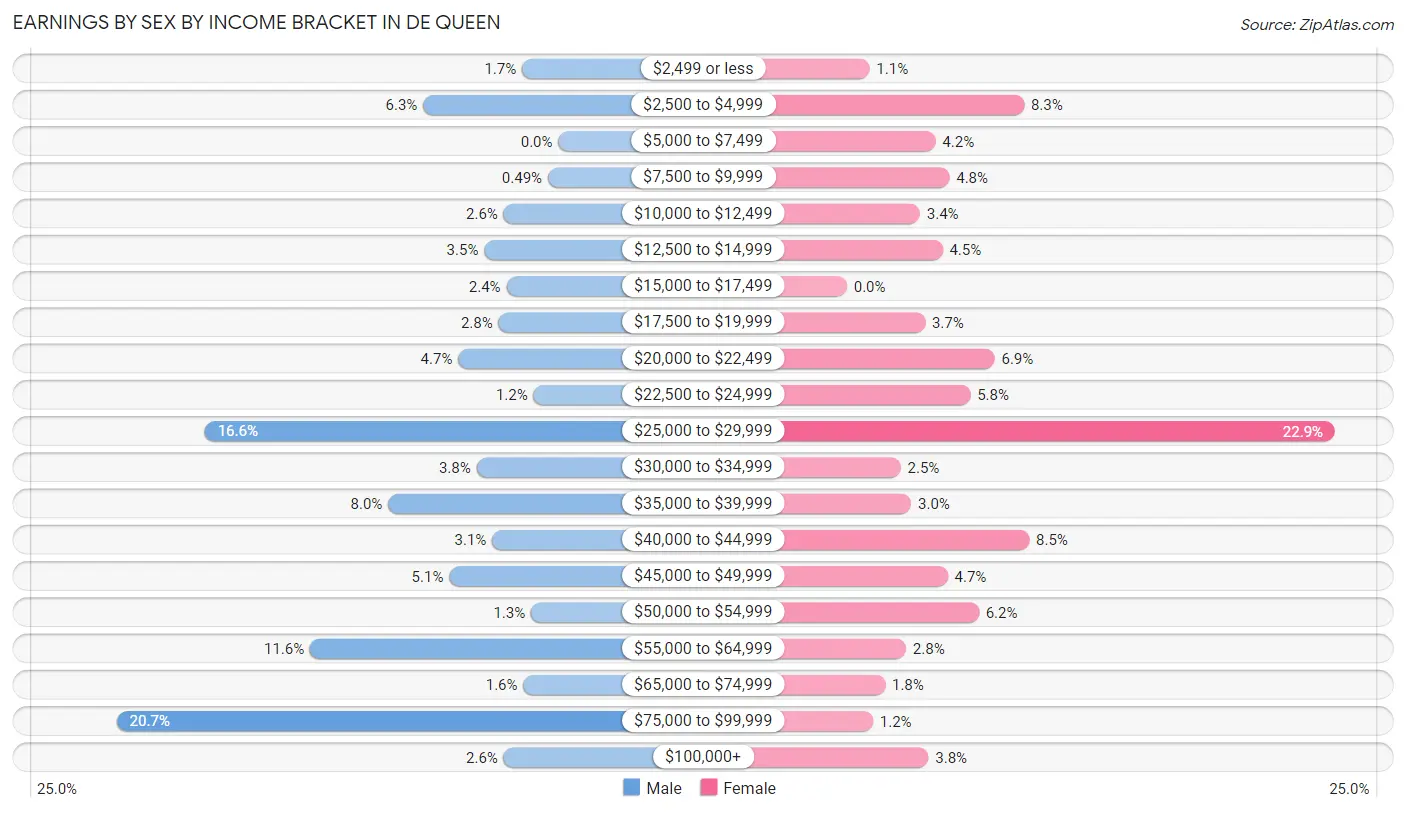
Earnings by Sex by Income Bracket in De Queen
The most common earnings brackets in De Queen are $75,000 to $99,999 for men (340 | 20.7%) and $25,000 to $29,999 for women (281 | 22.9%).
| Income | Male | Female |
| $2,499 or less | 28 (1.7%) | 13 (1.1%) |
| $2,500 to $4,999 | 104 (6.3%) | 102 (8.3%) |
| $5,000 to $7,499 | 0 (0.0%) | 51 (4.2%) |
| $7,500 to $9,999 | 8 (0.5%) | 59 (4.8%) |
| $10,000 to $12,499 | 42 (2.6%) | 42 (3.4%) |
| $12,500 to $14,999 | 57 (3.5%) | 55 (4.5%) |
| $15,000 to $17,499 | 40 (2.4%) | 0 (0.0%) |
| $17,500 to $19,999 | 46 (2.8%) | 45 (3.7%) |
| $20,000 to $22,499 | 77 (4.7%) | 85 (6.9%) |
| $22,500 to $24,999 | 19 (1.2%) | 71 (5.8%) |
| $25,000 to $29,999 | 272 (16.6%) | 281 (22.9%) |
| $30,000 to $34,999 | 63 (3.8%) | 31 (2.5%) |
| $35,000 to $39,999 | 131 (8.0%) | 37 (3.0%) |
| $40,000 to $44,999 | 51 (3.1%) | 105 (8.5%) |
| $45,000 to $49,999 | 84 (5.1%) | 58 (4.7%) |
| $50,000 to $54,999 | 21 (1.3%) | 76 (6.2%) |
| $55,000 to $64,999 | 191 (11.6%) | 34 (2.8%) |
| $65,000 to $74,999 | 27 (1.6%) | 22 (1.8%) |
| $75,000 to $99,999 | 340 (20.7%) | 15 (1.2%) |
| $100,000+ | 42 (2.6%) | 47 (3.8%) |
| Total | 1,643 (100.0%) | 1,229 (100.0%) |
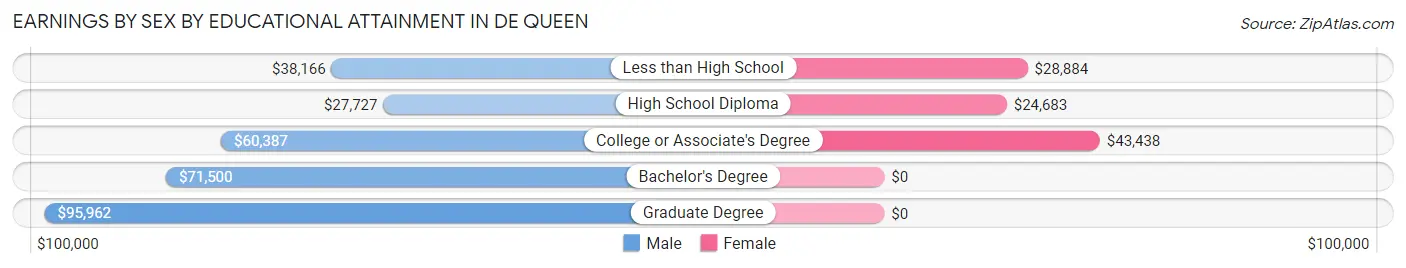
Earnings by Sex by Educational Attainment in De Queen
Average earnings in De Queen are $39,597 for men and $36,125 for women, a difference of 8.8%. Men with an educational attainment of graduate degree enjoy the highest average annual earnings of $95,962, while those with high school diploma education earn the least with $27,727. Women with an educational attainment of college or associate's degree earn the most with the average annual earnings of $43,438, while those with high school diploma education have the smallest earnings of $24,683.
| Educational Attainment | Male Income | Female Income |
| Less than High School | $38,166 | $28,884 |
| High School Diploma | $27,727 | $24,683 |
| College or Associate's Degree | $60,387 | $43,438 |
| Bachelor's Degree | $71,500 | $0 |
| Graduate Degree | $95,962 | $0 |
| Total | $39,597 | $36,125 |
Family Income in De Queen
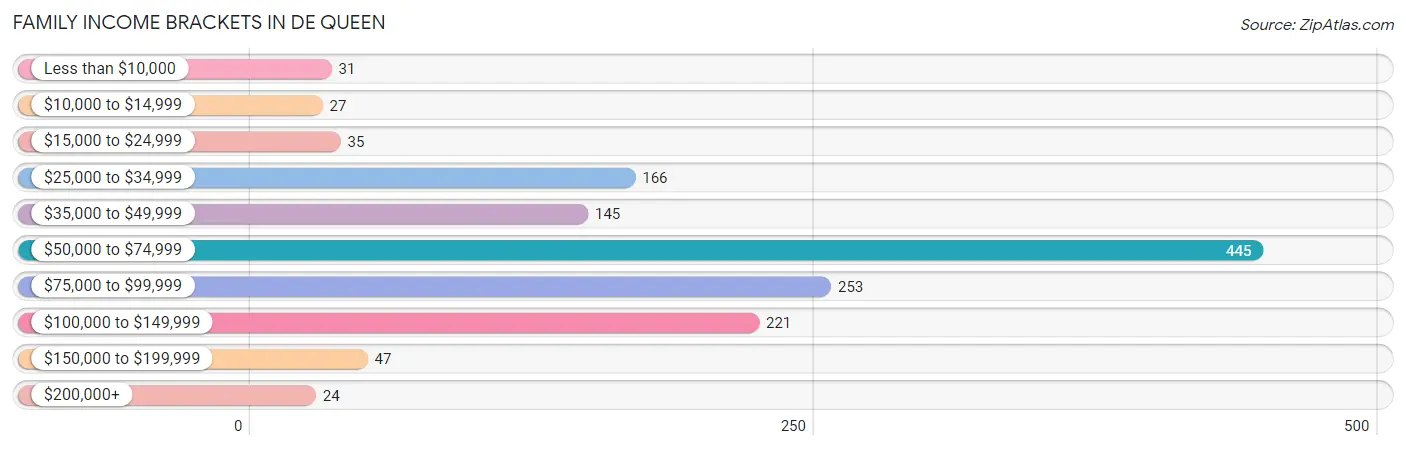
Family Income Brackets in De Queen
According to the De Queen family income data, there are 445 families falling into the $50,000 to $74,999 income range, which is the most common income bracket and makes up 31.9% of all families. Conversely, the $200,000+ income bracket is the least frequent group with only 24 families (1.7%) belonging to this category.
| Income Bracket | # Families | % Families |
| Less than $10,000 | 31 | 2.2% |
| $10,000 to $14,999 | 27 | 1.9% |
| $15,000 to $24,999 | 35 | 2.5% |
| $25,000 to $34,999 | 166 | 11.9% |
| $35,000 to $49,999 | 145 | 10.4% |
| $50,000 to $74,999 | 445 | 31.9% |
| $75,000 to $99,999 | 253 | 18.1% |
| $100,000 to $149,999 | 221 | 15.8% |
| $150,000 to $199,999 | 47 | 3.4% |
| $200,000+ | 24 | 1.7% |
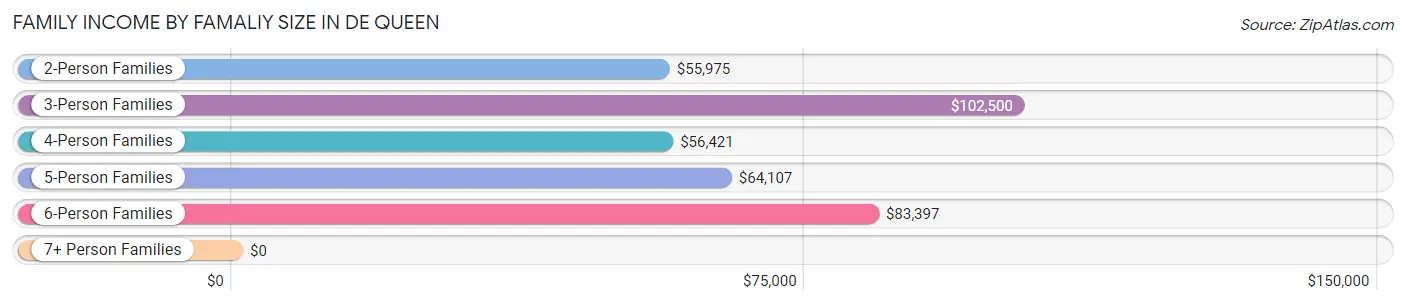
Family Income by Famaliy Size in De Queen
3-person families (116 | 8.3%) account for the highest median family income in De Queen with $102,500 per family, while 3-person families (116 | 8.3%) have the highest median income of $34,167 per family member.
| Income Bracket | # Families | Median Income |
| 2-Person Families | 495 (35.5%) | $55,975 |
| 3-Person Families | 116 (8.3%) | $102,500 |
| 4-Person Families | 228 (16.3%) | $56,421 |
| 5-Person Families | 255 (18.3%) | $64,107 |
| 6-Person Families | 234 (16.8%) | $83,397 |
| 7+ Person Families | 68 (4.9%) | $0 |
| Total | 1,396 (100.0%) | $58,214 |
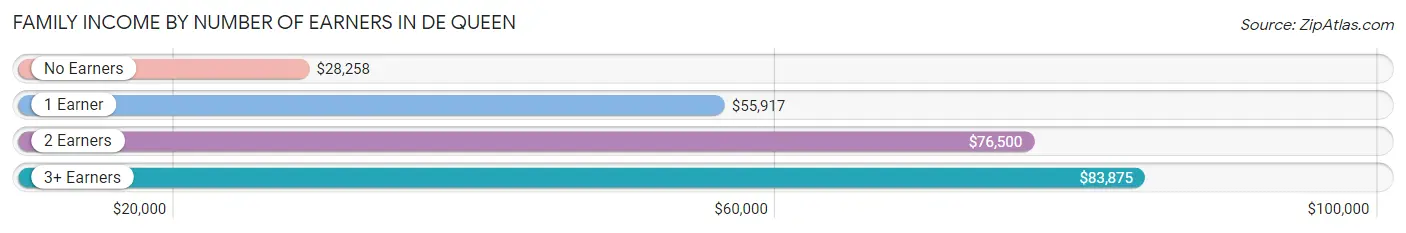
Family Income by Number of Earners in De Queen
The median family income in De Queen is $58,214, with families comprising 3+ earners (154) having the highest median family income of $83,875, while families with no earners (112) have the lowest median family income of $28,258, accounting for 11.0% and 8.0% of families, respectively.
| Number of Earners | # Families | Median Income |
| No Earners | 112 (8.0%) | $28,258 |
| 1 Earner | 458 (32.8%) | $55,917 |
| 2 Earners | 672 (48.1%) | $76,500 |
| 3+ Earners | 154 (11.0%) | $83,875 |
| Total | 1,396 (100.0%) | $58,214 |
Household Income in De Queen
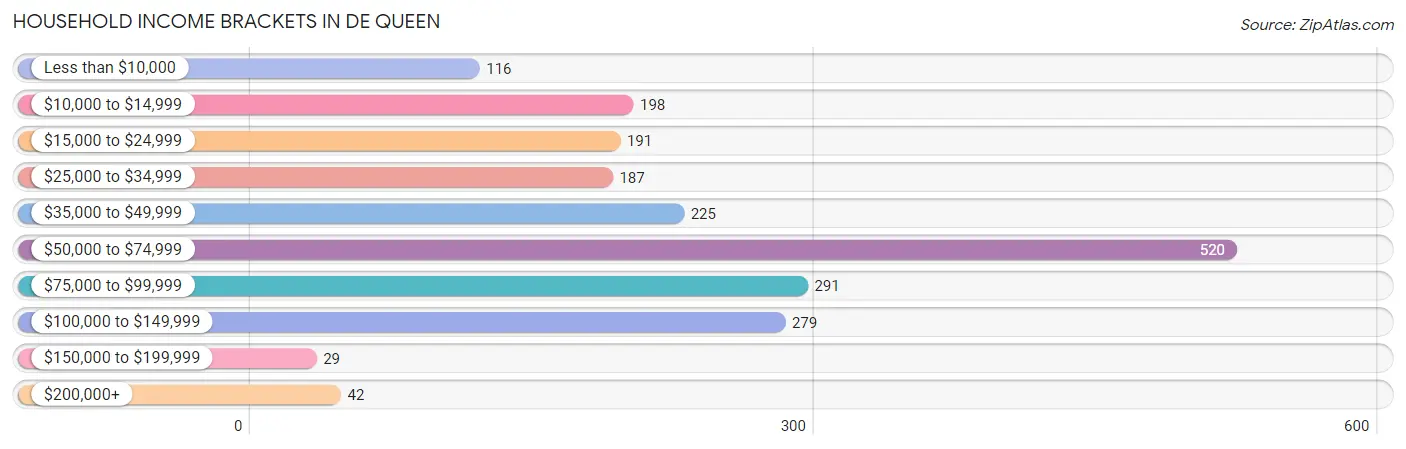
Household Income Brackets in De Queen
With 520 households falling in the category, the $50,000 to $74,999 income range is the most frequent in De Queen, accounting for 25.0% of all households. In contrast, only 29 households (1.4%) fall into the $150,000 to $199,999 income bracket, making it the least populous group.
| Income Bracket | # Households | % Households |
| Less than $10,000 | 116 | 5.6% |
| $10,000 to $14,999 | 198 | 9.5% |
| $15,000 to $24,999 | 191 | 9.2% |
| $25,000 to $34,999 | 187 | 9.0% |
| $35,000 to $49,999 | 225 | 10.8% |
| $50,000 to $74,999 | 520 | 25.0% |
| $75,000 to $99,999 | 291 | 14.0% |
| $100,000 to $149,999 | 279 | 13.4% |
| $150,000 to $199,999 | 29 | 1.4% |
| $200,000+ | 42 | 2.0% |
Household Income by Householder Age in De Queen
The median household income in De Queen is $55,207, with the highest median household income of $63,006 found in the 45 to 64 years age bracket for the primary householder. A total of 883 households (42.5%) fall into this category. Meanwhile, the 65+ years age bracket for the primary householder has the lowest median household income of $33,068, with 422 households (20.3%) in this group.
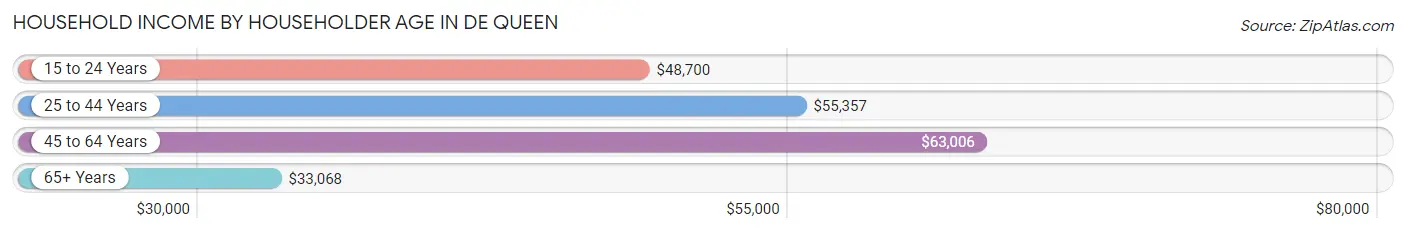
| Income Bracket | # Households | Median Income |
| 15 to 24 Years | 74 (3.6%) | $48,700 |
| 25 to 44 Years | 700 (33.7%) | $55,357 |
| 45 to 64 Years | 883 (42.5%) | $63,006 |
| 65+ Years | 422 (20.3%) | $33,068 |
| Total | 2,079 (100.0%) | $55,207 |
Poverty in De Queen
Income Below Poverty by Sex and Age in De Queen
With 16.4% poverty level for males and 20.8% for females among the residents of De Queen, 5 year old males and 5 year old females are the most vulnerable to poverty, with 56 males (75.7%) and 11 females (100.0%) in their respective age groups living below the poverty level.
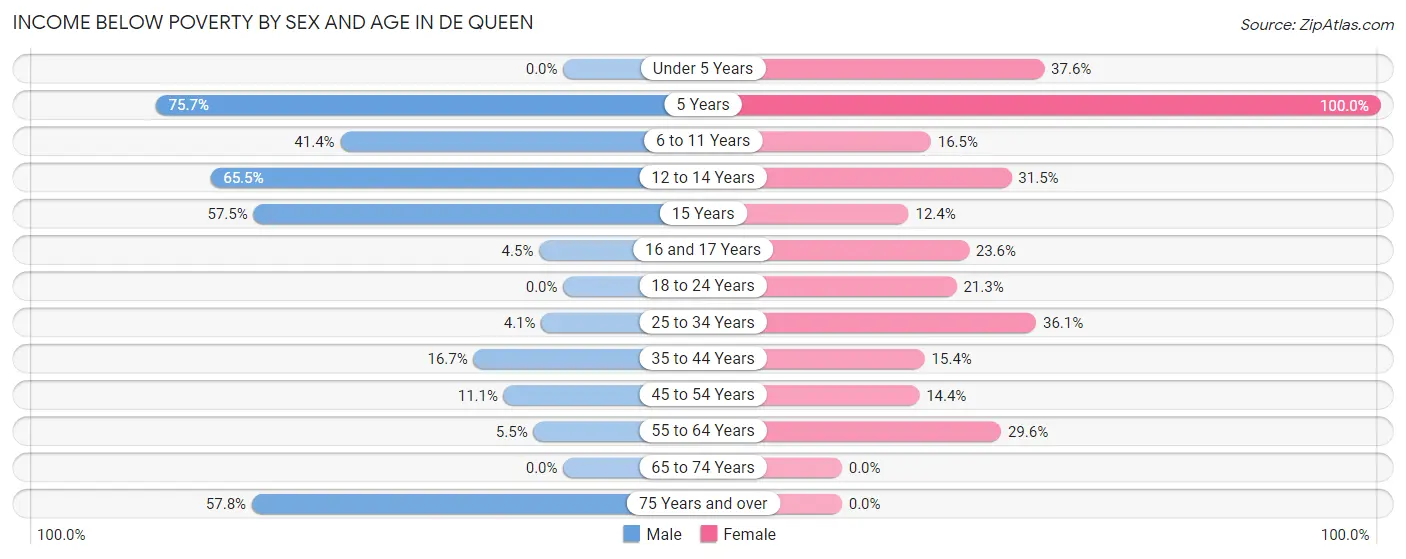
| Age Bracket | Male | Female |
| Under 5 Years | 0 (0.0%) | 77 (37.6%) |
| 5 Years | 56 (75.7%) | 11 (100.0%) |
| 6 to 11 Years | 72 (41.4%) | 77 (16.5%) |
| 12 to 14 Years | 57 (65.5%) | 34 (31.5%) |
| 15 Years | 23 (57.5%) | 14 (12.4%) |
| 16 and 17 Years | 3 (4.5%) | 37 (23.6%) |
| 18 to 24 Years | 0 (0.0%) | 99 (21.3%) |
| 25 to 34 Years | 12 (4.1%) | 97 (36.1%) |
| 35 to 44 Years | 88 (16.7%) | 68 (15.4%) |
| 45 to 54 Years | 39 (11.1%) | 51 (14.4%) |
| 55 to 64 Years | 18 (5.5%) | 99 (29.5%) |
| 65 to 74 Years | 0 (0.0%) | 0 (0.0%) |
| 75 Years and over | 74 (57.8%) | 0 (0.0%) |
| Total | 442 (16.4%) | 664 (20.8%) |
Income Above Poverty by Sex and Age in De Queen
According to the poverty statistics in De Queen, males aged under 5 years and females aged 65 to 74 years are the age groups that are most secure financially, with 100.0% of males and 100.0% of females in these age groups living above the poverty line.
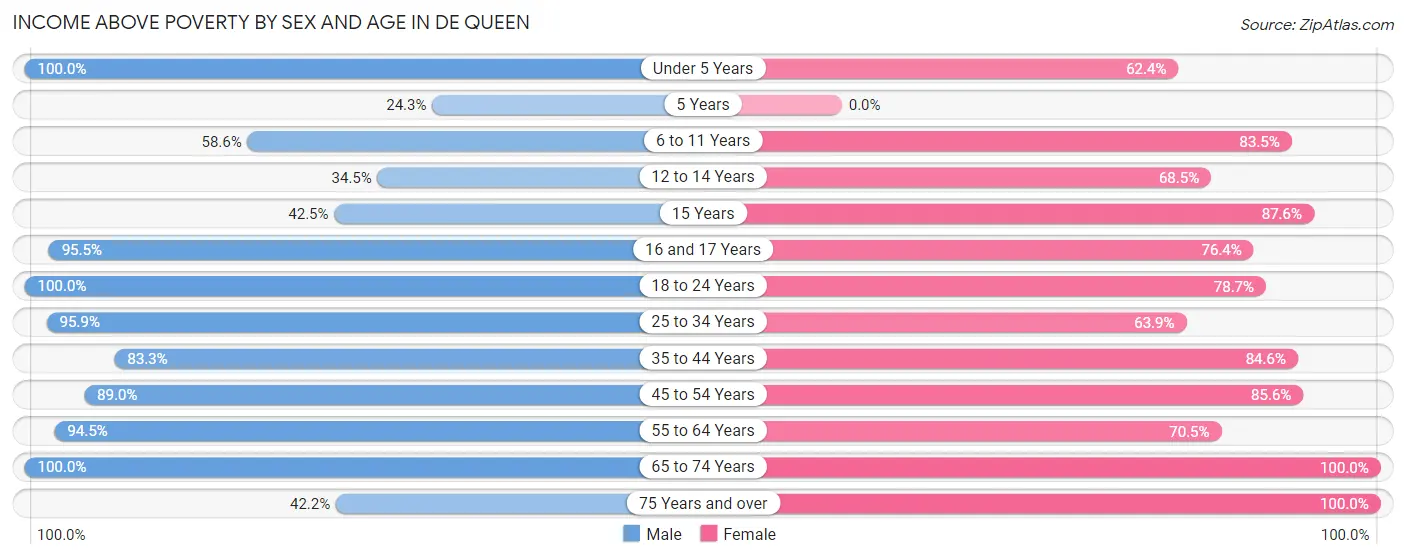
| Age Bracket | Male | Female |
| Under 5 Years | 261 (100.0%) | 128 (62.4%) |
| 5 Years | 18 (24.3%) | 0 (0.0%) |
| 6 to 11 Years | 102 (58.6%) | 389 (83.5%) |
| 12 to 14 Years | 30 (34.5%) | 74 (68.5%) |
| 15 Years | 17 (42.5%) | 99 (87.6%) |
| 16 and 17 Years | 64 (95.5%) | 120 (76.4%) |
| 18 to 24 Years | 249 (100.0%) | 366 (78.7%) |
| 25 to 34 Years | 282 (95.9%) | 172 (63.9%) |
| 35 to 44 Years | 440 (83.3%) | 374 (84.6%) |
| 45 to 54 Years | 314 (88.9%) | 304 (85.6%) |
| 55 to 64 Years | 307 (94.5%) | 236 (70.5%) |
| 65 to 74 Years | 117 (100.0%) | 192 (100.0%) |
| 75 Years and over | 54 (42.2%) | 80 (100.0%) |
| Total | 2,255 (83.6%) | 2,534 (79.2%) |
Income Below Poverty Among Married-Couple Families in De Queen
The poverty statistics for married-couple families in De Queen show that 3.6% or 39 of the total 1,079 families live below the poverty line. Families with 3 or 4 children have the highest poverty rate of 6.8%, comprising of 20 families. On the other hand, families with no children have the lowest poverty rate of 0.0%, which includes 0 families.
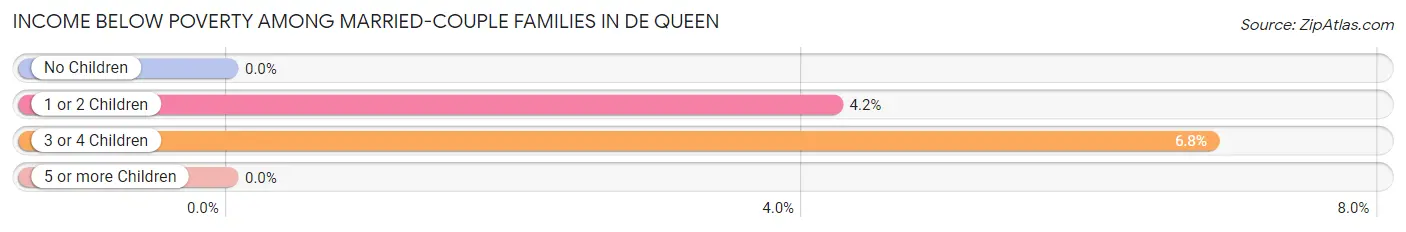
| Children | Above Poverty | Below Poverty |
| No Children | 335 (100.0%) | 0 (0.0%) |
| 1 or 2 Children | 432 (95.8%) | 19 (4.2%) |
| 3 or 4 Children | 273 (93.2%) | 20 (6.8%) |
| 5 or more Children | 0 (0.0%) | 0 (0.0%) |
| Total | 1,040 (96.4%) | 39 (3.6%) |
Income Below Poverty Among Single-Parent Households in De Queen
According to the poverty data in De Queen, 19.4% or 19 single-father households and 26.5% or 58 single-mother households are living below the poverty line. Among single-father households, those with 5 or more children have the highest poverty rate, with 19 households (100.0%) experiencing poverty. Likewise, among single-mother households, those with 3 or 4 children have the highest poverty rate, with 48 households (76.2%) falling below the poverty line.
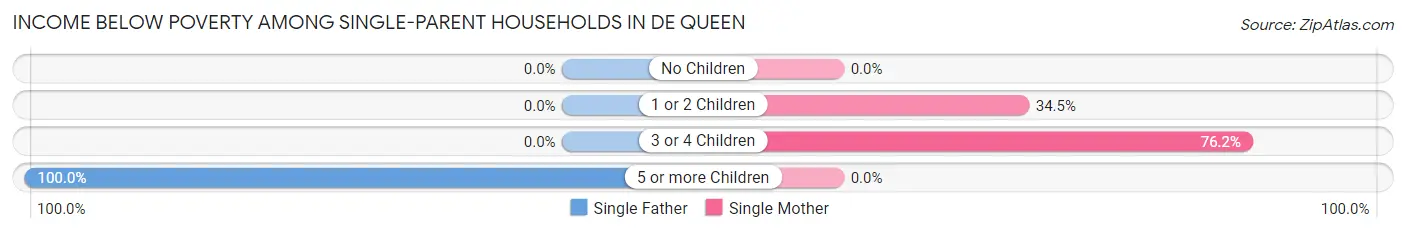
| Children | Single Father | Single Mother |
| No Children | 0 (0.0%) | 0 (0.0%) |
| 1 or 2 Children | 0 (0.0%) | 10 (34.5%) |
| 3 or 4 Children | 0 (0.0%) | 48 (76.2%) |
| 5 or more Children | 19 (100.0%) | 0 (0.0%) |
| Total | 19 (19.4%) | 58 (26.5%) |
Income Below Poverty Among Married-Couple vs Single-Parent Households in De Queen
The poverty data for De Queen shows that 39 of the married-couple family households (3.6%) and 77 of the single-parent households (24.3%) are living below the poverty level. Within the married-couple family households, those with 3 or 4 children have the highest poverty rate, with 20 households (6.8%) falling below the poverty line. Among the single-parent households, those with 5 or more children have the highest poverty rate, with 19 household (100.0%) living below poverty.
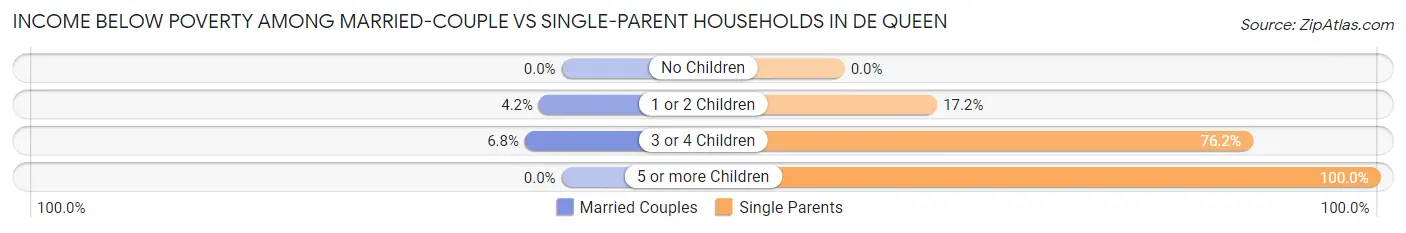
| Children | Married-Couple Families | Single-Parent Households |
| No Children | 0 (0.0%) | 0 (0.0%) |
| 1 or 2 Children | 19 (4.2%) | 10 (17.2%) |
| 3 or 4 Children | 20 (6.8%) | 48 (76.2%) |
| 5 or more Children | 0 (0.0%) | 19 (100.0%) |
| Total | 39 (3.6%) | 77 (24.3%) |
Race in De Queen
The most populous races in De Queen are Hispanic or Latino (3,596 | 58.6%), Some other Race (3,120 | 50.9%), and White / Caucasian (2,111 | 34.4%).
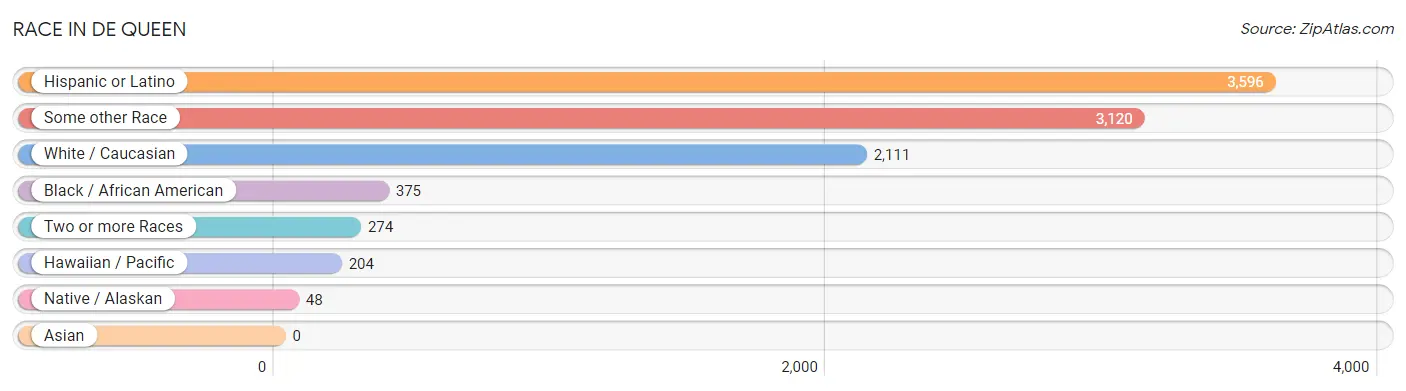
| Race | # Population | % Population |
| Asian | 0 | 0.0% |
| Black / African American | 375 | 6.1% |
| Hawaiian / Pacific | 204 | 3.3% |
| Hispanic or Latino | 3,596 | 58.6% |
| Native / Alaskan | 48 | 0.8% |
| White / Caucasian | 2,111 | 34.4% |
| Two or more Races | 274 | 4.5% |
| Some other Race | 3,120 | 50.9% |
| Total | 6,132 | 100.0% |
Ancestry in De Queen
The most populous ancestries reported in De Queen are Mexican (3,472 | 56.6%), Irish (552 | 9.0%), English (367 | 6.0%), Fijian (200 | 3.3%), and German (172 | 2.8%), together accounting for 77.7% of all De Queen residents.
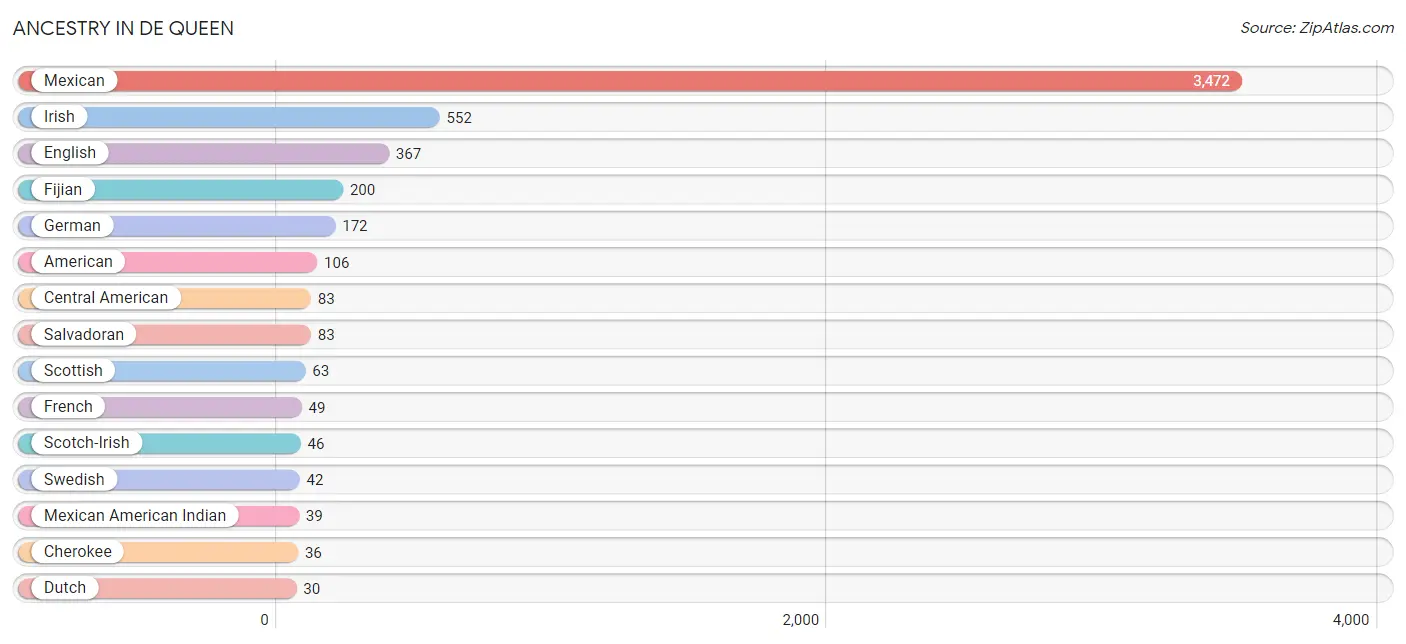
| Ancestry | # Population | % Population |
| American | 106 | 1.7% |
| Central American | 83 | 1.3% |
| Cherokee | 36 | 0.6% |
| Chippewa | 16 | 0.3% |
| Choctaw | 12 | 0.2% |
| Dutch | 30 | 0.5% |
| English | 367 | 6.0% |
| European | 10 | 0.2% |
| Fijian | 200 | 3.3% |
| French | 49 | 0.8% |
| German | 172 | 2.8% |
| Irish | 552 | 9.0% |
| Italian | 9 | 0.2% |
| Mexican | 3,472 | 56.6% |
| Mexican American Indian | 39 | 0.6% |
| Navajo | 22 | 0.4% |
| Salvadoran | 83 | 1.3% |
| Scotch-Irish | 46 | 0.7% |
| Scottish | 63 | 1.0% |
| Swedish | 42 | 0.7% |
| Welsh | 4 | 0.1% | View All 21 Rows |
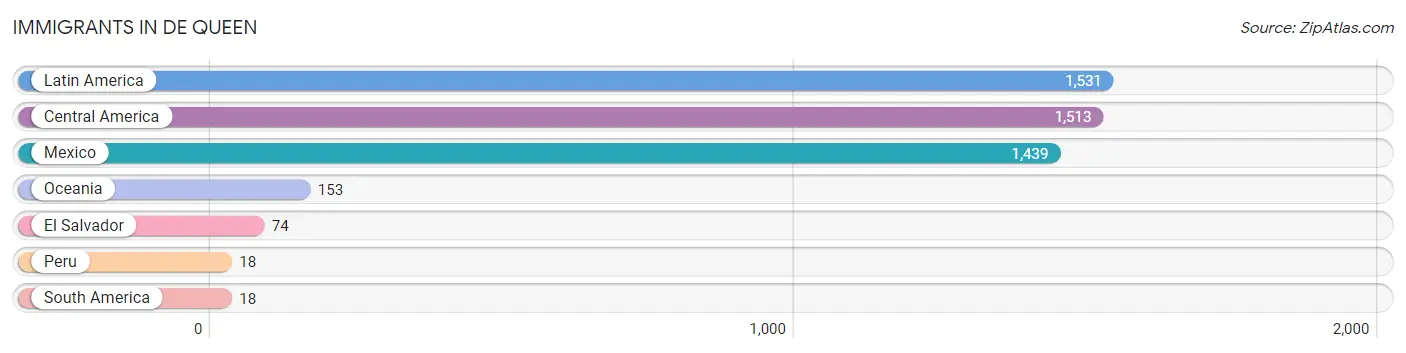
Immigrants in De Queen
The most numerous immigrant groups reported in De Queen came from Latin America (1,531 | 25.0%), Central America (1,513 | 24.7%), Mexico (1,439 | 23.5%), Oceania (153 | 2.5%), and El Salvador (74 | 1.2%), together accounting for 76.8% of all De Queen residents.
| Immigration Origin | # Population | % Population |
| Central America | 1,513 | 24.7% |
| El Salvador | 74 | 1.2% |
| Latin America | 1,531 | 25.0% |
| Mexico | 1,439 | 23.5% |
| Oceania | 153 | 2.5% |
| Peru | 18 | 0.3% |
| South America | 18 | 0.3% | View All 7 Rows |
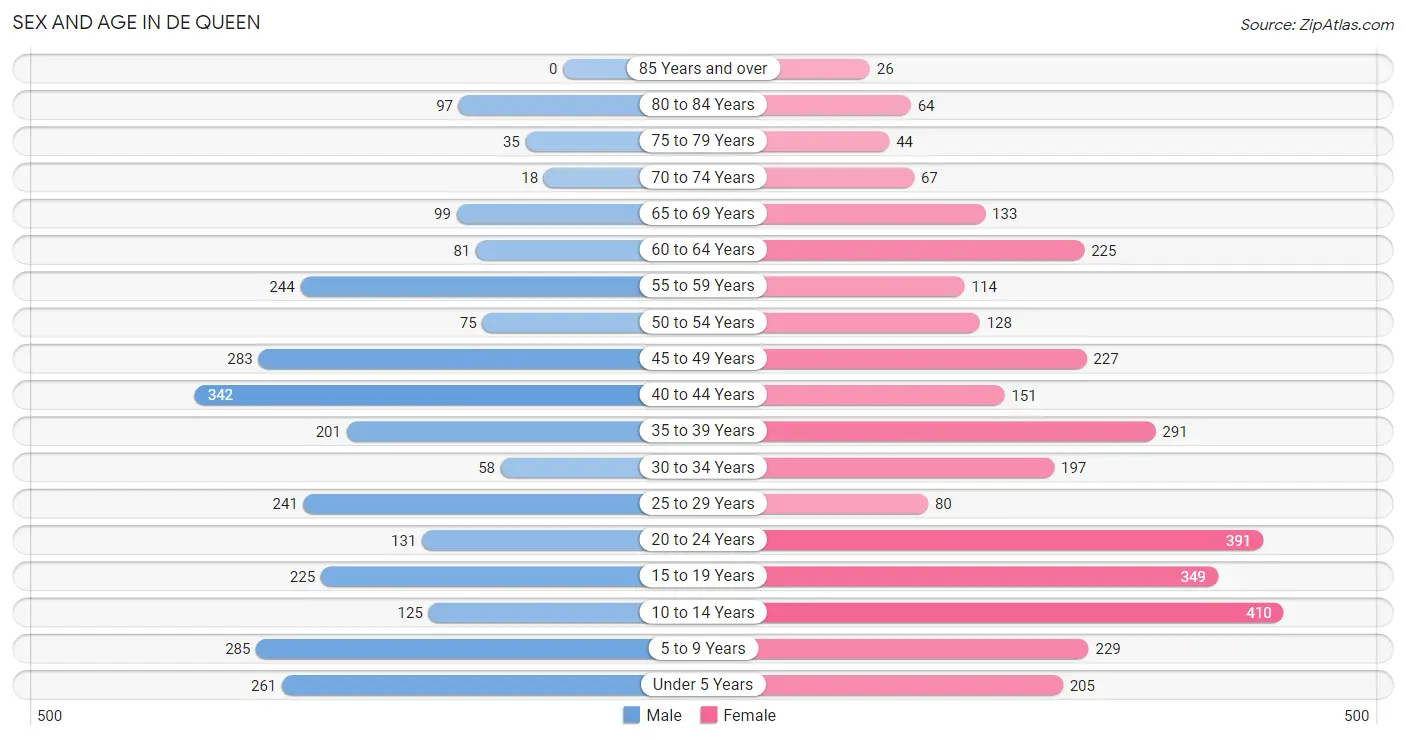
Sex and Age in De Queen
Sex and Age in De Queen
The most populous age groups in De Queen are 40 to 44 Years (342 | 12.2%) for men and 10 to 14 Years (410 | 12.3%) for women.
| Age Bracket | Male | Female |
| Under 5 Years | 261 (9.3%) | 205 (6.1%) |
| 5 to 9 Years | 285 (10.2%) | 229 (6.9%) |
| 10 to 14 Years | 125 (4.5%) | 410 (12.3%) |
| 15 to 19 Years | 225 (8.0%) | 349 (10.5%) |
| 20 to 24 Years | 131 (4.7%) | 391 (11.7%) |
| 25 to 29 Years | 241 (8.6%) | 80 (2.4%) |
| 30 to 34 Years | 58 (2.1%) | 197 (5.9%) |
| 35 to 39 Years | 201 (7.2%) | 291 (8.7%) |
| 40 to 44 Years | 342 (12.2%) | 151 (4.5%) |
| 45 to 49 Years | 283 (10.1%) | 227 (6.8%) |
| 50 to 54 Years | 75 (2.7%) | 128 (3.8%) |
| 55 to 59 Years | 244 (8.7%) | 114 (3.4%) |
| 60 to 64 Years | 81 (2.9%) | 225 (6.8%) |
| 65 to 69 Years | 99 (3.5%) | 133 (4.0%) |
| 70 to 74 Years | 18 (0.6%) | 67 (2.0%) |
| 75 to 79 Years | 35 (1.3%) | 44 (1.3%) |
| 80 to 84 Years | 97 (3.5%) | 64 (1.9%) |
| 85 Years and over | 0 (0.0%) | 26 (0.8%) |
| Total | 2,801 (100.0%) | 3,331 (100.0%) |
Families and Households in De Queen
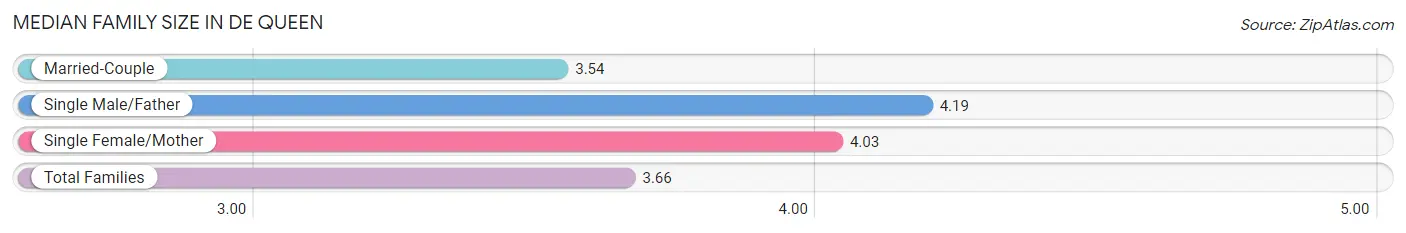
Median Family Size in De Queen
The median family size in De Queen is 3.66 persons per family, with single male/father families (98 | 7.0%) accounting for the largest median family size of 4.19 persons per family. On the other hand, married-couple families (1,079 | 77.3%) represent the smallest median family size with 3.54 persons per family.
| Family Type | # Families | Family Size |
| Married-Couple | 1,079 (77.3%) | 3.54 |
| Single Male/Father | 98 (7.0%) | 4.19 |
| Single Female/Mother | 219 (15.7%) | 4.03 |
| Total Families | 1,396 (100.0%) | 3.66 |
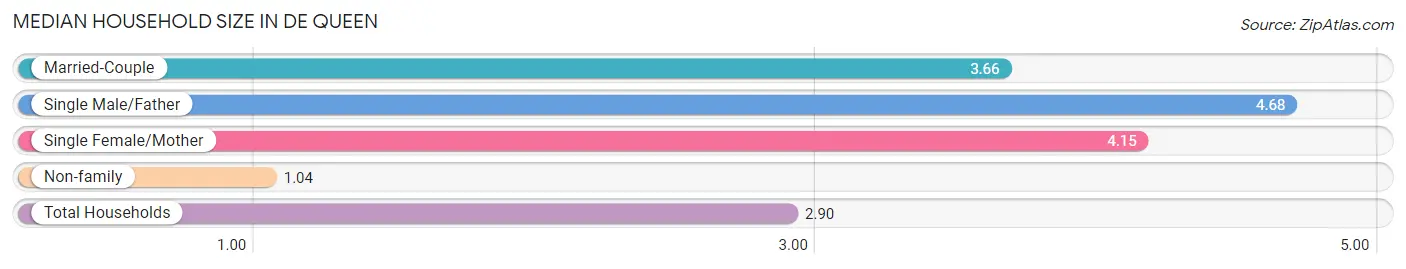
Median Household Size in De Queen
The median household size in De Queen is 2.90 persons per household, with single male/father households (98 | 4.7%) accounting for the largest median household size of 4.68 persons per household. non-family households (683 | 32.9%) represent the smallest median household size with 1.04 persons per household.
| Household Type | # Households | Household Size |
| Married-Couple | 1,079 (51.9%) | 3.66 |
| Single Male/Father | 98 (4.7%) | 4.68 |
| Single Female/Mother | 219 (10.5%) | 4.15 |
| Non-family | 683 (32.9%) | 1.04 |
| Total Households | 2,079 (100.0%) | 2.90 |
Household Size by Marriage Status in De Queen
Out of a total of 2,079 households in De Queen, 1,396 (67.1%) are family households, while 683 (32.9%) are nonfamily households. The most numerous type of family households are 2-person households, comprising 457, and the most common type of nonfamily households are 1-person households, comprising 665.
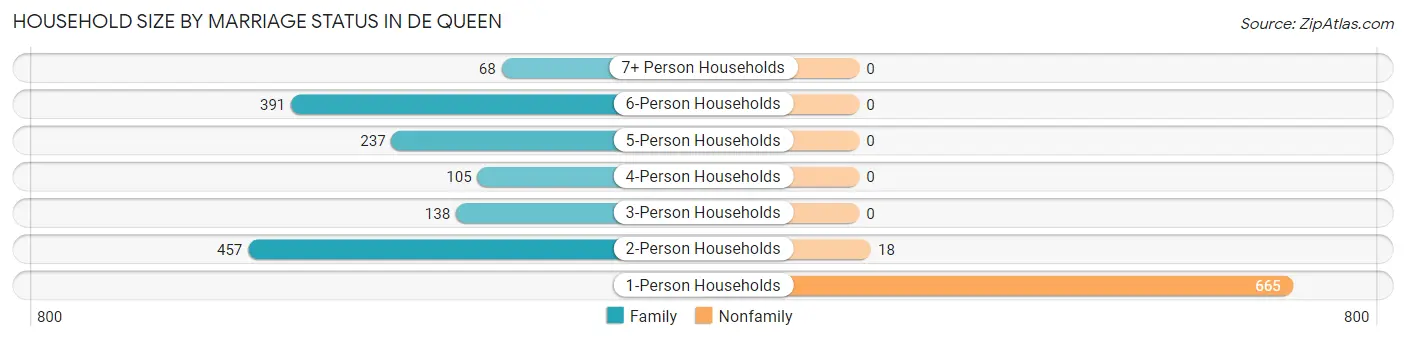
| Household Size | Family Households | Nonfamily Households |
| 1-Person Households | - | 665 (32.0%) |
| 2-Person Households | 457 (22.0%) | 18 (0.9%) |
| 3-Person Households | 138 (6.6%) | 0 (0.0%) |
| 4-Person Households | 105 (5.1%) | 0 (0.0%) |
| 5-Person Households | 237 (11.4%) | 0 (0.0%) |
| 6-Person Households | 391 (18.8%) | 0 (0.0%) |
| 7+ Person Households | 68 (3.3%) | 0 (0.0%) |
| Total | 1,396 (67.1%) | 683 (32.9%) |
Female Fertility in De Queen
Fertility by Age in De Queen
Average fertility rate in De Queen is 21.0 births per 1,000 women. Women in the age bracket of 20 to 34 years have the highest fertility rate with 55.0 births per 1,000 women. Women in the age bracket of 20 to 34 years acount for 100.0% of all women with births.
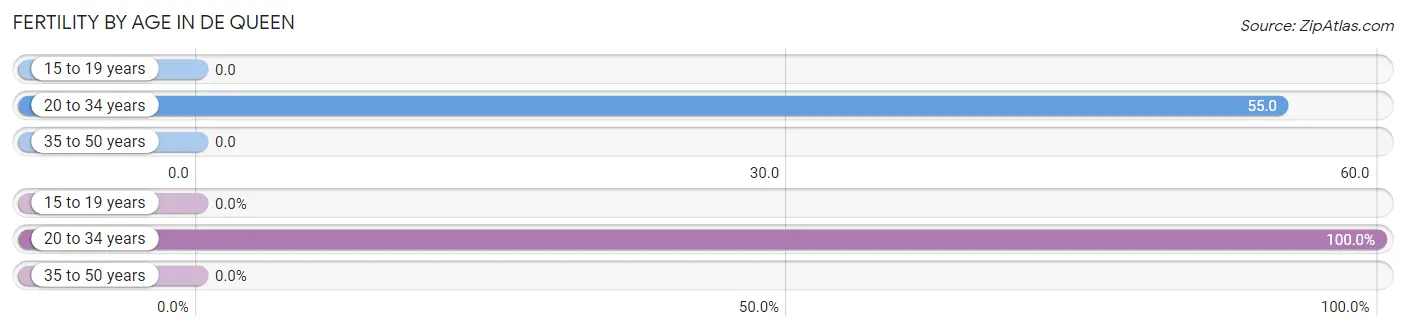
| Age Bracket | Women with Births | Births / 1,000 Women |
| 15 to 19 years | 0 (0.0%) | 0.0 |
| 20 to 34 years | 37 (100.0%) | 55.0 |
| 35 to 50 years | 0 (0.0%) | 0.0 |
| Total | 37 (100.0%) | 21.0 |
Fertility by Age by Marriage Status in De Queen
37.8% of women with births (37) in De Queen are married. The highest percentage of unmarried women with births falls into 20 to 34 years age bracket with 62.2% of them unmarried at the time of birth, while the lowest percentage of unmarried women with births belong to 20 to 34 years age bracket with 62.2% of them unmarried.
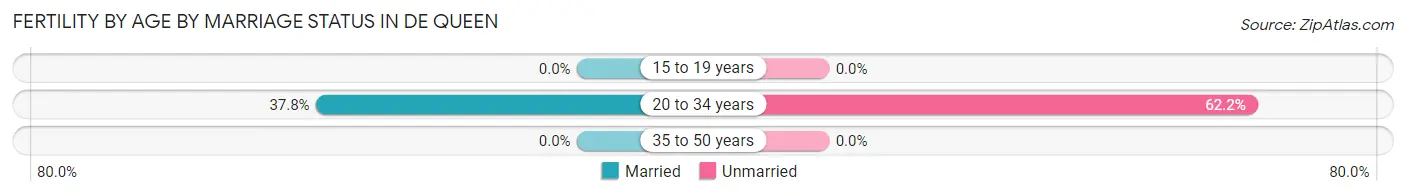
| Age Bracket | Married | Unmarried |
| 15 to 19 years | 0 (0.0%) | 0 (0.0%) |
| 20 to 34 years | 14 (37.8%) | 23 (62.2%) |
| 35 to 50 years | 0 (0.0%) | 0 (0.0%) |
| Total | 14 (37.8%) | 23 (62.2%) |
Fertility by Education in De Queen
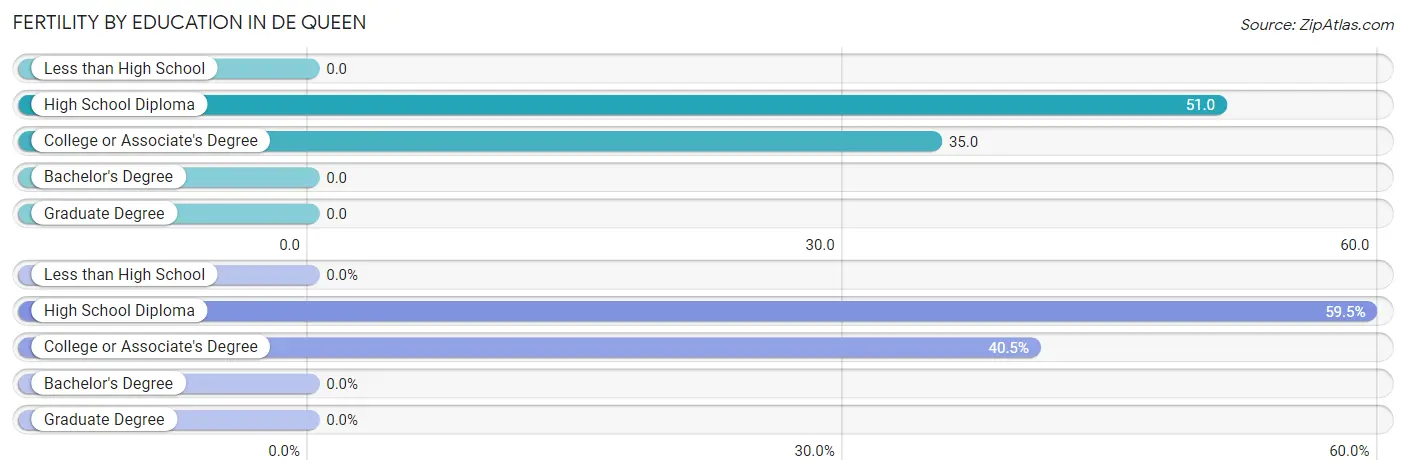
| Educational Attainment | Women with Births | Births / 1,000 Women |
| Less than High School | 0 (0.0%) | 0.0 |
| High School Diploma | 22 (59.5%) | 51.0 |
| College or Associate's Degree | 15 (40.5%) | 35.0 |
| Bachelor's Degree | 0 (0.0%) | 0.0 |
| Graduate Degree | 0 (0.0%) | 0.0 |
| Total | 37 (100.0%) | 21.0 |
Fertility by Education by Marriage Status in De Queen
62.2% of women with births in De Queen are unmarried. Women with the educational attainment of high school diploma are most likely to be married with 63.6% of them married at childbirth, while women with the educational attainment of college or associate's degree are least likely to be married with 100.0% of them unmarried at childbirth.
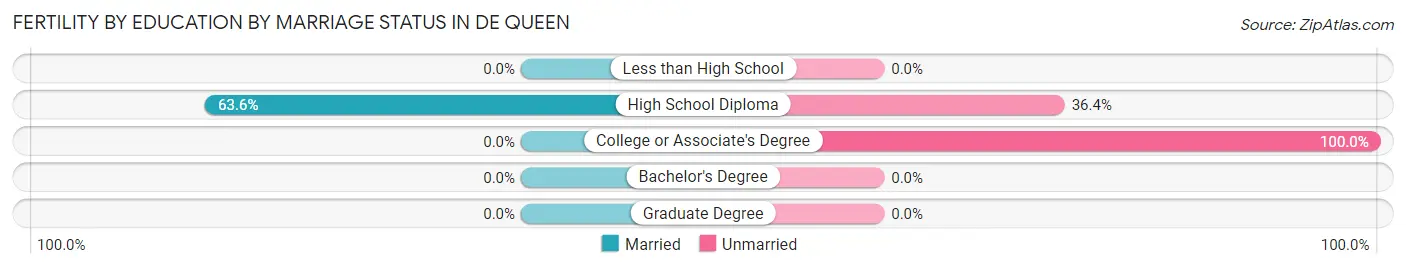
| Educational Attainment | Married | Unmarried |
| Less than High School | 0 (0.0%) | 0 (0.0%) |
| High School Diploma | 14 (63.6%) | 8 (36.4%) |
| College or Associate's Degree | 0 (0.0%) | 15 (100.0%) |
| Bachelor's Degree | 0 (0.0%) | 0 (0.0%) |
| Graduate Degree | 0 (0.0%) | 0 (0.0%) |
| Total | 14 (37.8%) | 23 (62.2%) |
Employment Characteristics in De Queen
Employment by Class of Employer in De Queen
Among the 2,728 employed individuals in De Queen, private company employees (2,196 | 80.5%), local government employees (166 | 6.1%), and not-for-profit organizations (121 | 4.4%) make up the most common classes of employment.
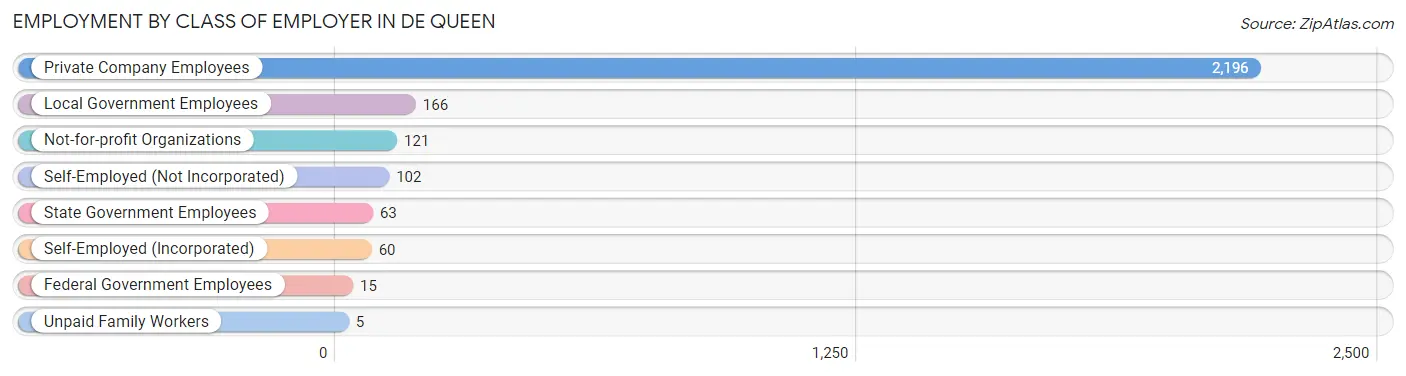
| Employer Class | # Employees | % Employees |
| Private Company Employees | 2,196 | 80.5% |
| Self-Employed (Incorporated) | 60 | 2.2% |
| Self-Employed (Not Incorporated) | 102 | 3.7% |
| Not-for-profit Organizations | 121 | 4.4% |
| Local Government Employees | 166 | 6.1% |
| State Government Employees | 63 | 2.3% |
| Federal Government Employees | 15 | 0.5% |
| Unpaid Family Workers | 5 | 0.2% |
| Total | 2,728 | 100.0% |
Employment Status by Age in De Queen
According to the labor force statistics for De Queen, out of the total population over 16 years of age (4,464), 63.4% or 2,830 individuals are in the labor force, with 2.5% or 71 of them unemployed. The age group with the highest labor force participation rate is 20 to 24 years, with 96.6% or 504 individuals in the labor force. Within the labor force, the 20 to 24 years age range has the highest percentage of unemployed individuals, with 9.9% or 50 of them being unemployed.
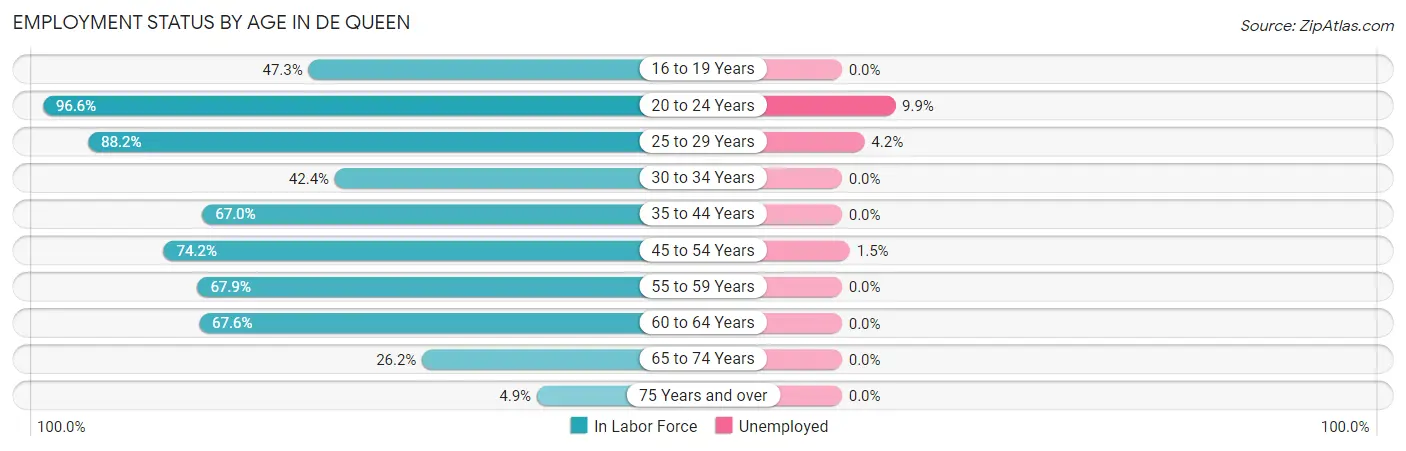
| Age Bracket | In Labor Force | Unemployed |
| 16 to 19 Years | 199 (47.3%) | 0 (0.0%) |
| 20 to 24 Years | 504 (96.6%) | 50 (9.9%) |
| 25 to 29 Years | 283 (88.2%) | 12 (4.2%) |
| 30 to 34 Years | 108 (42.4%) | 0 (0.0%) |
| 35 to 44 Years | 660 (67.0%) | 0 (0.0%) |
| 45 to 54 Years | 529 (74.2%) | 8 (1.5%) |
| 55 to 59 Years | 243 (67.9%) | 0 (0.0%) |
| 60 to 64 Years | 207 (67.6%) | 0 (0.0%) |
| 65 to 74 Years | 83 (26.2%) | 0 (0.0%) |
| 75 Years and over | 13 (4.9%) | 0 (0.0%) |
| Total | 2,830 (63.4%) | 71 (2.5%) |
Employment Status by Educational Attainment in De Queen
According to labor force statistics for De Queen, 69.1% of individuals (2,030) out of the total population between 25 and 64 years of age (2,938) are in the labor force, with 1.0% or 20 of them being unemployed. The group with the highest labor force participation rate are those with the educational attainment of bachelor's degree or higher, with 86.1% or 254 individuals in the labor force. Within the labor force, individuals with bachelor's degree or higher education have the highest percentage of unemployment, with 7.9% or 20 of them being unemployed.
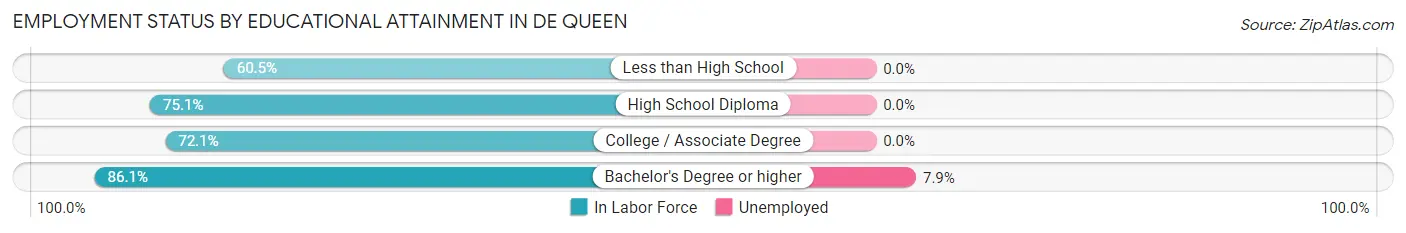
| Educational Attainment | In Labor Force | Unemployed |
| Less than High School | 820 (60.5%) | 0 (0.0%) |
| High School Diploma | 684 (75.1%) | 0 (0.0%) |
| College / Associate Degree | 272 (72.1%) | 0 (0.0%) |
| Bachelor's Degree or higher | 254 (86.1%) | 23 (7.9%) |
| Total | 2,030 (69.1%) | 29 (1.0%) |
Employment Occupations by Sex in De Queen
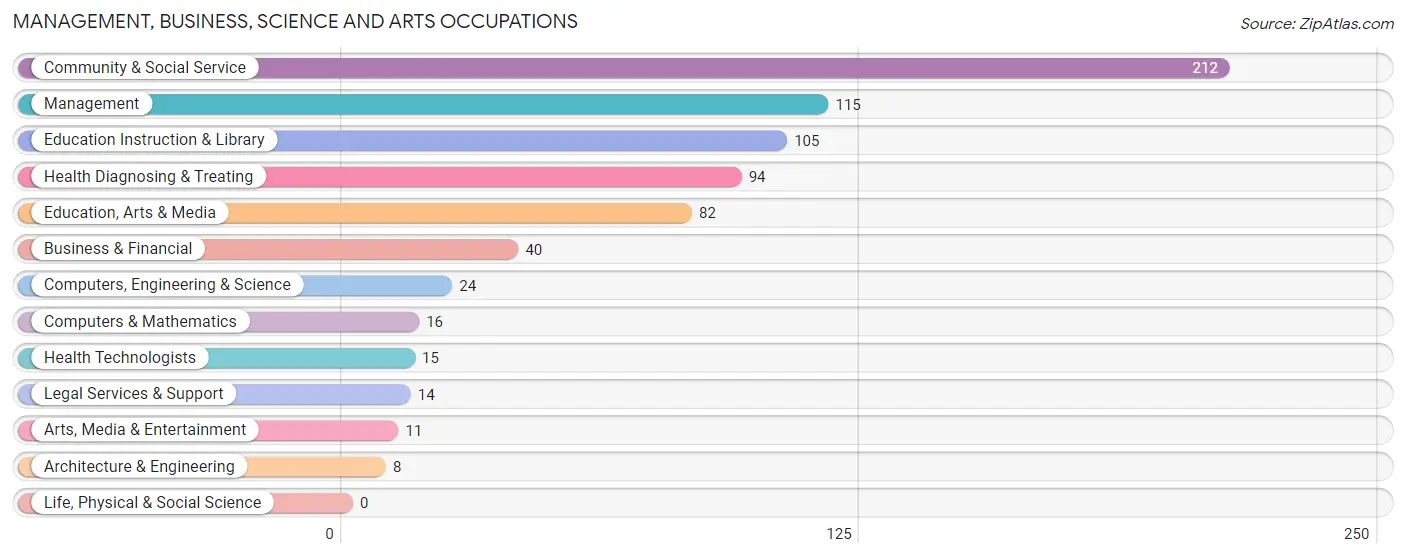
Management, Business, Science and Arts Occupations
The most common Management, Business, Science and Arts occupations in De Queen are Community & Social Service (212 | 7.7%), Management (115 | 4.2%), Education Instruction & Library (105 | 3.8%), Health Diagnosing & Treating (94 | 3.4%), and Education, Arts & Media (82 | 3.0%).
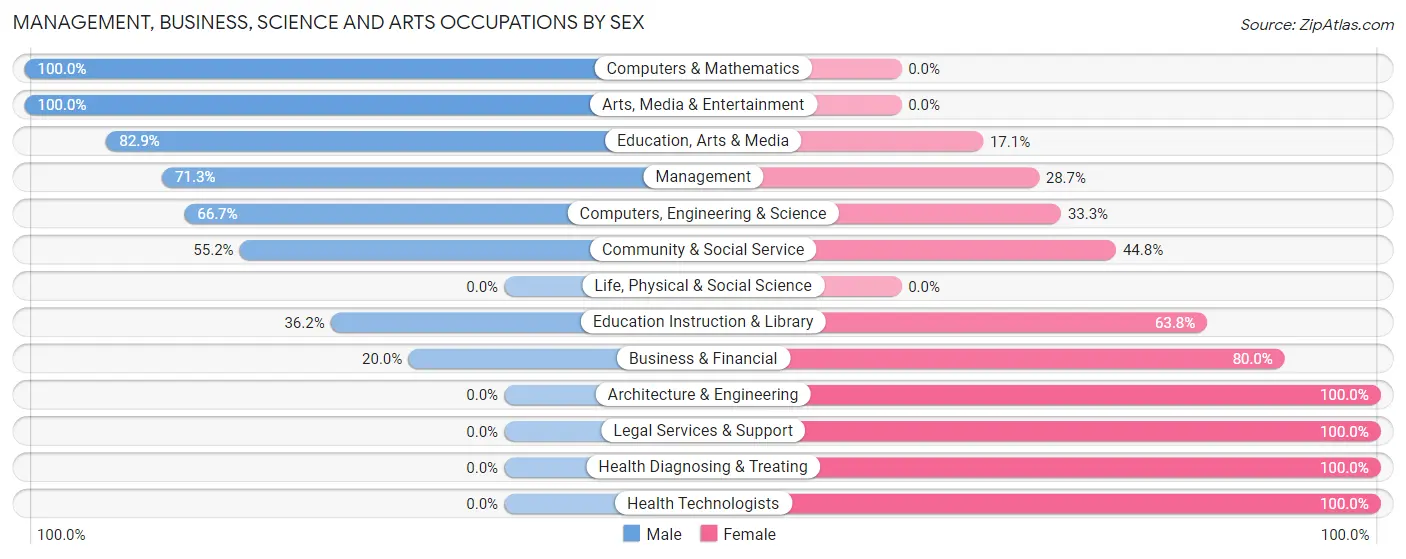
Management, Business, Science and Arts Occupations by Sex
Within the Management, Business, Science and Arts occupations in De Queen, the most male-oriented occupations are Computers & Mathematics (100.0%), Arts, Media & Entertainment (100.0%), and Education, Arts & Media (82.9%), while the most female-oriented occupations are Architecture & Engineering (100.0%), Legal Services & Support (100.0%), and Health Diagnosing & Treating (100.0%).
| Occupation | Male | Female |
| Management | 82 (71.3%) | 33 (28.7%) |
| Business & Financial | 8 (20.0%) | 32 (80.0%) |
| Computers, Engineering & Science | 16 (66.7%) | 8 (33.3%) |
| Computers & Mathematics | 16 (100.0%) | 0 (0.0%) |
| Architecture & Engineering | 0 (0.0%) | 8 (100.0%) |
| Life, Physical & Social Science | 0 (0.0%) | 0 (0.0%) |
| Community & Social Service | 117 (55.2%) | 95 (44.8%) |
| Education, Arts & Media | 68 (82.9%) | 14 (17.1%) |
| Legal Services & Support | 0 (0.0%) | 14 (100.0%) |
| Education Instruction & Library | 38 (36.2%) | 67 (63.8%) |
| Arts, Media & Entertainment | 11 (100.0%) | 0 (0.0%) |
| Health Diagnosing & Treating | 0 (0.0%) | 94 (100.0%) |
| Health Technologists | 0 (0.0%) | 15 (100.0%) |
| Total (Category) | 223 (46.0%) | 262 (54.0%) |
| Total (Overall) | 1,561 (56.6%) | 1,198 (43.4%) |
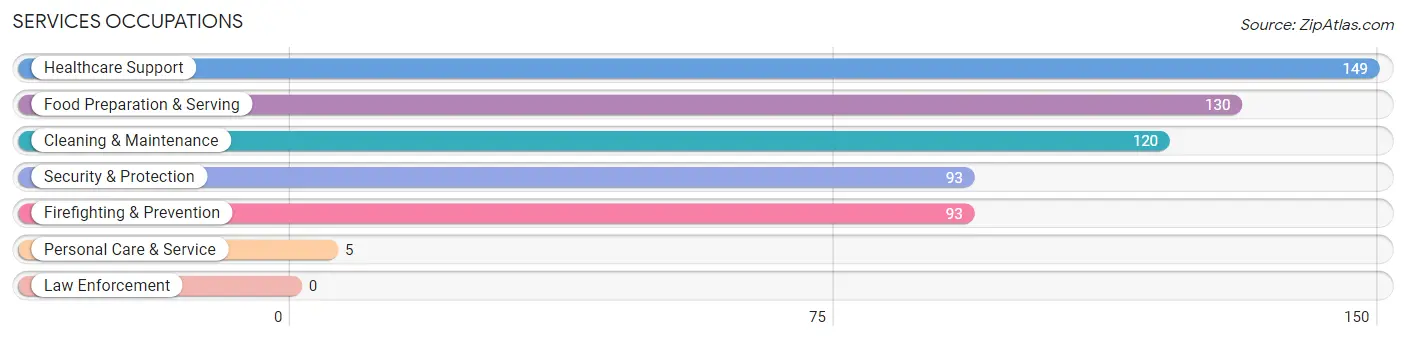
Services Occupations
The most common Services occupations in De Queen are Healthcare Support (149 | 5.4%), Food Preparation & Serving (130 | 4.7%), Cleaning & Maintenance (120 | 4.3%), Security & Protection (93 | 3.4%), and Firefighting & Prevention (93 | 3.4%).
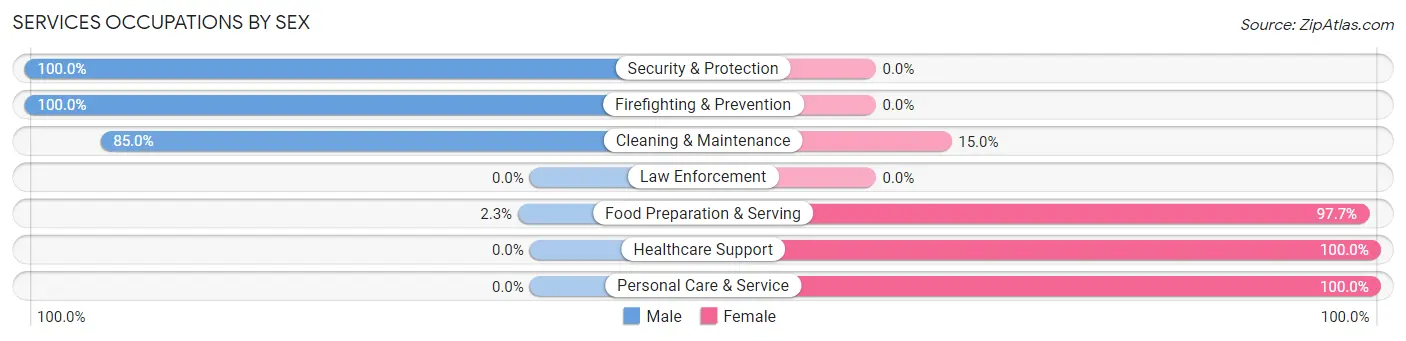
Services Occupations by Sex
Within the Services occupations in De Queen, the most male-oriented occupations are Security & Protection (100.0%), Firefighting & Prevention (100.0%), and Cleaning & Maintenance (85.0%), while the most female-oriented occupations are Healthcare Support (100.0%), Personal Care & Service (100.0%), and Food Preparation & Serving (97.7%).
| Occupation | Male | Female |
| Healthcare Support | 0 (0.0%) | 149 (100.0%) |
| Security & Protection | 93 (100.0%) | 0 (0.0%) |
| Firefighting & Prevention | 93 (100.0%) | 0 (0.0%) |
| Law Enforcement | 0 (0.0%) | 0 (0.0%) |
| Food Preparation & Serving | 3 (2.3%) | 127 (97.7%) |
| Cleaning & Maintenance | 102 (85.0%) | 18 (15.0%) |
| Personal Care & Service | 0 (0.0%) | 5 (100.0%) |
| Total (Category) | 198 (39.8%) | 299 (60.2%) |
| Total (Overall) | 1,561 (56.6%) | 1,198 (43.4%) |
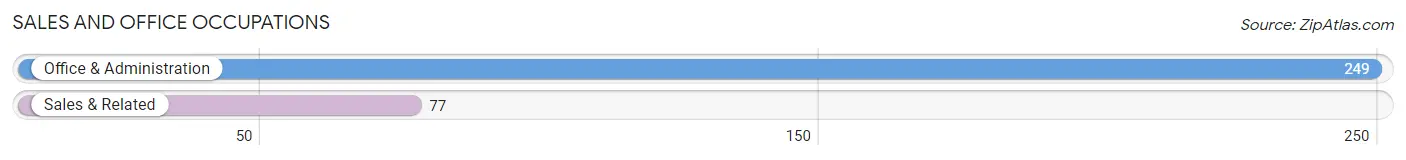
Sales and Office Occupations
The most common Sales and Office occupations in De Queen are Office & Administration (249 | 9.0%), and Sales & Related (77 | 2.8%).
Sales and Office Occupations by Sex
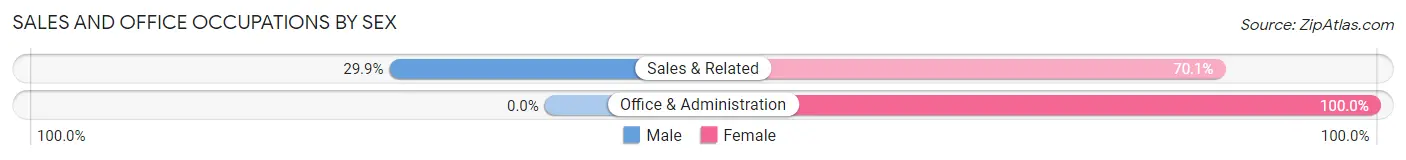
| Occupation | Male | Female |
| Sales & Related | 23 (29.9%) | 54 (70.1%) |
| Office & Administration | 0 (0.0%) | 249 (100.0%) |
| Total (Category) | 23 (7.1%) | 303 (92.9%) |
| Total (Overall) | 1,561 (56.6%) | 1,198 (43.4%) |
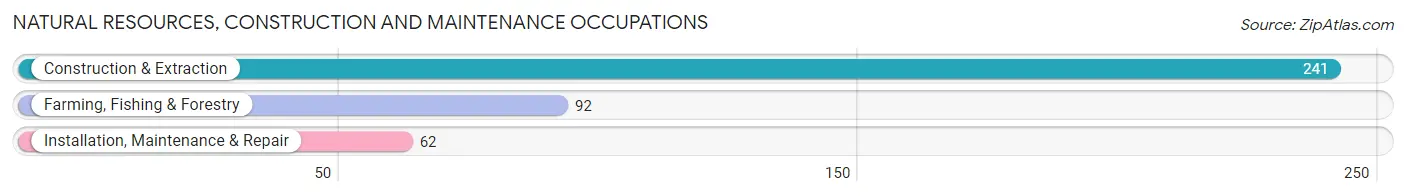
Natural Resources, Construction and Maintenance Occupations
The most common Natural Resources, Construction and Maintenance occupations in De Queen are Construction & Extraction (241 | 8.7%), Farming, Fishing & Forestry (92 | 3.3%), and Installation, Maintenance & Repair (62 | 2.2%).
Natural Resources, Construction and Maintenance Occupations by Sex
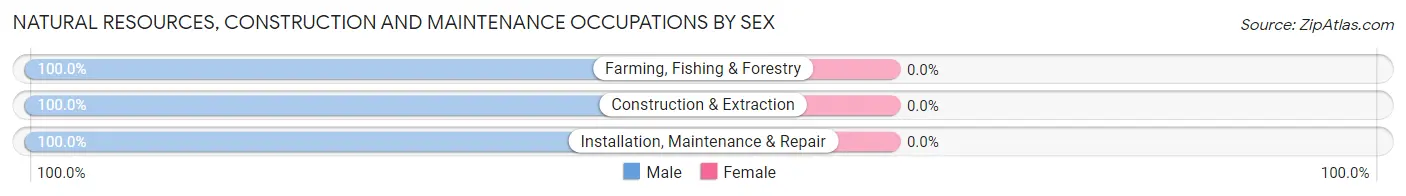
| Occupation | Male | Female |
| Farming, Fishing & Forestry | 92 (100.0%) | 0 (0.0%) |
| Construction & Extraction | 241 (100.0%) | 0 (0.0%) |
| Installation, Maintenance & Repair | 62 (100.0%) | 0 (0.0%) |
| Total (Category) | 395 (100.0%) | 0 (0.0%) |
| Total (Overall) | 1,561 (56.6%) | 1,198 (43.4%) |
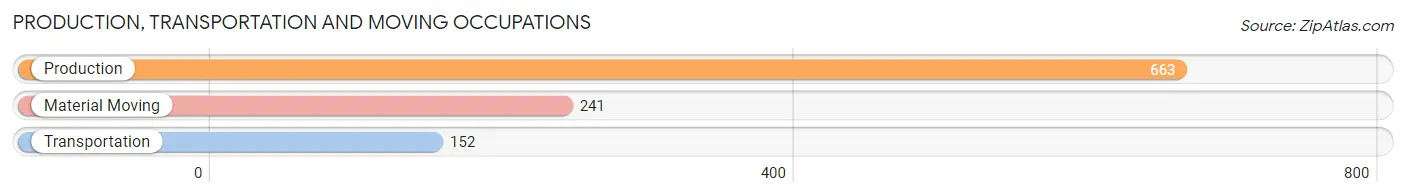
Production, Transportation and Moving Occupations
The most common Production, Transportation and Moving occupations in De Queen are Production (663 | 24.0%), Material Moving (241 | 8.7%), and Transportation (152 | 5.5%).
Production, Transportation and Moving Occupations by Sex
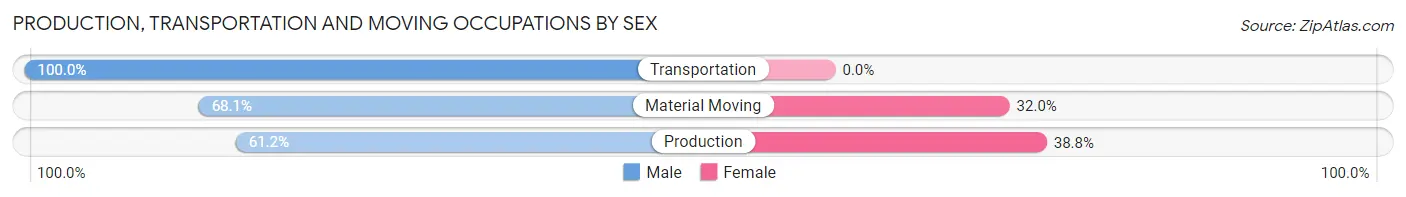
| Occupation | Male | Female |
| Production | 406 (61.2%) | 257 (38.8%) |
| Transportation | 152 (100.0%) | 0 (0.0%) |
| Material Moving | 164 (68.0%) | 77 (32.0%) |
| Total (Category) | 722 (68.4%) | 334 (31.6%) |
| Total (Overall) | 1,561 (56.6%) | 1,198 (43.4%) |
Employment Industries by Sex in De Queen
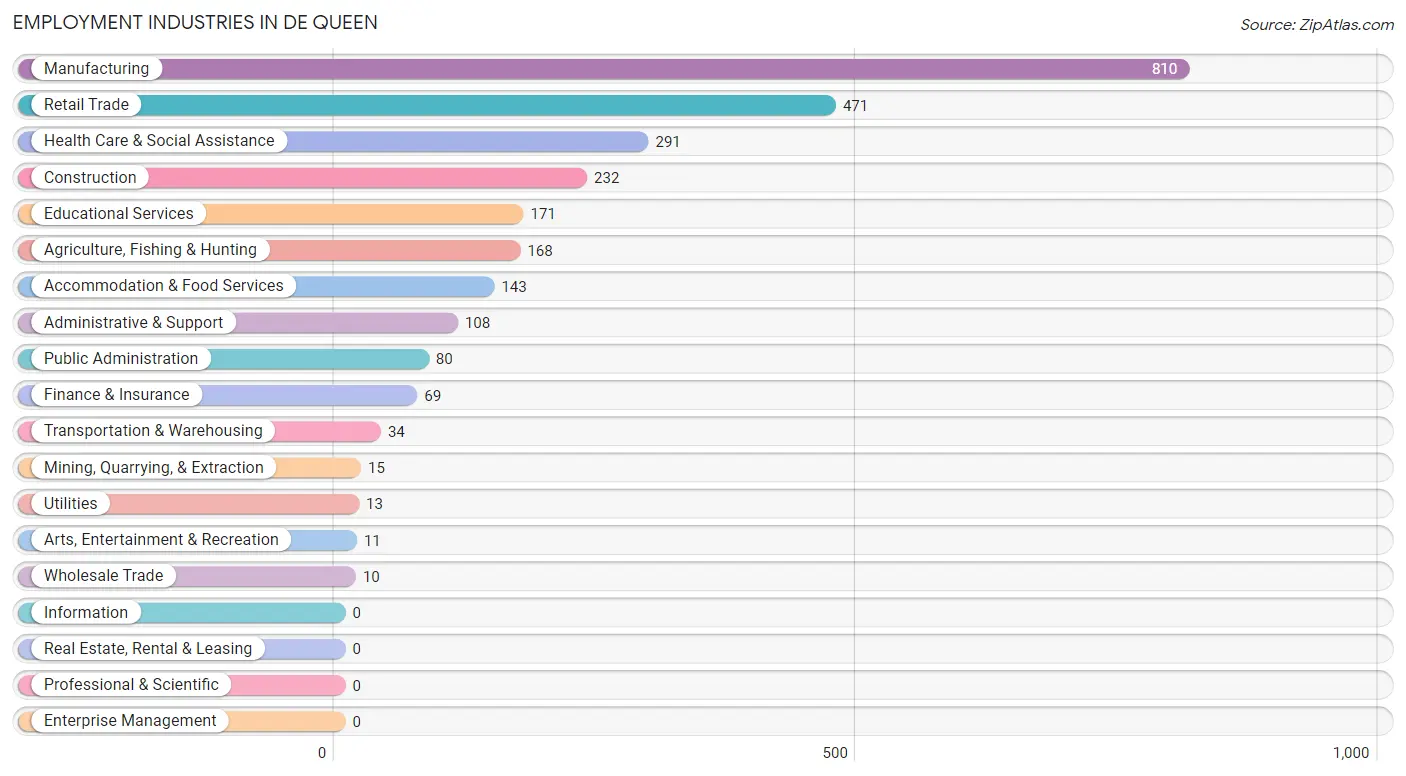
Employment Industries in De Queen
The major employment industries in De Queen include Manufacturing (810 | 29.4%), Retail Trade (471 | 17.1%), Health Care & Social Assistance (291 | 10.5%), Construction (232 | 8.4%), and Educational Services (171 | 6.2%).
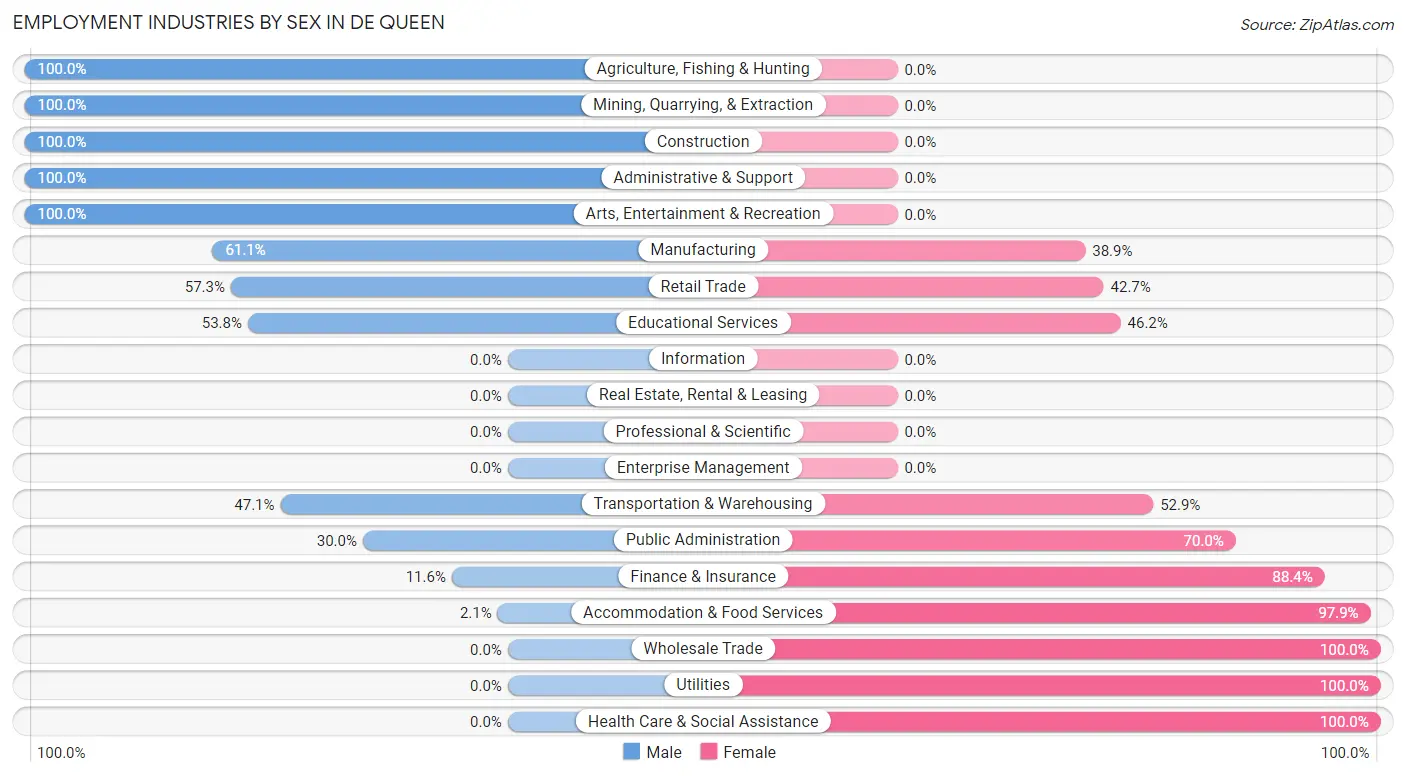
Employment Industries by Sex in De Queen
The De Queen industries that see more men than women are Agriculture, Fishing & Hunting (100.0%), Mining, Quarrying, & Extraction (100.0%), and Construction (100.0%), whereas the industries that tend to have a higher number of women are Wholesale Trade (100.0%), Utilities (100.0%), and Health Care & Social Assistance (100.0%).
| Industry | Male | Female |
| Agriculture, Fishing & Hunting | 168 (100.0%) | 0 (0.0%) |
| Mining, Quarrying, & Extraction | 15 (100.0%) | 0 (0.0%) |
| Construction | 232 (100.0%) | 0 (0.0%) |
| Manufacturing | 495 (61.1%) | 315 (38.9%) |
| Wholesale Trade | 0 (0.0%) | 10 (100.0%) |
| Retail Trade | 270 (57.3%) | 201 (42.7%) |
| Transportation & Warehousing | 16 (47.1%) | 18 (52.9%) |
| Utilities | 0 (0.0%) | 13 (100.0%) |
| Information | 0 (0.0%) | 0 (0.0%) |
| Finance & Insurance | 8 (11.6%) | 61 (88.4%) |
| Real Estate, Rental & Leasing | 0 (0.0%) | 0 (0.0%) |
| Professional & Scientific | 0 (0.0%) | 0 (0.0%) |
| Enterprise Management | 0 (0.0%) | 0 (0.0%) |
| Administrative & Support | 108 (100.0%) | 0 (0.0%) |
| Educational Services | 92 (53.8%) | 79 (46.2%) |
| Health Care & Social Assistance | 0 (0.0%) | 291 (100.0%) |
| Arts, Entertainment & Recreation | 11 (100.0%) | 0 (0.0%) |
| Accommodation & Food Services | 3 (2.1%) | 140 (97.9%) |
| Public Administration | 24 (30.0%) | 56 (70.0%) |
| Total | 1,561 (56.6%) | 1,198 (43.4%) |
Education in De Queen
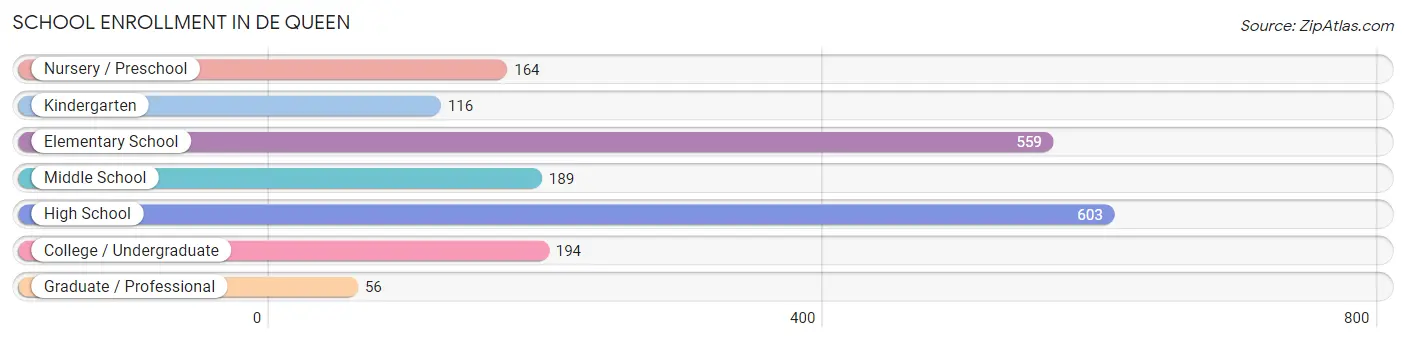
School Enrollment in De Queen
The most common levels of schooling among the 1,881 students in De Queen are high school (603 | 32.1%), elementary school (559 | 29.7%), and college / undergraduate (194 | 10.3%).
| School Level | # Students | % Students |
| Nursery / Preschool | 164 | 8.7% |
| Kindergarten | 116 | 6.2% |
| Elementary School | 559 | 29.7% |
| Middle School | 189 | 10.1% |
| High School | 603 | 32.1% |
| College / Undergraduate | 194 | 10.3% |
| Graduate / Professional | 56 | 3.0% |
| Total | 1,881 | 100.0% |
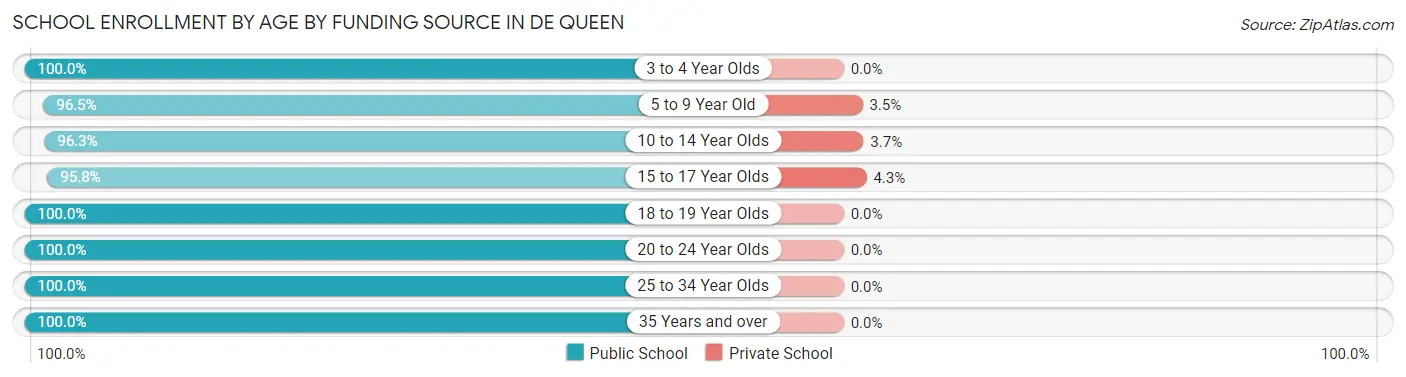
School Enrollment by Age by Funding Source in De Queen
Out of a total of 1,881 students who are enrolled in schools in De Queen, 53 (2.8%) attend a private institution, while the remaining 1,828 (97.2%) are enrolled in public schools. The age group of 15 to 17 year olds has the highest likelihood of being enrolled in private schools, with 15 (4.3% in the age bracket) enrolled. Conversely, the age group of 3 to 4 year olds has the lowest likelihood of being enrolled in a private school, with 91 (100.0% in the age bracket) attending a public institution.
| Age Bracket | Public School | Private School |
| 3 to 4 Year Olds | 91 (100.0%) | 0 (0.0%) |
| 5 to 9 Year Old | 496 (96.5%) | 18 (3.5%) |
| 10 to 14 Year Olds | 498 (96.3%) | 19 (3.7%) |
| 15 to 17 Year Olds | 338 (95.8%) | 15 (4.3%) |
| 18 to 19 Year Olds | 176 (100.0%) | 0 (0.0%) |
| 20 to 24 Year Olds | 168 (100.0%) | 0 (0.0%) |
| 25 to 34 Year Olds | 12 (100.0%) | 0 (0.0%) |
| 35 Years and over | 50 (100.0%) | 0 (0.0%) |
| Total | 1,828 (97.2%) | 53 (2.8%) |
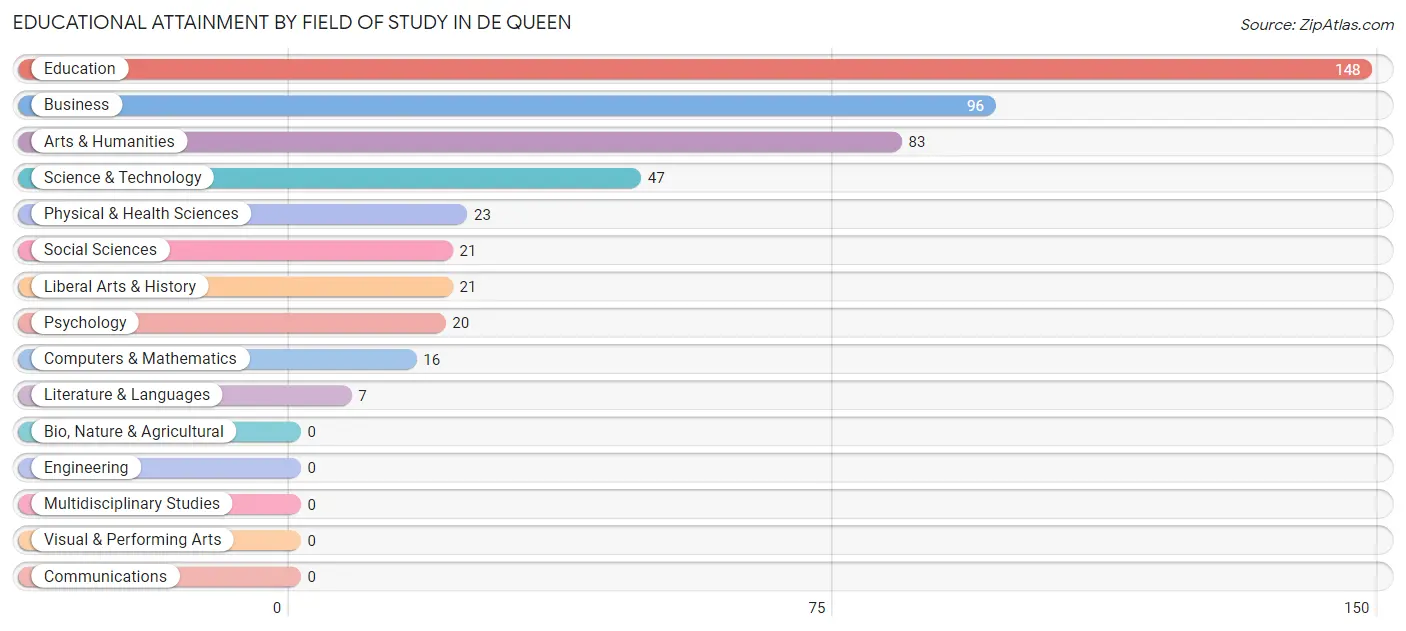
Educational Attainment by Field of Study in De Queen
Education (148 | 30.7%), business (96 | 19.9%), arts & humanities (83 | 17.2%), science & technology (47 | 9.8%), and physical & health sciences (23 | 4.8%) are the most common fields of study among 482 individuals in De Queen who have obtained a bachelor's degree or higher.
| Field of Study | # Graduates | % Graduates |
| Computers & Mathematics | 16 | 3.3% |
| Bio, Nature & Agricultural | 0 | 0.0% |
| Physical & Health Sciences | 23 | 4.8% |
| Psychology | 20 | 4.2% |
| Social Sciences | 21 | 4.4% |
| Engineering | 0 | 0.0% |
| Multidisciplinary Studies | 0 | 0.0% |
| Science & Technology | 47 | 9.8% |
| Business | 96 | 19.9% |
| Education | 148 | 30.7% |
| Literature & Languages | 7 | 1.5% |
| Liberal Arts & History | 21 | 4.4% |
| Visual & Performing Arts | 0 | 0.0% |
| Communications | 0 | 0.0% |
| Arts & Humanities | 83 | 17.2% |
| Total | 482 | 100.0% |
Transportation & Commute in De Queen
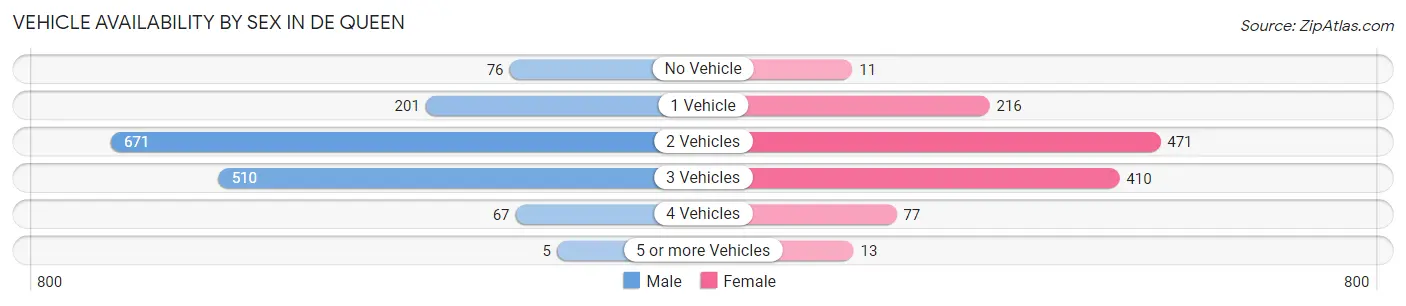
Vehicle Availability by Sex in De Queen
The most prevalent vehicle ownership categories in De Queen are males with 2 vehicles (671, accounting for 43.9%) and females with 2 vehicles (471, making up 56.0%).
| Vehicles Available | Male | Female |
| No Vehicle | 76 (5.0%) | 11 (0.9%) |
| 1 Vehicle | 201 (13.1%) | 216 (18.0%) |
| 2 Vehicles | 671 (43.9%) | 471 (39.3%) |
| 3 Vehicles | 510 (33.3%) | 410 (34.2%) |
| 4 Vehicles | 67 (4.4%) | 77 (6.4%) |
| 5 or more Vehicles | 5 (0.3%) | 13 (1.1%) |
| Total | 1,530 (100.0%) | 1,198 (100.0%) |
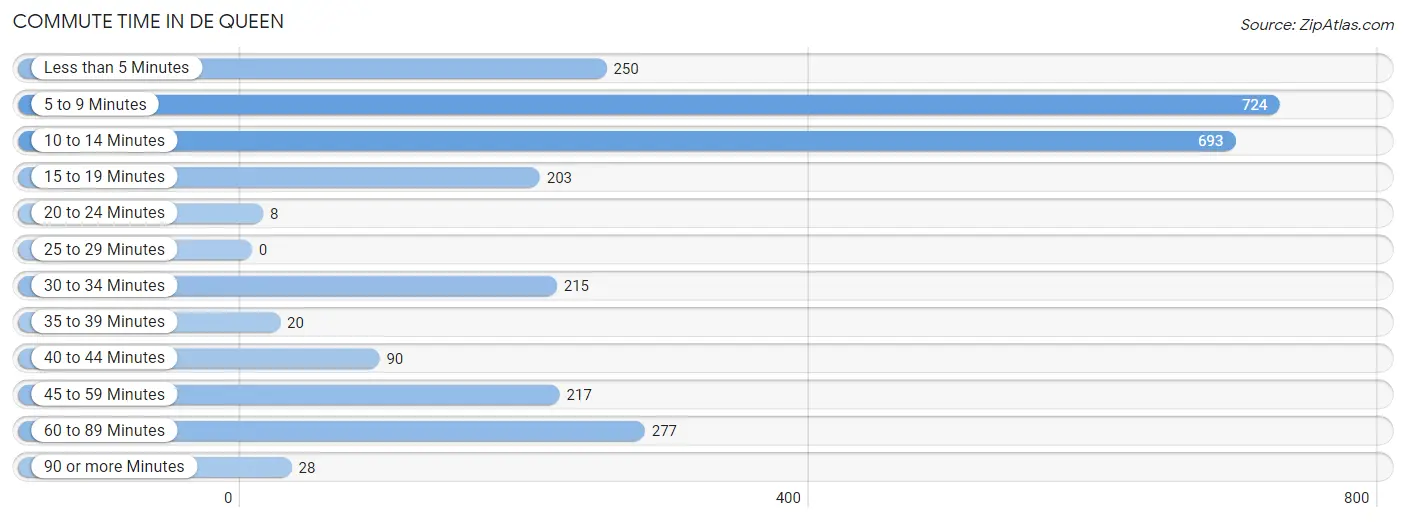
Commute Time in De Queen
The most frequently occuring commute durations in De Queen are 5 to 9 minutes (724 commuters, 26.6%), 10 to 14 minutes (693 commuters, 25.4%), and 60 to 89 minutes (277 commuters, 10.2%).
| Commute Time | # Commuters | % Commuters |
| Less than 5 Minutes | 250 | 9.2% |
| 5 to 9 Minutes | 724 | 26.6% |
| 10 to 14 Minutes | 693 | 25.4% |
| 15 to 19 Minutes | 203 | 7.4% |
| 20 to 24 Minutes | 8 | 0.3% |
| 25 to 29 Minutes | 0 | 0.0% |
| 30 to 34 Minutes | 215 | 7.9% |
| 35 to 39 Minutes | 20 | 0.7% |
| 40 to 44 Minutes | 90 | 3.3% |
| 45 to 59 Minutes | 217 | 8.0% |
| 60 to 89 Minutes | 277 | 10.2% |
| 90 or more Minutes | 28 | 1.0% |
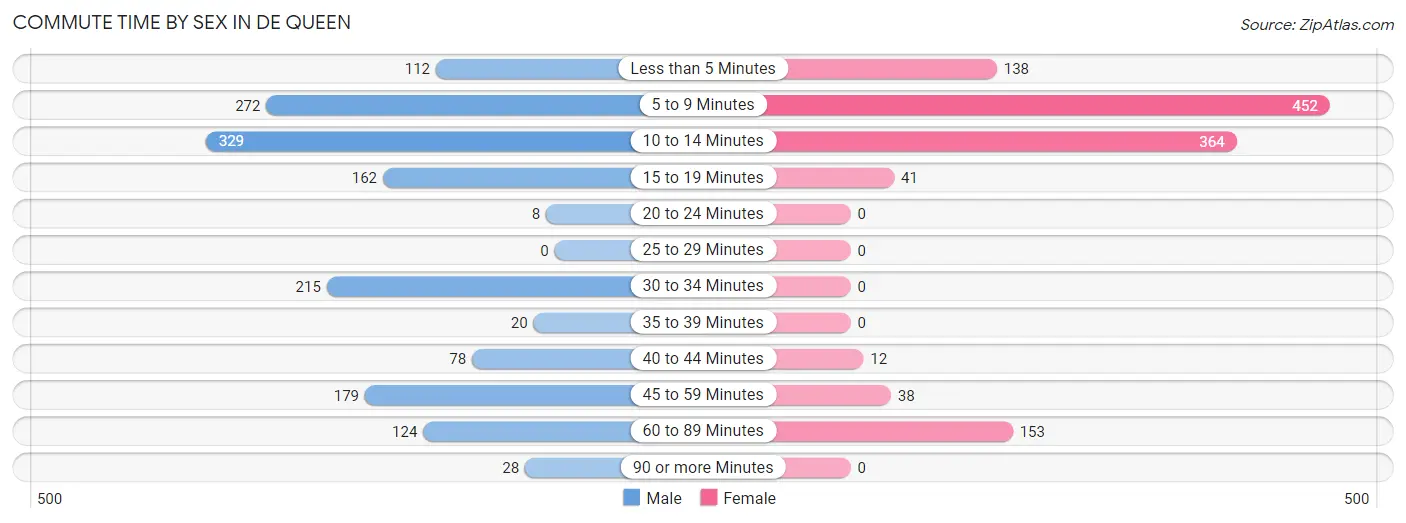
Commute Time by Sex in De Queen
The most common commute times in De Queen are 10 to 14 minutes (329 commuters, 21.5%) for males and 5 to 9 minutes (452 commuters, 37.7%) for females.
| Commute Time | Male | Female |
| Less than 5 Minutes | 112 (7.3%) | 138 (11.5%) |
| 5 to 9 Minutes | 272 (17.8%) | 452 (37.7%) |
| 10 to 14 Minutes | 329 (21.5%) | 364 (30.4%) |
| 15 to 19 Minutes | 162 (10.6%) | 41 (3.4%) |
| 20 to 24 Minutes | 8 (0.5%) | 0 (0.0%) |
| 25 to 29 Minutes | 0 (0.0%) | 0 (0.0%) |
| 30 to 34 Minutes | 215 (14.1%) | 0 (0.0%) |
| 35 to 39 Minutes | 20 (1.3%) | 0 (0.0%) |
| 40 to 44 Minutes | 78 (5.1%) | 12 (1.0%) |
| 45 to 59 Minutes | 179 (11.7%) | 38 (3.2%) |
| 60 to 89 Minutes | 124 (8.1%) | 153 (12.8%) |
| 90 or more Minutes | 28 (1.8%) | 0 (0.0%) |
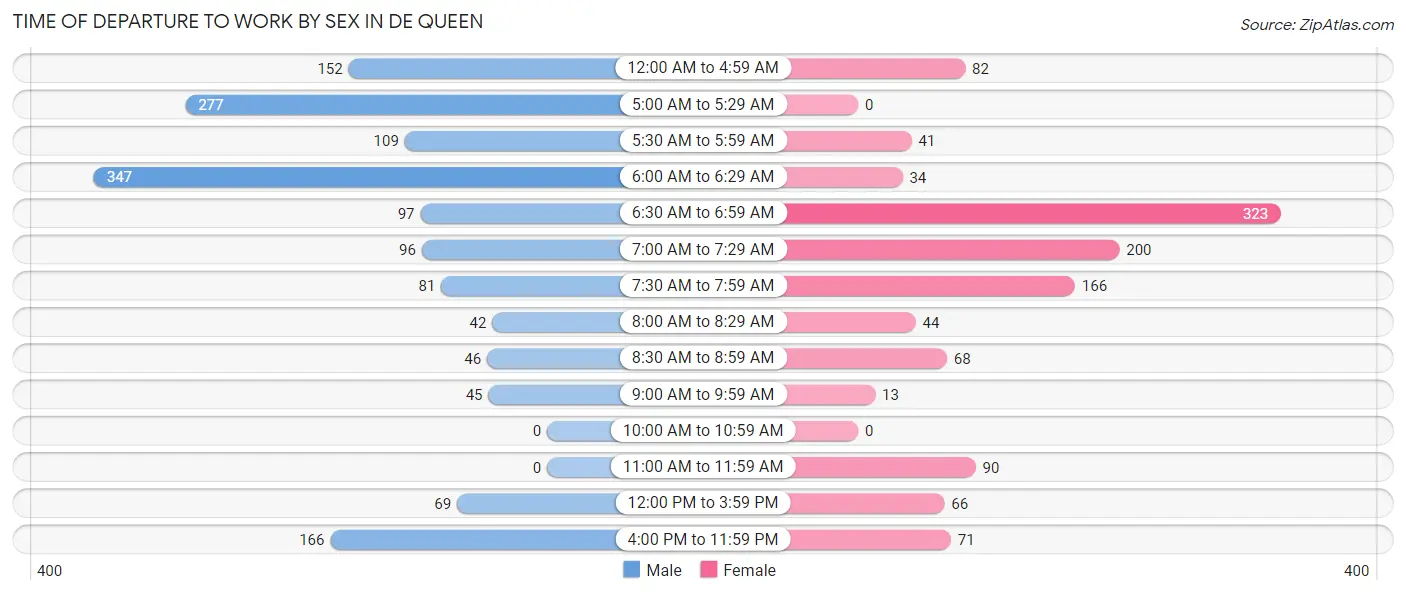
Time of Departure to Work by Sex in De Queen
The most frequent times of departure to work in De Queen are 6:00 AM to 6:29 AM (347, 22.7%) for males and 6:30 AM to 6:59 AM (323, 27.0%) for females.
| Time of Departure | Male | Female |
| 12:00 AM to 4:59 AM | 152 (10.0%) | 82 (6.8%) |
| 5:00 AM to 5:29 AM | 277 (18.1%) | 0 (0.0%) |
| 5:30 AM to 5:59 AM | 109 (7.1%) | 41 (3.4%) |
| 6:00 AM to 6:29 AM | 347 (22.7%) | 34 (2.8%) |
| 6:30 AM to 6:59 AM | 97 (6.4%) | 323 (27.0%) |
| 7:00 AM to 7:29 AM | 96 (6.3%) | 200 (16.7%) |
| 7:30 AM to 7:59 AM | 81 (5.3%) | 166 (13.9%) |
| 8:00 AM to 8:29 AM | 42 (2.8%) | 44 (3.7%) |
| 8:30 AM to 8:59 AM | 46 (3.0%) | 68 (5.7%) |
| 9:00 AM to 9:59 AM | 45 (2.9%) | 13 (1.1%) |
| 10:00 AM to 10:59 AM | 0 (0.0%) | 0 (0.0%) |
| 11:00 AM to 11:59 AM | 0 (0.0%) | 90 (7.5%) |
| 12:00 PM to 3:59 PM | 69 (4.5%) | 66 (5.5%) |
| 4:00 PM to 11:59 PM | 166 (10.9%) | 71 (5.9%) |
| Total | 1,527 (100.0%) | 1,198 (100.0%) |
Housing Occupancy in De Queen
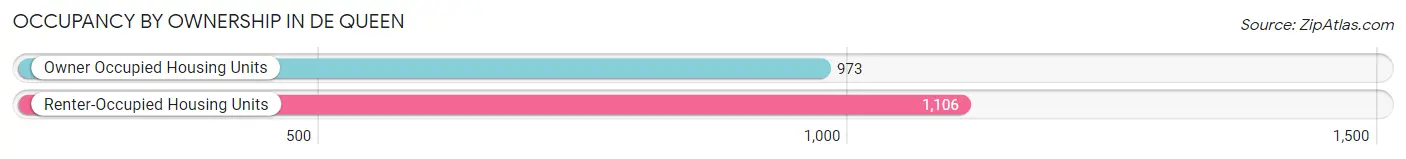
Occupancy by Ownership in De Queen
Of the total 2,079 dwellings in De Queen, owner-occupied units account for 973 (46.8%), while renter-occupied units make up 1,106 (53.2%).
| Occupancy | # Housing Units | % Housing Units |
| Owner Occupied Housing Units | 973 | 46.8% |
| Renter-Occupied Housing Units | 1,106 | 53.2% |
| Total Occupied Housing Units | 2,079 | 100.0% |
Occupancy by Household Size in De Queen
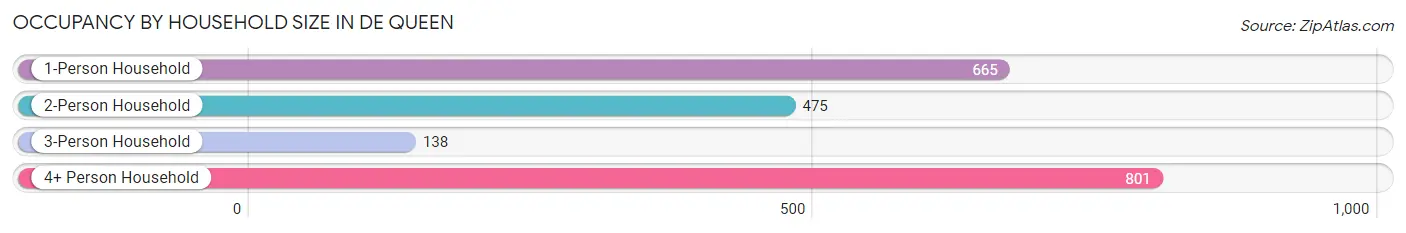
| Household Size | # Housing Units | % Housing Units |
| 1-Person Household | 665 | 32.0% |
| 2-Person Household | 475 | 22.9% |
| 3-Person Household | 138 | 6.6% |
| 4+ Person Household | 801 | 38.5% |
| Total Housing Units | 2,079 | 100.0% |
Occupancy by Ownership by Household Size in De Queen
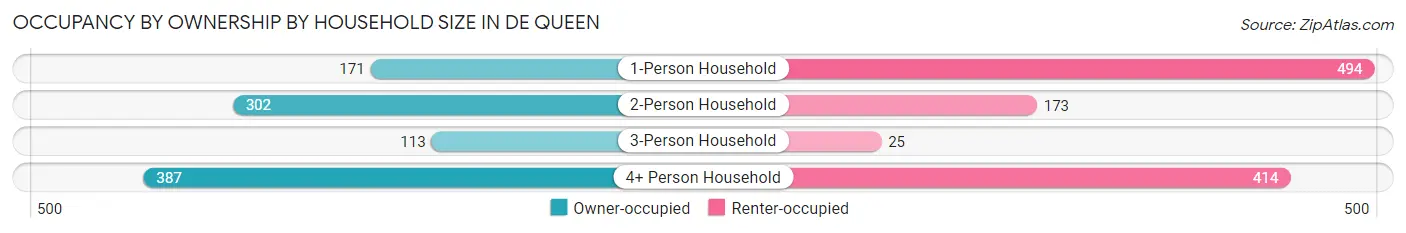
| Household Size | Owner-occupied | Renter-occupied |
| 1-Person Household | 171 (25.7%) | 494 (74.3%) |
| 2-Person Household | 302 (63.6%) | 173 (36.4%) |
| 3-Person Household | 113 (81.9%) | 25 (18.1%) |
| 4+ Person Household | 387 (48.3%) | 414 (51.7%) |
| Total Housing Units | 973 (46.8%) | 1,106 (53.2%) |
Occupancy by Educational Attainment in De Queen
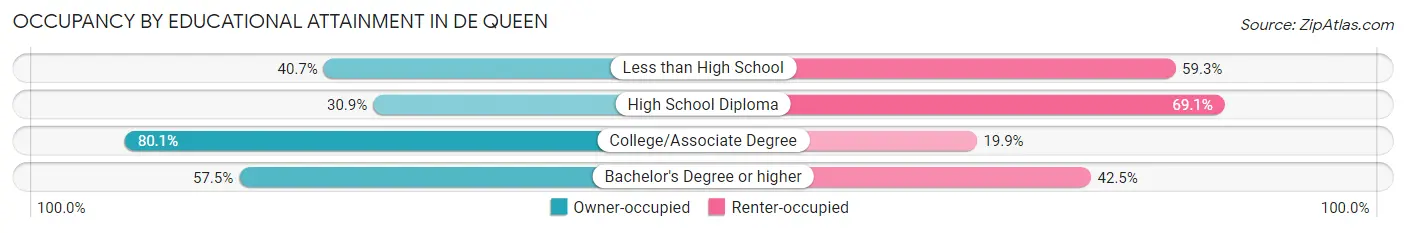
| Household Size | Owner-occupied | Renter-occupied |
| Less than High School | 338 (40.7%) | 492 (59.3%) |
| High School Diploma | 188 (30.9%) | 420 (69.1%) |
| College/Associate Degree | 278 (80.1%) | 69 (19.9%) |
| Bachelor's Degree or higher | 169 (57.5%) | 125 (42.5%) |
Occupancy by Age of Householder in De Queen
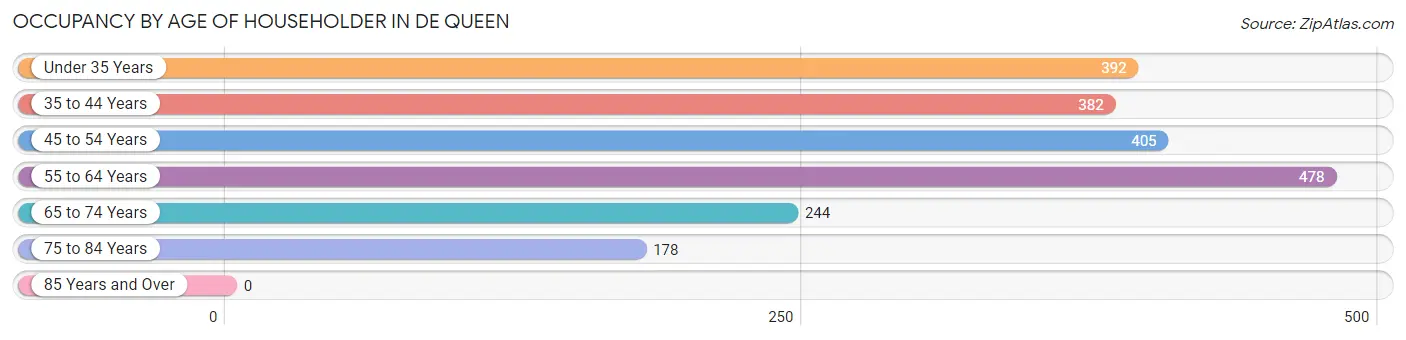
| Age Bracket | # Households | % Households |
| Under 35 Years | 392 | 18.9% |
| 35 to 44 Years | 382 | 18.4% |
| 45 to 54 Years | 405 | 19.5% |
| 55 to 64 Years | 478 | 23.0% |
| 65 to 74 Years | 244 | 11.7% |
| 75 to 84 Years | 178 | 8.6% |
| 85 Years and Over | 0 | 0.0% |
| Total | 2,079 | 100.0% |
Housing Finances in De Queen
Median Income by Occupancy in De Queen
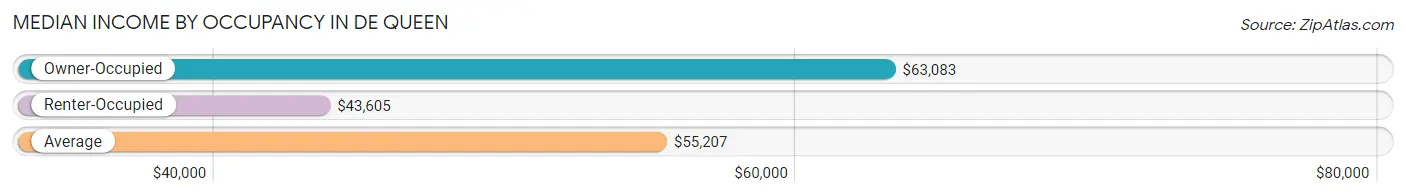
| Occupancy Type | # Households | Median Income |
| Owner-Occupied | 973 (46.8%) | $63,083 |
| Renter-Occupied | 1,106 (53.2%) | $43,605 |
| Average | 2,079 (100.0%) | $55,207 |
Occupancy by Householder Income Bracket in De Queen
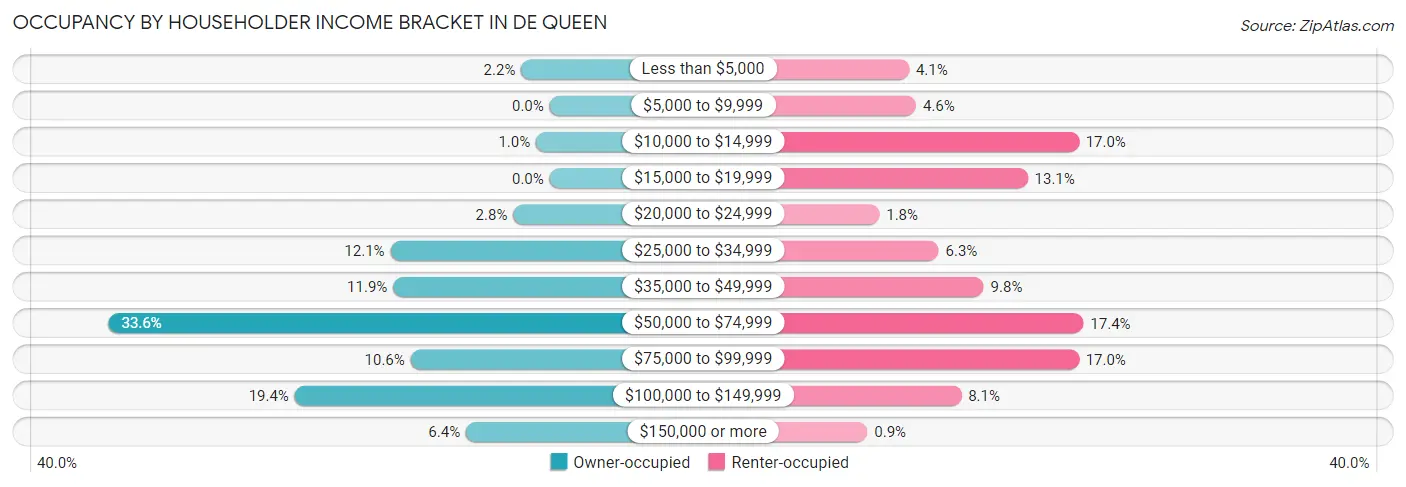
| Income Bracket | Owner-occupied | Renter-occupied |
| Less than $5,000 | 21 (2.2%) | 45 (4.1%) |
| $5,000 to $9,999 | 0 (0.0%) | 51 (4.6%) |
| $10,000 to $14,999 | 10 (1.0%) | 188 (17.0%) |
| $15,000 to $19,999 | 0 (0.0%) | 145 (13.1%) |
| $20,000 to $24,999 | 27 (2.8%) | 20 (1.8%) |
| $25,000 to $34,999 | 118 (12.1%) | 70 (6.3%) |
| $35,000 to $49,999 | 116 (11.9%) | 108 (9.8%) |
| $50,000 to $74,999 | 327 (33.6%) | 192 (17.4%) |
| $75,000 to $99,999 | 103 (10.6%) | 188 (17.0%) |
| $100,000 to $149,999 | 189 (19.4%) | 89 (8.1%) |
| $150,000 or more | 62 (6.4%) | 10 (0.9%) |
| Total | 973 (100.0%) | 1,106 (100.0%) |
Monthly Housing Cost Tiers in De Queen
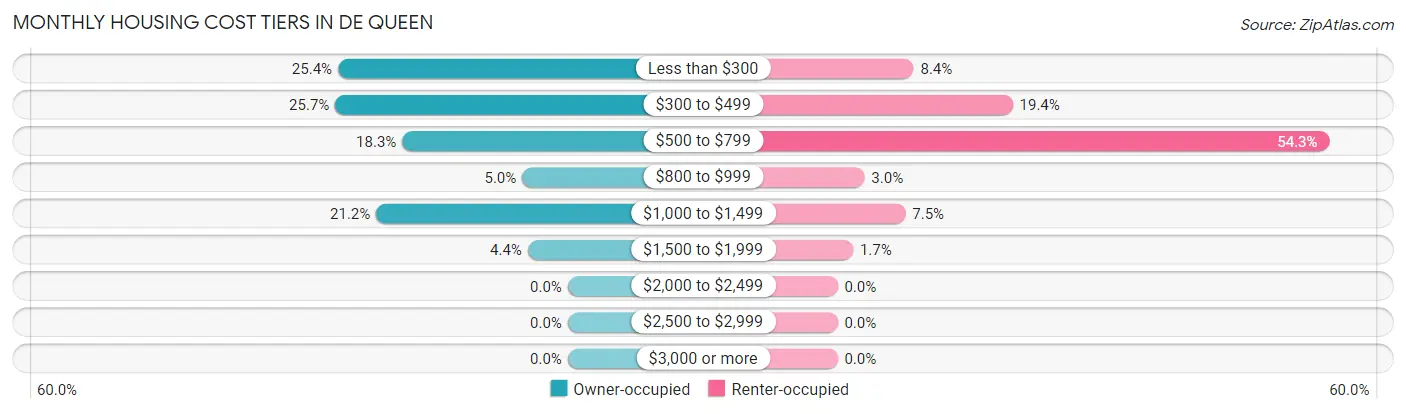
| Monthly Cost | Owner-occupied | Renter-occupied |
| Less than $300 | 247 (25.4%) | 93 (8.4%) |
| $300 to $499 | 250 (25.7%) | 214 (19.4%) |
| $500 to $799 | 178 (18.3%) | 601 (54.3%) |
| $800 to $999 | 49 (5.0%) | 33 (3.0%) |
| $1,000 to $1,499 | 206 (21.2%) | 83 (7.5%) |
| $1,500 to $1,999 | 43 (4.4%) | 19 (1.7%) |
| $2,000 to $2,499 | 0 (0.0%) | 0 (0.0%) |
| $2,500 to $2,999 | 0 (0.0%) | 0 (0.0%) |
| $3,000 or more | 0 (0.0%) | 0 (0.0%) |
| Total | 973 (100.0%) | 1,106 (100.0%) |
Physical Housing Characteristics in De Queen
Housing Structures in De Queen
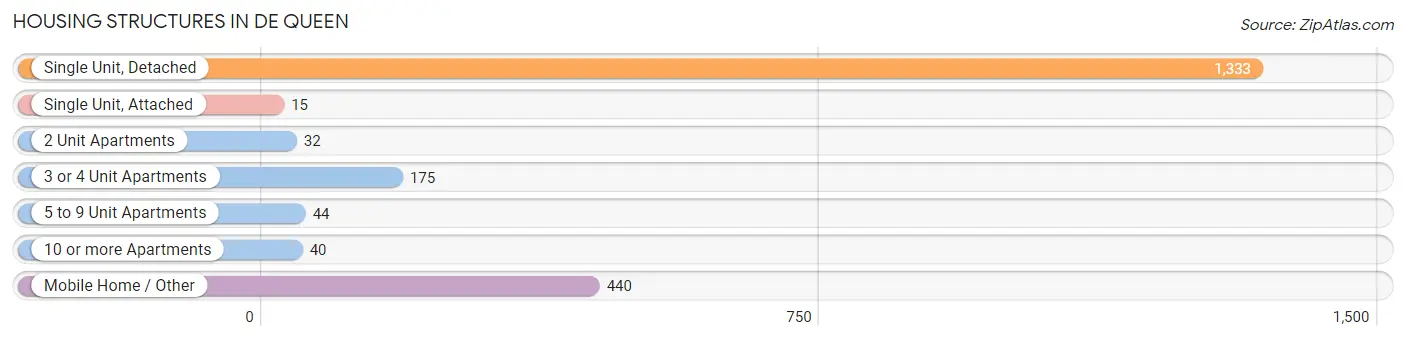
| Structure Type | # Housing Units | % Housing Units |
| Single Unit, Detached | 1,333 | 64.1% |
| Single Unit, Attached | 15 | 0.7% |
| 2 Unit Apartments | 32 | 1.5% |
| 3 or 4 Unit Apartments | 175 | 8.4% |
| 5 to 9 Unit Apartments | 44 | 2.1% |
| 10 or more Apartments | 40 | 1.9% |
| Mobile Home / Other | 440 | 21.2% |
| Total | 2,079 | 100.0% |
Housing Structures by Occupancy in De Queen
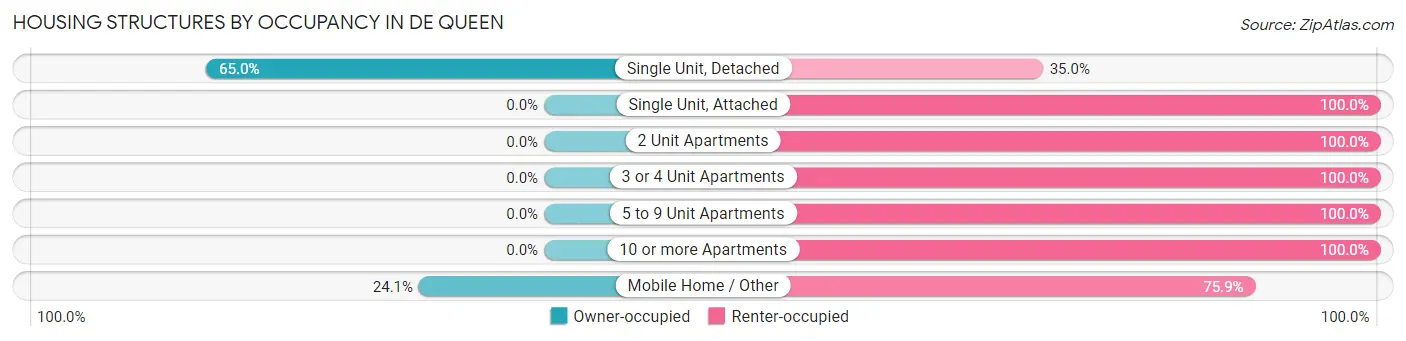
| Structure Type | Owner-occupied | Renter-occupied |
| Single Unit, Detached | 867 (65.0%) | 466 (35.0%) |
| Single Unit, Attached | 0 (0.0%) | 15 (100.0%) |
| 2 Unit Apartments | 0 (0.0%) | 32 (100.0%) |
| 3 or 4 Unit Apartments | 0 (0.0%) | 175 (100.0%) |
| 5 to 9 Unit Apartments | 0 (0.0%) | 44 (100.0%) |
| 10 or more Apartments | 0 (0.0%) | 40 (100.0%) |
| Mobile Home / Other | 106 (24.1%) | 334 (75.9%) |
| Total | 973 (46.8%) | 1,106 (53.2%) |
Housing Structures by Number of Rooms in De Queen
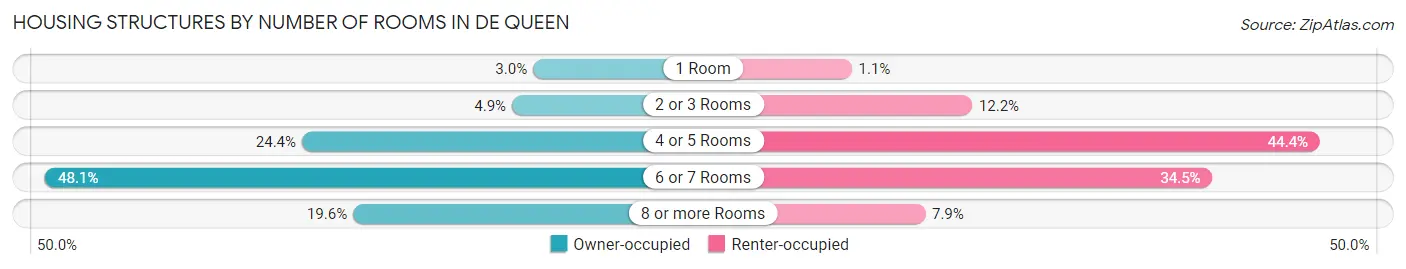
| Number of Rooms | Owner-occupied | Renter-occupied |
| 1 Room | 29 (3.0%) | 12 (1.1%) |
| 2 or 3 Rooms | 48 (4.9%) | 135 (12.2%) |
| 4 or 5 Rooms | 237 (24.4%) | 491 (44.4%) |
| 6 or 7 Rooms | 468 (48.1%) | 381 (34.4%) |
| 8 or more Rooms | 191 (19.6%) | 87 (7.9%) |
| Total | 973 (100.0%) | 1,106 (100.0%) |
Housing Structure by Heating Type in De Queen
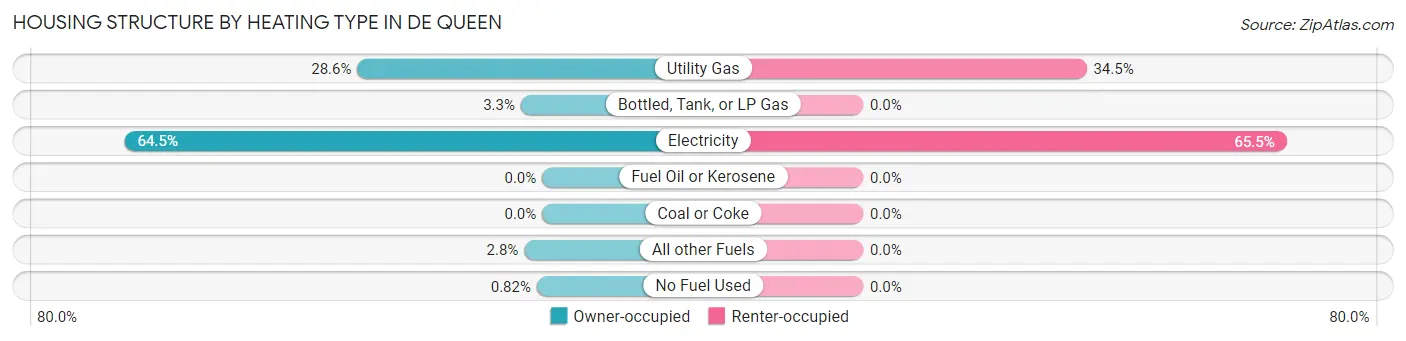
| Heating Type | Owner-occupied | Renter-occupied |
| Utility Gas | 278 (28.6%) | 382 (34.5%) |
| Bottled, Tank, or LP Gas | 32 (3.3%) | 0 (0.0%) |
| Electricity | 628 (64.5%) | 724 (65.5%) |
| Fuel Oil or Kerosene | 0 (0.0%) | 0 (0.0%) |
| Coal or Coke | 0 (0.0%) | 0 (0.0%) |
| All other Fuels | 27 (2.8%) | 0 (0.0%) |
| No Fuel Used | 8 (0.8%) | 0 (0.0%) |
| Total | 973 (100.0%) | 1,106 (100.0%) |
Household Vehicle Usage in De Queen
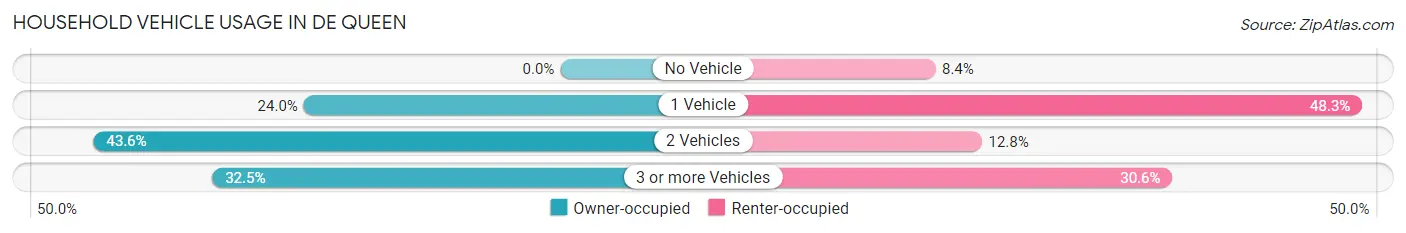
| Vehicles per Household | Owner-occupied | Renter-occupied |
| No Vehicle | 0 (0.0%) | 93 (8.4%) |
| 1 Vehicle | 233 (23.9%) | 534 (48.3%) |
| 2 Vehicles | 424 (43.6%) | 141 (12.8%) |
| 3 or more Vehicles | 316 (32.5%) | 338 (30.6%) |
| Total | 973 (100.0%) | 1,106 (100.0%) |
Real Estate & Mortgages in De Queen
Real Estate and Mortgage Overview in De Queen
| Characteristic | Without Mortgage | With Mortgage |
| Housing Units | 547 | 426 |
| Median Property Value | $69,300 | $152,200 |
| Median Household Income | $55,216 | $30 |
| Monthly Housing Costs | $316 | $0 |
| Real Estate Taxes | - | - |
Property Value by Mortgage Status in De Queen
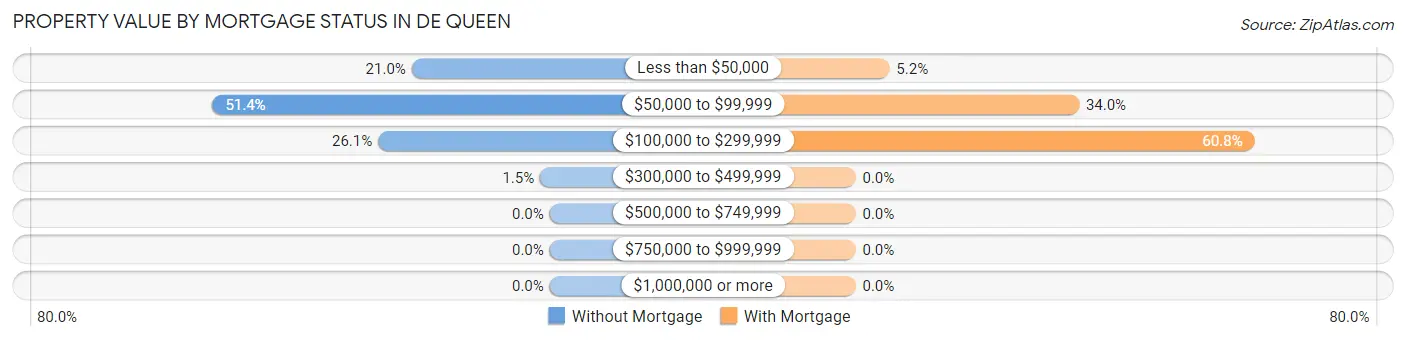
| Property Value | Without Mortgage | With Mortgage |
| Less than $50,000 | 115 (21.0%) | 22 (5.2%) |
| $50,000 to $99,999 | 281 (51.4%) | 145 (34.0%) |
| $100,000 to $299,999 | 143 (26.1%) | 259 (60.8%) |
| $300,000 to $499,999 | 8 (1.5%) | 0 (0.0%) |
| $500,000 to $749,999 | 0 (0.0%) | 0 (0.0%) |
| $750,000 to $999,999 | 0 (0.0%) | 0 (0.0%) |
| $1,000,000 or more | 0 (0.0%) | 0 (0.0%) |
| Total | 547 (100.0%) | 426 (100.0%) |
Household Income by Mortgage Status in De Queen
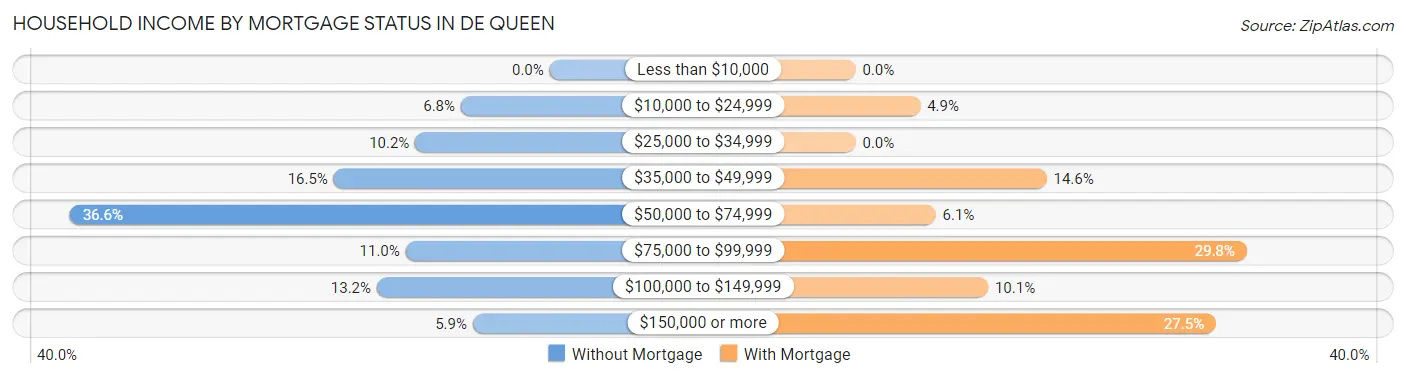
| Household Income | Without Mortgage | With Mortgage |
| Less than $10,000 | 0 (0.0%) | 0 (0.0%) |
| $10,000 to $24,999 | 37 (6.8%) | 21 (4.9%) |
| $25,000 to $34,999 | 56 (10.2%) | 0 (0.0%) |
| $35,000 to $49,999 | 90 (16.5%) | 62 (14.5%) |
| $50,000 to $74,999 | 200 (36.6%) | 26 (6.1%) |
| $75,000 to $99,999 | 60 (11.0%) | 127 (29.8%) |
| $100,000 to $149,999 | 72 (13.2%) | 43 (10.1%) |
| $150,000 or more | 32 (5.9%) | 117 (27.5%) |
| Total | 547 (100.0%) | 426 (100.0%) |
Property Value to Household Income Ratio in De Queen
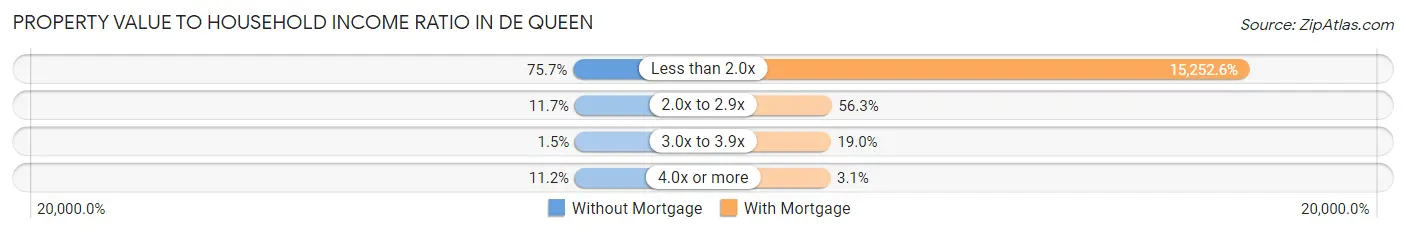
| Value-to-Income Ratio | Without Mortgage | With Mortgage |
| Less than 2.0x | 414 (75.7%) | 64,976 (15,252.6%) |
| 2.0x to 2.9x | 64 (11.7%) | 240 (56.3%) |
| 3.0x to 3.9x | 8 (1.5%) | 81 (19.0%) |
| 4.0x or more | 61 (11.2%) | 13 (3.0%) |
| Total | 547 (100.0%) | 426 (100.0%) |
Real Estate Taxes by Mortgage Status in De Queen
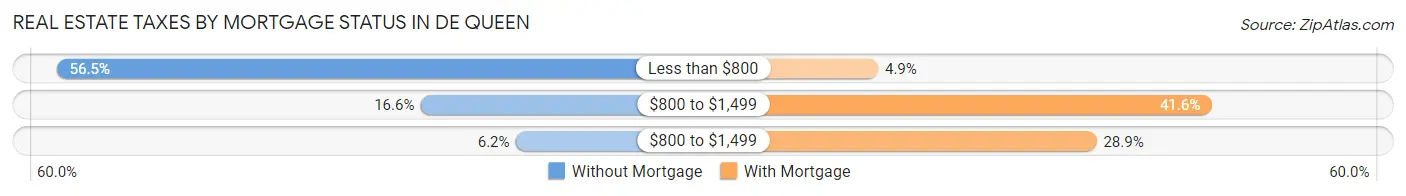
| Property Taxes | Without Mortgage | With Mortgage |
| Less than $800 | 309 (56.5%) | 21 (4.9%) |
| $800 to $1,499 | 91 (16.6%) | 177 (41.5%) |
| $800 to $1,499 | 34 (6.2%) | 123 (28.9%) |
| Total | 547 (100.0%) | 426 (100.0%) |
Health & Disability in De Queen
Health Insurance Coverage by Age in De Queen
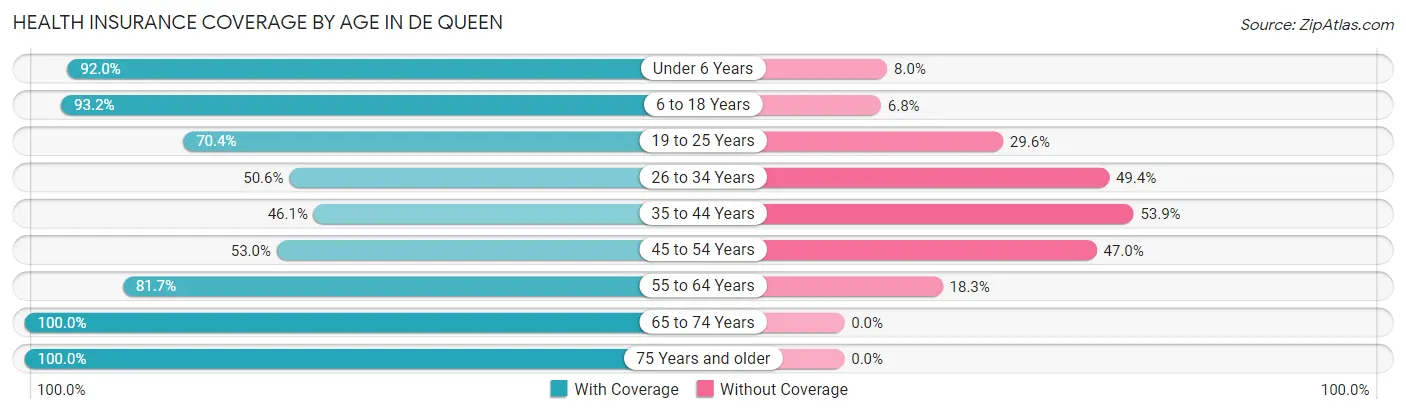
| Age Bracket | With Coverage | Without Coverage |
| Under 6 Years | 507 (92.0%) | 44 (8.0%) |
| 6 to 18 Years | 1,379 (93.2%) | 101 (6.8%) |
| 19 to 25 Years | 419 (70.4%) | 176 (29.6%) |
| 26 to 34 Years | 275 (50.6%) | 268 (49.4%) |
| 35 to 44 Years | 447 (46.1%) | 523 (53.9%) |
| 45 to 54 Years | 375 (53.0%) | 333 (47.0%) |
| 55 to 64 Years | 539 (81.7%) | 121 (18.3%) |
| 65 to 74 Years | 309 (100.0%) | 0 (0.0%) |
| 75 Years and older | 208 (100.0%) | 0 (0.0%) |
| Total | 4,458 (74.0%) | 1,566 (26.0%) |
Health Insurance Coverage by Citizenship Status in De Queen
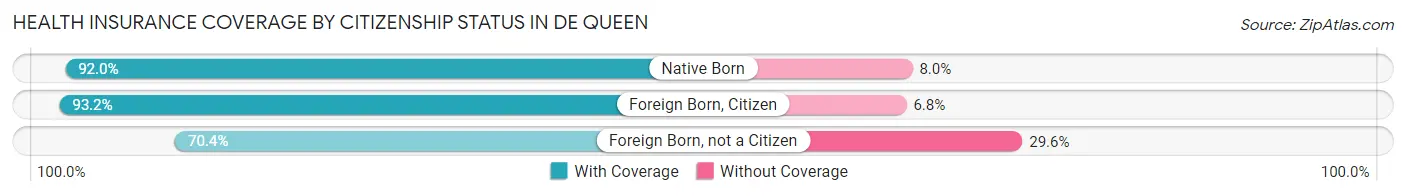
| Citizenship Status | With Coverage | Without Coverage |
| Native Born | 507 (92.0%) | 44 (8.0%) |
| Foreign Born, Citizen | 1,379 (93.2%) | 101 (6.8%) |
| Foreign Born, not a Citizen | 419 (70.4%) | 176 (29.6%) |
Health Insurance Coverage by Household Income in De Queen
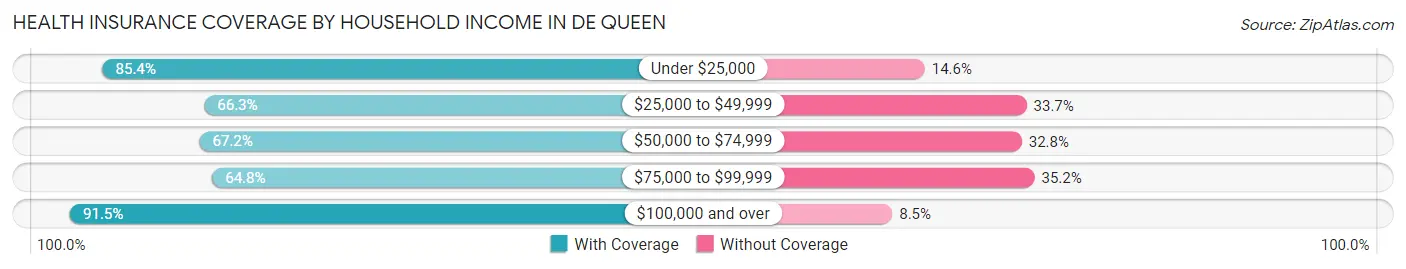
| Household Income | With Coverage | Without Coverage |
| Under $25,000 | 695 (85.4%) | 119 (14.6%) |
| $25,000 to $49,999 | 817 (66.3%) | 415 (33.7%) |
| $50,000 to $74,999 | 1,142 (67.2%) | 557 (32.8%) |
| $75,000 to $99,999 | 684 (64.8%) | 371 (35.2%) |
| $100,000 and over | 1,117 (91.5%) | 104 (8.5%) |
Public vs Private Health Insurance Coverage by Age in De Queen
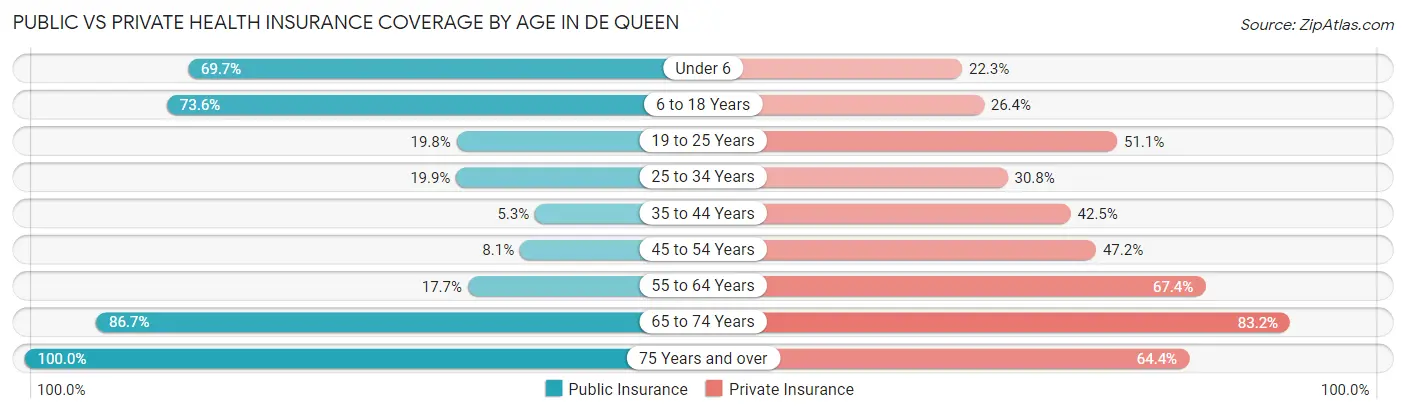
| Age Bracket | Public Insurance | Private Insurance |
| Under 6 | 384 (69.7%) | 123 (22.3%) |
| 6 to 18 Years | 1,089 (73.6%) | 390 (26.4%) |
| 19 to 25 Years | 118 (19.8%) | 304 (51.1%) |
| 25 to 34 Years | 108 (19.9%) | 167 (30.8%) |
| 35 to 44 Years | 51 (5.3%) | 412 (42.5%) |
| 45 to 54 Years | 57 (8.1%) | 334 (47.2%) |
| 55 to 64 Years | 117 (17.7%) | 445 (67.4%) |
| 65 to 74 Years | 268 (86.7%) | 257 (83.2%) |
| 75 Years and over | 208 (100.0%) | 134 (64.4%) |
| Total | 2,400 (39.8%) | 2,566 (42.6%) |
Disability Status by Sex by Age in De Queen
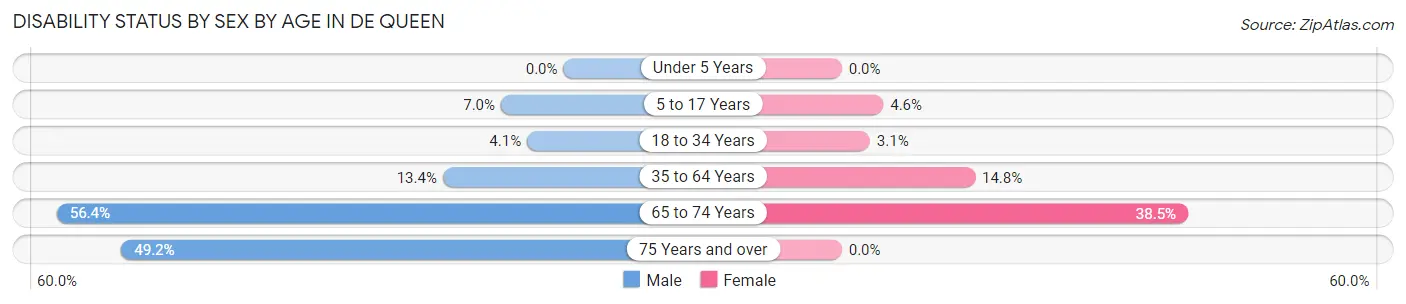
| Age Bracket | Male | Female |
| Under 5 Years | 0 (0.0%) | 0 (0.0%) |
| 5 to 17 Years | 36 (7.0%) | 42 (4.6%) |
| 18 to 34 Years | 22 (4.1%) | 23 (3.1%) |
| 35 to 64 Years | 162 (13.4%) | 168 (14.8%) |
| 65 to 74 Years | 66 (56.4%) | 74 (38.5%) |
| 75 Years and over | 63 (49.2%) | 0 (0.0%) |
Disability Class by Sex by Age in De Queen
Disability Class: Hearing Difficulty
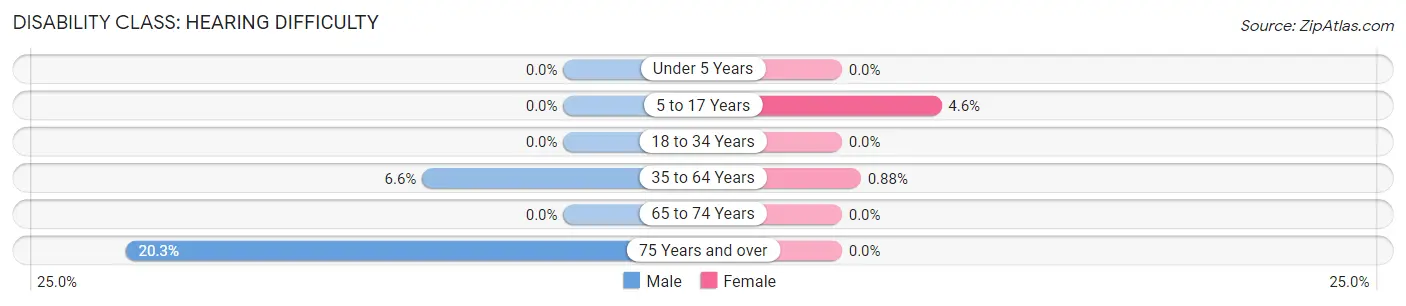
| Age Bracket | Male | Female |
| Under 5 Years | 0 (0.0%) | 0 (0.0%) |
| 5 to 17 Years | 0 (0.0%) | 42 (4.6%) |
| 18 to 34 Years | 0 (0.0%) | 0 (0.0%) |
| 35 to 64 Years | 79 (6.6%) | 10 (0.9%) |
| 65 to 74 Years | 0 (0.0%) | 0 (0.0%) |
| 75 Years and over | 26 (20.3%) | 0 (0.0%) |
Disability Class: Vision Difficulty
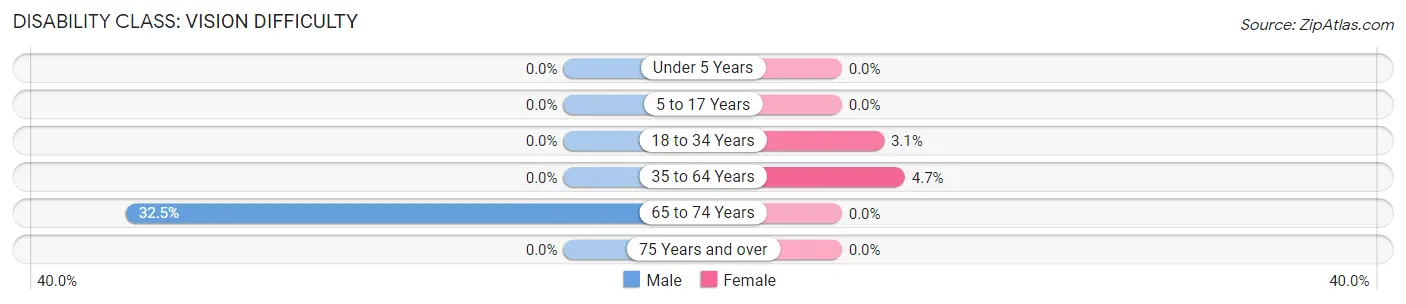
| Age Bracket | Male | Female |
| Under 5 Years | 0 (0.0%) | 0 (0.0%) |
| 5 to 17 Years | 0 (0.0%) | 0 (0.0%) |
| 18 to 34 Years | 0 (0.0%) | 23 (3.1%) |
| 35 to 64 Years | 0 (0.0%) | 53 (4.7%) |
| 65 to 74 Years | 38 (32.5%) | 0 (0.0%) |
| 75 Years and over | 0 (0.0%) | 0 (0.0%) |
Disability Class: Cognitive Difficulty
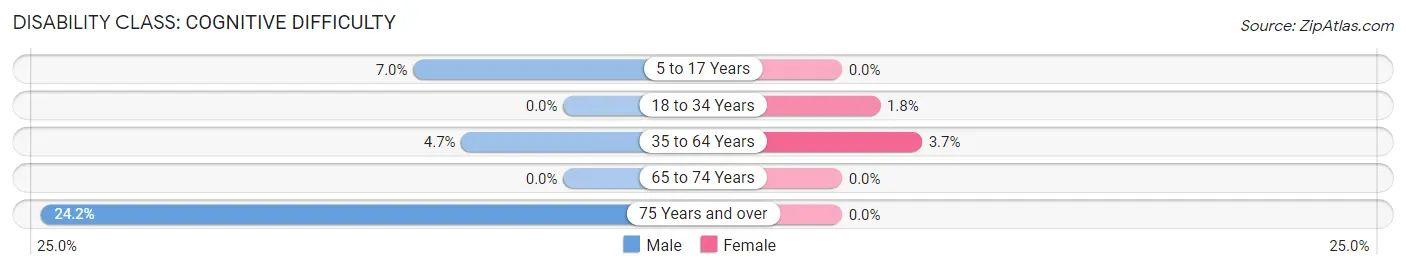
| Age Bracket | Male | Female |
| 5 to 17 Years | 36 (7.0%) | 0 (0.0%) |
| 18 to 34 Years | 0 (0.0%) | 13 (1.8%) |
| 35 to 64 Years | 57 (4.7%) | 42 (3.7%) |
| 65 to 74 Years | 0 (0.0%) | 0 (0.0%) |
| 75 Years and over | 31 (24.2%) | 0 (0.0%) |
Disability Class: Ambulatory Difficulty
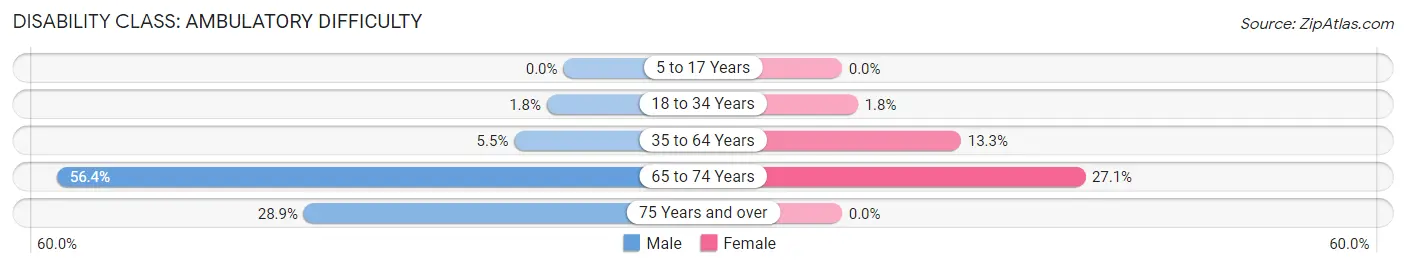
| Age Bracket | Male | Female |
| 5 to 17 Years | 0 (0.0%) | 0 (0.0%) |
| 18 to 34 Years | 10 (1.8%) | 13 (1.8%) |
| 35 to 64 Years | 66 (5.5%) | 150 (13.3%) |
| 65 to 74 Years | 66 (56.4%) | 52 (27.1%) |
| 75 Years and over | 37 (28.9%) | 0 (0.0%) |
Disability Class: Self-Care Difficulty
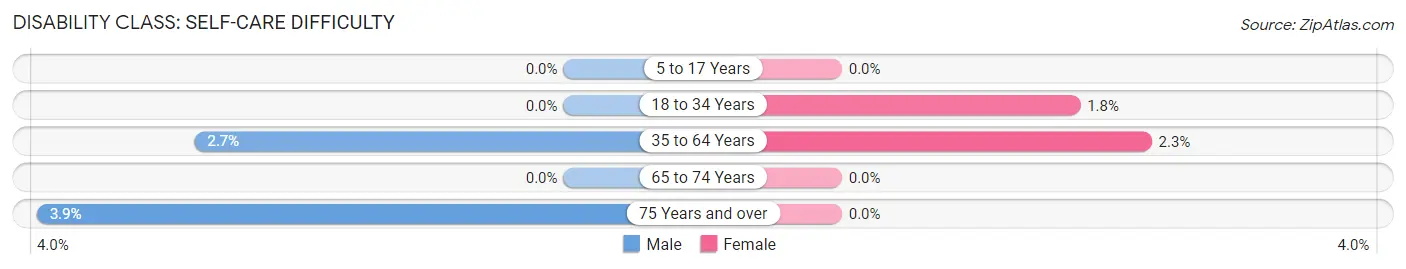
| Age Bracket | Male | Female |
| 5 to 17 Years | 0 (0.0%) | 0 (0.0%) |
| 18 to 34 Years | 0 (0.0%) | 13 (1.8%) |
| 35 to 64 Years | 33 (2.7%) | 26 (2.3%) |
| 65 to 74 Years | 0 (0.0%) | 0 (0.0%) |
| 75 Years and over | 5 (3.9%) | 0 (0.0%) |
Technology Access in De Queen
Computing Device Access in De Queen
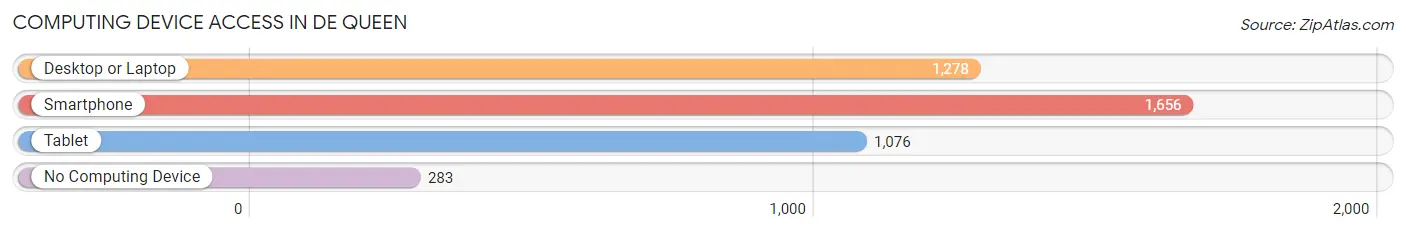
| Device Type | # Households | % Households |
| Desktop or Laptop | 1,278 | 61.5% |
| Smartphone | 1,656 | 79.6% |
| Tablet | 1,076 | 51.8% |
| No Computing Device | 283 | 13.6% |
| Total | 2,079 | 100.0% |
Internet Access in De Queen
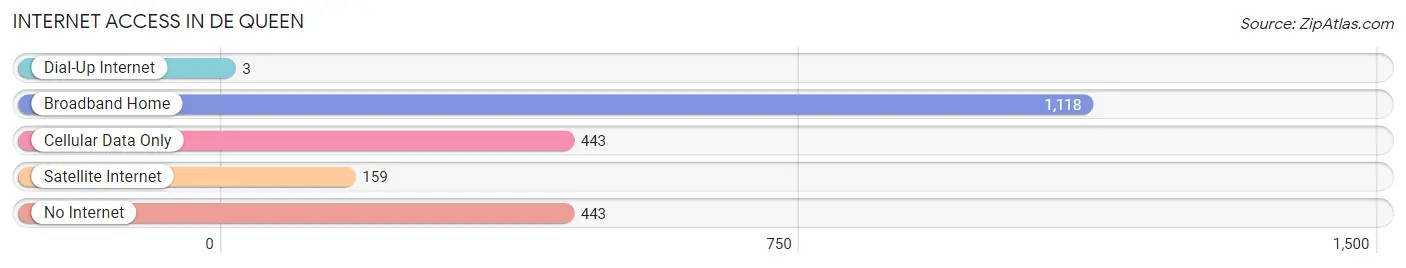
| Internet Type | # Households | % Households |
| Dial-Up Internet | 3 | 0.1% |
| Broadband Home | 1,118 | 53.8% |
| Cellular Data Only | 443 | 21.3% |
| Satellite Internet | 159 | 7.6% |
| No Internet | 443 | 21.3% |
| Total | 2,079 | 100.0% |
De Queen Summary
De Queen is a city located in Sevier County, Arkansas, United States. It is the county seat of Sevier County. The population was 6,629 at the 2010 census.
History
De Queen was founded in 1891 by the Kansas City, Pittsburg and Gulf Railroad. The city was named after the daughter of a railroad official. The first post office was established in 1892.
De Queen was incorporated in 1901. The city was a major center for timber production in the early 20th century. The city was also home to a large cotton mill, which was destroyed by fire in the 1920s.
Geography
De Queen is located at the intersection of U.S. Route 70 and Arkansas Highway 41 in the Ouachita Mountains of southwestern Arkansas. It is approximately 30 miles east of the Oklahoma border and 60 miles south of the Arkansas-Missouri border.
The city has a total area of 8.2 square miles, of which 8.1 square miles is land and 0.1 square miles is water.
Economy
De Queen is a major center for timber production in the region. The city is also home to a number of manufacturing and service businesses.
The city is served by the De Queen Municipal Airport which is located just outside the city limits
Demographics
As of the 2010 census, there were 6,629 people, 2,541 households, and 1,717 families residing in the city. The population density was 817.2 people per square mile. There were 2,845 housing units at an average density of 352.3 per square mile.
The racial makeup of the city was 79.2% White, 0.7% African American, 1.2% Native American, 0.3% Asian, 0.1% Pacific Islander, 16.2% from other races, and 2.5% from two or more races. Hispanic or Latino of any race were 28.2% of the population.
There were 2,541 households, out of which 33.2% had children under the age of 18 living with them, 48.2% were married couples living together, 14.7% had a female householder with no husband present, and 31.7% were non-families. 27.2% of all households were made up of individuals, and 13.2% had someone living alone who was 65 years of age or older. The average household size was 2.56 and the average family size was 3.10.
In the city, the population was spread out, with 27.2% under the age of 18, 8.7% from 18 to 24, 25.3% from 25 to 44, 22.2% from 45 to 64, and 16.6% who were 65 years of age or older. The median age was 36 years. For every 100 females, there were 92.2 males. For every 100 females age 18 and over, there were 88.2 males.
The median income for a household in the city was $27,813, and the median income for a family was $33,917. Males had a median income of $27,917 versus $19,917 for females. The per capita income for the city was $14,845. About 16.2% of families and 19.2% of the population were below the poverty line, including 25.2% of those under age 18 and 14.2% of those age 65 or over.
Common Questions
What is Per Capita Income in De Queen?
Per Capita income in De Queen is $23,247.
What is the Median Family Income in De Queen?
Median Family Income in De Queen is $58,214.
What is the Median Household income in De Queen?
Median Household Income in De Queen is $55,207.
What is Income or Wage Gap in De Queen?
Income or Wage Gap in De Queen is 31.1%.
Women in De Queen earn 68.9 cents for every dollar earned by a man.
What is Inequality or Gini Index in De Queen?
Inequality or Gini Index in De Queen is 0.44.
What is the Total Population of De Queen?
Total Population of De Queen is 6,132.
What is the Total Male Population of De Queen?
Total Male Population of De Queen is 2,801.
What is the Total Female Population of De Queen?
Total Female Population of De Queen is 3,331.
What is the Ratio of Males per 100 Females in De Queen?
There are 84.09 Males per 100 Females in De Queen.
What is the Ratio of Females per 100 Males in De Queen?
There are 118.92 Females per 100 Males in De Queen.
What is the Median Population Age in De Queen?
Median Population Age in De Queen is 33.0 Years.
What is the Average Family Size in De Queen
Average Family Size in De Queen is 3.7 People.
What is the Average Household Size in De Queen
Average Household Size in De Queen is 2.9 People.
How Large is the Labor Force in De Queen?
There are 2,830 People in the Labor Forcein in De Queen.
What is the Percentage of People in the Labor Force in De Queen?
63.4% of People are in the Labor Force in De Queen.
What is the Unemployment Rate in De Queen?
Unemployment Rate in De Queen is 2.5%.