Pepeekeo, HI Map & Demographics
Pepeekeo Map
Pepeekeo Overview
$25,764
PER CAPITA INCOME
$70,682
AVG FAMILY INCOME
$51,471
AVG HOUSEHOLD INCOME
23.9%
WAGE / INCOME GAP [ % ]
76.1¢/ $1
WAGE / INCOME GAP [ $ ]
$13,972
FAMILY INCOME DEFICIT
0.45
INEQUALITY / GINI INDEX
1,462
TOTAL POPULATION
766
MALE POPULATION
696
FEMALE POPULATION
110.06
MALES / 100 FEMALES
90.86
FEMALES / 100 MALES
38.3
MEDIAN AGE
3.5
AVG FAMILY SIZE
2.9
AVG HOUSEHOLD SIZE
699
LABOR FORCE [ PEOPLE ]
59.1%
PERCENT IN LABOR FORCE
8.5%
UNEMPLOYMENT RATE
Pepeekeo Zip Codes
Pepeekeo Area Codes
Income in Pepeekeo
Income Overview in Pepeekeo
Per Capita Income in Pepeekeo is $25,764, while median incomes of families and households are $70,682 and $51,471 respectively.
| Characteristic | Number | Measure |
| Per Capita Income | 1,462 | $25,764 |
| Median Family Income | 330 | $70,682 |
| Mean Family Income | 330 | $76,997 |
| Median Household Income | 510 | $51,471 |
| Mean Household Income | 510 | $73,238 |
| Income Deficit | 330 | $13,972 |
| Wage / Income Gap (%) | 1,462 | 23.94% |
| Wage / Income Gap ($) | 1,462 | 76.06¢ per $1 |
| Gini / Inequality Index | 1,462 | 0.45 |
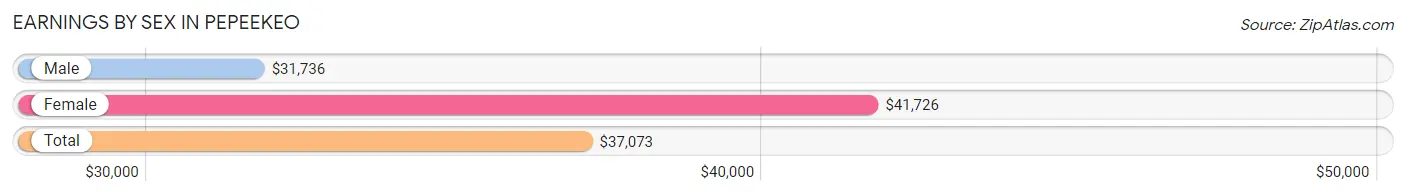
Earnings by Sex in Pepeekeo
Average Earnings in Pepeekeo are $37,073, $31,736 for men and $41,726 for women, a difference of 23.9%.
| Sex | Number | Average Earnings |
| Male | 395 (54.9%) | $31,736 |
| Female | 325 (45.1%) | $41,726 |
| Total | 720 (100.0%) | $37,073 |
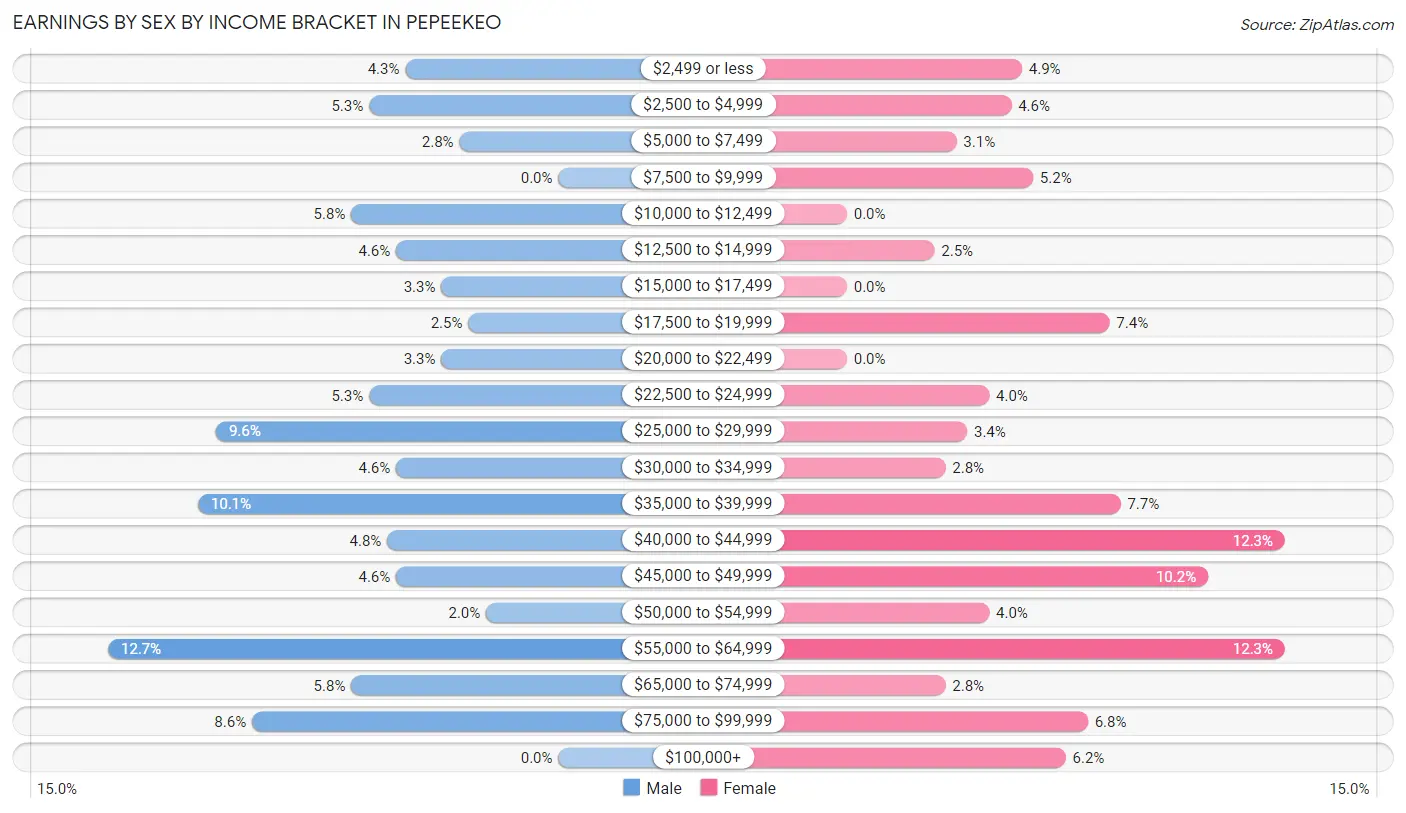
Earnings by Sex by Income Bracket in Pepeekeo
The most common earnings brackets in Pepeekeo are $55,000 to $64,999 for men (50 | 12.7%) and $40,000 to $44,999 for women (40 | 12.3%).
| Income | Male | Female |
| $2,499 or less | 17 (4.3%) | 16 (4.9%) |
| $2,500 to $4,999 | 21 (5.3%) | 15 (4.6%) |
| $5,000 to $7,499 | 11 (2.8%) | 10 (3.1%) |
| $7,500 to $9,999 | 0 (0.0%) | 17 (5.2%) |
| $10,000 to $12,499 | 23 (5.8%) | 0 (0.0%) |
| $12,500 to $14,999 | 18 (4.6%) | 8 (2.5%) |
| $15,000 to $17,499 | 13 (3.3%) | 0 (0.0%) |
| $17,500 to $19,999 | 10 (2.5%) | 24 (7.4%) |
| $20,000 to $22,499 | 13 (3.3%) | 0 (0.0%) |
| $22,500 to $24,999 | 21 (5.3%) | 13 (4.0%) |
| $25,000 to $29,999 | 38 (9.6%) | 11 (3.4%) |
| $30,000 to $34,999 | 18 (4.6%) | 9 (2.8%) |
| $35,000 to $39,999 | 40 (10.1%) | 25 (7.7%) |
| $40,000 to $44,999 | 19 (4.8%) | 40 (12.3%) |
| $45,000 to $49,999 | 18 (4.6%) | 33 (10.2%) |
| $50,000 to $54,999 | 8 (2.0%) | 13 (4.0%) |
| $55,000 to $64,999 | 50 (12.7%) | 40 (12.3%) |
| $65,000 to $74,999 | 23 (5.8%) | 9 (2.8%) |
| $75,000 to $99,999 | 34 (8.6%) | 22 (6.8%) |
| $100,000+ | 0 (0.0%) | 20 (6.1%) |
| Total | 395 (100.0%) | 325 (100.0%) |
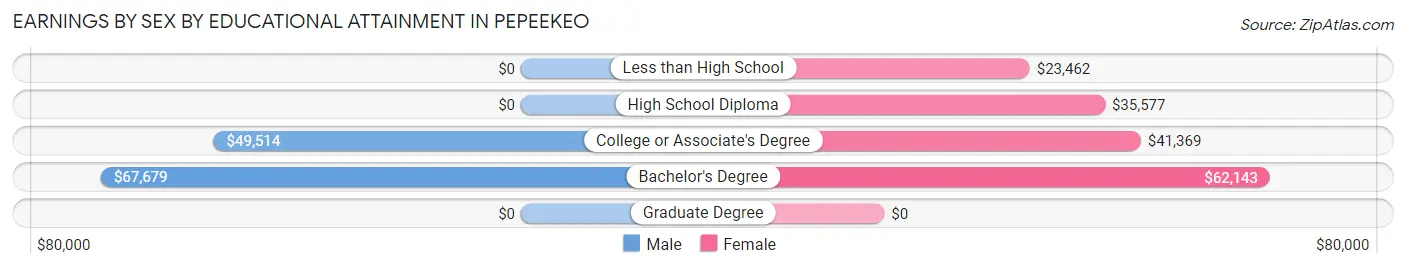
Earnings by Sex by Educational Attainment in Pepeekeo
Average earnings in Pepeekeo are $40,972 for men and $43,421 for women, a difference of 5.6%. Men with an educational attainment of bachelor's degree enjoy the highest average annual earnings of $67,679, while those with college or associate's degree education earn the least with $49,514. Women with an educational attainment of bachelor's degree earn the most with the average annual earnings of $62,143, while those with less than high school education have the smallest earnings of $23,462.
| Educational Attainment | Male Income | Female Income |
| Less than High School | - | - |
| High School Diploma | - | - |
| College or Associate's Degree | $49,514 | $41,369 |
| Bachelor's Degree | $67,679 | $62,143 |
| Graduate Degree | - | - |
| Total | $40,972 | $43,421 |
Family Income in Pepeekeo
Family Income Brackets in Pepeekeo
According to the Pepeekeo family income data, there are 88 families falling into the $100,000 to $149,999 income range, which is the most common income bracket and makes up 26.7% of all families.
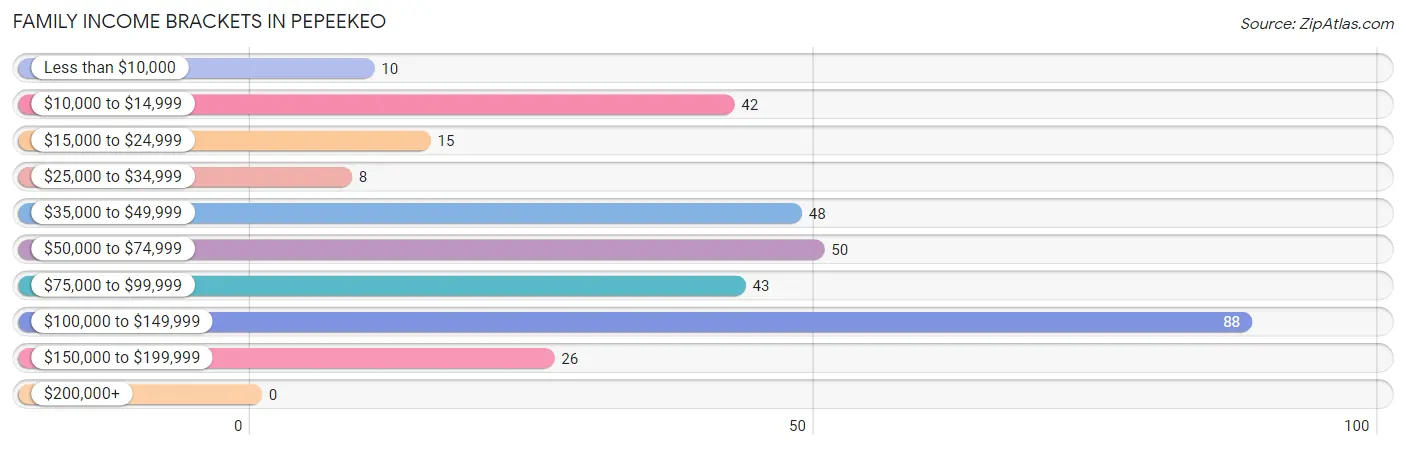
| Income Bracket | # Families | % Families |
| Less than $10,000 | 10 | 3.0% |
| $10,000 to $14,999 | 42 | 12.7% |
| $15,000 to $24,999 | 15 | 4.5% |
| $25,000 to $34,999 | 8 | 2.4% |
| $35,000 to $49,999 | 48 | 14.5% |
| $50,000 to $74,999 | 50 | 15.2% |
| $75,000 to $99,999 | 43 | 13.0% |
| $100,000 to $149,999 | 88 | 26.7% |
| $150,000 to $199,999 | 26 | 7.9% |
| $200,000+ | 0 | 0.0% |
Family Income by Famaliy Size in Pepeekeo
5-person families (60 | 18.2%) account for the highest median family income in Pepeekeo with $115,893 per family, while 2-person families (140 | 42.4%) have the highest median income of $31,406 per family member.
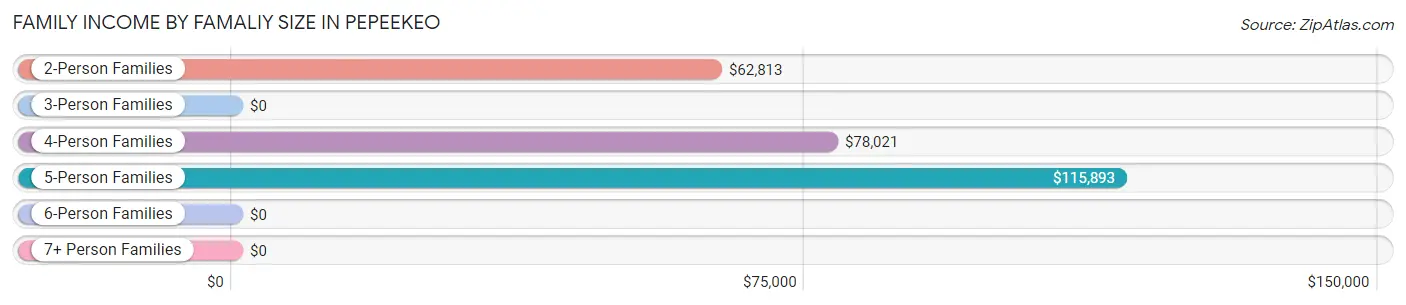
| Income Bracket | # Families | Median Income |
| 2-Person Families | 140 (42.4%) | $62,813 |
| 3-Person Families | 66 (20.0%) | $0 |
| 4-Person Families | 39 (11.8%) | $78,021 |
| 5-Person Families | 60 (18.2%) | $115,893 |
| 6-Person Families | 14 (4.2%) | $0 |
| 7+ Person Families | 11 (3.3%) | $0 |
| Total | 330 (100.0%) | $70,682 |
Family Income by Number of Earners in Pepeekeo
The median family income in Pepeekeo is $70,682, with families comprising 2 earners (107) having the highest median family income of $115,268, while families with no earners (102) have the lowest median family income of $35,583, accounting for 32.4% and 30.9% of families, respectively.
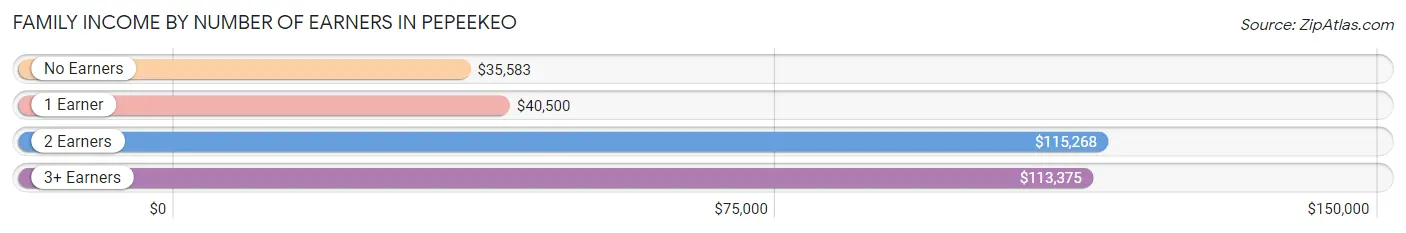
| Number of Earners | # Families | Median Income |
| No Earners | 102 (30.9%) | $35,583 |
| 1 Earner | 66 (20.0%) | $40,500 |
| 2 Earners | 107 (32.4%) | $115,268 |
| 3+ Earners | 55 (16.7%) | $113,375 |
| Total | 330 (100.0%) | $70,682 |
Household Income in Pepeekeo
Household Income Brackets in Pepeekeo
With 92 households falling in the category, the $100,000 to $149,999 income range is the most frequent in Pepeekeo, accounting for 18.0% of all households. In contrast, only 21 households (4.1%) fall into the less than $10,000 income bracket, making it the least populous group.
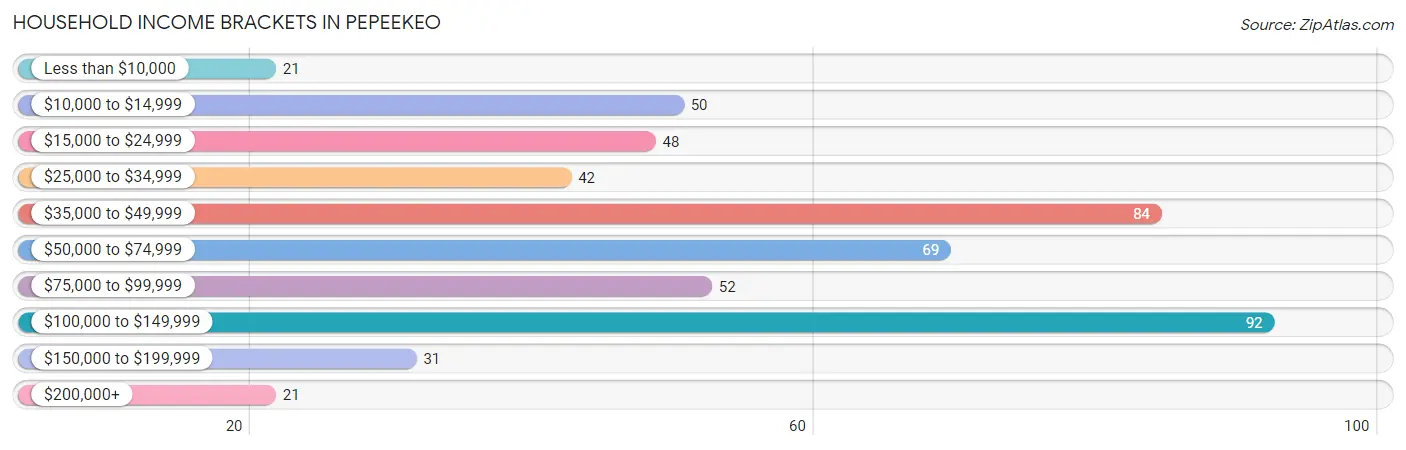
| Income Bracket | # Households | % Households |
| Less than $10,000 | 21 | 4.1% |
| $10,000 to $14,999 | 50 | 9.8% |
| $15,000 to $24,999 | 48 | 9.4% |
| $25,000 to $34,999 | 42 | 8.2% |
| $35,000 to $49,999 | 84 | 16.5% |
| $50,000 to $74,999 | 69 | 13.5% |
| $75,000 to $99,999 | 52 | 10.2% |
| $100,000 to $149,999 | 92 | 18.0% |
| $150,000 to $199,999 | 31 | 6.1% |
| $200,000+ | 21 | 4.1% |
Household Income by Householder Age in Pepeekeo
The median household income in Pepeekeo is $51,471, with the highest median household income of $92,143 found in the 25 to 44 years age bracket for the primary householder. A total of 128 households (25.1%) fall into this category. Meanwhile, the 15 to 24 years age bracket for the primary householder has the lowest median household income of $0, with 9 households (1.8%) in this group.
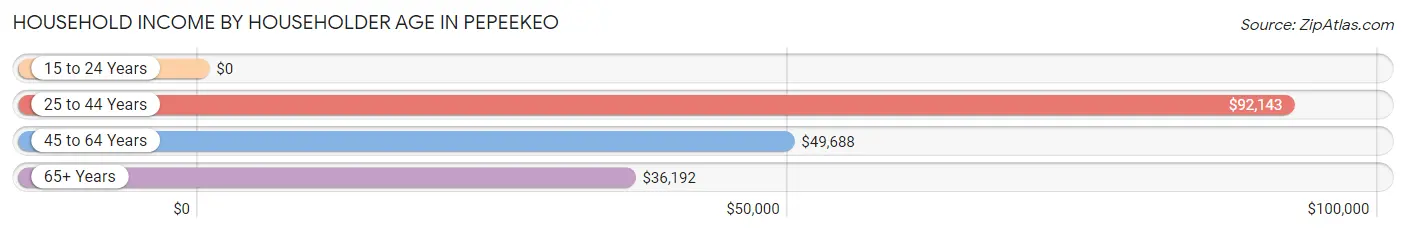
| Income Bracket | # Households | Median Income |
| 15 to 24 Years | 9 (1.8%) | $0 |
| 25 to 44 Years | 128 (25.1%) | $92,143 |
| 45 to 64 Years | 216 (42.3%) | $49,688 |
| 65+ Years | 157 (30.8%) | $36,192 |
| Total | 510 (100.0%) | $51,471 |
Poverty in Pepeekeo
Income Below Poverty by Sex and Age in Pepeekeo
With 26.0% poverty level for males and 21.8% for females among the residents of Pepeekeo, 15 year old males and 15 year old females are the most vulnerable to poverty, with 9 males (100.0%) and 2 females (100.0%) in their respective age groups living below the poverty level.
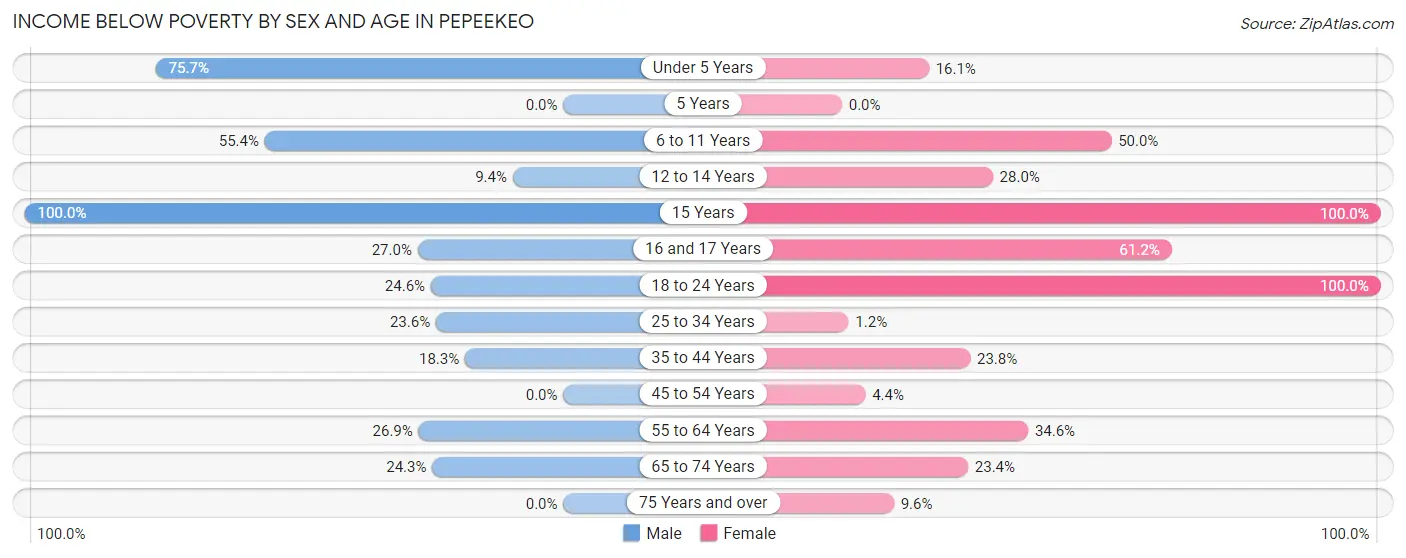
| Age Bracket | Male | Female |
| Under 5 Years | 28 (75.7%) | 5 (16.1%) |
| 5 Years | 0 (0.0%) | 0 (0.0%) |
| 6 to 11 Years | 46 (55.4%) | 18 (50.0%) |
| 12 to 14 Years | 3 (9.4%) | 14 (28.0%) |
| 15 Years | 9 (100.0%) | 2 (100.0%) |
| 16 and 17 Years | 10 (27.0%) | 30 (61.2%) |
| 18 to 24 Years | 29 (24.6%) | 17 (100.0%) |
| 25 to 34 Years | 13 (23.6%) | 1 (1.2%) |
| 35 to 44 Years | 25 (18.2%) | 20 (23.8%) |
| 45 to 54 Years | 0 (0.0%) | 7 (4.3%) |
| 55 to 64 Years | 18 (26.9%) | 19 (34.5%) |
| 65 to 74 Years | 18 (24.3%) | 11 (23.4%) |
| 75 Years and over | 0 (0.0%) | 8 (9.6%) |
| Total | 199 (26.0%) | 152 (21.8%) |
Income Above Poverty by Sex and Age in Pepeekeo
According to the poverty statistics in Pepeekeo, males aged 45 to 54 years and females aged 25 to 34 years are the age groups that are most secure financially, with 100.0% of males and 98.8% of females in these age groups living above the poverty line.
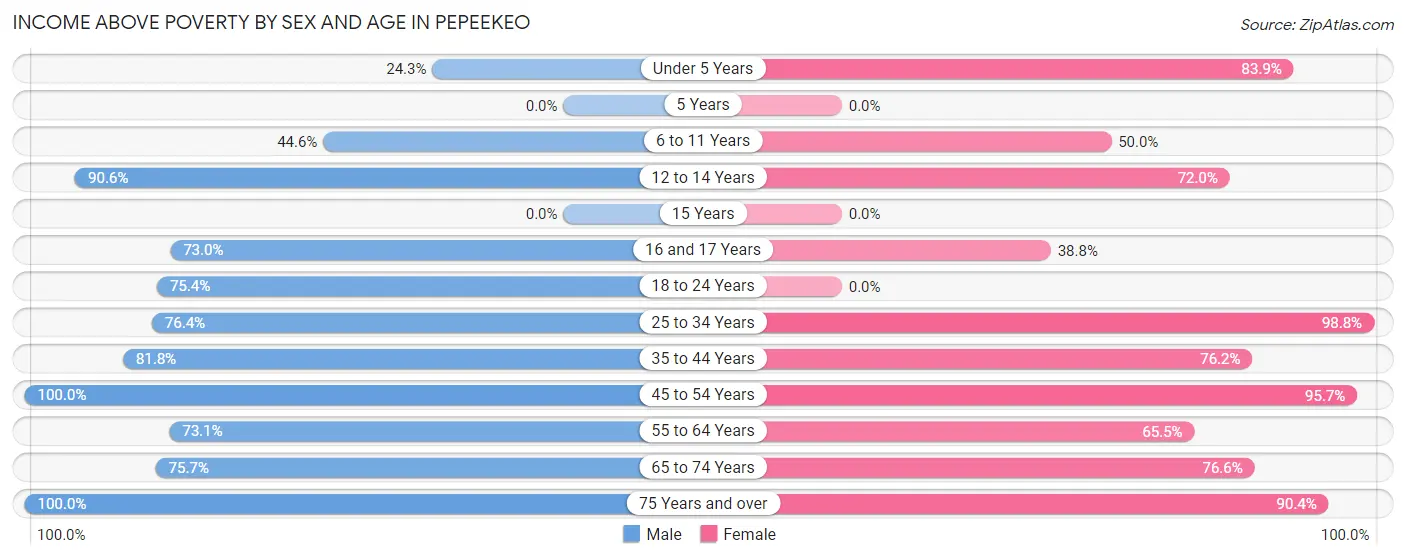
| Age Bracket | Male | Female |
| Under 5 Years | 9 (24.3%) | 26 (83.9%) |
| 5 Years | 0 (0.0%) | 0 (0.0%) |
| 6 to 11 Years | 37 (44.6%) | 18 (50.0%) |
| 12 to 14 Years | 29 (90.6%) | 36 (72.0%) |
| 15 Years | 0 (0.0%) | 0 (0.0%) |
| 16 and 17 Years | 27 (73.0%) | 19 (38.8%) |
| 18 to 24 Years | 89 (75.4%) | 0 (0.0%) |
| 25 to 34 Years | 42 (76.4%) | 80 (98.8%) |
| 35 to 44 Years | 112 (81.8%) | 64 (76.2%) |
| 45 to 54 Years | 77 (100.0%) | 154 (95.7%) |
| 55 to 64 Years | 49 (73.1%) | 36 (65.4%) |
| 65 to 74 Years | 56 (75.7%) | 36 (76.6%) |
| 75 Years and over | 40 (100.0%) | 75 (90.4%) |
| Total | 567 (74.0%) | 544 (78.2%) |
Income Below Poverty Among Married-Couple Families in Pepeekeo
The poverty statistics for married-couple families in Pepeekeo show that 11.6% or 26 of the total 224 families live below the poverty line. Families with 3 or 4 children have the highest poverty rate of 33.3%, comprising of 14 families. On the other hand, families with no children have the lowest poverty rate of 5.8%, which includes 8 families.
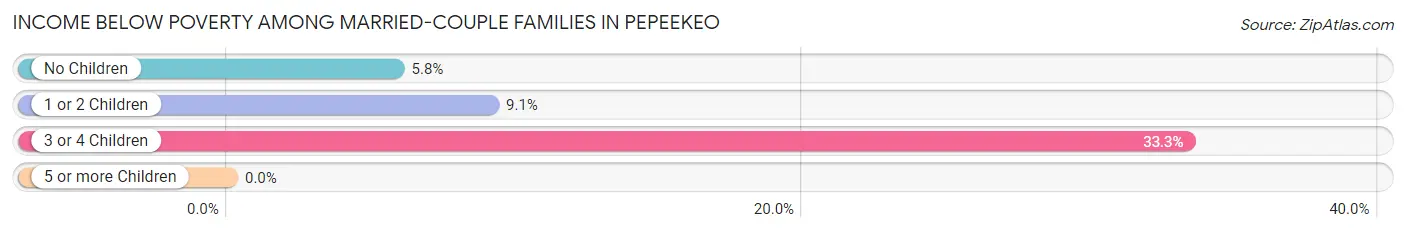
| Children | Above Poverty | Below Poverty |
| No Children | 130 (94.2%) | 8 (5.8%) |
| 1 or 2 Children | 40 (90.9%) | 4 (9.1%) |
| 3 or 4 Children | 28 (66.7%) | 14 (33.3%) |
| 5 or more Children | 0 (0.0%) | 0 (0.0%) |
| Total | 198 (88.4%) | 26 (11.6%) |
Income Below Poverty Among Single-Parent Households in Pepeekeo
According to the poverty data in Pepeekeo, 40.5% or 15 single-father households and 40.6% or 28 single-mother households are living below the poverty line. Among single-father households, those with 3 or 4 children have the highest poverty rate, with 1 households (100.0%) experiencing poverty. Likewise, among single-mother households, those with 3 or 4 children have the highest poverty rate, with 15 households (100.0%) falling below the poverty line.
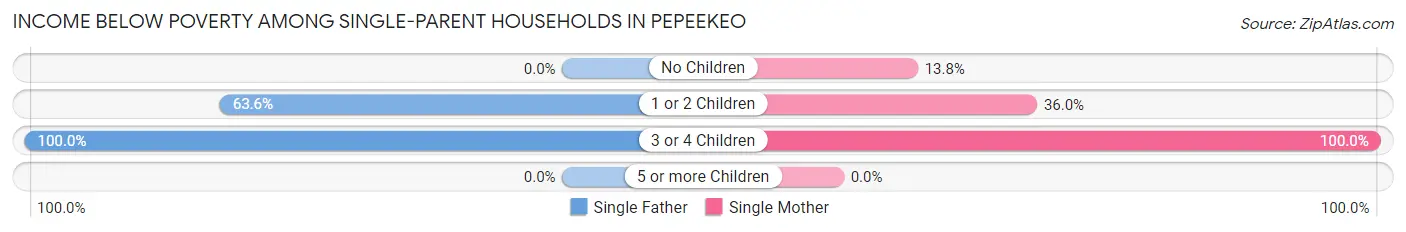
| Children | Single Father | Single Mother |
| No Children | 0 (0.0%) | 4 (13.8%) |
| 1 or 2 Children | 14 (63.6%) | 9 (36.0%) |
| 3 or 4 Children | 1 (100.0%) | 15 (100.0%) |
| 5 or more Children | 0 (0.0%) | 0 (0.0%) |
| Total | 15 (40.5%) | 28 (40.6%) |
Income Below Poverty Among Married-Couple vs Single-Parent Households in Pepeekeo
The poverty data for Pepeekeo shows that 26 of the married-couple family households (11.6%) and 43 of the single-parent households (40.6%) are living below the poverty level. Within the married-couple family households, those with 3 or 4 children have the highest poverty rate, with 14 households (33.3%) falling below the poverty line. Among the single-parent households, those with 3 or 4 children have the highest poverty rate, with 16 household (100.0%) living below poverty.
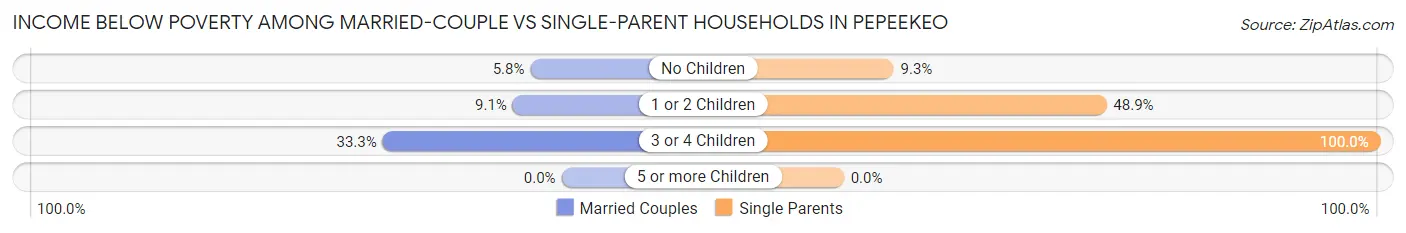
| Children | Married-Couple Families | Single-Parent Households |
| No Children | 8 (5.8%) | 4 (9.3%) |
| 1 or 2 Children | 4 (9.1%) | 23 (48.9%) |
| 3 or 4 Children | 14 (33.3%) | 16 (100.0%) |
| 5 or more Children | 0 (0.0%) | 0 (0.0%) |
| Total | 26 (11.6%) | 43 (40.6%) |
Race in Pepeekeo
The most populous races in Pepeekeo are Asian (450 | 30.8%), Hawaiian / Pacific (418 | 28.6%), and Two or more Races (381 | 26.1%).
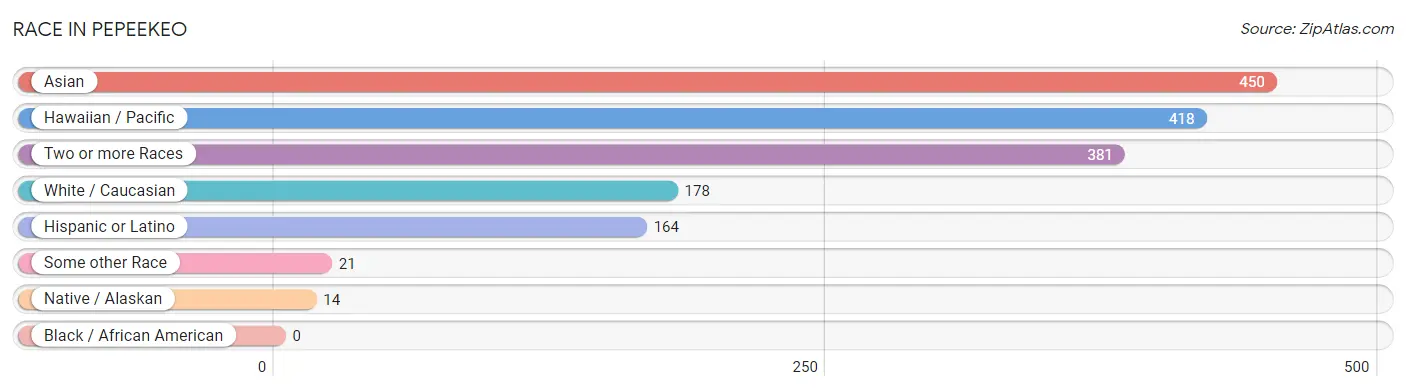
| Race | # Population | % Population |
| Asian | 450 | 30.8% |
| Black / African American | 0 | 0.0% |
| Hawaiian / Pacific | 418 | 28.6% |
| Hispanic or Latino | 164 | 11.2% |
| Native / Alaskan | 14 | 1.0% |
| White / Caucasian | 178 | 12.2% |
| Two or more Races | 381 | 26.1% |
| Some other Race | 21 | 1.4% |
| Total | 1,462 | 100.0% |
Ancestry in Pepeekeo
The most populous ancestries reported in Pepeekeo are Korean (488 | 33.4%), Native Hawaiian (342 | 23.4%), Fijian (183 | 12.5%), Bhutanese (167 | 11.4%), and English (127 | 8.7%), together accounting for 89.4% of all Pepeekeo residents.
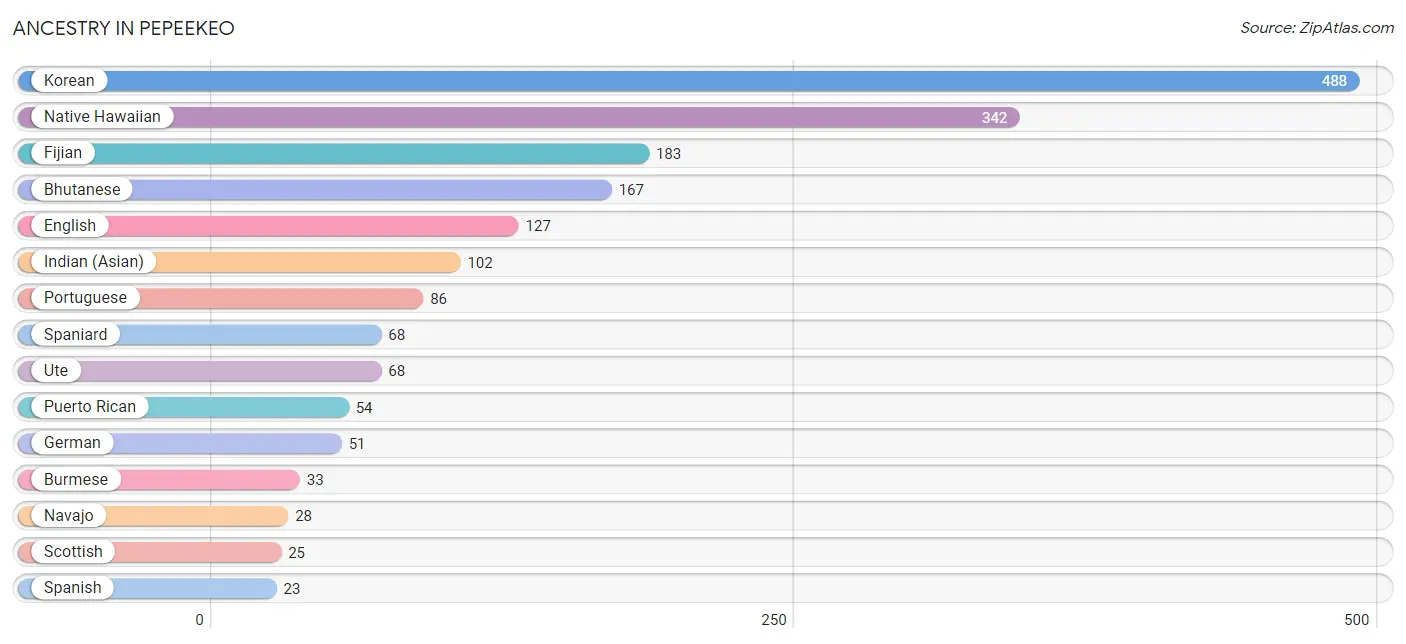
| Ancestry | # Population | % Population |
| American | 4 | 0.3% |
| Arab | 10 | 0.7% |
| Bhutanese | 167 | 11.4% |
| Burmese | 33 | 2.3% |
| Central American | 14 | 1.0% |
| Cherokee | 13 | 0.9% |
| Creek | 12 | 0.8% |
| Croatian | 3 | 0.2% |
| English | 127 | 8.7% |
| European | 3 | 0.2% |
| Fijian | 183 | 12.5% |
| French | 14 | 1.0% |
| German | 51 | 3.5% |
| Indian (Asian) | 102 | 7.0% |
| Irish | 3 | 0.2% |
| Italian | 3 | 0.2% |
| Korean | 488 | 33.4% |
| Mexican | 5 | 0.3% |
| Native Hawaiian | 342 | 23.4% |
| Navajo | 28 | 1.9% |
| Polish | 13 | 0.9% |
| Portuguese | 86 | 5.9% |
| Puerto Rican | 54 | 3.7% |
| Salvadoran | 14 | 1.0% |
| Samoan | 10 | 0.7% |
| Scotch-Irish | 21 | 1.4% |
| Scottish | 25 | 1.7% |
| Spaniard | 68 | 4.6% |
| Spanish | 23 | 1.6% |
| Syrian | 10 | 0.7% |
| Ute | 68 | 4.6% | View All 31 Rows |
Immigrants in Pepeekeo
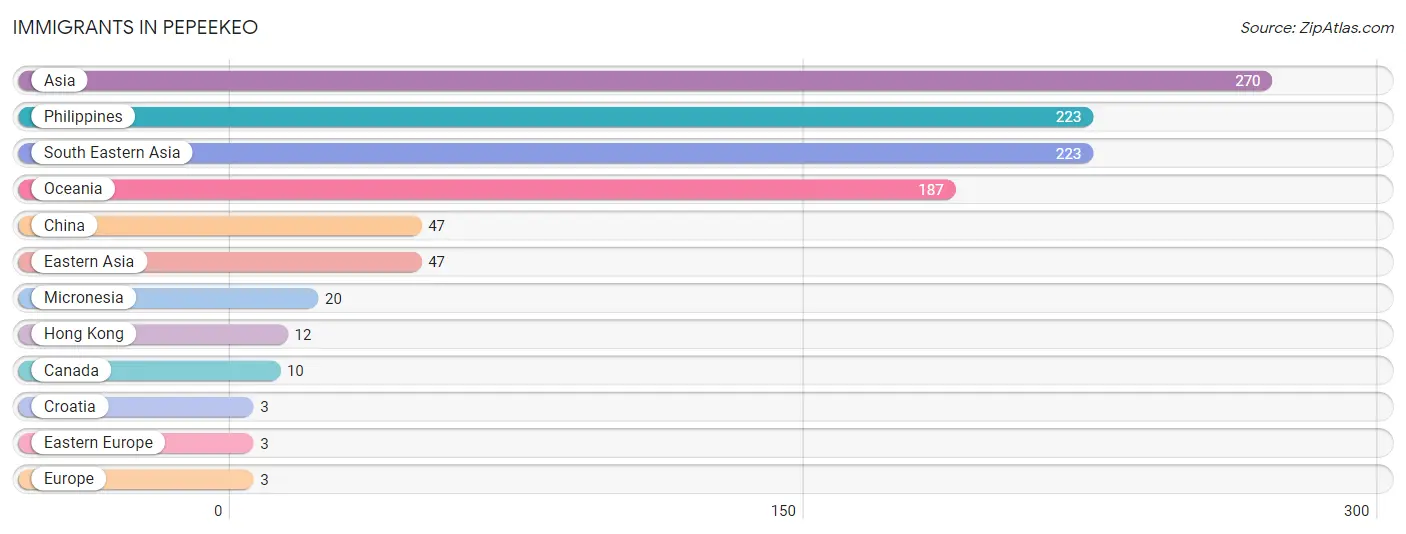
The most numerous immigrant groups reported in Pepeekeo came from Asia (270 | 18.5%), Philippines (223 | 15.2%), South Eastern Asia (223 | 15.2%), Oceania (187 | 12.8%), and China (47 | 3.2%), together accounting for 65.0% of all Pepeekeo residents.
| Immigration Origin | # Population | % Population |
| Asia | 270 | 18.5% |
| Canada | 10 | 0.7% |
| China | 47 | 3.2% |
| Croatia | 3 | 0.2% |
| Eastern Asia | 47 | 3.2% |
| Eastern Europe | 3 | 0.2% |
| Europe | 3 | 0.2% |
| Hong Kong | 12 | 0.8% |
| Micronesia | 20 | 1.4% |
| Oceania | 187 | 12.8% |
| Philippines | 223 | 15.2% |
| South Eastern Asia | 223 | 15.2% | View All 12 Rows |
Sex and Age in Pepeekeo
Sex and Age in Pepeekeo
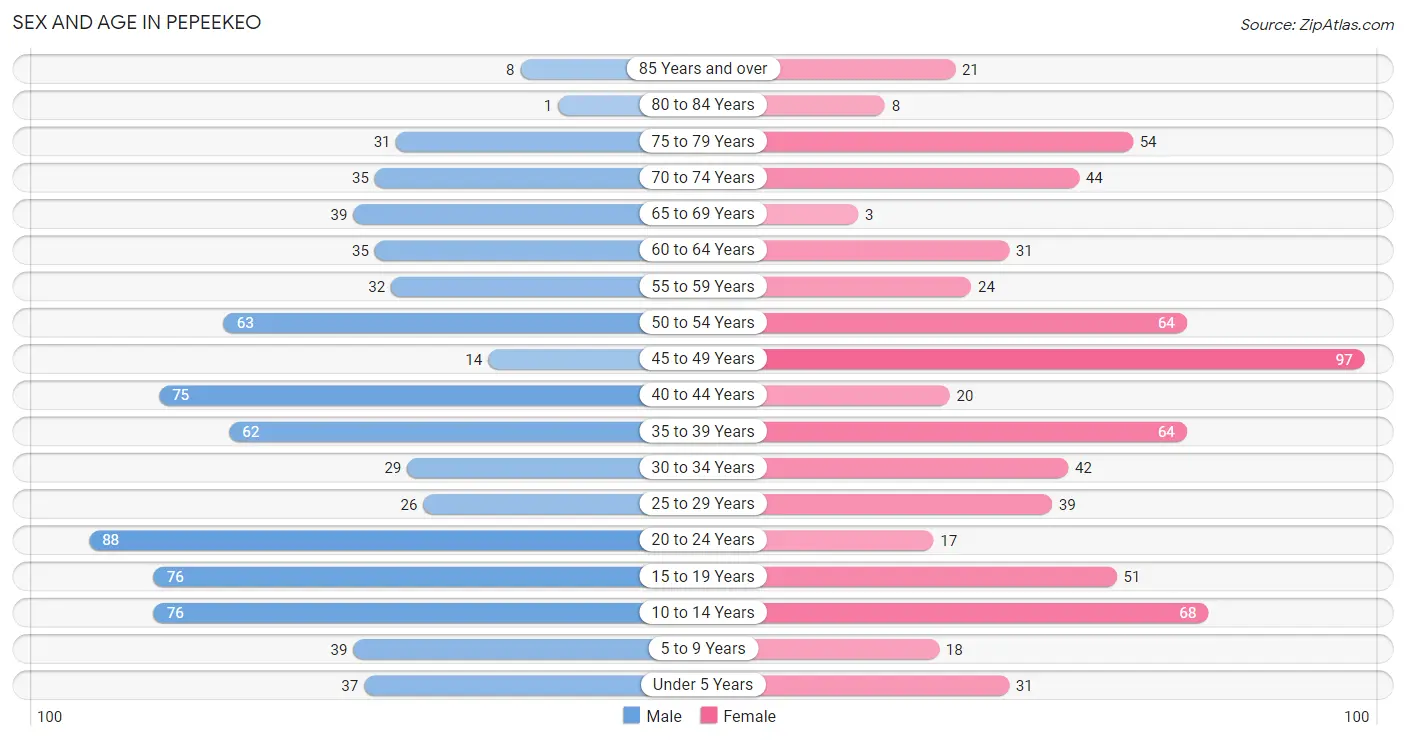
The most populous age groups in Pepeekeo are 20 to 24 Years (88 | 11.5%) for men and 45 to 49 Years (97 | 13.9%) for women.
| Age Bracket | Male | Female |
| Under 5 Years | 37 (4.8%) | 31 (4.4%) |
| 5 to 9 Years | 39 (5.1%) | 18 (2.6%) |
| 10 to 14 Years | 76 (9.9%) | 68 (9.8%) |
| 15 to 19 Years | 76 (9.9%) | 51 (7.3%) |
| 20 to 24 Years | 88 (11.5%) | 17 (2.4%) |
| 25 to 29 Years | 26 (3.4%) | 39 (5.6%) |
| 30 to 34 Years | 29 (3.8%) | 42 (6.0%) |
| 35 to 39 Years | 62 (8.1%) | 64 (9.2%) |
| 40 to 44 Years | 75 (9.8%) | 20 (2.9%) |
| 45 to 49 Years | 14 (1.8%) | 97 (13.9%) |
| 50 to 54 Years | 63 (8.2%) | 64 (9.2%) |
| 55 to 59 Years | 32 (4.2%) | 24 (3.5%) |
| 60 to 64 Years | 35 (4.6%) | 31 (4.4%) |
| 65 to 69 Years | 39 (5.1%) | 3 (0.4%) |
| 70 to 74 Years | 35 (4.6%) | 44 (6.3%) |
| 75 to 79 Years | 31 (4.1%) | 54 (7.8%) |
| 80 to 84 Years | 1 (0.1%) | 8 (1.1%) |
| 85 Years and over | 8 (1.0%) | 21 (3.0%) |
| Total | 766 (100.0%) | 696 (100.0%) |
Families and Households in Pepeekeo
Median Family Size in Pepeekeo
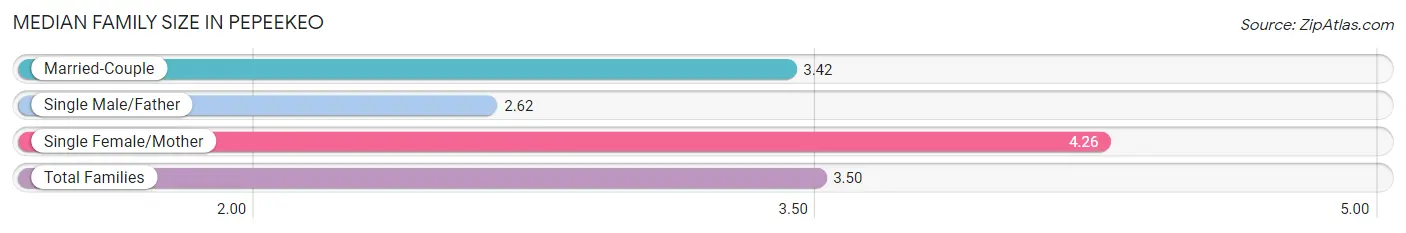
The median family size in Pepeekeo is 3.50 persons per family, with single female/mother families (69 | 20.9%) accounting for the largest median family size of 4.26 persons per family. On the other hand, single male/father families (37 | 11.2%) represent the smallest median family size with 2.62 persons per family.
| Family Type | # Families | Family Size |
| Married-Couple | 224 (67.9%) | 3.42 |
| Single Male/Father | 37 (11.2%) | 2.62 |
| Single Female/Mother | 69 (20.9%) | 4.26 |
| Total Families | 330 (100.0%) | 3.50 |
Median Household Size in Pepeekeo
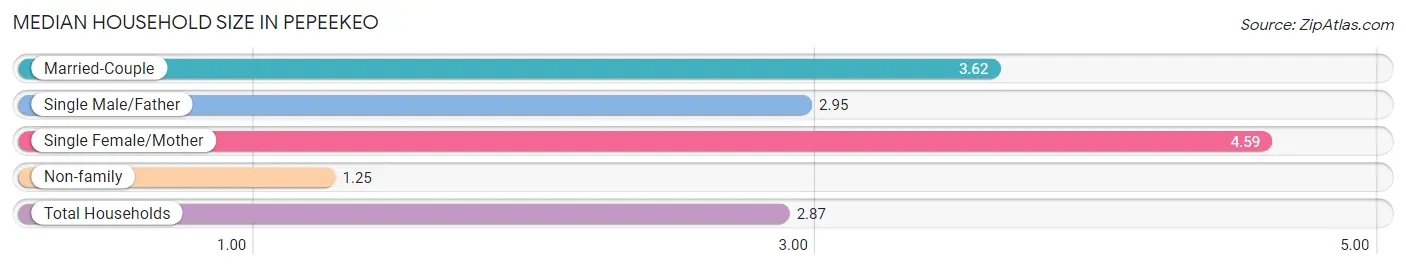
The median household size in Pepeekeo is 2.87 persons per household, with single female/mother households (69 | 13.5%) accounting for the largest median household size of 4.59 persons per household. non-family households (180 | 35.3%) represent the smallest median household size with 1.25 persons per household.
| Household Type | # Households | Household Size |
| Married-Couple | 224 (43.9%) | 3.62 |
| Single Male/Father | 37 (7.2%) | 2.95 |
| Single Female/Mother | 69 (13.5%) | 4.59 |
| Non-family | 180 (35.3%) | 1.25 |
| Total Households | 510 (100.0%) | 2.87 |
Household Size by Marriage Status in Pepeekeo
Out of a total of 510 households in Pepeekeo, 330 (64.7%) are family households, while 180 (35.3%) are nonfamily households. The most numerous type of family households are 2-person households, comprising 123, and the most common type of nonfamily households are 1-person households, comprising 128.
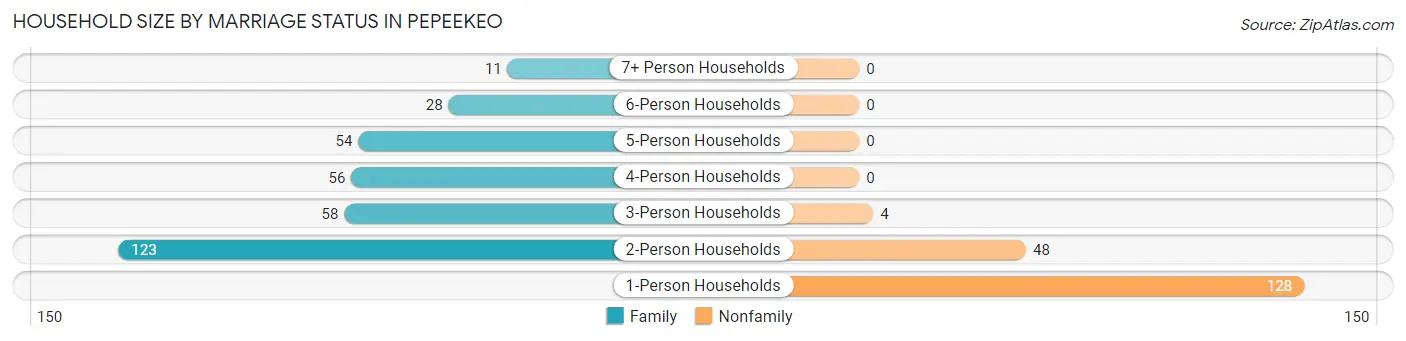
| Household Size | Family Households | Nonfamily Households |
| 1-Person Households | - | 128 (25.1%) |
| 2-Person Households | 123 (24.1%) | 48 (9.4%) |
| 3-Person Households | 58 (11.4%) | 4 (0.8%) |
| 4-Person Households | 56 (11.0%) | 0 (0.0%) |
| 5-Person Households | 54 (10.6%) | 0 (0.0%) |
| 6-Person Households | 28 (5.5%) | 0 (0.0%) |
| 7+ Person Households | 11 (2.2%) | 0 (0.0%) |
| Total | 330 (64.7%) | 180 (35.3%) |
Female Fertility in Pepeekeo
Fertility by Age in Pepeekeo
Average fertility rate in Pepeekeo is 42.0 births per 1,000 women. Women in the age bracket of 20 to 34 years have the highest fertility rate with 153.0 births per 1,000 women. Women in the age bracket of 20 to 34 years acount for 100.0% of all women with births.
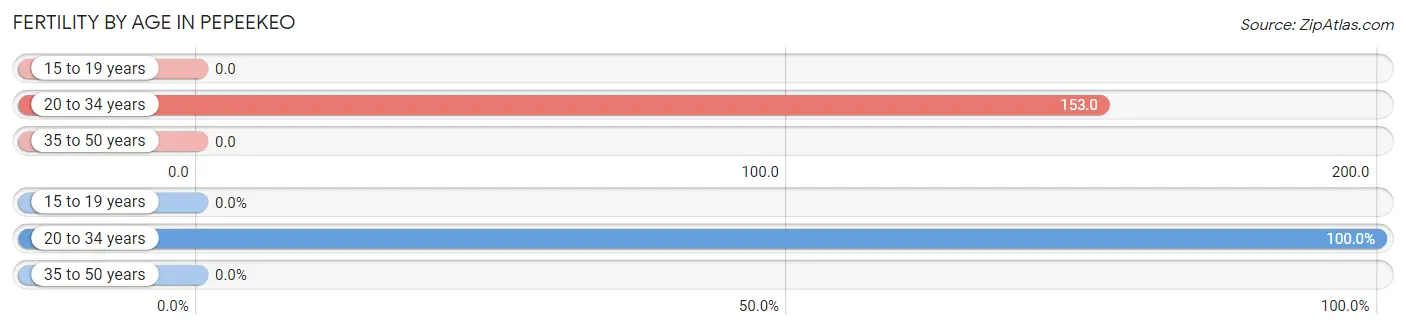
| Age Bracket | Women with Births | Births / 1,000 Women |
| 15 to 19 years | 0 (0.0%) | 0.0 |
| 20 to 34 years | 15 (100.0%) | 153.0 |
| 35 to 50 years | 0 (0.0%) | 0.0 |
| Total | 15 (100.0%) | 42.0 |
Fertility by Age by Marriage Status in Pepeekeo
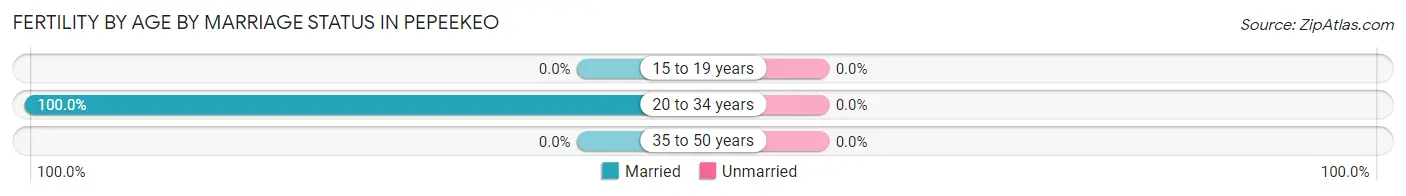
| Age Bracket | Married | Unmarried |
| 15 to 19 years | 0 (0.0%) | 0 (0.0%) |
| 20 to 34 years | 15 (100.0%) | 0 (0.0%) |
| 35 to 50 years | 0 (0.0%) | 0 (0.0%) |
| Total | 15 (100.0%) | 0 (0.0%) |
Fertility by Education in Pepeekeo
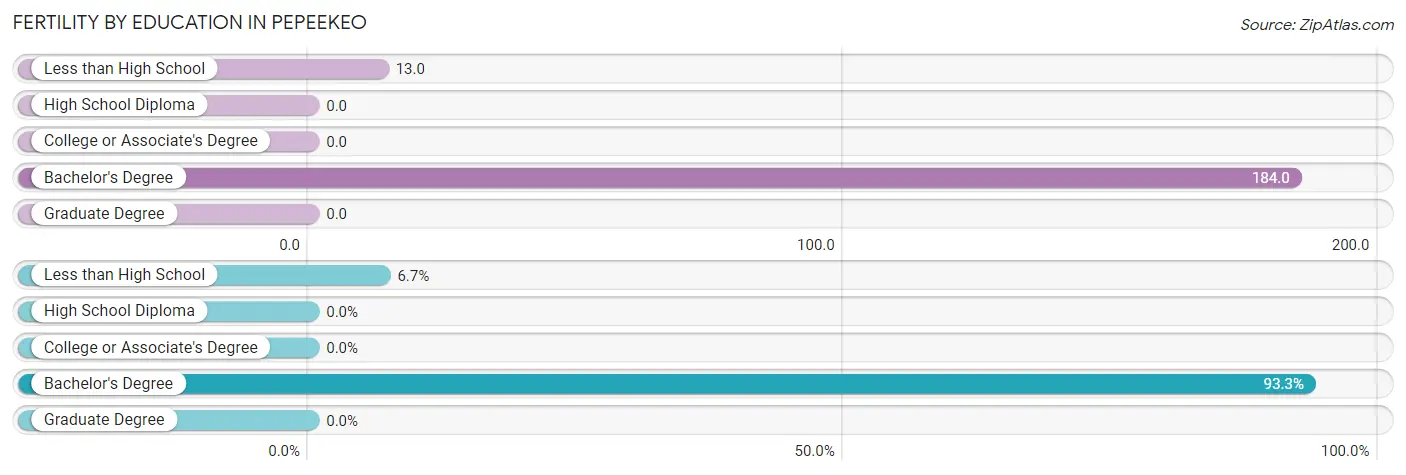
| Educational Attainment | Women with Births | Births / 1,000 Women |
| Less than High School | 1 (6.7%) | 13.0 |
| High School Diploma | 0 (0.0%) | 0.0 |
| College or Associate's Degree | 0 (0.0%) | 0.0 |
| Bachelor's Degree | 14 (93.3%) | 184.0 |
| Graduate Degree | 0 (0.0%) | 0.0 |
| Total | 15 (100.0%) | 42.0 |
Fertility by Education by Marriage Status in Pepeekeo
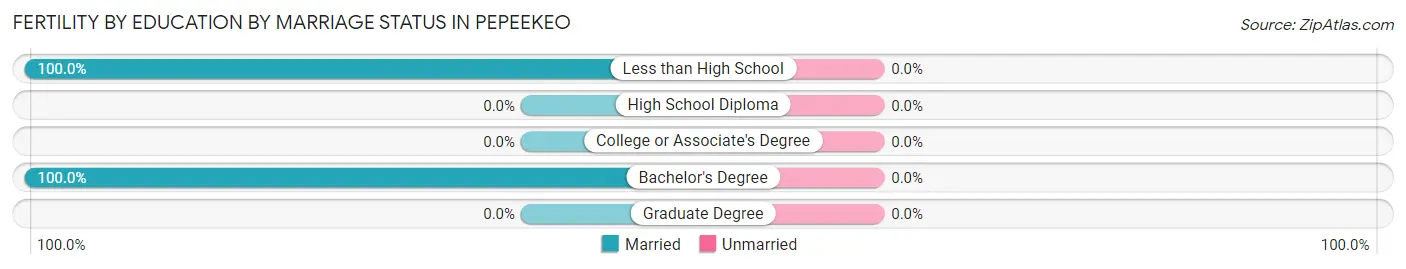
| Educational Attainment | Married | Unmarried |
| Less than High School | 1 (100.0%) | 0 (0.0%) |
| High School Diploma | 0 (0.0%) | 0 (0.0%) |
| College or Associate's Degree | 0 (0.0%) | 0 (0.0%) |
| Bachelor's Degree | 14 (100.0%) | 0 (0.0%) |
| Graduate Degree | 0 (0.0%) | 0 (0.0%) |
| Total | 15 (100.0%) | 0 (0.0%) |
Employment Characteristics in Pepeekeo
Employment by Class of Employer in Pepeekeo
Among the 625 employed individuals in Pepeekeo, private company employees (351 | 56.2%), local government employees (71 | 11.4%), and not-for-profit organizations (63 | 10.1%) make up the most common classes of employment.
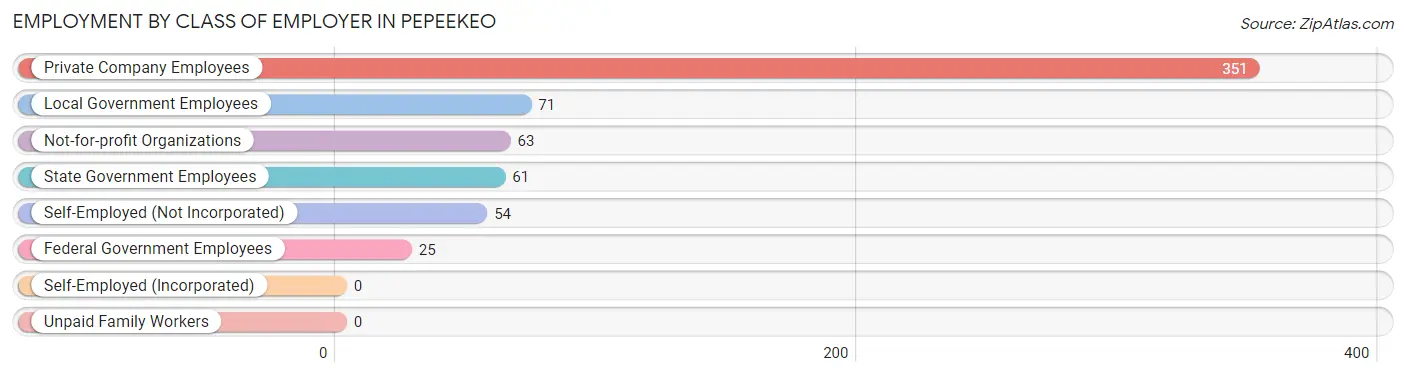
| Employer Class | # Employees | % Employees |
| Private Company Employees | 351 | 56.2% |
| Self-Employed (Incorporated) | 0 | 0.0% |
| Self-Employed (Not Incorporated) | 54 | 8.6% |
| Not-for-profit Organizations | 63 | 10.1% |
| Local Government Employees | 71 | 11.4% |
| State Government Employees | 61 | 9.8% |
| Federal Government Employees | 25 | 4.0% |
| Unpaid Family Workers | 0 | 0.0% |
| Total | 625 | 100.0% |
Employment Status by Age in Pepeekeo
According to the labor force statistics for Pepeekeo, out of the total population over 16 years of age (1,182), 59.1% or 699 individuals are in the labor force, with 8.5% or 59 of them unemployed. The age group with the highest labor force participation rate is 30 to 34 years, with 100.0% or 71 individuals in the labor force. Within the labor force, the 30 to 34 years age range has the highest percentage of unemployed individuals, with 33.8% or 24 of them being unemployed.
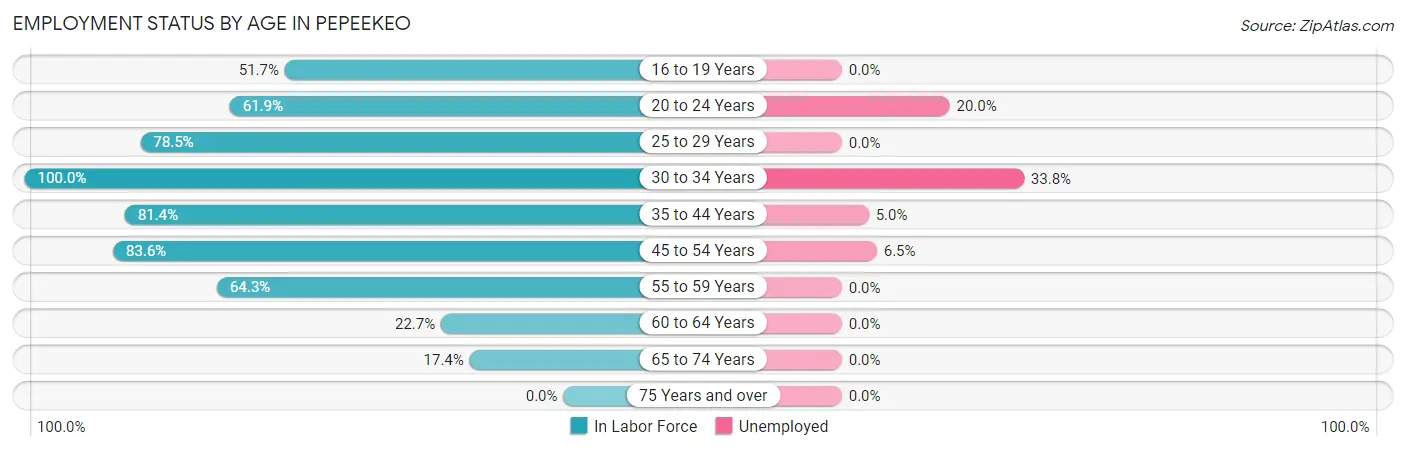
| Age Bracket | In Labor Force | Unemployed |
| 16 to 19 Years | 60 (51.7%) | 0 (0.0%) |
| 20 to 24 Years | 65 (61.9%) | 13 (20.0%) |
| 25 to 29 Years | 51 (78.5%) | 0 (0.0%) |
| 30 to 34 Years | 71 (100.0%) | 24 (33.8%) |
| 35 to 44 Years | 180 (81.4%) | 9 (5.0%) |
| 45 to 54 Years | 199 (83.6%) | 13 (6.5%) |
| 55 to 59 Years | 36 (64.3%) | 0 (0.0%) |
| 60 to 64 Years | 15 (22.7%) | 0 (0.0%) |
| 65 to 74 Years | 21 (17.4%) | 0 (0.0%) |
| 75 Years and over | 0 (0.0%) | 0 (0.0%) |
| Total | 699 (59.1%) | 59 (8.5%) |
Employment Status by Educational Attainment in Pepeekeo
According to labor force statistics for Pepeekeo, 77.0% of individuals (552) out of the total population between 25 and 64 years of age (717) are in the labor force, with 8.3% or 46 of them being unemployed. The group with the highest labor force participation rate are those with the educational attainment of bachelor's degree or higher, with 85.3% or 180 individuals in the labor force. Within the labor force, individuals with less than high school education have the highest percentage of unemployment, with 27.7% or 13 of them being unemployed.
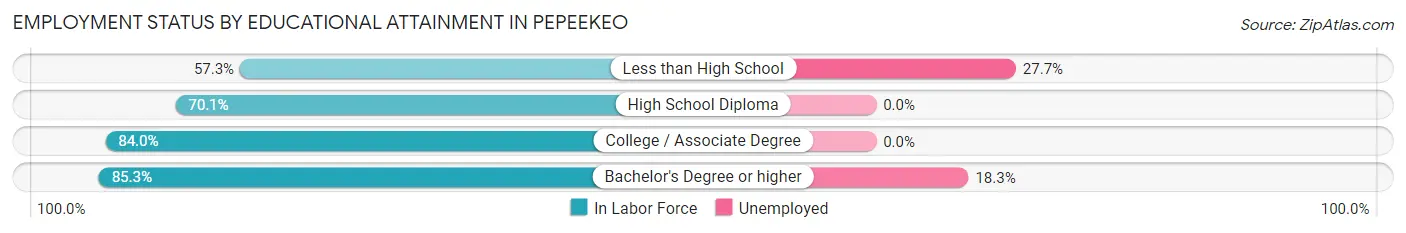
| Educational Attainment | In Labor Force | Unemployed |
| Less than High School | 47 (57.3%) | 23 (27.7%) |
| High School Diploma | 157 (70.1%) | 0 (0.0%) |
| College / Associate Degree | 168 (84.0%) | 0 (0.0%) |
| Bachelor's Degree or higher | 180 (85.3%) | 39 (18.3%) |
| Total | 552 (77.0%) | 60 (8.3%) |
Employment Occupations by Sex in Pepeekeo
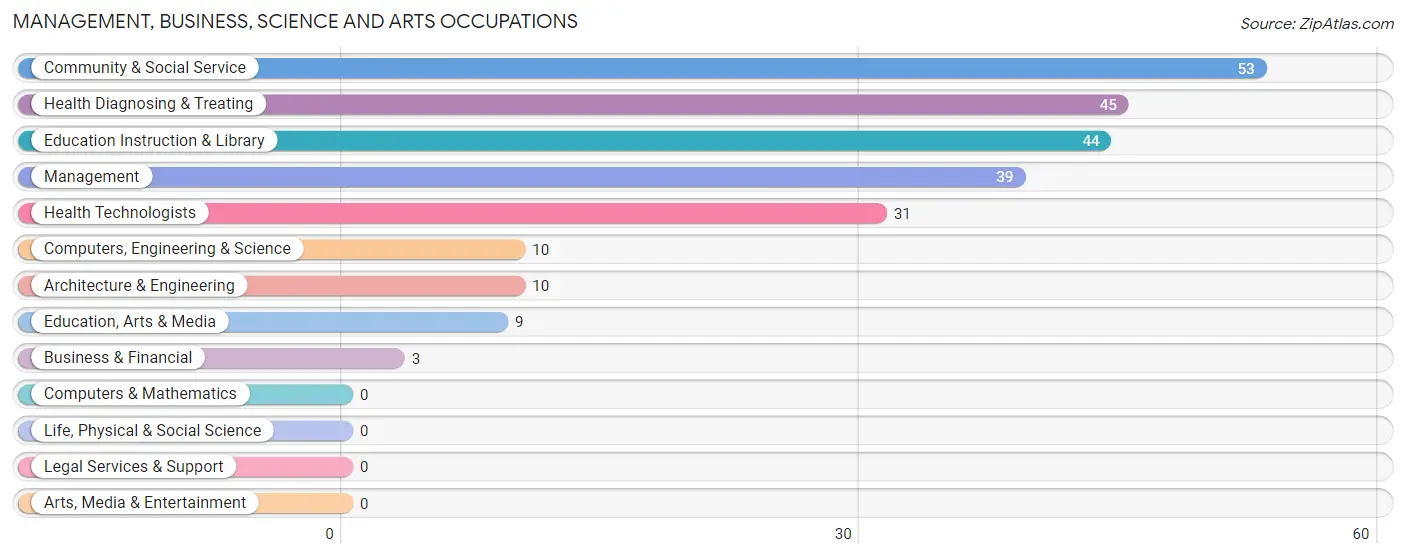
Management, Business, Science and Arts Occupations
The most common Management, Business, Science and Arts occupations in Pepeekeo are Community & Social Service (53 | 8.3%), Health Diagnosing & Treating (45 | 7.0%), Education Instruction & Library (44 | 6.9%), Management (39 | 6.1%), and Health Technologists (31 | 4.9%).
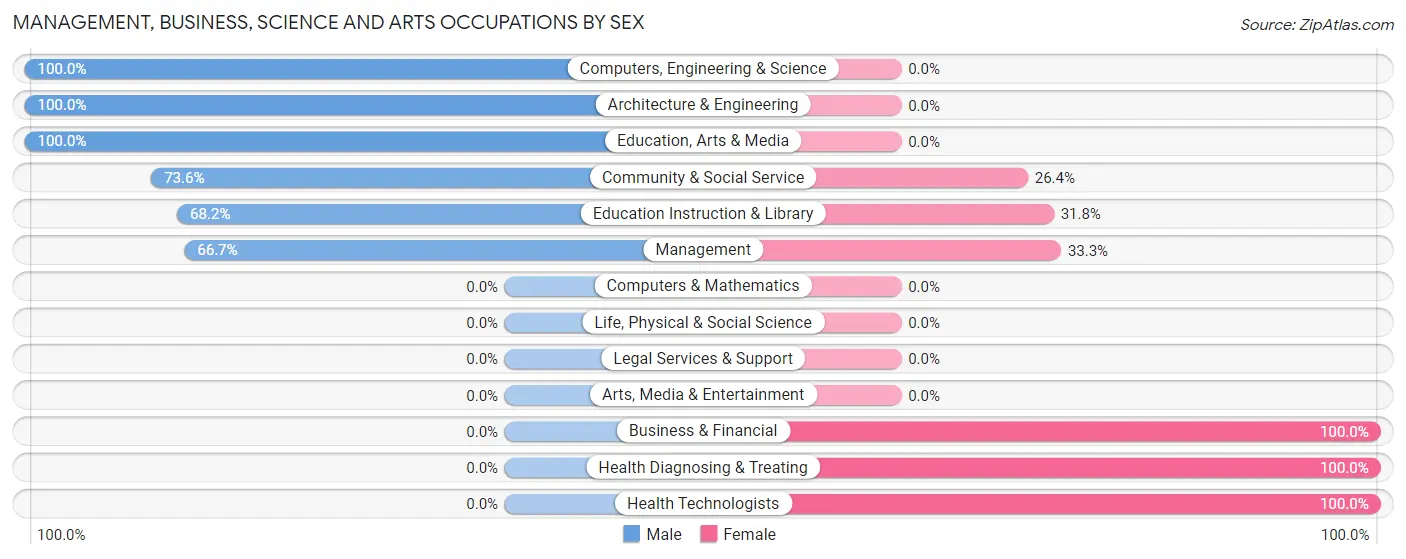
Management, Business, Science and Arts Occupations by Sex
Within the Management, Business, Science and Arts occupations in Pepeekeo, the most male-oriented occupations are Computers, Engineering & Science (100.0%), Architecture & Engineering (100.0%), and Education, Arts & Media (100.0%), while the most female-oriented occupations are Business & Financial (100.0%), Health Diagnosing & Treating (100.0%), and Health Technologists (100.0%).
| Occupation | Male | Female |
| Management | 26 (66.7%) | 13 (33.3%) |
| Business & Financial | 0 (0.0%) | 3 (100.0%) |
| Computers, Engineering & Science | 10 (100.0%) | 0 (0.0%) |
| Computers & Mathematics | 0 (0.0%) | 0 (0.0%) |
| Architecture & Engineering | 10 (100.0%) | 0 (0.0%) |
| Life, Physical & Social Science | 0 (0.0%) | 0 (0.0%) |
| Community & Social Service | 39 (73.6%) | 14 (26.4%) |
| Education, Arts & Media | 9 (100.0%) | 0 (0.0%) |
| Legal Services & Support | 0 (0.0%) | 0 (0.0%) |
| Education Instruction & Library | 30 (68.2%) | 14 (31.8%) |
| Arts, Media & Entertainment | 0 (0.0%) | 0 (0.0%) |
| Health Diagnosing & Treating | 0 (0.0%) | 45 (100.0%) |
| Health Technologists | 0 (0.0%) | 31 (100.0%) |
| Total (Category) | 75 (50.0%) | 75 (50.0%) |
| Total (Overall) | 352 (55.1%) | 287 (44.9%) |
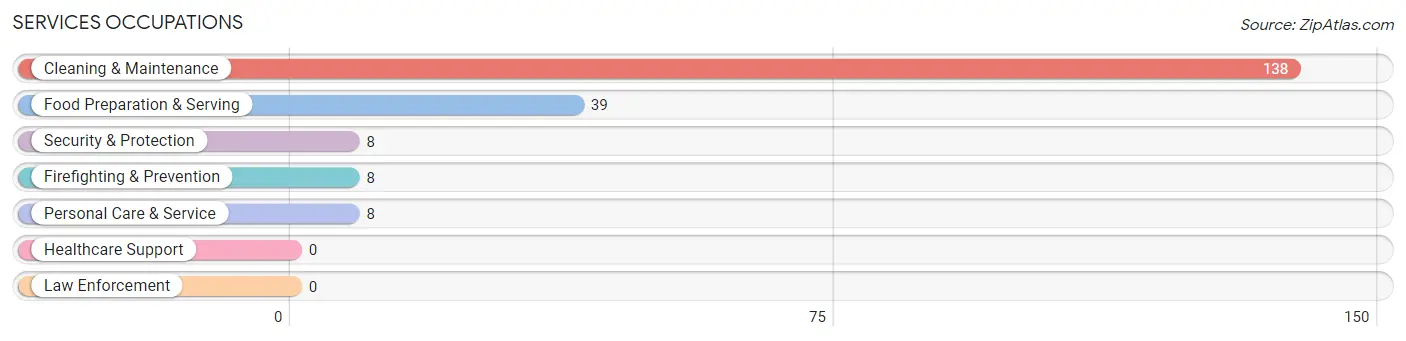
Services Occupations
The most common Services occupations in Pepeekeo are Cleaning & Maintenance (138 | 21.6%), Food Preparation & Serving (39 | 6.1%), Security & Protection (8 | 1.3%), Firefighting & Prevention (8 | 1.3%), and Personal Care & Service (8 | 1.3%).
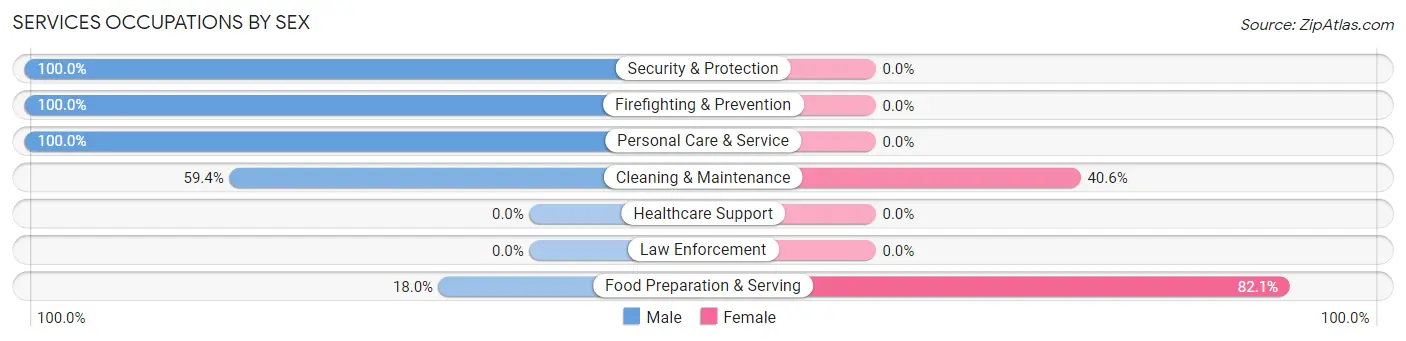
Services Occupations by Sex
Within the Services occupations in Pepeekeo, the most male-oriented occupations are Security & Protection (100.0%), Firefighting & Prevention (100.0%), and Personal Care & Service (100.0%), while the most female-oriented occupations are Food Preparation & Serving (82.1%), and Cleaning & Maintenance (40.6%).
| Occupation | Male | Female |
| Healthcare Support | 0 (0.0%) | 0 (0.0%) |
| Security & Protection | 8 (100.0%) | 0 (0.0%) |
| Firefighting & Prevention | 8 (100.0%) | 0 (0.0%) |
| Law Enforcement | 0 (0.0%) | 0 (0.0%) |
| Food Preparation & Serving | 7 (17.9%) | 32 (82.1%) |
| Cleaning & Maintenance | 82 (59.4%) | 56 (40.6%) |
| Personal Care & Service | 8 (100.0%) | 0 (0.0%) |
| Total (Category) | 105 (54.4%) | 88 (45.6%) |
| Total (Overall) | 352 (55.1%) | 287 (44.9%) |
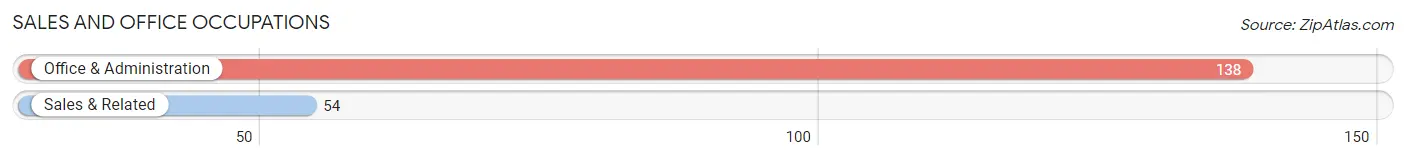
Sales and Office Occupations
The most common Sales and Office occupations in Pepeekeo are Office & Administration (138 | 21.6%), and Sales & Related (54 | 8.5%).
Sales and Office Occupations by Sex
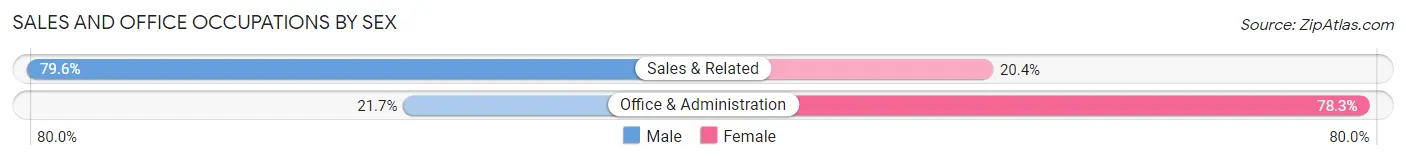
| Occupation | Male | Female |
| Sales & Related | 43 (79.6%) | 11 (20.4%) |
| Office & Administration | 30 (21.7%) | 108 (78.3%) |
| Total (Category) | 73 (38.0%) | 119 (62.0%) |
| Total (Overall) | 352 (55.1%) | 287 (44.9%) |
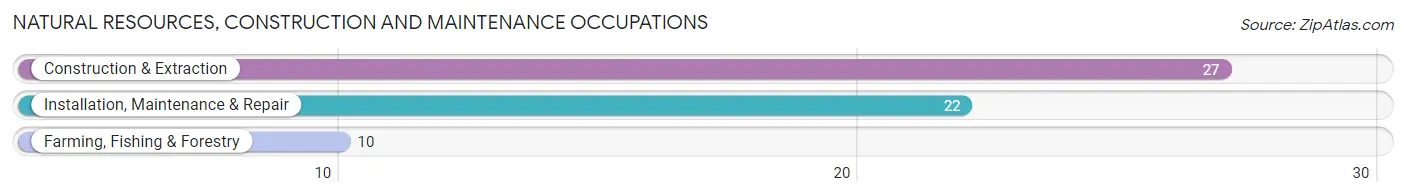
Natural Resources, Construction and Maintenance Occupations
The most common Natural Resources, Construction and Maintenance occupations in Pepeekeo are Construction & Extraction (27 | 4.2%), Installation, Maintenance & Repair (22 | 3.4%), and Farming, Fishing & Forestry (10 | 1.6%).
Natural Resources, Construction and Maintenance Occupations by Sex
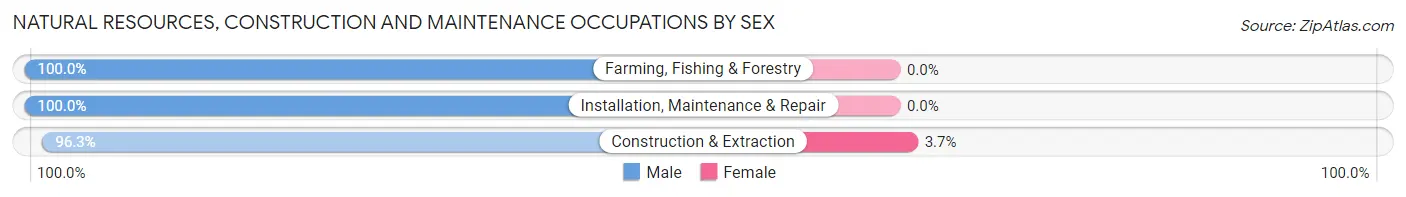
| Occupation | Male | Female |
| Farming, Fishing & Forestry | 10 (100.0%) | 0 (0.0%) |
| Construction & Extraction | 26 (96.3%) | 1 (3.7%) |
| Installation, Maintenance & Repair | 22 (100.0%) | 0 (0.0%) |
| Total (Category) | 58 (98.3%) | 1 (1.7%) |
| Total (Overall) | 352 (55.1%) | 287 (44.9%) |
Production, Transportation and Moving Occupations
The most common Production, Transportation and Moving occupations in Pepeekeo are Production (27 | 4.2%), and Transportation (18 | 2.8%).
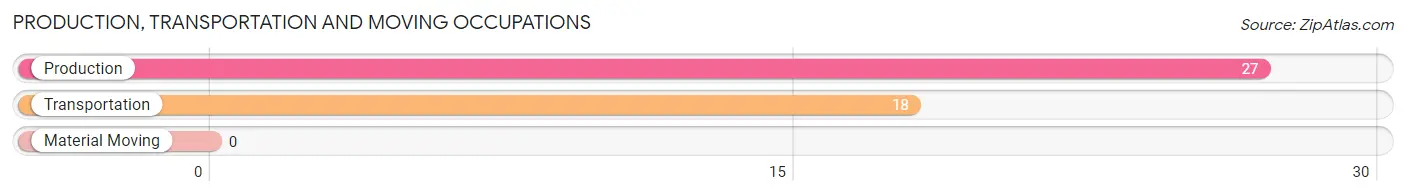
Production, Transportation and Moving Occupations by Sex
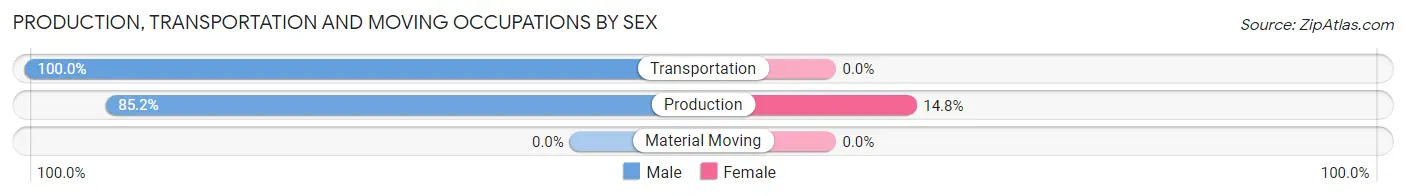
| Occupation | Male | Female |
| Production | 23 (85.2%) | 4 (14.8%) |
| Transportation | 18 (100.0%) | 0 (0.0%) |
| Material Moving | 0 (0.0%) | 0 (0.0%) |
| Total (Category) | 41 (91.1%) | 4 (8.9%) |
| Total (Overall) | 352 (55.1%) | 287 (44.9%) |
Employment Industries by Sex in Pepeekeo
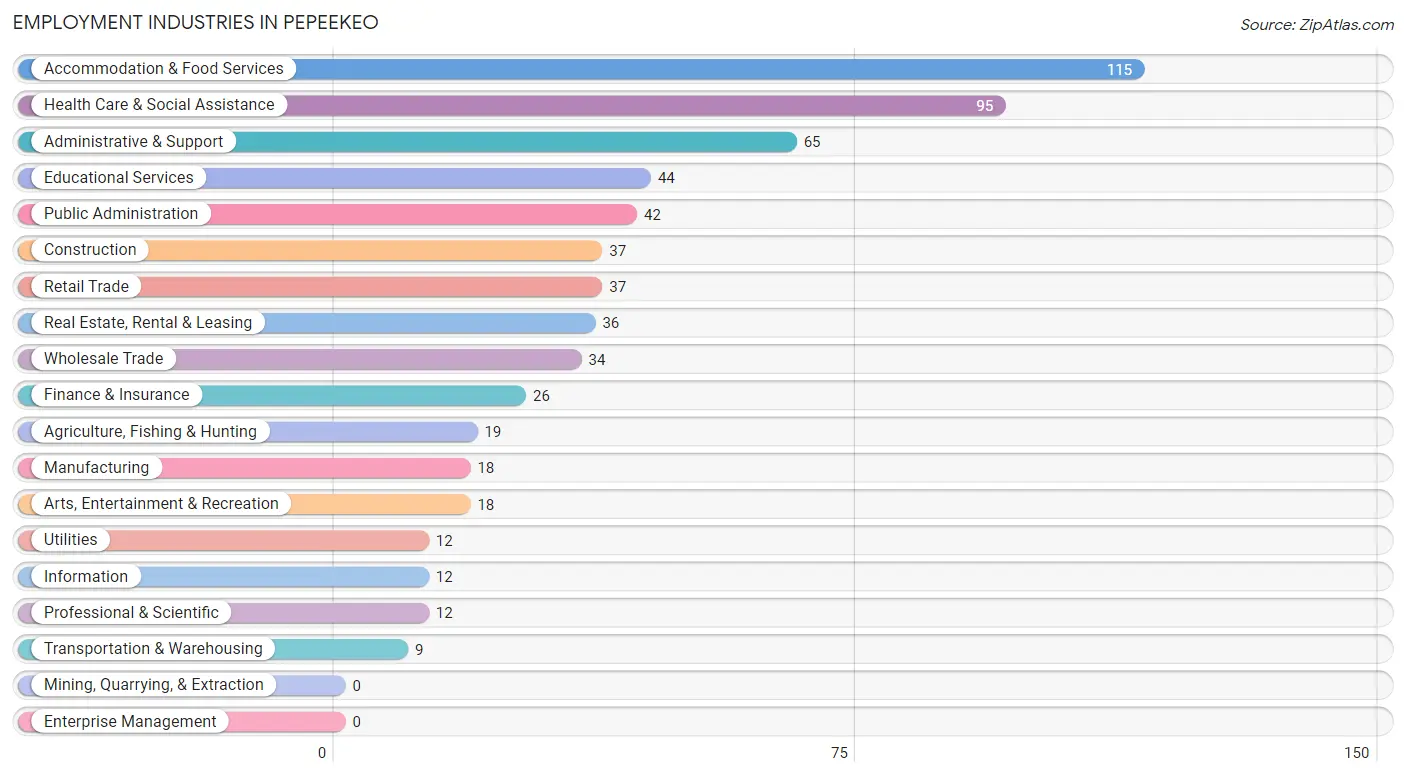
Employment Industries in Pepeekeo
The major employment industries in Pepeekeo include Accommodation & Food Services (115 | 18.0%), Health Care & Social Assistance (95 | 14.9%), Administrative & Support (65 | 10.2%), Educational Services (44 | 6.9%), and Public Administration (42 | 6.6%).
Employment Industries by Sex in Pepeekeo
The Pepeekeo industries that see more men than women are Agriculture, Fishing & Hunting (100.0%), Wholesale Trade (100.0%), and Transportation & Warehousing (100.0%), whereas the industries that tend to have a higher number of women are Information (100.0%), Professional & Scientific (100.0%), and Health Care & Social Assistance (90.5%).
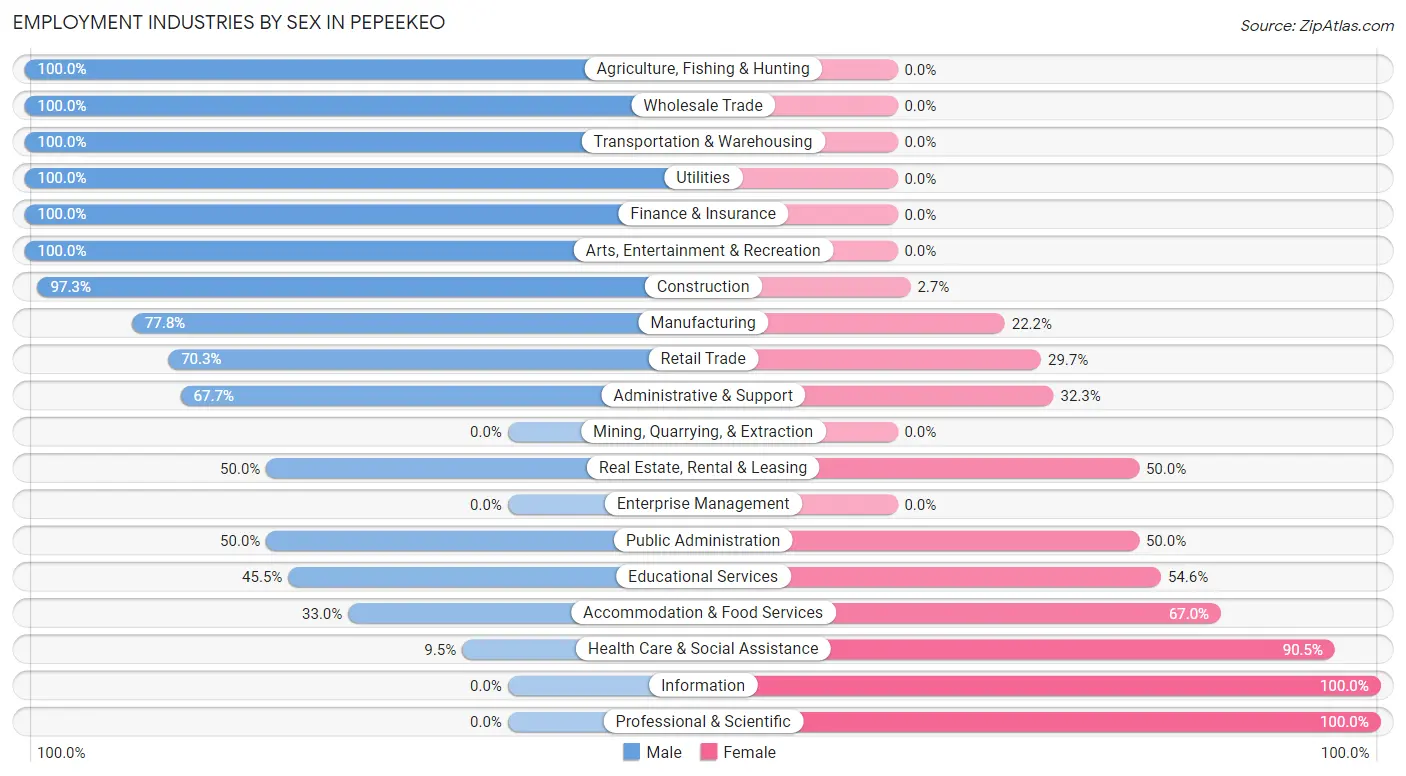
| Industry | Male | Female |
| Agriculture, Fishing & Hunting | 19 (100.0%) | 0 (0.0%) |
| Mining, Quarrying, & Extraction | 0 (0.0%) | 0 (0.0%) |
| Construction | 36 (97.3%) | 1 (2.7%) |
| Manufacturing | 14 (77.8%) | 4 (22.2%) |
| Wholesale Trade | 34 (100.0%) | 0 (0.0%) |
| Retail Trade | 26 (70.3%) | 11 (29.7%) |
| Transportation & Warehousing | 9 (100.0%) | 0 (0.0%) |
| Utilities | 12 (100.0%) | 0 (0.0%) |
| Information | 0 (0.0%) | 12 (100.0%) |
| Finance & Insurance | 26 (100.0%) | 0 (0.0%) |
| Real Estate, Rental & Leasing | 18 (50.0%) | 18 (50.0%) |
| Professional & Scientific | 0 (0.0%) | 12 (100.0%) |
| Enterprise Management | 0 (0.0%) | 0 (0.0%) |
| Administrative & Support | 44 (67.7%) | 21 (32.3%) |
| Educational Services | 20 (45.5%) | 24 (54.5%) |
| Health Care & Social Assistance | 9 (9.5%) | 86 (90.5%) |
| Arts, Entertainment & Recreation | 18 (100.0%) | 0 (0.0%) |
| Accommodation & Food Services | 38 (33.0%) | 77 (67.0%) |
| Public Administration | 21 (50.0%) | 21 (50.0%) |
| Total | 352 (55.1%) | 287 (44.9%) |
Education in Pepeekeo
School Enrollment in Pepeekeo
The most common levels of schooling among the 321 students in Pepeekeo are middle school (136 | 42.4%), high school (90 | 28.0%), and elementary school (42 | 13.1%).
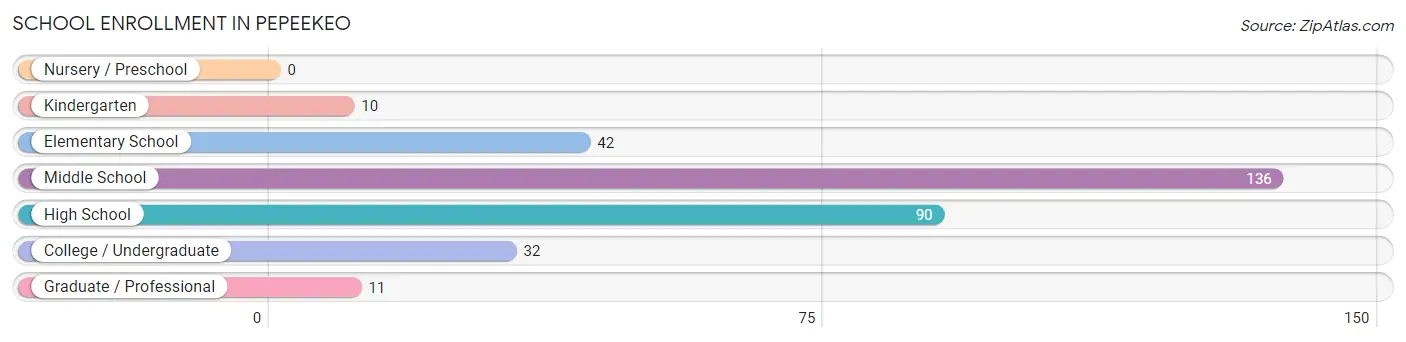
| School Level | # Students | % Students |
| Nursery / Preschool | 0 | 0.0% |
| Kindergarten | 10 | 3.1% |
| Elementary School | 42 | 13.1% |
| Middle School | 136 | 42.4% |
| High School | 90 | 28.0% |
| College / Undergraduate | 32 | 10.0% |
| Graduate / Professional | 11 | 3.4% |
| Total | 321 | 100.0% |
School Enrollment by Age by Funding Source in Pepeekeo
Out of a total of 321 students who are enrolled in schools in Pepeekeo, 34 (10.6%) attend a private institution, while the remaining 287 (89.4%) are enrolled in public schools. The age group of 35 years and over has the highest likelihood of being enrolled in private schools, with 8 (40.0% in the age bracket) enrolled. Conversely, the age group of 10 to 14 year olds has the lowest likelihood of being enrolled in a private school, with 144 (100.0% in the age bracket) attending a public institution.
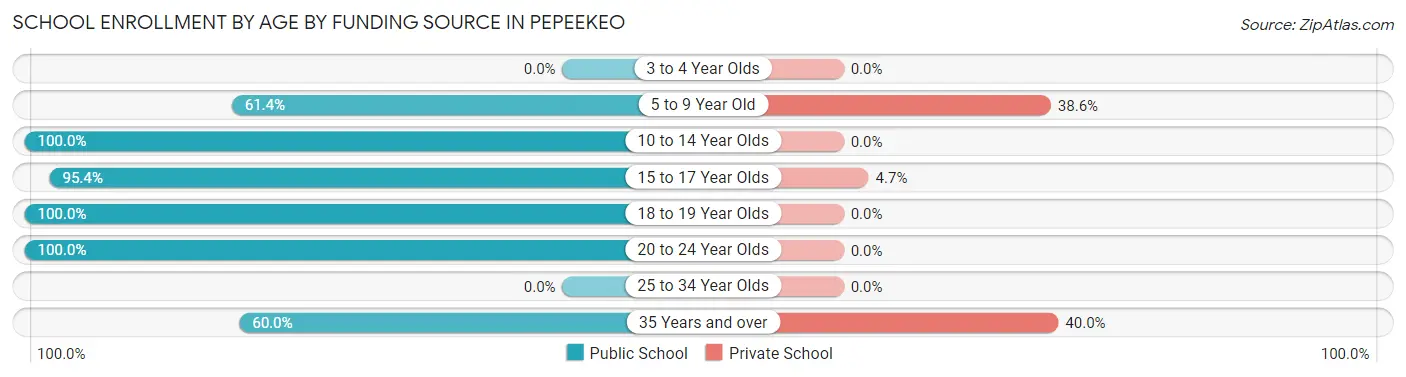
| Age Bracket | Public School | Private School |
| 3 to 4 Year Olds | 0 (0.0%) | 0 (0.0%) |
| 5 to 9 Year Old | 35 (61.4%) | 22 (38.6%) |
| 10 to 14 Year Olds | 144 (100.0%) | 0 (0.0%) |
| 15 to 17 Year Olds | 82 (95.4%) | 4 (4.6%) |
| 18 to 19 Year Olds | 2 (100.0%) | 0 (0.0%) |
| 20 to 24 Year Olds | 12 (100.0%) | 0 (0.0%) |
| 25 to 34 Year Olds | 0 (0.0%) | 0 (0.0%) |
| 35 Years and over | 12 (60.0%) | 8 (40.0%) |
| Total | 287 (89.4%) | 34 (10.6%) |
Educational Attainment by Field of Study in Pepeekeo
Social sciences (53 | 21.0%), science & technology (48 | 19.1%), business (41 | 16.3%), physical & health sciences (30 | 11.9%), and psychology (22 | 8.7%) are the most common fields of study among 252 individuals in Pepeekeo who have obtained a bachelor's degree or higher.
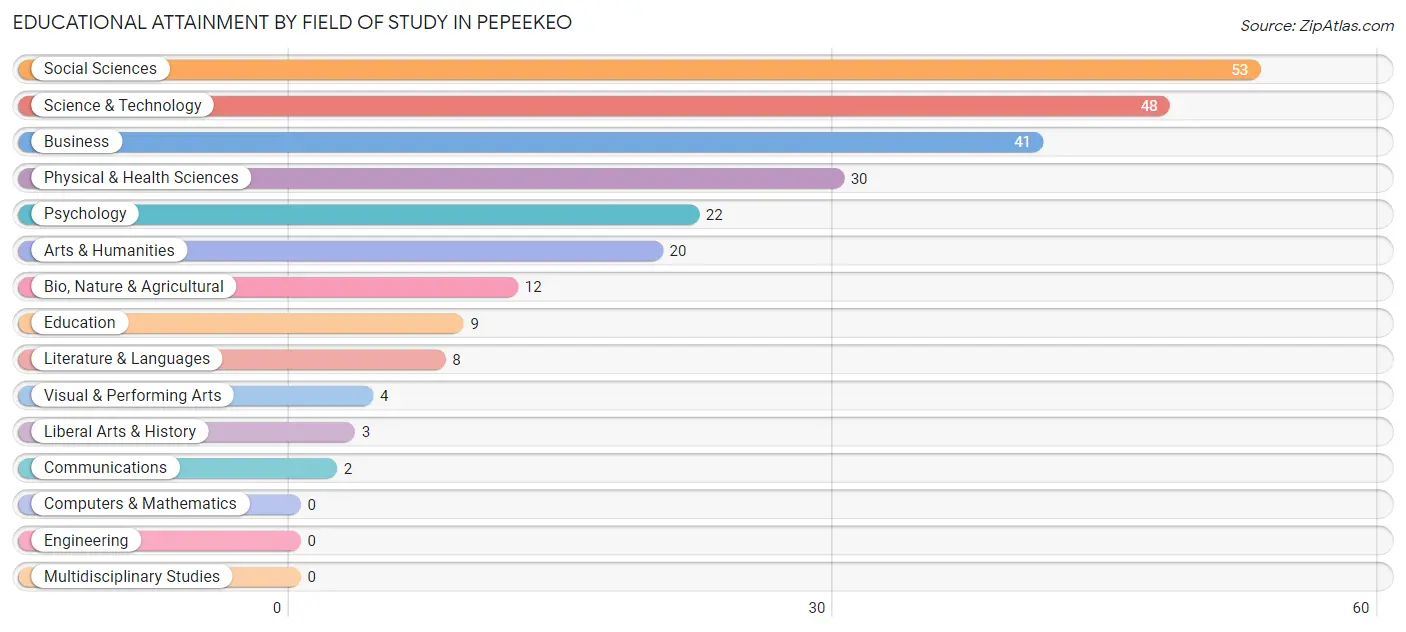
| Field of Study | # Graduates | % Graduates |
| Computers & Mathematics | 0 | 0.0% |
| Bio, Nature & Agricultural | 12 | 4.8% |
| Physical & Health Sciences | 30 | 11.9% |
| Psychology | 22 | 8.7% |
| Social Sciences | 53 | 21.0% |
| Engineering | 0 | 0.0% |
| Multidisciplinary Studies | 0 | 0.0% |
| Science & Technology | 48 | 19.1% |
| Business | 41 | 16.3% |
| Education | 9 | 3.6% |
| Literature & Languages | 8 | 3.2% |
| Liberal Arts & History | 3 | 1.2% |
| Visual & Performing Arts | 4 | 1.6% |
| Communications | 2 | 0.8% |
| Arts & Humanities | 20 | 7.9% |
| Total | 252 | 100.0% |
Transportation & Commute in Pepeekeo
Vehicle Availability by Sex in Pepeekeo
The most prevalent vehicle ownership categories in Pepeekeo are males with 2 vehicles (125, accounting for 35.5%) and females with 2 vehicles (119, making up 45.8%).
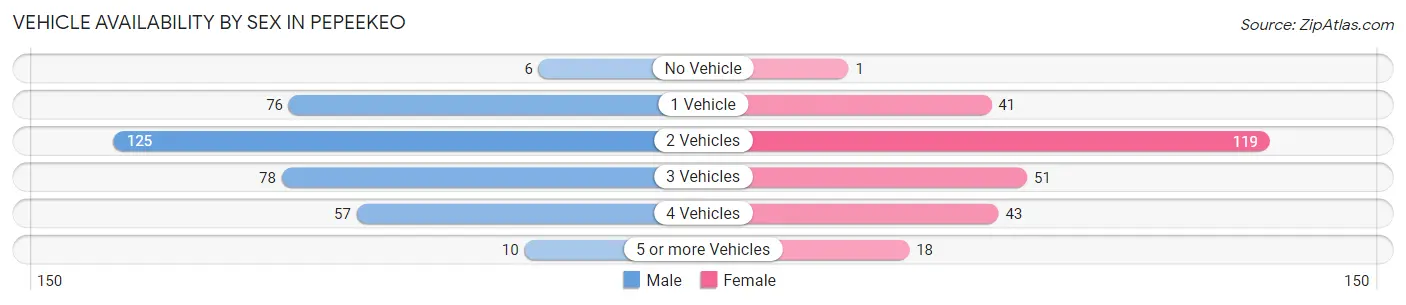
| Vehicles Available | Male | Female |
| No Vehicle | 6 (1.7%) | 1 (0.4%) |
| 1 Vehicle | 76 (21.6%) | 41 (15.0%) |
| 2 Vehicles | 125 (35.5%) | 119 (43.6%) |
| 3 Vehicles | 78 (22.2%) | 51 (18.7%) |
| 4 Vehicles | 57 (16.2%) | 43 (15.8%) |
| 5 or more Vehicles | 10 (2.8%) | 18 (6.6%) |
| Total | 352 (100.0%) | 273 (100.0%) |
Commute Time in Pepeekeo
The most frequently occuring commute durations in Pepeekeo are 15 to 19 minutes (146 commuters, 25.4%), 90 or more minutes (108 commuters, 18.8%), and 20 to 24 minutes (79 commuters, 13.7%).
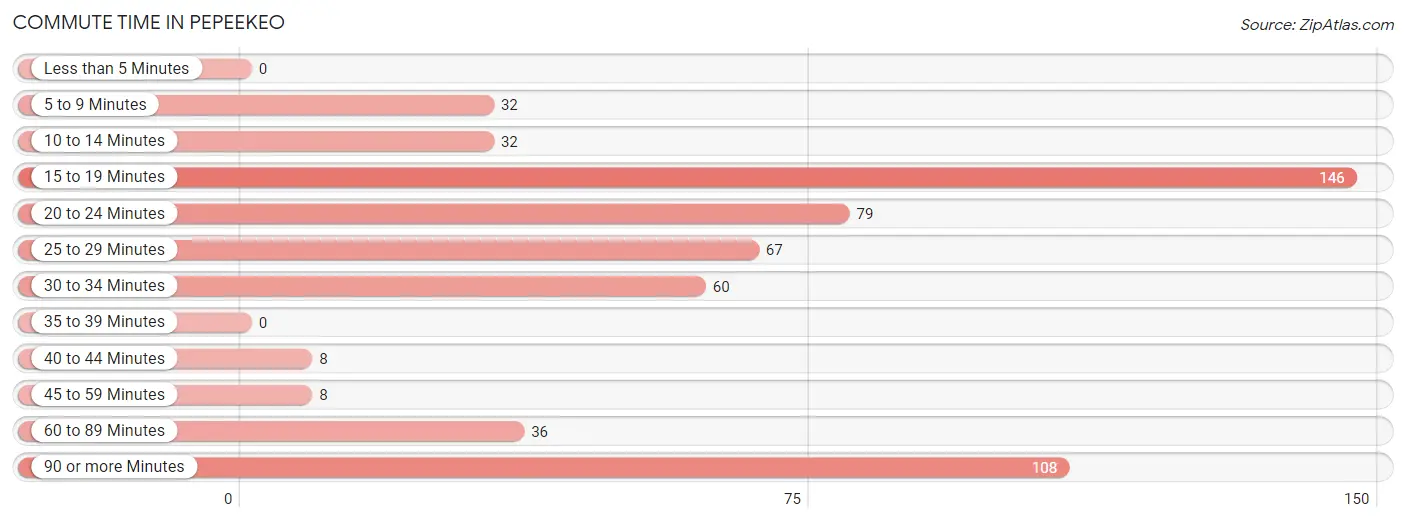
| Commute Time | # Commuters | % Commuters |
| Less than 5 Minutes | 0 | 0.0% |
| 5 to 9 Minutes | 32 | 5.6% |
| 10 to 14 Minutes | 32 | 5.6% |
| 15 to 19 Minutes | 146 | 25.4% |
| 20 to 24 Minutes | 79 | 13.7% |
| 25 to 29 Minutes | 67 | 11.6% |
| 30 to 34 Minutes | 60 | 10.4% |
| 35 to 39 Minutes | 0 | 0.0% |
| 40 to 44 Minutes | 8 | 1.4% |
| 45 to 59 Minutes | 8 | 1.4% |
| 60 to 89 Minutes | 36 | 6.2% |
| 90 or more Minutes | 108 | 18.8% |
Commute Time by Sex in Pepeekeo
The most common commute times in Pepeekeo are 15 to 19 minutes (62 commuters, 18.8%) for males and 15 to 19 minutes (84 commuters, 34.0%) for females.
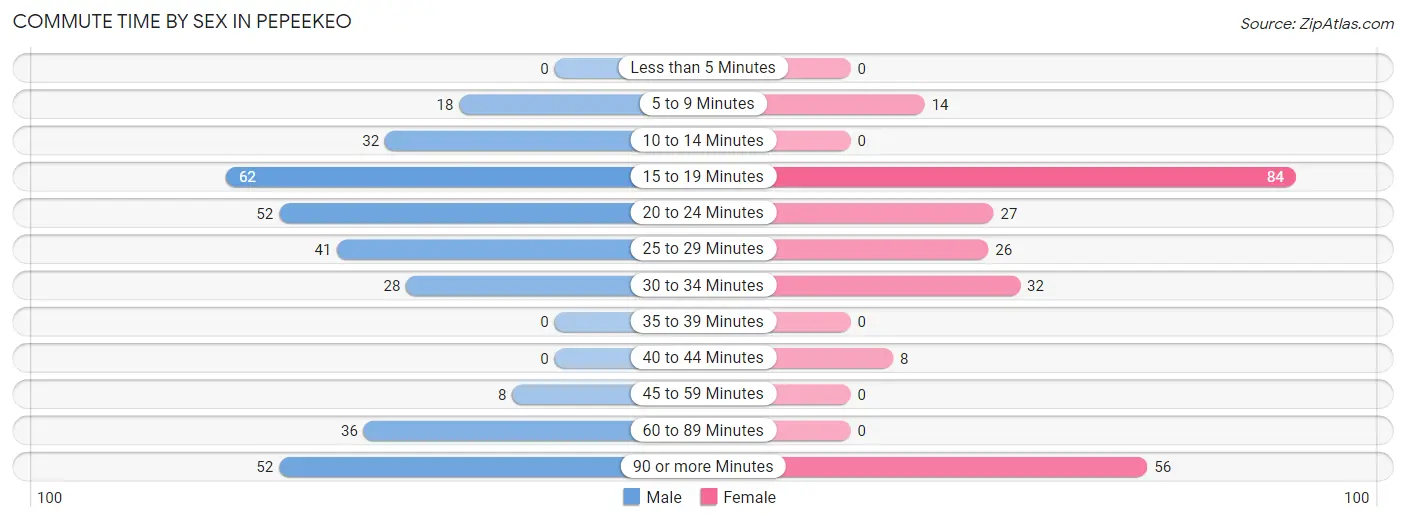
| Commute Time | Male | Female |
| Less than 5 Minutes | 0 (0.0%) | 0 (0.0%) |
| 5 to 9 Minutes | 18 (5.5%) | 14 (5.7%) |
| 10 to 14 Minutes | 32 (9.7%) | 0 (0.0%) |
| 15 to 19 Minutes | 62 (18.8%) | 84 (34.0%) |
| 20 to 24 Minutes | 52 (15.8%) | 27 (10.9%) |
| 25 to 29 Minutes | 41 (12.5%) | 26 (10.5%) |
| 30 to 34 Minutes | 28 (8.5%) | 32 (13.0%) |
| 35 to 39 Minutes | 0 (0.0%) | 0 (0.0%) |
| 40 to 44 Minutes | 0 (0.0%) | 8 (3.2%) |
| 45 to 59 Minutes | 8 (2.4%) | 0 (0.0%) |
| 60 to 89 Minutes | 36 (10.9%) | 0 (0.0%) |
| 90 or more Minutes | 52 (15.8%) | 56 (22.7%) |
Time of Departure to Work by Sex in Pepeekeo
The most frequent times of departure to work in Pepeekeo are 6:30 AM to 6:59 AM (62, 18.8%) for males and 7:00 AM to 7:29 AM (60, 24.3%) for females.
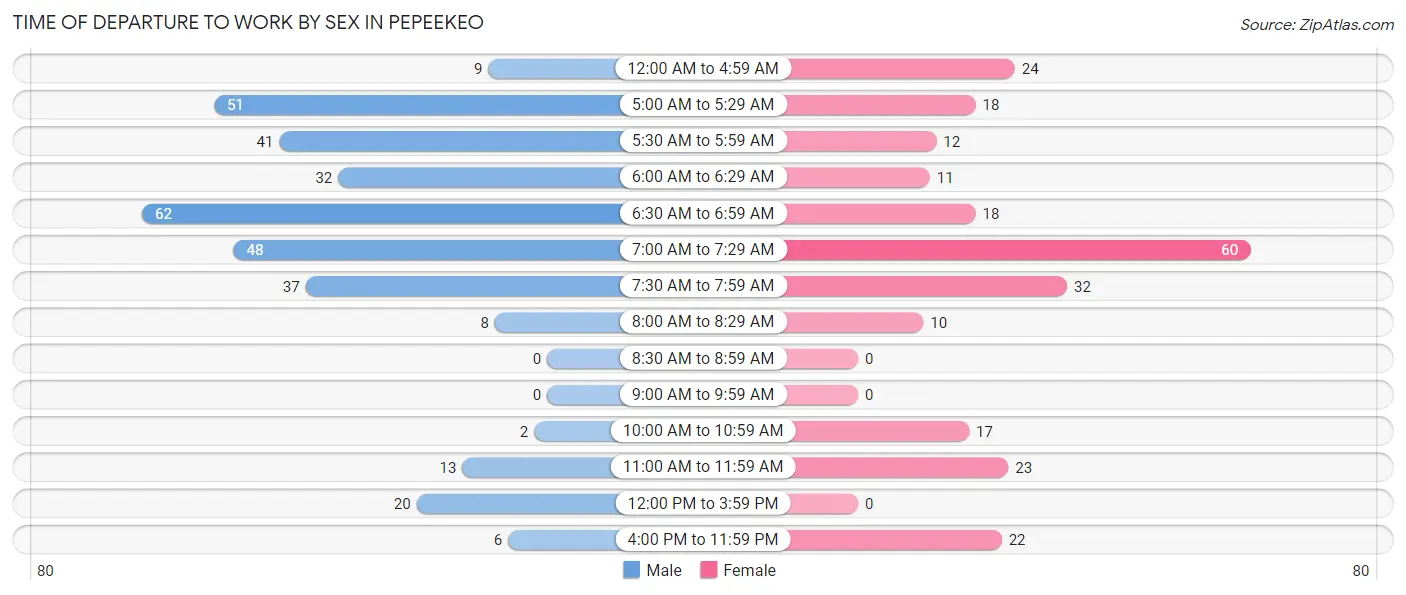
| Time of Departure | Male | Female |
| 12:00 AM to 4:59 AM | 9 (2.7%) | 24 (9.7%) |
| 5:00 AM to 5:29 AM | 51 (15.5%) | 18 (7.3%) |
| 5:30 AM to 5:59 AM | 41 (12.5%) | 12 (4.9%) |
| 6:00 AM to 6:29 AM | 32 (9.7%) | 11 (4.4%) |
| 6:30 AM to 6:59 AM | 62 (18.8%) | 18 (7.3%) |
| 7:00 AM to 7:29 AM | 48 (14.6%) | 60 (24.3%) |
| 7:30 AM to 7:59 AM | 37 (11.3%) | 32 (13.0%) |
| 8:00 AM to 8:29 AM | 8 (2.4%) | 10 (4.1%) |
| 8:30 AM to 8:59 AM | 0 (0.0%) | 0 (0.0%) |
| 9:00 AM to 9:59 AM | 0 (0.0%) | 0 (0.0%) |
| 10:00 AM to 10:59 AM | 2 (0.6%) | 17 (6.9%) |
| 11:00 AM to 11:59 AM | 13 (4.0%) | 23 (9.3%) |
| 12:00 PM to 3:59 PM | 20 (6.1%) | 0 (0.0%) |
| 4:00 PM to 11:59 PM | 6 (1.8%) | 22 (8.9%) |
| Total | 329 (100.0%) | 247 (100.0%) |
Housing Occupancy in Pepeekeo
Occupancy by Ownership in Pepeekeo
Of the total 510 dwellings in Pepeekeo, owner-occupied units account for 261 (51.2%), while renter-occupied units make up 249 (48.8%).
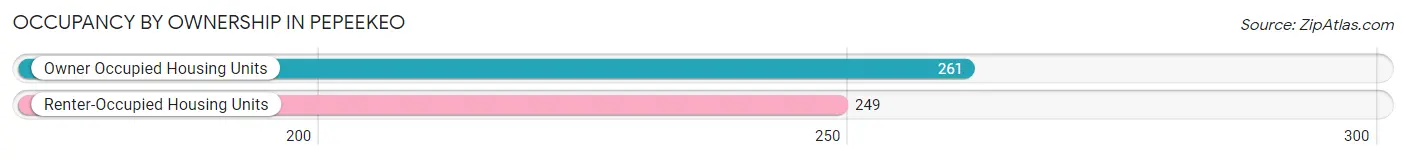
| Occupancy | # Housing Units | % Housing Units |
| Owner Occupied Housing Units | 261 | 51.2% |
| Renter-Occupied Housing Units | 249 | 48.8% |
| Total Occupied Housing Units | 510 | 100.0% |
Occupancy by Household Size in Pepeekeo
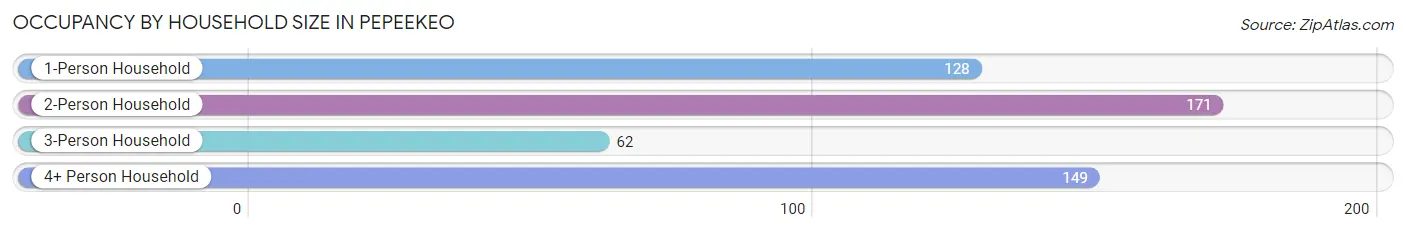
| Household Size | # Housing Units | % Housing Units |
| 1-Person Household | 128 | 25.1% |
| 2-Person Household | 171 | 33.5% |
| 3-Person Household | 62 | 12.2% |
| 4+ Person Household | 149 | 29.2% |
| Total Housing Units | 510 | 100.0% |
Occupancy by Ownership by Household Size in Pepeekeo
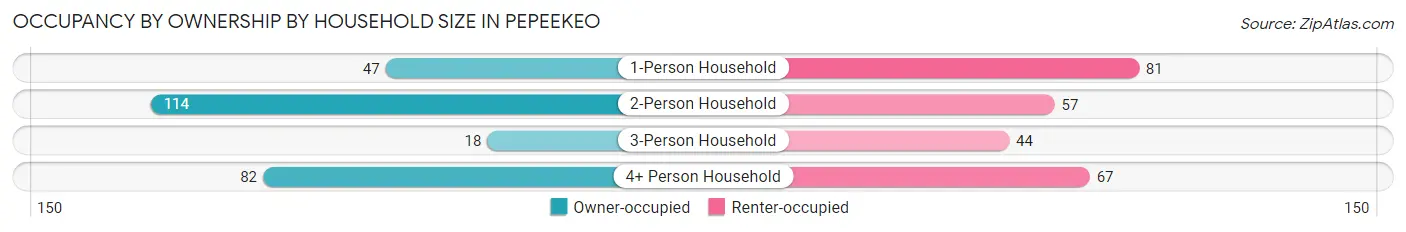
| Household Size | Owner-occupied | Renter-occupied |
| 1-Person Household | 47 (36.7%) | 81 (63.3%) |
| 2-Person Household | 114 (66.7%) | 57 (33.3%) |
| 3-Person Household | 18 (29.0%) | 44 (71.0%) |
| 4+ Person Household | 82 (55.0%) | 67 (45.0%) |
| Total Housing Units | 261 (51.2%) | 249 (48.8%) |
Occupancy by Educational Attainment in Pepeekeo
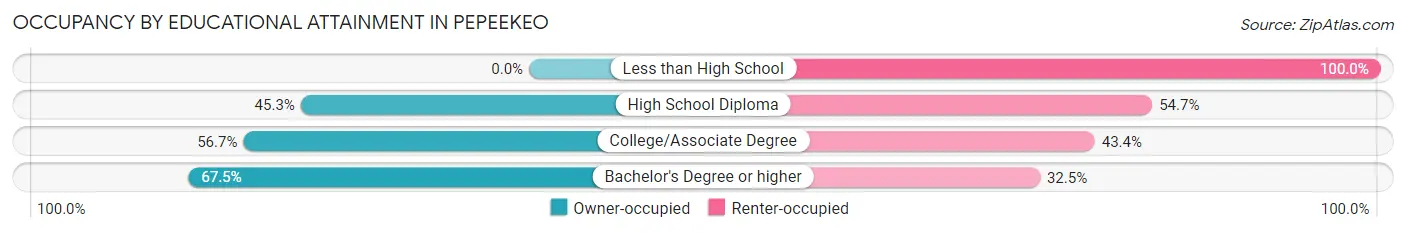
| Household Size | Owner-occupied | Renter-occupied |
| Less than High School | 0 (0.0%) | 42 (100.0%) |
| High School Diploma | 67 (45.3%) | 81 (54.7%) |
| College/Associate Degree | 115 (56.7%) | 88 (43.3%) |
| Bachelor's Degree or higher | 79 (67.5%) | 38 (32.5%) |
Occupancy by Age of Householder in Pepeekeo
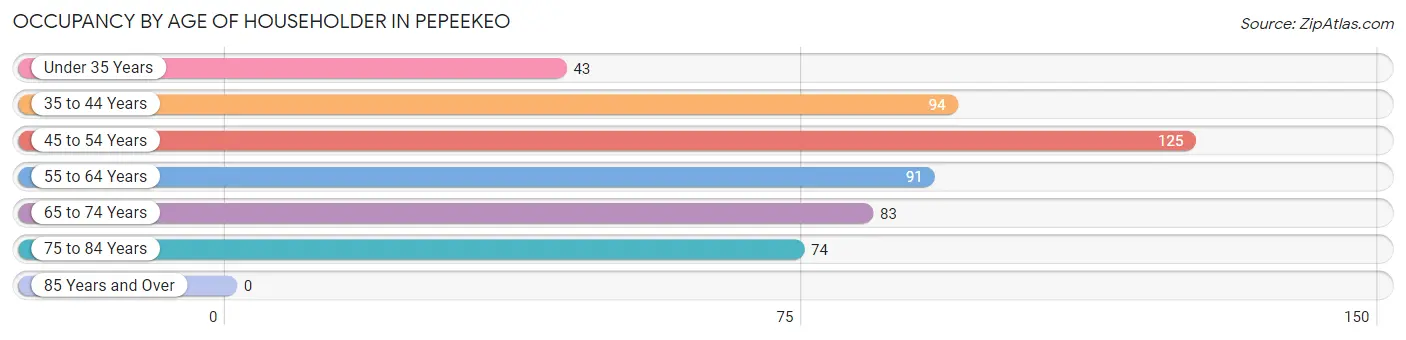
| Age Bracket | # Households | % Households |
| Under 35 Years | 43 | 8.4% |
| 35 to 44 Years | 94 | 18.4% |
| 45 to 54 Years | 125 | 24.5% |
| 55 to 64 Years | 91 | 17.8% |
| 65 to 74 Years | 83 | 16.3% |
| 75 to 84 Years | 74 | 14.5% |
| 85 Years and Over | 0 | 0.0% |
| Total | 510 | 100.0% |
Housing Finances in Pepeekeo
Median Income by Occupancy in Pepeekeo
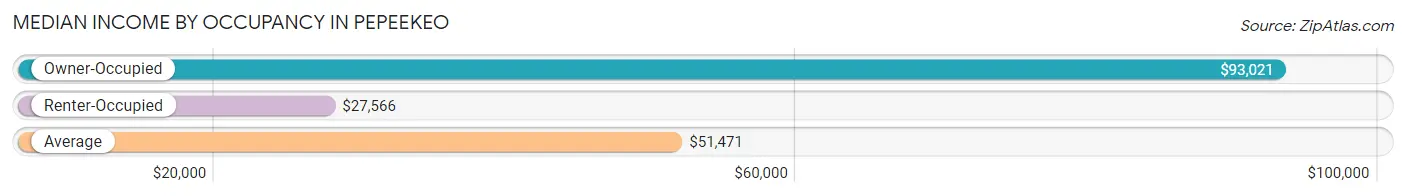
| Occupancy Type | # Households | Median Income |
| Owner-Occupied | 261 (51.2%) | $93,021 |
| Renter-Occupied | 249 (48.8%) | $27,566 |
| Average | 510 (100.0%) | $51,471 |
Occupancy by Householder Income Bracket in Pepeekeo
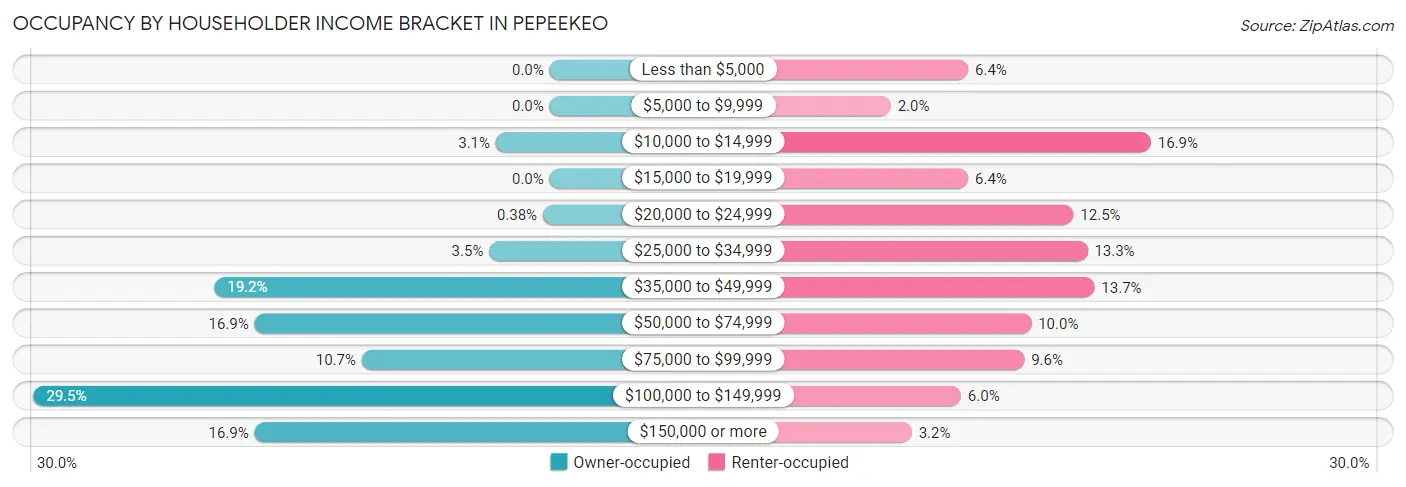
| Income Bracket | Owner-occupied | Renter-occupied |
| Less than $5,000 | 0 (0.0%) | 16 (6.4%) |
| $5,000 to $9,999 | 0 (0.0%) | 5 (2.0%) |
| $10,000 to $14,999 | 8 (3.1%) | 42 (16.9%) |
| $15,000 to $19,999 | 0 (0.0%) | 16 (6.4%) |
| $20,000 to $24,999 | 1 (0.4%) | 31 (12.4%) |
| $25,000 to $34,999 | 9 (3.5%) | 33 (13.3%) |
| $35,000 to $49,999 | 50 (19.2%) | 34 (13.7%) |
| $50,000 to $74,999 | 44 (16.9%) | 25 (10.0%) |
| $75,000 to $99,999 | 28 (10.7%) | 24 (9.6%) |
| $100,000 to $149,999 | 77 (29.5%) | 15 (6.0%) |
| $150,000 or more | 44 (16.9%) | 8 (3.2%) |
| Total | 261 (100.0%) | 249 (100.0%) |
Monthly Housing Cost Tiers in Pepeekeo
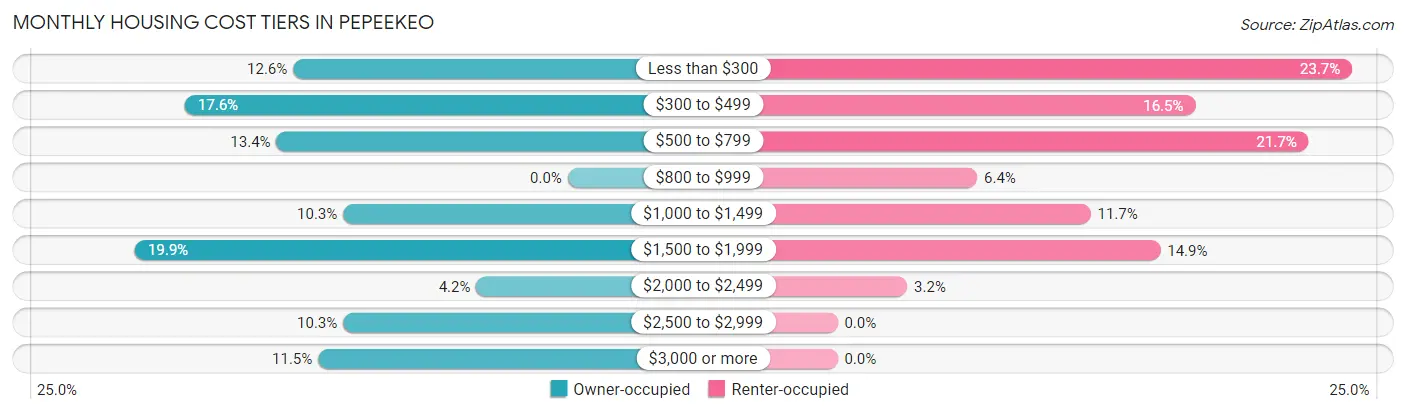
| Monthly Cost | Owner-occupied | Renter-occupied |
| Less than $300 | 33 (12.6%) | 59 (23.7%) |
| $300 to $499 | 46 (17.6%) | 41 (16.5%) |
| $500 to $799 | 35 (13.4%) | 54 (21.7%) |
| $800 to $999 | 0 (0.0%) | 16 (6.4%) |
| $1,000 to $1,499 | 27 (10.3%) | 29 (11.7%) |
| $1,500 to $1,999 | 52 (19.9%) | 37 (14.9%) |
| $2,000 to $2,499 | 11 (4.2%) | 8 (3.2%) |
| $2,500 to $2,999 | 27 (10.3%) | 0 (0.0%) |
| $3,000 or more | 30 (11.5%) | 0 (0.0%) |
| Total | 261 (100.0%) | 249 (100.0%) |
Physical Housing Characteristics in Pepeekeo
Housing Structures in Pepeekeo
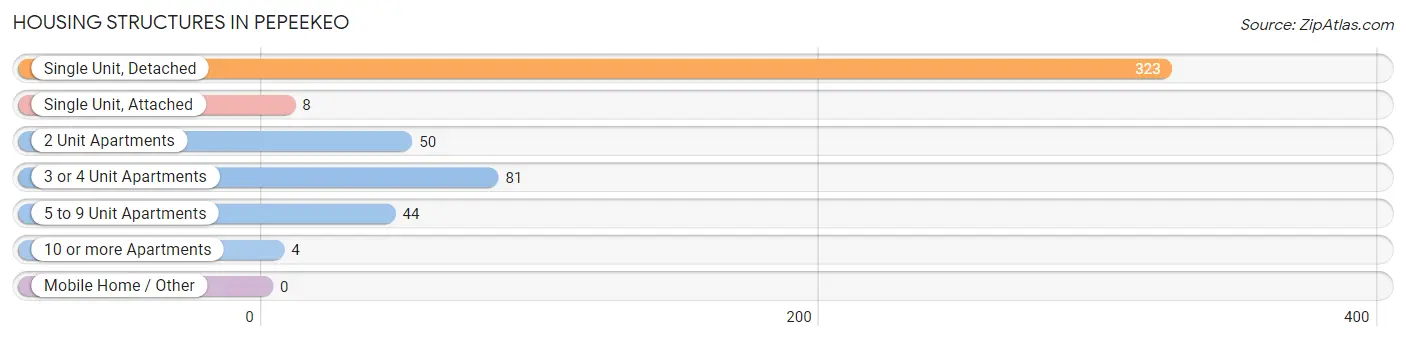
| Structure Type | # Housing Units | % Housing Units |
| Single Unit, Detached | 323 | 63.3% |
| Single Unit, Attached | 8 | 1.6% |
| 2 Unit Apartments | 50 | 9.8% |
| 3 or 4 Unit Apartments | 81 | 15.9% |
| 5 to 9 Unit Apartments | 44 | 8.6% |
| 10 or more Apartments | 4 | 0.8% |
| Mobile Home / Other | 0 | 0.0% |
| Total | 510 | 100.0% |
Housing Structures by Occupancy in Pepeekeo
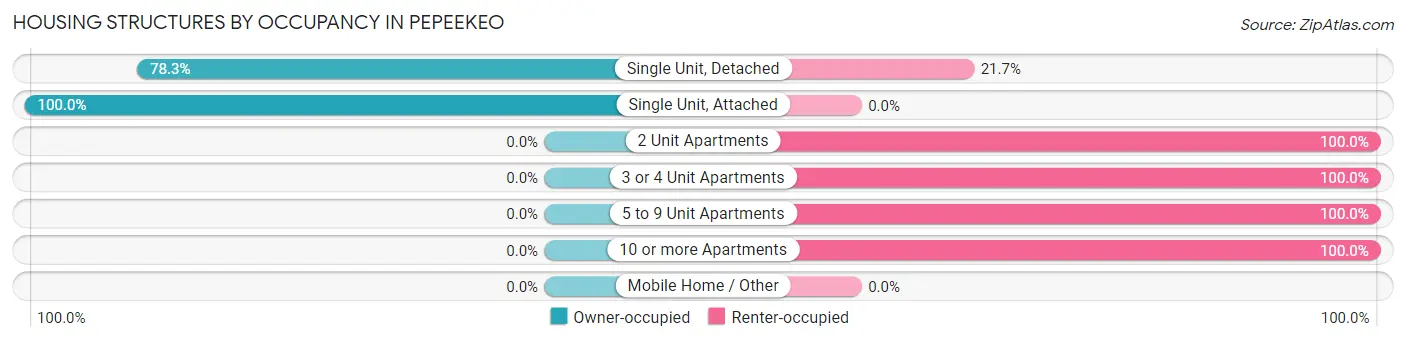
| Structure Type | Owner-occupied | Renter-occupied |
| Single Unit, Detached | 253 (78.3%) | 70 (21.7%) |
| Single Unit, Attached | 8 (100.0%) | 0 (0.0%) |
| 2 Unit Apartments | 0 (0.0%) | 50 (100.0%) |
| 3 or 4 Unit Apartments | 0 (0.0%) | 81 (100.0%) |
| 5 to 9 Unit Apartments | 0 (0.0%) | 44 (100.0%) |
| 10 or more Apartments | 0 (0.0%) | 4 (100.0%) |
| Mobile Home / Other | 0 (0.0%) | 0 (0.0%) |
| Total | 261 (51.2%) | 249 (48.8%) |
Housing Structures by Number of Rooms in Pepeekeo
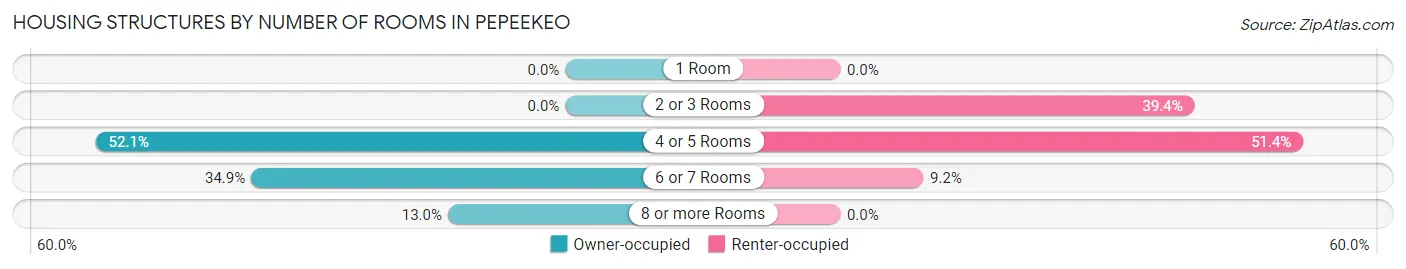
| Number of Rooms | Owner-occupied | Renter-occupied |
| 1 Room | 0 (0.0%) | 0 (0.0%) |
| 2 or 3 Rooms | 0 (0.0%) | 98 (39.4%) |
| 4 or 5 Rooms | 136 (52.1%) | 128 (51.4%) |
| 6 or 7 Rooms | 91 (34.9%) | 23 (9.2%) |
| 8 or more Rooms | 34 (13.0%) | 0 (0.0%) |
| Total | 261 (100.0%) | 249 (100.0%) |
Housing Structure by Heating Type in Pepeekeo
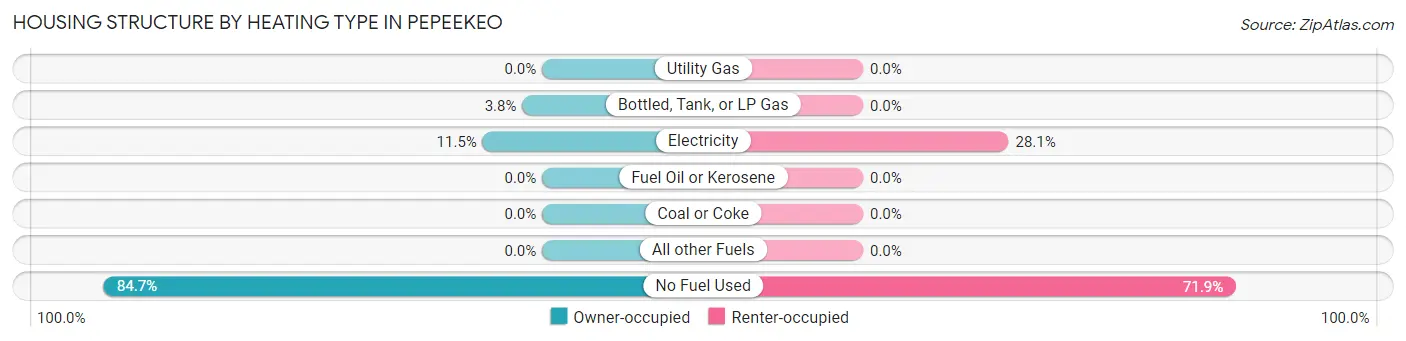
| Heating Type | Owner-occupied | Renter-occupied |
| Utility Gas | 0 (0.0%) | 0 (0.0%) |
| Bottled, Tank, or LP Gas | 10 (3.8%) | 0 (0.0%) |
| Electricity | 30 (11.5%) | 70 (28.1%) |
| Fuel Oil or Kerosene | 0 (0.0%) | 0 (0.0%) |
| Coal or Coke | 0 (0.0%) | 0 (0.0%) |
| All other Fuels | 0 (0.0%) | 0 (0.0%) |
| No Fuel Used | 221 (84.7%) | 179 (71.9%) |
| Total | 261 (100.0%) | 249 (100.0%) |
Household Vehicle Usage in Pepeekeo
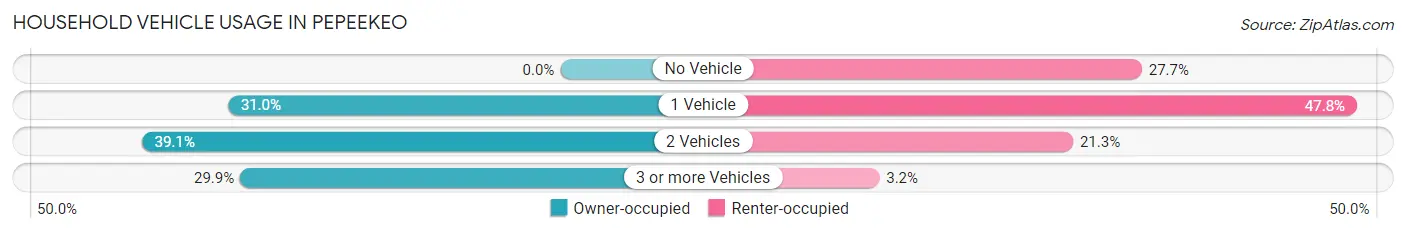
| Vehicles per Household | Owner-occupied | Renter-occupied |
| No Vehicle | 0 (0.0%) | 69 (27.7%) |
| 1 Vehicle | 81 (31.0%) | 119 (47.8%) |
| 2 Vehicles | 102 (39.1%) | 53 (21.3%) |
| 3 or more Vehicles | 78 (29.9%) | 8 (3.2%) |
| Total | 261 (100.0%) | 249 (100.0%) |
Real Estate & Mortgages in Pepeekeo
Real Estate and Mortgage Overview in Pepeekeo
| Characteristic | Without Mortgage | With Mortgage |
| Housing Units | 105 | 156 |
| Median Property Value | $388,500 | $381,100 |
| Median Household Income | $63,750 | $34 |
| Monthly Housing Costs | $354 | $30 |
| Real Estate Taxes | $316 | $0 |
Property Value by Mortgage Status in Pepeekeo
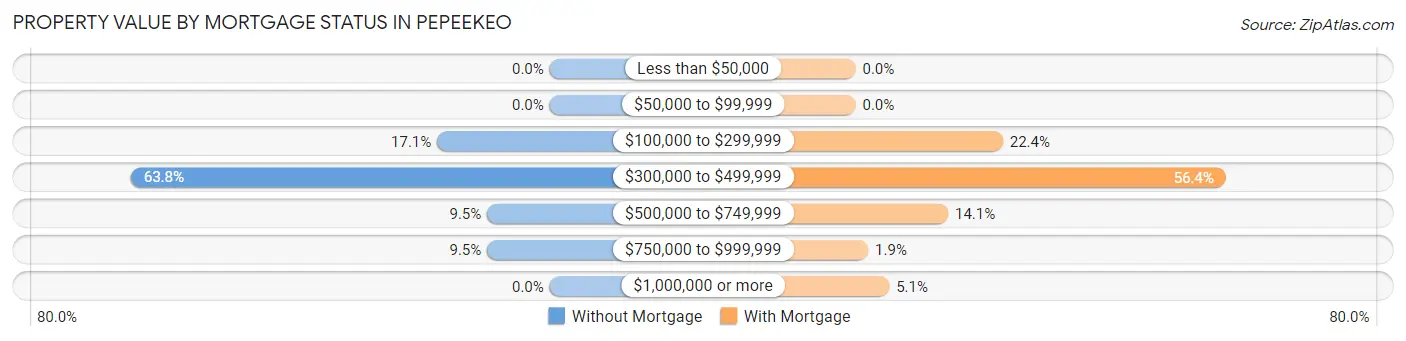
| Property Value | Without Mortgage | With Mortgage |
| Less than $50,000 | 0 (0.0%) | 0 (0.0%) |
| $50,000 to $99,999 | 0 (0.0%) | 0 (0.0%) |
| $100,000 to $299,999 | 18 (17.1%) | 35 (22.4%) |
| $300,000 to $499,999 | 67 (63.8%) | 88 (56.4%) |
| $500,000 to $749,999 | 10 (9.5%) | 22 (14.1%) |
| $750,000 to $999,999 | 10 (9.5%) | 3 (1.9%) |
| $1,000,000 or more | 0 (0.0%) | 8 (5.1%) |
| Total | 105 (100.0%) | 156 (100.0%) |
Household Income by Mortgage Status in Pepeekeo
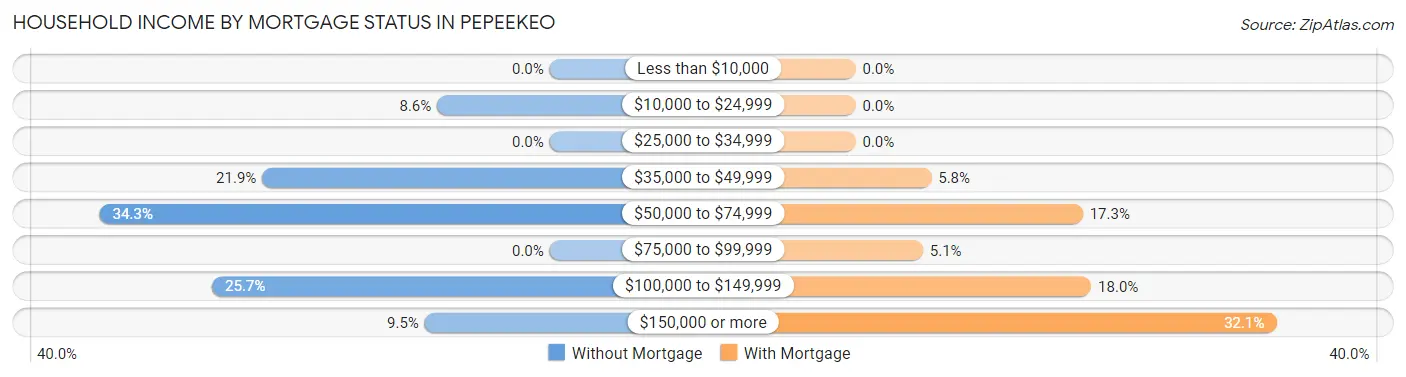
| Household Income | Without Mortgage | With Mortgage |
| Less than $10,000 | 0 (0.0%) | 0 (0.0%) |
| $10,000 to $24,999 | 9 (8.6%) | 0 (0.0%) |
| $25,000 to $34,999 | 0 (0.0%) | 0 (0.0%) |
| $35,000 to $49,999 | 23 (21.9%) | 9 (5.8%) |
| $50,000 to $74,999 | 36 (34.3%) | 27 (17.3%) |
| $75,000 to $99,999 | 0 (0.0%) | 8 (5.1%) |
| $100,000 to $149,999 | 27 (25.7%) | 28 (17.9%) |
| $150,000 or more | 10 (9.5%) | 50 (32.1%) |
| Total | 105 (100.0%) | 156 (100.0%) |
Property Value to Household Income Ratio in Pepeekeo
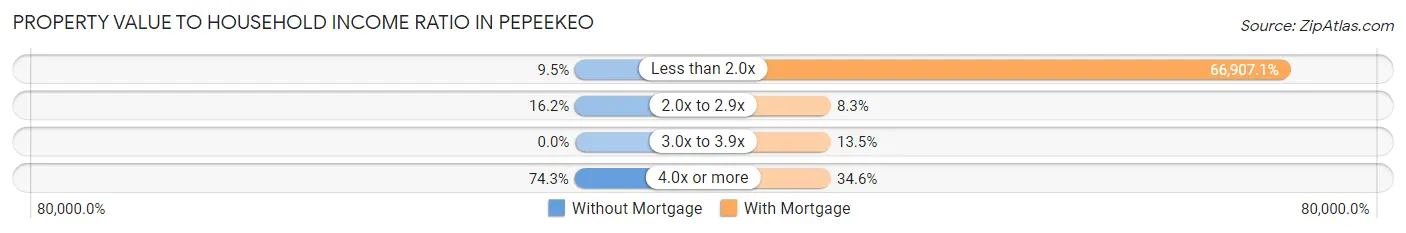
| Value-to-Income Ratio | Without Mortgage | With Mortgage |
| Less than 2.0x | 10 (9.5%) | 104,375 (66,907.1%) |
| 2.0x to 2.9x | 17 (16.2%) | 13 (8.3%) |
| 3.0x to 3.9x | 0 (0.0%) | 21 (13.5%) |
| 4.0x or more | 78 (74.3%) | 54 (34.6%) |
| Total | 105 (100.0%) | 156 (100.0%) |
Real Estate Taxes by Mortgage Status in Pepeekeo
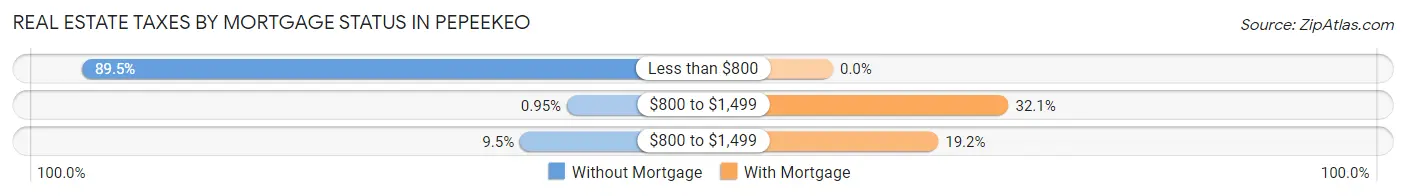
| Property Taxes | Without Mortgage | With Mortgage |
| Less than $800 | 94 (89.5%) | 0 (0.0%) |
| $800 to $1,499 | 1 (0.9%) | 50 (32.1%) |
| $800 to $1,499 | 10 (9.5%) | 30 (19.2%) |
| Total | 105 (100.0%) | 156 (100.0%) |
Health & Disability in Pepeekeo
Health Insurance Coverage by Age in Pepeekeo
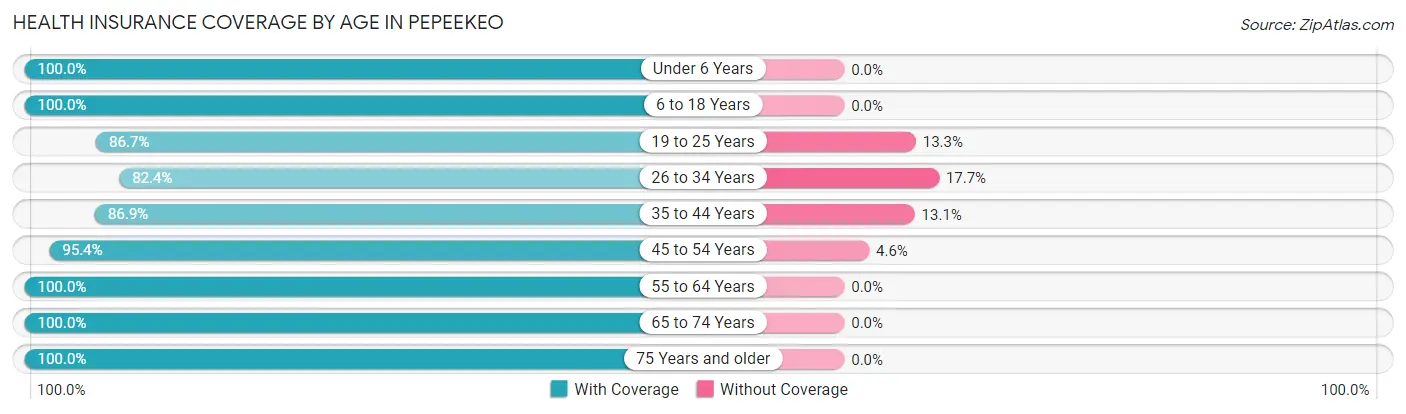
| Age Bracket | With Coverage | Without Coverage |
| Under 6 Years | 68 (100.0%) | 0 (0.0%) |
| 6 to 18 Years | 298 (100.0%) | 0 (0.0%) |
| 19 to 25 Years | 117 (86.7%) | 18 (13.3%) |
| 26 to 34 Years | 112 (82.4%) | 24 (17.6%) |
| 35 to 44 Years | 192 (86.9%) | 29 (13.1%) |
| 45 to 54 Years | 227 (95.4%) | 11 (4.6%) |
| 55 to 64 Years | 122 (100.0%) | 0 (0.0%) |
| 65 to 74 Years | 121 (100.0%) | 0 (0.0%) |
| 75 Years and older | 123 (100.0%) | 0 (0.0%) |
| Total | 1,380 (94.4%) | 82 (5.6%) |
Health Insurance Coverage by Citizenship Status in Pepeekeo
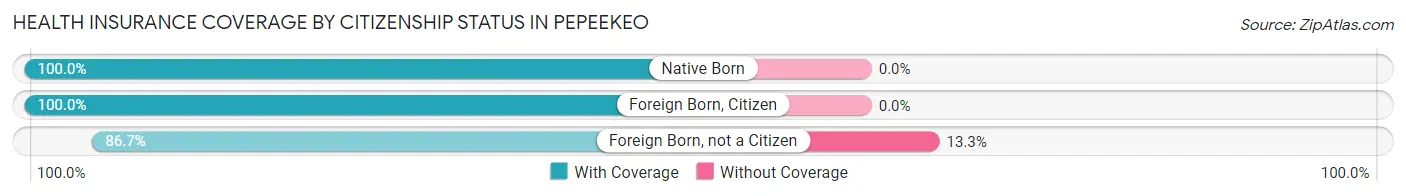
| Citizenship Status | With Coverage | Without Coverage |
| Native Born | 68 (100.0%) | 0 (0.0%) |
| Foreign Born, Citizen | 298 (100.0%) | 0 (0.0%) |
| Foreign Born, not a Citizen | 117 (86.7%) | 18 (13.3%) |
Health Insurance Coverage by Household Income in Pepeekeo
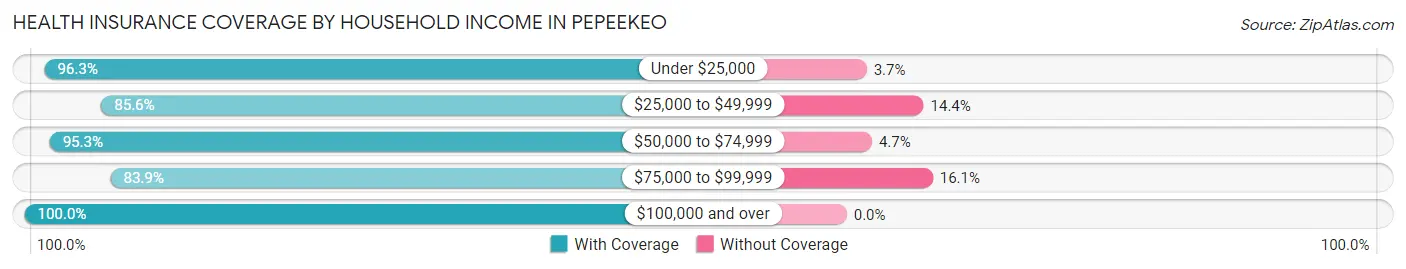
| Household Income | With Coverage | Without Coverage |
| Under $25,000 | 258 (96.3%) | 10 (3.7%) |
| $25,000 to $49,999 | 226 (85.6%) | 38 (14.4%) |
| $50,000 to $74,999 | 202 (95.3%) | 10 (4.7%) |
| $75,000 to $99,999 | 125 (83.9%) | 24 (16.1%) |
| $100,000 and over | 569 (100.0%) | 0 (0.0%) |
Public vs Private Health Insurance Coverage by Age in Pepeekeo
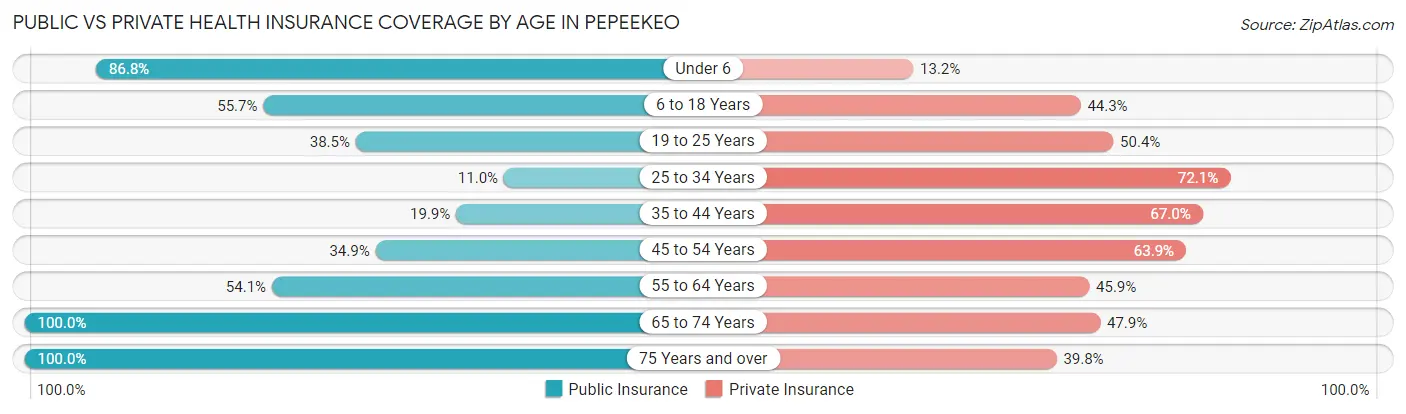
| Age Bracket | Public Insurance | Private Insurance |
| Under 6 | 59 (86.8%) | 9 (13.2%) |
| 6 to 18 Years | 166 (55.7%) | 132 (44.3%) |
| 19 to 25 Years | 52 (38.5%) | 68 (50.4%) |
| 25 to 34 Years | 15 (11.0%) | 98 (72.1%) |
| 35 to 44 Years | 44 (19.9%) | 148 (67.0%) |
| 45 to 54 Years | 83 (34.9%) | 152 (63.9%) |
| 55 to 64 Years | 66 (54.1%) | 56 (45.9%) |
| 65 to 74 Years | 121 (100.0%) | 58 (47.9%) |
| 75 Years and over | 123 (100.0%) | 49 (39.8%) |
| Total | 729 (49.9%) | 770 (52.7%) |
Disability Status by Sex by Age in Pepeekeo
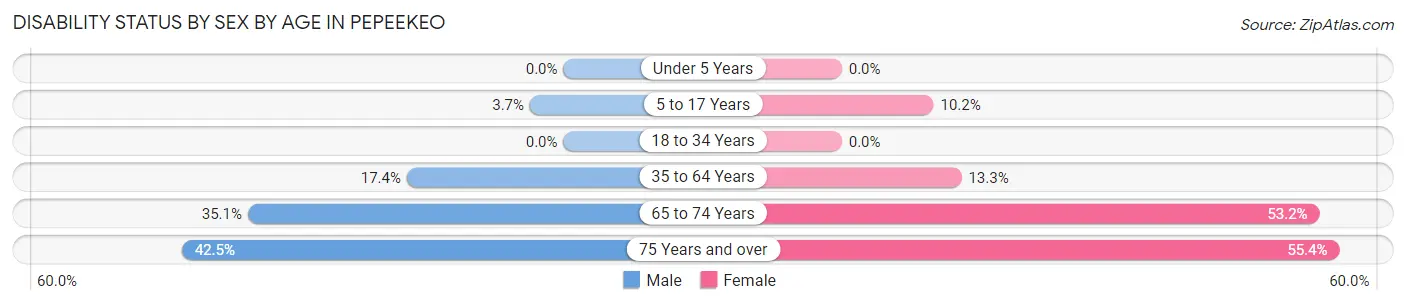
| Age Bracket | Male | Female |
| Under 5 Years | 0 (0.0%) | 0 (0.0%) |
| 5 to 17 Years | 6 (3.7%) | 14 (10.2%) |
| 18 to 34 Years | 0 (0.0%) | 0 (0.0%) |
| 35 to 64 Years | 49 (17.4%) | 40 (13.3%) |
| 65 to 74 Years | 26 (35.1%) | 25 (53.2%) |
| 75 Years and over | 17 (42.5%) | 46 (55.4%) |
Disability Class by Sex by Age in Pepeekeo
Disability Class: Hearing Difficulty
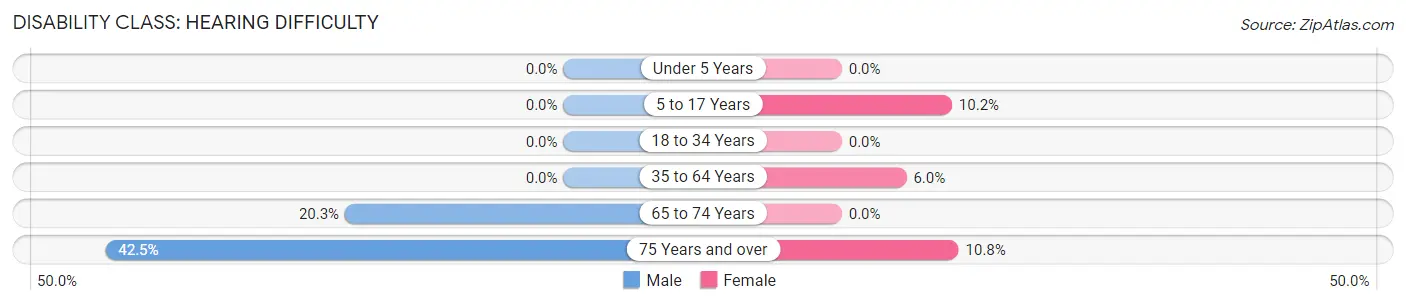
| Age Bracket | Male | Female |
| Under 5 Years | 0 (0.0%) | 0 (0.0%) |
| 5 to 17 Years | 0 (0.0%) | 14 (10.2%) |
| 18 to 34 Years | 0 (0.0%) | 0 (0.0%) |
| 35 to 64 Years | 0 (0.0%) | 18 (6.0%) |
| 65 to 74 Years | 15 (20.3%) | 0 (0.0%) |
| 75 Years and over | 17 (42.5%) | 9 (10.8%) |
Disability Class: Vision Difficulty
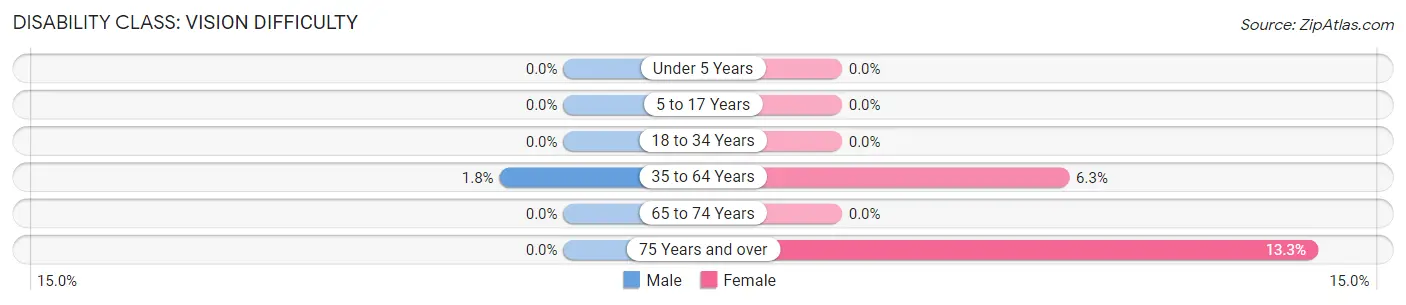
| Age Bracket | Male | Female |
| Under 5 Years | 0 (0.0%) | 0 (0.0%) |
| 5 to 17 Years | 0 (0.0%) | 0 (0.0%) |
| 18 to 34 Years | 0 (0.0%) | 0 (0.0%) |
| 35 to 64 Years | 5 (1.8%) | 19 (6.3%) |
| 65 to 74 Years | 0 (0.0%) | 0 (0.0%) |
| 75 Years and over | 0 (0.0%) | 11 (13.3%) |
Disability Class: Cognitive Difficulty
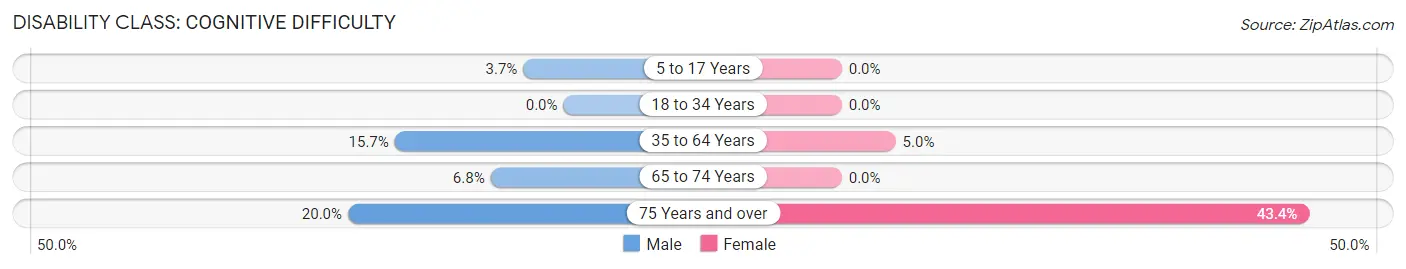
| Age Bracket | Male | Female |
| 5 to 17 Years | 6 (3.7%) | 0 (0.0%) |
| 18 to 34 Years | 0 (0.0%) | 0 (0.0%) |
| 35 to 64 Years | 44 (15.7%) | 15 (5.0%) |
| 65 to 74 Years | 5 (6.8%) | 0 (0.0%) |
| 75 Years and over | 8 (20.0%) | 36 (43.4%) |
Disability Class: Ambulatory Difficulty
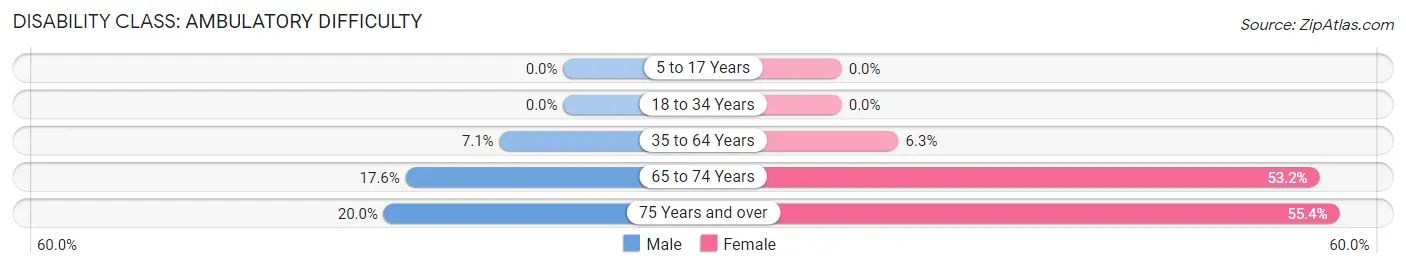
| Age Bracket | Male | Female |
| 5 to 17 Years | 0 (0.0%) | 0 (0.0%) |
| 18 to 34 Years | 0 (0.0%) | 0 (0.0%) |
| 35 to 64 Years | 20 (7.1%) | 19 (6.3%) |
| 65 to 74 Years | 13 (17.6%) | 25 (53.2%) |
| 75 Years and over | 8 (20.0%) | 46 (55.4%) |
Disability Class: Self-Care Difficulty
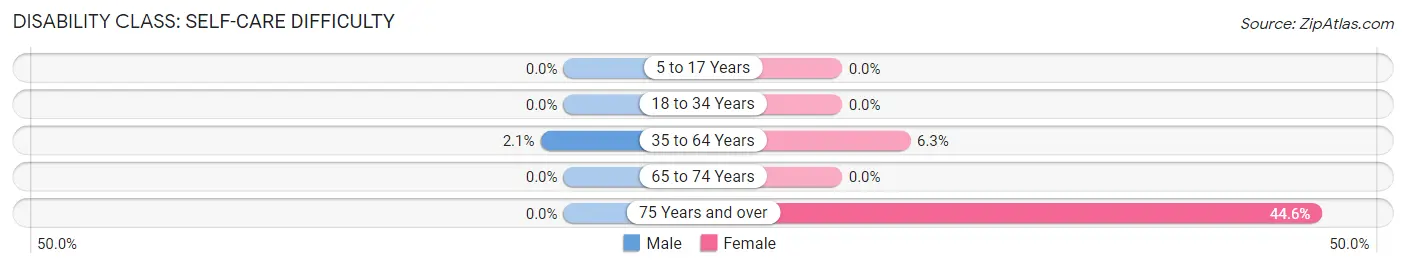
| Age Bracket | Male | Female |
| 5 to 17 Years | 0 (0.0%) | 0 (0.0%) |
| 18 to 34 Years | 0 (0.0%) | 0 (0.0%) |
| 35 to 64 Years | 6 (2.1%) | 19 (6.3%) |
| 65 to 74 Years | 0 (0.0%) | 0 (0.0%) |
| 75 Years and over | 0 (0.0%) | 37 (44.6%) |
Technology Access in Pepeekeo
Computing Device Access in Pepeekeo
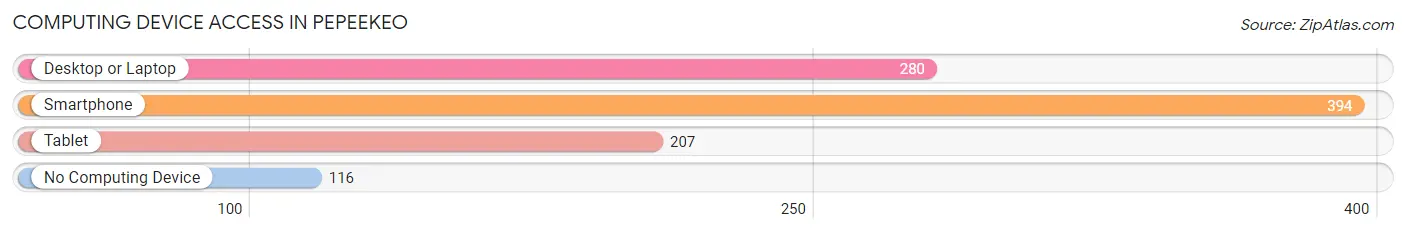
| Device Type | # Households | % Households |
| Desktop or Laptop | 280 | 54.9% |
| Smartphone | 394 | 77.2% |
| Tablet | 207 | 40.6% |
| No Computing Device | 116 | 22.8% |
| Total | 510 | 100.0% |
Internet Access in Pepeekeo
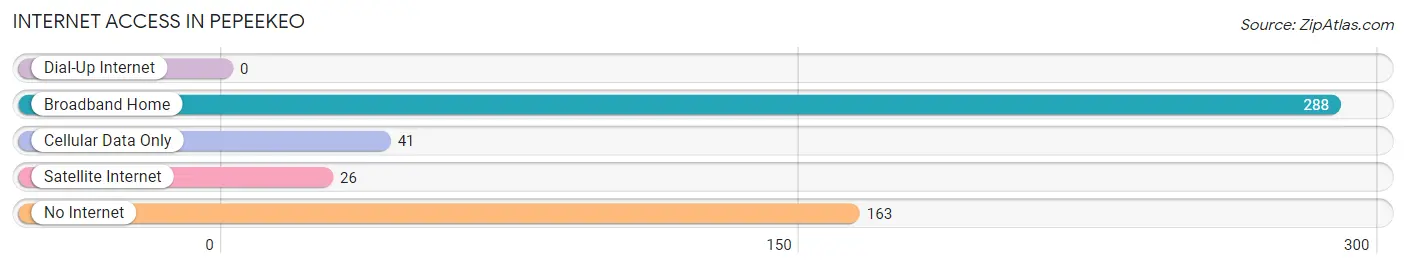
| Internet Type | # Households | % Households |
| Dial-Up Internet | 0 | 0.0% |
| Broadband Home | 288 | 56.5% |
| Cellular Data Only | 41 | 8.0% |
| Satellite Internet | 26 | 5.1% |
| No Internet | 163 | 32.0% |
| Total | 510 | 100.0% |
Pepeekeo Summary
Pepeekeo is a small town located on the Hamakua Coast of the Big Island of Hawaii. It is situated between the towns of Honomu and Paauilo, and is part of the North Hilo District. The town is located at an elevation of about 500 feet, and is surrounded by lush tropical rainforest. The population of Pepeekeo was 1,845 as of the 2010 census.
History
Pepeekeo was originally settled by Native Hawaiians in the late 1700s. The area was used for farming and fishing, and the town was known as “Pu’u Peekeo”, which means “hill of the red dirt”. In the early 1800s, the area was settled by Japanese immigrants who established a sugar plantation. The plantation was later sold to the Hawaiian Sugar Company, which operated the plantation until it closed in the late 1960s.
Geography
Pepeekeo is located on the Hamakua Coast of the Big Island of Hawaii. It is situated between the towns of Honomu and Paauilo, and is part of the North Hilo District. The town is located at an elevation of about 500 feet, and is surrounded by lush tropical rainforest. The climate in Pepeekeo is tropical and humid, with temperatures ranging from the mid-70s to the mid-80s.
Economy
The economy of Pepeekeo is largely based on agriculture and tourism. The town is home to several farms, including macadamia nut, coffee, and tropical fruit farms. The town is also home to several small businesses, including restaurants, shops, and galleries. Tourism is also an important part of the local economy, with visitors coming to the area to enjoy the natural beauty and outdoor activities.
Demographics
As of the 2010 census, the population of Pepeekeo was 1,845. The racial makeup of the town was 57.3% White, 0.3% African American, 0.2% Native American, 28.2% Asian, 0.2% Pacific Islander, 0.7% from other races, and 13.1% from two or more races. The median household income in Pepeekeo was $50,938, and the median family income was $54,844. The per capita income in Pepeekeo was $20,945.
Pepeekeo is a small town with a rich history and a vibrant economy. The town is home to several farms and businesses, and is a popular destination for tourists. The population of Pepeekeo is diverse, with a mix of different racial and ethnic backgrounds. The town is a great place to live, work, and visit, and is a great example of the beauty and culture of the Big Island of Hawaii.
Common Questions
What is Per Capita Income in Pepeekeo?
Per Capita income in Pepeekeo is $25,764.
What is the Median Family Income in Pepeekeo?
Median Family Income in Pepeekeo is $70,682.
What is the Median Household income in Pepeekeo?
Median Household Income in Pepeekeo is $51,471.
What is Income or Wage Gap in Pepeekeo?
Income or Wage Gap in Pepeekeo is 23.9%.
Women in Pepeekeo earn 76.1 cents for every dollar earned by a man.
What is Family Income Deficit in Pepeekeo?
Family Income Deficit in Pepeekeo is $13,972.
Families that are below poverty line in Pepeekeo earn $13,972 less on average than the poverty threshold level.
What is Inequality or Gini Index in Pepeekeo?
Inequality or Gini Index in Pepeekeo is 0.45.
What is the Total Population of Pepeekeo?
Total Population of Pepeekeo is 1,462.
What is the Total Male Population of Pepeekeo?
Total Male Population of Pepeekeo is 766.
What is the Total Female Population of Pepeekeo?
Total Female Population of Pepeekeo is 696.
What is the Ratio of Males per 100 Females in Pepeekeo?
There are 110.06 Males per 100 Females in Pepeekeo.
What is the Ratio of Females per 100 Males in Pepeekeo?
There are 90.86 Females per 100 Males in Pepeekeo.
What is the Median Population Age in Pepeekeo?
Median Population Age in Pepeekeo is 38.3 Years.
What is the Average Family Size in Pepeekeo
Average Family Size in Pepeekeo is 3.5 People.
What is the Average Household Size in Pepeekeo
Average Household Size in Pepeekeo is 2.9 People.
How Large is the Labor Force in Pepeekeo?
There are 699 People in the Labor Forcein in Pepeekeo.
What is the Percentage of People in the Labor Force in Pepeekeo?
59.1% of People are in the Labor Force in Pepeekeo.
What is the Unemployment Rate in Pepeekeo?
Unemployment Rate in Pepeekeo is 8.5%.