Port Orchard, WA Map & Demographics
Port Orchard Map
Port Orchard Overview
$38,364
PER CAPITA INCOME
$98,500
AVG FAMILY INCOME
$82,650
AVG HOUSEHOLD INCOME
28.3%
WAGE / INCOME GAP [ % ]
71.7¢/ $1
WAGE / INCOME GAP [ $ ]
$14,898
FAMILY INCOME DEFICIT
0.39
INEQUALITY / GINI INDEX
15,820
TOTAL POPULATION
7,961
MALE POPULATION
7,859
FEMALE POPULATION
101.30
MALES / 100 FEMALES
98.72
FEMALES / 100 MALES
33.7
MEDIAN AGE
2.8
AVG FAMILY SIZE
2.4
AVG HOUSEHOLD SIZE
7,424
LABOR FORCE [ PEOPLE ]
61.2%
PERCENT IN LABOR FORCE
4.8%
UNEMPLOYMENT RATE
Income in Port Orchard
Income Overview in Port Orchard
Per Capita Income in Port Orchard is $38,364, while median incomes of families and households are $98,500 and $82,650 respectively.
| Characteristic | Number | Measure |
| Per Capita Income | 15,820 | $38,364 |
| Median Family Income | 4,436 | $98,500 |
| Mean Family Income | 4,436 | $104,271 |
| Median Household Income | 6,269 | $82,650 |
| Mean Household Income | 6,269 | $94,850 |
| Income Deficit | 4,436 | $14,898 |
| Wage / Income Gap (%) | 15,820 | 28.32% |
| Wage / Income Gap ($) | 15,820 | 71.68¢ per $1 |
| Gini / Inequality Index | 15,820 | 0.39 |
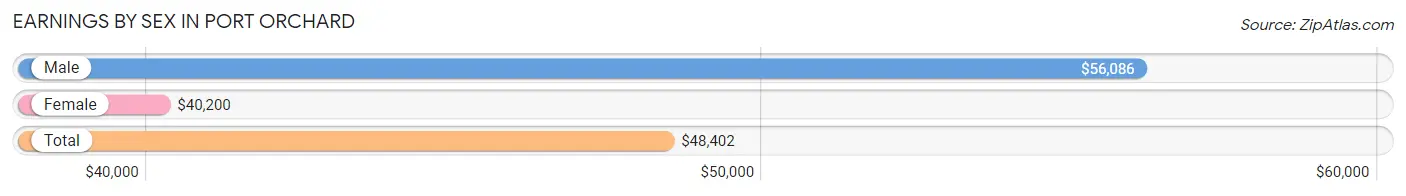
Earnings by Sex in Port Orchard
Average Earnings in Port Orchard are $48,402, $56,086 for men and $40,200 for women, a difference of 28.3%.
| Sex | Number | Average Earnings |
| Male | 4,163 (53.1%) | $56,086 |
| Female | 3,679 (46.9%) | $40,200 |
| Total | 7,842 (100.0%) | $48,402 |
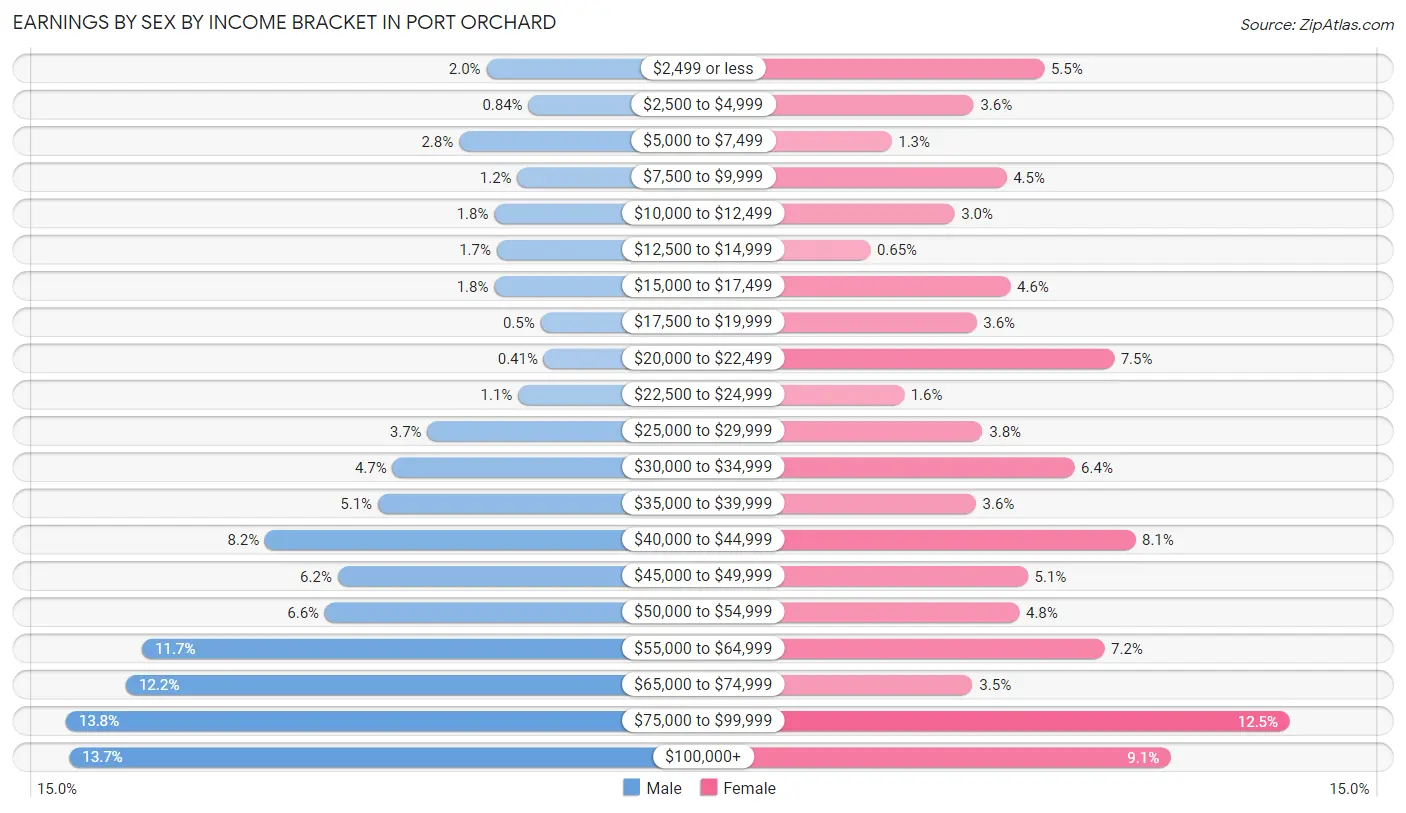
Earnings by Sex by Income Bracket in Port Orchard
The most common earnings brackets in Port Orchard are $75,000 to $99,999 for men (576 | 13.8%) and $75,000 to $99,999 for women (458 | 12.4%).
| Income | Male | Female |
| $2,499 or less | 84 (2.0%) | 204 (5.5%) |
| $2,500 to $4,999 | 35 (0.8%) | 131 (3.6%) |
| $5,000 to $7,499 | 116 (2.8%) | 46 (1.3%) |
| $7,500 to $9,999 | 48 (1.1%) | 165 (4.5%) |
| $10,000 to $12,499 | 75 (1.8%) | 111 (3.0%) |
| $12,500 to $14,999 | 72 (1.7%) | 24 (0.6%) |
| $15,000 to $17,499 | 75 (1.8%) | 169 (4.6%) |
| $17,500 to $19,999 | 21 (0.5%) | 134 (3.6%) |
| $20,000 to $22,499 | 17 (0.4%) | 276 (7.5%) |
| $22,500 to $24,999 | 47 (1.1%) | 59 (1.6%) |
| $25,000 to $29,999 | 153 (3.7%) | 140 (3.8%) |
| $30,000 to $34,999 | 194 (4.7%) | 235 (6.4%) |
| $35,000 to $39,999 | 211 (5.1%) | 133 (3.6%) |
| $40,000 to $44,999 | 343 (8.2%) | 298 (8.1%) |
| $45,000 to $49,999 | 258 (6.2%) | 187 (5.1%) |
| $50,000 to $54,999 | 273 (6.6%) | 178 (4.8%) |
| $55,000 to $64,999 | 487 (11.7%) | 266 (7.2%) |
| $65,000 to $74,999 | 506 (12.1%) | 130 (3.5%) |
| $75,000 to $99,999 | 576 (13.8%) | 458 (12.4%) |
| $100,000+ | 572 (13.7%) | 335 (9.1%) |
| Total | 4,163 (100.0%) | 3,679 (100.0%) |
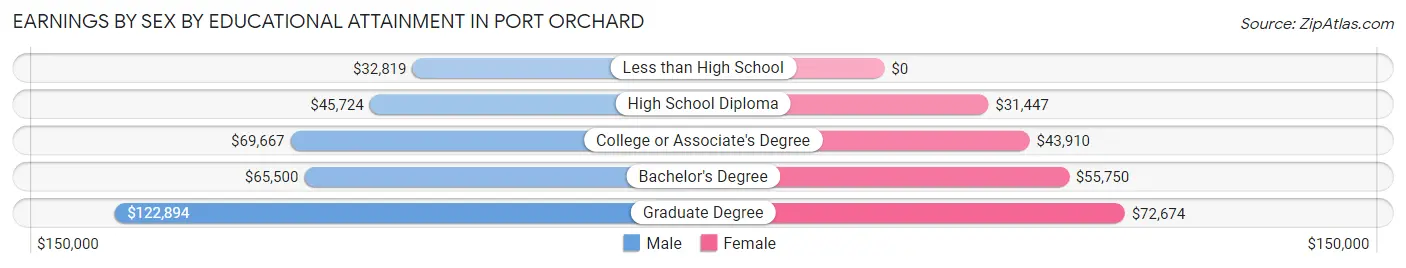
Earnings by Sex by Educational Attainment in Port Orchard
Average earnings in Port Orchard are $58,167 for men and $43,387 for women, a difference of 25.4%. Men with an educational attainment of graduate degree enjoy the highest average annual earnings of $122,894, while those with less than high school education earn the least with $32,819. Women with an educational attainment of graduate degree earn the most with the average annual earnings of $72,674, while those with high school diploma education have the smallest earnings of $31,447.
| Educational Attainment | Male Income | Female Income |
| Less than High School | $32,819 | $0 |
| High School Diploma | $45,724 | $31,447 |
| College or Associate's Degree | $69,667 | $43,910 |
| Bachelor's Degree | $65,500 | $55,750 |
| Graduate Degree | $122,894 | $72,674 |
| Total | $58,167 | $43,387 |
Family Income in Port Orchard
Family Income Brackets in Port Orchard
According to the Port Orchard family income data, there are 1,393 families falling into the $100,000 to $149,999 income range, which is the most common income bracket and makes up 31.4% of all families. Conversely, the $10,000 to $14,999 income bracket is the least frequent group with only 67 families (1.5%) belonging to this category.
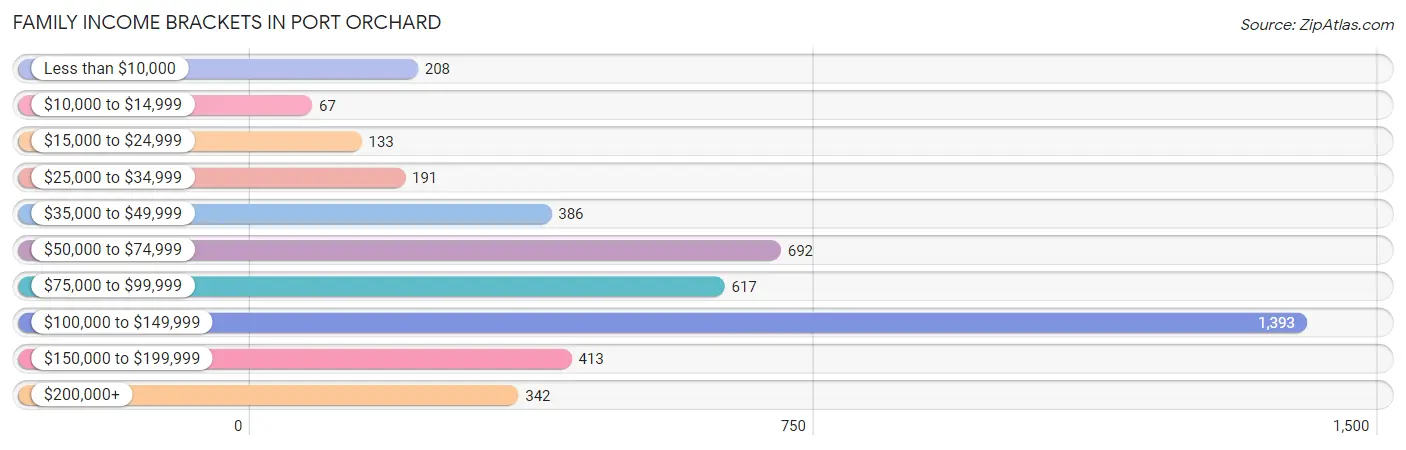
| Income Bracket | # Families | % Families |
| Less than $10,000 | 208 | 4.7% |
| $10,000 to $14,999 | 67 | 1.5% |
| $15,000 to $24,999 | 133 | 3.0% |
| $25,000 to $34,999 | 191 | 4.3% |
| $35,000 to $49,999 | 386 | 8.7% |
| $50,000 to $74,999 | 692 | 15.6% |
| $75,000 to $99,999 | 617 | 13.9% |
| $100,000 to $149,999 | 1,393 | 31.4% |
| $150,000 to $199,999 | 413 | 9.3% |
| $200,000+ | 342 | 7.7% |
Family Income by Famaliy Size in Port Orchard
7+ person families (112 | 2.5%) account for the highest median family income in Port Orchard with $166,086 per family, while 2-person families (2,082 | 46.9%) have the highest median income of $43,421 per family member.
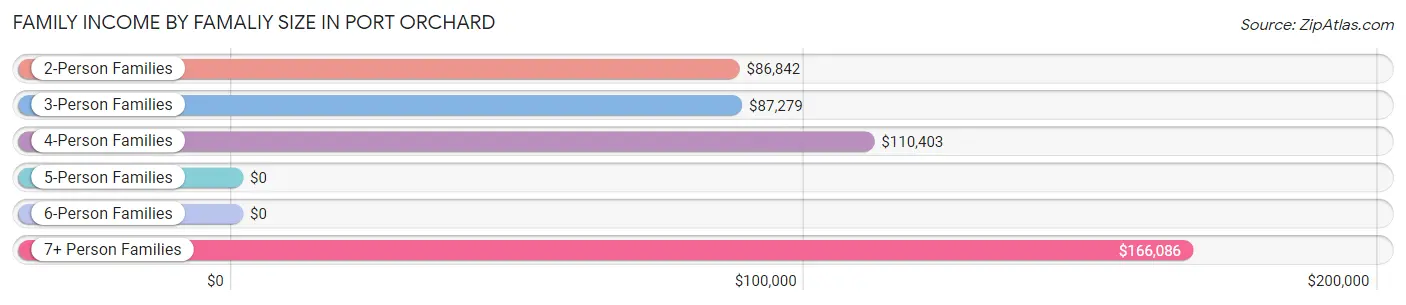
| Income Bracket | # Families | Median Income |
| 2-Person Families | 2,082 (46.9%) | $86,842 |
| 3-Person Families | 963 (21.7%) | $87,279 |
| 4-Person Families | 973 (21.9%) | $110,403 |
| 5-Person Families | 214 (4.8%) | $0 |
| 6-Person Families | 92 (2.1%) | $0 |
| 7+ Person Families | 112 (2.5%) | $166,086 |
| Total | 4,436 (100.0%) | $98,500 |
Family Income by Number of Earners in Port Orchard
The median family income in Port Orchard is $98,500, with families comprising 3+ earners (379) having the highest median family income of $143,264, while families with 1 earner (1,561) have the lowest median family income of $52,333, accounting for 8.5% and 35.2% of families, respectively.
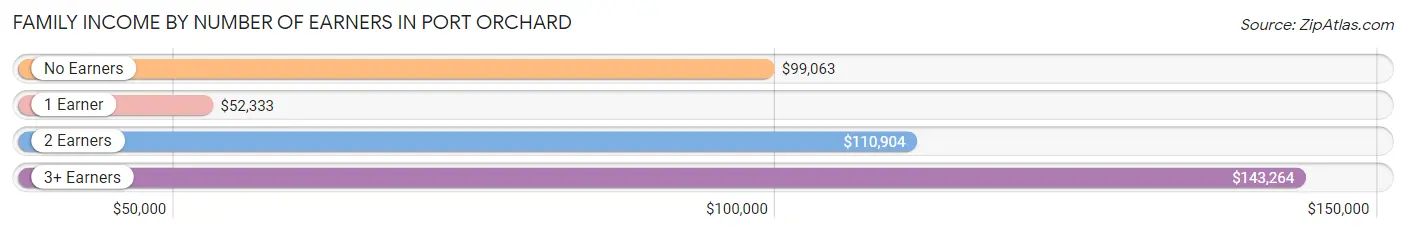
| Number of Earners | # Families | Median Income |
| No Earners | 944 (21.3%) | $99,063 |
| 1 Earner | 1,561 (35.2%) | $52,333 |
| 2 Earners | 1,552 (35.0%) | $110,904 |
| 3+ Earners | 379 (8.5%) | $143,264 |
| Total | 4,436 (100.0%) | $98,500 |
Household Income in Port Orchard
Household Income Brackets in Port Orchard
With 1,605 households falling in the category, the $100,000 to $149,999 income range is the most frequent in Port Orchard, accounting for 25.6% of all households. In contrast, only 226 households (3.6%) fall into the $10,000 to $14,999 income bracket, making it the least populous group.
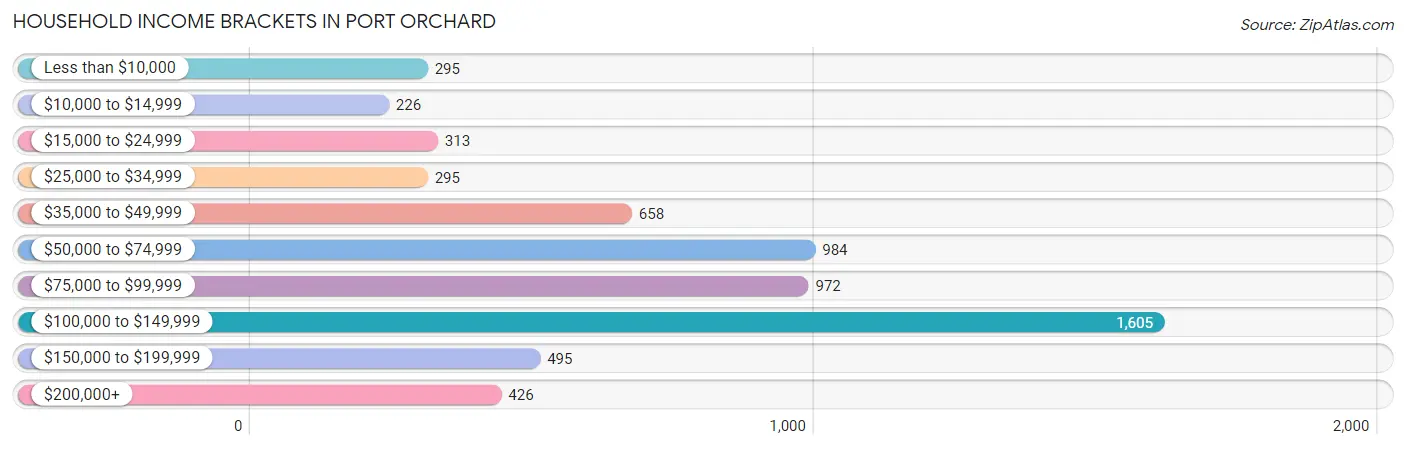
| Income Bracket | # Households | % Households |
| Less than $10,000 | 295 | 4.7% |
| $10,000 to $14,999 | 226 | 3.6% |
| $15,000 to $24,999 | 313 | 5.0% |
| $25,000 to $34,999 | 295 | 4.7% |
| $35,000 to $49,999 | 658 | 10.5% |
| $50,000 to $74,999 | 984 | 15.7% |
| $75,000 to $99,999 | 972 | 15.5% |
| $100,000 to $149,999 | 1,605 | 25.6% |
| $150,000 to $199,999 | 495 | 7.9% |
| $200,000+ | 426 | 6.8% |
Household Income by Householder Age in Port Orchard
The median household income in Port Orchard is $82,650, with the highest median household income of $97,750 found in the 45 to 64 years age bracket for the primary householder. A total of 2,124 households (33.9%) fall into this category. Meanwhile, the 15 to 24 years age bracket for the primary householder has the lowest median household income of $61,250, with 306 households (4.9%) in this group.
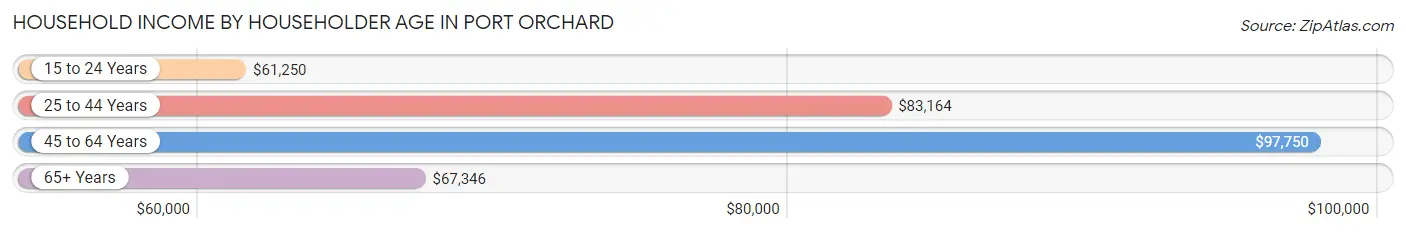
| Income Bracket | # Households | Median Income |
| 15 to 24 Years | 306 (4.9%) | $61,250 |
| 25 to 44 Years | 2,614 (41.7%) | $83,164 |
| 45 to 64 Years | 2,124 (33.9%) | $97,750 |
| 65+ Years | 1,225 (19.5%) | $67,346 |
| Total | 6,269 (100.0%) | $82,650 |
Poverty in Port Orchard
Income Below Poverty by Sex and Age in Port Orchard
With 10.1% poverty level for males and 14.0% for females among the residents of Port Orchard, under 5 year old males and under 5 year old females are the most vulnerable to poverty, with 234 males (34.0%) and 170 females (30.3%) in their respective age groups living below the poverty level.
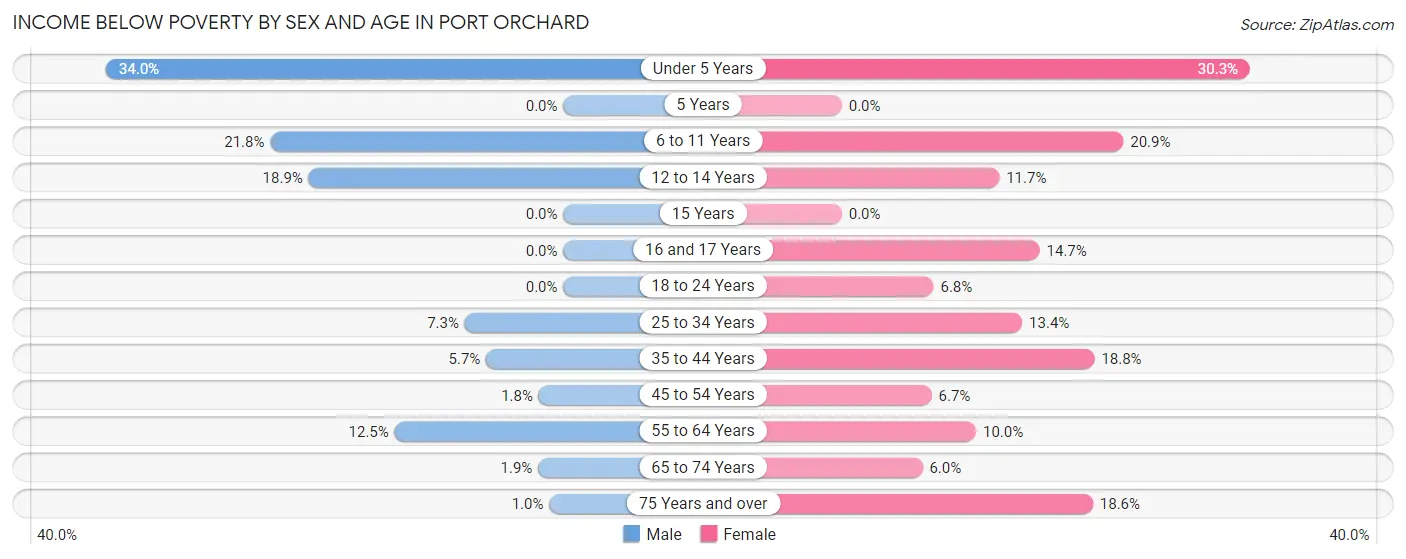
| Age Bracket | Male | Female |
| Under 5 Years | 234 (34.0%) | 170 (30.3%) |
| 5 Years | 0 (0.0%) | 0 (0.0%) |
| 6 to 11 Years | 198 (21.8%) | 154 (20.9%) |
| 12 to 14 Years | 38 (18.9%) | 27 (11.7%) |
| 15 Years | 0 (0.0%) | 0 (0.0%) |
| 16 and 17 Years | 0 (0.0%) | 16 (14.7%) |
| 18 to 24 Years | 0 (0.0%) | 35 (6.8%) |
| 25 to 34 Years | 105 (7.3%) | 223 (13.4%) |
| 35 to 44 Years | 52 (5.7%) | 163 (18.8%) |
| 45 to 54 Years | 15 (1.8%) | 38 (6.7%) |
| 55 to 64 Years | 110 (12.5%) | 101 (10.0%) |
| 65 to 74 Years | 10 (1.9%) | 48 (6.0%) |
| 75 Years and over | 3 (1.0%) | 88 (18.6%) |
| Total | 765 (10.1%) | 1,063 (14.0%) |
Income Above Poverty by Sex and Age in Port Orchard
According to the poverty statistics in Port Orchard, males aged 5 years and females aged 5 years are the age groups that are most secure financially, with 100.0% of males and 100.0% of females in these age groups living above the poverty line.
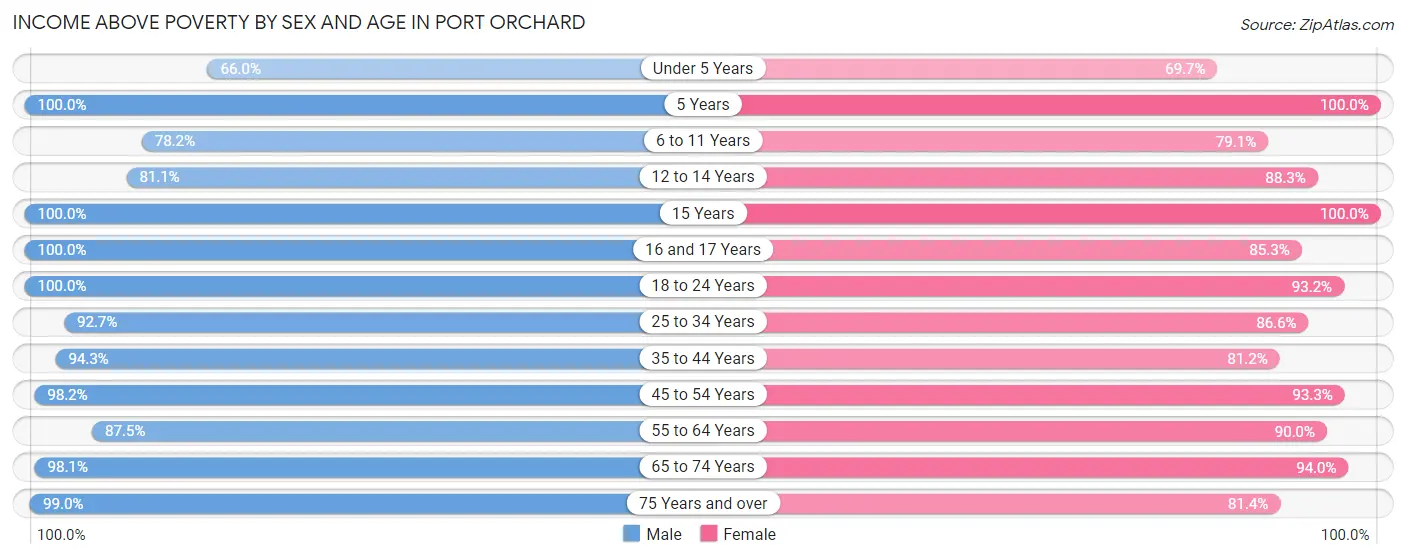
| Age Bracket | Male | Female |
| Under 5 Years | 455 (66.0%) | 391 (69.7%) |
| 5 Years | 204 (100.0%) | 13 (100.0%) |
| 6 to 11 Years | 712 (78.2%) | 583 (79.1%) |
| 12 to 14 Years | 163 (81.1%) | 204 (88.3%) |
| 15 Years | 10 (100.0%) | 44 (100.0%) |
| 16 and 17 Years | 192 (100.0%) | 93 (85.3%) |
| 18 to 24 Years | 471 (100.0%) | 479 (93.2%) |
| 25 to 34 Years | 1,329 (92.7%) | 1,443 (86.6%) |
| 35 to 44 Years | 855 (94.3%) | 706 (81.2%) |
| 45 to 54 Years | 811 (98.2%) | 532 (93.3%) |
| 55 to 64 Years | 768 (87.5%) | 912 (90.0%) |
| 65 to 74 Years | 526 (98.1%) | 754 (94.0%) |
| 75 Years and over | 285 (99.0%) | 384 (81.4%) |
| Total | 6,781 (89.9%) | 6,538 (86.0%) |
Income Below Poverty Among Married-Couple Families in Port Orchard
The poverty statistics for married-couple families in Port Orchard show that 2.0% or 69 of the total 3,438 families live below the poverty line. Families with 5 or more children have the highest poverty rate of 100.0%, comprising of 20 families. On the other hand, families with 1 or 2 children have the lowest poverty rate of 0.9%, which includes 12 families.
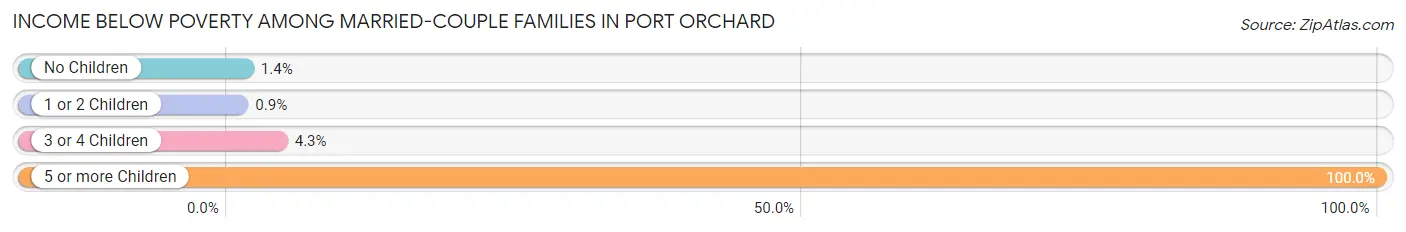
| Children | Above Poverty | Below Poverty |
| No Children | 1,785 (98.6%) | 25 (1.4%) |
| 1 or 2 Children | 1,319 (99.1%) | 12 (0.9%) |
| 3 or 4 Children | 265 (95.7%) | 12 (4.3%) |
| 5 or more Children | 0 (0.0%) | 20 (100.0%) |
| Total | 3,369 (98.0%) | 69 (2.0%) |
Income Below Poverty Among Single-Parent Households in Port Orchard
According to the poverty data in Port Orchard, 26.9% or 108 single-father households and 38.9% or 232 single-mother households are living below the poverty line. Among single-father households, those with 3 or 4 children have the highest poverty rate, with 26 households (43.3%) experiencing poverty. Likewise, among single-mother households, those with 5 or more children have the highest poverty rate, with 30 households (100.0%) falling below the poverty line.
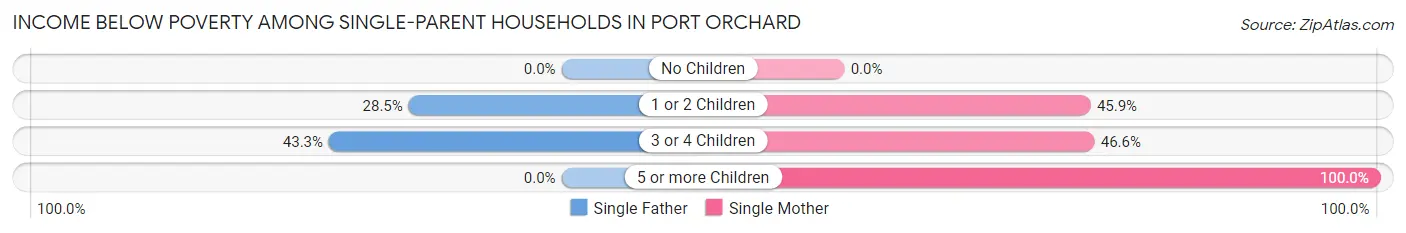
| Children | Single Father | Single Mother |
| No Children | 0 (0.0%) | 0 (0.0%) |
| 1 or 2 Children | 82 (28.5%) | 161 (45.9%) |
| 3 or 4 Children | 26 (43.3%) | 41 (46.6%) |
| 5 or more Children | 0 (0.0%) | 30 (100.0%) |
| Total | 108 (26.9%) | 232 (38.9%) |
Income Below Poverty Among Married-Couple vs Single-Parent Households in Port Orchard
The poverty data for Port Orchard shows that 69 of the married-couple family households (2.0%) and 340 of the single-parent households (34.1%) are living below the poverty level. Within the married-couple family households, those with 5 or more children have the highest poverty rate, with 20 households (100.0%) falling below the poverty line. Among the single-parent households, those with 5 or more children have the highest poverty rate, with 30 household (100.0%) living below poverty.
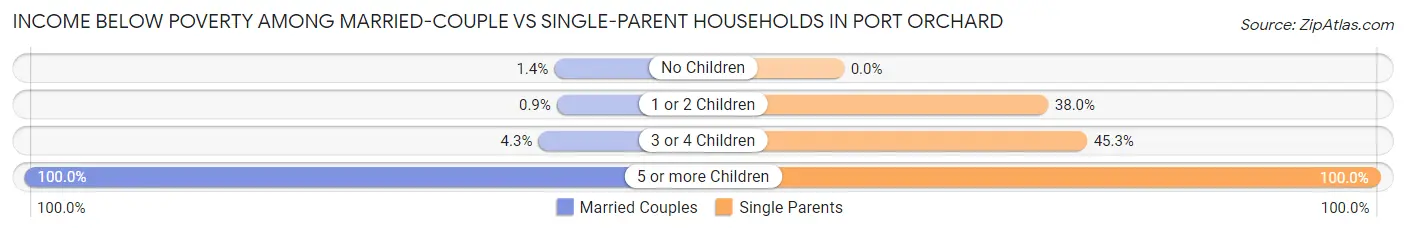
| Children | Married-Couple Families | Single-Parent Households |
| No Children | 25 (1.4%) | 0 (0.0%) |
| 1 or 2 Children | 12 (0.9%) | 243 (38.0%) |
| 3 or 4 Children | 12 (4.3%) | 67 (45.3%) |
| 5 or more Children | 20 (100.0%) | 30 (100.0%) |
| Total | 69 (2.0%) | 340 (34.1%) |
Race in Port Orchard
The most populous races in Port Orchard are White / Caucasian (11,435 | 72.3%), Two or more Races (2,469 | 15.6%), and Hispanic or Latino (1,937 | 12.2%).
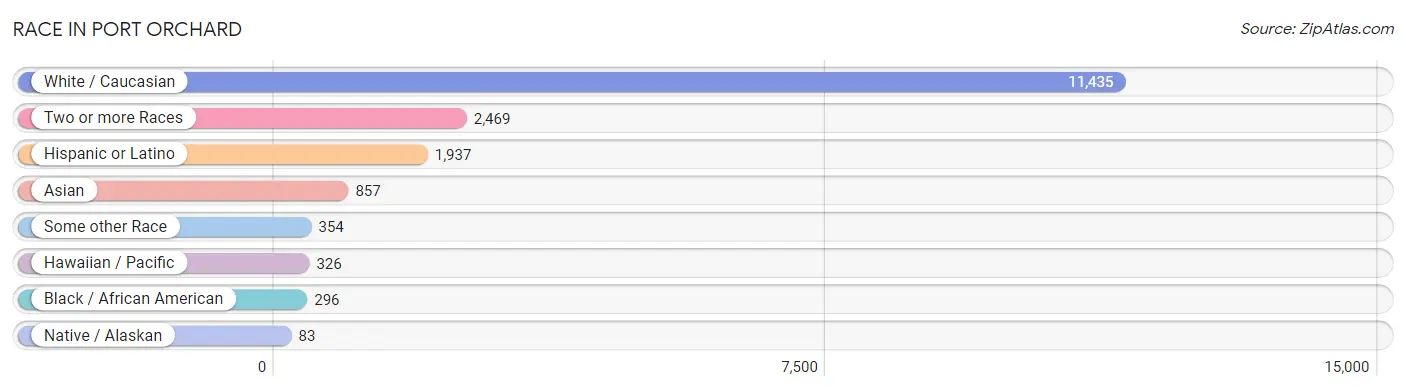
| Race | # Population | % Population |
| Asian | 857 | 5.4% |
| Black / African American | 296 | 1.9% |
| Hawaiian / Pacific | 326 | 2.1% |
| Hispanic or Latino | 1,937 | 12.2% |
| Native / Alaskan | 83 | 0.5% |
| White / Caucasian | 11,435 | 72.3% |
| Two or more Races | 2,469 | 15.6% |
| Some other Race | 354 | 2.2% |
| Total | 15,820 | 100.0% |
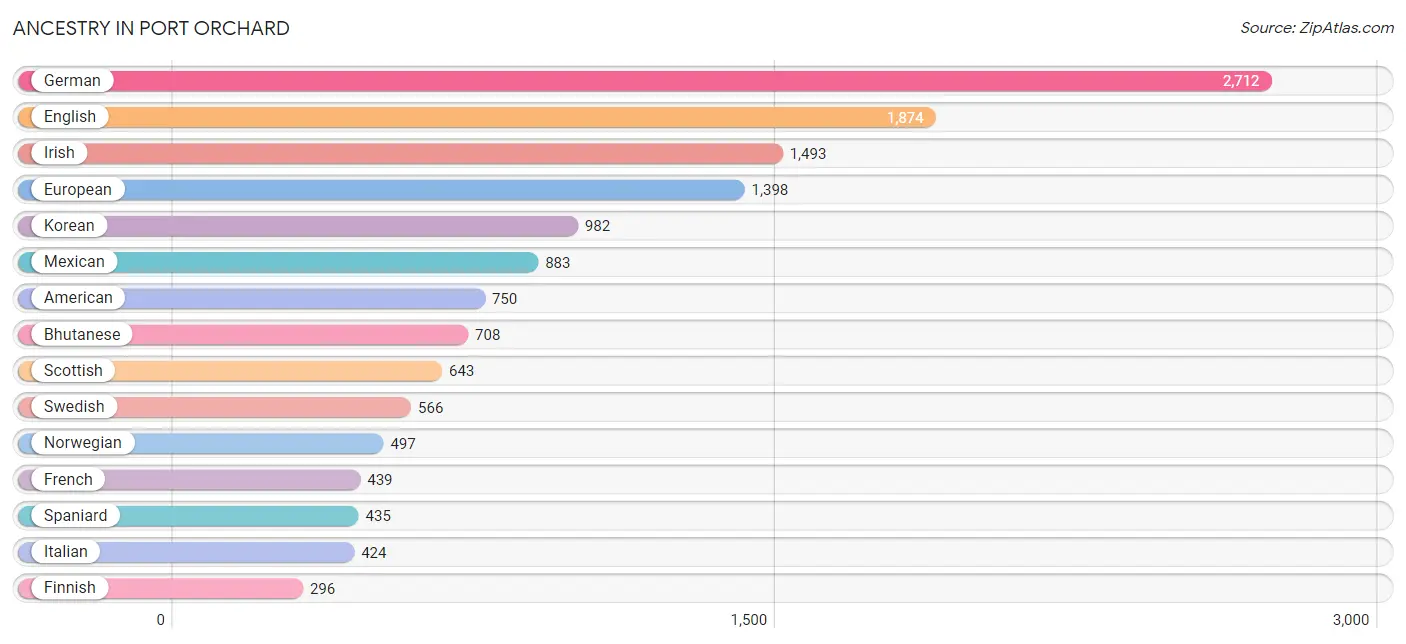
Ancestry in Port Orchard
The most populous ancestries reported in Port Orchard are German (2,712 | 17.1%), English (1,874 | 11.8%), Irish (1,493 | 9.4%), European (1,398 | 8.8%), and Korean (982 | 6.2%), together accounting for 53.5% of all Port Orchard residents.
| Ancestry | # Population | % Population |
| African | 38 | 0.2% |
| Aleut | 25 | 0.2% |
| American | 750 | 4.7% |
| Arab | 20 | 0.1% |
| Armenian | 34 | 0.2% |
| Austrian | 17 | 0.1% |
| Bhutanese | 708 | 4.5% |
| Blackfeet | 4 | 0.0% |
| Brazilian | 15 | 0.1% |
| British | 58 | 0.4% |
| Burmese | 104 | 0.7% |
| Canadian | 22 | 0.1% |
| Celtic | 14 | 0.1% |
| Central American | 34 | 0.2% |
| Cherokee | 72 | 0.5% |
| Colombian | 85 | 0.5% |
| Colville | 11 | 0.1% |
| Croatian | 13 | 0.1% |
| Cuban | 151 | 0.9% |
| Czech | 77 | 0.5% |
| Danish | 27 | 0.2% |
| Dutch | 122 | 0.8% |
| Eastern European | 54 | 0.3% |
| English | 1,874 | 11.8% |
| European | 1,398 | 8.8% |
| Fijian | 146 | 0.9% |
| Finnish | 296 | 1.9% |
| French | 439 | 2.8% |
| French Canadian | 115 | 0.7% |
| German | 2,712 | 17.1% |
| Greek | 44 | 0.3% |
| Guamanian / Chamorro | 153 | 1.0% |
| Guatemalan | 34 | 0.2% |
| Guyanese | 17 | 0.1% |
| Hungarian | 16 | 0.1% |
| Indian (Asian) | 176 | 1.1% |
| Irish | 1,493 | 9.4% |
| Italian | 424 | 2.7% |
| Korean | 982 | 6.2% |
| Lebanese | 20 | 0.1% |
| Lithuanian | 25 | 0.2% |
| Mexican | 883 | 5.6% |
| Mexican American Indian | 6 | 0.0% |
| Native Hawaiian | 131 | 0.8% |
| Northern European | 52 | 0.3% |
| Norwegian | 497 | 3.1% |
| Polish | 188 | 1.2% |
| Portuguese | 101 | 0.6% |
| Pueblo | 2 | 0.0% |
| Puerto Rican | 103 | 0.6% |
| Puget Sound Salish | 15 | 0.1% |
| Russian | 44 | 0.3% |
| Samoan | 26 | 0.2% |
| Scandinavian | 260 | 1.6% |
| Scotch-Irish | 218 | 1.4% |
| Scottish | 643 | 4.1% |
| Serbian | 15 | 0.1% |
| Slovak | 17 | 0.1% |
| South American | 85 | 0.5% |
| Spaniard | 435 | 2.8% |
| Spanish | 228 | 1.4% |
| Sri Lankan | 122 | 0.8% |
| Subsaharan African | 38 | 0.2% |
| Swedish | 566 | 3.6% |
| Swiss | 34 | 0.2% |
| Tlingit-Haida | 19 | 0.1% |
| Trinidadian and Tobagonian | 112 | 0.7% |
| Welsh | 101 | 0.6% |
| Yakama | 33 | 0.2% |
| Yup'ik | 22 | 0.1% | View All 70 Rows |
Immigrants in Port Orchard
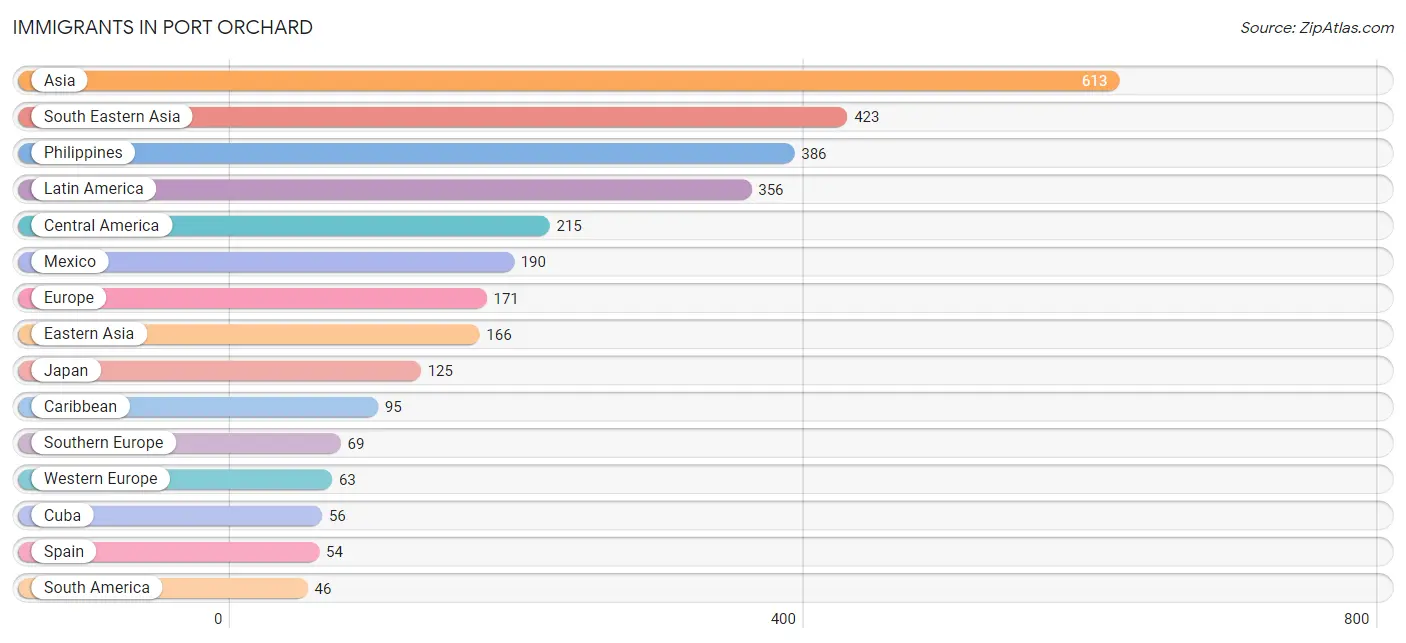
The most numerous immigrant groups reported in Port Orchard came from Asia (613 | 3.9%), South Eastern Asia (423 | 2.7%), Philippines (386 | 2.4%), Latin America (356 | 2.2%), and Central America (215 | 1.4%), together accounting for 12.6% of all Port Orchard residents.
| Immigration Origin | # Population | % Population |
| Asia | 613 | 3.9% |
| Brazil | 15 | 0.1% |
| Canada | 43 | 0.3% |
| Caribbean | 95 | 0.6% |
| Central America | 215 | 1.4% |
| Colombia | 31 | 0.2% |
| Cuba | 56 | 0.4% |
| Eastern Asia | 166 | 1.1% |
| Europe | 171 | 1.1% |
| France | 35 | 0.2% |
| Germany | 28 | 0.2% |
| Guatemala | 25 | 0.2% |
| Italy | 15 | 0.1% |
| Japan | 125 | 0.8% |
| Kazakhstan | 24 | 0.2% |
| Korea | 41 | 0.3% |
| Latin America | 356 | 2.2% |
| Mexico | 190 | 1.2% |
| Northern Europe | 39 | 0.3% |
| Oceania | 25 | 0.2% |
| Philippines | 386 | 2.4% |
| Scotland | 39 | 0.3% |
| South America | 46 | 0.3% |
| South Central Asia | 24 | 0.2% |
| South Eastern Asia | 423 | 2.7% |
| Southern Europe | 69 | 0.4% |
| Spain | 54 | 0.3% |
| Trinidad and Tobago | 39 | 0.3% |
| Vietnam | 37 | 0.2% |
| Western Europe | 63 | 0.4% | View All 30 Rows |
Sex and Age in Port Orchard
Sex and Age in Port Orchard
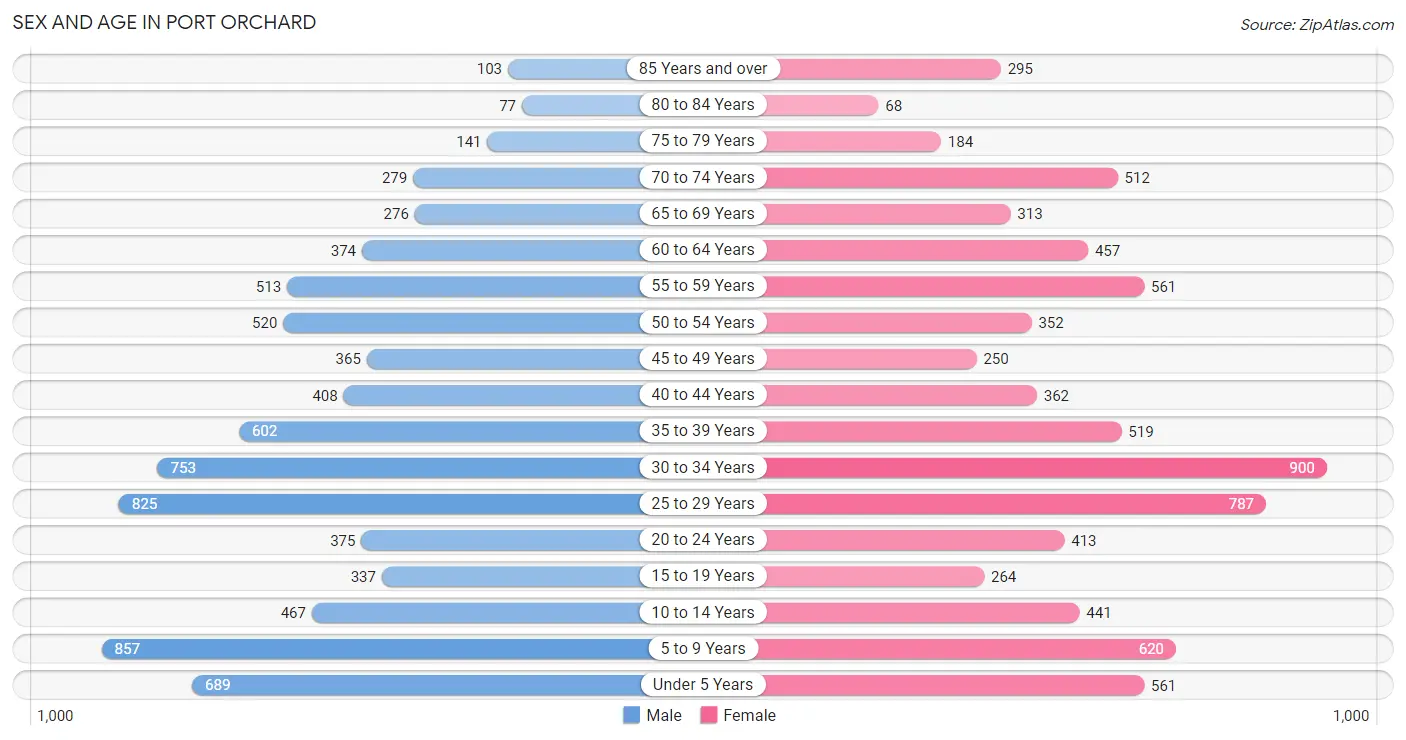
The most populous age groups in Port Orchard are 5 to 9 Years (857 | 10.8%) for men and 30 to 34 Years (900 | 11.5%) for women.
| Age Bracket | Male | Female |
| Under 5 Years | 689 (8.6%) | 561 (7.1%) |
| 5 to 9 Years | 857 (10.8%) | 620 (7.9%) |
| 10 to 14 Years | 467 (5.9%) | 441 (5.6%) |
| 15 to 19 Years | 337 (4.2%) | 264 (3.4%) |
| 20 to 24 Years | 375 (4.7%) | 413 (5.3%) |
| 25 to 29 Years | 825 (10.4%) | 787 (10.0%) |
| 30 to 34 Years | 753 (9.5%) | 900 (11.5%) |
| 35 to 39 Years | 602 (7.6%) | 519 (6.6%) |
| 40 to 44 Years | 408 (5.1%) | 362 (4.6%) |
| 45 to 49 Years | 365 (4.6%) | 250 (3.2%) |
| 50 to 54 Years | 520 (6.5%) | 352 (4.5%) |
| 55 to 59 Years | 513 (6.4%) | 561 (7.1%) |
| 60 to 64 Years | 374 (4.7%) | 457 (5.8%) |
| 65 to 69 Years | 276 (3.5%) | 313 (4.0%) |
| 70 to 74 Years | 279 (3.5%) | 512 (6.5%) |
| 75 to 79 Years | 141 (1.8%) | 184 (2.3%) |
| 80 to 84 Years | 77 (1.0%) | 68 (0.9%) |
| 85 Years and over | 103 (1.3%) | 295 (3.7%) |
| Total | 7,961 (100.0%) | 7,859 (100.0%) |
Families and Households in Port Orchard
Median Family Size in Port Orchard
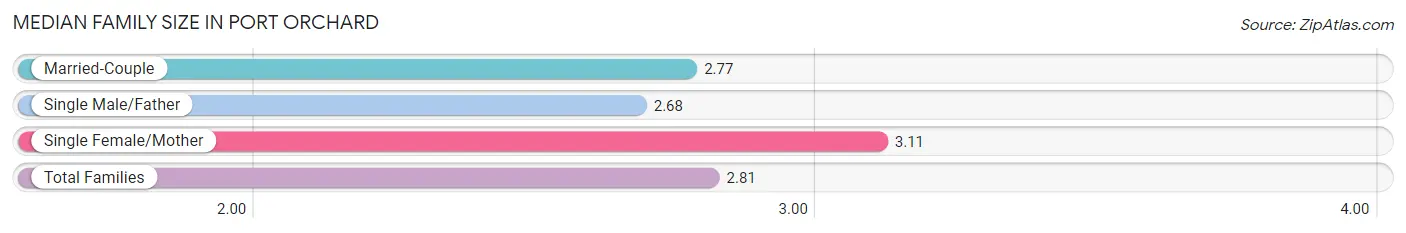
The median family size in Port Orchard is 2.81 persons per family, with single female/mother families (596 | 13.4%) accounting for the largest median family size of 3.11 persons per family. On the other hand, single male/father families (402 | 9.1%) represent the smallest median family size with 2.68 persons per family.
| Family Type | # Families | Family Size |
| Married-Couple | 3,438 (77.5%) | 2.77 |
| Single Male/Father | 402 (9.1%) | 2.68 |
| Single Female/Mother | 596 (13.4%) | 3.11 |
| Total Families | 4,436 (100.0%) | 2.81 |
Median Household Size in Port Orchard
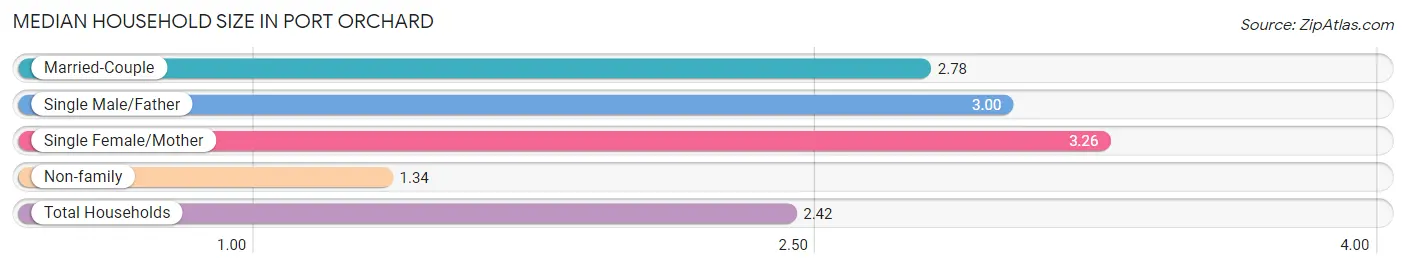
The median household size in Port Orchard is 2.42 persons per household, with single female/mother households (596 | 9.5%) accounting for the largest median household size of 3.26 persons per household. non-family households (1,833 | 29.2%) represent the smallest median household size with 1.34 persons per household.
| Household Type | # Households | Household Size |
| Married-Couple | 3,438 (54.8%) | 2.78 |
| Single Male/Father | 402 (6.4%) | 3.00 |
| Single Female/Mother | 596 (9.5%) | 3.26 |
| Non-family | 1,833 (29.2%) | 1.34 |
| Total Households | 6,269 (100.0%) | 2.42 |
Household Size by Marriage Status in Port Orchard
Out of a total of 6,269 households in Port Orchard, 4,436 (70.8%) are family households, while 1,833 (29.2%) are nonfamily households. The most numerous type of family households are 2-person households, comprising 1,880, and the most common type of nonfamily households are 1-person households, comprising 1,425.
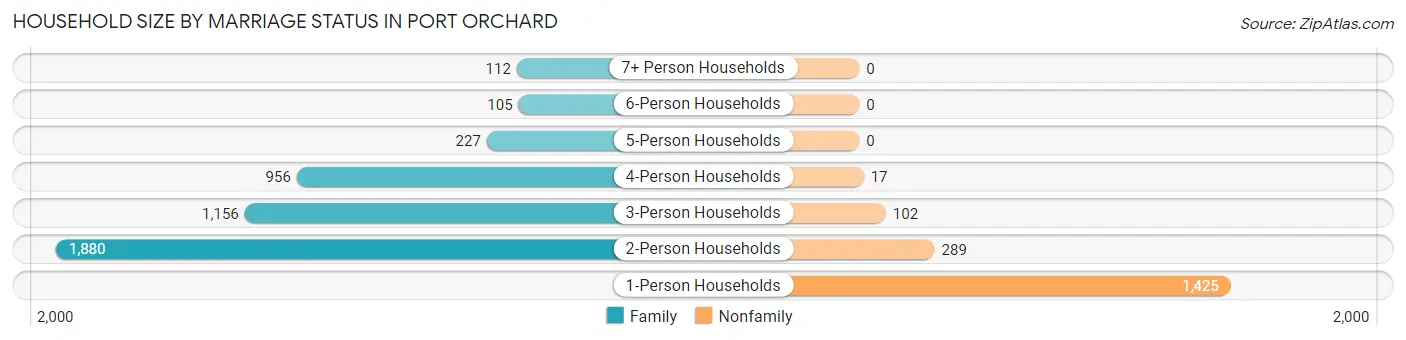
| Household Size | Family Households | Nonfamily Households |
| 1-Person Households | - | 1,425 (22.7%) |
| 2-Person Households | 1,880 (30.0%) | 289 (4.6%) |
| 3-Person Households | 1,156 (18.4%) | 102 (1.6%) |
| 4-Person Households | 956 (15.2%) | 17 (0.3%) |
| 5-Person Households | 227 (3.6%) | 0 (0.0%) |
| 6-Person Households | 105 (1.7%) | 0 (0.0%) |
| 7+ Person Households | 112 (1.8%) | 0 (0.0%) |
| Total | 4,436 (70.8%) | 1,833 (29.2%) |
Female Fertility in Port Orchard
Fertility by Age in Port Orchard
Average fertility rate in Port Orchard is 47.0 births per 1,000 women. Women in the age bracket of 20 to 34 years have the highest fertility rate with 65.0 births per 1,000 women. Women in the age bracket of 20 to 34 years acount for 80.0% of all women with births.
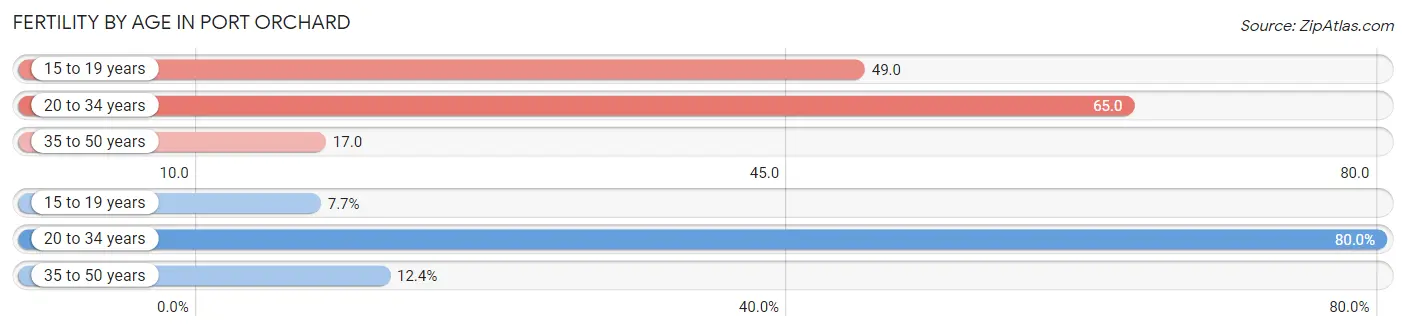
| Age Bracket | Women with Births | Births / 1,000 Women |
| 15 to 19 years | 13 (7.6%) | 49.0 |
| 20 to 34 years | 136 (80.0%) | 65.0 |
| 35 to 50 years | 21 (12.3%) | 17.0 |
| Total | 170 (100.0%) | 47.0 |
Fertility by Age by Marriage Status in Port Orchard
76.5% of women with births (170) in Port Orchard are married. The highest percentage of unmarried women with births falls into 15 to 19 years age bracket with 100.0% of them unmarried at the time of birth, while the lowest percentage of unmarried women with births belong to 35 to 50 years age bracket with 0.0% of them unmarried.
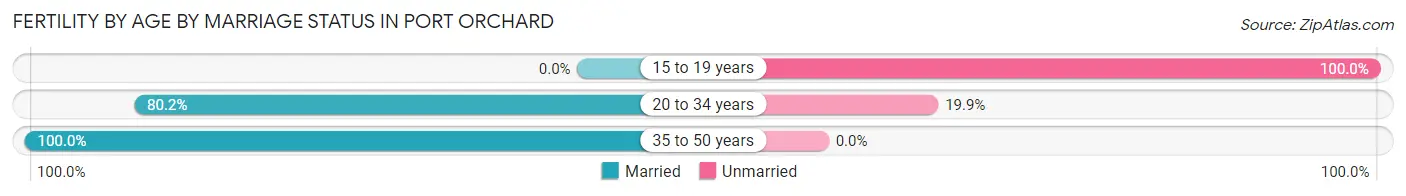
| Age Bracket | Married | Unmarried |
| 15 to 19 years | 0 (0.0%) | 13 (100.0%) |
| 20 to 34 years | 109 (80.1%) | 27 (19.9%) |
| 35 to 50 years | 21 (100.0%) | 0 (0.0%) |
| Total | 130 (76.5%) | 40 (23.5%) |
Fertility by Education in Port Orchard
Average fertility rate in Port Orchard is 47.0 births per 1,000 women. Women with the education attainment of graduate degree have the highest fertility rate of 112.0 births per 1,000 women, while women with the education attainment of bachelor's degree have the lowest fertility at 13.0 births per 1,000 women. Women with the education attainment of high school diploma represent 37.7% of all women with births.
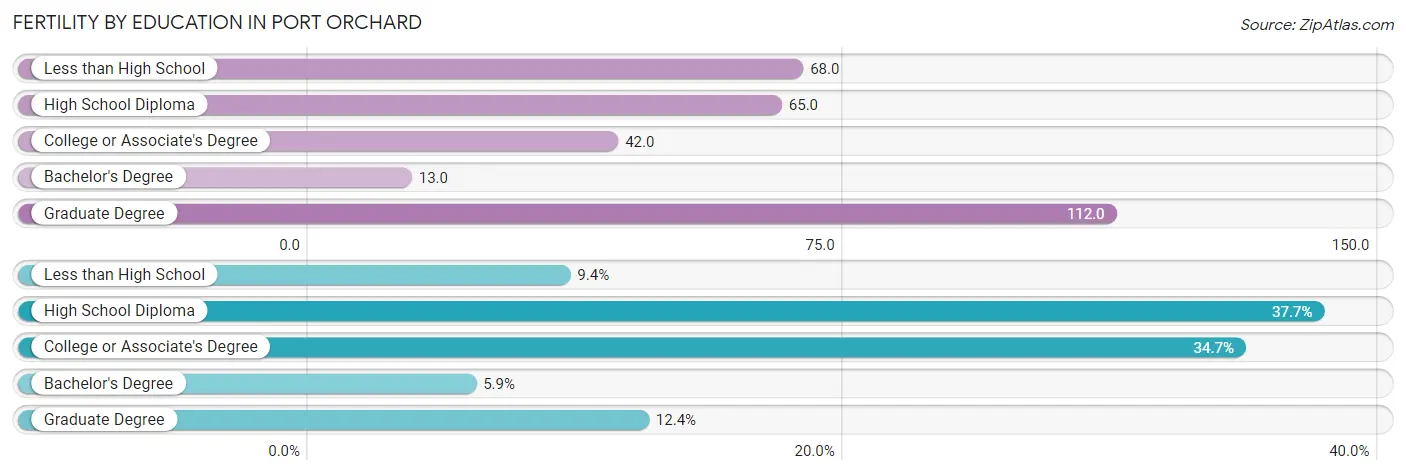
| Educational Attainment | Women with Births | Births / 1,000 Women |
| Less than High School | 16 (9.4%) | 68.0 |
| High School Diploma | 64 (37.7%) | 65.0 |
| College or Associate's Degree | 59 (34.7%) | 42.0 |
| Bachelor's Degree | 10 (5.9%) | 13.0 |
| Graduate Degree | 21 (12.3%) | 112.0 |
| Total | 170 (100.0%) | 47.0 |
Fertility by Education by Marriage Status in Port Orchard
23.5% of women with births in Port Orchard are unmarried. Women with the educational attainment of less than high school are most likely to be married with 100.0% of them married at childbirth, while women with the educational attainment of high school diploma are least likely to be married with 62.5% of them unmarried at childbirth.
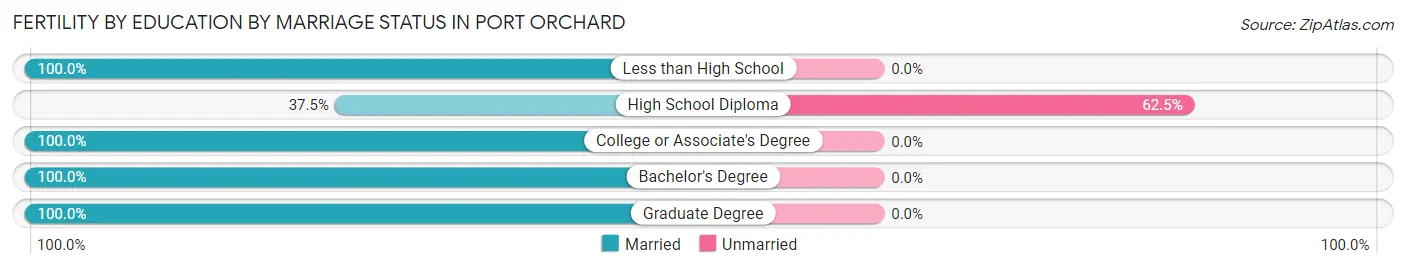
| Educational Attainment | Married | Unmarried |
| Less than High School | 16 (100.0%) | 0 (0.0%) |
| High School Diploma | 24 (37.5%) | 40 (62.5%) |
| College or Associate's Degree | 59 (100.0%) | 0 (0.0%) |
| Bachelor's Degree | 10 (100.0%) | 0 (0.0%) |
| Graduate Degree | 21 (100.0%) | 0 (0.0%) |
| Total | 130 (76.5%) | 40 (23.5%) |
Employment Characteristics in Port Orchard
Employment by Class of Employer in Port Orchard
Among the 7,044 employed individuals in Port Orchard, private company employees (3,316 | 47.1%), federal government employees (2,018 | 28.6%), and not-for-profit organizations (772 | 11.0%) make up the most common classes of employment.
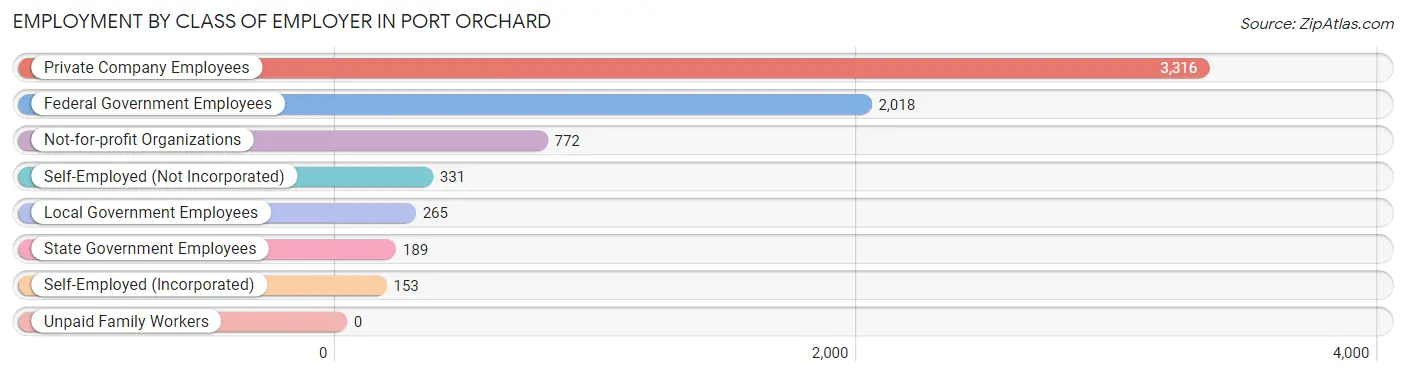
| Employer Class | # Employees | % Employees |
| Private Company Employees | 3,316 | 47.1% |
| Self-Employed (Incorporated) | 153 | 2.2% |
| Self-Employed (Not Incorporated) | 331 | 4.7% |
| Not-for-profit Organizations | 772 | 11.0% |
| Local Government Employees | 265 | 3.8% |
| State Government Employees | 189 | 2.7% |
| Federal Government Employees | 2,018 | 28.6% |
| Unpaid Family Workers | 0 | 0.0% |
| Total | 7,044 | 100.0% |
Employment Status by Age in Port Orchard
According to the labor force statistics for Port Orchard, out of the total population over 16 years of age (12,131), 61.2% or 7,424 individuals are in the labor force, with 4.8% or 356 of them unemployed. The age group with the highest labor force participation rate is 20 to 24 years, with 87.3% or 688 individuals in the labor force. Within the labor force, the 30 to 34 years age range has the highest percentage of unemployed individuals, with 8.5% or 113 of them being unemployed.
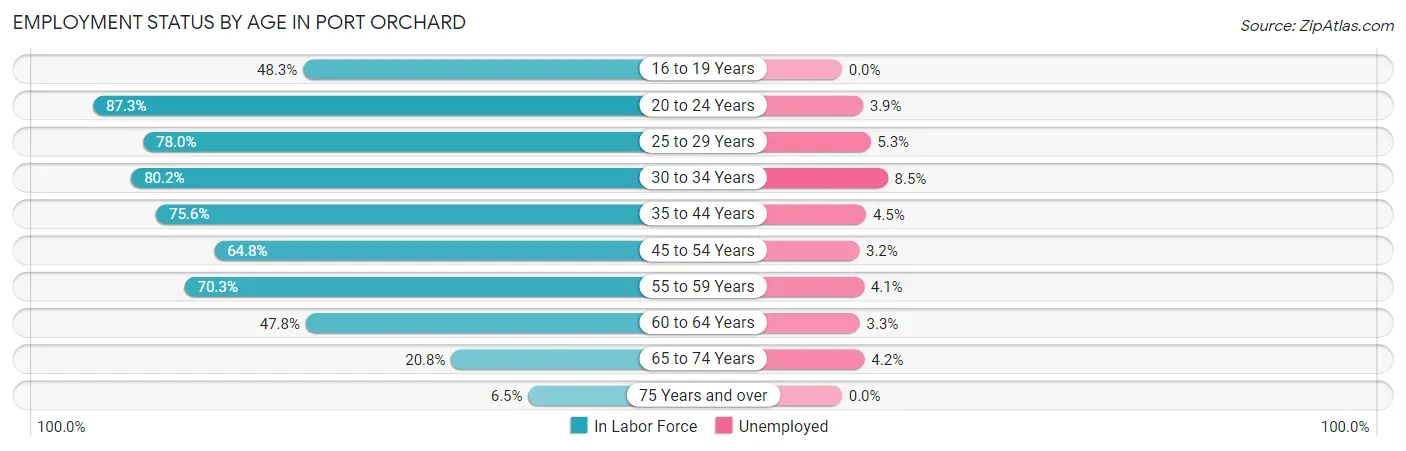
| Age Bracket | In Labor Force | Unemployed |
| 16 to 19 Years | 264 (48.3%) | 0 (0.0%) |
| 20 to 24 Years | 688 (87.3%) | 27 (3.9%) |
| 25 to 29 Years | 1,257 (78.0%) | 67 (5.3%) |
| 30 to 34 Years | 1,326 (80.2%) | 113 (8.5%) |
| 35 to 44 Years | 1,430 (75.6%) | 64 (4.5%) |
| 45 to 54 Years | 964 (64.8%) | 31 (3.2%) |
| 55 to 59 Years | 755 (70.3%) | 31 (4.1%) |
| 60 to 64 Years | 397 (47.8%) | 13 (3.3%) |
| 65 to 74 Years | 287 (20.8%) | 12 (4.2%) |
| 75 Years and over | 56 (6.5%) | 0 (0.0%) |
| Total | 7,424 (61.2%) | 356 (4.8%) |
Employment Status by Educational Attainment in Port Orchard
According to labor force statistics for Port Orchard, 71.7% of individuals (6,129) out of the total population between 25 and 64 years of age (8,548) are in the labor force, with 5.2% or 319 of them being unemployed. The group with the highest labor force participation rate are those with the educational attainment of bachelor's degree or higher, with 76.1% or 1,883 individuals in the labor force. Within the labor force, individuals with high school diploma education have the highest percentage of unemployment, with 15.5% or 215 of them being unemployed.
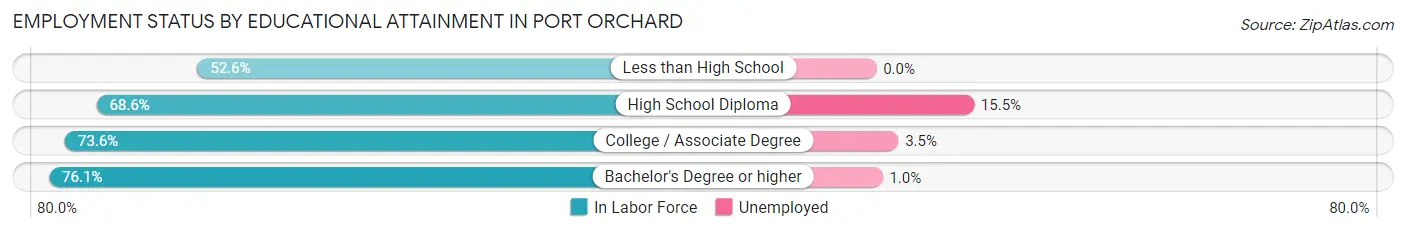
| Educational Attainment | In Labor Force | Unemployed |
| Less than High School | 307 (52.6%) | 0 (0.0%) |
| High School Diploma | 1,390 (68.6%) | 314 (15.5%) |
| College / Associate Degree | 2,550 (73.6%) | 121 (3.5%) |
| Bachelor's Degree or higher | 1,883 (76.1%) | 25 (1.0%) |
| Total | 6,129 (71.7%) | 444 (5.2%) |
Employment Occupations by Sex in Port Orchard
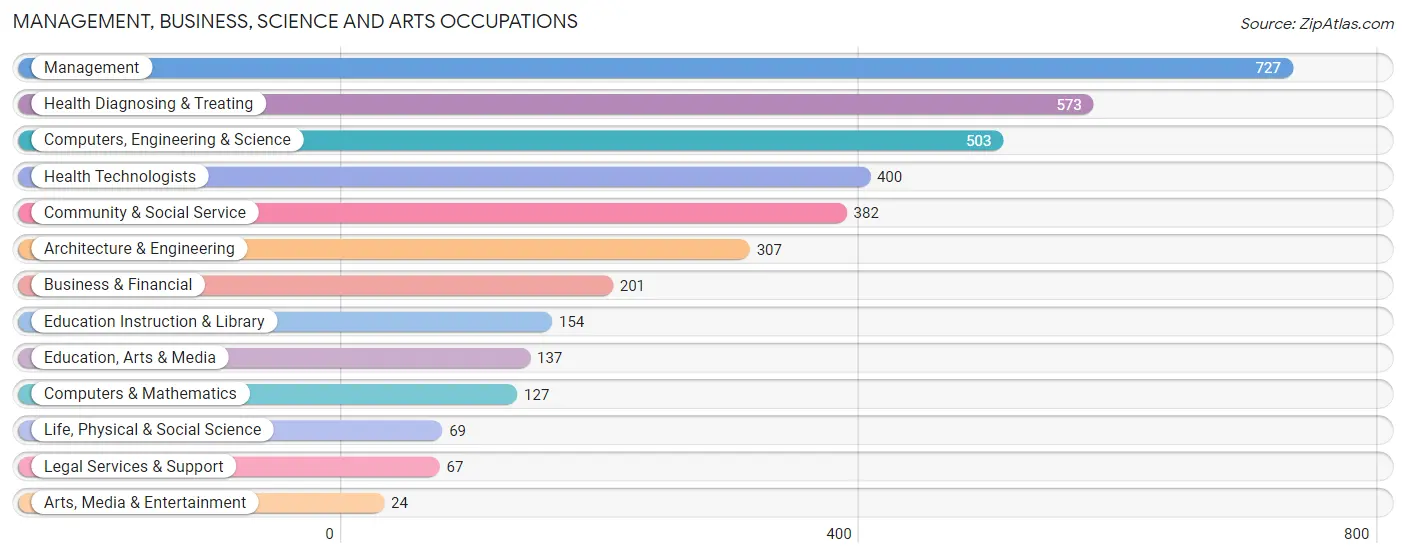
Management, Business, Science and Arts Occupations
The most common Management, Business, Science and Arts occupations in Port Orchard are Management (727 | 11.5%), Health Diagnosing & Treating (573 | 9.0%), Computers, Engineering & Science (503 | 7.9%), Health Technologists (400 | 6.3%), and Community & Social Service (382 | 6.0%).
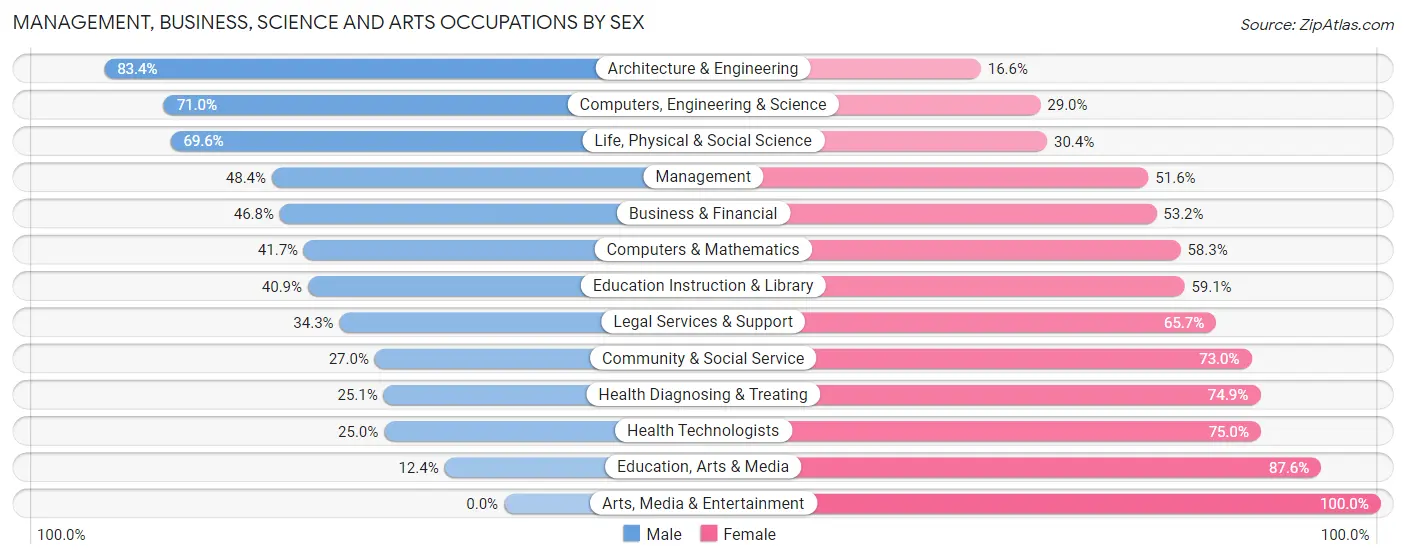
Management, Business, Science and Arts Occupations by Sex
Within the Management, Business, Science and Arts occupations in Port Orchard, the most male-oriented occupations are Architecture & Engineering (83.4%), Computers, Engineering & Science (71.0%), and Life, Physical & Social Science (69.6%), while the most female-oriented occupations are Arts, Media & Entertainment (100.0%), Education, Arts & Media (87.6%), and Health Technologists (75.0%).
| Occupation | Male | Female |
| Management | 352 (48.4%) | 375 (51.6%) |
| Business & Financial | 94 (46.8%) | 107 (53.2%) |
| Computers, Engineering & Science | 357 (71.0%) | 146 (29.0%) |
| Computers & Mathematics | 53 (41.7%) | 74 (58.3%) |
| Architecture & Engineering | 256 (83.4%) | 51 (16.6%) |
| Life, Physical & Social Science | 48 (69.6%) | 21 (30.4%) |
| Community & Social Service | 103 (27.0%) | 279 (73.0%) |
| Education, Arts & Media | 17 (12.4%) | 120 (87.6%) |
| Legal Services & Support | 23 (34.3%) | 44 (65.7%) |
| Education Instruction & Library | 63 (40.9%) | 91 (59.1%) |
| Arts, Media & Entertainment | 0 (0.0%) | 24 (100.0%) |
| Health Diagnosing & Treating | 144 (25.1%) | 429 (74.9%) |
| Health Technologists | 100 (25.0%) | 300 (75.0%) |
| Total (Category) | 1,050 (44.0%) | 1,336 (56.0%) |
| Total (Overall) | 3,135 (49.5%) | 3,204 (50.5%) |
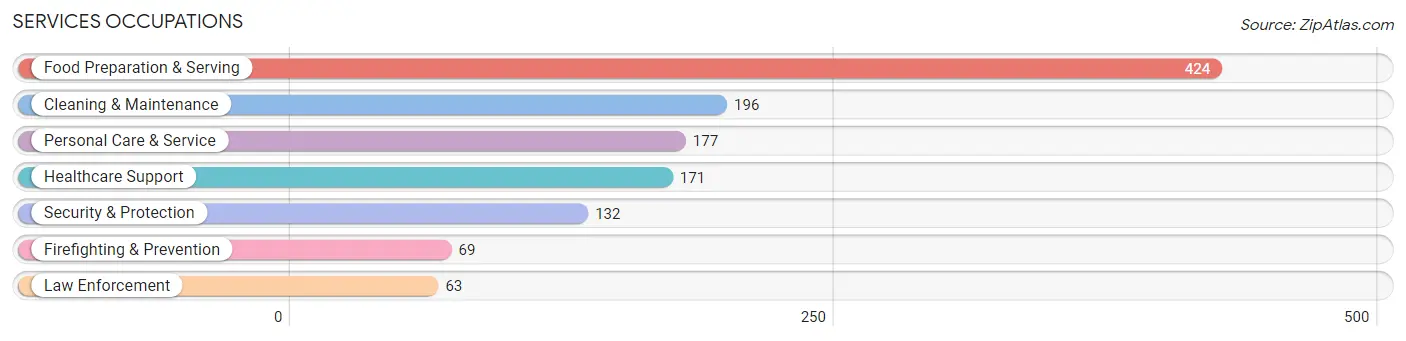
Services Occupations
The most common Services occupations in Port Orchard are Food Preparation & Serving (424 | 6.7%), Cleaning & Maintenance (196 | 3.1%), Personal Care & Service (177 | 2.8%), Healthcare Support (171 | 2.7%), and Security & Protection (132 | 2.1%).
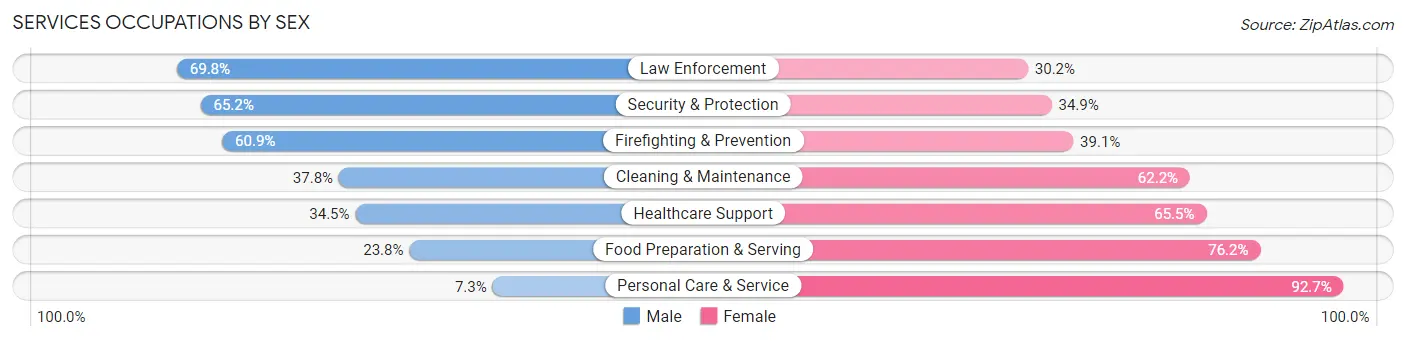
Services Occupations by Sex
Within the Services occupations in Port Orchard, the most male-oriented occupations are Law Enforcement (69.8%), Security & Protection (65.1%), and Firefighting & Prevention (60.9%), while the most female-oriented occupations are Personal Care & Service (92.7%), Food Preparation & Serving (76.2%), and Healthcare Support (65.5%).
| Occupation | Male | Female |
| Healthcare Support | 59 (34.5%) | 112 (65.5%) |
| Security & Protection | 86 (65.1%) | 46 (34.8%) |
| Firefighting & Prevention | 42 (60.9%) | 27 (39.1%) |
| Law Enforcement | 44 (69.8%) | 19 (30.2%) |
| Food Preparation & Serving | 101 (23.8%) | 323 (76.2%) |
| Cleaning & Maintenance | 74 (37.8%) | 122 (62.2%) |
| Personal Care & Service | 13 (7.3%) | 164 (92.7%) |
| Total (Category) | 333 (30.3%) | 767 (69.7%) |
| Total (Overall) | 3,135 (49.5%) | 3,204 (50.5%) |
Sales and Office Occupations
The most common Sales and Office occupations in Port Orchard are Office & Administration (758 | 12.0%), and Sales & Related (577 | 9.1%).
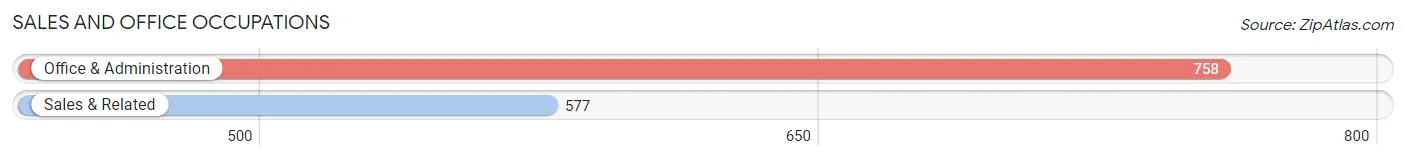
Sales and Office Occupations by Sex

| Occupation | Male | Female |
| Sales & Related | 325 (56.3%) | 252 (43.7%) |
| Office & Administration | 175 (23.1%) | 583 (76.9%) |
| Total (Category) | 500 (37.4%) | 835 (62.5%) |
| Total (Overall) | 3,135 (49.5%) | 3,204 (50.5%) |
Natural Resources, Construction and Maintenance Occupations
The most common Natural Resources, Construction and Maintenance occupations in Port Orchard are Construction & Extraction (460 | 7.3%), and Installation, Maintenance & Repair (259 | 4.1%).
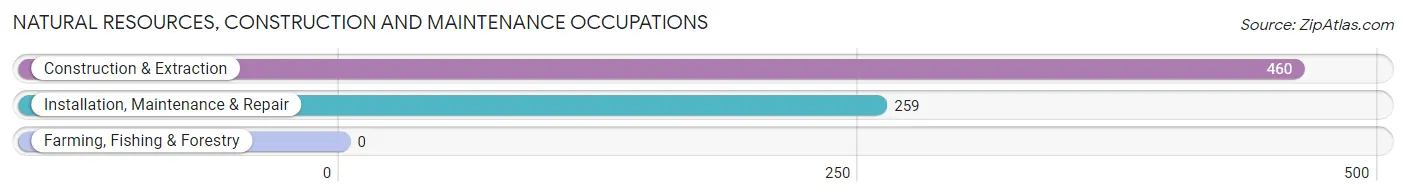
Natural Resources, Construction and Maintenance Occupations by Sex
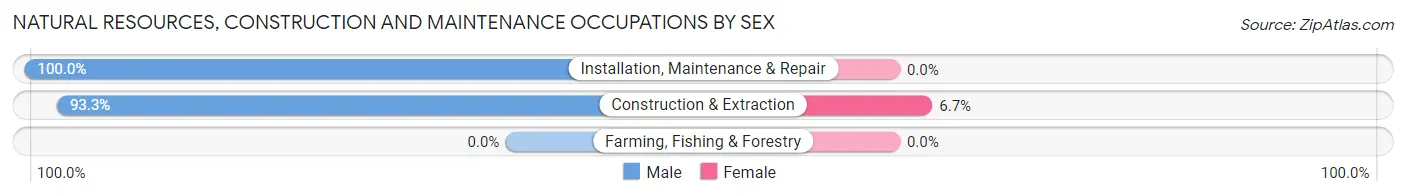
| Occupation | Male | Female |
| Farming, Fishing & Forestry | 0 (0.0%) | 0 (0.0%) |
| Construction & Extraction | 429 (93.3%) | 31 (6.7%) |
| Installation, Maintenance & Repair | 259 (100.0%) | 0 (0.0%) |
| Total (Category) | 688 (95.7%) | 31 (4.3%) |
| Total (Overall) | 3,135 (49.5%) | 3,204 (50.5%) |
Production, Transportation and Moving Occupations
The most common Production, Transportation and Moving occupations in Port Orchard are Production (474 | 7.5%), Material Moving (180 | 2.8%), and Transportation (145 | 2.3%).
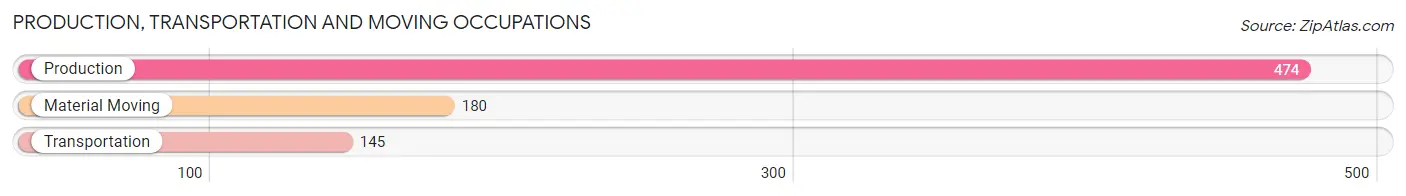
Production, Transportation and Moving Occupations by Sex
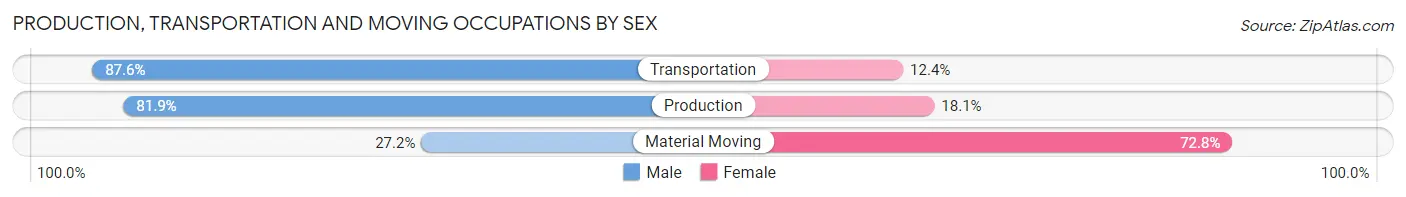
| Occupation | Male | Female |
| Production | 388 (81.9%) | 86 (18.1%) |
| Transportation | 127 (87.6%) | 18 (12.4%) |
| Material Moving | 49 (27.2%) | 131 (72.8%) |
| Total (Category) | 564 (70.6%) | 235 (29.4%) |
| Total (Overall) | 3,135 (49.5%) | 3,204 (50.5%) |
Employment Industries by Sex in Port Orchard
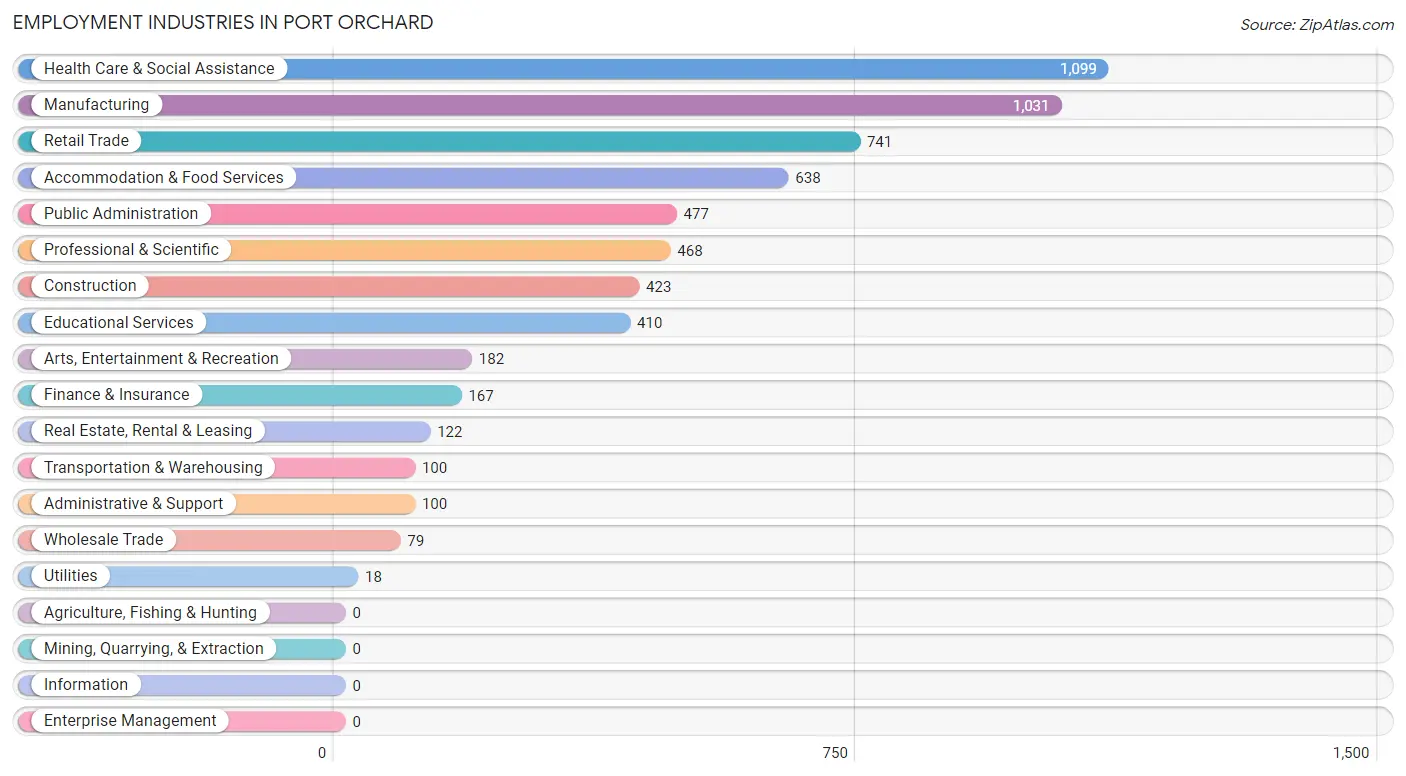
Employment Industries in Port Orchard
The major employment industries in Port Orchard include Health Care & Social Assistance (1,099 | 17.3%), Manufacturing (1,031 | 16.3%), Retail Trade (741 | 11.7%), Accommodation & Food Services (638 | 10.1%), and Public Administration (477 | 7.5%).
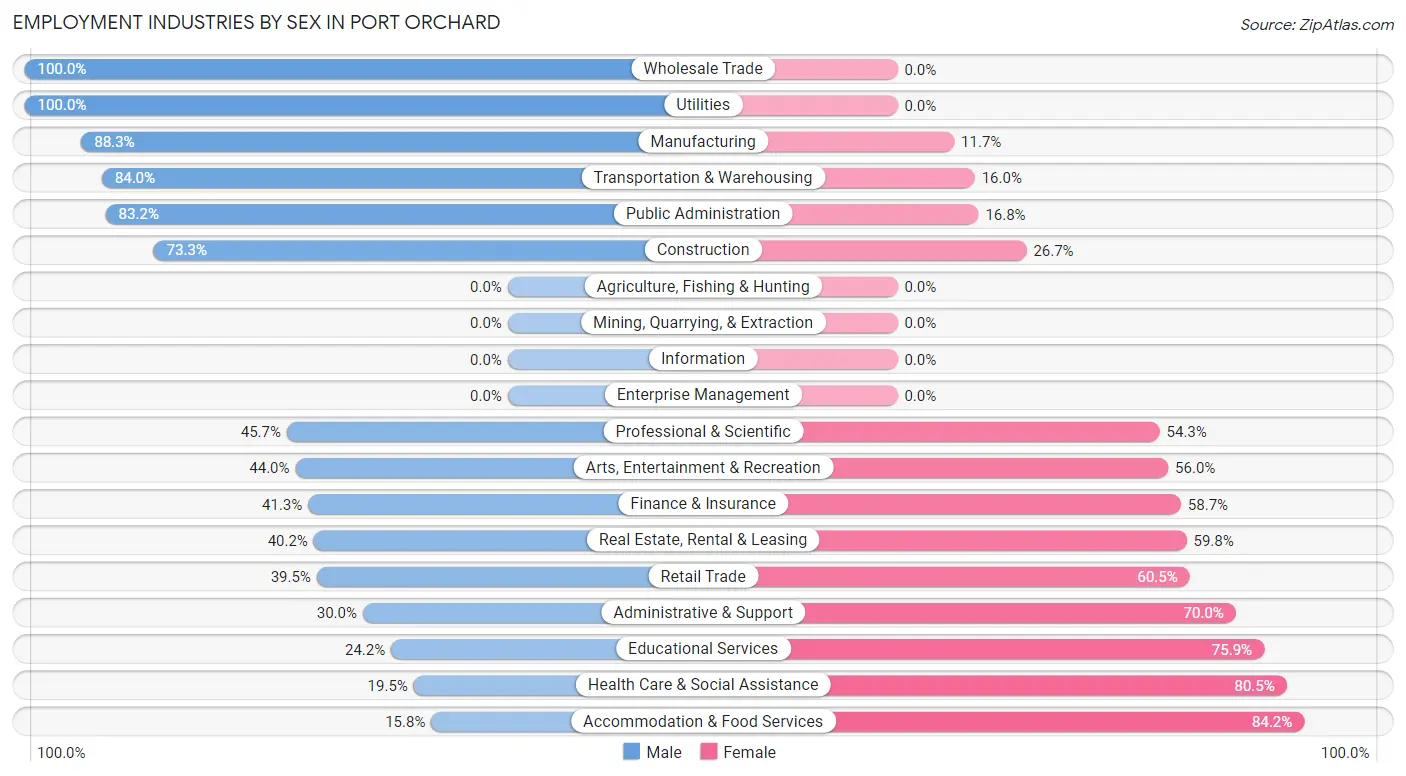
Employment Industries by Sex in Port Orchard
The Port Orchard industries that see more men than women are Wholesale Trade (100.0%), Utilities (100.0%), and Manufacturing (88.3%), whereas the industries that tend to have a higher number of women are Accommodation & Food Services (84.2%), Health Care & Social Assistance (80.5%), and Educational Services (75.8%).
| Industry | Male | Female |
| Agriculture, Fishing & Hunting | 0 (0.0%) | 0 (0.0%) |
| Mining, Quarrying, & Extraction | 0 (0.0%) | 0 (0.0%) |
| Construction | 310 (73.3%) | 113 (26.7%) |
| Manufacturing | 910 (88.3%) | 121 (11.7%) |
| Wholesale Trade | 79 (100.0%) | 0 (0.0%) |
| Retail Trade | 293 (39.5%) | 448 (60.5%) |
| Transportation & Warehousing | 84 (84.0%) | 16 (16.0%) |
| Utilities | 18 (100.0%) | 0 (0.0%) |
| Information | 0 (0.0%) | 0 (0.0%) |
| Finance & Insurance | 69 (41.3%) | 98 (58.7%) |
| Real Estate, Rental & Leasing | 49 (40.2%) | 73 (59.8%) |
| Professional & Scientific | 214 (45.7%) | 254 (54.3%) |
| Enterprise Management | 0 (0.0%) | 0 (0.0%) |
| Administrative & Support | 30 (30.0%) | 70 (70.0%) |
| Educational Services | 99 (24.1%) | 311 (75.8%) |
| Health Care & Social Assistance | 214 (19.5%) | 885 (80.5%) |
| Arts, Entertainment & Recreation | 80 (44.0%) | 102 (56.0%) |
| Accommodation & Food Services | 101 (15.8%) | 537 (84.2%) |
| Public Administration | 397 (83.2%) | 80 (16.8%) |
| Total | 3,135 (49.5%) | 3,204 (50.5%) |
Education in Port Orchard
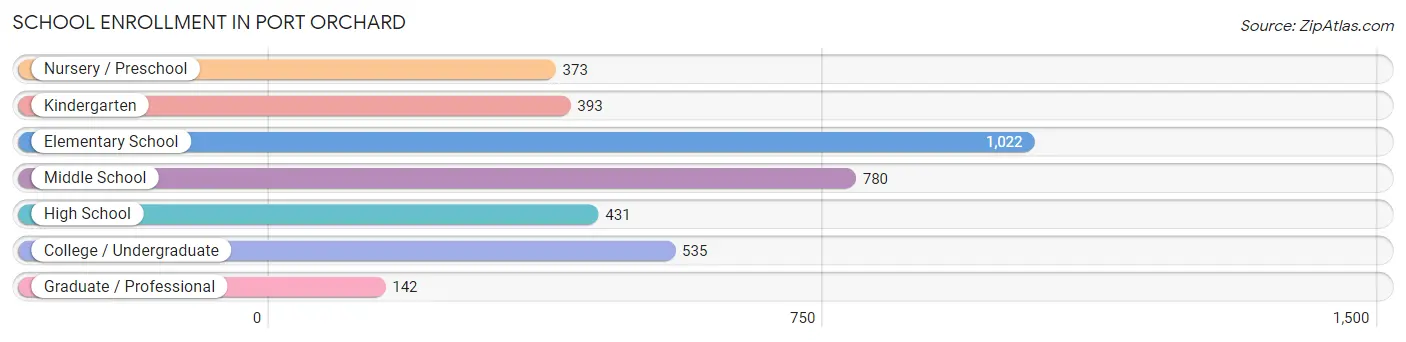
School Enrollment in Port Orchard
The most common levels of schooling among the 3,676 students in Port Orchard are elementary school (1,022 | 27.8%), middle school (780 | 21.2%), and college / undergraduate (535 | 14.5%).
| School Level | # Students | % Students |
| Nursery / Preschool | 373 | 10.2% |
| Kindergarten | 393 | 10.7% |
| Elementary School | 1,022 | 27.8% |
| Middle School | 780 | 21.2% |
| High School | 431 | 11.7% |
| College / Undergraduate | 535 | 14.5% |
| Graduate / Professional | 142 | 3.9% |
| Total | 3,676 | 100.0% |
School Enrollment by Age by Funding Source in Port Orchard
Out of a total of 3,676 students who are enrolled in schools in Port Orchard, 570 (15.5%) attend a private institution, while the remaining 3,106 (84.5%) are enrolled in public schools. The age group of 3 to 4 year olds has the highest likelihood of being enrolled in private schools, with 178 (54.1% in the age bracket) enrolled. Conversely, the age group of 18 to 19 year olds has the lowest likelihood of being enrolled in a private school, with 105 (100.0% in the age bracket) attending a public institution.
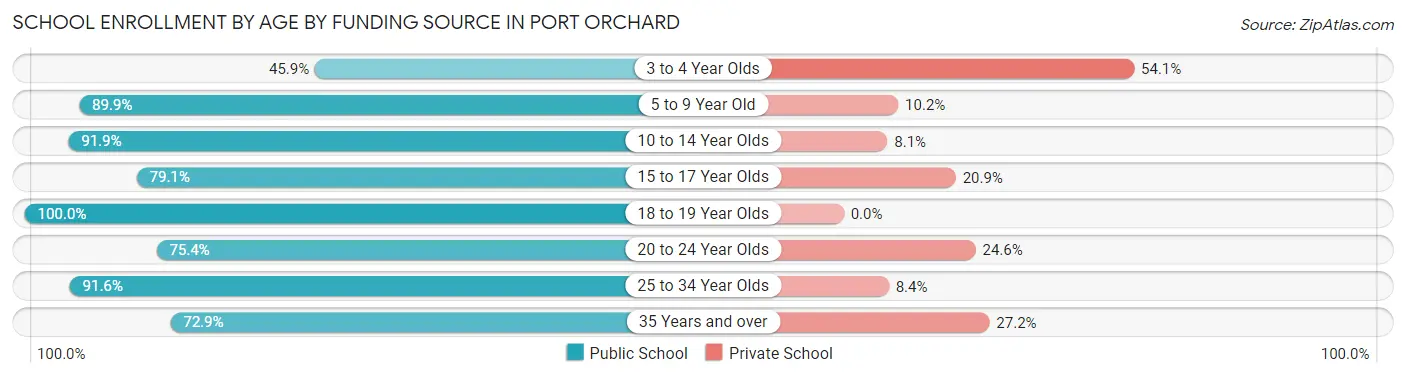
| Age Bracket | Public School | Private School |
| 3 to 4 Year Olds | 151 (45.9%) | 178 (54.1%) |
| 5 to 9 Year Old | 1,248 (89.8%) | 141 (10.2%) |
| 10 to 14 Year Olds | 812 (91.9%) | 72 (8.1%) |
| 15 to 17 Year Olds | 292 (79.1%) | 77 (20.9%) |
| 18 to 19 Year Olds | 105 (100.0%) | 0 (0.0%) |
| 20 to 24 Year Olds | 43 (75.4%) | 14 (24.6%) |
| 25 to 34 Year Olds | 295 (91.6%) | 27 (8.4%) |
| 35 Years and over | 161 (72.9%) | 60 (27.2%) |
| Total | 3,106 (84.5%) | 570 (15.5%) |
Educational Attainment by Field of Study in Port Orchard
Business (694 | 19.0%), science & technology (582 | 15.9%), social sciences (343 | 9.4%), engineering (342 | 9.4%), and arts & humanities (276 | 7.6%) are the most common fields of study among 3,651 individuals in Port Orchard who have obtained a bachelor's degree or higher.
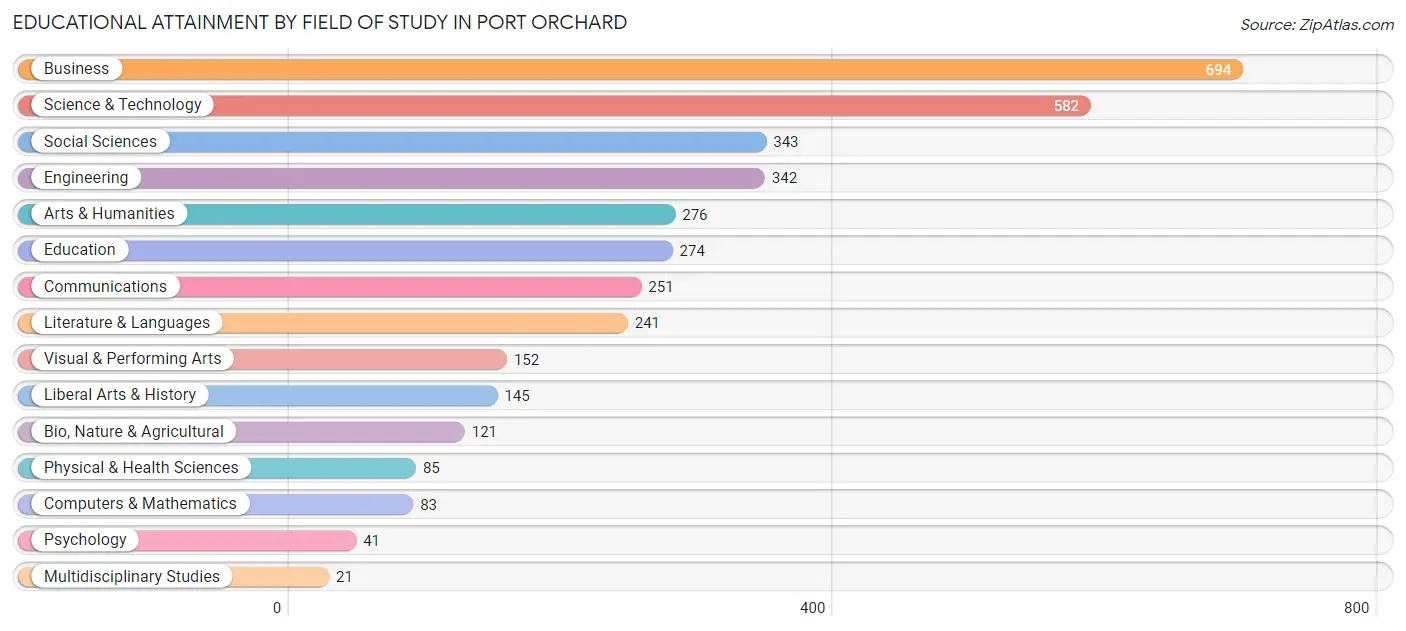
| Field of Study | # Graduates | % Graduates |
| Computers & Mathematics | 83 | 2.3% |
| Bio, Nature & Agricultural | 121 | 3.3% |
| Physical & Health Sciences | 85 | 2.3% |
| Psychology | 41 | 1.1% |
| Social Sciences | 343 | 9.4% |
| Engineering | 342 | 9.4% |
| Multidisciplinary Studies | 21 | 0.6% |
| Science & Technology | 582 | 15.9% |
| Business | 694 | 19.0% |
| Education | 274 | 7.5% |
| Literature & Languages | 241 | 6.6% |
| Liberal Arts & History | 145 | 4.0% |
| Visual & Performing Arts | 152 | 4.2% |
| Communications | 251 | 6.9% |
| Arts & Humanities | 276 | 7.6% |
| Total | 3,651 | 100.0% |
Transportation & Commute in Port Orchard
Vehicle Availability by Sex in Port Orchard
The most prevalent vehicle ownership categories in Port Orchard are males with 2 vehicles (1,970, accounting for 51.0%) and females with 2 vehicles (1,322, making up 61.9%).
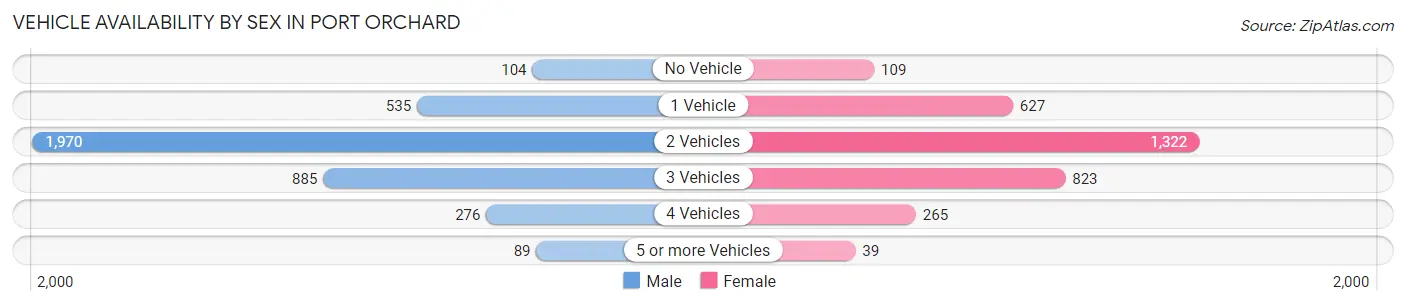
| Vehicles Available | Male | Female |
| No Vehicle | 104 (2.7%) | 109 (3.4%) |
| 1 Vehicle | 535 (13.9%) | 627 (19.7%) |
| 2 Vehicles | 1,970 (51.0%) | 1,322 (41.5%) |
| 3 Vehicles | 885 (22.9%) | 823 (25.8%) |
| 4 Vehicles | 276 (7.1%) | 265 (8.3%) |
| 5 or more Vehicles | 89 (2.3%) | 39 (1.2%) |
| Total | 3,859 (100.0%) | 3,185 (100.0%) |
Commute Time in Port Orchard
The most frequently occuring commute durations in Port Orchard are 15 to 19 minutes (1,117 commuters, 17.4%), 30 to 34 minutes (979 commuters, 15.2%), and 20 to 24 minutes (784 commuters, 12.2%).
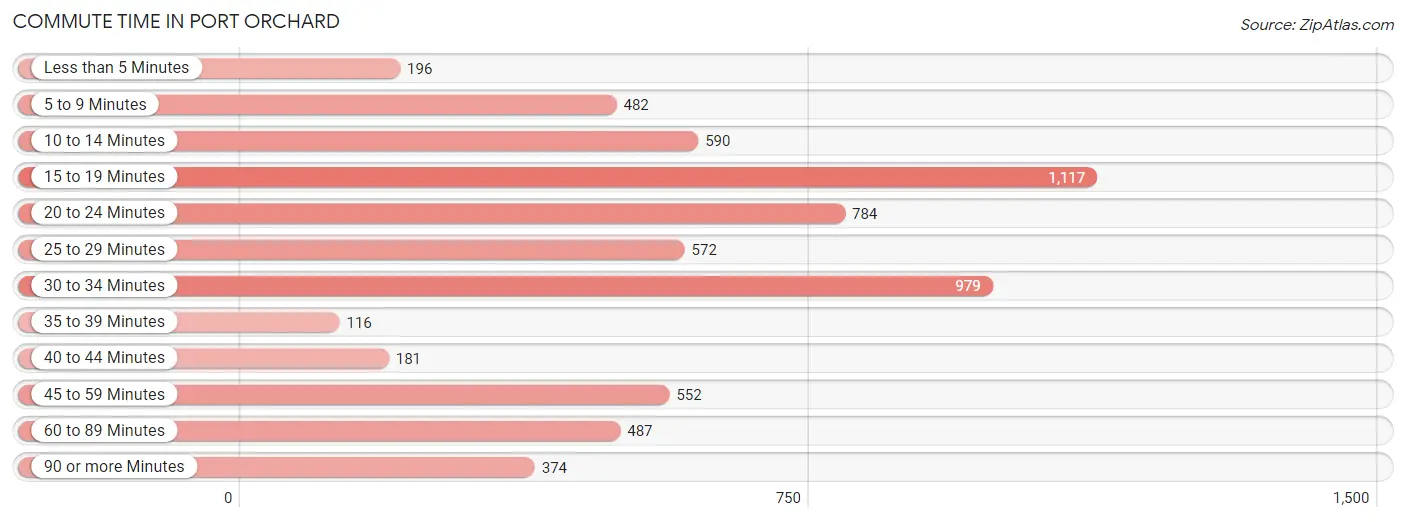
| Commute Time | # Commuters | % Commuters |
| Less than 5 Minutes | 196 | 3.0% |
| 5 to 9 Minutes | 482 | 7.5% |
| 10 to 14 Minutes | 590 | 9.2% |
| 15 to 19 Minutes | 1,117 | 17.4% |
| 20 to 24 Minutes | 784 | 12.2% |
| 25 to 29 Minutes | 572 | 8.9% |
| 30 to 34 Minutes | 979 | 15.2% |
| 35 to 39 Minutes | 116 | 1.8% |
| 40 to 44 Minutes | 181 | 2.8% |
| 45 to 59 Minutes | 552 | 8.6% |
| 60 to 89 Minutes | 487 | 7.6% |
| 90 or more Minutes | 374 | 5.8% |
Commute Time by Sex in Port Orchard
The most common commute times in Port Orchard are 20 to 24 minutes (591 commuters, 16.7%) for males and 15 to 19 minutes (555 commuters, 19.2%) for females.
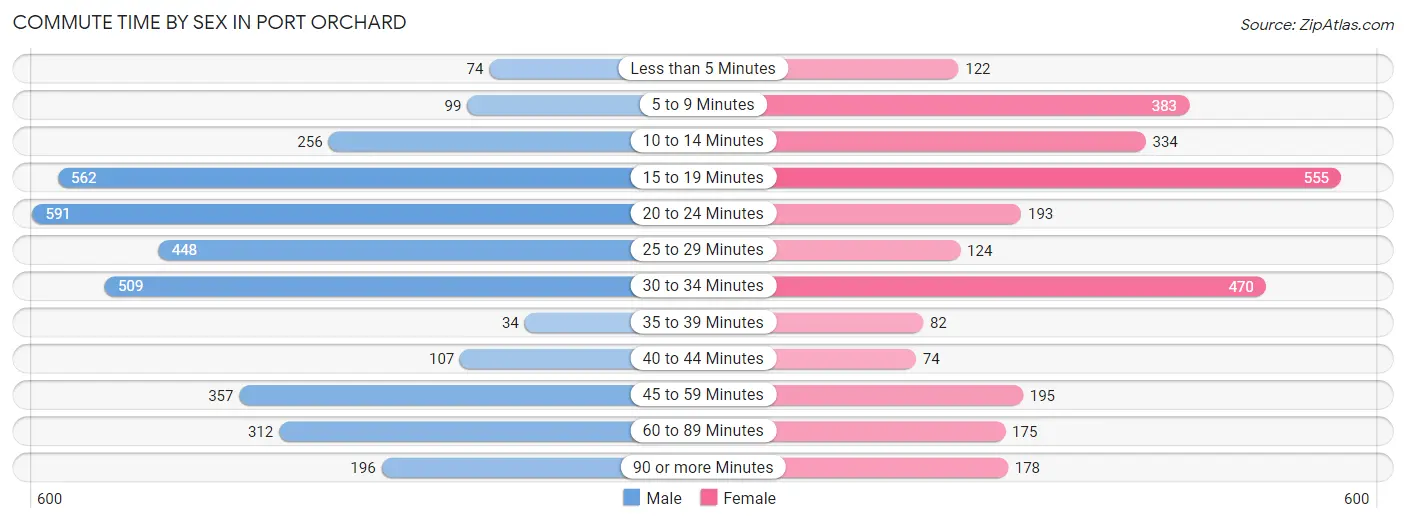
| Commute Time | Male | Female |
| Less than 5 Minutes | 74 (2.1%) | 122 (4.2%) |
| 5 to 9 Minutes | 99 (2.8%) | 383 (13.3%) |
| 10 to 14 Minutes | 256 (7.2%) | 334 (11.6%) |
| 15 to 19 Minutes | 562 (15.9%) | 555 (19.2%) |
| 20 to 24 Minutes | 591 (16.7%) | 193 (6.7%) |
| 25 to 29 Minutes | 448 (12.6%) | 124 (4.3%) |
| 30 to 34 Minutes | 509 (14.4%) | 470 (16.3%) |
| 35 to 39 Minutes | 34 (1.0%) | 82 (2.8%) |
| 40 to 44 Minutes | 107 (3.0%) | 74 (2.6%) |
| 45 to 59 Minutes | 357 (10.1%) | 195 (6.8%) |
| 60 to 89 Minutes | 312 (8.8%) | 175 (6.1%) |
| 90 or more Minutes | 196 (5.5%) | 178 (6.2%) |
Time of Departure to Work by Sex in Port Orchard
The most frequent times of departure to work in Port Orchard are 12:00 AM to 4:59 AM (667, 18.8%) for males and 12:00 AM to 4:59 AM (367, 12.7%) for females.
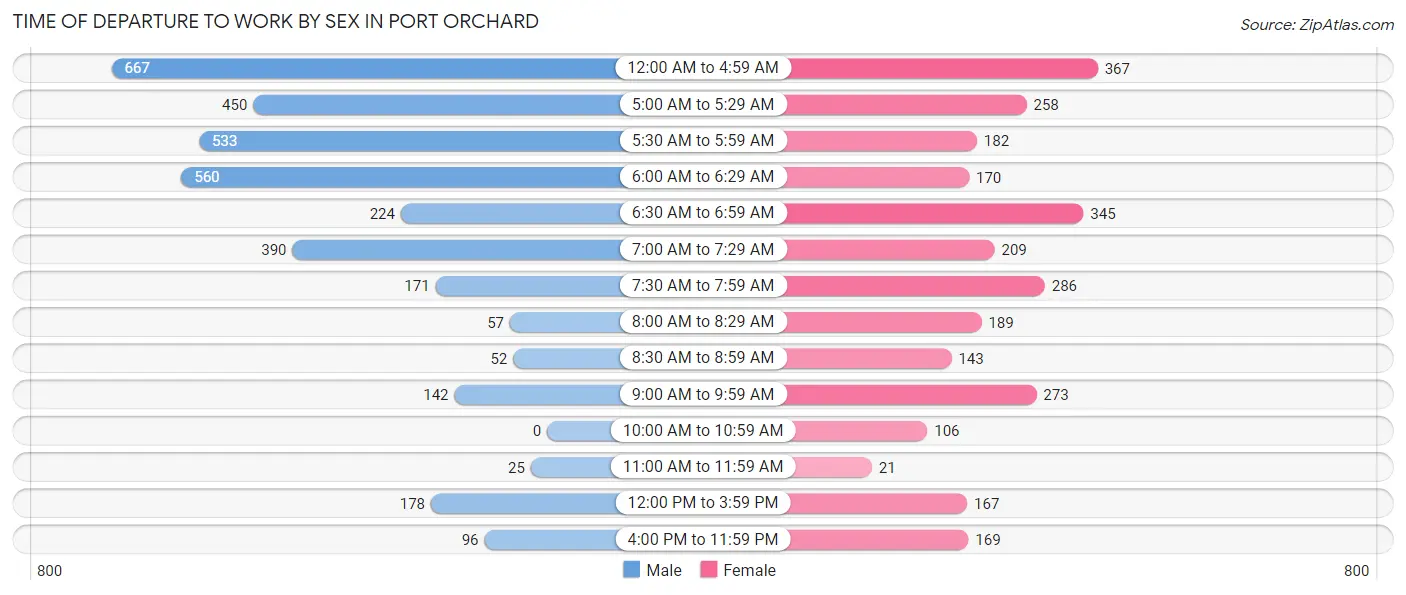
| Time of Departure | Male | Female |
| 12:00 AM to 4:59 AM | 667 (18.8%) | 367 (12.7%) |
| 5:00 AM to 5:29 AM | 450 (12.7%) | 258 (8.9%) |
| 5:30 AM to 5:59 AM | 533 (15.0%) | 182 (6.3%) |
| 6:00 AM to 6:29 AM | 560 (15.8%) | 170 (5.9%) |
| 6:30 AM to 6:59 AM | 224 (6.3%) | 345 (12.0%) |
| 7:00 AM to 7:29 AM | 390 (11.0%) | 209 (7.2%) |
| 7:30 AM to 7:59 AM | 171 (4.8%) | 286 (9.9%) |
| 8:00 AM to 8:29 AM | 57 (1.6%) | 189 (6.6%) |
| 8:30 AM to 8:59 AM | 52 (1.5%) | 143 (5.0%) |
| 9:00 AM to 9:59 AM | 142 (4.0%) | 273 (9.5%) |
| 10:00 AM to 10:59 AM | 0 (0.0%) | 106 (3.7%) |
| 11:00 AM to 11:59 AM | 25 (0.7%) | 21 (0.7%) |
| 12:00 PM to 3:59 PM | 178 (5.0%) | 167 (5.8%) |
| 4:00 PM to 11:59 PM | 96 (2.7%) | 169 (5.9%) |
| Total | 3,545 (100.0%) | 2,885 (100.0%) |
Housing Occupancy in Port Orchard
Occupancy by Ownership in Port Orchard
Of the total 6,269 dwellings in Port Orchard, owner-occupied units account for 3,874 (61.8%), while renter-occupied units make up 2,395 (38.2%).
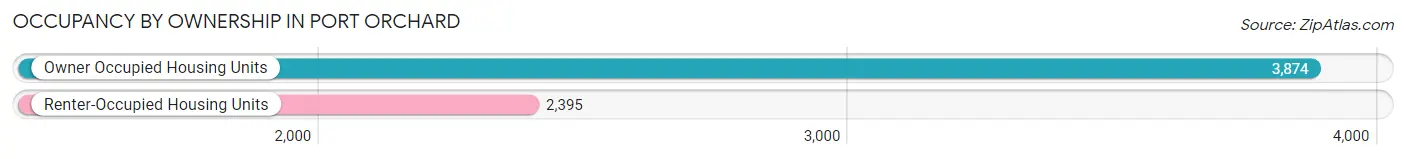
| Occupancy | # Housing Units | % Housing Units |
| Owner Occupied Housing Units | 3,874 | 61.8% |
| Renter-Occupied Housing Units | 2,395 | 38.2% |
| Total Occupied Housing Units | 6,269 | 100.0% |
Occupancy by Household Size in Port Orchard
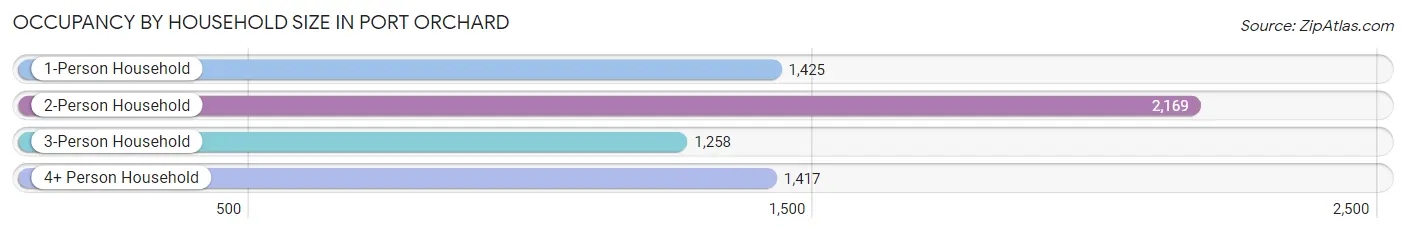
| Household Size | # Housing Units | % Housing Units |
| 1-Person Household | 1,425 | 22.7% |
| 2-Person Household | 2,169 | 34.6% |
| 3-Person Household | 1,258 | 20.1% |
| 4+ Person Household | 1,417 | 22.6% |
| Total Housing Units | 6,269 | 100.0% |
Occupancy by Ownership by Household Size in Port Orchard
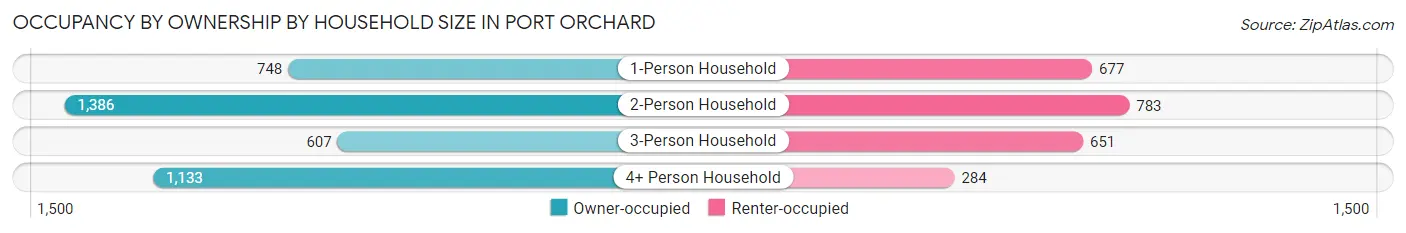
| Household Size | Owner-occupied | Renter-occupied |
| 1-Person Household | 748 (52.5%) | 677 (47.5%) |
| 2-Person Household | 1,386 (63.9%) | 783 (36.1%) |
| 3-Person Household | 607 (48.2%) | 651 (51.7%) |
| 4+ Person Household | 1,133 (80.0%) | 284 (20.0%) |
| Total Housing Units | 3,874 (61.8%) | 2,395 (38.2%) |
Occupancy by Educational Attainment in Port Orchard
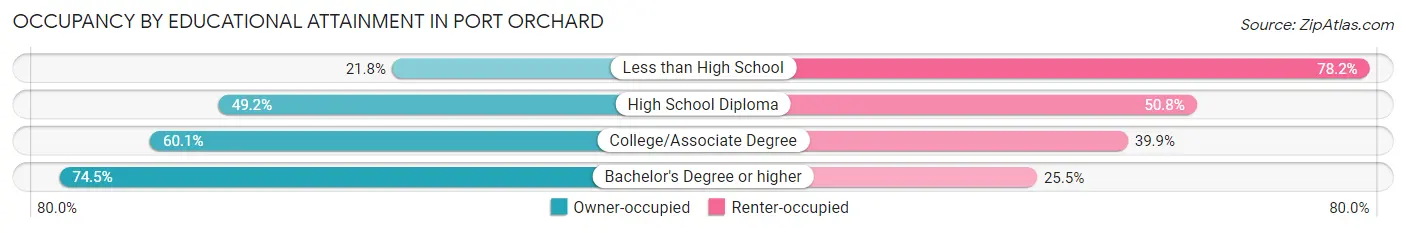
| Household Size | Owner-occupied | Renter-occupied |
| Less than High School | 54 (21.8%) | 194 (78.2%) |
| High School Diploma | 578 (49.2%) | 597 (50.8%) |
| College/Associate Degree | 1,534 (60.1%) | 1,019 (39.9%) |
| Bachelor's Degree or higher | 1,708 (74.5%) | 585 (25.5%) |
Occupancy by Age of Householder in Port Orchard
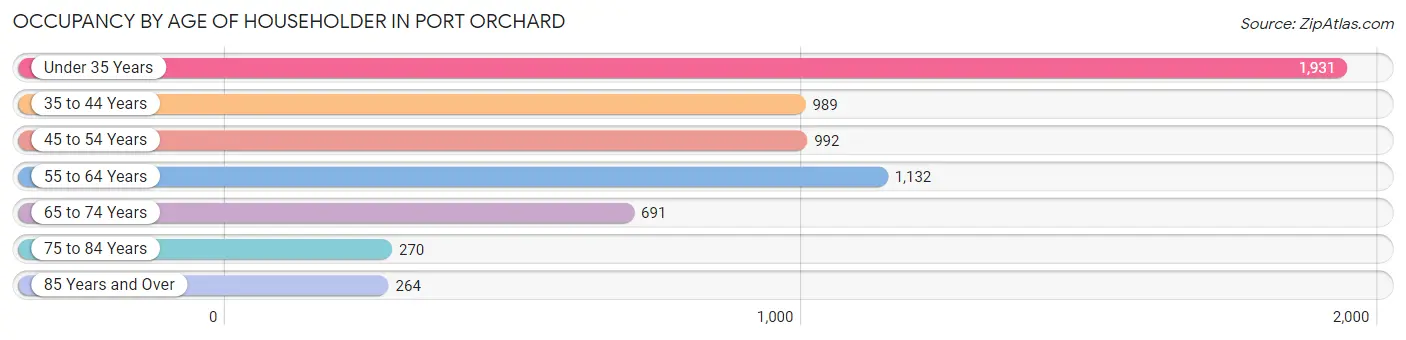
| Age Bracket | # Households | % Households |
| Under 35 Years | 1,931 | 30.8% |
| 35 to 44 Years | 989 | 15.8% |
| 45 to 54 Years | 992 | 15.8% |
| 55 to 64 Years | 1,132 | 18.1% |
| 65 to 74 Years | 691 | 11.0% |
| 75 to 84 Years | 270 | 4.3% |
| 85 Years and Over | 264 | 4.2% |
| Total | 6,269 | 100.0% |
Housing Finances in Port Orchard
Median Income by Occupancy in Port Orchard
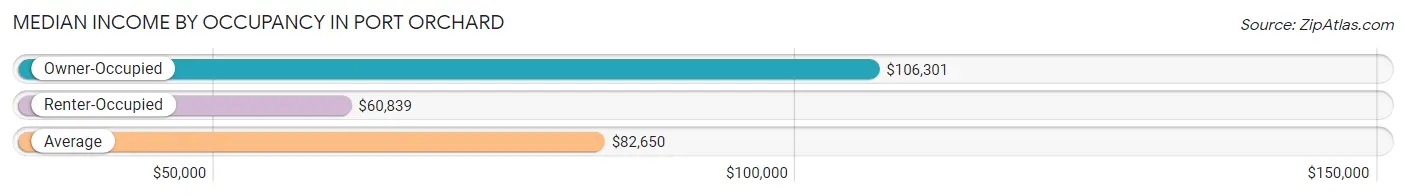
| Occupancy Type | # Households | Median Income |
| Owner-Occupied | 3,874 (61.8%) | $106,301 |
| Renter-Occupied | 2,395 (38.2%) | $60,839 |
| Average | 6,269 (100.0%) | $82,650 |
Occupancy by Householder Income Bracket in Port Orchard
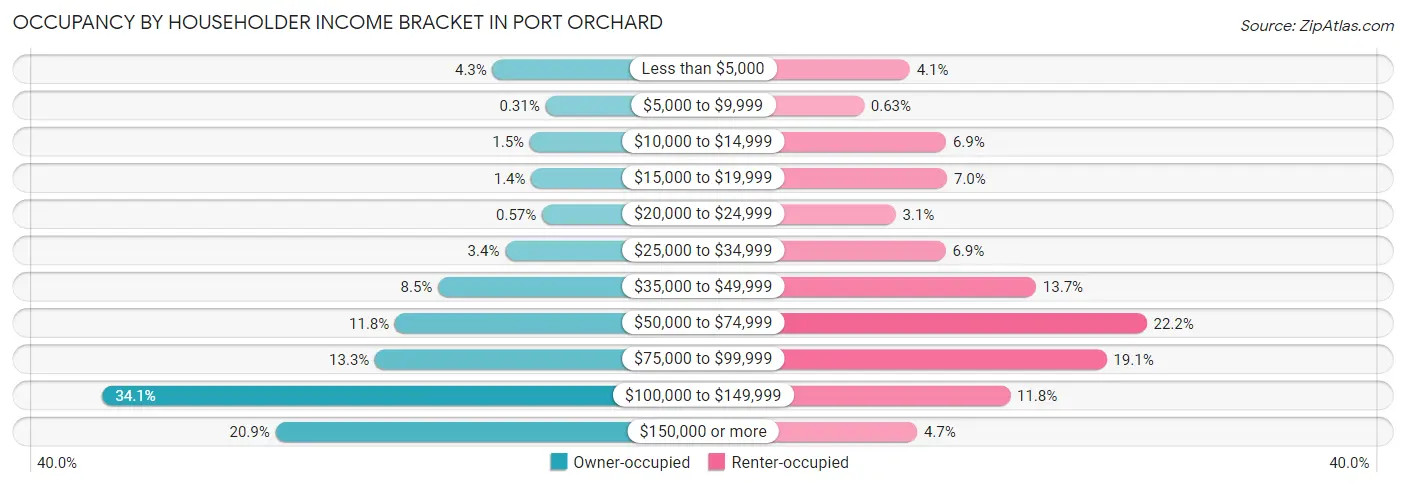
| Income Bracket | Owner-occupied | Renter-occupied |
| Less than $5,000 | 168 (4.3%) | 99 (4.1%) |
| $5,000 to $9,999 | 12 (0.3%) | 15 (0.6%) |
| $10,000 to $14,999 | 58 (1.5%) | 165 (6.9%) |
| $15,000 to $19,999 | 54 (1.4%) | 167 (7.0%) |
| $20,000 to $24,999 | 22 (0.6%) | 73 (3.0%) |
| $25,000 to $34,999 | 131 (3.4%) | 164 (6.9%) |
| $35,000 to $49,999 | 329 (8.5%) | 329 (13.7%) |
| $50,000 to $74,999 | 456 (11.8%) | 531 (22.2%) |
| $75,000 to $99,999 | 515 (13.3%) | 458 (19.1%) |
| $100,000 to $149,999 | 1,320 (34.1%) | 282 (11.8%) |
| $150,000 or more | 809 (20.9%) | 112 (4.7%) |
| Total | 3,874 (100.0%) | 2,395 (100.0%) |
Monthly Housing Cost Tiers in Port Orchard
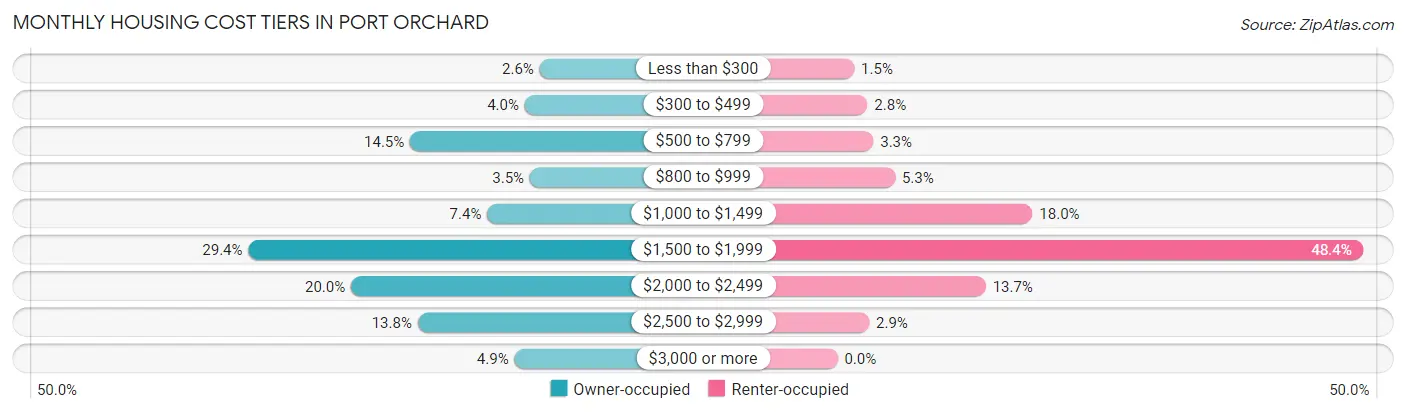
| Monthly Cost | Owner-occupied | Renter-occupied |
| Less than $300 | 100 (2.6%) | 37 (1.5%) |
| $300 to $499 | 153 (4.0%) | 66 (2.8%) |
| $500 to $799 | 562 (14.5%) | 79 (3.3%) |
| $800 to $999 | 135 (3.5%) | 127 (5.3%) |
| $1,000 to $1,499 | 287 (7.4%) | 430 (17.9%) |
| $1,500 to $1,999 | 1,139 (29.4%) | 1,160 (48.4%) |
| $2,000 to $2,499 | 773 (20.0%) | 327 (13.7%) |
| $2,500 to $2,999 | 535 (13.8%) | 70 (2.9%) |
| $3,000 or more | 190 (4.9%) | 0 (0.0%) |
| Total | 3,874 (100.0%) | 2,395 (100.0%) |
Physical Housing Characteristics in Port Orchard
Housing Structures in Port Orchard
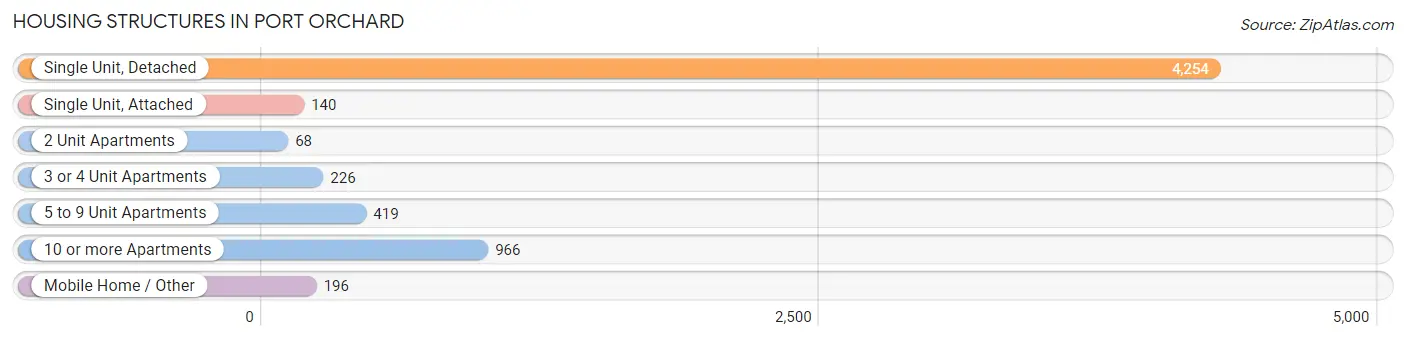
| Structure Type | # Housing Units | % Housing Units |
| Single Unit, Detached | 4,254 | 67.9% |
| Single Unit, Attached | 140 | 2.2% |
| 2 Unit Apartments | 68 | 1.1% |
| 3 or 4 Unit Apartments | 226 | 3.6% |
| 5 to 9 Unit Apartments | 419 | 6.7% |
| 10 or more Apartments | 966 | 15.4% |
| Mobile Home / Other | 196 | 3.1% |
| Total | 6,269 | 100.0% |
Housing Structures by Occupancy in Port Orchard
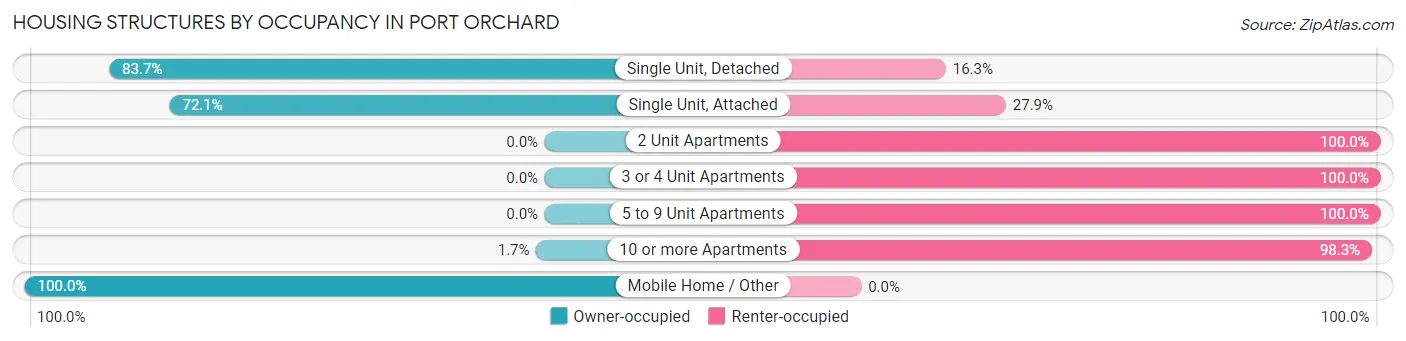
| Structure Type | Owner-occupied | Renter-occupied |
| Single Unit, Detached | 3,561 (83.7%) | 693 (16.3%) |
| Single Unit, Attached | 101 (72.1%) | 39 (27.9%) |
| 2 Unit Apartments | 0 (0.0%) | 68 (100.0%) |
| 3 or 4 Unit Apartments | 0 (0.0%) | 226 (100.0%) |
| 5 to 9 Unit Apartments | 0 (0.0%) | 419 (100.0%) |
| 10 or more Apartments | 16 (1.7%) | 950 (98.3%) |
| Mobile Home / Other | 196 (100.0%) | 0 (0.0%) |
| Total | 3,874 (61.8%) | 2,395 (38.2%) |
Housing Structures by Number of Rooms in Port Orchard
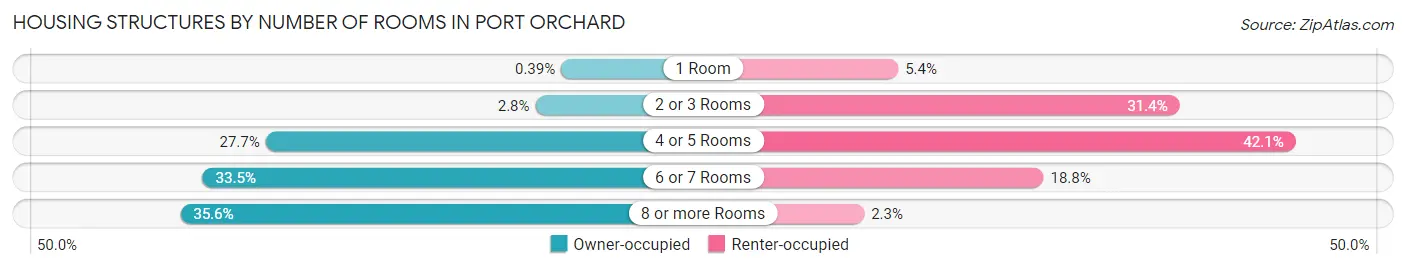
| Number of Rooms | Owner-occupied | Renter-occupied |
| 1 Room | 15 (0.4%) | 129 (5.4%) |
| 2 or 3 Rooms | 107 (2.8%) | 752 (31.4%) |
| 4 or 5 Rooms | 1,074 (27.7%) | 1,009 (42.1%) |
| 6 or 7 Rooms | 1,299 (33.5%) | 451 (18.8%) |
| 8 or more Rooms | 1,379 (35.6%) | 54 (2.2%) |
| Total | 3,874 (100.0%) | 2,395 (100.0%) |
Housing Structure by Heating Type in Port Orchard
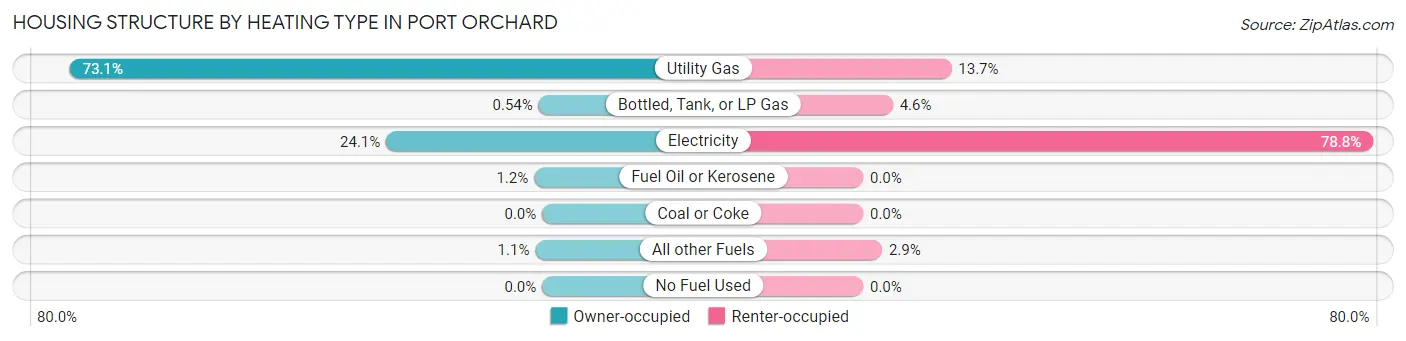
| Heating Type | Owner-occupied | Renter-occupied |
| Utility Gas | 2,830 (73.1%) | 327 (13.7%) |
| Bottled, Tank, or LP Gas | 21 (0.5%) | 110 (4.6%) |
| Electricity | 934 (24.1%) | 1,888 (78.8%) |
| Fuel Oil or Kerosene | 48 (1.2%) | 0 (0.0%) |
| Coal or Coke | 0 (0.0%) | 0 (0.0%) |
| All other Fuels | 41 (1.1%) | 70 (2.9%) |
| No Fuel Used | 0 (0.0%) | 0 (0.0%) |
| Total | 3,874 (100.0%) | 2,395 (100.0%) |
Household Vehicle Usage in Port Orchard
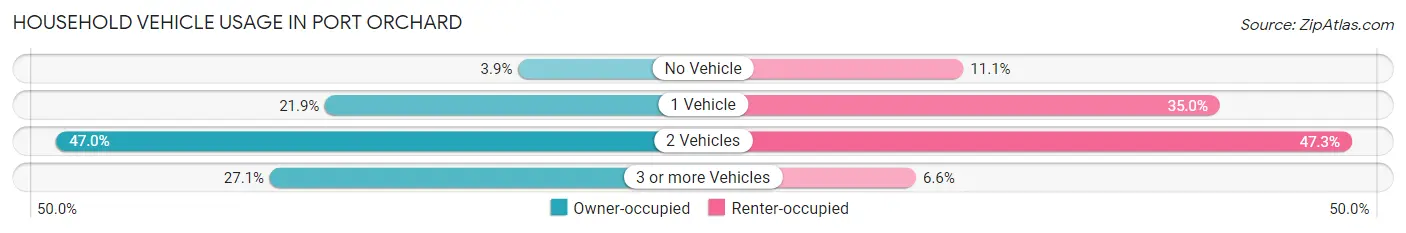
| Vehicles per Household | Owner-occupied | Renter-occupied |
| No Vehicle | 152 (3.9%) | 265 (11.1%) |
| 1 Vehicle | 850 (21.9%) | 838 (35.0%) |
| 2 Vehicles | 1,822 (47.0%) | 1,133 (47.3%) |
| 3 or more Vehicles | 1,050 (27.1%) | 159 (6.6%) |
| Total | 3,874 (100.0%) | 2,395 (100.0%) |
Real Estate & Mortgages in Port Orchard
Real Estate and Mortgage Overview in Port Orchard
| Characteristic | Without Mortgage | With Mortgage |
| Housing Units | 952 | 2,922 |
| Median Property Value | $404,600 | $458,800 |
| Median Household Income | $66,974 | $636 |
| Monthly Housing Costs | $611 | $190 |
| Real Estate Taxes | $3,231 | $15 |
Property Value by Mortgage Status in Port Orchard
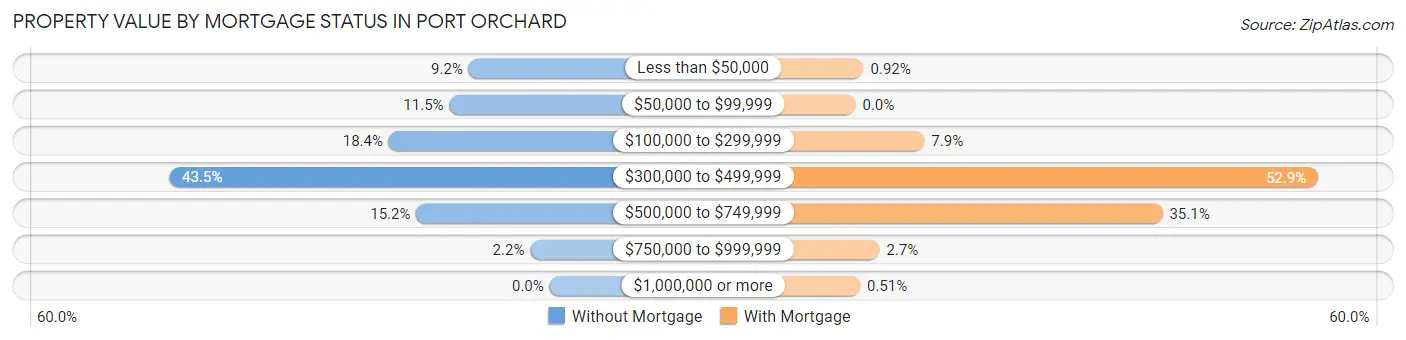
| Property Value | Without Mortgage | With Mortgage |
| Less than $50,000 | 88 (9.2%) | 27 (0.9%) |
| $50,000 to $99,999 | 109 (11.5%) | 0 (0.0%) |
| $100,000 to $299,999 | 175 (18.4%) | 230 (7.9%) |
| $300,000 to $499,999 | 414 (43.5%) | 1,545 (52.9%) |
| $500,000 to $749,999 | 145 (15.2%) | 1,025 (35.1%) |
| $750,000 to $999,999 | 21 (2.2%) | 80 (2.7%) |
| $1,000,000 or more | 0 (0.0%) | 15 (0.5%) |
| Total | 952 (100.0%) | 2,922 (100.0%) |
Household Income by Mortgage Status in Port Orchard
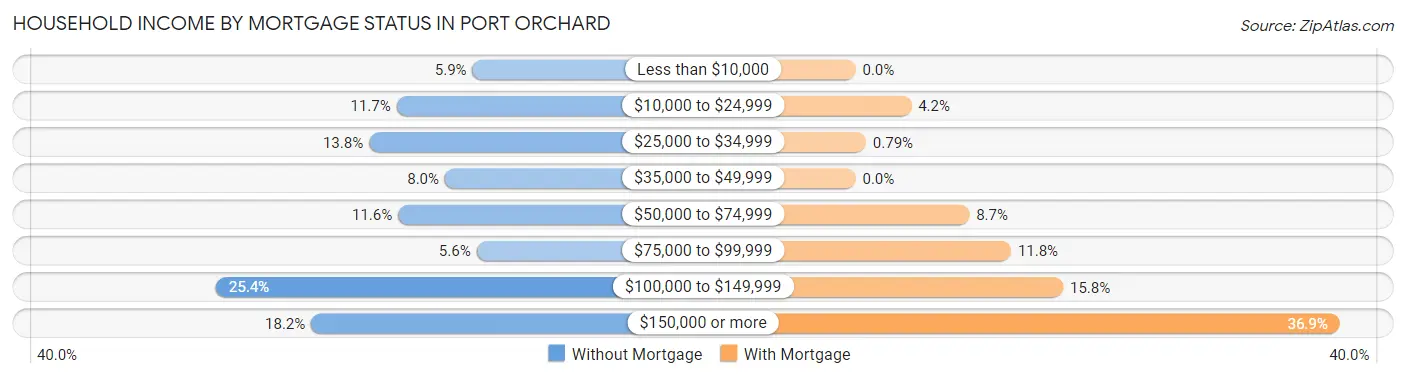
| Household Income | Without Mortgage | With Mortgage |
| Less than $10,000 | 56 (5.9%) | 0 (0.0%) |
| $10,000 to $24,999 | 111 (11.7%) | 124 (4.2%) |
| $25,000 to $34,999 | 131 (13.8%) | 23 (0.8%) |
| $35,000 to $49,999 | 76 (8.0%) | 0 (0.0%) |
| $50,000 to $74,999 | 110 (11.6%) | 253 (8.7%) |
| $75,000 to $99,999 | 53 (5.6%) | 346 (11.8%) |
| $100,000 to $149,999 | 242 (25.4%) | 462 (15.8%) |
| $150,000 or more | 173 (18.2%) | 1,078 (36.9%) |
| Total | 952 (100.0%) | 2,922 (100.0%) |
Property Value to Household Income Ratio in Port Orchard
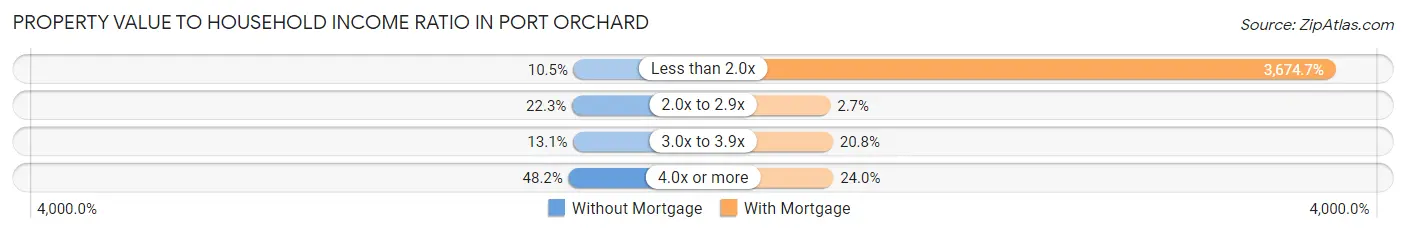
| Value-to-Income Ratio | Without Mortgage | With Mortgage |
| Less than 2.0x | 100 (10.5%) | 107,374 (3,674.7%) |
| 2.0x to 2.9x | 212 (22.3%) | 79 (2.7%) |
| 3.0x to 3.9x | 125 (13.1%) | 608 (20.8%) |
| 4.0x or more | 459 (48.2%) | 701 (24.0%) |
| Total | 952 (100.0%) | 2,922 (100.0%) |
Real Estate Taxes by Mortgage Status in Port Orchard
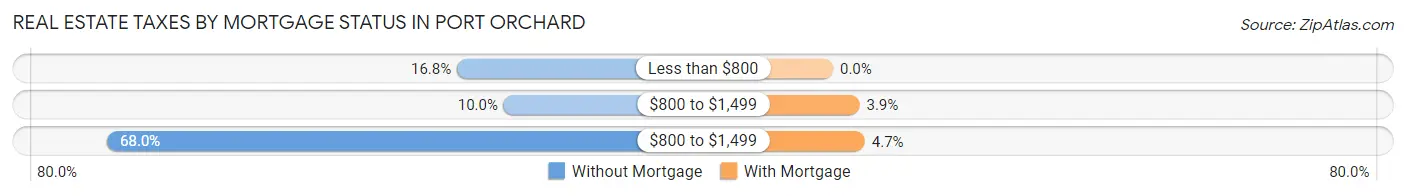
| Property Taxes | Without Mortgage | With Mortgage |
| Less than $800 | 160 (16.8%) | 0 (0.0%) |
| $800 to $1,499 | 95 (10.0%) | 113 (3.9%) |
| $800 to $1,499 | 647 (68.0%) | 136 (4.6%) |
| Total | 952 (100.0%) | 2,922 (100.0%) |
Health & Disability in Port Orchard
Health Insurance Coverage by Age in Port Orchard
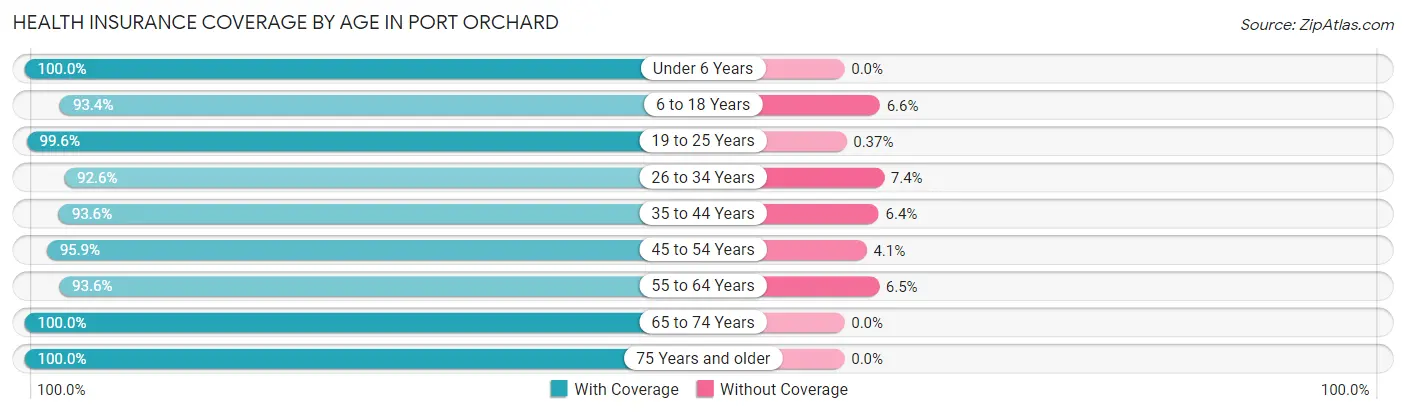
| Age Bracket | With Coverage | Without Coverage |
| Under 6 Years | 1,467 (100.0%) | 0 (0.0%) |
| 6 to 18 Years | 2,393 (93.4%) | 169 (6.6%) |
| 19 to 25 Years | 1,084 (99.6%) | 4 (0.4%) |
| 26 to 34 Years | 2,259 (92.6%) | 180 (7.4%) |
| 35 to 44 Years | 1,436 (93.6%) | 98 (6.4%) |
| 45 to 54 Years | 1,324 (95.9%) | 57 (4.1%) |
| 55 to 64 Years | 1,769 (93.5%) | 122 (6.5%) |
| 65 to 74 Years | 1,338 (100.0%) | 0 (0.0%) |
| 75 Years and older | 760 (100.0%) | 0 (0.0%) |
| Total | 13,830 (95.6%) | 630 (4.4%) |
Health Insurance Coverage by Citizenship Status in Port Orchard
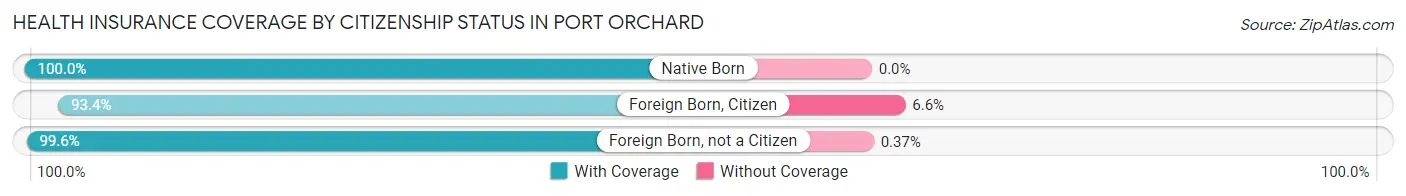
| Citizenship Status | With Coverage | Without Coverage |
| Native Born | 1,467 (100.0%) | 0 (0.0%) |
| Foreign Born, Citizen | 2,393 (93.4%) | 169 (6.6%) |
| Foreign Born, not a Citizen | 1,084 (99.6%) | 4 (0.4%) |
Health Insurance Coverage by Household Income in Port Orchard
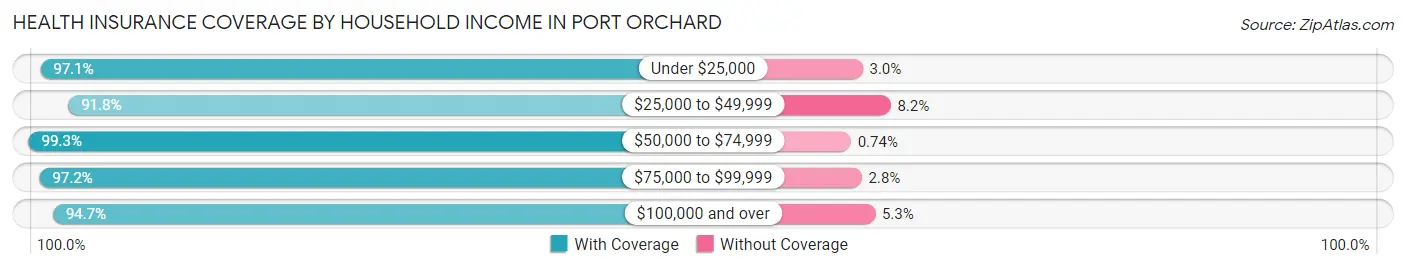
| Household Income | With Coverage | Without Coverage |
| Under $25,000 | 1,581 (97.1%) | 48 (2.9%) |
| $25,000 to $49,999 | 1,830 (91.8%) | 163 (8.2%) |
| $50,000 to $74,999 | 2,280 (99.3%) | 17 (0.7%) |
| $75,000 to $99,999 | 1,783 (97.2%) | 51 (2.8%) |
| $100,000 and over | 6,298 (94.7%) | 351 (5.3%) |
Public vs Private Health Insurance Coverage by Age in Port Orchard
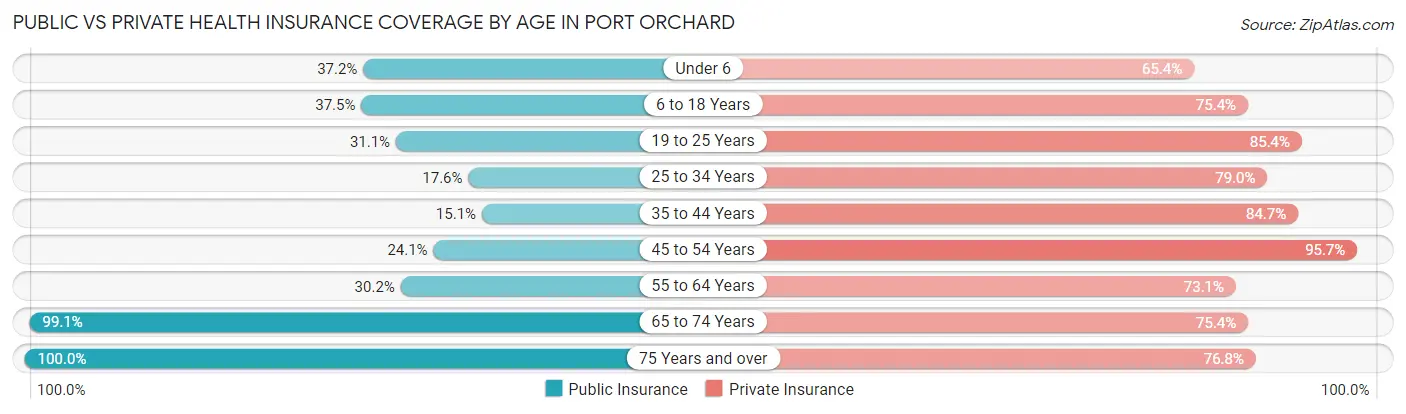
| Age Bracket | Public Insurance | Private Insurance |
| Under 6 | 545 (37.1%) | 959 (65.4%) |
| 6 to 18 Years | 961 (37.5%) | 1,931 (75.4%) |
| 19 to 25 Years | 338 (31.1%) | 929 (85.4%) |
| 25 to 34 Years | 430 (17.6%) | 1,926 (79.0%) |
| 35 to 44 Years | 232 (15.1%) | 1,299 (84.7%) |
| 45 to 54 Years | 333 (24.1%) | 1,321 (95.7%) |
| 55 to 64 Years | 571 (30.2%) | 1,383 (73.1%) |
| 65 to 74 Years | 1,326 (99.1%) | 1,009 (75.4%) |
| 75 Years and over | 760 (100.0%) | 584 (76.8%) |
| Total | 5,496 (38.0%) | 11,341 (78.4%) |
Disability Status by Sex by Age in Port Orchard
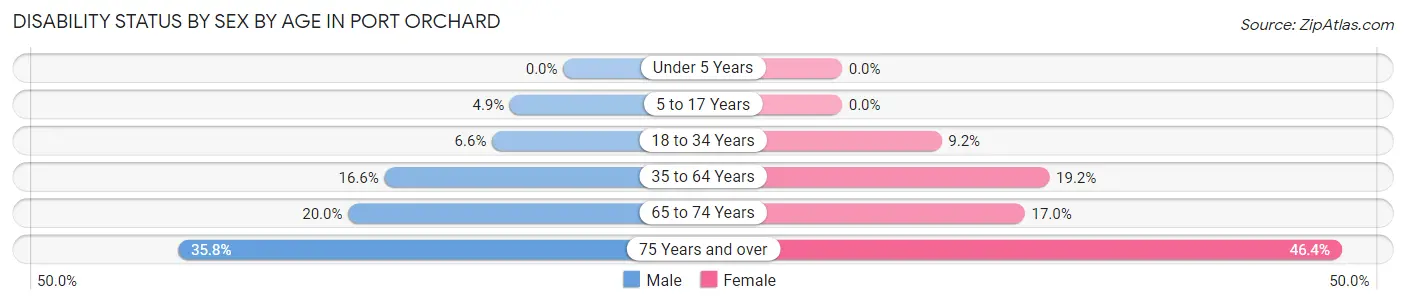
| Age Bracket | Male | Female |
| Under 5 Years | 0 (0.0%) | 0 (0.0%) |
| 5 to 17 Years | 75 (4.9%) | 0 (0.0%) |
| 18 to 34 Years | 93 (6.6%) | 200 (9.2%) |
| 35 to 64 Years | 393 (16.6%) | 469 (19.2%) |
| 65 to 74 Years | 107 (20.0%) | 136 (17.0%) |
| 75 Years and over | 103 (35.8%) | 219 (46.4%) |
Disability Class by Sex by Age in Port Orchard
Disability Class: Hearing Difficulty
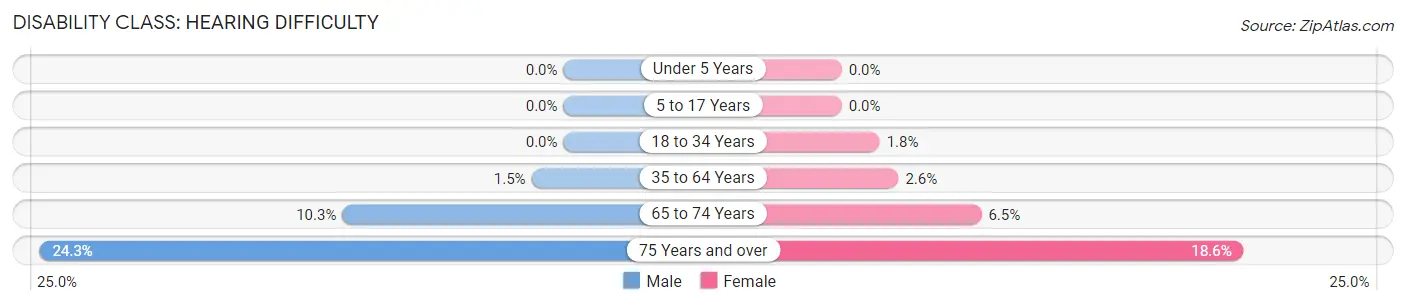
| Age Bracket | Male | Female |
| Under 5 Years | 0 (0.0%) | 0 (0.0%) |
| 5 to 17 Years | 0 (0.0%) | 0 (0.0%) |
| 18 to 34 Years | 0 (0.0%) | 38 (1.8%) |
| 35 to 64 Years | 35 (1.5%) | 64 (2.6%) |
| 65 to 74 Years | 55 (10.3%) | 52 (6.5%) |
| 75 Years and over | 70 (24.3%) | 88 (18.6%) |
Disability Class: Vision Difficulty
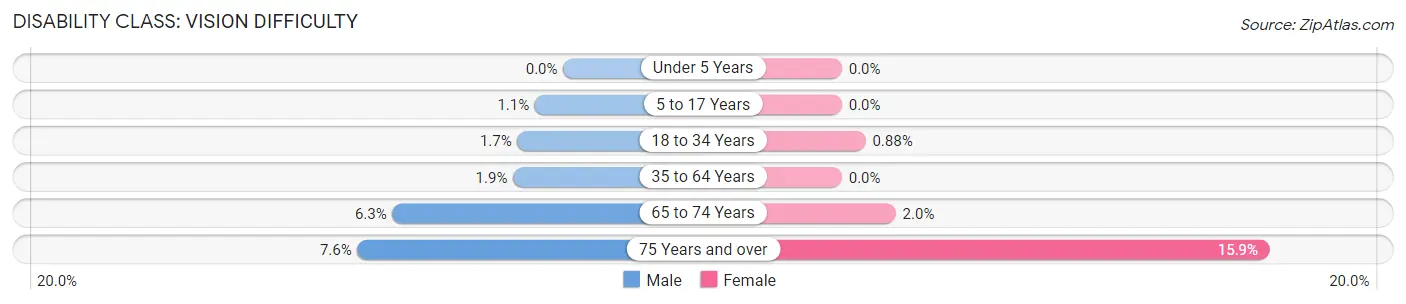
| Age Bracket | Male | Female |
| Under 5 Years | 0 (0.0%) | 0 (0.0%) |
| 5 to 17 Years | 16 (1.1%) | 0 (0.0%) |
| 18 to 34 Years | 24 (1.7%) | 19 (0.9%) |
| 35 to 64 Years | 44 (1.9%) | 0 (0.0%) |
| 65 to 74 Years | 34 (6.3%) | 16 (2.0%) |
| 75 Years and over | 22 (7.6%) | 75 (15.9%) |
Disability Class: Cognitive Difficulty
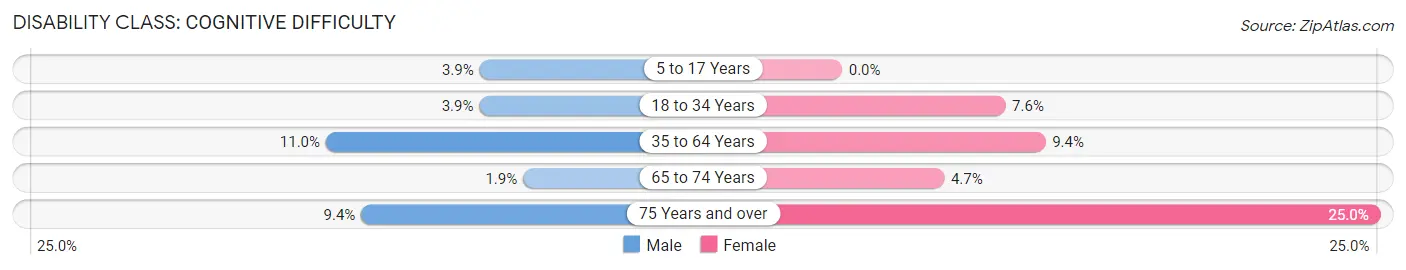
| Age Bracket | Male | Female |
| 5 to 17 Years | 59 (3.9%) | 0 (0.0%) |
| 18 to 34 Years | 55 (3.9%) | 164 (7.6%) |
| 35 to 64 Years | 261 (11.0%) | 230 (9.4%) |
| 65 to 74 Years | 10 (1.9%) | 38 (4.7%) |
| 75 Years and over | 27 (9.4%) | 118 (25.0%) |
Disability Class: Ambulatory Difficulty
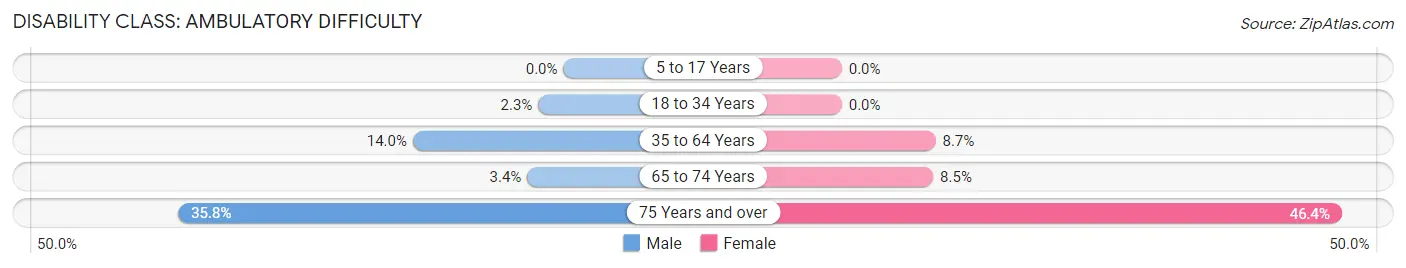
| Age Bracket | Male | Female |
| 5 to 17 Years | 0 (0.0%) | 0 (0.0%) |
| 18 to 34 Years | 33 (2.3%) | 0 (0.0%) |
| 35 to 64 Years | 331 (14.0%) | 212 (8.7%) |
| 65 to 74 Years | 18 (3.4%) | 68 (8.5%) |
| 75 Years and over | 103 (35.8%) | 219 (46.4%) |
Disability Class: Self-Care Difficulty
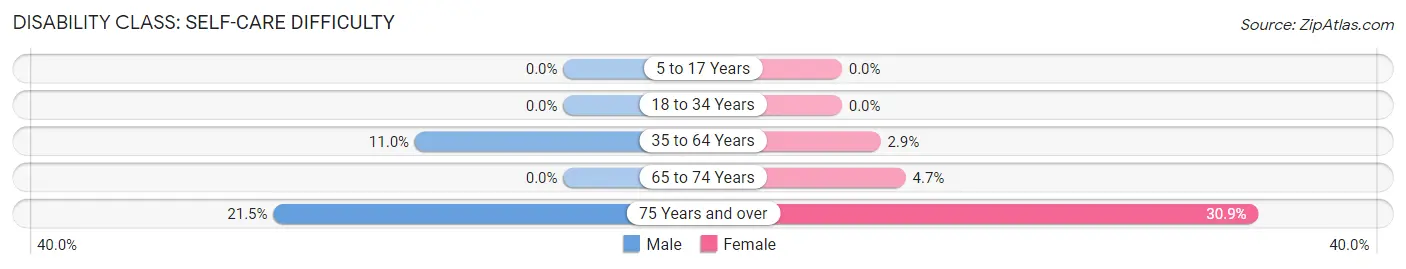
| Age Bracket | Male | Female |
| 5 to 17 Years | 0 (0.0%) | 0 (0.0%) |
| 18 to 34 Years | 0 (0.0%) | 0 (0.0%) |
| 35 to 64 Years | 261 (11.0%) | 70 (2.9%) |
| 65 to 74 Years | 0 (0.0%) | 38 (4.7%) |
| 75 Years and over | 62 (21.5%) | 146 (30.9%) |
Technology Access in Port Orchard
Computing Device Access in Port Orchard
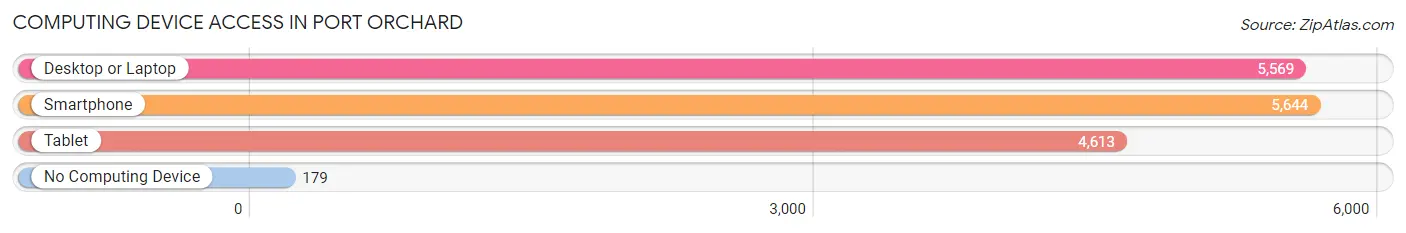
| Device Type | # Households | % Households |
| Desktop or Laptop | 5,569 | 88.8% |
| Smartphone | 5,644 | 90.0% |
| Tablet | 4,613 | 73.6% |
| No Computing Device | 179 | 2.9% |
| Total | 6,269 | 100.0% |
Internet Access in Port Orchard
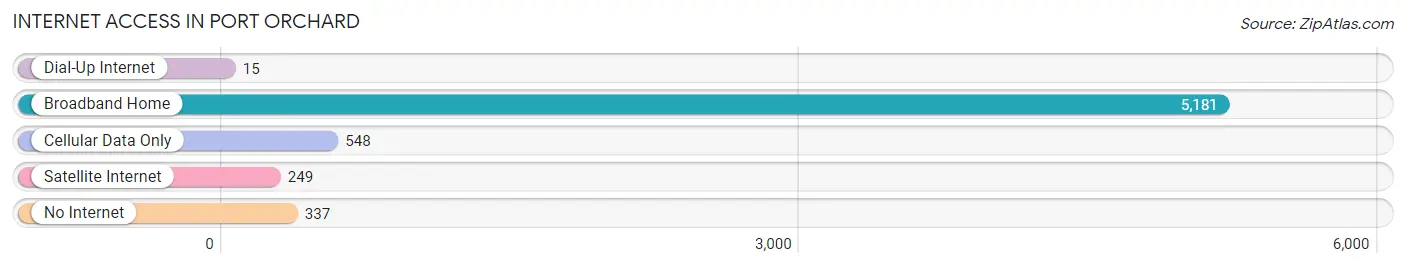
| Internet Type | # Households | % Households |
| Dial-Up Internet | 15 | 0.2% |
| Broadband Home | 5,181 | 82.6% |
| Cellular Data Only | 548 | 8.7% |
| Satellite Internet | 249 | 4.0% |
| No Internet | 337 | 5.4% |
| Total | 6,269 | 100.0% |
Port Orchard Summary
Port Orchard is a city located in Kitsap County, Washington, United States. It is the county seat of Kitsap County and is located on the Kitsap Peninsula, across the Sinclair Inlet from Bremerton. The population was 11,144 at the 2010 census.
History
Port Orchard was first settled in 1853 by William Renton and was originally known as Sidney. The town was renamed Port Orchard in 1891 after the nearby bay, which was named by Captain George Vancouver in 1792. The bay was named after the British Royal Navy Admiral William Henry Smyth's 1790 survey of the area, which he named Port Orchard after his friend, Rear Admiral Sir John Orchard.
The town was officially incorporated on August 6, 1901. The city was originally a small fishing and logging community, but it has since grown into a larger city with a diverse economy.
Geography
Port Orchard is located at 47°32′N 122°37′W (47.534, -122.619). According to the United States Census Bureau, the city has a total area of 5.90 square miles (15.27 km2), of which, 5.87 square miles (15.19 km2) is land and 0.03 square miles (0.08 km2) is water.
Port Orchard is located on the Kitsap Peninsula, across the Sinclair Inlet from Bremerton. The city is bordered by the cities of Bremerton to the east, Manchester to the south, and Olalla to the west.
Economy
Port Orchard's economy is largely based on the service industry, with many businesses providing services to the local community. The city is home to several retail stores, restaurants, and other businesses. The city also has a large number of medical and dental offices, as well as a number of professional services firms.
The city is also home to a number of manufacturing and industrial businesses, including a shipyard, a paper mill, and a number of other businesses.
Demographics
As of the census of 2010, there were 11,144 people, 4,541 households, and 2,845 families residing in the city. The population density was 1,902.3 people per square mile (734.2/km2). There were 4,945 housing units at an average density of 841.3 per square mile (325.2/km2). The racial makeup of the city was 87.2% White, 4.2% African American, 0.7% Native American, 2.2% Asian, 0.2% Pacific Islander, 2.3% from other races, and 3.2% from two or more races. Hispanic or Latino of any race were 6.2% of the population.
There were 4,541 households, out of which 28.2% had children under the age of 18 living with them, 44.2% were married couples living together, 12.7% had a female householder with no husband present, and 37.7% were non-families. 30.2% of all households were made up of individuals, and 11.2% had someone living alone who was 65 years of age or older. The average household size was 2.44 and the average family size was 3.03.
In the city, the population was spread out, with 24.2% under the age of 18, 8.2% from 18 to 24, 28.3% from 25 to 44, 24.2% from 45 to 64, and 15.1% who were 65 years of age or older. The median age was 38 years. For every 100 females, there were 94.2 males. For every 100 females age 18 and over, there were 91.2 males.
The median income for a household in the city was $41,945, and the median income for a family was $50,945. Males had a median income of $41,945 versus $30,945 for females. The per capita income for the city was $21,945. About 8.2% of families and 10.2% of the population were below the poverty line, including 14.2% of those under age 18 and 6.2% of those age 65 or over.
Common Questions
What is Per Capita Income in Port Orchard?
Per Capita income in Port Orchard is $38,364.
What is the Median Family Income in Port Orchard?
Median Family Income in Port Orchard is $98,500.
What is the Median Household income in Port Orchard?
Median Household Income in Port Orchard is $82,650.
What is Income or Wage Gap in Port Orchard?
Income or Wage Gap in Port Orchard is 28.3%.
Women in Port Orchard earn 71.7 cents for every dollar earned by a man.
What is Family Income Deficit in Port Orchard?
Family Income Deficit in Port Orchard is $14,898.
Families that are below poverty line in Port Orchard earn $14,898 less on average than the poverty threshold level.
What is Inequality or Gini Index in Port Orchard?
Inequality or Gini Index in Port Orchard is 0.39.
What is the Total Population of Port Orchard?
Total Population of Port Orchard is 15,820.
What is the Total Male Population of Port Orchard?
Total Male Population of Port Orchard is 7,961.
What is the Total Female Population of Port Orchard?
Total Female Population of Port Orchard is 7,859.
What is the Ratio of Males per 100 Females in Port Orchard?
There are 101.30 Males per 100 Females in Port Orchard.
What is the Ratio of Females per 100 Males in Port Orchard?
There are 98.72 Females per 100 Males in Port Orchard.
What is the Median Population Age in Port Orchard?
Median Population Age in Port Orchard is 33.7 Years.
What is the Average Family Size in Port Orchard
Average Family Size in Port Orchard is 2.8 People.
What is the Average Household Size in Port Orchard
Average Household Size in Port Orchard is 2.4 People.
How Large is the Labor Force in Port Orchard?
There are 7,424 People in the Labor Forcein in Port Orchard.
What is the Percentage of People in the Labor Force in Port Orchard?
61.2% of People are in the Labor Force in Port Orchard.
What is the Unemployment Rate in Port Orchard?
Unemployment Rate in Port Orchard is 4.8%.