Lamar, MO Map & Demographics
Lamar Map
Lamar Overview
$19,694
PER CAPITA INCOME
$47,813
AVG FAMILY INCOME
$32,907
AVG HOUSEHOLD INCOME
59.0%
WAGE / INCOME GAP [ % ]
41.0¢/ $1
WAGE / INCOME GAP [ $ ]
0.45
INEQUALITY / GINI INDEX
4,298
TOTAL POPULATION
2,030
MALE POPULATION
2,268
FEMALE POPULATION
89.51
MALES / 100 FEMALES
111.72
FEMALES / 100 MALES
38.7
MEDIAN AGE
2.9
AVG FAMILY SIZE
2.5
AVG HOUSEHOLD SIZE
1,779
LABOR FORCE [ PEOPLE ]
50.8%
PERCENT IN LABOR FORCE
9.7%
UNEMPLOYMENT RATE
Lamar Zip Codes
Lamar Area Codes
Income in Lamar
Income Overview in Lamar
Per Capita Income in Lamar is $19,694, while median incomes of families and households are $47,813 and $32,907 respectively.
| Characteristic | Number | Measure |
| Per Capita Income | 4,298 | $19,694 |
| Median Family Income | 1,134 | $47,813 |
| Mean Family Income | 1,134 | $57,372 |
| Median Household Income | 1,676 | $32,907 |
| Mean Household Income | 1,676 | $47,726 |
| Income Deficit | 1,134 | $0 |
| Wage / Income Gap (%) | 4,298 | 58.98% |
| Wage / Income Gap ($) | 4,298 | 41.02¢ per $1 |
| Gini / Inequality Index | 4,298 | 0.45 |
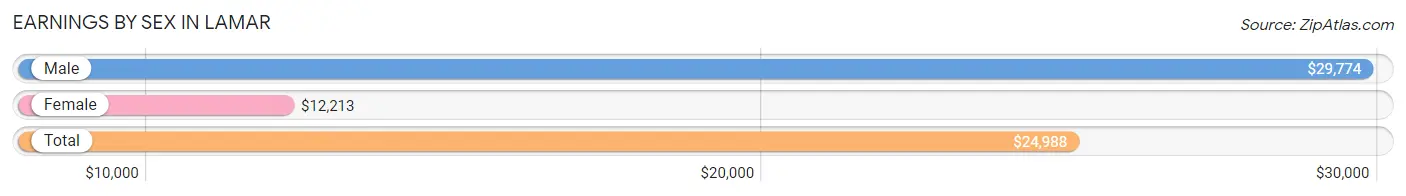
Earnings by Sex in Lamar
Average Earnings in Lamar are $24,988, $29,774 for men and $12,213 for women, a difference of 59.0%.
| Sex | Number | Average Earnings |
| Male | 831 (47.1%) | $29,774 |
| Female | 932 (52.9%) | $12,213 |
| Total | 1,763 (100.0%) | $24,988 |
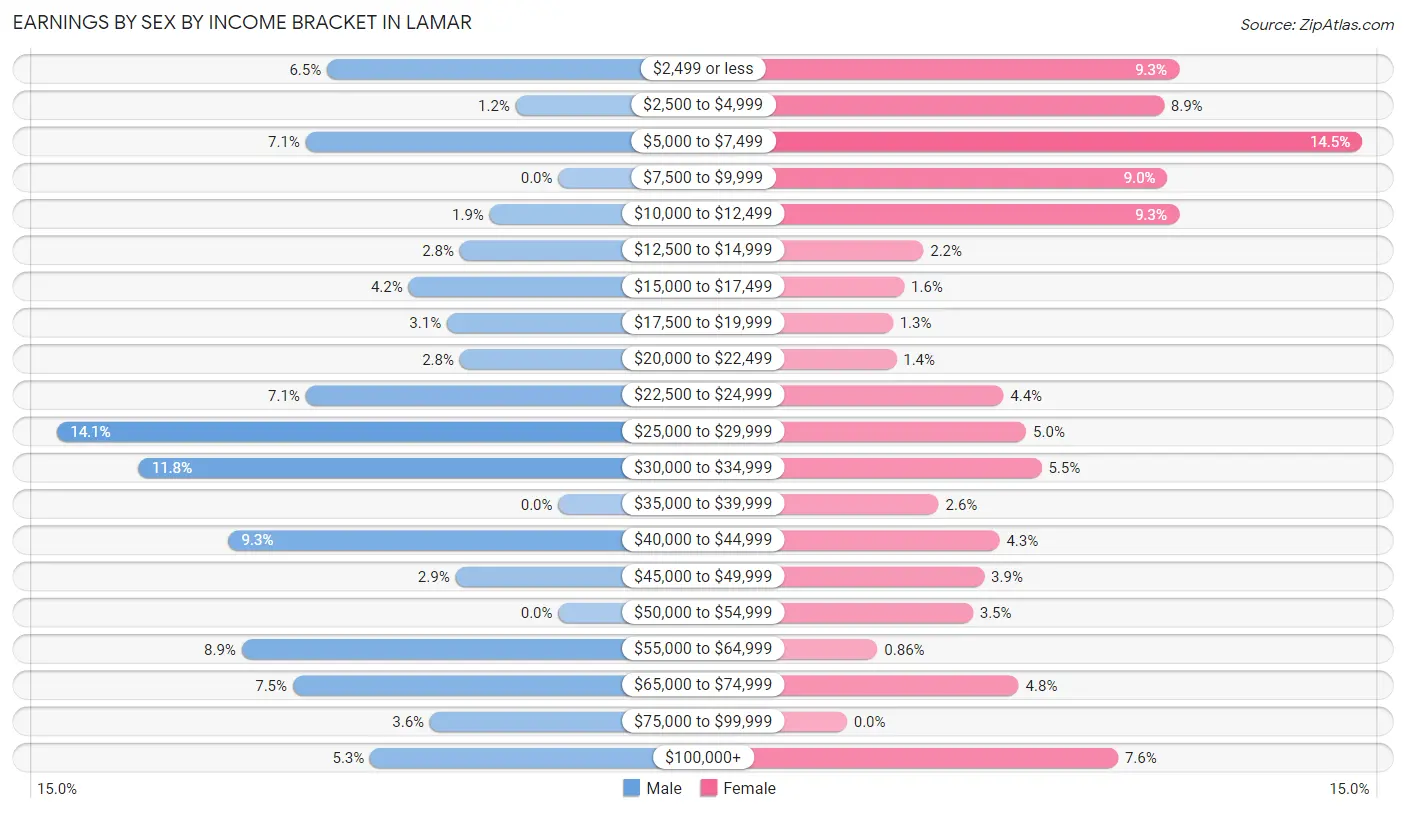
Earnings by Sex by Income Bracket in Lamar
The most common earnings brackets in Lamar are $25,000 to $29,999 for men (117 | 14.1%) and $5,000 to $7,499 for women (135 | 14.5%).
| Income | Male | Female |
| $2,499 or less | 54 (6.5%) | 87 (9.3%) |
| $2,500 to $4,999 | 10 (1.2%) | 83 (8.9%) |
| $5,000 to $7,499 | 59 (7.1%) | 135 (14.5%) |
| $7,500 to $9,999 | 0 (0.0%) | 84 (9.0%) |
| $10,000 to $12,499 | 16 (1.9%) | 87 (9.3%) |
| $12,500 to $14,999 | 23 (2.8%) | 20 (2.1%) |
| $15,000 to $17,499 | 35 (4.2%) | 15 (1.6%) |
| $17,500 to $19,999 | 26 (3.1%) | 12 (1.3%) |
| $20,000 to $22,499 | 23 (2.8%) | 13 (1.4%) |
| $22,500 to $24,999 | 59 (7.1%) | 41 (4.4%) |
| $25,000 to $29,999 | 117 (14.1%) | 47 (5.0%) |
| $30,000 to $34,999 | 98 (11.8%) | 51 (5.5%) |
| $35,000 to $39,999 | 0 (0.0%) | 24 (2.6%) |
| $40,000 to $44,999 | 77 (9.3%) | 40 (4.3%) |
| $45,000 to $49,999 | 24 (2.9%) | 36 (3.9%) |
| $50,000 to $54,999 | 0 (0.0%) | 33 (3.5%) |
| $55,000 to $64,999 | 74 (8.9%) | 8 (0.9%) |
| $65,000 to $74,999 | 62 (7.5%) | 45 (4.8%) |
| $75,000 to $99,999 | 30 (3.6%) | 0 (0.0%) |
| $100,000+ | 44 (5.3%) | 71 (7.6%) |
| Total | 831 (100.0%) | 932 (100.0%) |
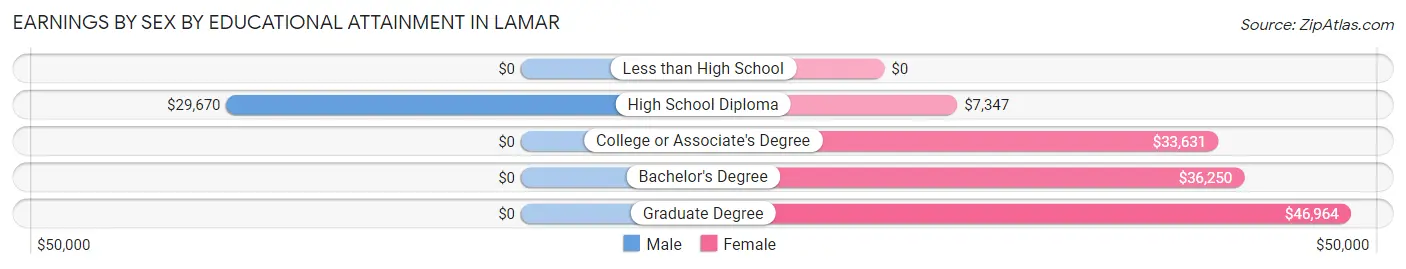
Earnings by Sex by Educational Attainment in Lamar
Average earnings in Lamar are $31,394 for men and $25,921 for women, a difference of 17.4%. Men with an educational attainment of high school diploma enjoy the highest average annual earnings of $29,670, while those with high school diploma education earn the least with $29,670. Women with an educational attainment of graduate degree earn the most with the average annual earnings of $46,964, while those with high school diploma education have the smallest earnings of $7,347.
| Educational Attainment | Male Income | Female Income |
| Less than High School | - | - |
| High School Diploma | $29,670 | $7,347 |
| College or Associate's Degree | - | - |
| Bachelor's Degree | - | - |
| Graduate Degree | - | - |
| Total | $31,394 | $25,921 |
Family Income in Lamar
Family Income Brackets in Lamar
According to the Lamar family income data, there are 217 families falling into the $50,000 to $74,999 income range, which is the most common income bracket and makes up 19.1% of all families. Conversely, the $200,000+ income bracket is the least frequent group with only 9 families (0.8%) belonging to this category.
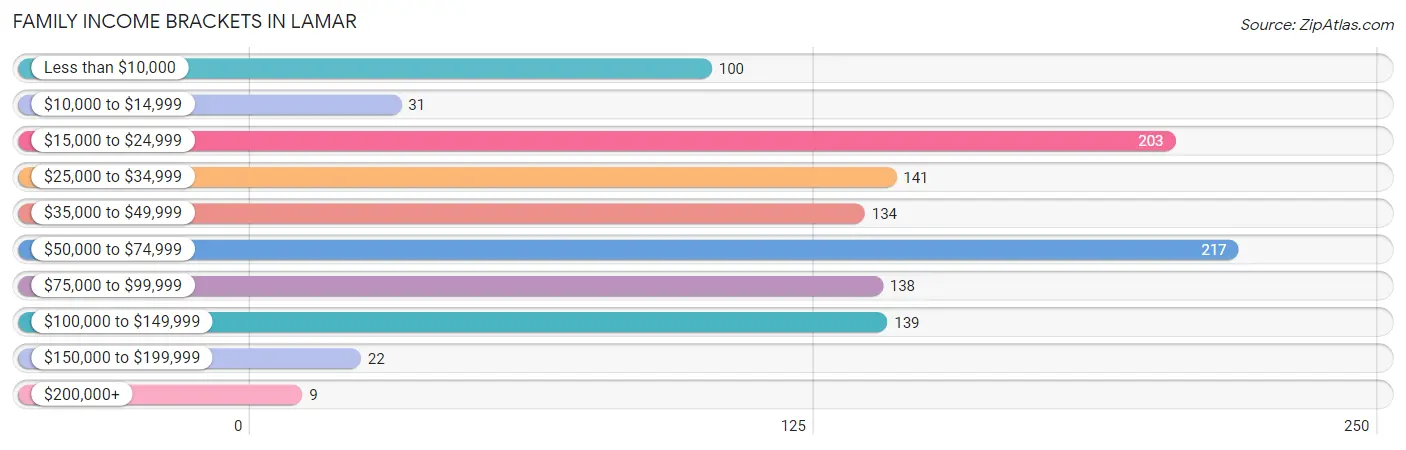
| Income Bracket | # Families | % Families |
| Less than $10,000 | 100 | 8.8% |
| $10,000 to $14,999 | 31 | 2.7% |
| $15,000 to $24,999 | 203 | 17.9% |
| $25,000 to $34,999 | 141 | 12.4% |
| $35,000 to $49,999 | 134 | 11.8% |
| $50,000 to $74,999 | 217 | 19.1% |
| $75,000 to $99,999 | 138 | 12.2% |
| $100,000 to $149,999 | 139 | 12.3% |
| $150,000 to $199,999 | 22 | 1.9% |
| $200,000+ | 9 | 0.8% |
Family Income by Famaliy Size in Lamar
2-person families (454 | 40.0%) account for the highest median family income in Lamar with $48,393 per family, while 2-person families (454 | 40.0%) have the highest median income of $24,196 per family member.
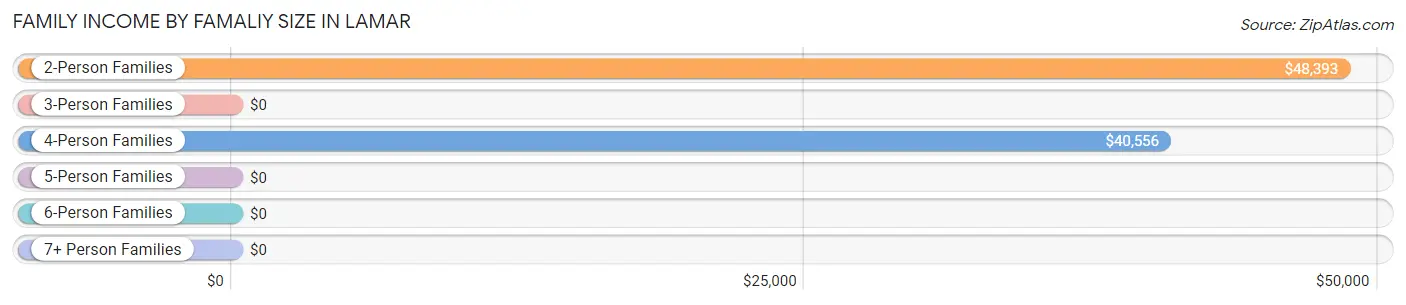
| Income Bracket | # Families | Median Income |
| 2-Person Families | 454 (40.0%) | $48,393 |
| 3-Person Families | 418 (36.9%) | $0 |
| 4-Person Families | 238 (21.0%) | $40,556 |
| 5-Person Families | 24 (2.1%) | $0 |
| 6-Person Families | 0 (0.0%) | $0 |
| 7+ Person Families | 0 (0.0%) | $0 |
| Total | 1,134 (100.0%) | $47,813 |
Family Income by Number of Earners in Lamar
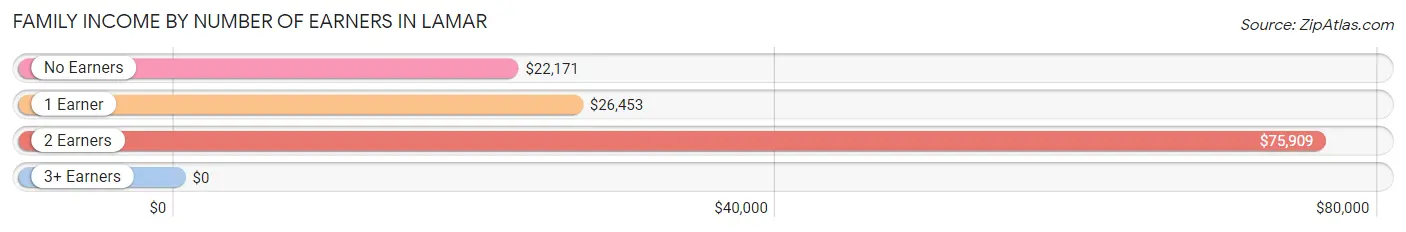
| Number of Earners | # Families | Median Income |
| No Earners | 329 (29.0%) | $22,171 |
| 1 Earner | 265 (23.4%) | $26,453 |
| 2 Earners | 528 (46.6%) | $75,909 |
| 3+ Earners | 12 (1.1%) | $0 |
| Total | 1,134 (100.0%) | $47,813 |
Household Income in Lamar
Household Income Brackets in Lamar
With 389 households falling in the category, the $15,000 to $24,999 income range is the most frequent in Lamar, accounting for 23.2% of all households. In contrast, only 18 households (1.1%) fall into the $200,000+ income bracket, making it the least populous group.
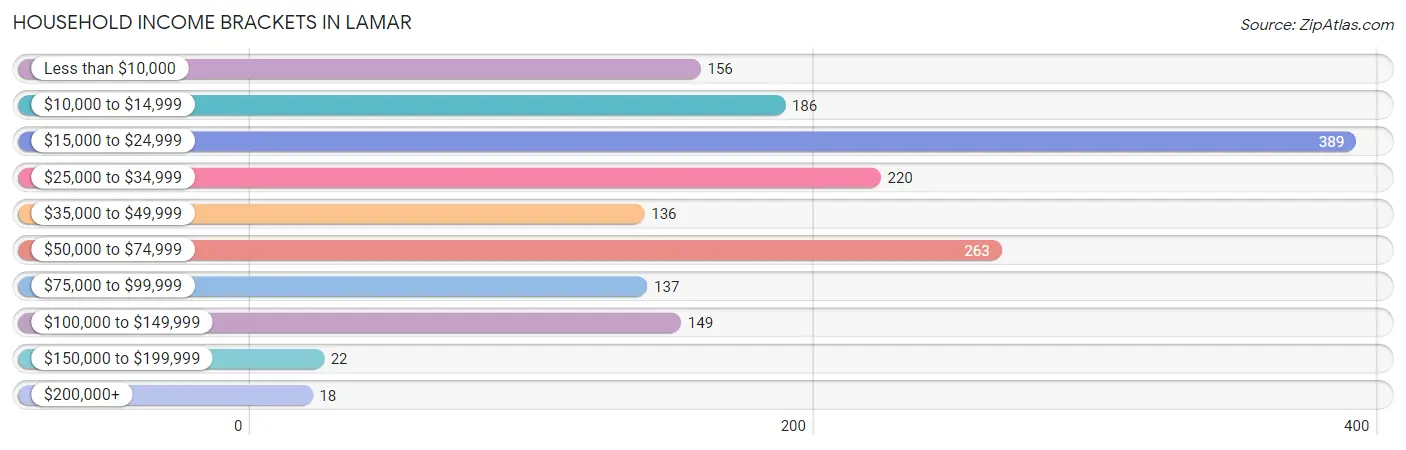
| Income Bracket | # Households | % Households |
| Less than $10,000 | 156 | 9.3% |
| $10,000 to $14,999 | 186 | 11.1% |
| $15,000 to $24,999 | 389 | 23.2% |
| $25,000 to $34,999 | 220 | 13.1% |
| $35,000 to $49,999 | 136 | 8.1% |
| $50,000 to $74,999 | 263 | 15.7% |
| $75,000 to $99,999 | 137 | 8.2% |
| $100,000 to $149,999 | 149 | 8.9% |
| $150,000 to $199,999 | 22 | 1.3% |
| $200,000+ | 18 | 1.1% |
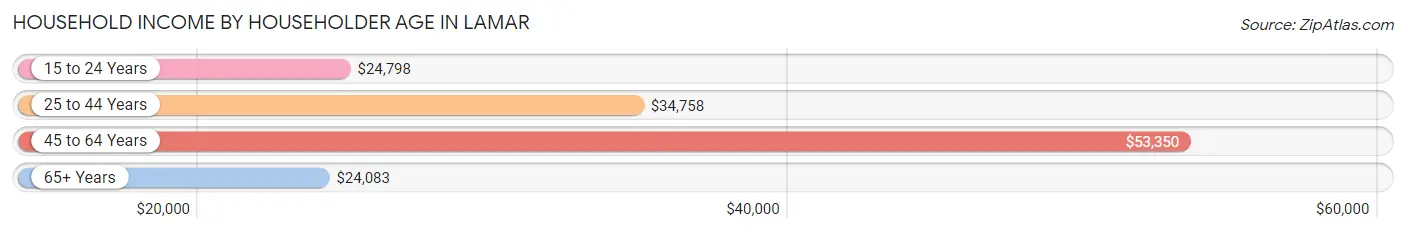
Household Income by Householder Age in Lamar
The median household income in Lamar is $32,907, with the highest median household income of $53,350 found in the 45 to 64 years age bracket for the primary householder. A total of 625 households (37.3%) fall into this category. Meanwhile, the 65+ years age bracket for the primary householder has the lowest median household income of $24,083, with 472 households (28.2%) in this group.
| Income Bracket | # Households | Median Income |
| 15 to 24 Years | 125 (7.5%) | $24,798 |
| 25 to 44 Years | 454 (27.1%) | $34,758 |
| 45 to 64 Years | 625 (37.3%) | $53,350 |
| 65+ Years | 472 (28.2%) | $24,083 |
| Total | 1,676 (100.0%) | $32,907 |
Poverty in Lamar
Income Below Poverty by Sex and Age in Lamar
With 30.3% poverty level for males and 34.8% for females among the residents of Lamar, 6 to 11 year old males and 16 and 17 year old females are the most vulnerable to poverty, with 105 males (87.5%) and 28 females (100.0%) in their respective age groups living below the poverty level.
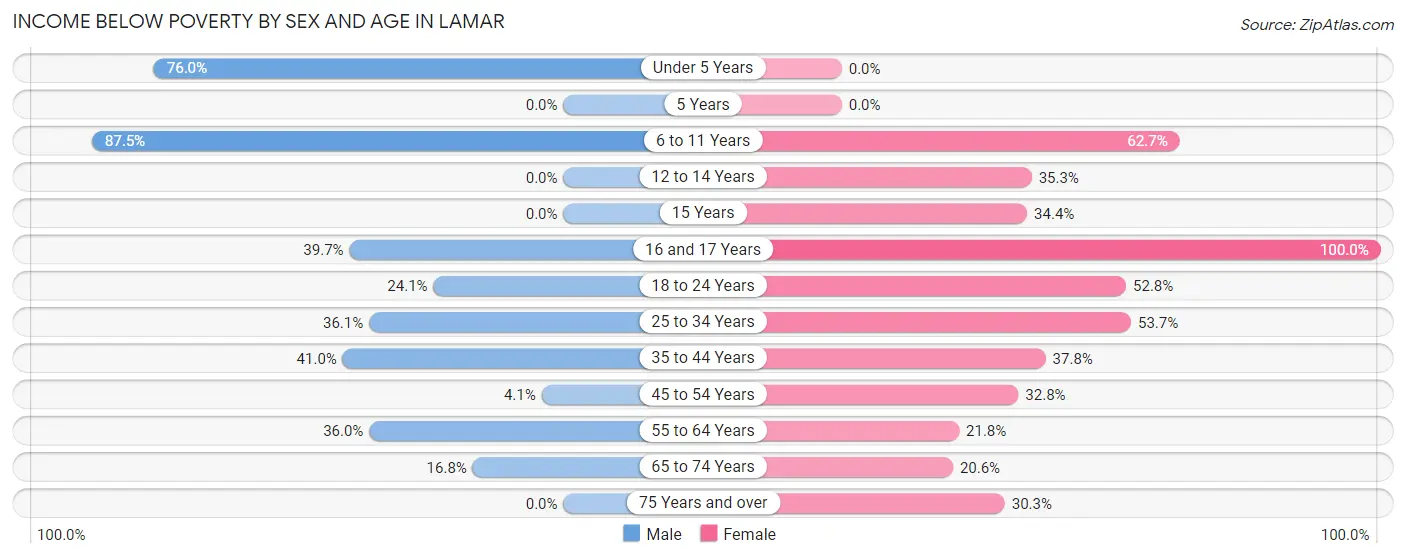
| Age Bracket | Male | Female |
| Under 5 Years | 57 (76.0%) | 0 (0.0%) |
| 5 Years | 0 (0.0%) | 0 (0.0%) |
| 6 to 11 Years | 105 (87.5%) | 42 (62.7%) |
| 12 to 14 Years | 0 (0.0%) | 43 (35.2%) |
| 15 Years | 0 (0.0%) | 32 (34.4%) |
| 16 and 17 Years | 27 (39.7%) | 28 (100.0%) |
| 18 to 24 Years | 55 (24.1%) | 124 (52.8%) |
| 25 to 34 Years | 88 (36.1%) | 160 (53.7%) |
| 35 to 44 Years | 120 (41.0%) | 112 (37.8%) |
| 45 to 54 Years | 10 (4.1%) | 79 (32.8%) |
| 55 to 64 Years | 102 (36.0%) | 44 (21.8%) |
| 65 to 74 Years | 35 (16.8%) | 59 (20.6%) |
| 75 Years and over | 0 (0.0%) | 46 (30.3%) |
| Total | 599 (30.3%) | 769 (34.8%) |
Income Above Poverty by Sex and Age in Lamar
According to the poverty statistics in Lamar, males aged 12 to 14 years and females aged under 5 years are the age groups that are most secure financially, with 100.0% of males and 100.0% of females in these age groups living above the poverty line.
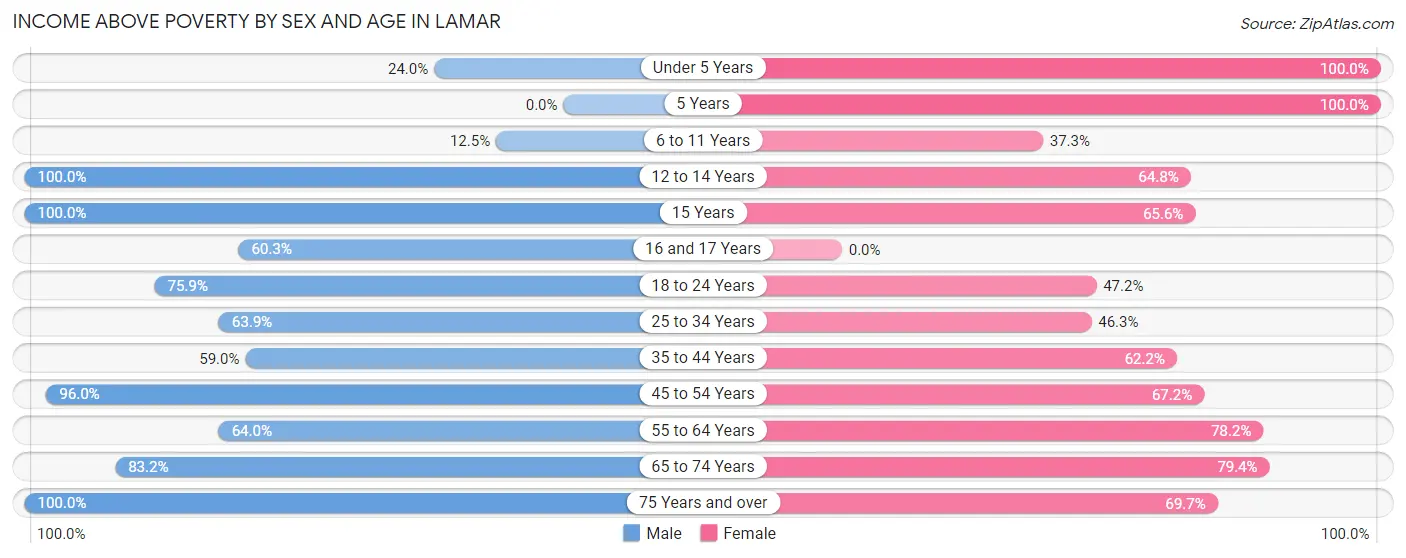
| Age Bracket | Male | Female |
| Under 5 Years | 18 (24.0%) | 138 (100.0%) |
| 5 Years | 0 (0.0%) | 50 (100.0%) |
| 6 to 11 Years | 15 (12.5%) | 25 (37.3%) |
| 12 to 14 Years | 117 (100.0%) | 79 (64.7%) |
| 15 Years | 10 (100.0%) | 61 (65.6%) |
| 16 and 17 Years | 41 (60.3%) | 0 (0.0%) |
| 18 to 24 Years | 173 (75.9%) | 111 (47.2%) |
| 25 to 34 Years | 156 (63.9%) | 138 (46.3%) |
| 35 to 44 Years | 173 (59.0%) | 184 (62.2%) |
| 45 to 54 Years | 237 (96.0%) | 162 (67.2%) |
| 55 to 64 Years | 181 (64.0%) | 158 (78.2%) |
| 65 to 74 Years | 173 (83.2%) | 227 (79.4%) |
| 75 Years and over | 84 (100.0%) | 106 (69.7%) |
| Total | 1,378 (69.7%) | 1,439 (65.2%) |
Income Below Poverty Among Married-Couple Families in Lamar
The poverty statistics for married-couple families in Lamar show that 12.2% or 87 of the total 714 families live below the poverty line. Families with 1 or 2 children have the highest poverty rate of 23.3%, comprising of 61 families. On the other hand, families with 3 or 4 children have the lowest poverty rate of 0.0%, which includes 0 families.
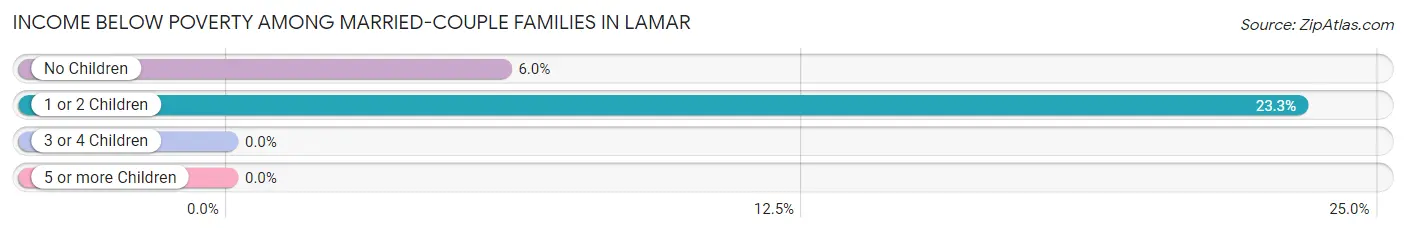
| Children | Above Poverty | Below Poverty |
| No Children | 411 (94.1%) | 26 (5.9%) |
| 1 or 2 Children | 201 (76.7%) | 61 (23.3%) |
| 3 or 4 Children | 15 (100.0%) | 0 (0.0%) |
| 5 or more Children | 0 (0.0%) | 0 (0.0%) |
| Total | 627 (87.8%) | 87 (12.2%) |
Income Below Poverty Among Single-Parent Households in Lamar
According to the poverty data in Lamar, 63.0% or 102 single-father households and 48.1% or 124 single-mother households are living below the poverty line. Among single-father households, those with no children have the highest poverty rate, with 102 households (89.5%) experiencing poverty. Likewise, among single-mother households, those with 3 or 4 children have the highest poverty rate, with 44 households (83.0%) falling below the poverty line.
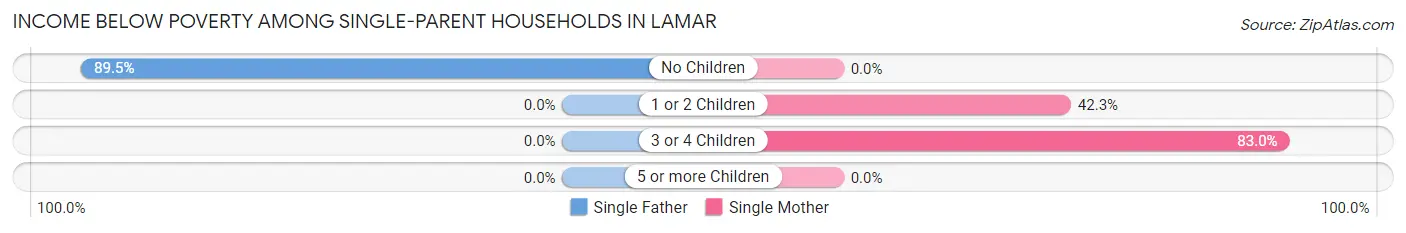
| Children | Single Father | Single Mother |
| No Children | 102 (89.5%) | 0 (0.0%) |
| 1 or 2 Children | 0 (0.0%) | 80 (42.3%) |
| 3 or 4 Children | 0 (0.0%) | 44 (83.0%) |
| 5 or more Children | 0 (0.0%) | 0 (0.0%) |
| Total | 102 (63.0%) | 124 (48.1%) |
Income Below Poverty Among Married-Couple vs Single-Parent Households in Lamar
The poverty data for Lamar shows that 87 of the married-couple family households (12.2%) and 226 of the single-parent households (53.8%) are living below the poverty level. Within the married-couple family households, those with 1 or 2 children have the highest poverty rate, with 61 households (23.3%) falling below the poverty line. Among the single-parent households, those with 3 or 4 children have the highest poverty rate, with 44 household (83.0%) living below poverty.
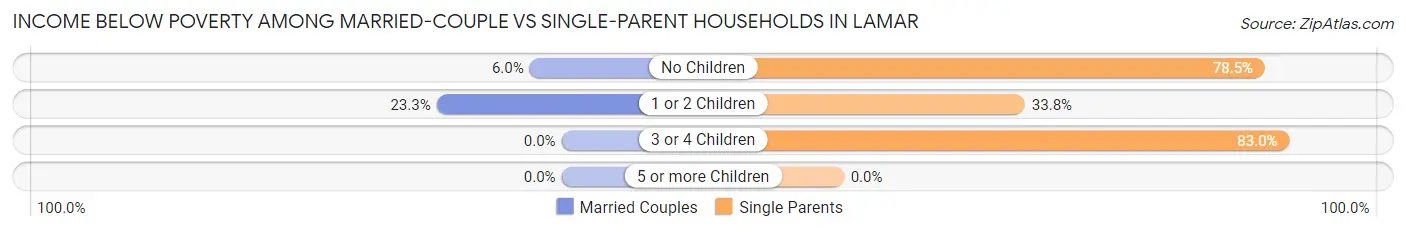
| Children | Married-Couple Families | Single-Parent Households |
| No Children | 26 (5.9%) | 102 (78.5%) |
| 1 or 2 Children | 61 (23.3%) | 80 (33.8%) |
| 3 or 4 Children | 0 (0.0%) | 44 (83.0%) |
| 5 or more Children | 0 (0.0%) | 0 (0.0%) |
| Total | 87 (12.2%) | 226 (53.8%) |
Race in Lamar
The most populous races in Lamar are White / Caucasian (4,024 | 93.6%), Two or more Races (215 | 5.0%), and Hispanic or Latino (75 | 1.7%).
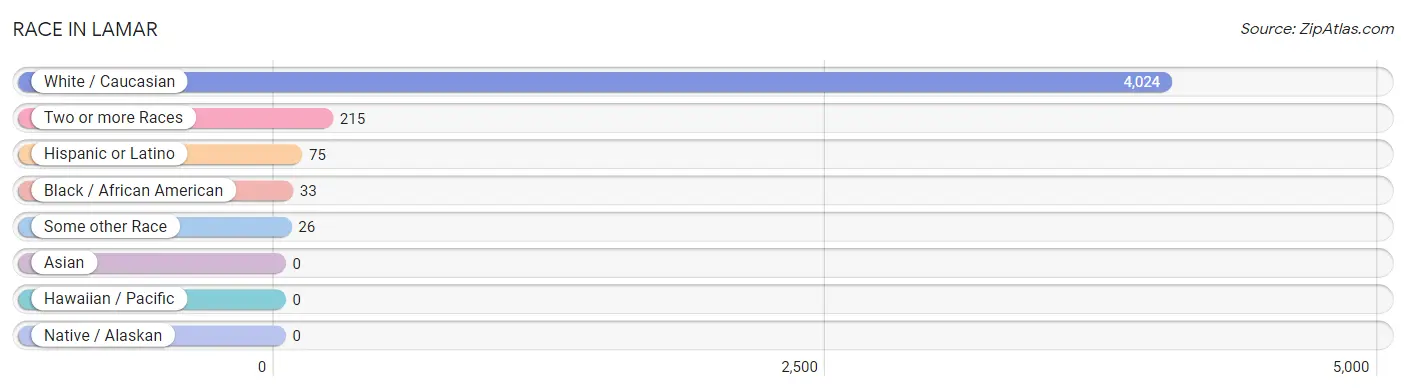
| Race | # Population | % Population |
| Asian | 0 | 0.0% |
| Black / African American | 33 | 0.8% |
| Hawaiian / Pacific | 0 | 0.0% |
| Hispanic or Latino | 75 | 1.7% |
| Native / Alaskan | 0 | 0.0% |
| White / Caucasian | 4,024 | 93.6% |
| Two or more Races | 215 | 5.0% |
| Some other Race | 26 | 0.6% |
| Total | 4,298 | 100.0% |
Ancestry in Lamar
The most populous ancestries reported in Lamar are German (1,192 | 27.7%), Irish (675 | 15.7%), English (307 | 7.1%), Italian (114 | 2.6%), and Dutch (105 | 2.4%), together accounting for 55.7% of all Lamar residents.
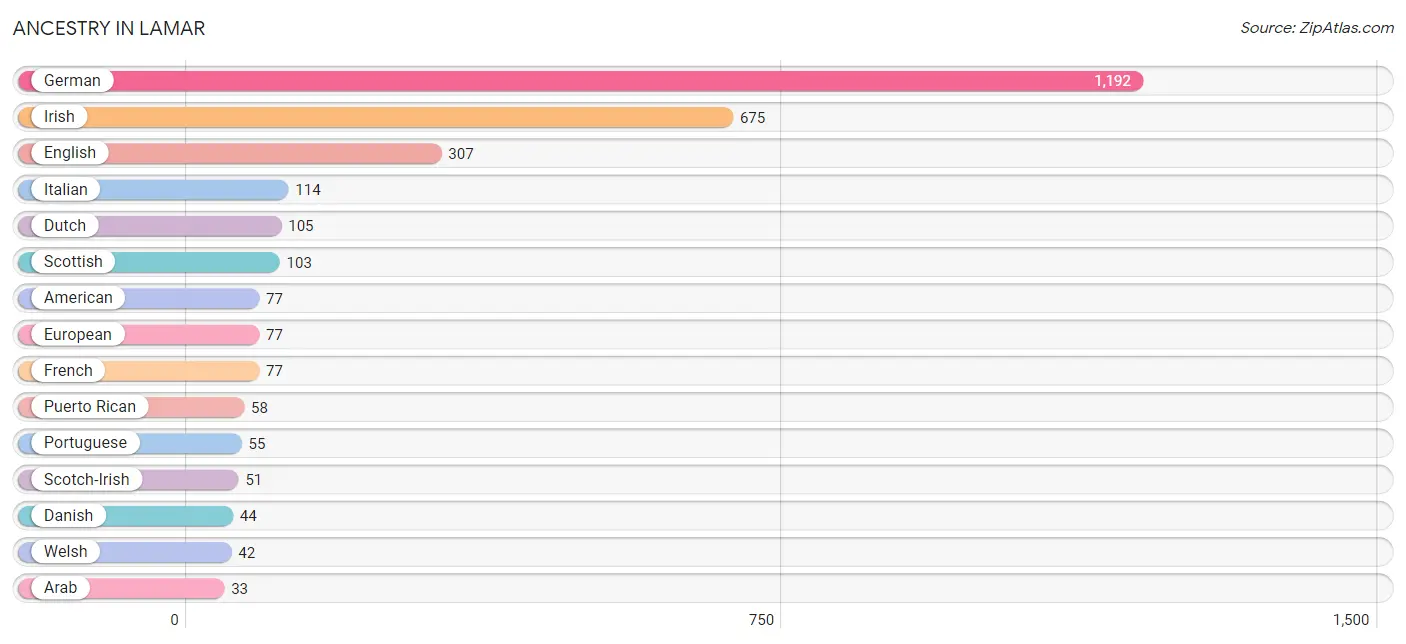
| Ancestry | # Population | % Population |
| American | 77 | 1.8% |
| Arab | 33 | 0.8% |
| Bhutanese | 26 | 0.6% |
| Cherokee | 24 | 0.6% |
| Danish | 44 | 1.0% |
| Dutch | 105 | 2.4% |
| English | 307 | 7.1% |
| European | 77 | 1.8% |
| Fijian | 26 | 0.6% |
| French | 77 | 1.8% |
| German | 1,192 | 27.7% |
| Inupiat | 14 | 0.3% |
| Irish | 675 | 15.7% |
| Italian | 114 | 2.6% |
| Lebanese | 33 | 0.8% |
| Marshallese | 26 | 0.6% |
| Norwegian | 5 | 0.1% |
| Polish | 10 | 0.2% |
| Portuguese | 55 | 1.3% |
| Puerto Rican | 58 | 1.3% |
| Scandinavian | 24 | 0.6% |
| Scotch-Irish | 51 | 1.2% |
| Scottish | 103 | 2.4% |
| Swedish | 21 | 0.5% |
| Welsh | 42 | 1.0% | View All 25 Rows |
Immigrants in Lamar

| Immigration Origin | # Population | % Population | View All 0 Rows |
Sex and Age in Lamar
Sex and Age in Lamar
The most populous age groups in Lamar are 40 to 44 Years (209 | 10.3%) for men and 35 to 39 Years (231 | 10.2%) for women.
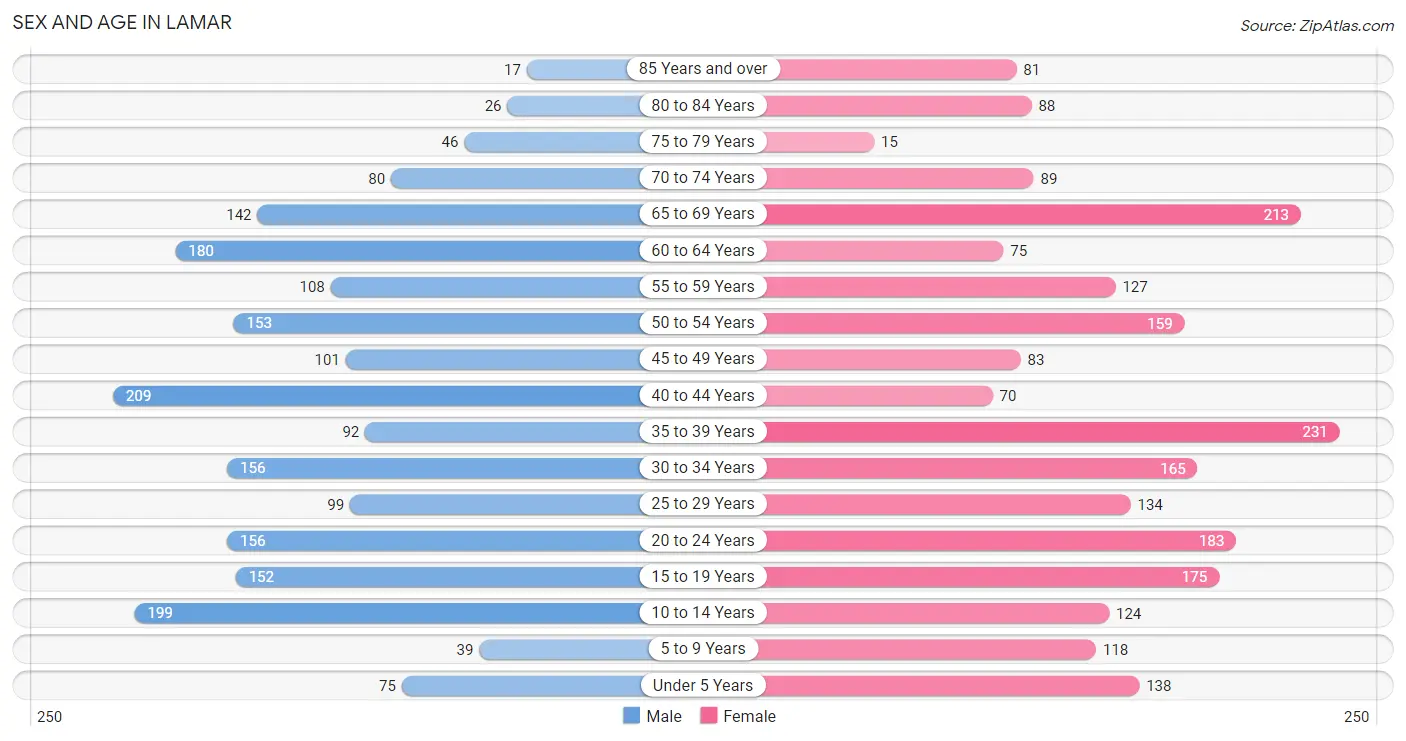
| Age Bracket | Male | Female |
| Under 5 Years | 75 (3.7%) | 138 (6.1%) |
| 5 to 9 Years | 39 (1.9%) | 118 (5.2%) |
| 10 to 14 Years | 199 (9.8%) | 124 (5.5%) |
| 15 to 19 Years | 152 (7.5%) | 175 (7.7%) |
| 20 to 24 Years | 156 (7.7%) | 183 (8.1%) |
| 25 to 29 Years | 99 (4.9%) | 134 (5.9%) |
| 30 to 34 Years | 156 (7.7%) | 165 (7.3%) |
| 35 to 39 Years | 92 (4.5%) | 231 (10.2%) |
| 40 to 44 Years | 209 (10.3%) | 70 (3.1%) |
| 45 to 49 Years | 101 (5.0%) | 83 (3.7%) |
| 50 to 54 Years | 153 (7.5%) | 159 (7.0%) |
| 55 to 59 Years | 108 (5.3%) | 127 (5.6%) |
| 60 to 64 Years | 180 (8.9%) | 75 (3.3%) |
| 65 to 69 Years | 142 (7.0%) | 213 (9.4%) |
| 70 to 74 Years | 80 (3.9%) | 89 (3.9%) |
| 75 to 79 Years | 46 (2.3%) | 15 (0.7%) |
| 80 to 84 Years | 26 (1.3%) | 88 (3.9%) |
| 85 Years and over | 17 (0.8%) | 81 (3.6%) |
| Total | 2,030 (100.0%) | 2,268 (100.0%) |
Families and Households in Lamar
Median Family Size in Lamar
The median family size in Lamar is 2.94 persons per family, with married-couple families (714 | 63.0%) accounting for the largest median family size of 3.09 persons per family. On the other hand, single male/father families (162 | 14.3%) represent the smallest median family size with 2.60 persons per family.
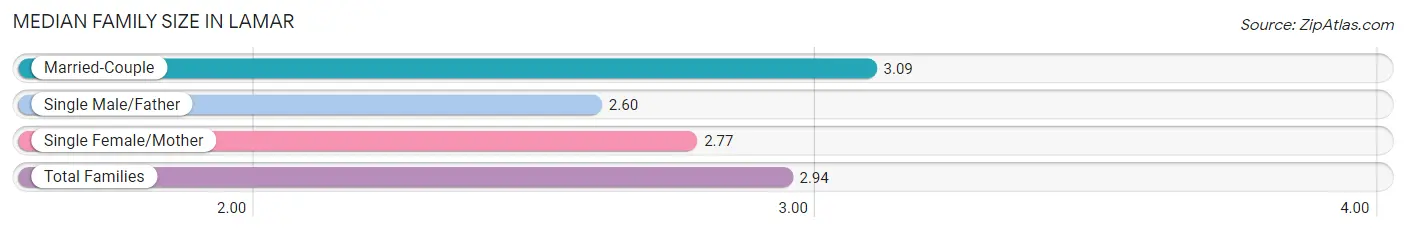
| Family Type | # Families | Family Size |
| Married-Couple | 714 (63.0%) | 3.09 |
| Single Male/Father | 162 (14.3%) | 2.60 |
| Single Female/Mother | 258 (22.8%) | 2.77 |
| Total Families | 1,134 (100.0%) | 2.94 |
Median Household Size in Lamar
The median household size in Lamar is 2.48 persons per household, with married-couple households (714 | 42.6%) accounting for the largest median household size of 3.09 persons per household. non-family households (542 | 32.3%) represent the smallest median household size with 1.30 persons per household.
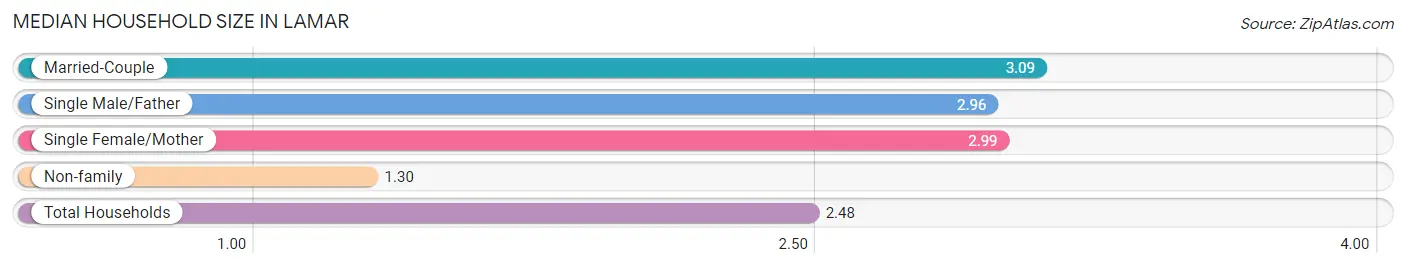
| Household Type | # Households | Household Size |
| Married-Couple | 714 (42.6%) | 3.09 |
| Single Male/Father | 162 (9.7%) | 2.96 |
| Single Female/Mother | 258 (15.4%) | 2.99 |
| Non-family | 542 (32.3%) | 1.30 |
| Total Households | 1,676 (100.0%) | 2.48 |
Household Size by Marriage Status in Lamar
Out of a total of 1,676 households in Lamar, 1,134 (67.7%) are family households, while 542 (32.3%) are nonfamily households. The most numerous type of family households are 2-person households, comprising 421, and the most common type of nonfamily households are 1-person households, comprising 418.
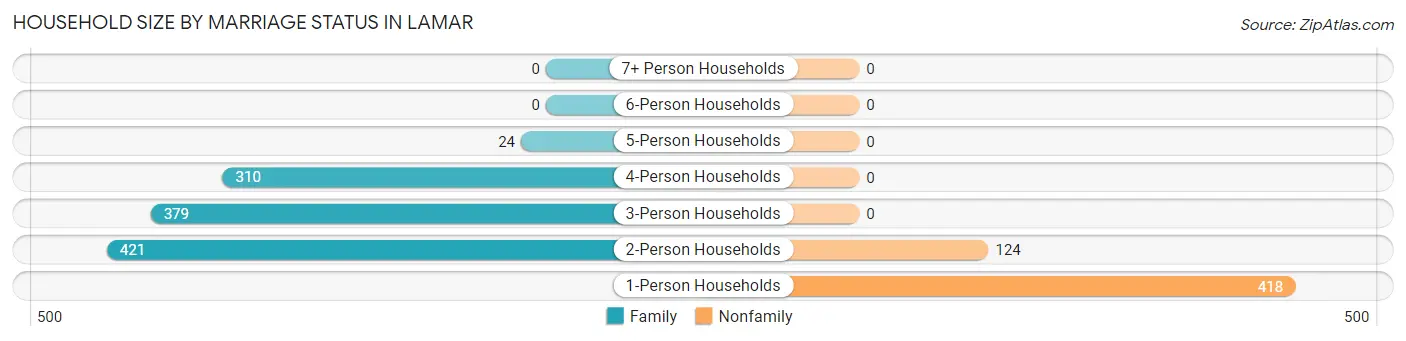
| Household Size | Family Households | Nonfamily Households |
| 1-Person Households | - | 418 (24.9%) |
| 2-Person Households | 421 (25.1%) | 124 (7.4%) |
| 3-Person Households | 379 (22.6%) | 0 (0.0%) |
| 4-Person Households | 310 (18.5%) | 0 (0.0%) |
| 5-Person Households | 24 (1.4%) | 0 (0.0%) |
| 6-Person Households | 0 (0.0%) | 0 (0.0%) |
| 7+ Person Households | 0 (0.0%) | 0 (0.0%) |
| Total | 1,134 (67.7%) | 542 (32.3%) |
Female Fertility in Lamar
Fertility by Age in Lamar
Average fertility rate in Lamar is 53.0 births per 1,000 women. Women in the age bracket of 20 to 34 years have the highest fertility rate with 122.0 births per 1,000 women. Women in the age bracket of 20 to 34 years acount for 100.0% of all women with births.
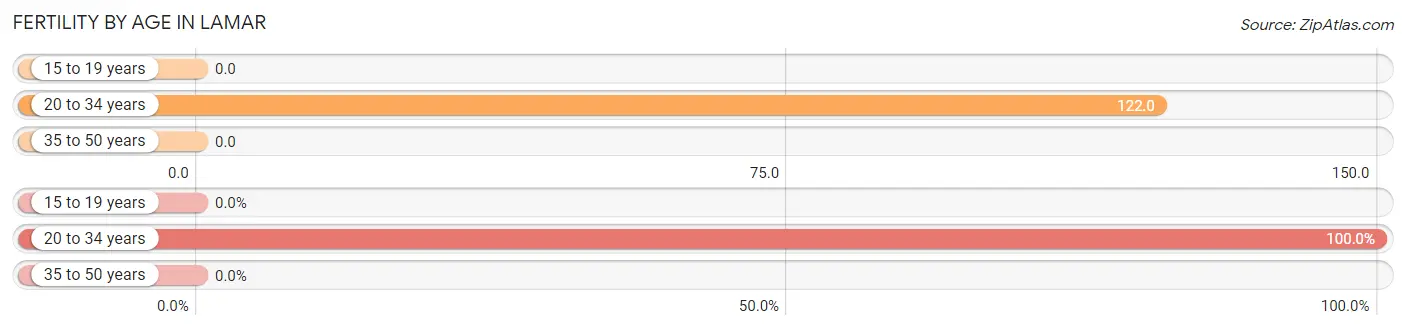
| Age Bracket | Women with Births | Births / 1,000 Women |
| 15 to 19 years | 0 (0.0%) | 0.0 |
| 20 to 34 years | 59 (100.0%) | 122.0 |
| 35 to 50 years | 0 (0.0%) | 0.0 |
| Total | 59 (100.0%) | 53.0 |
Fertility by Age by Marriage Status in Lamar
66.1% of women with births (59) in Lamar are married. The highest percentage of unmarried women with births falls into 20 to 34 years age bracket with 33.9% of them unmarried at the time of birth, while the lowest percentage of unmarried women with births belong to 20 to 34 years age bracket with 33.9% of them unmarried.
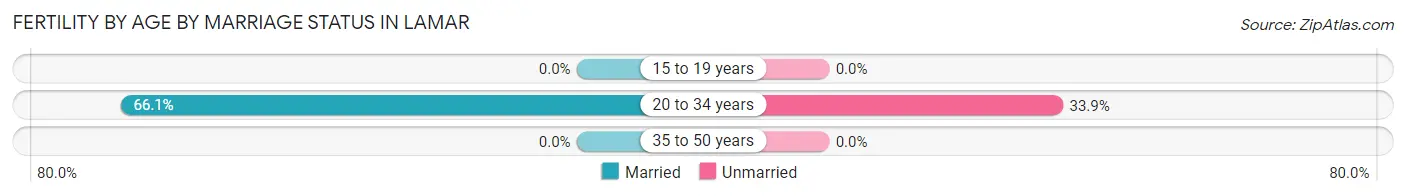
| Age Bracket | Married | Unmarried |
| 15 to 19 years | 0 (0.0%) | 0 (0.0%) |
| 20 to 34 years | 39 (66.1%) | 20 (33.9%) |
| 35 to 50 years | 0 (0.0%) | 0 (0.0%) |
| Total | 39 (66.1%) | 20 (33.9%) |
Fertility by Education in Lamar
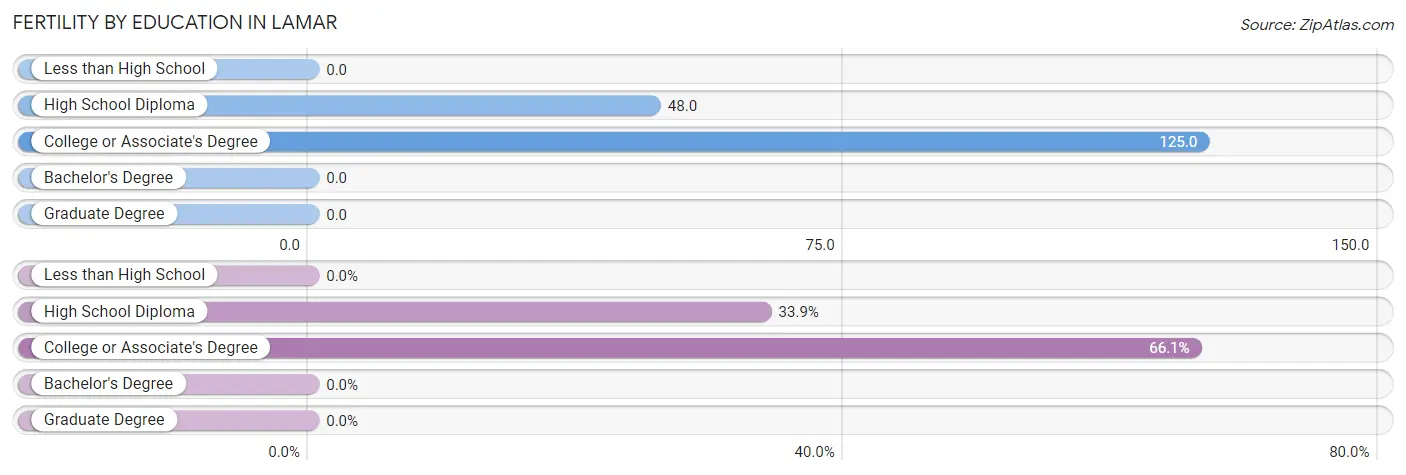
| Educational Attainment | Women with Births | Births / 1,000 Women |
| Less than High School | 0 (0.0%) | 0.0 |
| High School Diploma | 20 (33.9%) | 48.0 |
| College or Associate's Degree | 39 (66.1%) | 125.0 |
| Bachelor's Degree | 0 (0.0%) | 0.0 |
| Graduate Degree | 0 (0.0%) | 0.0 |
| Total | 59 (100.0%) | 53.0 |
Fertility by Education by Marriage Status in Lamar
33.9% of women with births in Lamar are unmarried. Women with the educational attainment of college or associate's degree are most likely to be married with 100.0% of them married at childbirth, while women with the educational attainment of high school diploma are least likely to be married with 100.0% of them unmarried at childbirth.
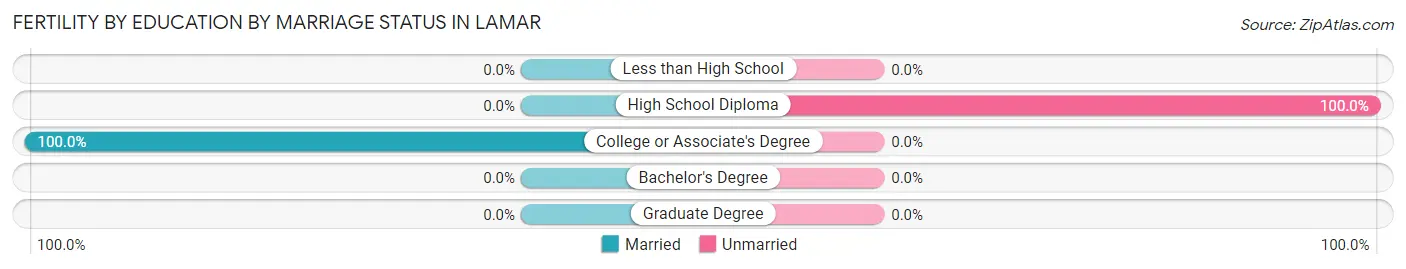
| Educational Attainment | Married | Unmarried |
| Less than High School | 0 (0.0%) | 0 (0.0%) |
| High School Diploma | 0 (0.0%) | 20 (100.0%) |
| College or Associate's Degree | 39 (100.0%) | 0 (0.0%) |
| Bachelor's Degree | 0 (0.0%) | 0 (0.0%) |
| Graduate Degree | 0 (0.0%) | 0 (0.0%) |
| Total | 39 (66.1%) | 20 (33.9%) |
Employment Characteristics in Lamar
Employment by Class of Employer in Lamar
Among the 1,604 employed individuals in Lamar, private company employees (1,086 | 67.7%), local government employees (152 | 9.5%), and state government employees (134 | 8.4%) make up the most common classes of employment.
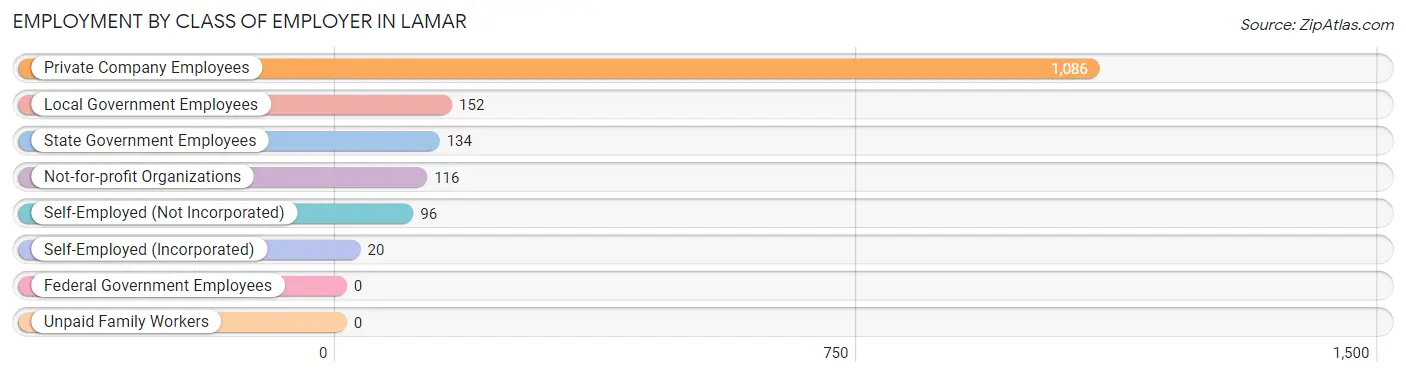
| Employer Class | # Employees | % Employees |
| Private Company Employees | 1,086 | 67.7% |
| Self-Employed (Incorporated) | 20 | 1.3% |
| Self-Employed (Not Incorporated) | 96 | 6.0% |
| Not-for-profit Organizations | 116 | 7.2% |
| Local Government Employees | 152 | 9.5% |
| State Government Employees | 134 | 8.4% |
| Federal Government Employees | 0 | 0.0% |
| Unpaid Family Workers | 0 | 0.0% |
| Total | 1,604 | 100.0% |
Employment Status by Age in Lamar
According to the labor force statistics for Lamar, out of the total population over 16 years of age (3,501), 50.8% or 1,779 individuals are in the labor force, with 9.7% or 173 of them unemployed. The age group with the highest labor force participation rate is 25 to 29 years, with 88.8% or 207 individuals in the labor force. Within the labor force, the 30 to 34 years age range has the highest percentage of unemployed individuals, with 52.9% or 55 of them being unemployed.
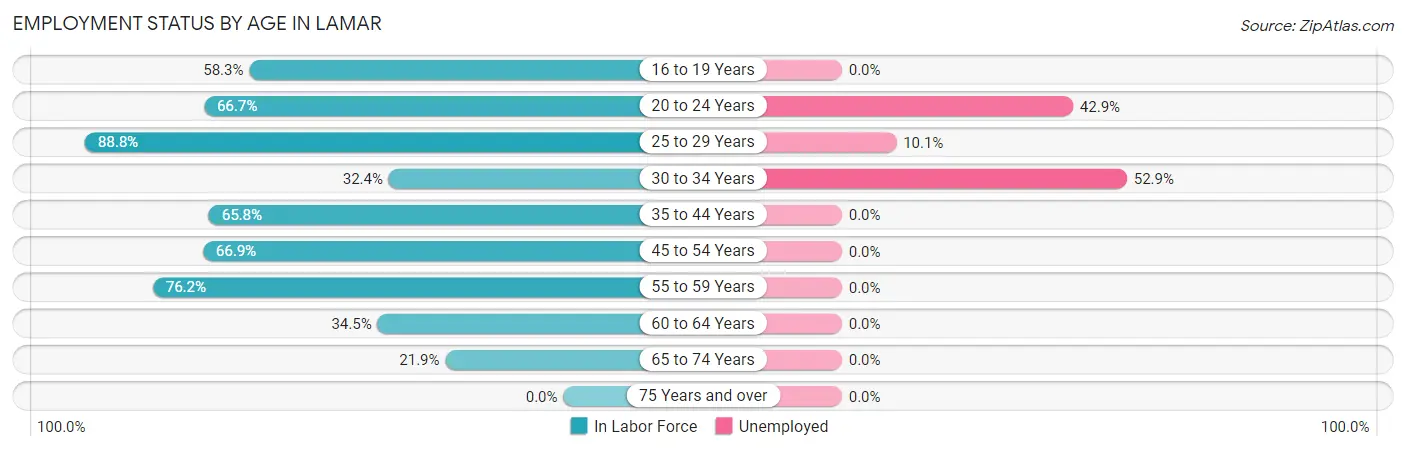
| Age Bracket | In Labor Force | Unemployed |
| 16 to 19 Years | 130 (58.3%) | 0 (0.0%) |
| 20 to 24 Years | 226 (66.7%) | 97 (42.9%) |
| 25 to 29 Years | 207 (88.8%) | 21 (10.1%) |
| 30 to 34 Years | 104 (32.4%) | 55 (52.9%) |
| 35 to 44 Years | 396 (65.8%) | 0 (0.0%) |
| 45 to 54 Years | 332 (66.9%) | 0 (0.0%) |
| 55 to 59 Years | 179 (76.2%) | 0 (0.0%) |
| 60 to 64 Years | 88 (34.5%) | 0 (0.0%) |
| 65 to 74 Years | 115 (21.9%) | 0 (0.0%) |
| 75 Years and over | 0 (0.0%) | 0 (0.0%) |
| Total | 1,779 (50.8%) | 173 (9.7%) |
Employment Status by Educational Attainment in Lamar
According to labor force statistics for Lamar, 61.0% of individuals (1,307) out of the total population between 25 and 64 years of age (2,142) are in the labor force, with 5.8% or 76 of them being unemployed. The group with the highest labor force participation rate are those with the educational attainment of bachelor's degree or higher, with 96.0% or 363 individuals in the labor force. Within the labor force, individuals with college / associate degree education have the highest percentage of unemployment, with 18.7% or 76 of them being unemployed.
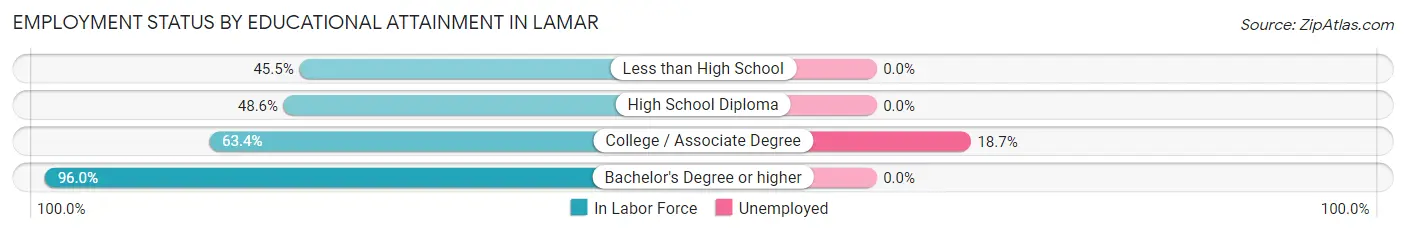
| Educational Attainment | In Labor Force | Unemployed |
| Less than High School | 130 (45.5%) | 0 (0.0%) |
| High School Diploma | 407 (48.6%) | 0 (0.0%) |
| College / Associate Degree | 406 (63.4%) | 120 (18.7%) |
| Bachelor's Degree or higher | 363 (96.0%) | 0 (0.0%) |
| Total | 1,307 (61.0%) | 124 (5.8%) |
Employment Occupations by Sex in Lamar
Management, Business, Science and Arts Occupations
The most common Management, Business, Science and Arts occupations in Lamar are Community & Social Service (229 | 14.3%), Education Instruction & Library (163 | 10.2%), Management (143 | 8.9%), Health Diagnosing & Treating (90 | 5.6%), and Computers, Engineering & Science (53 | 3.3%).
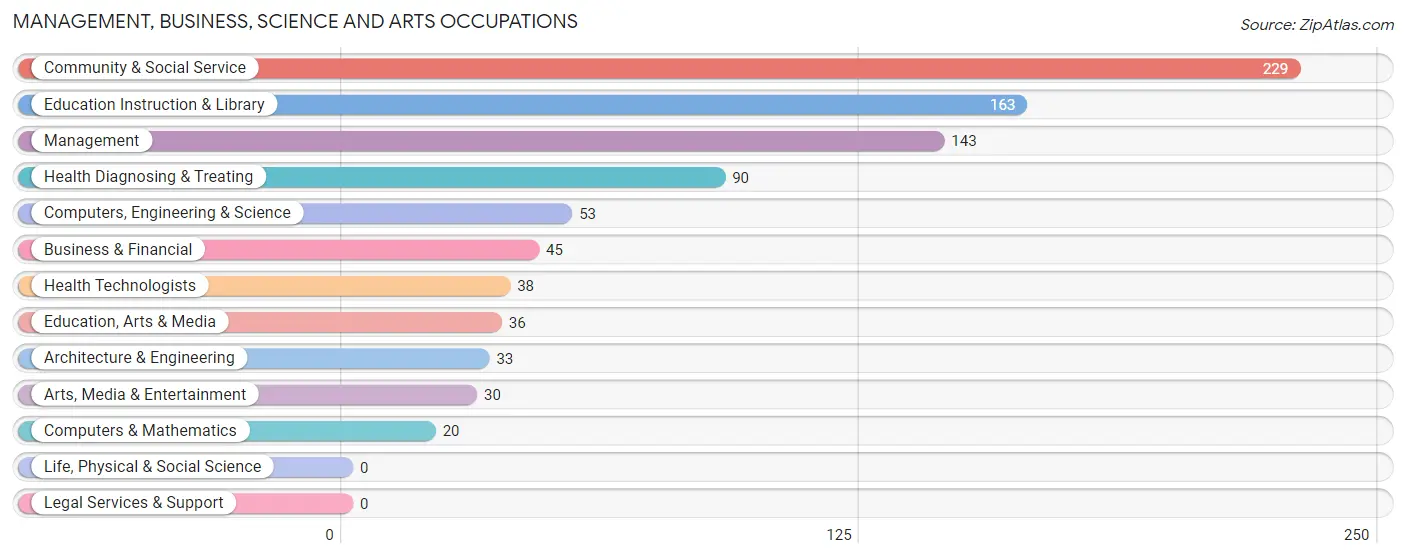
Management, Business, Science and Arts Occupations by Sex
Within the Management, Business, Science and Arts occupations in Lamar, the most male-oriented occupations are Computers, Engineering & Science (100.0%), Computers & Mathematics (100.0%), and Architecture & Engineering (100.0%), while the most female-oriented occupations are Education, Arts & Media (100.0%), Arts, Media & Entertainment (100.0%), and Health Technologists (100.0%).
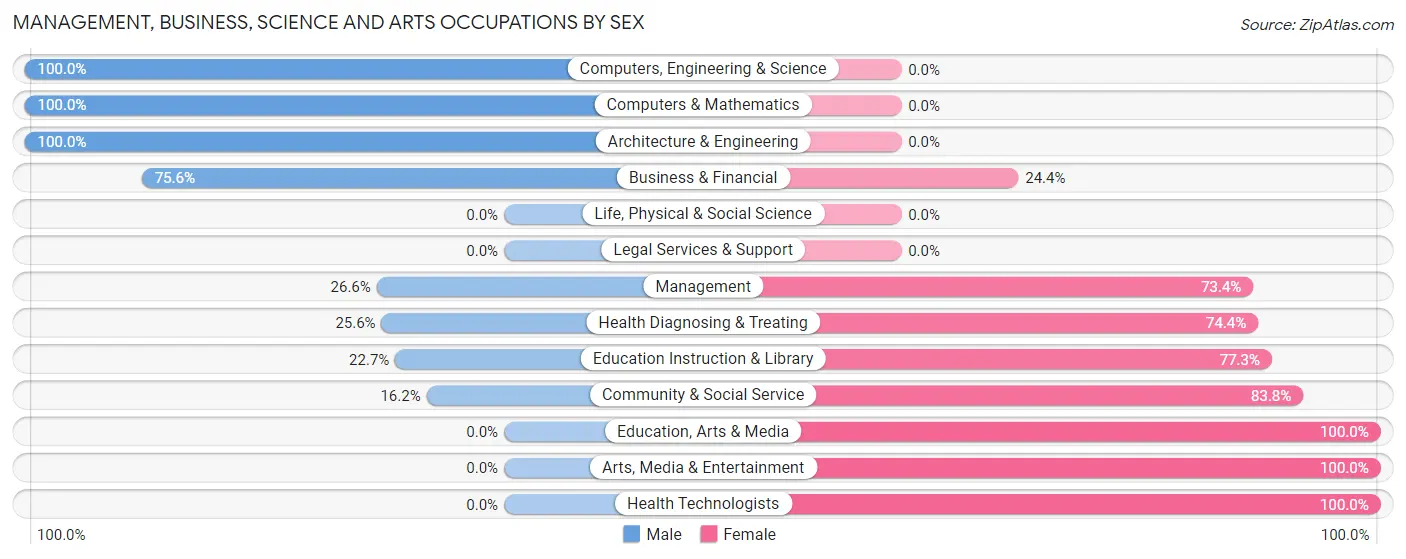
| Occupation | Male | Female |
| Management | 38 (26.6%) | 105 (73.4%) |
| Business & Financial | 34 (75.6%) | 11 (24.4%) |
| Computers, Engineering & Science | 53 (100.0%) | 0 (0.0%) |
| Computers & Mathematics | 20 (100.0%) | 0 (0.0%) |
| Architecture & Engineering | 33 (100.0%) | 0 (0.0%) |
| Life, Physical & Social Science | 0 (0.0%) | 0 (0.0%) |
| Community & Social Service | 37 (16.2%) | 192 (83.8%) |
| Education, Arts & Media | 0 (0.0%) | 36 (100.0%) |
| Legal Services & Support | 0 (0.0%) | 0 (0.0%) |
| Education Instruction & Library | 37 (22.7%) | 126 (77.3%) |
| Arts, Media & Entertainment | 0 (0.0%) | 30 (100.0%) |
| Health Diagnosing & Treating | 23 (25.6%) | 67 (74.4%) |
| Health Technologists | 0 (0.0%) | 38 (100.0%) |
| Total (Category) | 185 (33.0%) | 375 (67.0%) |
| Total (Overall) | 807 (50.3%) | 797 (49.7%) |
Services Occupations
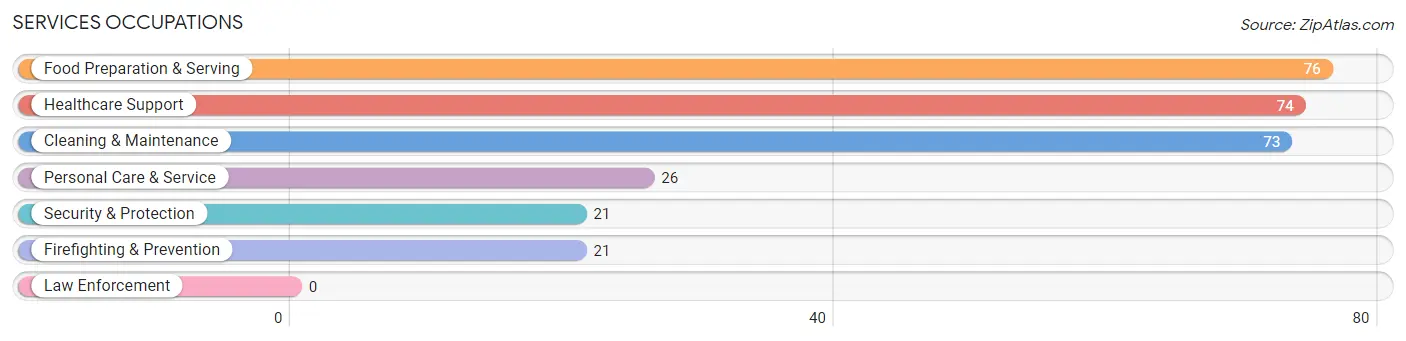
The most common Services occupations in Lamar are Food Preparation & Serving (76 | 4.7%), Healthcare Support (74 | 4.6%), Cleaning & Maintenance (73 | 4.5%), Personal Care & Service (26 | 1.6%), and Security & Protection (21 | 1.3%).
Services Occupations by Sex
Within the Services occupations in Lamar, the most male-oriented occupations are Security & Protection (100.0%), Firefighting & Prevention (100.0%), and Cleaning & Maintenance (100.0%), while the most female-oriented occupations are Healthcare Support (100.0%), Personal Care & Service (100.0%), and Food Preparation & Serving (64.5%).
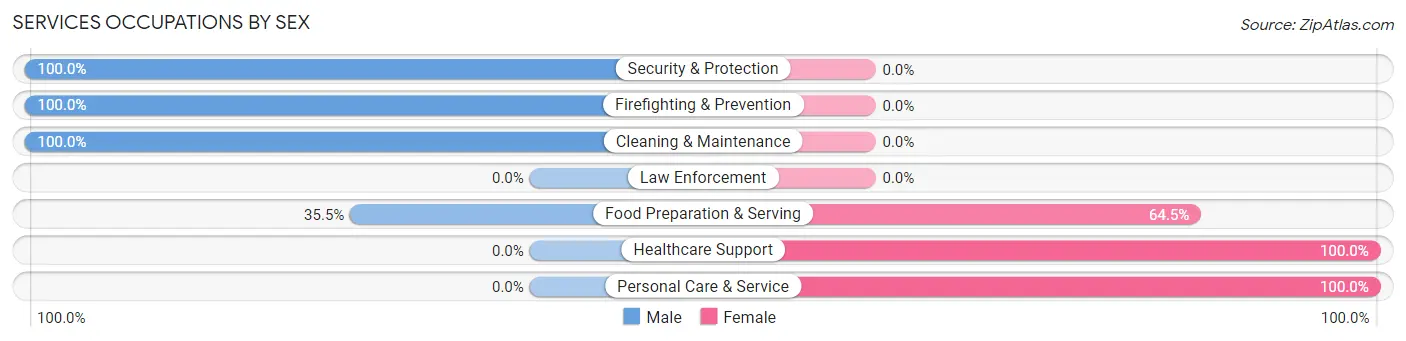
| Occupation | Male | Female |
| Healthcare Support | 0 (0.0%) | 74 (100.0%) |
| Security & Protection | 21 (100.0%) | 0 (0.0%) |
| Firefighting & Prevention | 21 (100.0%) | 0 (0.0%) |
| Law Enforcement | 0 (0.0%) | 0 (0.0%) |
| Food Preparation & Serving | 27 (35.5%) | 49 (64.5%) |
| Cleaning & Maintenance | 73 (100.0%) | 0 (0.0%) |
| Personal Care & Service | 0 (0.0%) | 26 (100.0%) |
| Total (Category) | 121 (44.8%) | 149 (55.2%) |
| Total (Overall) | 807 (50.3%) | 797 (49.7%) |
Sales and Office Occupations
The most common Sales and Office occupations in Lamar are Office & Administration (184 | 11.5%), and Sales & Related (125 | 7.8%).

Sales and Office Occupations by Sex

| Occupation | Male | Female |
| Sales & Related | 36 (28.8%) | 89 (71.2%) |
| Office & Administration | 33 (17.9%) | 151 (82.1%) |
| Total (Category) | 69 (22.3%) | 240 (77.7%) |
| Total (Overall) | 807 (50.3%) | 797 (49.7%) |
Natural Resources, Construction and Maintenance Occupations
The most common Natural Resources, Construction and Maintenance occupations in Lamar are Construction & Extraction (161 | 10.0%), Installation, Maintenance & Repair (73 | 4.5%), and Farming, Fishing & Forestry (51 | 3.2%).
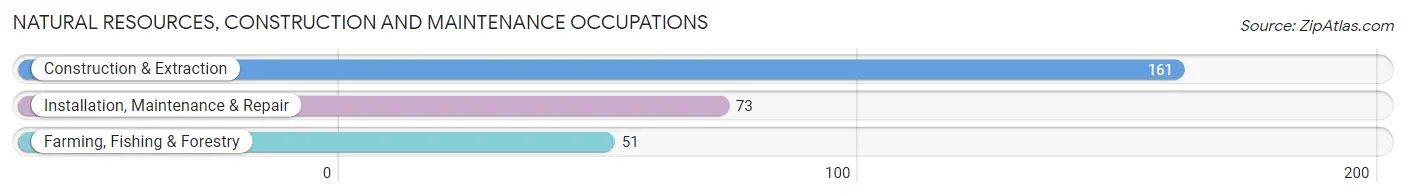
Natural Resources, Construction and Maintenance Occupations by Sex
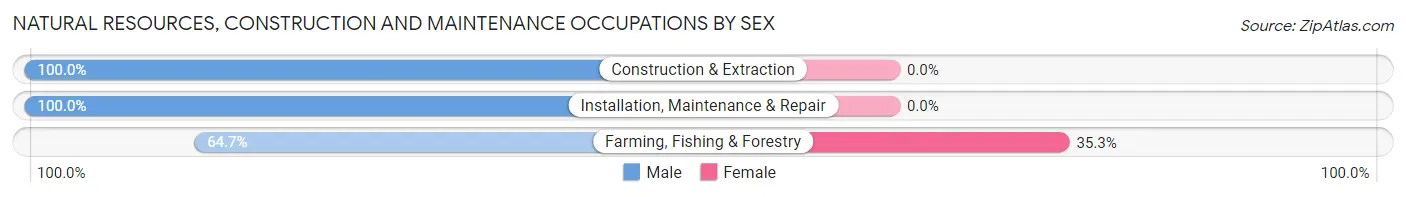
| Occupation | Male | Female |
| Farming, Fishing & Forestry | 33 (64.7%) | 18 (35.3%) |
| Construction & Extraction | 161 (100.0%) | 0 (0.0%) |
| Installation, Maintenance & Repair | 73 (100.0%) | 0 (0.0%) |
| Total (Category) | 267 (93.7%) | 18 (6.3%) |
| Total (Overall) | 807 (50.3%) | 797 (49.7%) |
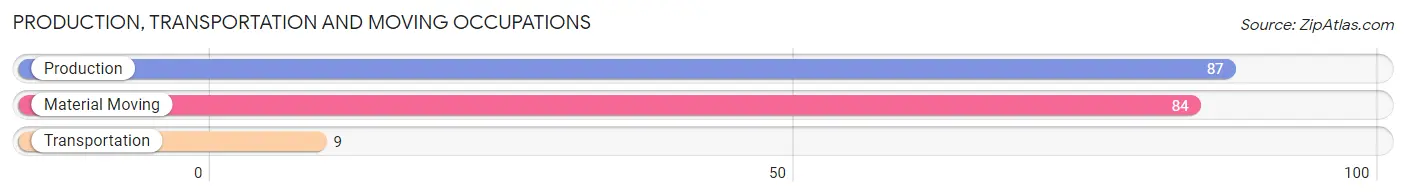
Production, Transportation and Moving Occupations
The most common Production, Transportation and Moving occupations in Lamar are Production (87 | 5.4%), Material Moving (84 | 5.2%), and Transportation (9 | 0.6%).
Production, Transportation and Moving Occupations by Sex
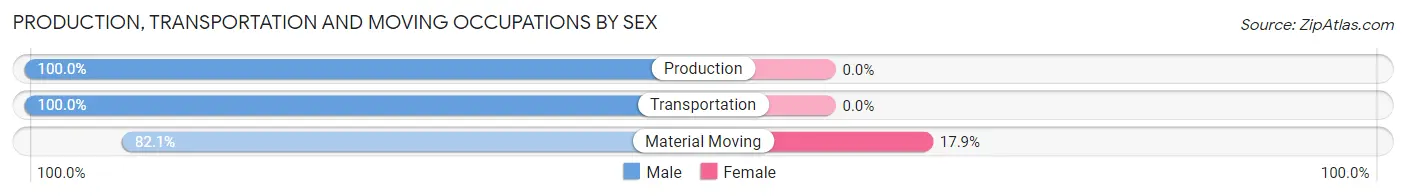
| Occupation | Male | Female |
| Production | 87 (100.0%) | 0 (0.0%) |
| Transportation | 9 (100.0%) | 0 (0.0%) |
| Material Moving | 69 (82.1%) | 15 (17.9%) |
| Total (Category) | 165 (91.7%) | 15 (8.3%) |
| Total (Overall) | 807 (50.3%) | 797 (49.7%) |
Employment Industries by Sex in Lamar
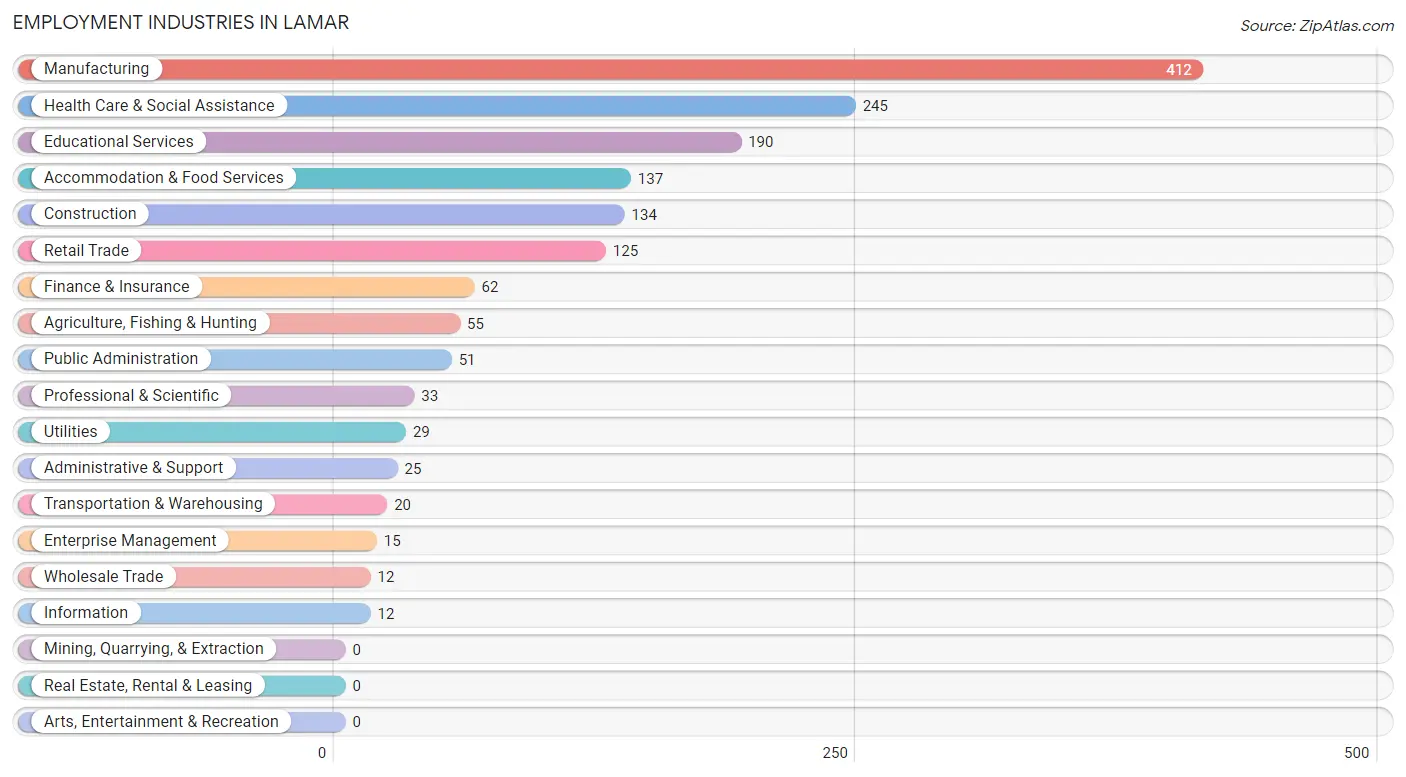
Employment Industries in Lamar
The major employment industries in Lamar include Manufacturing (412 | 25.7%), Health Care & Social Assistance (245 | 15.3%), Educational Services (190 | 11.8%), Accommodation & Food Services (137 | 8.5%), and Construction (134 | 8.4%).
Employment Industries by Sex in Lamar
The Lamar industries that see more men than women are Wholesale Trade (100.0%), Utilities (100.0%), and Professional & Scientific (100.0%), whereas the industries that tend to have a higher number of women are Information (100.0%), Enterprise Management (100.0%), and Health Care & Social Assistance (90.6%).
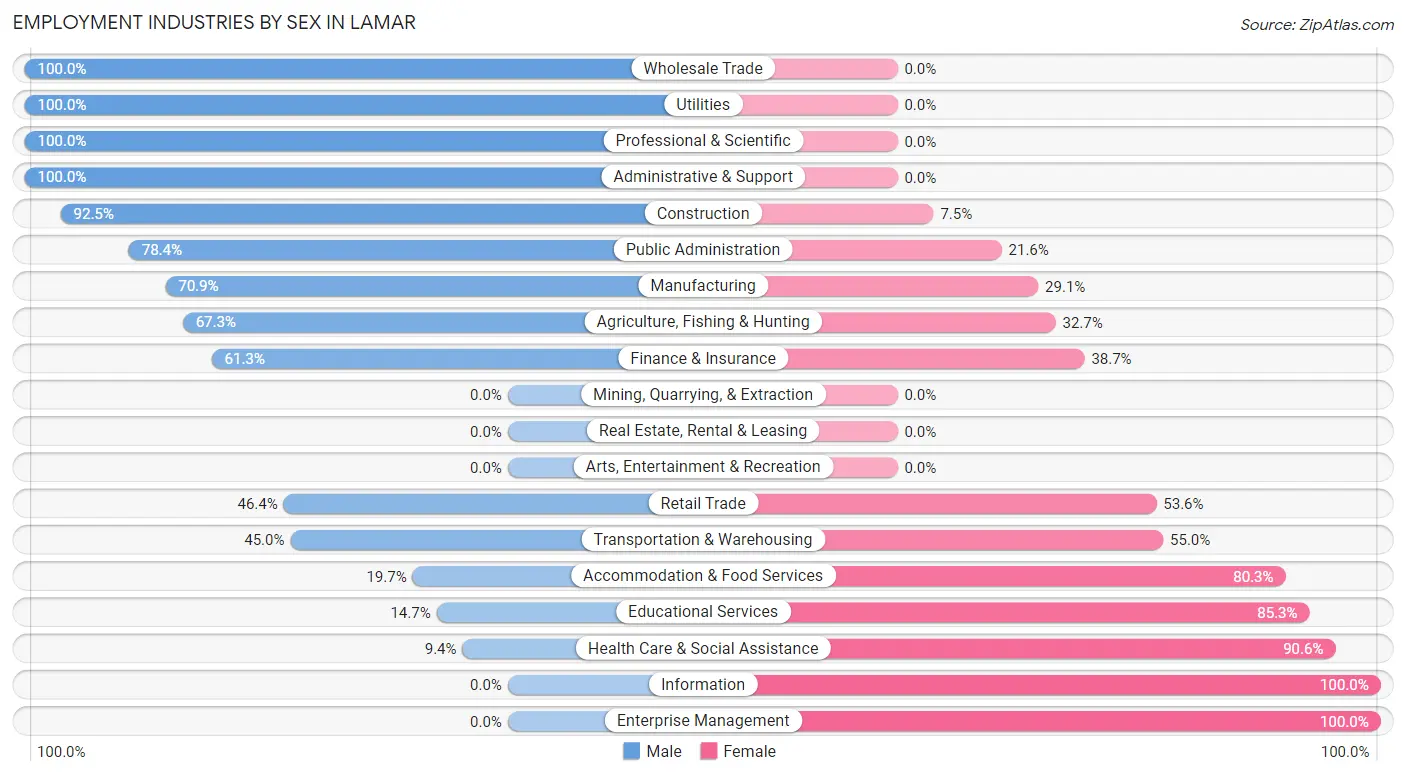
| Industry | Male | Female |
| Agriculture, Fishing & Hunting | 37 (67.3%) | 18 (32.7%) |
| Mining, Quarrying, & Extraction | 0 (0.0%) | 0 (0.0%) |
| Construction | 124 (92.5%) | 10 (7.5%) |
| Manufacturing | 292 (70.9%) | 120 (29.1%) |
| Wholesale Trade | 12 (100.0%) | 0 (0.0%) |
| Retail Trade | 58 (46.4%) | 67 (53.6%) |
| Transportation & Warehousing | 9 (45.0%) | 11 (55.0%) |
| Utilities | 29 (100.0%) | 0 (0.0%) |
| Information | 0 (0.0%) | 12 (100.0%) |
| Finance & Insurance | 38 (61.3%) | 24 (38.7%) |
| Real Estate, Rental & Leasing | 0 (0.0%) | 0 (0.0%) |
| Professional & Scientific | 33 (100.0%) | 0 (0.0%) |
| Enterprise Management | 0 (0.0%) | 15 (100.0%) |
| Administrative & Support | 25 (100.0%) | 0 (0.0%) |
| Educational Services | 28 (14.7%) | 162 (85.3%) |
| Health Care & Social Assistance | 23 (9.4%) | 222 (90.6%) |
| Arts, Entertainment & Recreation | 0 (0.0%) | 0 (0.0%) |
| Accommodation & Food Services | 27 (19.7%) | 110 (80.3%) |
| Public Administration | 40 (78.4%) | 11 (21.6%) |
| Total | 807 (50.3%) | 797 (49.7%) |
Education in Lamar
School Enrollment in Lamar
The most common levels of schooling among the 908 students in Lamar are high school (272 | 30.0%), middle school (264 | 29.1%), and college / undergraduate (122 | 13.4%).
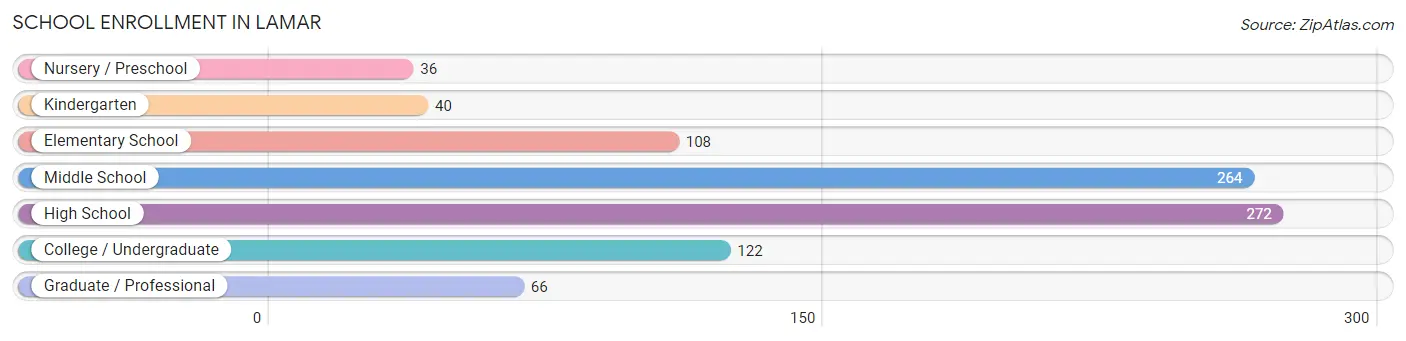
| School Level | # Students | % Students |
| Nursery / Preschool | 36 | 4.0% |
| Kindergarten | 40 | 4.4% |
| Elementary School | 108 | 11.9% |
| Middle School | 264 | 29.1% |
| High School | 272 | 30.0% |
| College / Undergraduate | 122 | 13.4% |
| Graduate / Professional | 66 | 7.3% |
| Total | 908 | 100.0% |
School Enrollment by Age by Funding Source in Lamar
Out of a total of 908 students who are enrolled in schools in Lamar, 83 (9.1%) attend a private institution, while the remaining 825 (90.9%) are enrolled in public schools. The age group of 15 to 17 year olds has the highest likelihood of being enrolled in private schools, with 28 (14.7% in the age bracket) enrolled. Conversely, the age group of 5 to 9 year old has the lowest likelihood of being enrolled in a private school, with 157 (100.0% in the age bracket) attending a public institution.
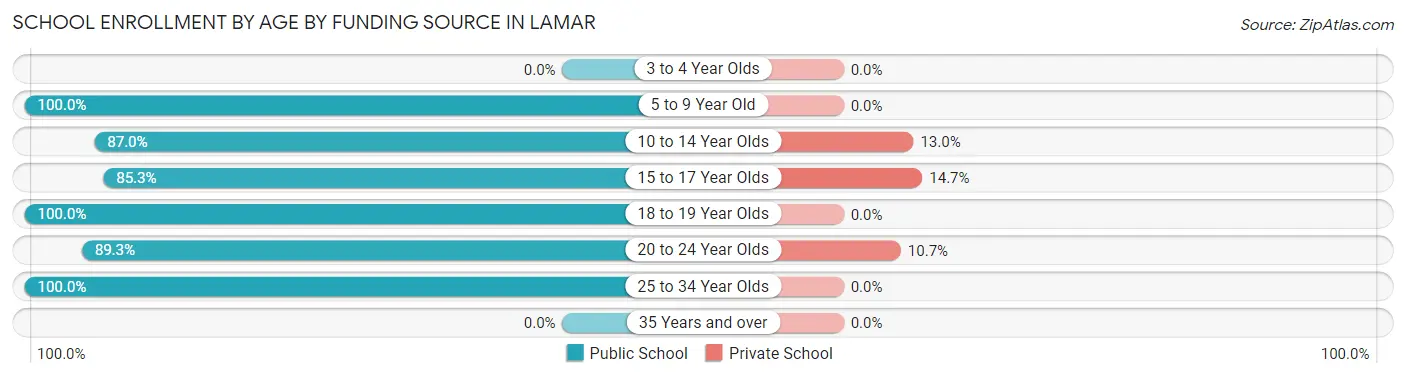
| Age Bracket | Public School | Private School |
| 3 to 4 Year Olds | 0 (0.0%) | 0 (0.0%) |
| 5 to 9 Year Old | 157 (100.0%) | 0 (0.0%) |
| 10 to 14 Year Olds | 281 (87.0%) | 42 (13.0%) |
| 15 to 17 Year Olds | 163 (85.3%) | 28 (14.7%) |
| 18 to 19 Year Olds | 49 (100.0%) | 0 (0.0%) |
| 20 to 24 Year Olds | 109 (89.3%) | 13 (10.7%) |
| 25 to 34 Year Olds | 66 (100.0%) | 0 (0.0%) |
| 35 Years and over | 0 (0.0%) | 0 (0.0%) |
| Total | 825 (90.9%) | 83 (9.1%) |
Educational Attainment by Field of Study in Lamar
Education (135 | 28.4%), engineering (86 | 18.1%), literature & languages (66 | 13.9%), computers & mathematics (51 | 10.7%), and arts & humanities (42 | 8.8%) are the most common fields of study among 476 individuals in Lamar who have obtained a bachelor's degree or higher.
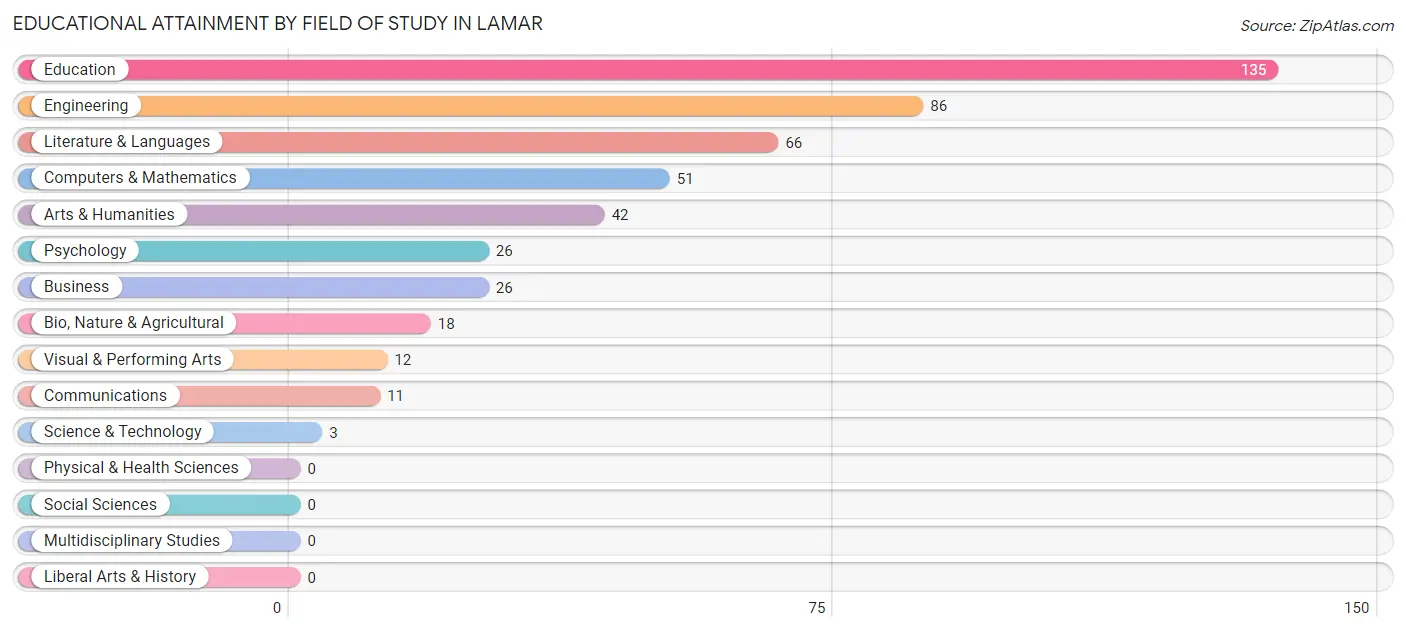
| Field of Study | # Graduates | % Graduates |
| Computers & Mathematics | 51 | 10.7% |
| Bio, Nature & Agricultural | 18 | 3.8% |
| Physical & Health Sciences | 0 | 0.0% |
| Psychology | 26 | 5.5% |
| Social Sciences | 0 | 0.0% |
| Engineering | 86 | 18.1% |
| Multidisciplinary Studies | 0 | 0.0% |
| Science & Technology | 3 | 0.6% |
| Business | 26 | 5.5% |
| Education | 135 | 28.4% |
| Literature & Languages | 66 | 13.9% |
| Liberal Arts & History | 0 | 0.0% |
| Visual & Performing Arts | 12 | 2.5% |
| Communications | 11 | 2.3% |
| Arts & Humanities | 42 | 8.8% |
| Total | 476 | 100.0% |
Transportation & Commute in Lamar
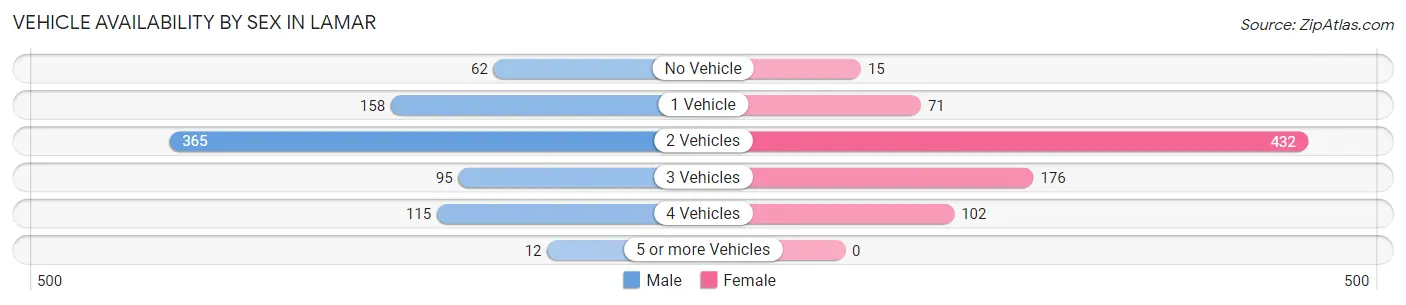
Vehicle Availability by Sex in Lamar
The most prevalent vehicle ownership categories in Lamar are males with 2 vehicles (365, accounting for 45.2%) and females with 2 vehicles (432, making up 45.9%).
| Vehicles Available | Male | Female |
| No Vehicle | 62 (7.7%) | 15 (1.9%) |
| 1 Vehicle | 158 (19.6%) | 71 (8.9%) |
| 2 Vehicles | 365 (45.2%) | 432 (54.3%) |
| 3 Vehicles | 95 (11.8%) | 176 (22.1%) |
| 4 Vehicles | 115 (14.2%) | 102 (12.8%) |
| 5 or more Vehicles | 12 (1.5%) | 0 (0.0%) |
| Total | 807 (100.0%) | 796 (100.0%) |
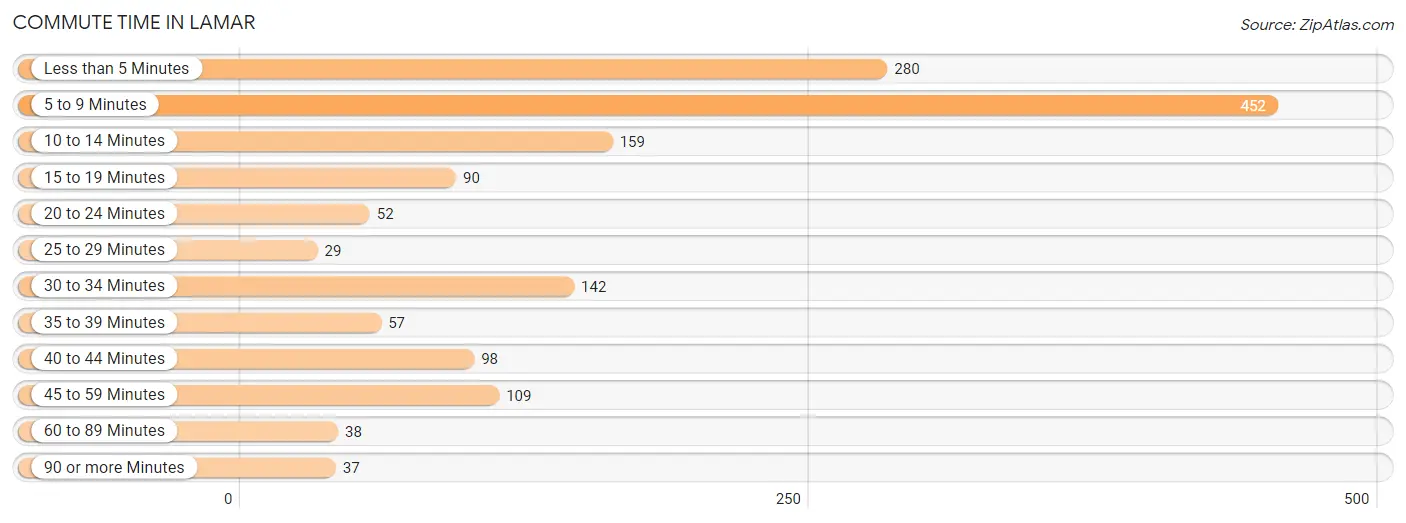
Commute Time in Lamar
The most frequently occuring commute durations in Lamar are 5 to 9 minutes (452 commuters, 29.3%), less than 5 minutes (280 commuters, 18.1%), and 10 to 14 minutes (159 commuters, 10.3%).
| Commute Time | # Commuters | % Commuters |
| Less than 5 Minutes | 280 | 18.1% |
| 5 to 9 Minutes | 452 | 29.3% |
| 10 to 14 Minutes | 159 | 10.3% |
| 15 to 19 Minutes | 90 | 5.8% |
| 20 to 24 Minutes | 52 | 3.4% |
| 25 to 29 Minutes | 29 | 1.9% |
| 30 to 34 Minutes | 142 | 9.2% |
| 35 to 39 Minutes | 57 | 3.7% |
| 40 to 44 Minutes | 98 | 6.4% |
| 45 to 59 Minutes | 109 | 7.1% |
| 60 to 89 Minutes | 38 | 2.5% |
| 90 or more Minutes | 37 | 2.4% |
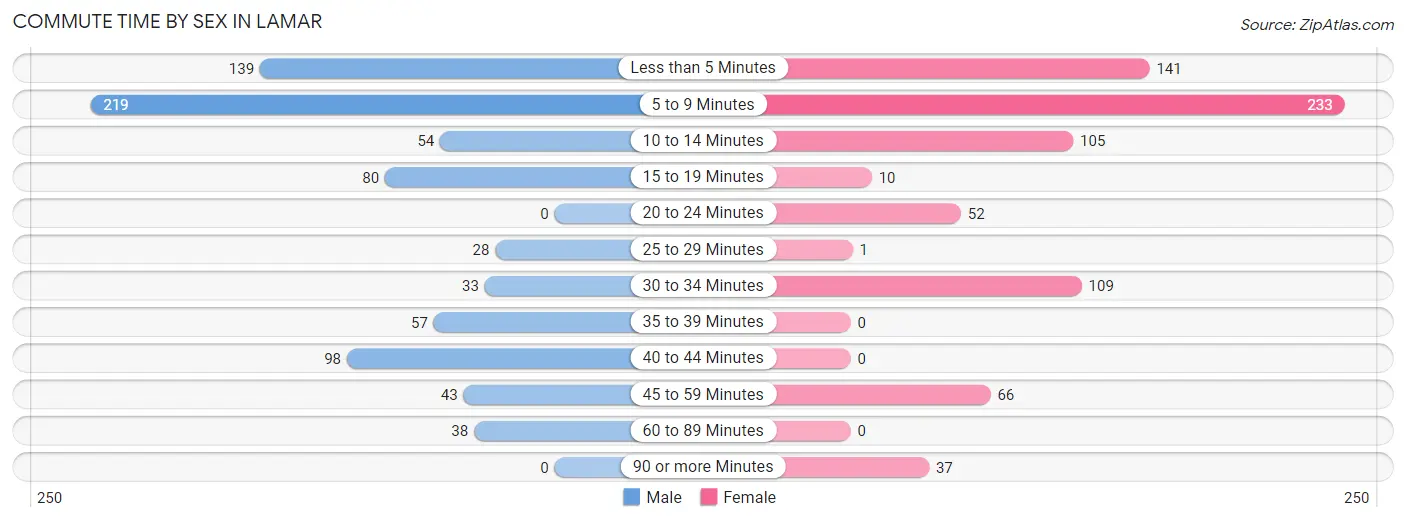
Commute Time by Sex in Lamar
The most common commute times in Lamar are 5 to 9 minutes (219 commuters, 27.8%) for males and 5 to 9 minutes (233 commuters, 30.9%) for females.
| Commute Time | Male | Female |
| Less than 5 Minutes | 139 (17.6%) | 141 (18.7%) |
| 5 to 9 Minutes | 219 (27.8%) | 233 (30.9%) |
| 10 to 14 Minutes | 54 (6.8%) | 105 (13.9%) |
| 15 to 19 Minutes | 80 (10.1%) | 10 (1.3%) |
| 20 to 24 Minutes | 0 (0.0%) | 52 (6.9%) |
| 25 to 29 Minutes | 28 (3.5%) | 1 (0.1%) |
| 30 to 34 Minutes | 33 (4.2%) | 109 (14.5%) |
| 35 to 39 Minutes | 57 (7.2%) | 0 (0.0%) |
| 40 to 44 Minutes | 98 (12.4%) | 0 (0.0%) |
| 45 to 59 Minutes | 43 (5.4%) | 66 (8.7%) |
| 60 to 89 Minutes | 38 (4.8%) | 0 (0.0%) |
| 90 or more Minutes | 0 (0.0%) | 37 (4.9%) |
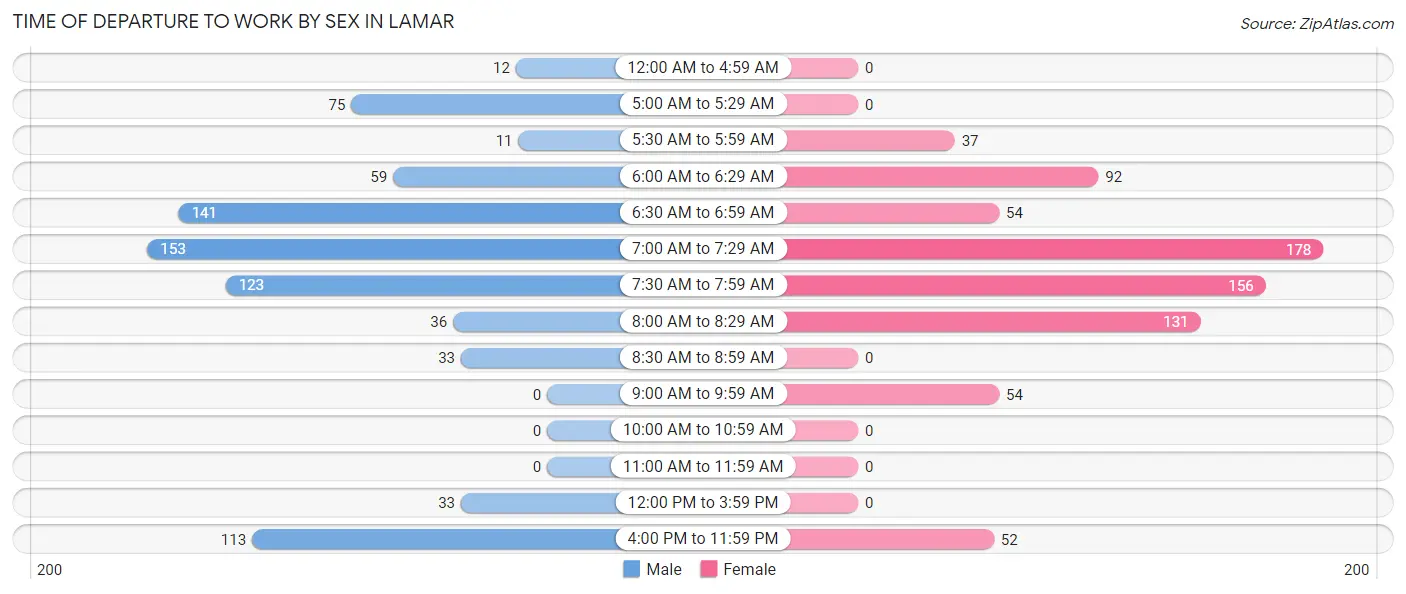
Time of Departure to Work by Sex in Lamar
The most frequent times of departure to work in Lamar are 7:00 AM to 7:29 AM (153, 19.4%) for males and 7:00 AM to 7:29 AM (178, 23.6%) for females.
| Time of Departure | Male | Female |
| 12:00 AM to 4:59 AM | 12 (1.5%) | 0 (0.0%) |
| 5:00 AM to 5:29 AM | 75 (9.5%) | 0 (0.0%) |
| 5:30 AM to 5:59 AM | 11 (1.4%) | 37 (4.9%) |
| 6:00 AM to 6:29 AM | 59 (7.5%) | 92 (12.2%) |
| 6:30 AM to 6:59 AM | 141 (17.9%) | 54 (7.2%) |
| 7:00 AM to 7:29 AM | 153 (19.4%) | 178 (23.6%) |
| 7:30 AM to 7:59 AM | 123 (15.6%) | 156 (20.7%) |
| 8:00 AM to 8:29 AM | 36 (4.6%) | 131 (17.4%) |
| 8:30 AM to 8:59 AM | 33 (4.2%) | 0 (0.0%) |
| 9:00 AM to 9:59 AM | 0 (0.0%) | 54 (7.2%) |
| 10:00 AM to 10:59 AM | 0 (0.0%) | 0 (0.0%) |
| 11:00 AM to 11:59 AM | 0 (0.0%) | 0 (0.0%) |
| 12:00 PM to 3:59 PM | 33 (4.2%) | 0 (0.0%) |
| 4:00 PM to 11:59 PM | 113 (14.3%) | 52 (6.9%) |
| Total | 789 (100.0%) | 754 (100.0%) |
Housing Occupancy in Lamar
Occupancy by Ownership in Lamar
Of the total 1,676 dwellings in Lamar, owner-occupied units account for 840 (50.1%), while renter-occupied units make up 836 (49.9%).
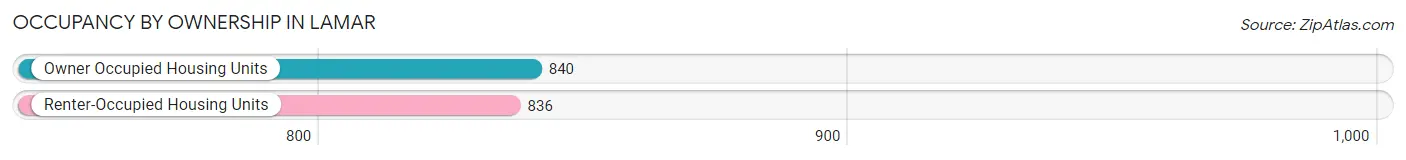
| Occupancy | # Housing Units | % Housing Units |
| Owner Occupied Housing Units | 840 | 50.1% |
| Renter-Occupied Housing Units | 836 | 49.9% |
| Total Occupied Housing Units | 1,676 | 100.0% |
Occupancy by Household Size in Lamar
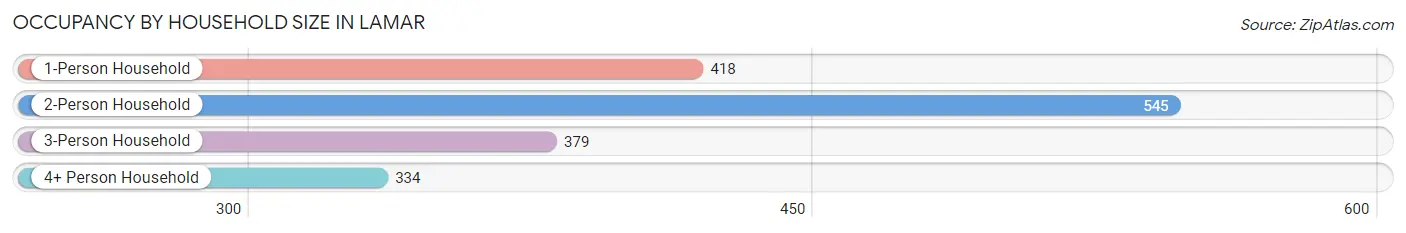
| Household Size | # Housing Units | % Housing Units |
| 1-Person Household | 418 | 24.9% |
| 2-Person Household | 545 | 32.5% |
| 3-Person Household | 379 | 22.6% |
| 4+ Person Household | 334 | 19.9% |
| Total Housing Units | 1,676 | 100.0% |
Occupancy by Ownership by Household Size in Lamar
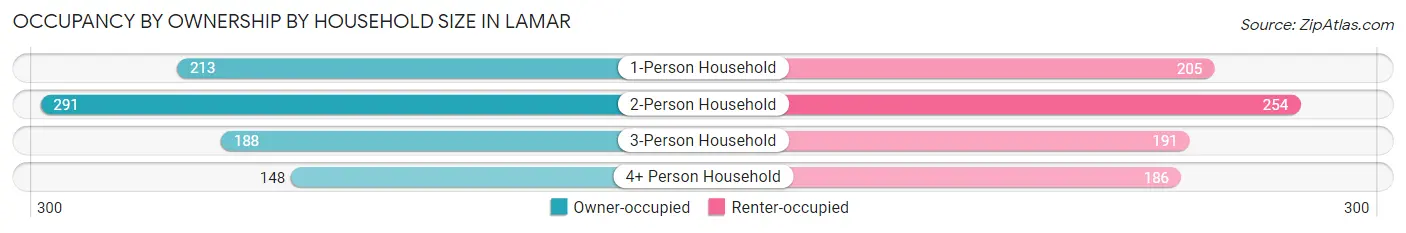
| Household Size | Owner-occupied | Renter-occupied |
| 1-Person Household | 213 (51.0%) | 205 (49.0%) |
| 2-Person Household | 291 (53.4%) | 254 (46.6%) |
| 3-Person Household | 188 (49.6%) | 191 (50.4%) |
| 4+ Person Household | 148 (44.3%) | 186 (55.7%) |
| Total Housing Units | 840 (50.1%) | 836 (49.9%) |
Occupancy by Educational Attainment in Lamar
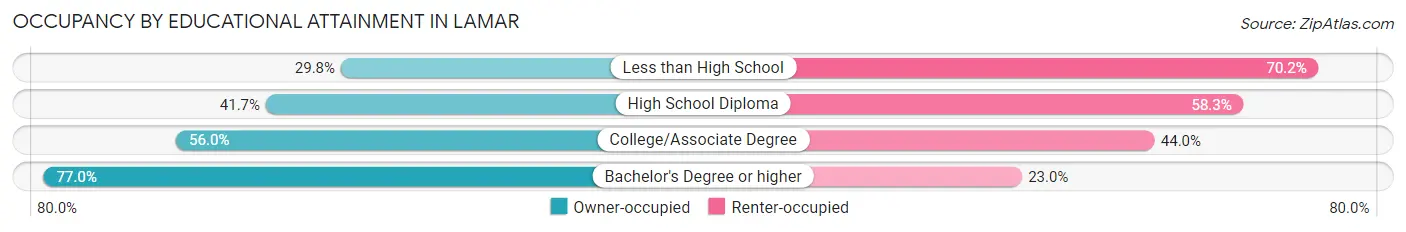
| Household Size | Owner-occupied | Renter-occupied |
| Less than High School | 57 (29.8%) | 134 (70.2%) |
| High School Diploma | 318 (41.7%) | 444 (58.3%) |
| College/Associate Degree | 244 (56.0%) | 192 (44.0%) |
| Bachelor's Degree or higher | 221 (77.0%) | 66 (23.0%) |
Occupancy by Age of Householder in Lamar
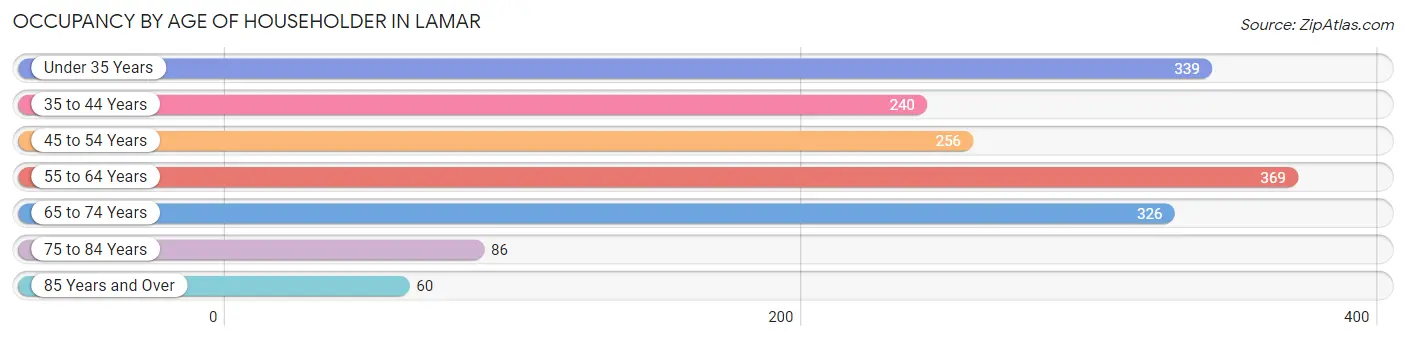
| Age Bracket | # Households | % Households |
| Under 35 Years | 339 | 20.2% |
| 35 to 44 Years | 240 | 14.3% |
| 45 to 54 Years | 256 | 15.3% |
| 55 to 64 Years | 369 | 22.0% |
| 65 to 74 Years | 326 | 19.5% |
| 75 to 84 Years | 86 | 5.1% |
| 85 Years and Over | 60 | 3.6% |
| Total | 1,676 | 100.0% |
Housing Finances in Lamar
Median Income by Occupancy in Lamar
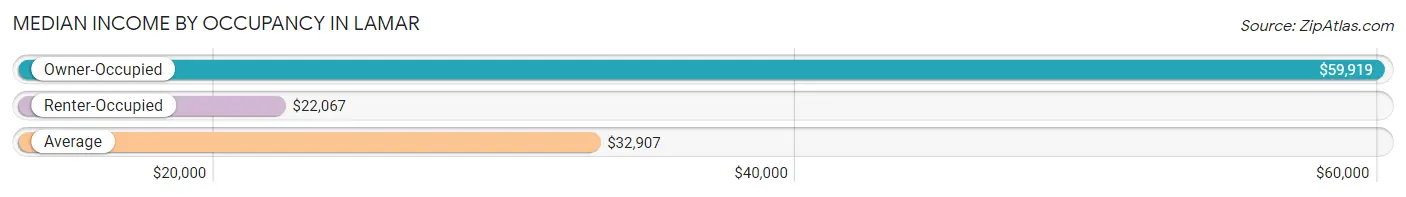
| Occupancy Type | # Households | Median Income |
| Owner-Occupied | 840 (50.1%) | $59,919 |
| Renter-Occupied | 836 (49.9%) | $22,067 |
| Average | 1,676 (100.0%) | $32,907 |
Occupancy by Householder Income Bracket in Lamar
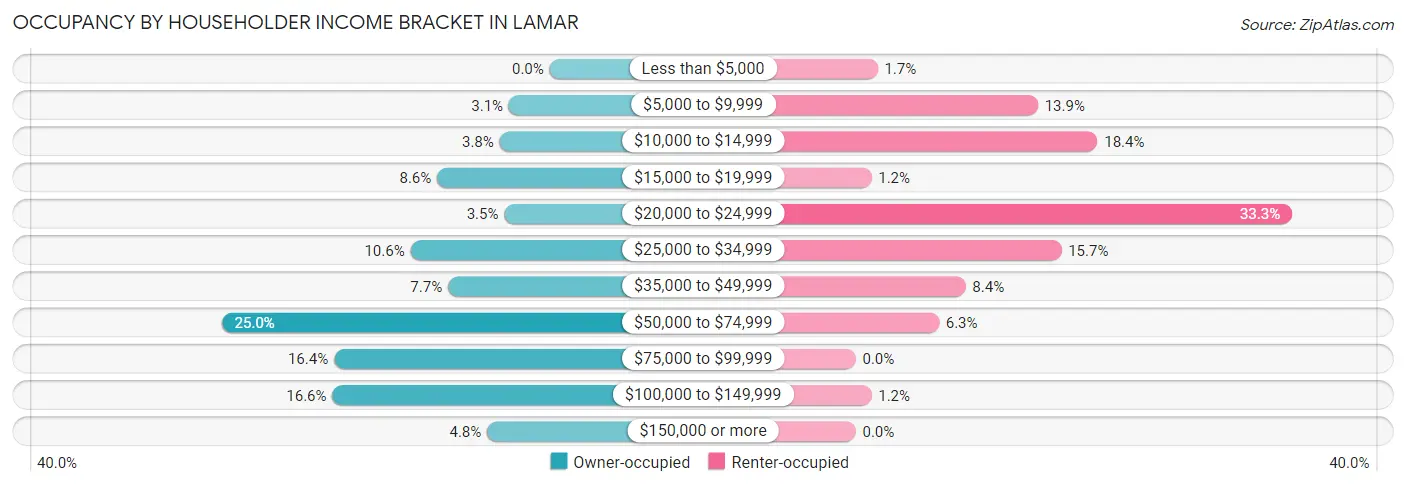
| Income Bracket | Owner-occupied | Renter-occupied |
| Less than $5,000 | 0 (0.0%) | 14 (1.7%) |
| $5,000 to $9,999 | 26 (3.1%) | 116 (13.9%) |
| $10,000 to $14,999 | 32 (3.8%) | 154 (18.4%) |
| $15,000 to $19,999 | 72 (8.6%) | 10 (1.2%) |
| $20,000 to $24,999 | 29 (3.5%) | 278 (33.3%) |
| $25,000 to $34,999 | 89 (10.6%) | 131 (15.7%) |
| $35,000 to $49,999 | 65 (7.7%) | 70 (8.4%) |
| $50,000 to $74,999 | 210 (25.0%) | 53 (6.3%) |
| $75,000 to $99,999 | 138 (16.4%) | 0 (0.0%) |
| $100,000 to $149,999 | 139 (16.6%) | 10 (1.2%) |
| $150,000 or more | 40 (4.8%) | 0 (0.0%) |
| Total | 840 (100.0%) | 836 (100.0%) |
Monthly Housing Cost Tiers in Lamar
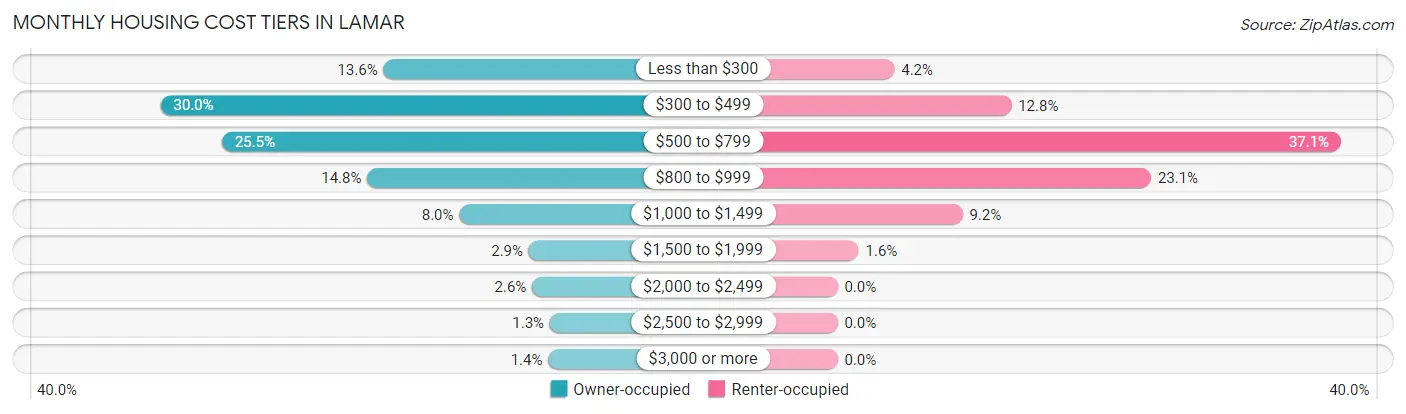
| Monthly Cost | Owner-occupied | Renter-occupied |
| Less than $300 | 114 (13.6%) | 35 (4.2%) |
| $300 to $499 | 252 (30.0%) | 107 (12.8%) |
| $500 to $799 | 214 (25.5%) | 310 (37.1%) |
| $800 to $999 | 124 (14.8%) | 193 (23.1%) |
| $1,000 to $1,499 | 67 (8.0%) | 77 (9.2%) |
| $1,500 to $1,999 | 24 (2.9%) | 13 (1.6%) |
| $2,000 to $2,499 | 22 (2.6%) | 0 (0.0%) |
| $2,500 to $2,999 | 11 (1.3%) | 0 (0.0%) |
| $3,000 or more | 12 (1.4%) | 0 (0.0%) |
| Total | 840 (100.0%) | 836 (100.0%) |
Physical Housing Characteristics in Lamar
Housing Structures in Lamar
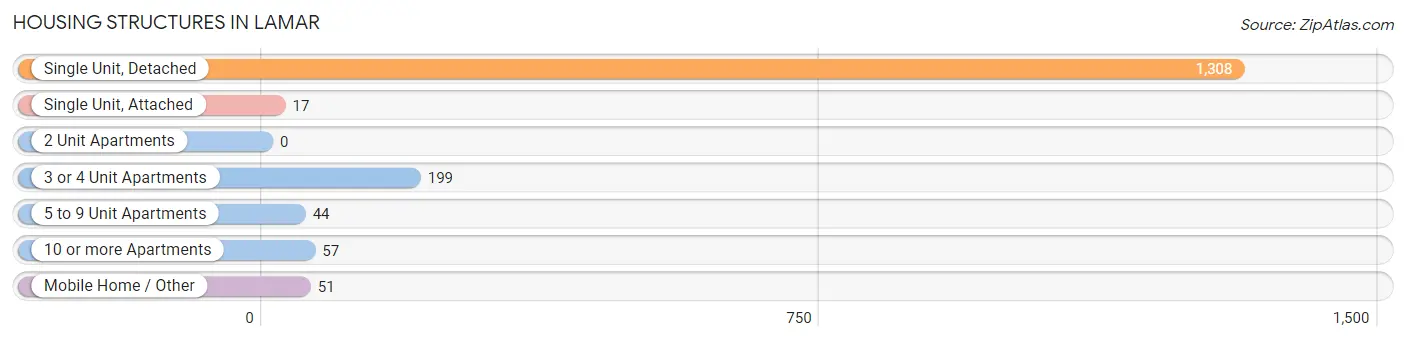
| Structure Type | # Housing Units | % Housing Units |
| Single Unit, Detached | 1,308 | 78.0% |
| Single Unit, Attached | 17 | 1.0% |
| 2 Unit Apartments | 0 | 0.0% |
| 3 or 4 Unit Apartments | 199 | 11.9% |
| 5 to 9 Unit Apartments | 44 | 2.6% |
| 10 or more Apartments | 57 | 3.4% |
| Mobile Home / Other | 51 | 3.0% |
| Total | 1,676 | 100.0% |
Housing Structures by Occupancy in Lamar
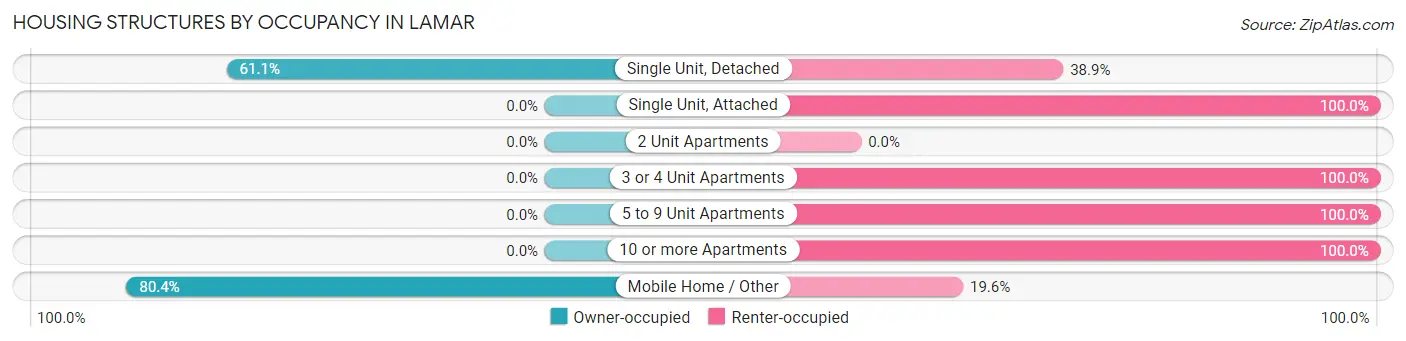
| Structure Type | Owner-occupied | Renter-occupied |
| Single Unit, Detached | 799 (61.1%) | 509 (38.9%) |
| Single Unit, Attached | 0 (0.0%) | 17 (100.0%) |
| 2 Unit Apartments | 0 (0.0%) | 0 (0.0%) |
| 3 or 4 Unit Apartments | 0 (0.0%) | 199 (100.0%) |
| 5 to 9 Unit Apartments | 0 (0.0%) | 44 (100.0%) |
| 10 or more Apartments | 0 (0.0%) | 57 (100.0%) |
| Mobile Home / Other | 41 (80.4%) | 10 (19.6%) |
| Total | 840 (50.1%) | 836 (49.9%) |
Housing Structures by Number of Rooms in Lamar
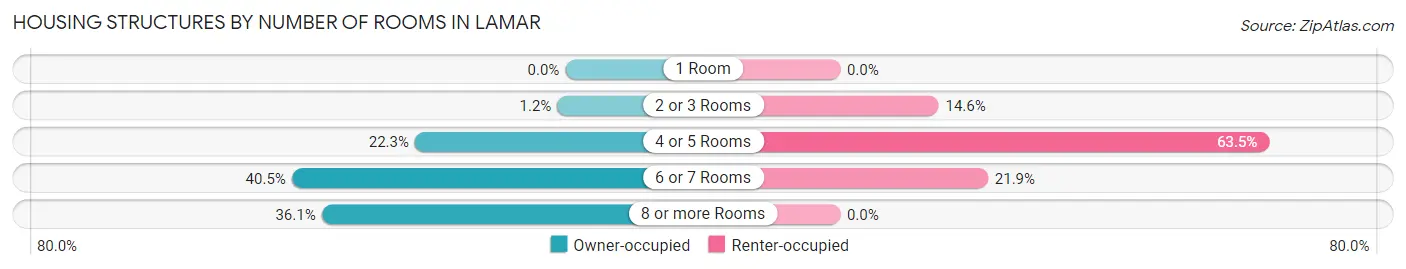
| Number of Rooms | Owner-occupied | Renter-occupied |
| 1 Room | 0 (0.0%) | 0 (0.0%) |
| 2 or 3 Rooms | 10 (1.2%) | 122 (14.6%) |
| 4 or 5 Rooms | 187 (22.3%) | 531 (63.5%) |
| 6 or 7 Rooms | 340 (40.5%) | 183 (21.9%) |
| 8 or more Rooms | 303 (36.1%) | 0 (0.0%) |
| Total | 840 (100.0%) | 836 (100.0%) |
Housing Structure by Heating Type in Lamar
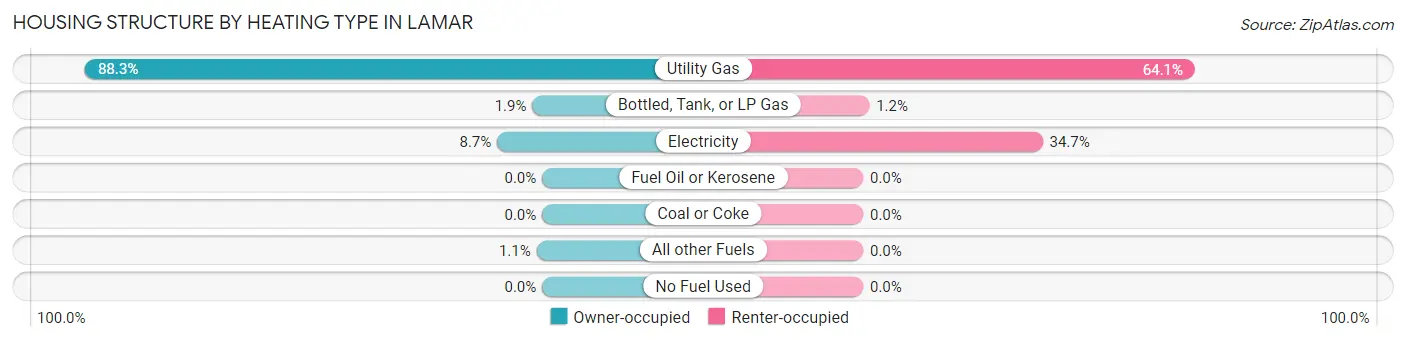
| Heating Type | Owner-occupied | Renter-occupied |
| Utility Gas | 742 (88.3%) | 536 (64.1%) |
| Bottled, Tank, or LP Gas | 16 (1.9%) | 10 (1.2%) |
| Electricity | 73 (8.7%) | 290 (34.7%) |
| Fuel Oil or Kerosene | 0 (0.0%) | 0 (0.0%) |
| Coal or Coke | 0 (0.0%) | 0 (0.0%) |
| All other Fuels | 9 (1.1%) | 0 (0.0%) |
| No Fuel Used | 0 (0.0%) | 0 (0.0%) |
| Total | 840 (100.0%) | 836 (100.0%) |
Household Vehicle Usage in Lamar
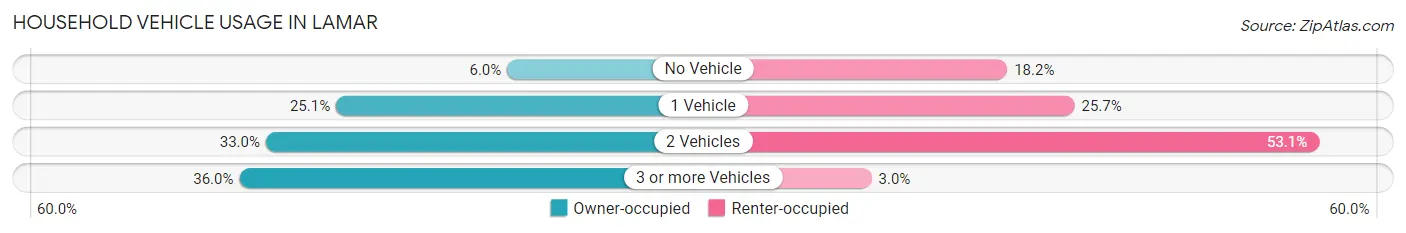
| Vehicles per Household | Owner-occupied | Renter-occupied |
| No Vehicle | 50 (5.9%) | 152 (18.2%) |
| 1 Vehicle | 211 (25.1%) | 215 (25.7%) |
| 2 Vehicles | 277 (33.0%) | 444 (53.1%) |
| 3 or more Vehicles | 302 (35.9%) | 25 (3.0%) |
| Total | 840 (100.0%) | 836 (100.0%) |
Real Estate & Mortgages in Lamar
Real Estate and Mortgage Overview in Lamar
| Characteristic | Without Mortgage | With Mortgage |
| Housing Units | 475 | 365 |
| Median Property Value | $108,300 | $97,800 |
| Median Household Income | $51,932 | $22 |
| Monthly Housing Costs | $431 | $12 |
| Real Estate Taxes | $823 | $0 |
Property Value by Mortgage Status in Lamar
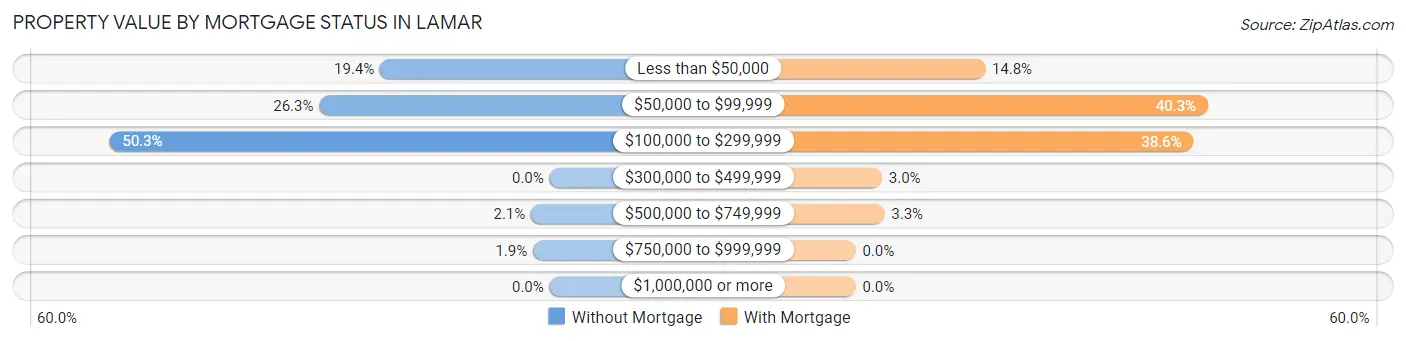
| Property Value | Without Mortgage | With Mortgage |
| Less than $50,000 | 92 (19.4%) | 54 (14.8%) |
| $50,000 to $99,999 | 125 (26.3%) | 147 (40.3%) |
| $100,000 to $299,999 | 239 (50.3%) | 141 (38.6%) |
| $300,000 to $499,999 | 0 (0.0%) | 11 (3.0%) |
| $500,000 to $749,999 | 10 (2.1%) | 12 (3.3%) |
| $750,000 to $999,999 | 9 (1.9%) | 0 (0.0%) |
| $1,000,000 or more | 0 (0.0%) | 0 (0.0%) |
| Total | 475 (100.0%) | 365 (100.0%) |
Household Income by Mortgage Status in Lamar
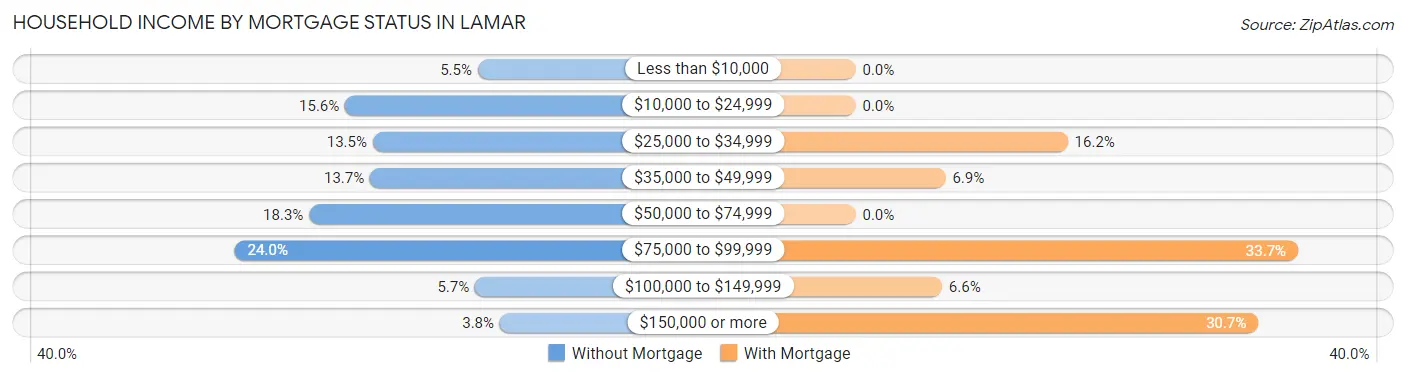
| Household Income | Without Mortgage | With Mortgage |
| Less than $10,000 | 26 (5.5%) | 0 (0.0%) |
| $10,000 to $24,999 | 74 (15.6%) | 0 (0.0%) |
| $25,000 to $34,999 | 64 (13.5%) | 59 (16.2%) |
| $35,000 to $49,999 | 65 (13.7%) | 25 (6.9%) |
| $50,000 to $74,999 | 87 (18.3%) | 0 (0.0%) |
| $75,000 to $99,999 | 114 (24.0%) | 123 (33.7%) |
| $100,000 to $149,999 | 27 (5.7%) | 24 (6.6%) |
| $150,000 or more | 18 (3.8%) | 112 (30.7%) |
| Total | 475 (100.0%) | 365 (100.0%) |
Property Value to Household Income Ratio in Lamar
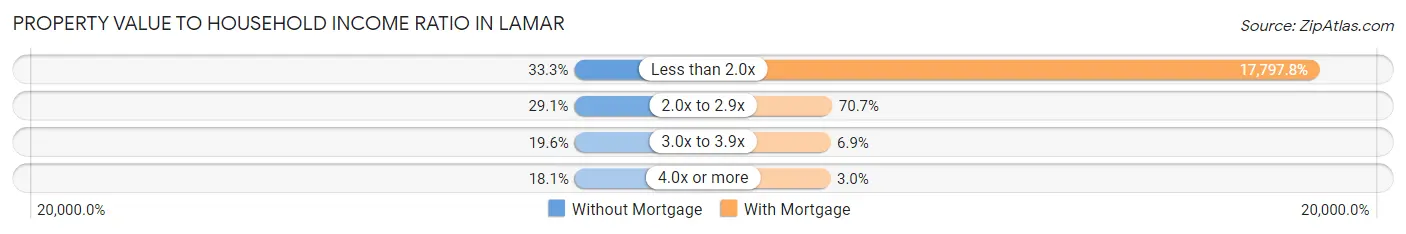
| Value-to-Income Ratio | Without Mortgage | With Mortgage |
| Less than 2.0x | 158 (33.3%) | 64,962 (17,797.8%) |
| 2.0x to 2.9x | 138 (29.0%) | 258 (70.7%) |
| 3.0x to 3.9x | 93 (19.6%) | 25 (6.9%) |
| 4.0x or more | 86 (18.1%) | 11 (3.0%) |
| Total | 475 (100.0%) | 365 (100.0%) |
Real Estate Taxes by Mortgage Status in Lamar
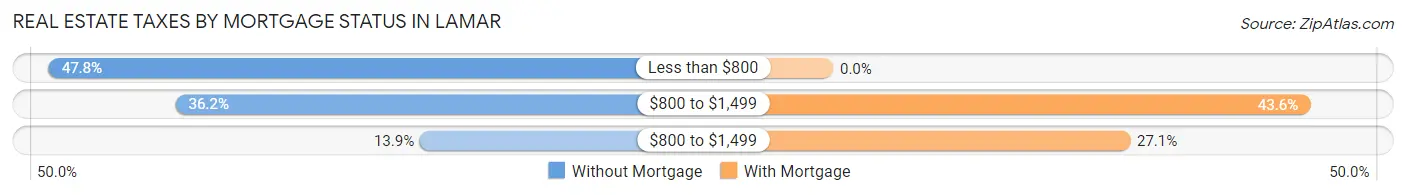
| Property Taxes | Without Mortgage | With Mortgage |
| Less than $800 | 227 (47.8%) | 0 (0.0%) |
| $800 to $1,499 | 172 (36.2%) | 159 (43.6%) |
| $800 to $1,499 | 66 (13.9%) | 99 (27.1%) |
| Total | 475 (100.0%) | 365 (100.0%) |
Health & Disability in Lamar
Health Insurance Coverage by Age in Lamar
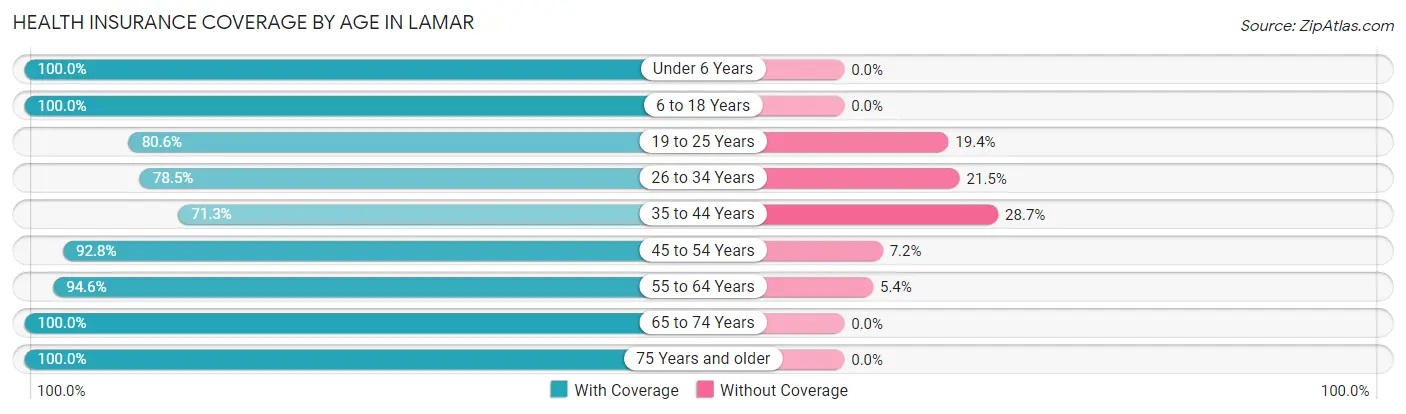
| Age Bracket | With Coverage | Without Coverage |
| Under 6 Years | 263 (100.0%) | 0 (0.0%) |
| 6 to 18 Years | 697 (100.0%) | 0 (0.0%) |
| 19 to 25 Years | 336 (80.6%) | 81 (19.4%) |
| 26 to 34 Years | 405 (78.5%) | 111 (21.5%) |
| 35 to 44 Years | 420 (71.3%) | 169 (28.7%) |
| 45 to 54 Years | 453 (92.8%) | 35 (7.2%) |
| 55 to 64 Years | 459 (94.6%) | 26 (5.4%) |
| 65 to 74 Years | 494 (100.0%) | 0 (0.0%) |
| 75 Years and older | 236 (100.0%) | 0 (0.0%) |
| Total | 3,763 (89.9%) | 422 (10.1%) |
Health Insurance Coverage by Citizenship Status in Lamar
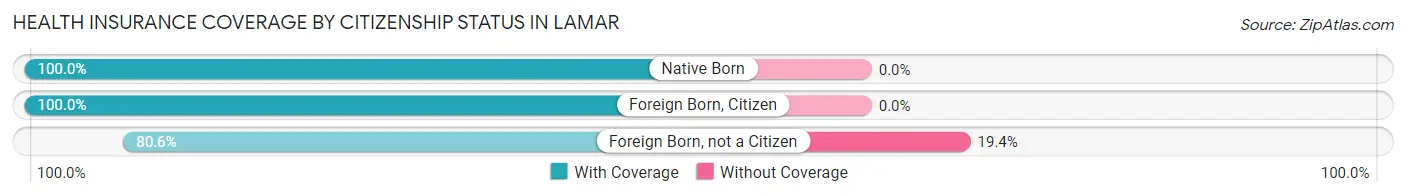
| Citizenship Status | With Coverage | Without Coverage |
| Native Born | 263 (100.0%) | 0 (0.0%) |
| Foreign Born, Citizen | 697 (100.0%) | 0 (0.0%) |
| Foreign Born, not a Citizen | 336 (80.6%) | 81 (19.4%) |
Health Insurance Coverage by Household Income in Lamar
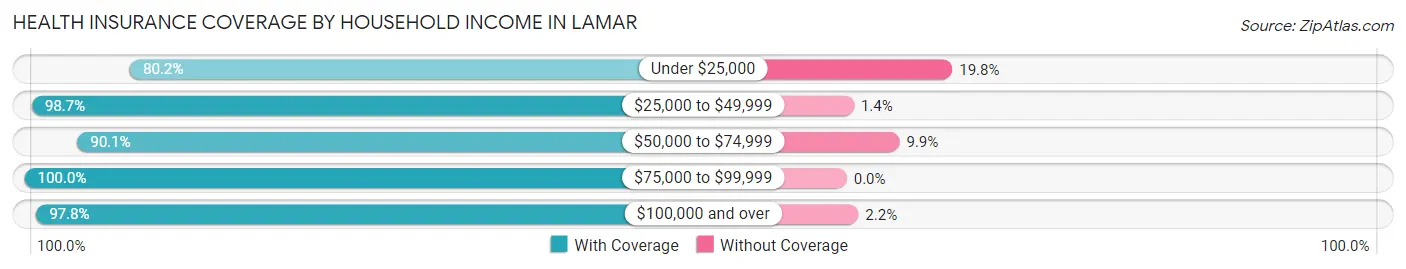
| Household Income | With Coverage | Without Coverage |
| Under $25,000 | 1,251 (80.2%) | 308 (19.8%) |
| $25,000 to $49,999 | 874 (98.7%) | 12 (1.3%) |
| $50,000 to $74,999 | 830 (90.1%) | 91 (9.9%) |
| $75,000 to $99,999 | 332 (100.0%) | 0 (0.0%) |
| $100,000 and over | 448 (97.8%) | 10 (2.2%) |
Public vs Private Health Insurance Coverage by Age in Lamar
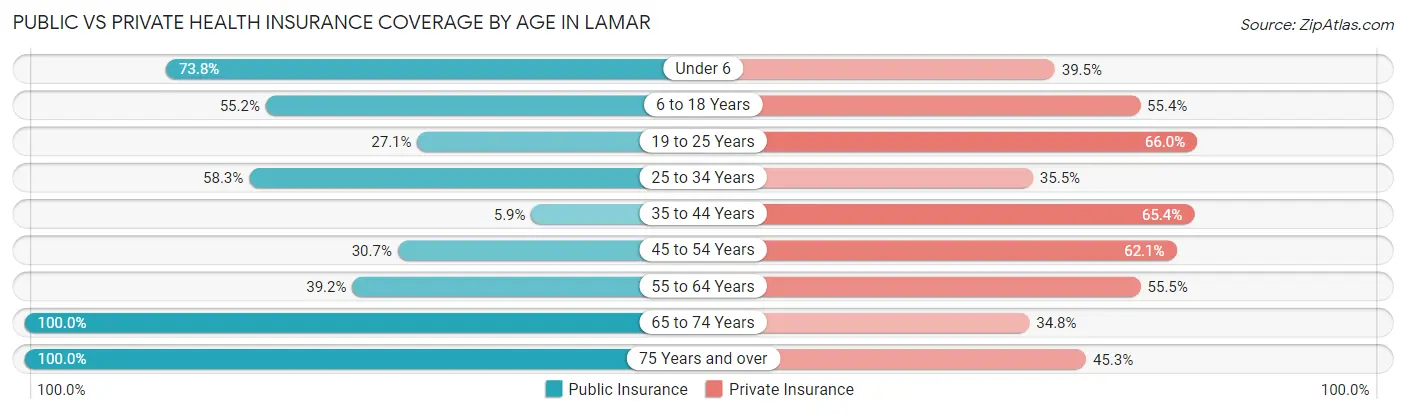
| Age Bracket | Public Insurance | Private Insurance |
| Under 6 | 194 (73.8%) | 104 (39.5%) |
| 6 to 18 Years | 385 (55.2%) | 386 (55.4%) |
| 19 to 25 Years | 113 (27.1%) | 275 (65.9%) |
| 25 to 34 Years | 301 (58.3%) | 183 (35.5%) |
| 35 to 44 Years | 35 (5.9%) | 385 (65.4%) |
| 45 to 54 Years | 150 (30.7%) | 303 (62.1%) |
| 55 to 64 Years | 190 (39.2%) | 269 (55.5%) |
| 65 to 74 Years | 494 (100.0%) | 172 (34.8%) |
| 75 Years and over | 236 (100.0%) | 107 (45.3%) |
| Total | 2,098 (50.1%) | 2,184 (52.2%) |
Disability Status by Sex by Age in Lamar
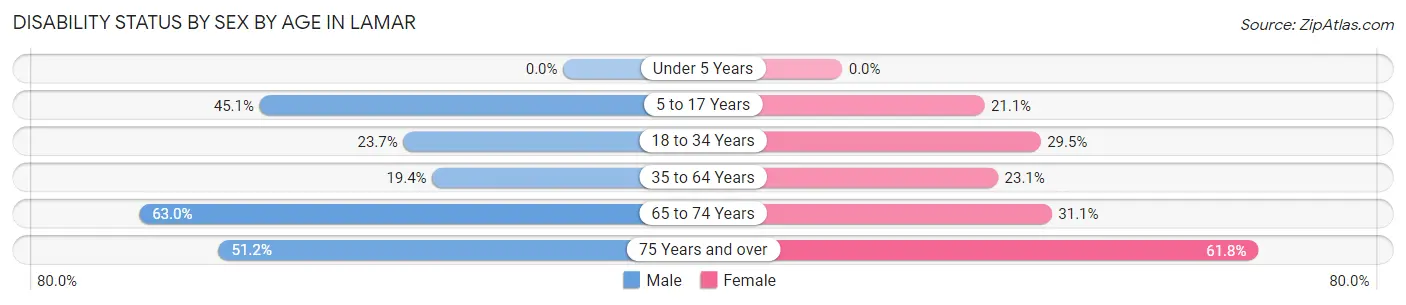
| Age Bracket | Male | Female |
| Under 5 Years | 0 (0.0%) | 0 (0.0%) |
| 5 to 17 Years | 142 (45.1%) | 76 (21.1%) |
| 18 to 34 Years | 112 (23.7%) | 157 (29.5%) |
| 35 to 64 Years | 160 (19.4%) | 171 (23.1%) |
| 65 to 74 Years | 131 (63.0%) | 89 (31.1%) |
| 75 Years and over | 43 (51.2%) | 94 (61.8%) |
Disability Class by Sex by Age in Lamar
Disability Class: Hearing Difficulty
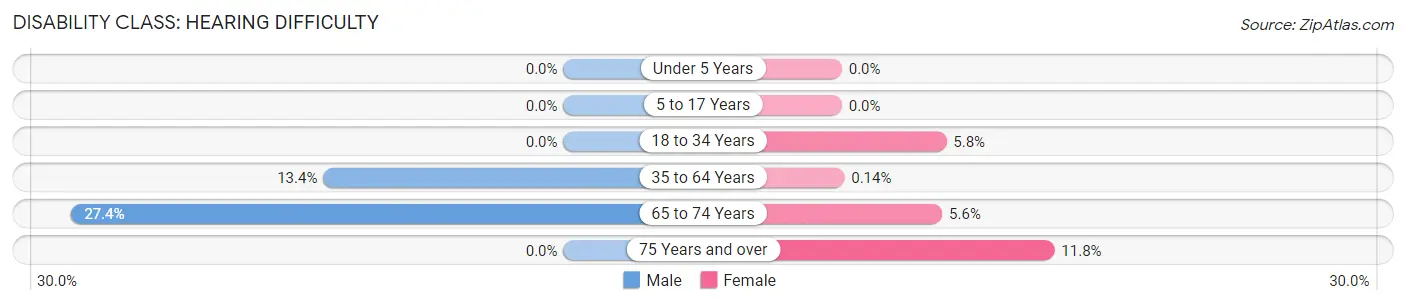
| Age Bracket | Male | Female |
| Under 5 Years | 0 (0.0%) | 0 (0.0%) |
| 5 to 17 Years | 0 (0.0%) | 0 (0.0%) |
| 18 to 34 Years | 0 (0.0%) | 31 (5.8%) |
| 35 to 64 Years | 110 (13.4%) | 1 (0.1%) |
| 65 to 74 Years | 57 (27.4%) | 16 (5.6%) |
| 75 Years and over | 0 (0.0%) | 18 (11.8%) |
Disability Class: Vision Difficulty
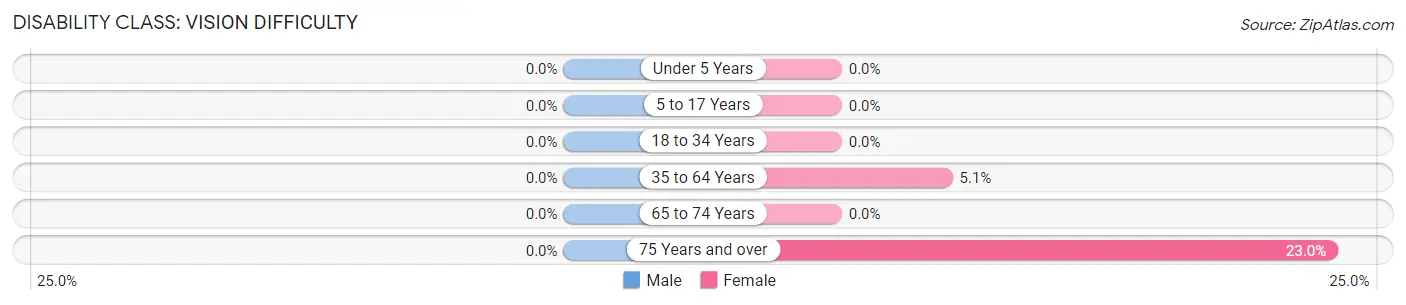
| Age Bracket | Male | Female |
| Under 5 Years | 0 (0.0%) | 0 (0.0%) |
| 5 to 17 Years | 0 (0.0%) | 0 (0.0%) |
| 18 to 34 Years | 0 (0.0%) | 0 (0.0%) |
| 35 to 64 Years | 0 (0.0%) | 38 (5.1%) |
| 65 to 74 Years | 0 (0.0%) | 0 (0.0%) |
| 75 Years and over | 0 (0.0%) | 35 (23.0%) |
Disability Class: Cognitive Difficulty
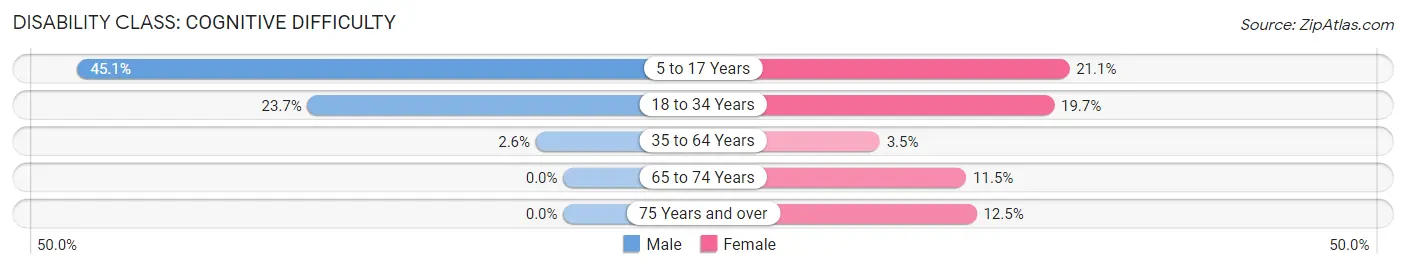
| Age Bracket | Male | Female |
| 5 to 17 Years | 142 (45.1%) | 76 (21.1%) |
| 18 to 34 Years | 112 (23.7%) | 105 (19.7%) |
| 35 to 64 Years | 21 (2.5%) | 26 (3.5%) |
| 65 to 74 Years | 0 (0.0%) | 33 (11.5%) |
| 75 Years and over | 0 (0.0%) | 19 (12.5%) |
Disability Class: Ambulatory Difficulty
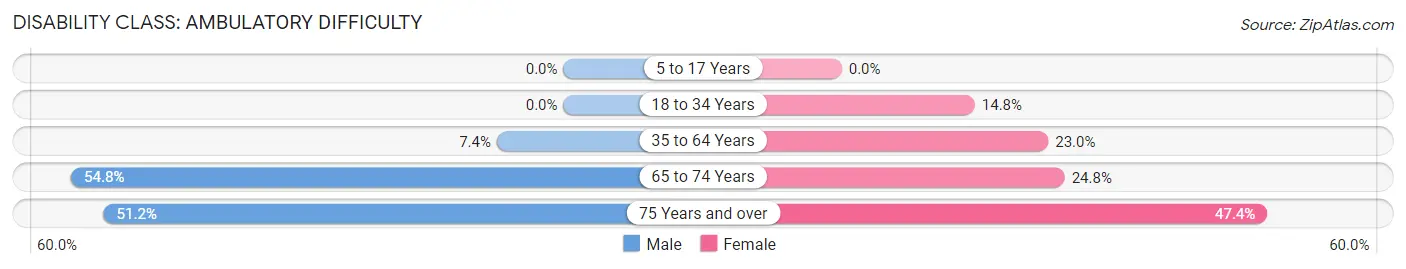
| Age Bracket | Male | Female |
| 5 to 17 Years | 0 (0.0%) | 0 (0.0%) |
| 18 to 34 Years | 0 (0.0%) | 79 (14.8%) |
| 35 to 64 Years | 61 (7.4%) | 170 (23.0%) |
| 65 to 74 Years | 114 (54.8%) | 71 (24.8%) |
| 75 Years and over | 43 (51.2%) | 72 (47.4%) |
Disability Class: Self-Care Difficulty
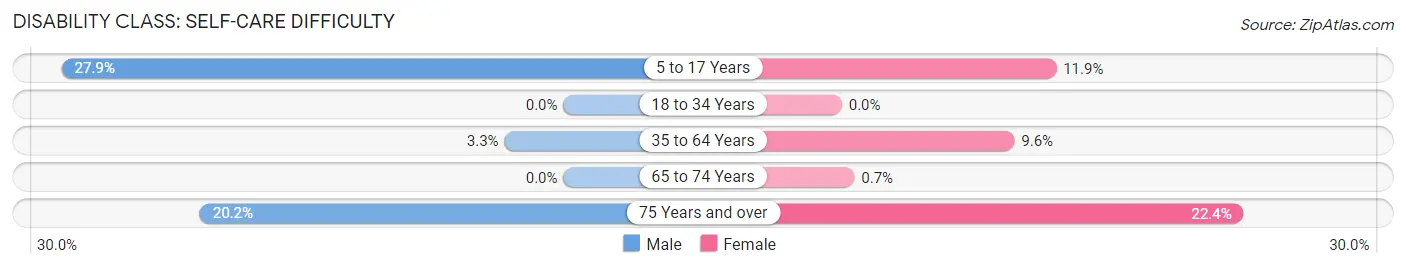
| Age Bracket | Male | Female |
| 5 to 17 Years | 88 (27.9%) | 43 (11.9%) |
| 18 to 34 Years | 0 (0.0%) | 0 (0.0%) |
| 35 to 64 Years | 27 (3.3%) | 71 (9.6%) |
| 65 to 74 Years | 0 (0.0%) | 2 (0.7%) |
| 75 Years and over | 17 (20.2%) | 34 (22.4%) |
Technology Access in Lamar
Computing Device Access in Lamar
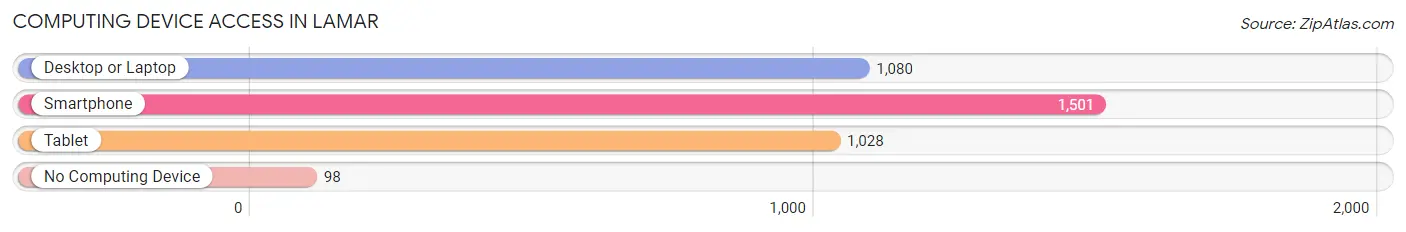
| Device Type | # Households | % Households |
| Desktop or Laptop | 1,080 | 64.4% |
| Smartphone | 1,501 | 89.6% |
| Tablet | 1,028 | 61.3% |
| No Computing Device | 98 | 5.9% |
| Total | 1,676 | 100.0% |
Internet Access in Lamar
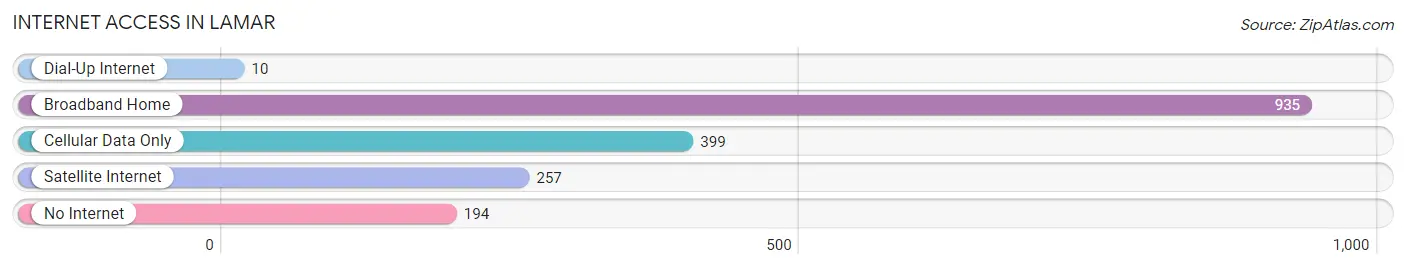
| Internet Type | # Households | % Households |
| Dial-Up Internet | 10 | 0.6% |
| Broadband Home | 935 | 55.8% |
| Cellular Data Only | 399 | 23.8% |
| Satellite Internet | 257 | 15.3% |
| No Internet | 194 | 11.6% |
| Total | 1,676 | 100.0% |
Lamar Summary
Lamar, Missouri is a small city located in Barton County in the southwestern corner of the state. It is the county seat and the largest city in the county. The city is situated on the banks of the Spring River, which is a tributary of the Osage River. The city is located approximately 90 miles south of Kansas City and about 100 miles north of Springfield.
History
The area that is now Lamar was first settled in the early 1800s by settlers from Kentucky and Tennessee. The first post office was established in 1837 and the town was officially incorporated in 1871. The city was named after Lucius Quintus Cincinnatus Lamar, a prominent politician from Mississippi.
In the late 1800s, Lamar was a bustling center of commerce and industry. The city was home to several factories, including a flour mill, a sawmill, a brickyard, and a furniture factory. The city also had a large railroad depot and was a major stop on the Missouri Pacific Railroad.
Geography
Lamar is located in the Ozark Plateau region of Missouri. The city is situated on the banks of the Spring River, which is a tributary of the Osage River. The city is located approximately 90 miles south of Kansas City and about 100 miles north of Springfield.
The city has a total area of 4.2 square miles, all of which is land. The city is located at an elevation of 890 feet above sea level. The climate is characterized by hot, humid summers and cold, wet winters.
Economy
Lamar’s economy is largely based on agriculture and manufacturing. The city is home to several factories, including a flour mill, a sawmill, a brickyard, and a furniture factory. The city also has a large railroad depot and is a major stop on the Missouri Pacific Railroad.
The city is also home to several retail stores, restaurants, and other businesses. The city is also home to a branch of the Barton County Library.
Demographics
As of the 2010 census, Lamar had a population of 4,531. The racial makeup of the city was 95.2% White, 0.7% African American, 0.3% Native American, 0.3% Asian, 0.1% Pacific Islander, 1.2% from other races, and 2.3% from two or more races. Hispanic or Latino of any race were 3.2% of the population.
The median household income in Lamar was $31,944, and the median family income was $41,250. The per capita income for the city was $17,845. About 16.2% of families and 19.2% of the population were below the poverty line, including 25.2% of those under age 18 and 11.2% of those age 65 or over.
Common Questions
What is Per Capita Income in Lamar?
Per Capita income in Lamar is $19,694.
What is the Median Family Income in Lamar?
Median Family Income in Lamar is $47,813.
What is the Median Household income in Lamar?
Median Household Income in Lamar is $32,907.
What is Income or Wage Gap in Lamar?
Income or Wage Gap in Lamar is 59.0%.
Women in Lamar earn 41.0 cents for every dollar earned by a man.
What is Inequality or Gini Index in Lamar?
Inequality or Gini Index in Lamar is 0.45.
What is the Total Population of Lamar?
Total Population of Lamar is 4,298.
What is the Total Male Population of Lamar?
Total Male Population of Lamar is 2,030.
What is the Total Female Population of Lamar?
Total Female Population of Lamar is 2,268.
What is the Ratio of Males per 100 Females in Lamar?
There are 89.51 Males per 100 Females in Lamar.
What is the Ratio of Females per 100 Males in Lamar?
There are 111.72 Females per 100 Males in Lamar.
What is the Median Population Age in Lamar?
Median Population Age in Lamar is 38.7 Years.
What is the Average Family Size in Lamar
Average Family Size in Lamar is 2.9 People.
What is the Average Household Size in Lamar
Average Household Size in Lamar is 2.5 People.
How Large is the Labor Force in Lamar?
There are 1,779 People in the Labor Forcein in Lamar.
What is the Percentage of People in the Labor Force in Lamar?
50.8% of People are in the Labor Force in Lamar.
What is the Unemployment Rate in Lamar?
Unemployment Rate in Lamar is 9.7%.