Makaha, HI Map & Demographics
Makaha Map
Makaha Overview
$24,855
PER CAPITA INCOME
$71,845
AVG FAMILY INCOME
$57,235
AVG HOUSEHOLD INCOME
25.6%
WAGE / INCOME GAP [ % ]
74.4¢/ $1
WAGE / INCOME GAP [ $ ]
0.45
INEQUALITY / GINI INDEX
10,042
TOTAL POPULATION
5,108
MALE POPULATION
4,934
FEMALE POPULATION
103.53
MALES / 100 FEMALES
96.59
FEMALES / 100 MALES
37.0
MEDIAN AGE
4.2
AVG FAMILY SIZE
3.0
AVG HOUSEHOLD SIZE
3,771
LABOR FORCE [ PEOPLE ]
50.4%
PERCENT IN LABOR FORCE
9.7%
UNEMPLOYMENT RATE
Income in Makaha
Income Overview in Makaha
Per Capita Income in Makaha is $24,855, while median incomes of families and households are $71,845 and $57,235 respectively.
| Characteristic | Number | Measure |
| Per Capita Income | 10,042 | $24,855 |
| Median Family Income | 1,761 | $71,845 |
| Mean Family Income | 1,761 | $79,287 |
| Median Household Income | 3,285 | $57,235 |
| Mean Household Income | 3,285 | $72,174 |
| Income Deficit | 1,761 | $0 |
| Wage / Income Gap (%) | 10,042 | 25.55% |
| Wage / Income Gap ($) | 10,042 | 74.45¢ per $1 |
| Gini / Inequality Index | 10,042 | 0.45 |
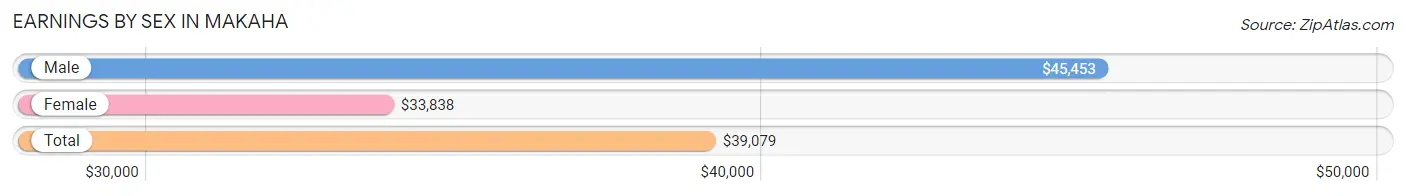
Earnings by Sex in Makaha
Average Earnings in Makaha are $39,079, $45,453 for men and $33,838 for women, a difference of 25.6%.
| Sex | Number | Average Earnings |
| Male | 1,999 (51.4%) | $45,453 |
| Female | 1,893 (48.6%) | $33,838 |
| Total | 3,892 (100.0%) | $39,079 |
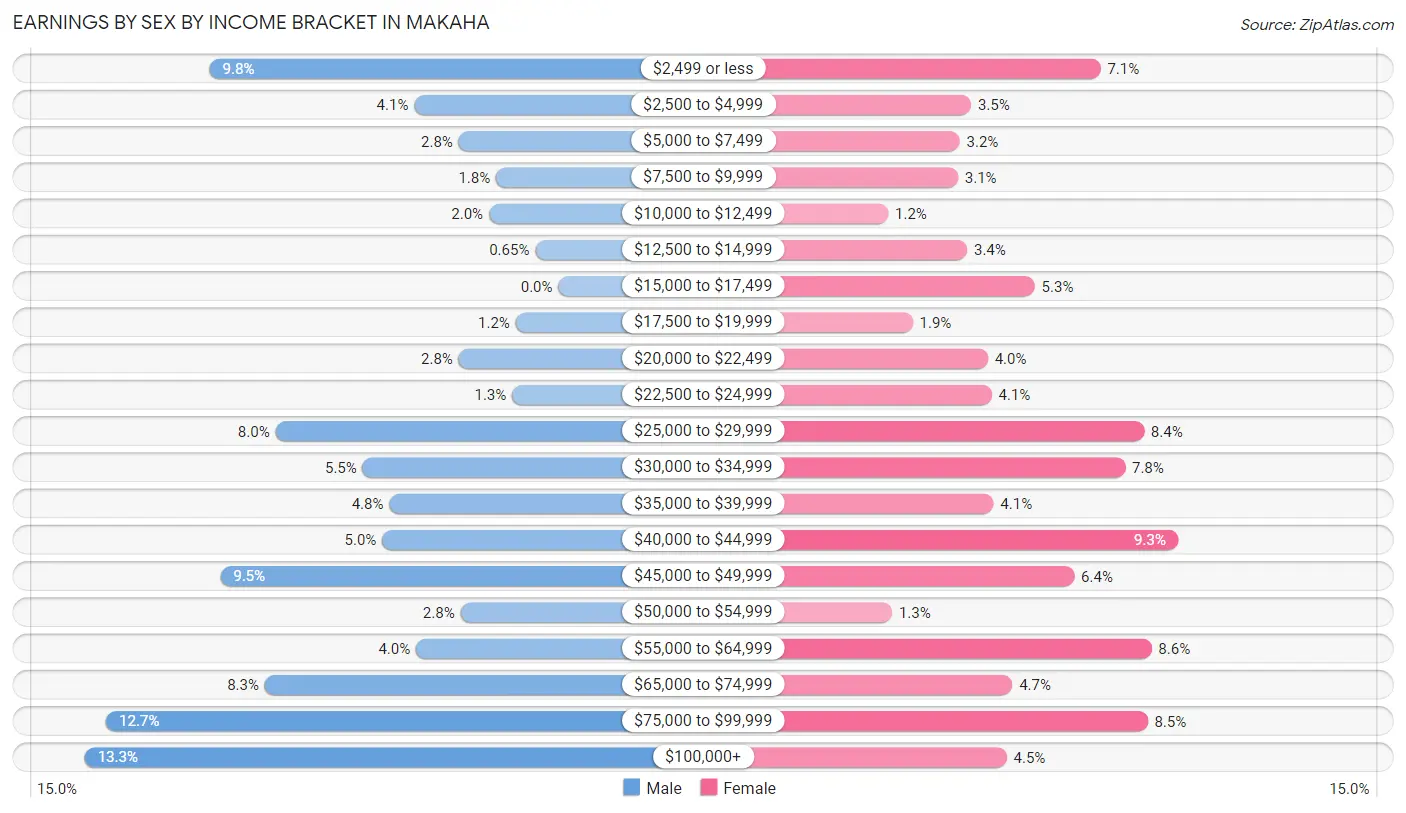
Earnings by Sex by Income Bracket in Makaha
The most common earnings brackets in Makaha are $100,000+ for men (266 | 13.3%) and $40,000 to $44,999 for women (176 | 9.3%).
| Income | Male | Female |
| $2,499 or less | 196 (9.8%) | 135 (7.1%) |
| $2,500 to $4,999 | 81 (4.1%) | 66 (3.5%) |
| $5,000 to $7,499 | 56 (2.8%) | 60 (3.2%) |
| $7,500 to $9,999 | 35 (1.8%) | 59 (3.1%) |
| $10,000 to $12,499 | 39 (1.9%) | 22 (1.2%) |
| $12,500 to $14,999 | 13 (0.6%) | 64 (3.4%) |
| $15,000 to $17,499 | 0 (0.0%) | 100 (5.3%) |
| $17,500 to $19,999 | 24 (1.2%) | 35 (1.8%) |
| $20,000 to $22,499 | 56 (2.8%) | 75 (4.0%) |
| $22,500 to $24,999 | 26 (1.3%) | 77 (4.1%) |
| $25,000 to $29,999 | 159 (8.0%) | 158 (8.4%) |
| $30,000 to $34,999 | 110 (5.5%) | 148 (7.8%) |
| $35,000 to $39,999 | 95 (4.8%) | 78 (4.1%) |
| $40,000 to $44,999 | 99 (5.0%) | 176 (9.3%) |
| $45,000 to $49,999 | 190 (9.5%) | 121 (6.4%) |
| $50,000 to $54,999 | 55 (2.8%) | 24 (1.3%) |
| $55,000 to $64,999 | 80 (4.0%) | 162 (8.6%) |
| $65,000 to $74,999 | 165 (8.3%) | 88 (4.6%) |
| $75,000 to $99,999 | 254 (12.7%) | 160 (8.5%) |
| $100,000+ | 266 (13.3%) | 85 (4.5%) |
| Total | 1,999 (100.0%) | 1,893 (100.0%) |
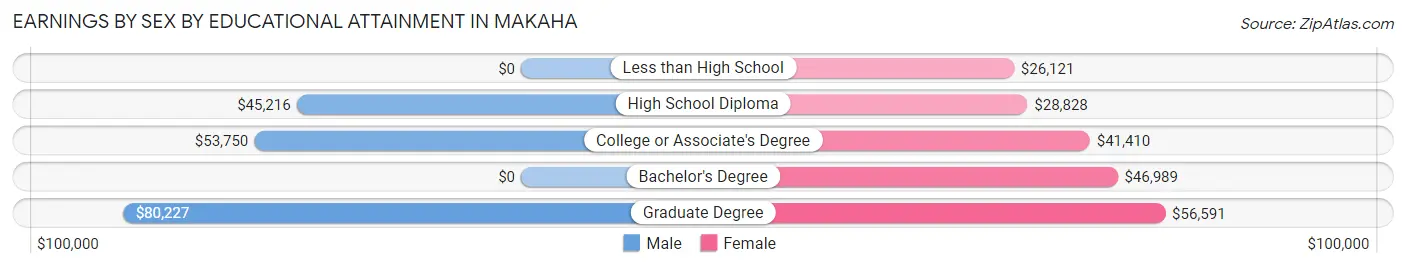
Earnings by Sex by Educational Attainment in Makaha
Average earnings in Makaha are $48,731 for men and $40,055 for women, a difference of 17.8%. Men with an educational attainment of graduate degree enjoy the highest average annual earnings of $80,227, while those with high school diploma education earn the least with $45,216. Women with an educational attainment of graduate degree earn the most with the average annual earnings of $56,591, while those with less than high school education have the smallest earnings of $26,121.
| Educational Attainment | Male Income | Female Income |
| Less than High School | - | - |
| High School Diploma | $45,216 | $28,828 |
| College or Associate's Degree | $53,750 | $41,410 |
| Bachelor's Degree | - | - |
| Graduate Degree | $80,227 | $56,591 |
| Total | $48,731 | $40,055 |
Family Income in Makaha
Family Income Brackets in Makaha
According to the Makaha family income data, there are 370 families falling into the $100,000 to $149,999 income range, which is the most common income bracket and makes up 21.0% of all families. Conversely, the $200,000+ income bracket is the least frequent group with only 72 families (4.1%) belonging to this category.
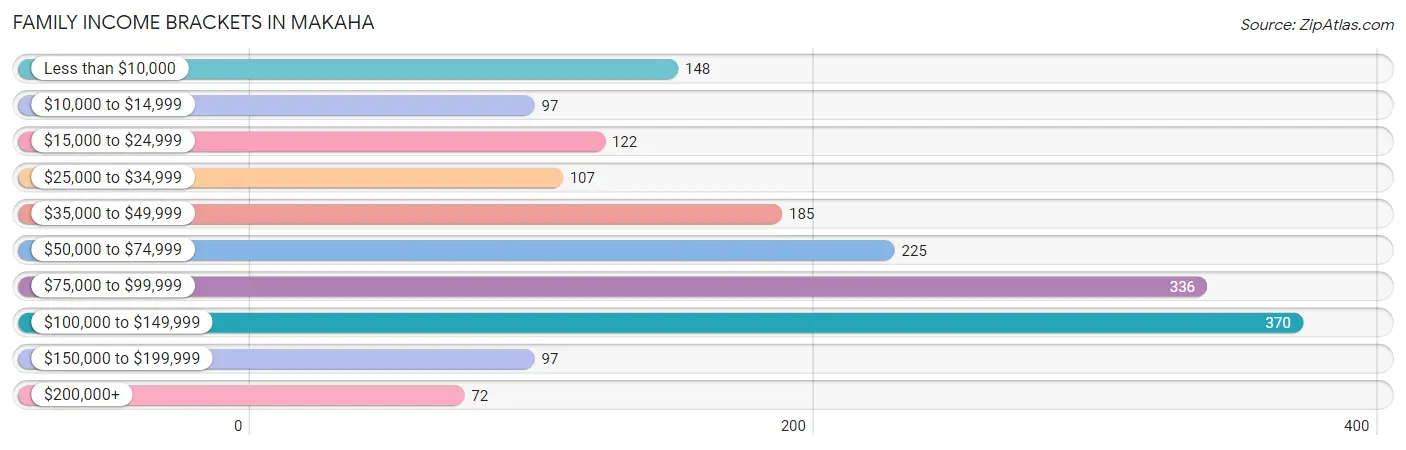
| Income Bracket | # Families | % Families |
| Less than $10,000 | 148 | 8.4% |
| $10,000 to $14,999 | 97 | 5.5% |
| $15,000 to $24,999 | 122 | 6.9% |
| $25,000 to $34,999 | 107 | 6.1% |
| $35,000 to $49,999 | 185 | 10.5% |
| $50,000 to $74,999 | 225 | 12.8% |
| $75,000 to $99,999 | 336 | 19.1% |
| $100,000 to $149,999 | 370 | 21.0% |
| $150,000 to $199,999 | 97 | 5.5% |
| $200,000+ | 72 | 4.1% |
Family Income by Famaliy Size in Makaha
5-person families (314 | 17.8%) account for the highest median family income in Makaha with $97,656 per family, while 3-person families (361 | 20.5%) have the highest median income of $27,910 per family member.
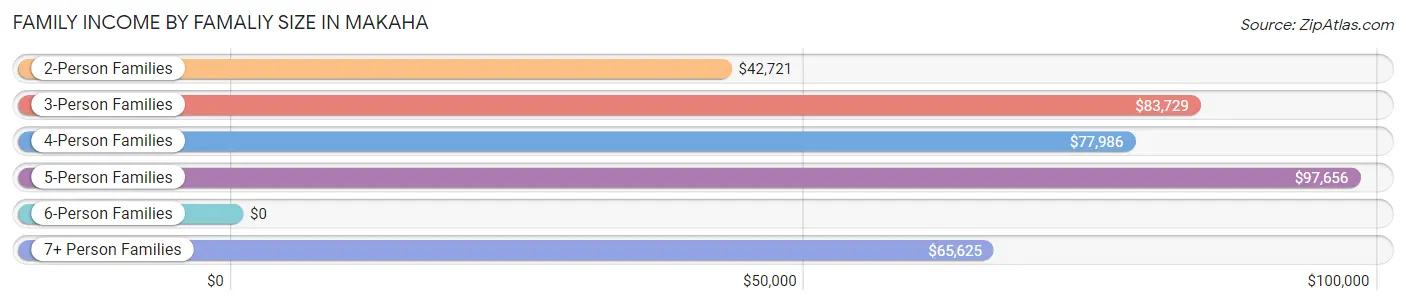
| Income Bracket | # Families | Median Income |
| 2-Person Families | 683 (38.8%) | $42,721 |
| 3-Person Families | 361 (20.5%) | $83,729 |
| 4-Person Families | 165 (9.4%) | $77,986 |
| 5-Person Families | 314 (17.8%) | $97,656 |
| 6-Person Families | 124 (7.0%) | $0 |
| 7+ Person Families | 114 (6.5%) | $65,625 |
| Total | 1,761 (100.0%) | $71,845 |
Family Income by Number of Earners in Makaha
The median family income in Makaha is $71,845, with families comprising 3+ earners (209) having the highest median family income of $134,688, while families with no earners (368) have the lowest median family income of $16,250, accounting for 11.9% and 20.9% of families, respectively.
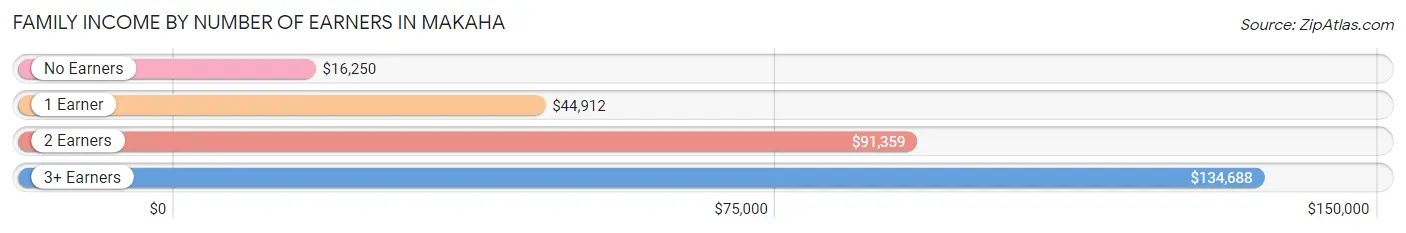
| Number of Earners | # Families | Median Income |
| No Earners | 368 (20.9%) | $16,250 |
| 1 Earner | 631 (35.8%) | $44,912 |
| 2 Earners | 553 (31.4%) | $91,359 |
| 3+ Earners | 209 (11.9%) | $134,688 |
| Total | 1,761 (100.0%) | $71,845 |
Household Income in Makaha
Household Income Brackets in Makaha
With 591 households falling in the category, the $100,000 to $149,999 income range is the most frequent in Makaha, accounting for 18.0% of all households. In contrast, only 122 households (3.7%) fall into the $200,000+ income bracket, making it the least populous group.
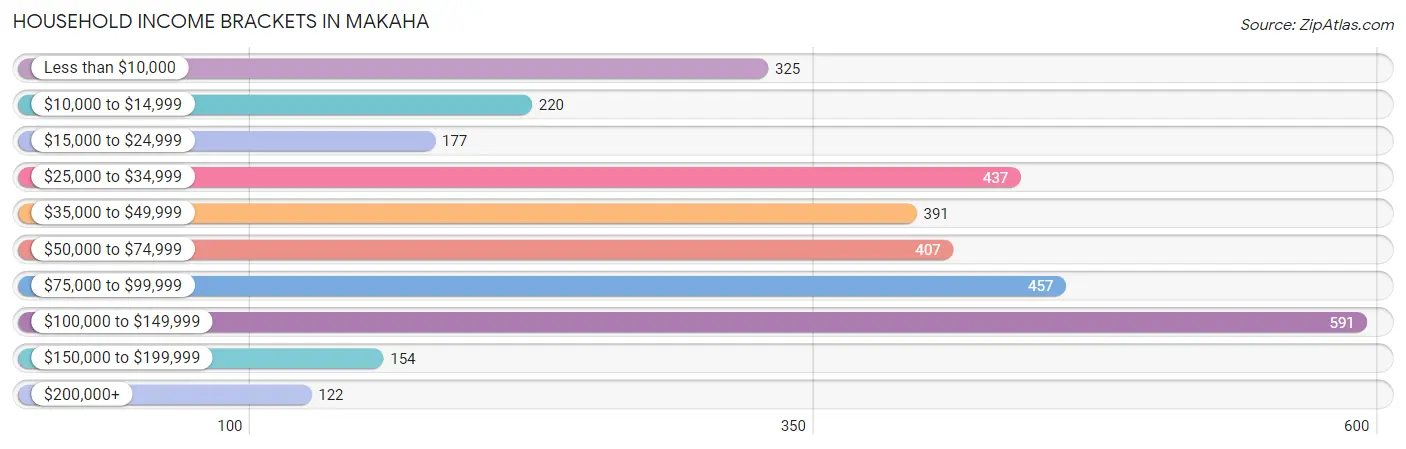
| Income Bracket | # Households | % Households |
| Less than $10,000 | 325 | 9.9% |
| $10,000 to $14,999 | 220 | 6.7% |
| $15,000 to $24,999 | 177 | 5.4% |
| $25,000 to $34,999 | 437 | 13.3% |
| $35,000 to $49,999 | 391 | 11.9% |
| $50,000 to $74,999 | 407 | 12.4% |
| $75,000 to $99,999 | 457 | 13.9% |
| $100,000 to $149,999 | 591 | 18.0% |
| $150,000 to $199,999 | 154 | 4.7% |
| $200,000+ | 122 | 3.7% |
Household Income by Householder Age in Makaha
The median household income in Makaha is $57,235, with the highest median household income of $68,750 found in the 45 to 64 years age bracket for the primary householder. A total of 1,418 households (43.2%) fall into this category. Meanwhile, the 15 to 24 years age bracket for the primary householder has the lowest median household income of $28,780, with 144 households (4.4%) in this group.
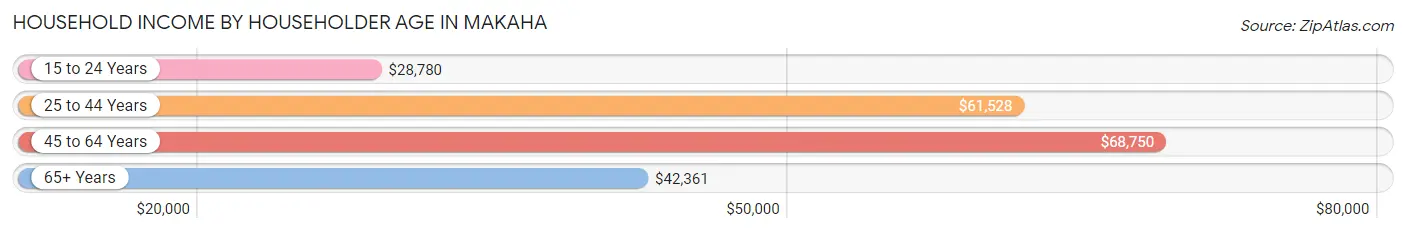
| Income Bracket | # Households | Median Income |
| 15 to 24 Years | 144 (4.4%) | $28,780 |
| 25 to 44 Years | 894 (27.2%) | $61,528 |
| 45 to 64 Years | 1,418 (43.2%) | $68,750 |
| 65+ Years | 829 (25.2%) | $42,361 |
| Total | 3,285 (100.0%) | $57,235 |
Poverty in Makaha
Income Below Poverty by Sex and Age in Makaha
With 22.8% poverty level for males and 25.2% for females among the residents of Makaha, 5 year old males and 15 year old females are the most vulnerable to poverty, with 25 males (56.8%) and 80 females (82.5%) in their respective age groups living below the poverty level.
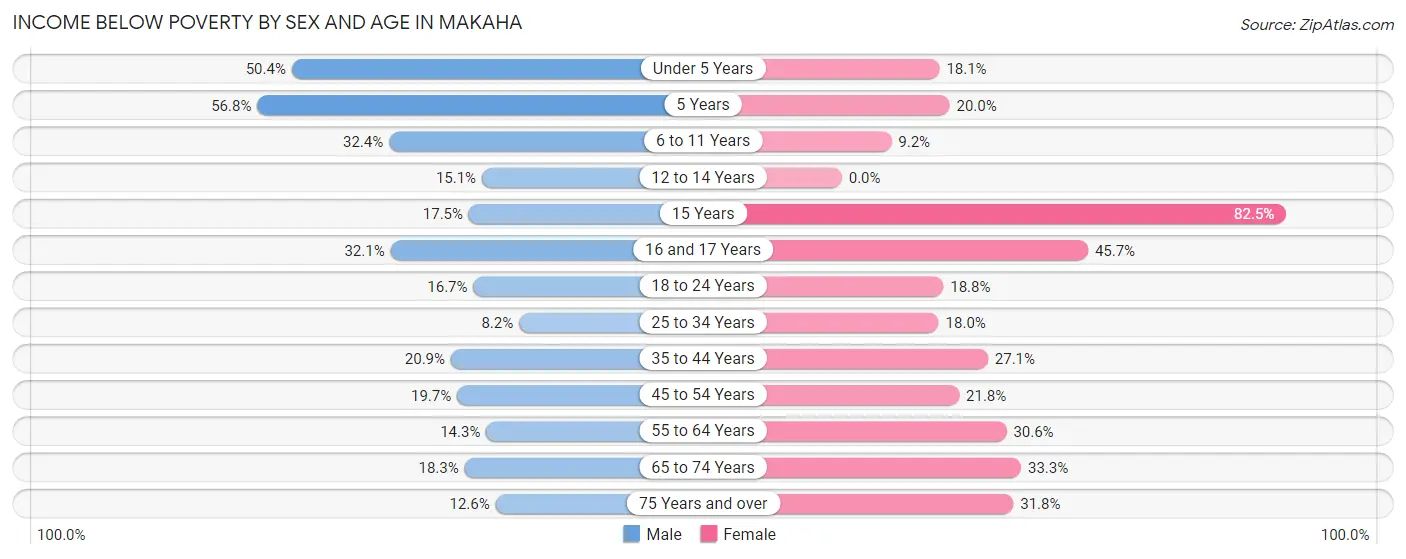
| Age Bracket | Male | Female |
| Under 5 Years | 301 (50.4%) | 70 (18.1%) |
| 5 Years | 25 (56.8%) | 8 (20.0%) |
| 6 to 11 Years | 143 (32.4%) | 37 (9.2%) |
| 12 to 14 Years | 47 (15.1%) | 0 (0.0%) |
| 15 Years | 10 (17.5%) | 80 (82.5%) |
| 16 and 17 Years | 43 (32.1%) | 122 (45.7%) |
| 18 to 24 Years | 79 (16.7%) | 65 (18.8%) |
| 25 to 34 Years | 36 (8.2%) | 96 (18.0%) |
| 35 to 44 Years | 186 (20.9%) | 170 (27.1%) |
| 45 to 54 Years | 87 (19.7%) | 113 (21.8%) |
| 55 to 64 Years | 82 (14.3%) | 239 (30.6%) |
| 65 to 74 Years | 95 (18.3%) | 173 (33.3%) |
| 75 Years and over | 17 (12.6%) | 64 (31.8%) |
| Total | 1,151 (22.8%) | 1,237 (25.2%) |
Income Above Poverty by Sex and Age in Makaha
According to the poverty statistics in Makaha, males aged 25 to 34 years and females aged 12 to 14 years are the age groups that are most secure financially, with 91.8% of males and 100.0% of females in these age groups living above the poverty line.
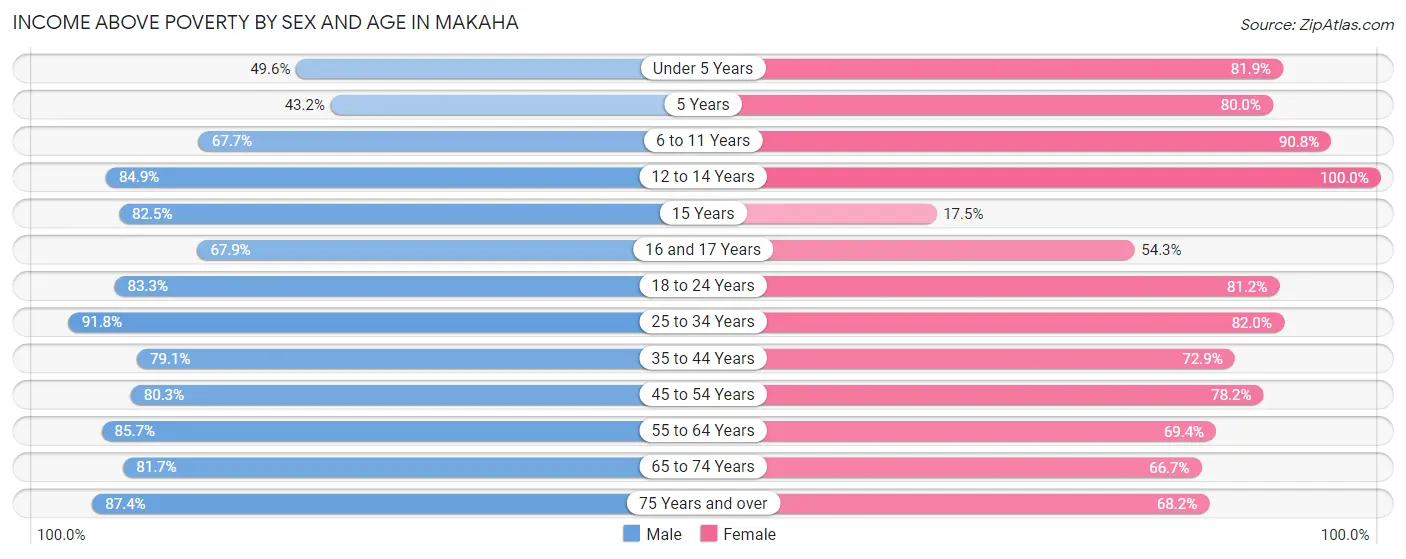
| Age Bracket | Male | Female |
| Under 5 Years | 296 (49.6%) | 316 (81.9%) |
| 5 Years | 19 (43.2%) | 32 (80.0%) |
| 6 to 11 Years | 299 (67.6%) | 365 (90.8%) |
| 12 to 14 Years | 264 (84.9%) | 184 (100.0%) |
| 15 Years | 47 (82.5%) | 17 (17.5%) |
| 16 and 17 Years | 91 (67.9%) | 145 (54.3%) |
| 18 to 24 Years | 394 (83.3%) | 280 (81.2%) |
| 25 to 34 Years | 402 (91.8%) | 438 (82.0%) |
| 35 to 44 Years | 705 (79.1%) | 457 (72.9%) |
| 45 to 54 Years | 354 (80.3%) | 406 (78.2%) |
| 55 to 64 Years | 491 (85.7%) | 543 (69.4%) |
| 65 to 74 Years | 423 (81.7%) | 347 (66.7%) |
| 75 Years and over | 118 (87.4%) | 137 (68.2%) |
| Total | 3,903 (77.2%) | 3,667 (74.8%) |
Income Below Poverty Among Married-Couple Families in Makaha
The poverty statistics for married-couple families in Makaha show that 6.4% or 62 of the total 968 families live below the poverty line. Families with no children have the highest poverty rate of 9.6%, comprising of 47 families. On the other hand, families with 3 or 4 children have the lowest poverty rate of 0.0%, which includes 0 families.
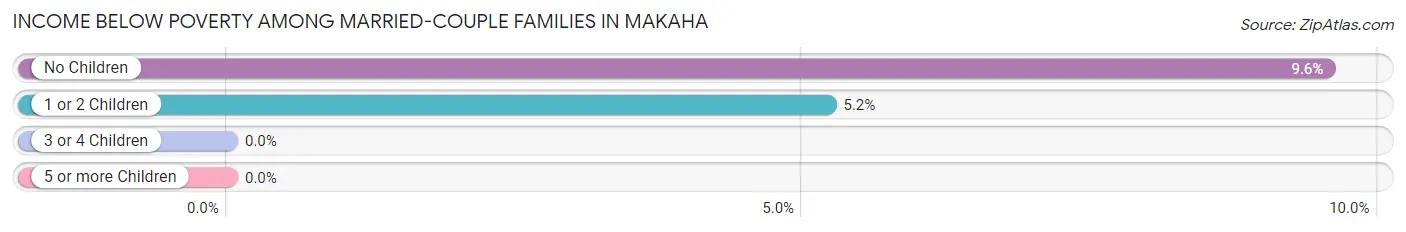
| Children | Above Poverty | Below Poverty |
| No Children | 445 (90.4%) | 47 (9.6%) |
| 1 or 2 Children | 273 (94.8%) | 15 (5.2%) |
| 3 or 4 Children | 117 (100.0%) | 0 (0.0%) |
| 5 or more Children | 71 (100.0%) | 0 (0.0%) |
| Total | 906 (93.6%) | 62 (6.4%) |
Income Below Poverty Among Single-Parent Households in Makaha
According to the poverty data in Makaha, 14.0% or 23 single-father households and 41.5% or 261 single-mother households are living below the poverty line. Among single-father households, those with 1 or 2 children have the highest poverty rate, with 23 households (22.3%) experiencing poverty. Likewise, among single-mother households, those with 3 or 4 children have the highest poverty rate, with 125 households (79.1%) falling below the poverty line.
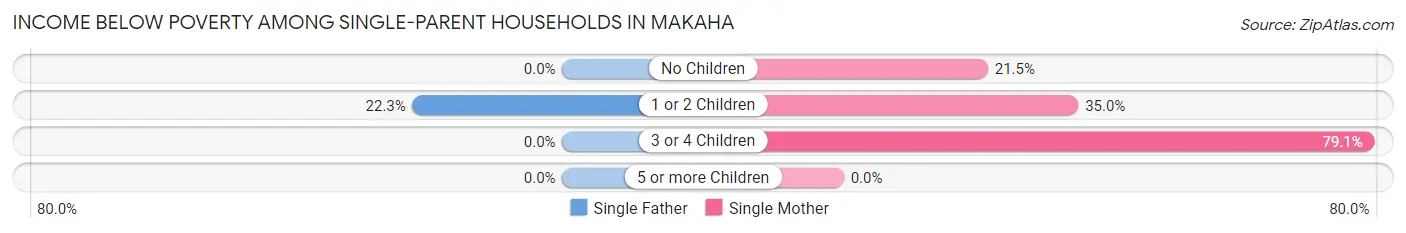
| Children | Single Father | Single Mother |
| No Children | 0 (0.0%) | 35 (21.5%) |
| 1 or 2 Children | 23 (22.3%) | 101 (34.9%) |
| 3 or 4 Children | 0 (0.0%) | 125 (79.1%) |
| 5 or more Children | 0 (0.0%) | 0 (0.0%) |
| Total | 23 (14.0%) | 261 (41.5%) |
Income Below Poverty Among Married-Couple vs Single-Parent Households in Makaha
The poverty data for Makaha shows that 62 of the married-couple family households (6.4%) and 284 of the single-parent households (35.8%) are living below the poverty level. Within the married-couple family households, those with no children have the highest poverty rate, with 47 households (9.6%) falling below the poverty line. Among the single-parent households, those with 3 or 4 children have the highest poverty rate, with 125 household (75.8%) living below poverty.
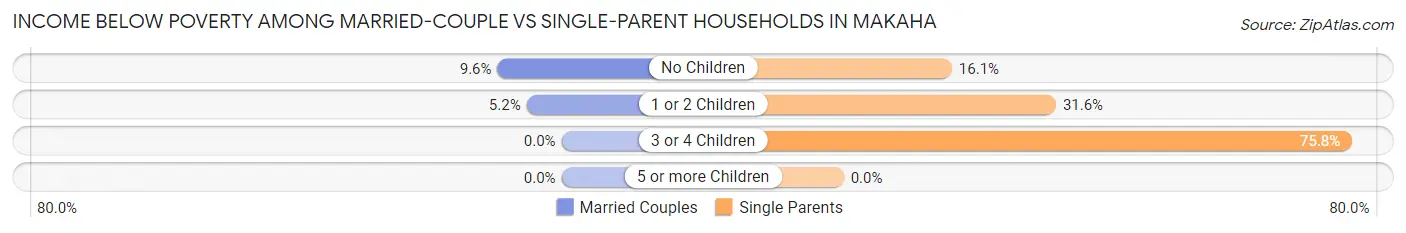
| Children | Married-Couple Families | Single-Parent Households |
| No Children | 47 (9.6%) | 35 (16.1%) |
| 1 or 2 Children | 15 (5.2%) | 124 (31.6%) |
| 3 or 4 Children | 0 (0.0%) | 125 (75.8%) |
| 5 or more Children | 0 (0.0%) | 0 (0.0%) |
| Total | 62 (6.4%) | 284 (35.8%) |
Race in Makaha
The most populous races in Makaha are Hawaiian / Pacific (3,954 | 39.4%), Two or more Races (2,541 | 25.3%), and White / Caucasian (2,019 | 20.1%).
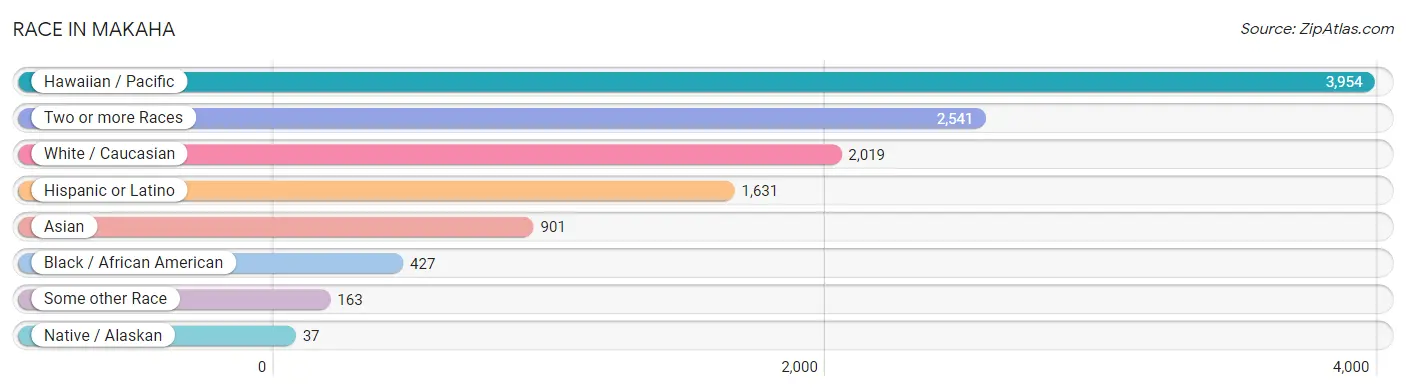
| Race | # Population | % Population |
| Asian | 901 | 9.0% |
| Black / African American | 427 | 4.3% |
| Hawaiian / Pacific | 3,954 | 39.4% |
| Hispanic or Latino | 1,631 | 16.2% |
| Native / Alaskan | 37 | 0.4% |
| White / Caucasian | 2,019 | 20.1% |
| Two or more Races | 2,541 | 25.3% |
| Some other Race | 163 | 1.6% |
| Total | 10,042 | 100.0% |
Ancestry in Makaha
The most populous ancestries reported in Makaha are Native Hawaiian (4,548 | 45.3%), Korean (1,616 | 16.1%), Indian (Asian) (982 | 9.8%), Bhutanese (919 | 9.1%), and Samoan (878 | 8.7%), together accounting for 89.1% of all Makaha residents.
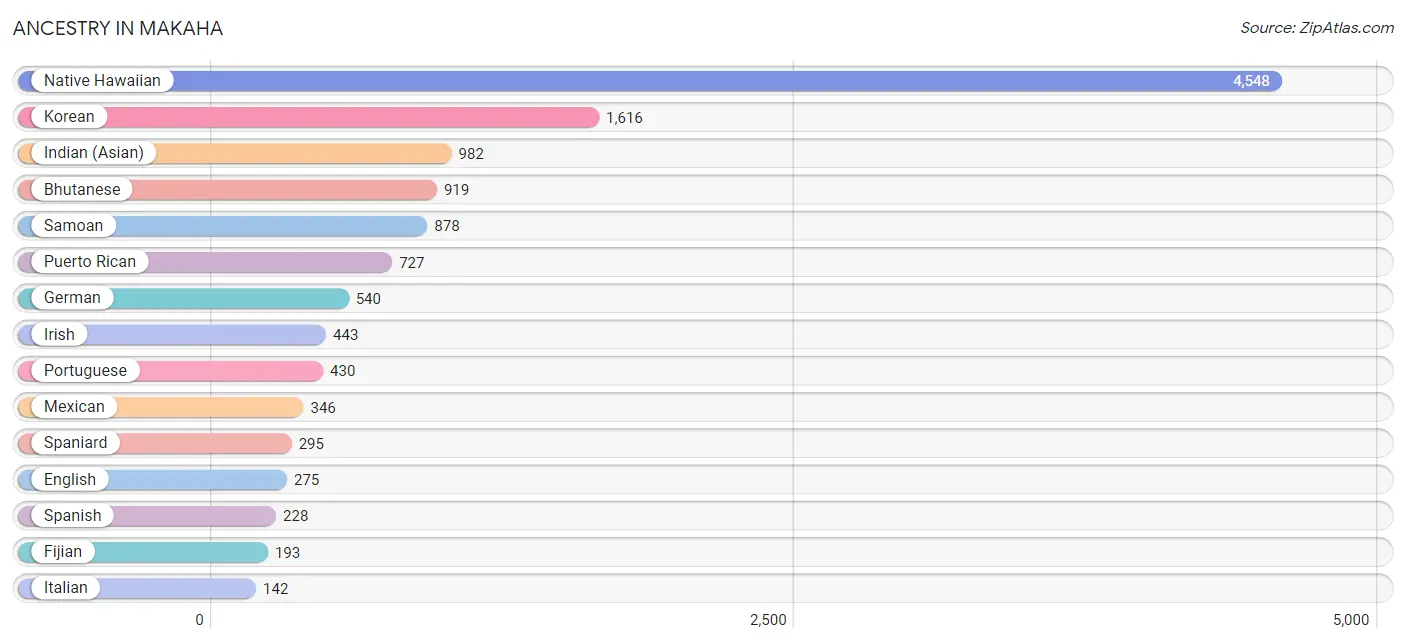
| Ancestry | # Population | % Population |
| African | 29 | 0.3% |
| Aleut | 3 | 0.0% |
| American | 110 | 1.1% |
| Bhutanese | 919 | 9.1% |
| British | 26 | 0.3% |
| Burmese | 119 | 1.2% |
| Canadian | 27 | 0.3% |
| Central American | 19 | 0.2% |
| Central American Indian | 14 | 0.1% |
| Cherokee | 92 | 0.9% |
| Chinese | 48 | 0.5% |
| Choctaw | 7 | 0.1% |
| Creek | 2 | 0.0% |
| Danish | 21 | 0.2% |
| Dutch | 10 | 0.1% |
| English | 275 | 2.7% |
| Ethiopian | 2 | 0.0% |
| European | 58 | 0.6% |
| Fijian | 193 | 1.9% |
| French | 53 | 0.5% |
| German | 540 | 5.4% |
| Guamanian / Chamorro | 23 | 0.2% |
| Honduran | 12 | 0.1% |
| Icelander | 18 | 0.2% |
| Indian (Asian) | 982 | 9.8% |
| Irish | 443 | 4.4% |
| Italian | 142 | 1.4% |
| Korean | 1,616 | 16.1% |
| Luxembourger | 6 | 0.1% |
| Mexican | 346 | 3.5% |
| Mongolian | 8 | 0.1% |
| Native Hawaiian | 4,548 | 45.3% |
| Navajo | 31 | 0.3% |
| Nigerian | 23 | 0.2% |
| Northern European | 17 | 0.2% |
| Norwegian | 60 | 0.6% |
| Panamanian | 7 | 0.1% |
| Peruvian | 9 | 0.1% |
| Polish | 135 | 1.3% |
| Portuguese | 430 | 4.3% |
| Puerto Rican | 727 | 7.2% |
| Russian | 37 | 0.4% |
| Samoan | 878 | 8.7% |
| Scandinavian | 18 | 0.2% |
| Scotch-Irish | 32 | 0.3% |
| Scottish | 46 | 0.5% |
| Slavic | 11 | 0.1% |
| South American | 9 | 0.1% |
| Spaniard | 295 | 2.9% |
| Spanish | 228 | 2.3% |
| Sri Lankan | 12 | 0.1% |
| Subsaharan African | 61 | 0.6% |
| Swedish | 139 | 1.4% |
| Thai | 8 | 0.1% |
| Tongan | 68 | 0.7% |
| Ukrainian | 21 | 0.2% |
| Welsh | 4 | 0.0% |
| Yaqui | 11 | 0.1% | View All 58 Rows |
Immigrants in Makaha
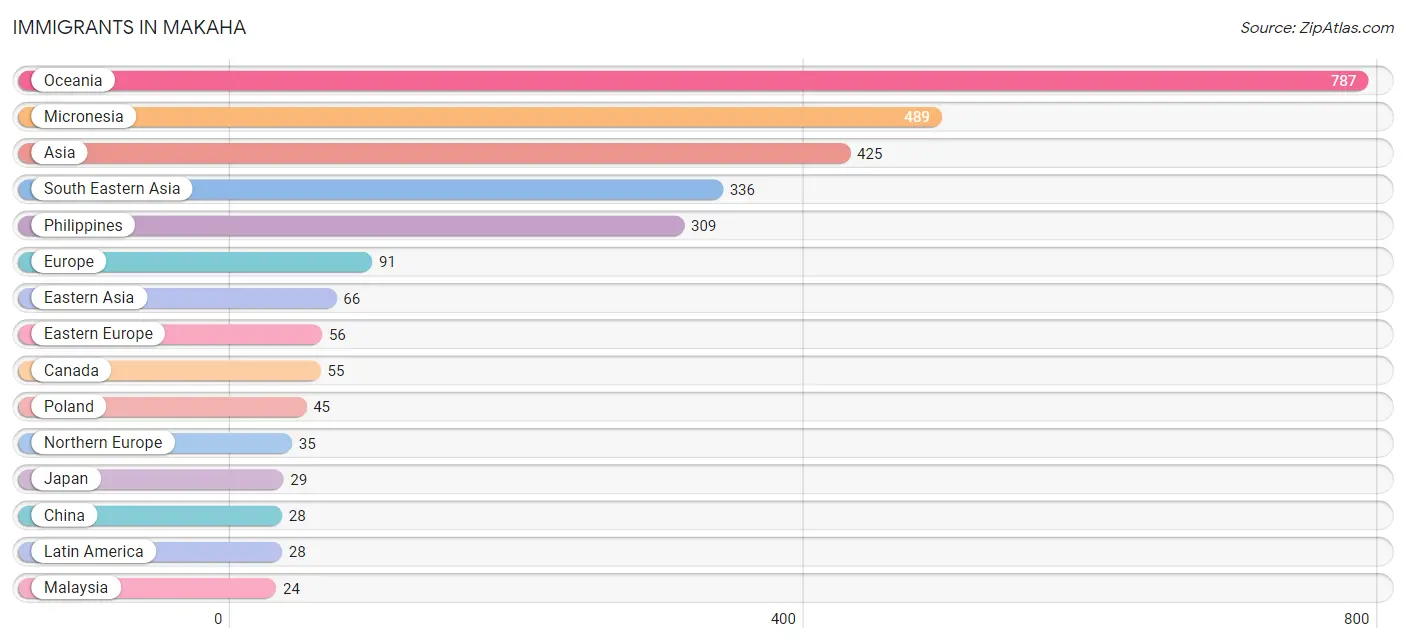
The most numerous immigrant groups reported in Makaha came from Oceania (787 | 7.8%), Micronesia (489 | 4.9%), Asia (425 | 4.2%), South Eastern Asia (336 | 3.4%), and Philippines (309 | 3.1%), together accounting for 23.4% of all Makaha residents.
| Immigration Origin | # Population | % Population |
| Africa | 9 | 0.1% |
| Asia | 425 | 4.2% |
| Australia | 21 | 0.2% |
| Belarus | 11 | 0.1% |
| Canada | 55 | 0.5% |
| Central America | 19 | 0.2% |
| China | 28 | 0.3% |
| Eastern Africa | 9 | 0.1% |
| Eastern Asia | 66 | 0.7% |
| Eastern Europe | 56 | 0.6% |
| England | 17 | 0.2% |
| Eritrea | 2 | 0.0% |
| Europe | 91 | 0.9% |
| Fiji | 21 | 0.2% |
| Honduras | 4 | 0.0% |
| Japan | 29 | 0.3% |
| Korea | 9 | 0.1% |
| Latin America | 28 | 0.3% |
| Malaysia | 24 | 0.2% |
| Mexico | 8 | 0.1% |
| Micronesia | 489 | 4.9% |
| Northern Europe | 35 | 0.4% |
| Oceania | 787 | 7.8% |
| Pakistan | 23 | 0.2% |
| Panama | 7 | 0.1% |
| Peru | 9 | 0.1% |
| Philippines | 309 | 3.1% |
| Poland | 45 | 0.4% |
| South America | 9 | 0.1% |
| South Central Asia | 23 | 0.2% |
| South Eastern Asia | 336 | 3.4% |
| Taiwan | 19 | 0.2% |
| Vietnam | 3 | 0.0% | View All 33 Rows |
Sex and Age in Makaha
Sex and Age in Makaha
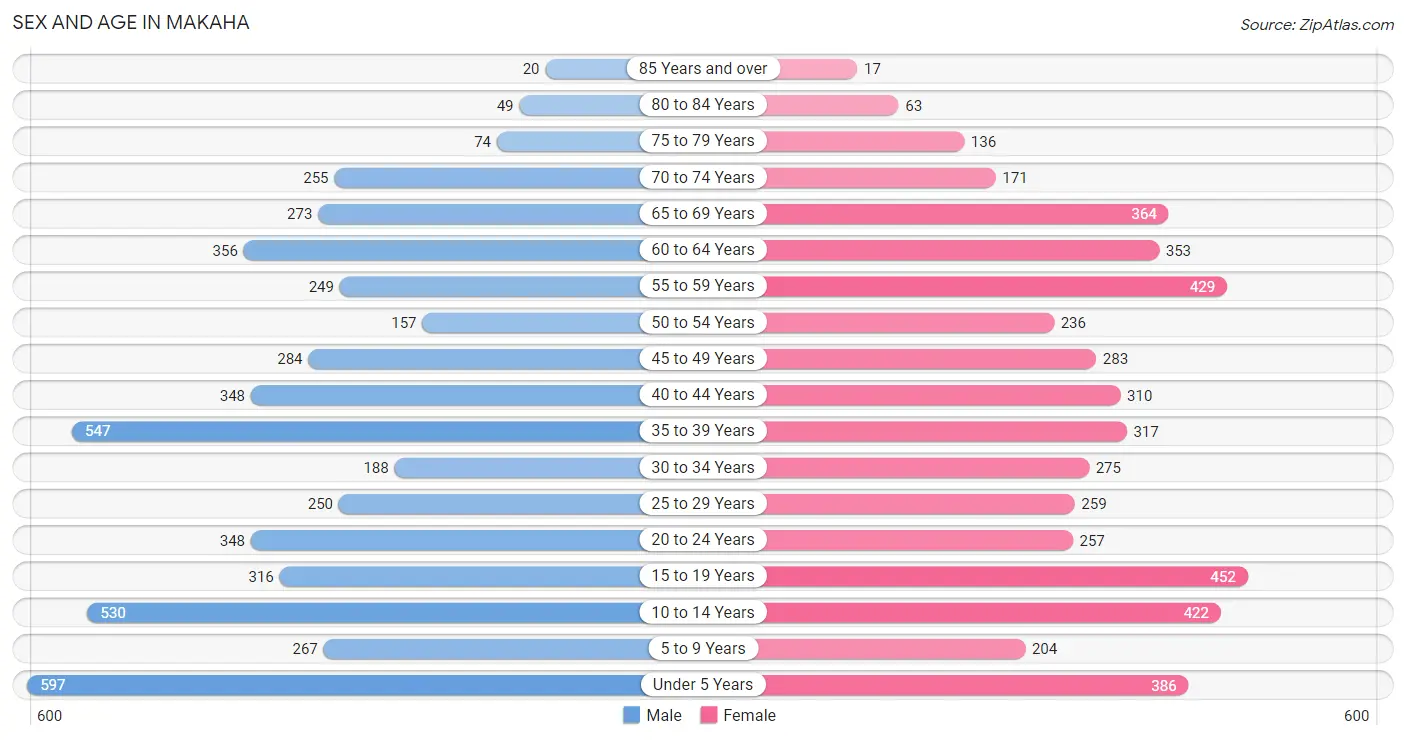
The most populous age groups in Makaha are Under 5 Years (597 | 11.7%) for men and 15 to 19 Years (452 | 9.2%) for women.
| Age Bracket | Male | Female |
| Under 5 Years | 597 (11.7%) | 386 (7.8%) |
| 5 to 9 Years | 267 (5.2%) | 204 (4.1%) |
| 10 to 14 Years | 530 (10.4%) | 422 (8.6%) |
| 15 to 19 Years | 316 (6.2%) | 452 (9.2%) |
| 20 to 24 Years | 348 (6.8%) | 257 (5.2%) |
| 25 to 29 Years | 250 (4.9%) | 259 (5.2%) |
| 30 to 34 Years | 188 (3.7%) | 275 (5.6%) |
| 35 to 39 Years | 547 (10.7%) | 317 (6.4%) |
| 40 to 44 Years | 348 (6.8%) | 310 (6.3%) |
| 45 to 49 Years | 284 (5.6%) | 283 (5.7%) |
| 50 to 54 Years | 157 (3.1%) | 236 (4.8%) |
| 55 to 59 Years | 249 (4.9%) | 429 (8.7%) |
| 60 to 64 Years | 356 (7.0%) | 353 (7.1%) |
| 65 to 69 Years | 273 (5.3%) | 364 (7.4%) |
| 70 to 74 Years | 255 (5.0%) | 171 (3.5%) |
| 75 to 79 Years | 74 (1.5%) | 136 (2.8%) |
| 80 to 84 Years | 49 (1.0%) | 63 (1.3%) |
| 85 Years and over | 20 (0.4%) | 17 (0.3%) |
| Total | 5,108 (100.0%) | 4,934 (100.0%) |
Families and Households in Makaha
Median Family Size in Makaha
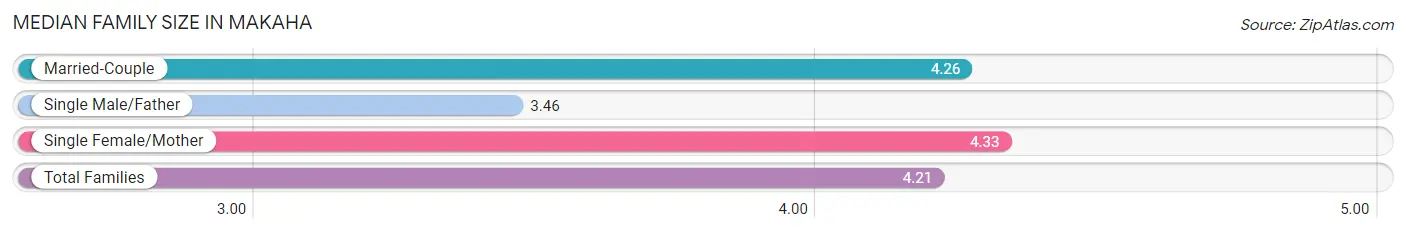
The median family size in Makaha is 4.21 persons per family, with single female/mother families (629 | 35.7%) accounting for the largest median family size of 4.33 persons per family. On the other hand, single male/father families (164 | 9.3%) represent the smallest median family size with 3.46 persons per family.
| Family Type | # Families | Family Size |
| Married-Couple | 968 (55.0%) | 4.26 |
| Single Male/Father | 164 (9.3%) | 3.46 |
| Single Female/Mother | 629 (35.7%) | 4.33 |
| Total Families | 1,761 (100.0%) | 4.21 |
Median Household Size in Makaha
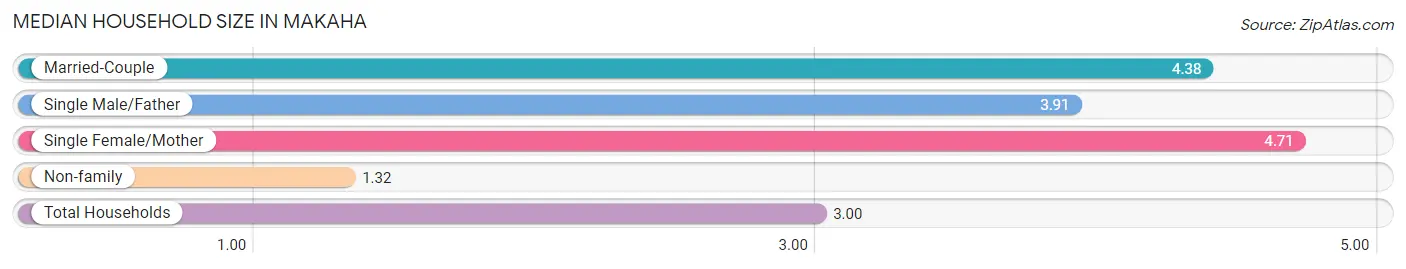
The median household size in Makaha is 3.00 persons per household, with single female/mother households (629 | 19.2%) accounting for the largest median household size of 4.71 persons per household. non-family households (1,524 | 46.4%) represent the smallest median household size with 1.32 persons per household.
| Household Type | # Households | Household Size |
| Married-Couple | 968 (29.5%) | 4.38 |
| Single Male/Father | 164 (5.0%) | 3.91 |
| Single Female/Mother | 629 (19.2%) | 4.71 |
| Non-family | 1,524 (46.4%) | 1.32 |
| Total Households | 3,285 (100.0%) | 3.00 |
Household Size by Marriage Status in Makaha
Out of a total of 3,285 households in Makaha, 1,761 (53.6%) are family households, while 1,524 (46.4%) are nonfamily households. The most numerous type of family households are 2-person households, comprising 580, and the most common type of nonfamily households are 1-person households, comprising 1,151.
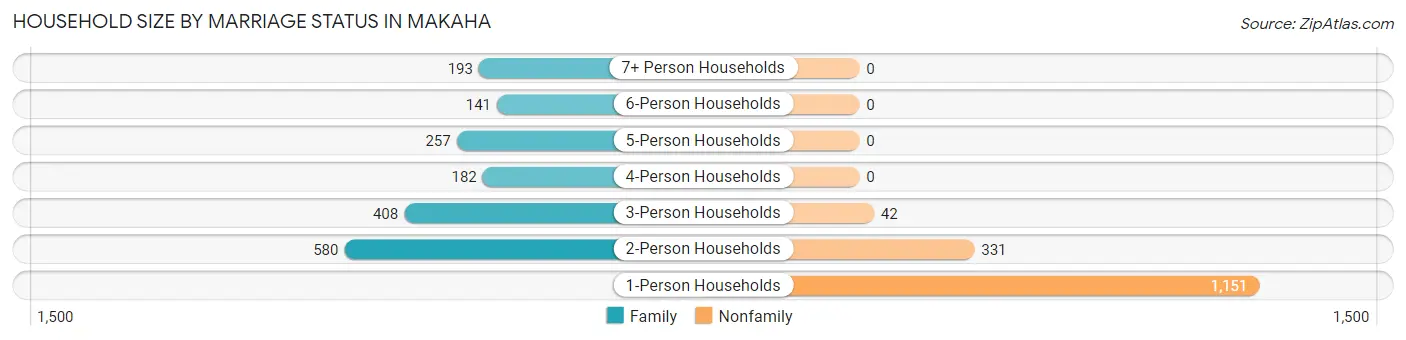
| Household Size | Family Households | Nonfamily Households |
| 1-Person Households | - | 1,151 (35.0%) |
| 2-Person Households | 580 (17.7%) | 331 (10.1%) |
| 3-Person Households | 408 (12.4%) | 42 (1.3%) |
| 4-Person Households | 182 (5.5%) | 0 (0.0%) |
| 5-Person Households | 257 (7.8%) | 0 (0.0%) |
| 6-Person Households | 141 (4.3%) | 0 (0.0%) |
| 7+ Person Households | 193 (5.9%) | 0 (0.0%) |
| Total | 1,761 (53.6%) | 1,524 (46.4%) |
Female Fertility in Makaha
Fertility by Age in Makaha
Average fertility rate in Makaha is 59.0 births per 1,000 women. Women in the age bracket of 20 to 34 years have the highest fertility rate with 121.0 births per 1,000 women. Women in the age bracket of 20 to 34 years acount for 72.2% of all women with births.
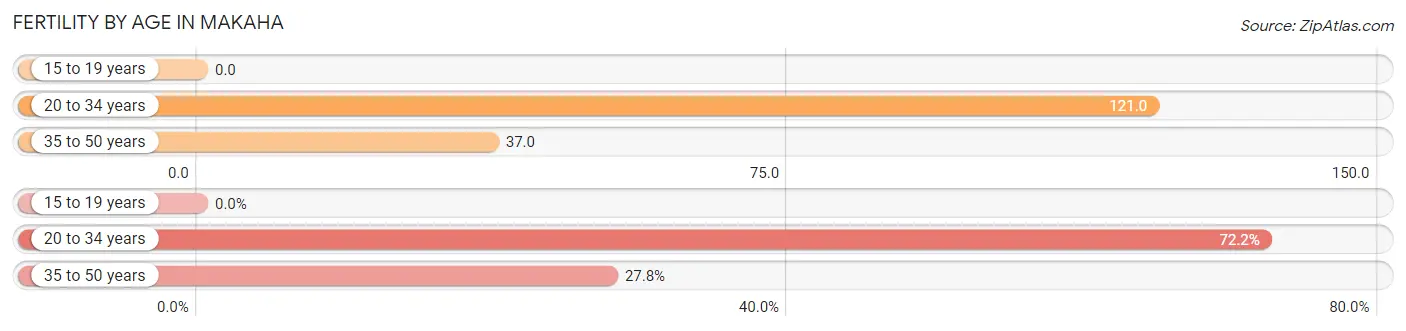
| Age Bracket | Women with Births | Births / 1,000 Women |
| 15 to 19 years | 0 (0.0%) | 0.0 |
| 20 to 34 years | 96 (72.2%) | 121.0 |
| 35 to 50 years | 37 (27.8%) | 37.0 |
| Total | 133 (100.0%) | 59.0 |
Fertility by Age by Marriage Status in Makaha
47.4% of women with births (133) in Makaha are married. The highest percentage of unmarried women with births falls into 20 to 34 years age bracket with 72.9% of them unmarried at the time of birth, while the lowest percentage of unmarried women with births belong to 35 to 50 years age bracket with 0.0% of them unmarried.
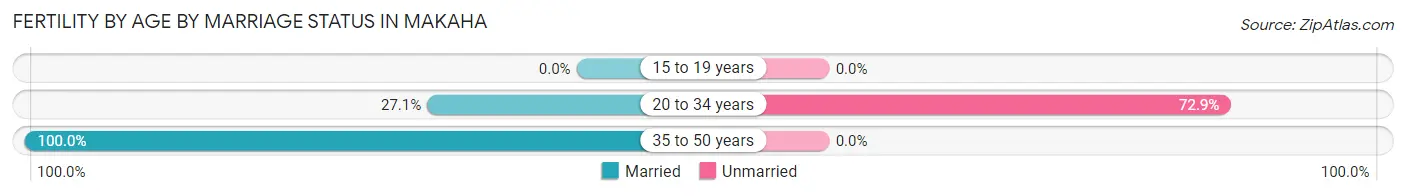
| Age Bracket | Married | Unmarried |
| 15 to 19 years | 0 (0.0%) | 0 (0.0%) |
| 20 to 34 years | 26 (27.1%) | 70 (72.9%) |
| 35 to 50 years | 37 (100.0%) | 0 (0.0%) |
| Total | 63 (47.4%) | 70 (52.6%) |
Fertility by Education in Makaha
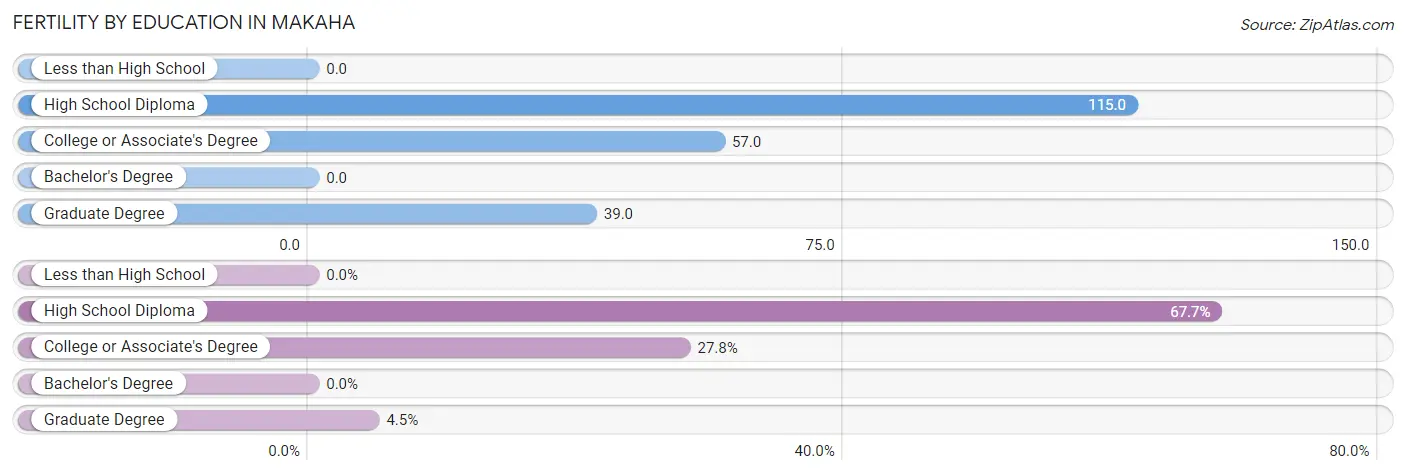
| Educational Attainment | Women with Births | Births / 1,000 Women |
| Less than High School | 0 (0.0%) | 0.0 |
| High School Diploma | 90 (67.7%) | 115.0 |
| College or Associate's Degree | 37 (27.8%) | 57.0 |
| Bachelor's Degree | 0 (0.0%) | 0.0 |
| Graduate Degree | 6 (4.5%) | 39.0 |
| Total | 133 (100.0%) | 59.0 |
Fertility by Education by Marriage Status in Makaha
52.6% of women with births in Makaha are unmarried. Women with the educational attainment of high school diploma are most likely to be married with 52.2% of them married at childbirth, while women with the educational attainment of graduate degree are least likely to be married with 100.0% of them unmarried at childbirth.
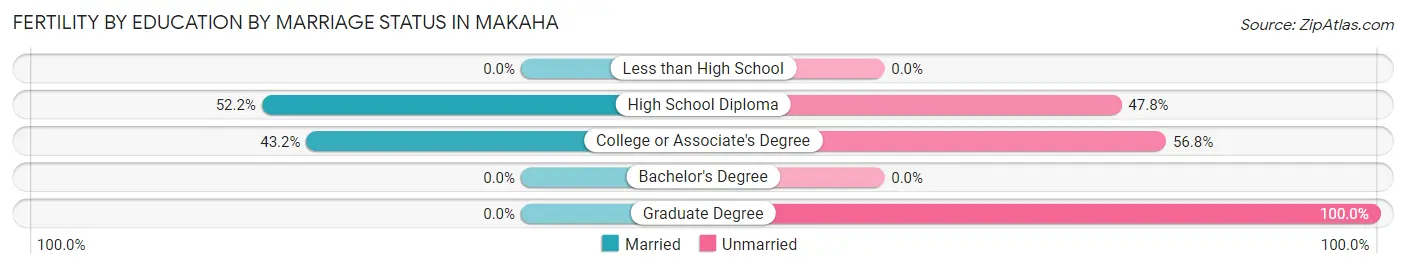
| Educational Attainment | Married | Unmarried |
| Less than High School | 0 (0.0%) | 0 (0.0%) |
| High School Diploma | 47 (52.2%) | 43 (47.8%) |
| College or Associate's Degree | 16 (43.2%) | 21 (56.8%) |
| Bachelor's Degree | 0 (0.0%) | 0 (0.0%) |
| Graduate Degree | 0 (0.0%) | 6 (100.0%) |
| Total | 63 (47.4%) | 70 (52.6%) |
Employment Characteristics in Makaha
Employment by Class of Employer in Makaha
Among the 3,299 employed individuals in Makaha, private company employees (2,139 | 64.8%), not-for-profit organizations (344 | 10.4%), and state government employees (240 | 7.3%) make up the most common classes of employment.
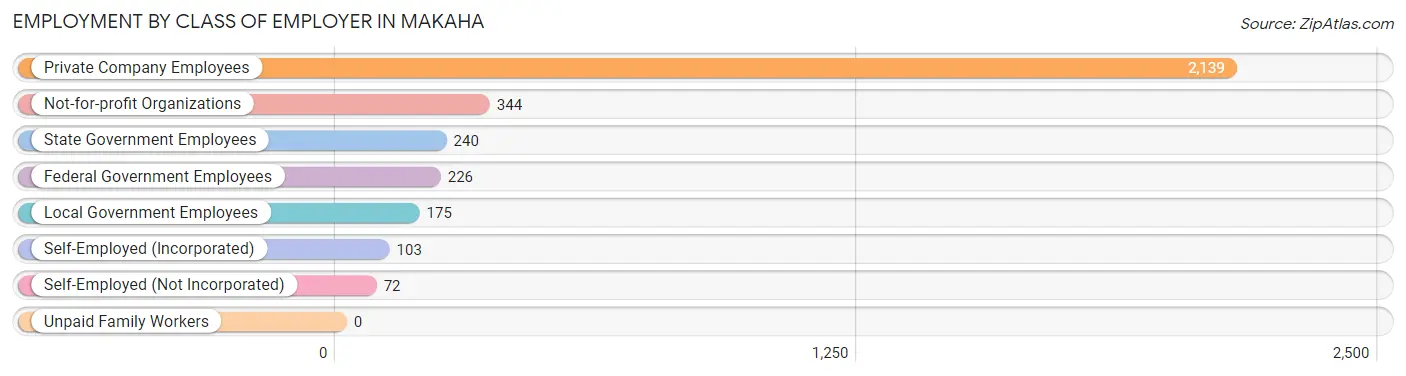
| Employer Class | # Employees | % Employees |
| Private Company Employees | 2,139 | 64.8% |
| Self-Employed (Incorporated) | 103 | 3.1% |
| Self-Employed (Not Incorporated) | 72 | 2.2% |
| Not-for-profit Organizations | 344 | 10.4% |
| Local Government Employees | 175 | 5.3% |
| State Government Employees | 240 | 7.3% |
| Federal Government Employees | 226 | 6.9% |
| Unpaid Family Workers | 0 | 0.0% |
| Total | 3,299 | 100.0% |
Employment Status by Age in Makaha
According to the labor force statistics for Makaha, out of the total population over 16 years of age (7,482), 50.4% or 3,771 individuals are in the labor force, with 9.7% or 366 of them unemployed. The age group with the highest labor force participation rate is 35 to 44 years, with 75.2% or 1,145 individuals in the labor force. Within the labor force, the 16 to 19 years age range has the highest percentage of unemployed individuals, with 42.7% or 44 of them being unemployed.
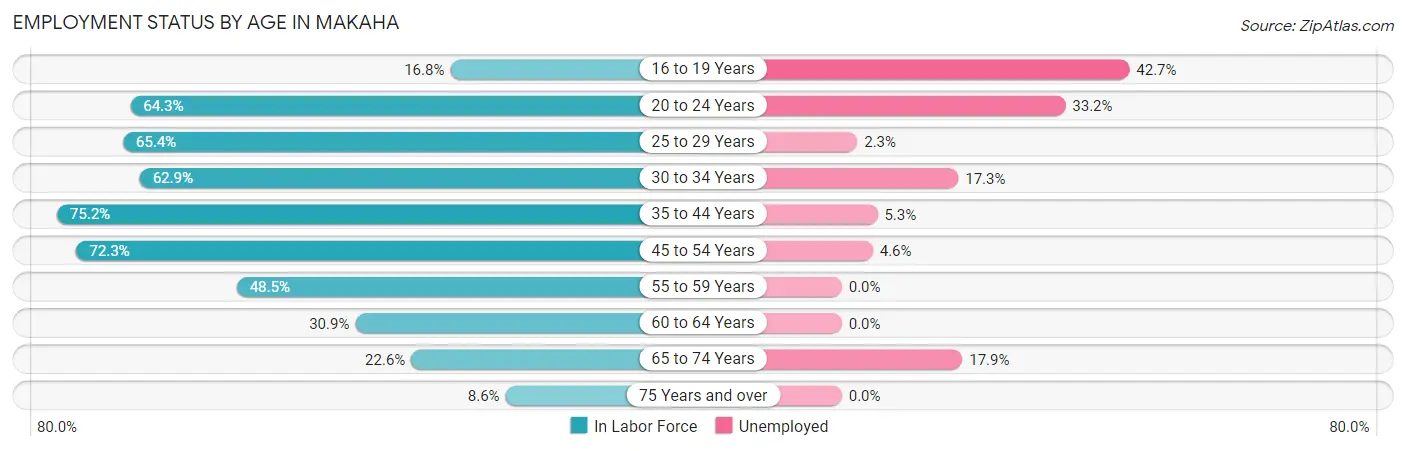
| Age Bracket | In Labor Force | Unemployed |
| 16 to 19 Years | 103 (16.8%) | 44 (42.7%) |
| 20 to 24 Years | 389 (64.3%) | 129 (33.2%) |
| 25 to 29 Years | 333 (65.4%) | 8 (2.3%) |
| 30 to 34 Years | 291 (62.9%) | 50 (17.3%) |
| 35 to 44 Years | 1,145 (75.2%) | 61 (5.3%) |
| 45 to 54 Years | 694 (72.3%) | 32 (4.6%) |
| 55 to 59 Years | 329 (48.5%) | 0 (0.0%) |
| 60 to 64 Years | 219 (30.9%) | 0 (0.0%) |
| 65 to 74 Years | 240 (22.6%) | 43 (17.9%) |
| 75 Years and over | 31 (8.6%) | 0 (0.0%) |
| Total | 3,771 (50.4%) | 366 (9.7%) |
Employment Status by Educational Attainment in Makaha
According to labor force statistics for Makaha, 62.2% of individuals (3,011) out of the total population between 25 and 64 years of age (4,841) are in the labor force, with 4.9% or 148 of them being unemployed. The group with the highest labor force participation rate are those with the educational attainment of bachelor's degree or higher, with 87.8% or 667 individuals in the labor force. Within the labor force, individuals with less than high school education have the highest percentage of unemployment, with 11.7% or 23 of them being unemployed.
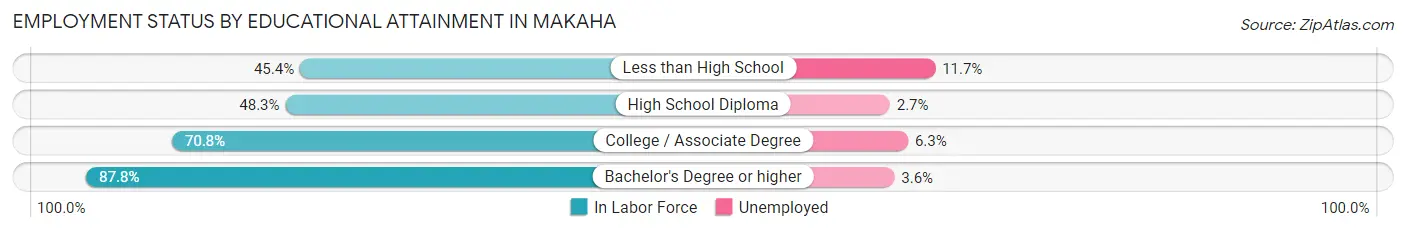
| Educational Attainment | In Labor Force | Unemployed |
| Less than High School | 196 (45.4%) | 51 (11.7%) |
| High School Diploma | 936 (48.3%) | 52 (2.7%) |
| College / Associate Degree | 1,211 (70.8%) | 108 (6.3%) |
| Bachelor's Degree or higher | 667 (87.8%) | 27 (3.6%) |
| Total | 3,011 (62.2%) | 237 (4.9%) |
Employment Occupations by Sex in Makaha
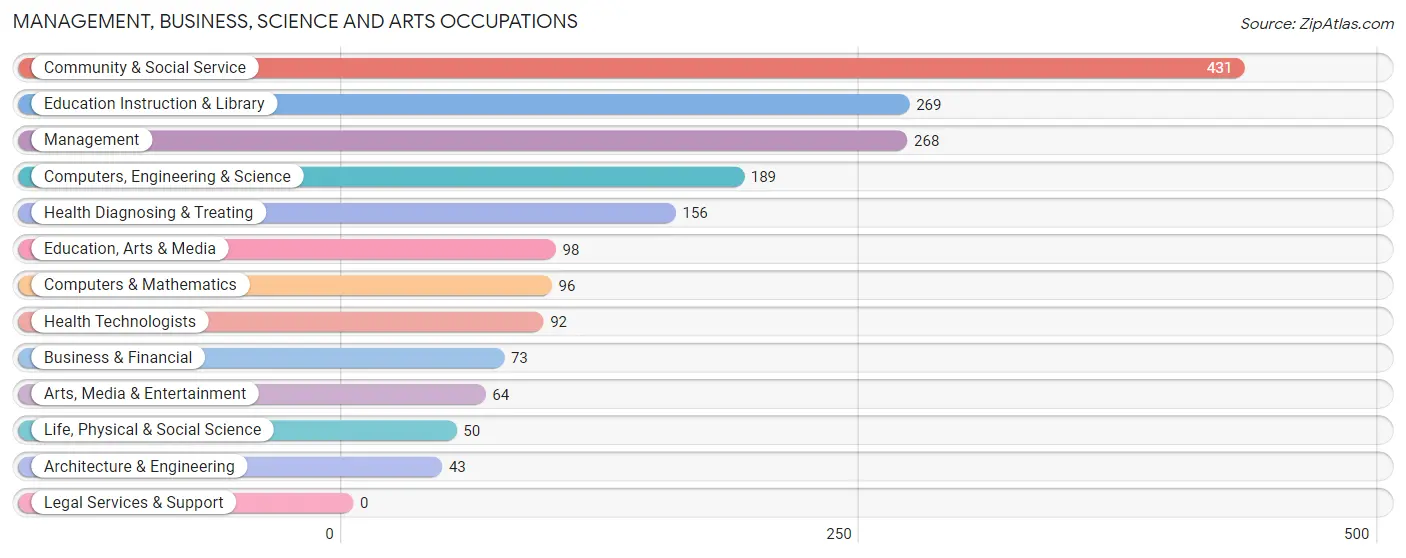
Management, Business, Science and Arts Occupations
The most common Management, Business, Science and Arts occupations in Makaha are Community & Social Service (431 | 12.9%), Education Instruction & Library (269 | 8.0%), Management (268 | 8.0%), Computers, Engineering & Science (189 | 5.7%), and Health Diagnosing & Treating (156 | 4.7%).
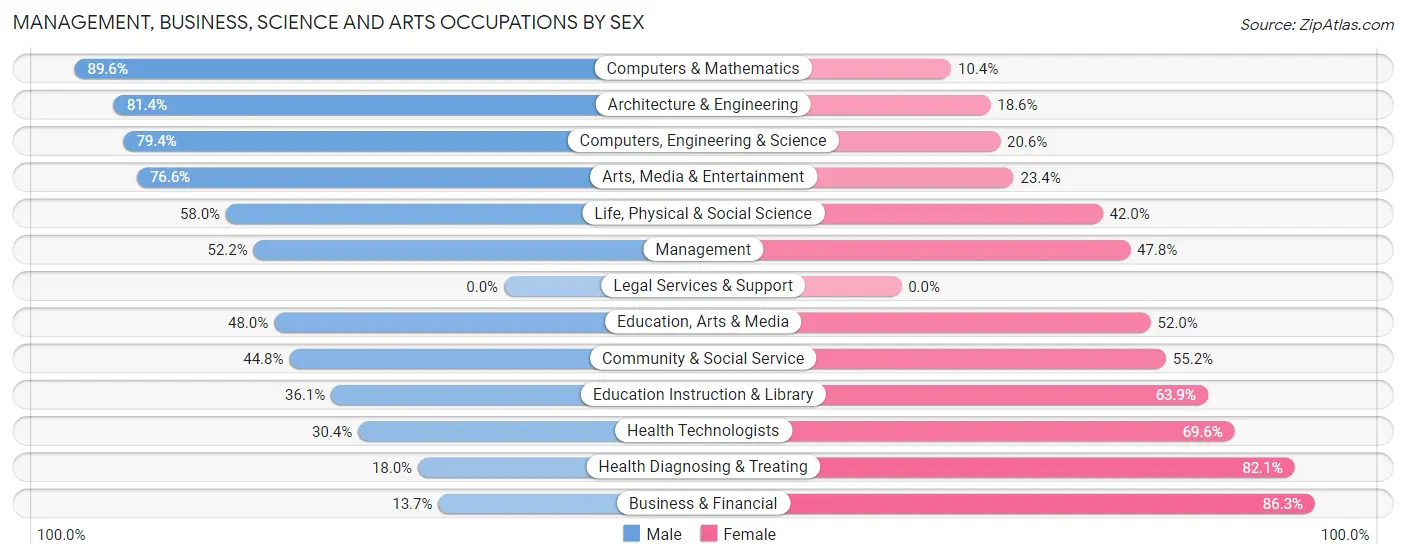
Management, Business, Science and Arts Occupations by Sex
Within the Management, Business, Science and Arts occupations in Makaha, the most male-oriented occupations are Computers & Mathematics (89.6%), Architecture & Engineering (81.4%), and Computers, Engineering & Science (79.4%), while the most female-oriented occupations are Business & Financial (86.3%), Health Diagnosing & Treating (82.1%), and Health Technologists (69.6%).
| Occupation | Male | Female |
| Management | 140 (52.2%) | 128 (47.8%) |
| Business & Financial | 10 (13.7%) | 63 (86.3%) |
| Computers, Engineering & Science | 150 (79.4%) | 39 (20.6%) |
| Computers & Mathematics | 86 (89.6%) | 10 (10.4%) |
| Architecture & Engineering | 35 (81.4%) | 8 (18.6%) |
| Life, Physical & Social Science | 29 (58.0%) | 21 (42.0%) |
| Community & Social Service | 193 (44.8%) | 238 (55.2%) |
| Education, Arts & Media | 47 (48.0%) | 51 (52.0%) |
| Legal Services & Support | 0 (0.0%) | 0 (0.0%) |
| Education Instruction & Library | 97 (36.1%) | 172 (63.9%) |
| Arts, Media & Entertainment | 49 (76.6%) | 15 (23.4%) |
| Health Diagnosing & Treating | 28 (17.9%) | 128 (82.1%) |
| Health Technologists | 28 (30.4%) | 64 (69.6%) |
| Total (Category) | 521 (46.6%) | 596 (53.4%) |
| Total (Overall) | 1,654 (49.4%) | 1,692 (50.6%) |
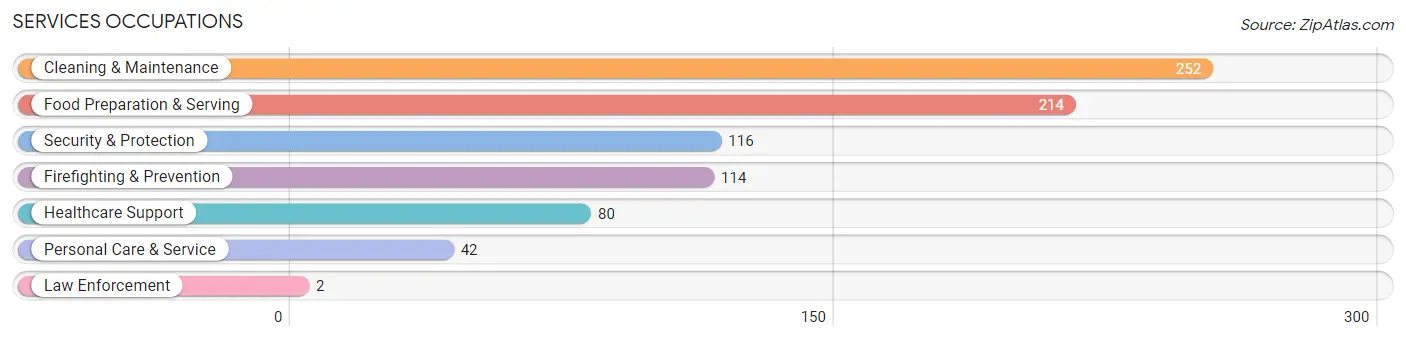
Services Occupations
The most common Services occupations in Makaha are Cleaning & Maintenance (252 | 7.5%), Food Preparation & Serving (214 | 6.4%), Security & Protection (116 | 3.5%), Firefighting & Prevention (114 | 3.4%), and Healthcare Support (80 | 2.4%).
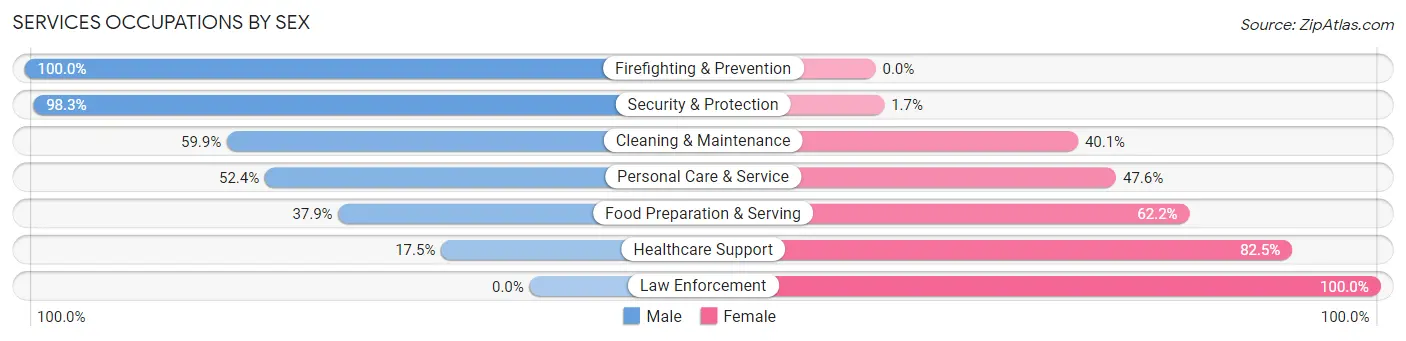
Services Occupations by Sex
Within the Services occupations in Makaha, the most male-oriented occupations are Firefighting & Prevention (100.0%), Security & Protection (98.3%), and Cleaning & Maintenance (59.9%), while the most female-oriented occupations are Law Enforcement (100.0%), Healthcare Support (82.5%), and Food Preparation & Serving (62.2%).
| Occupation | Male | Female |
| Healthcare Support | 14 (17.5%) | 66 (82.5%) |
| Security & Protection | 114 (98.3%) | 2 (1.7%) |
| Firefighting & Prevention | 114 (100.0%) | 0 (0.0%) |
| Law Enforcement | 0 (0.0%) | 2 (100.0%) |
| Food Preparation & Serving | 81 (37.9%) | 133 (62.2%) |
| Cleaning & Maintenance | 151 (59.9%) | 101 (40.1%) |
| Personal Care & Service | 22 (52.4%) | 20 (47.6%) |
| Total (Category) | 382 (54.3%) | 322 (45.7%) |
| Total (Overall) | 1,654 (49.4%) | 1,692 (50.6%) |
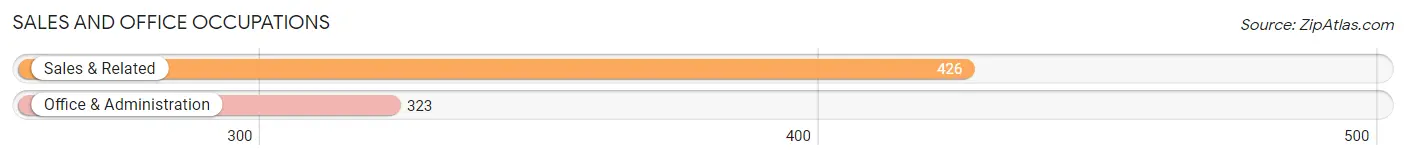
Sales and Office Occupations
The most common Sales and Office occupations in Makaha are Sales & Related (426 | 12.7%), and Office & Administration (323 | 9.7%).
Sales and Office Occupations by Sex
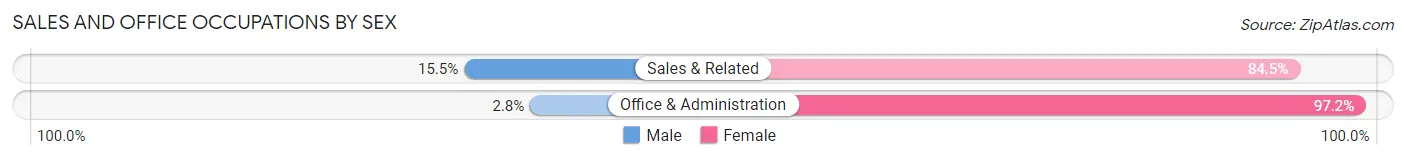
| Occupation | Male | Female |
| Sales & Related | 66 (15.5%) | 360 (84.5%) |
| Office & Administration | 9 (2.8%) | 314 (97.2%) |
| Total (Category) | 75 (10.0%) | 674 (90.0%) |
| Total (Overall) | 1,654 (49.4%) | 1,692 (50.6%) |
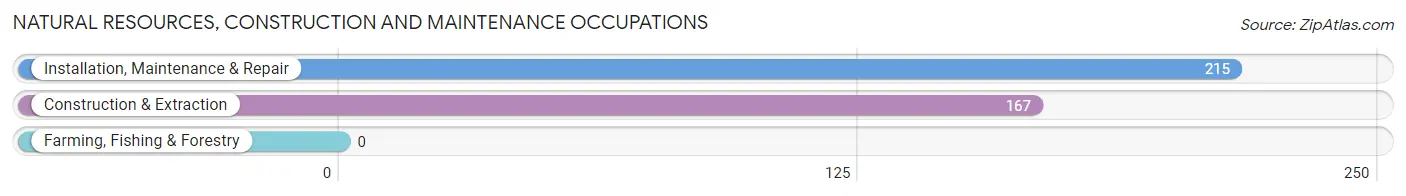
Natural Resources, Construction and Maintenance Occupations
The most common Natural Resources, Construction and Maintenance occupations in Makaha are Installation, Maintenance & Repair (215 | 6.4%), and Construction & Extraction (167 | 5.0%).
Natural Resources, Construction and Maintenance Occupations by Sex
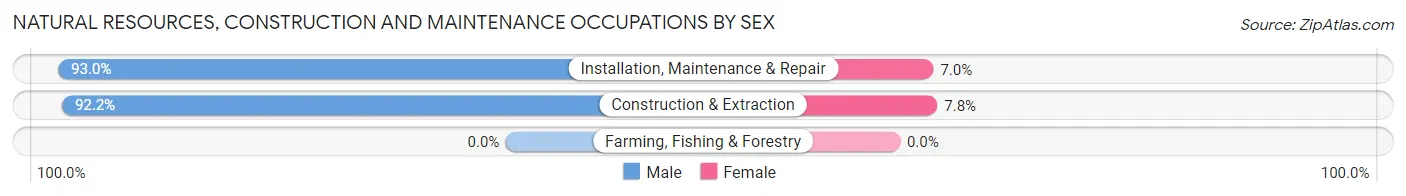
| Occupation | Male | Female |
| Farming, Fishing & Forestry | 0 (0.0%) | 0 (0.0%) |
| Construction & Extraction | 154 (92.2%) | 13 (7.8%) |
| Installation, Maintenance & Repair | 200 (93.0%) | 15 (7.0%) |
| Total (Category) | 354 (92.7%) | 28 (7.3%) |
| Total (Overall) | 1,654 (49.4%) | 1,692 (50.6%) |
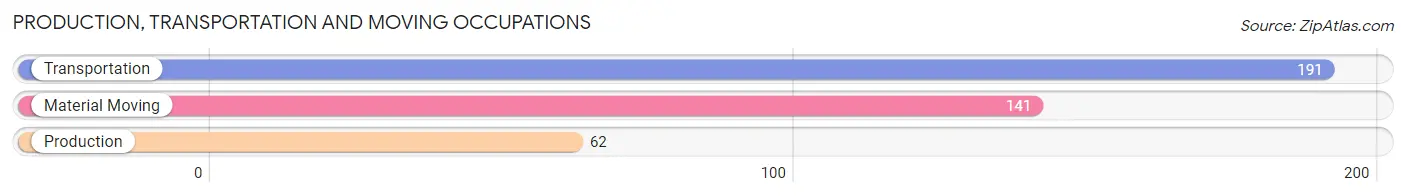
Production, Transportation and Moving Occupations
The most common Production, Transportation and Moving occupations in Makaha are Transportation (191 | 5.7%), Material Moving (141 | 4.2%), and Production (62 | 1.8%).
Production, Transportation and Moving Occupations by Sex
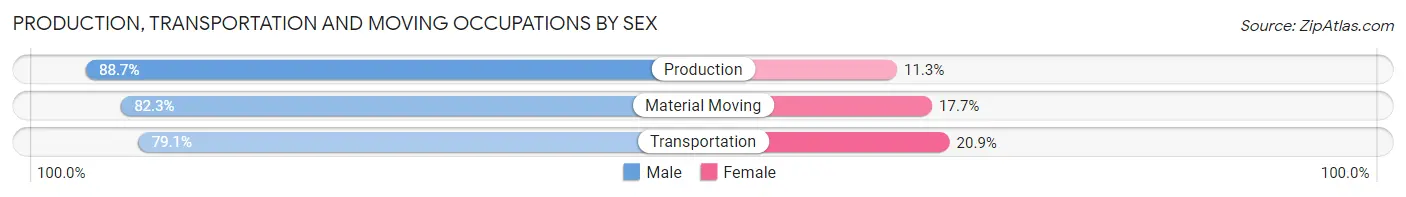
| Occupation | Male | Female |
| Production | 55 (88.7%) | 7 (11.3%) |
| Transportation | 151 (79.1%) | 40 (20.9%) |
| Material Moving | 116 (82.3%) | 25 (17.7%) |
| Total (Category) | 322 (81.7%) | 72 (18.3%) |
| Total (Overall) | 1,654 (49.4%) | 1,692 (50.6%) |
Employment Industries by Sex in Makaha
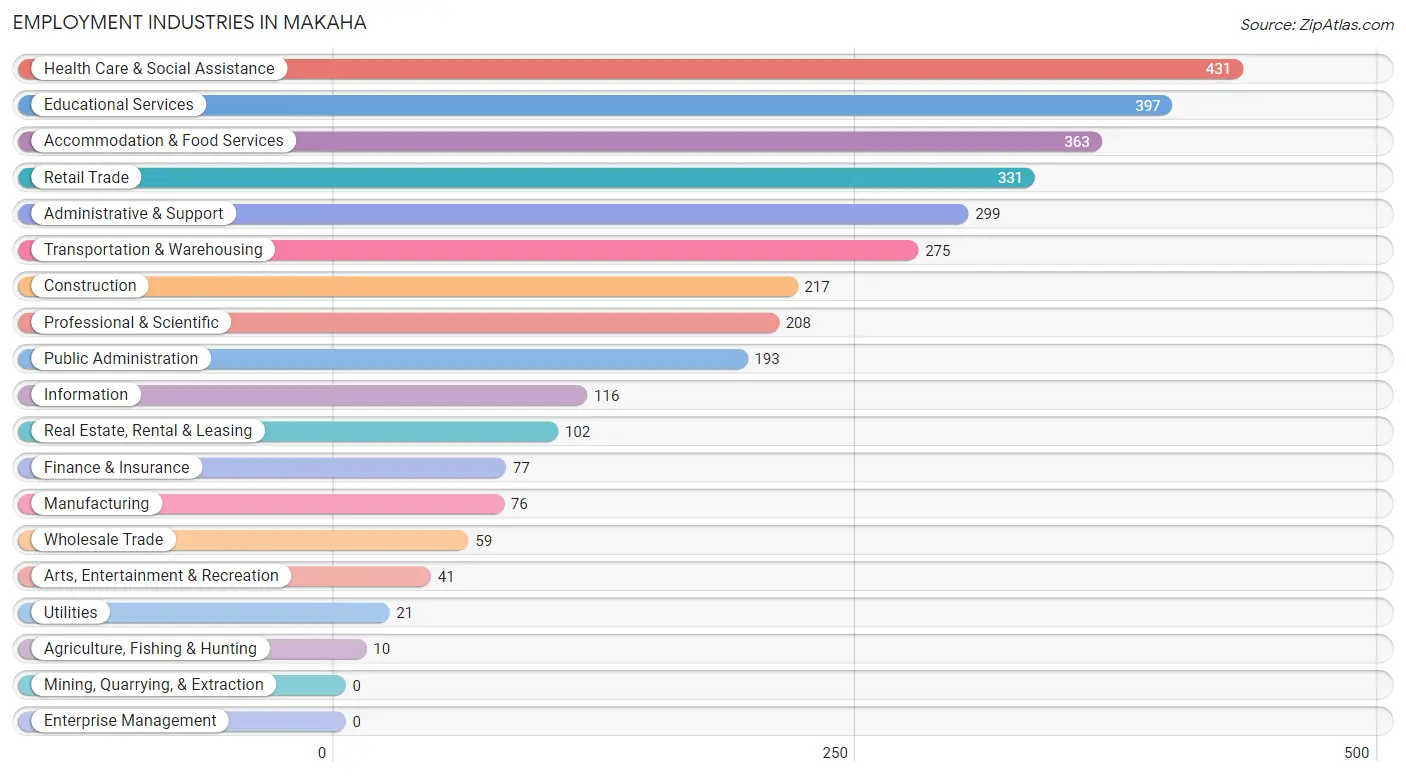
Employment Industries in Makaha
The major employment industries in Makaha include Health Care & Social Assistance (431 | 12.9%), Educational Services (397 | 11.9%), Accommodation & Food Services (363 | 10.8%), Retail Trade (331 | 9.9%), and Administrative & Support (299 | 8.9%).
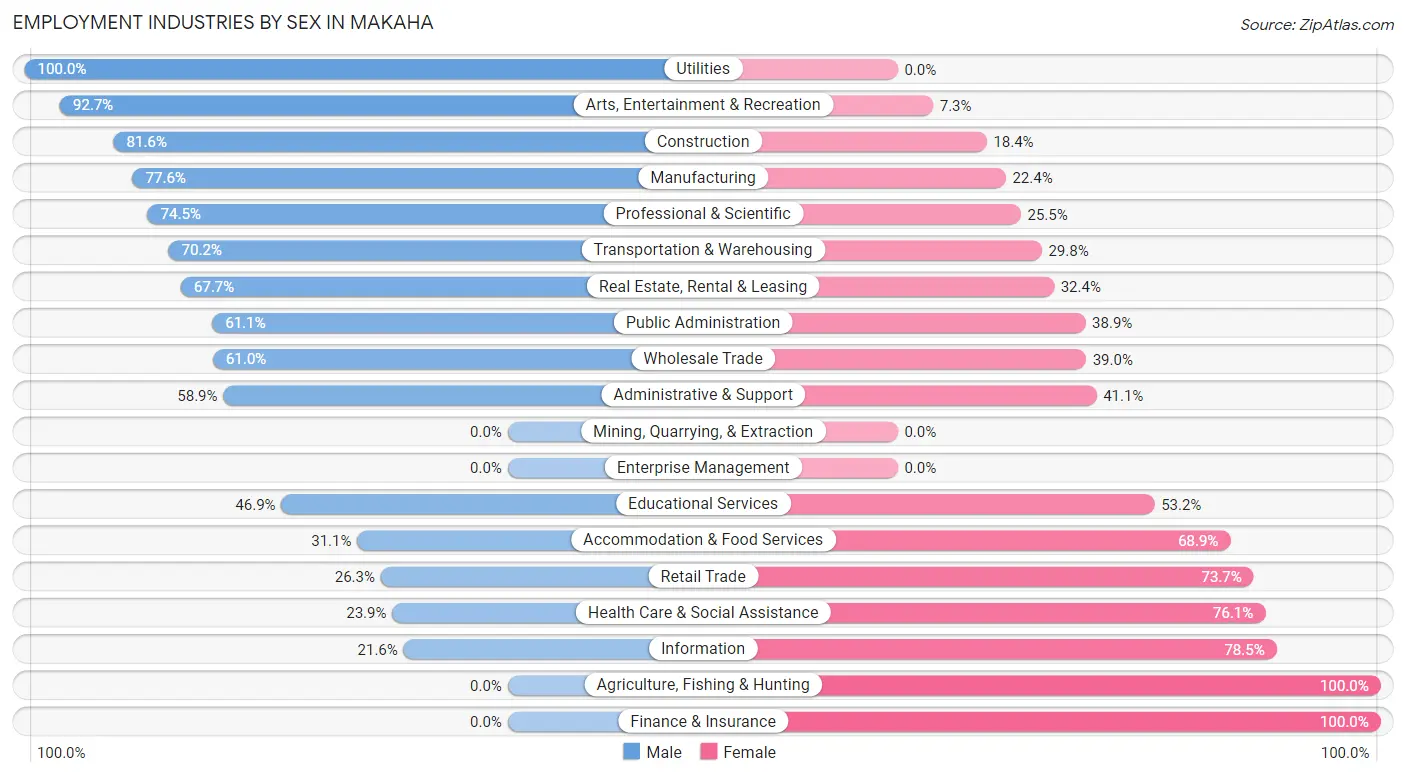
Employment Industries by Sex in Makaha
The Makaha industries that see more men than women are Utilities (100.0%), Arts, Entertainment & Recreation (92.7%), and Construction (81.6%), whereas the industries that tend to have a higher number of women are Agriculture, Fishing & Hunting (100.0%), Finance & Insurance (100.0%), and Information (78.4%).
| Industry | Male | Female |
| Agriculture, Fishing & Hunting | 0 (0.0%) | 10 (100.0%) |
| Mining, Quarrying, & Extraction | 0 (0.0%) | 0 (0.0%) |
| Construction | 177 (81.6%) | 40 (18.4%) |
| Manufacturing | 59 (77.6%) | 17 (22.4%) |
| Wholesale Trade | 36 (61.0%) | 23 (39.0%) |
| Retail Trade | 87 (26.3%) | 244 (73.7%) |
| Transportation & Warehousing | 193 (70.2%) | 82 (29.8%) |
| Utilities | 21 (100.0%) | 0 (0.0%) |
| Information | 25 (21.5%) | 91 (78.4%) |
| Finance & Insurance | 0 (0.0%) | 77 (100.0%) |
| Real Estate, Rental & Leasing | 69 (67.6%) | 33 (32.4%) |
| Professional & Scientific | 155 (74.5%) | 53 (25.5%) |
| Enterprise Management | 0 (0.0%) | 0 (0.0%) |
| Administrative & Support | 176 (58.9%) | 123 (41.1%) |
| Educational Services | 186 (46.9%) | 211 (53.1%) |
| Health Care & Social Assistance | 103 (23.9%) | 328 (76.1%) |
| Arts, Entertainment & Recreation | 38 (92.7%) | 3 (7.3%) |
| Accommodation & Food Services | 113 (31.1%) | 250 (68.9%) |
| Public Administration | 118 (61.1%) | 75 (38.9%) |
| Total | 1,654 (49.4%) | 1,692 (50.6%) |
Education in Makaha
School Enrollment in Makaha
The most common levels of schooling among the 2,517 students in Makaha are high school (779 | 30.9%), middle school (692 | 27.5%), and elementary school (374 | 14.9%).
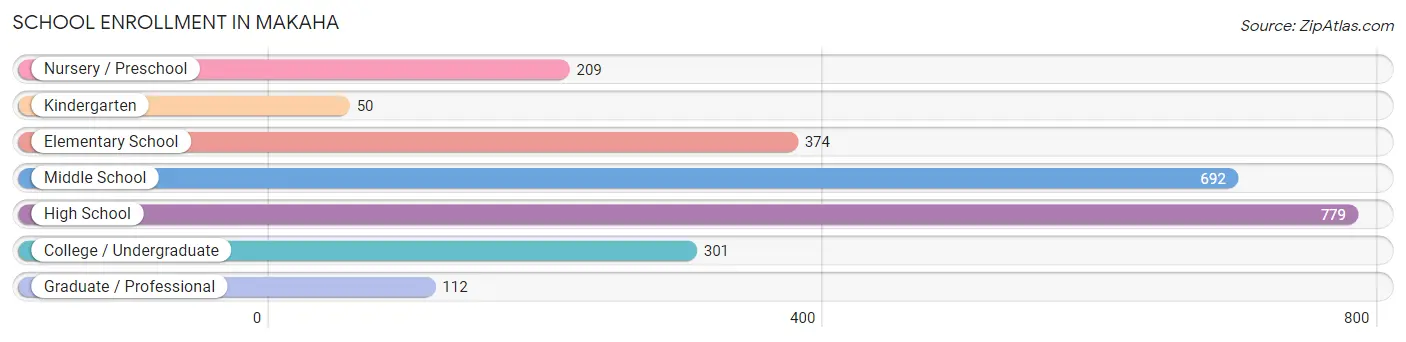
| School Level | # Students | % Students |
| Nursery / Preschool | 209 | 8.3% |
| Kindergarten | 50 | 2.0% |
| Elementary School | 374 | 14.9% |
| Middle School | 692 | 27.5% |
| High School | 779 | 30.9% |
| College / Undergraduate | 301 | 12.0% |
| Graduate / Professional | 112 | 4.4% |
| Total | 2,517 | 100.0% |
School Enrollment by Age by Funding Source in Makaha
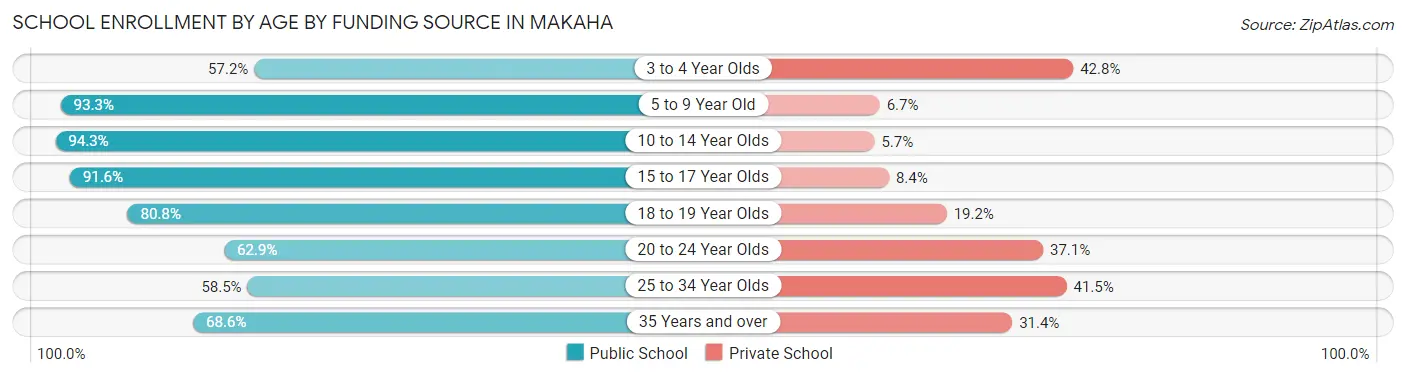
Out of a total of 2,517 students who are enrolled in schools in Makaha, 332 (13.2%) attend a private institution, while the remaining 2,185 (86.8%) are enrolled in public schools. The age group of 3 to 4 year olds has the highest likelihood of being enrolled in private schools, with 65 (42.8% in the age bracket) enrolled. Conversely, the age group of 10 to 14 year olds has the lowest likelihood of being enrolled in a private school, with 889 (94.3% in the age bracket) attending a public institution.
| Age Bracket | Public School | Private School |
| 3 to 4 Year Olds | 87 (57.2%) | 65 (42.8%) |
| 5 to 9 Year Old | 403 (93.3%) | 29 (6.7%) |
| 10 to 14 Year Olds | 889 (94.3%) | 54 (5.7%) |
| 15 to 17 Year Olds | 499 (91.6%) | 46 (8.4%) |
| 18 to 19 Year Olds | 80 (80.8%) | 19 (19.2%) |
| 20 to 24 Year Olds | 44 (62.9%) | 26 (37.1%) |
| 25 to 34 Year Olds | 31 (58.5%) | 22 (41.5%) |
| 35 Years and over | 153 (68.6%) | 70 (31.4%) |
| Total | 2,185 (86.8%) | 332 (13.2%) |
Educational Attainment by Field of Study in Makaha
Business (164 | 15.0%), education (164 | 15.0%), science & technology (163 | 14.9%), social sciences (150 | 13.8%), and literature & languages (95 | 8.7%) are the most common fields of study among 1,090 individuals in Makaha who have obtained a bachelor's degree or higher.
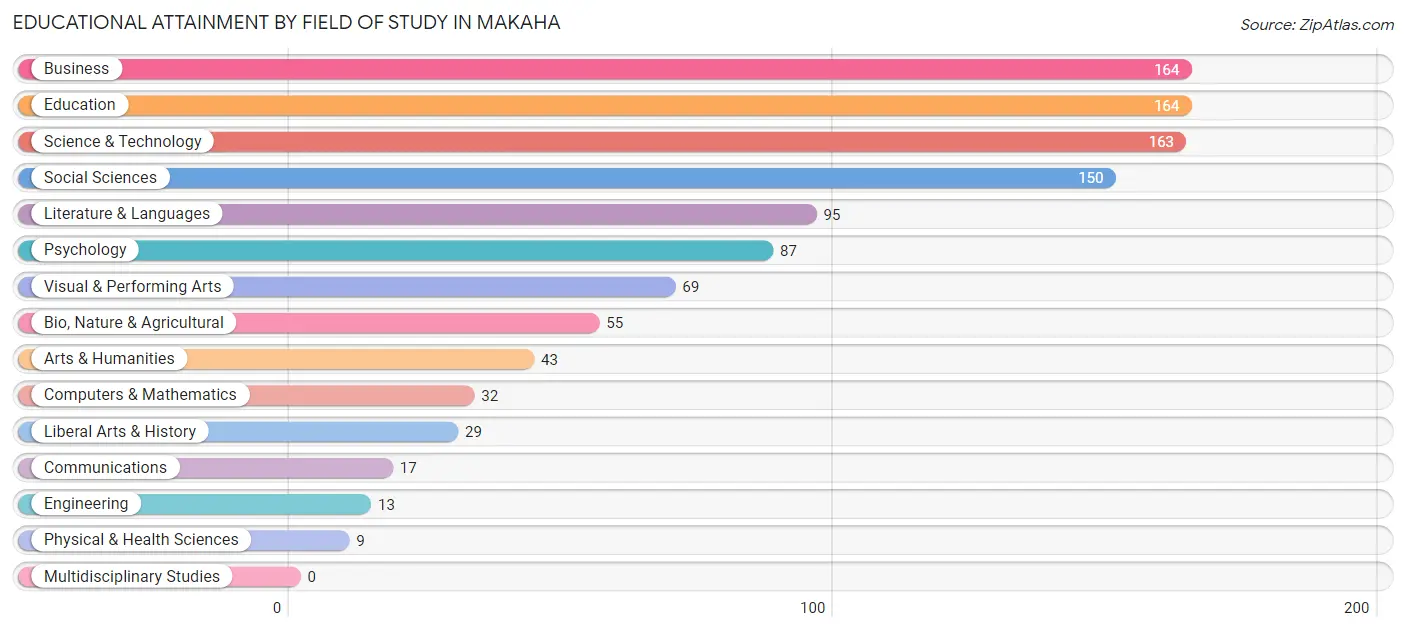
| Field of Study | # Graduates | % Graduates |
| Computers & Mathematics | 32 | 2.9% |
| Bio, Nature & Agricultural | 55 | 5.1% |
| Physical & Health Sciences | 9 | 0.8% |
| Psychology | 87 | 8.0% |
| Social Sciences | 150 | 13.8% |
| Engineering | 13 | 1.2% |
| Multidisciplinary Studies | 0 | 0.0% |
| Science & Technology | 163 | 14.9% |
| Business | 164 | 15.0% |
| Education | 164 | 15.0% |
| Literature & Languages | 95 | 8.7% |
| Liberal Arts & History | 29 | 2.7% |
| Visual & Performing Arts | 69 | 6.3% |
| Communications | 17 | 1.6% |
| Arts & Humanities | 43 | 3.9% |
| Total | 1,090 | 100.0% |
Transportation & Commute in Makaha
Vehicle Availability by Sex in Makaha
The most prevalent vehicle ownership categories in Makaha are males with 2 vehicles (704, accounting for 41.9%) and females with 2 vehicles (469, making up 43.5%).
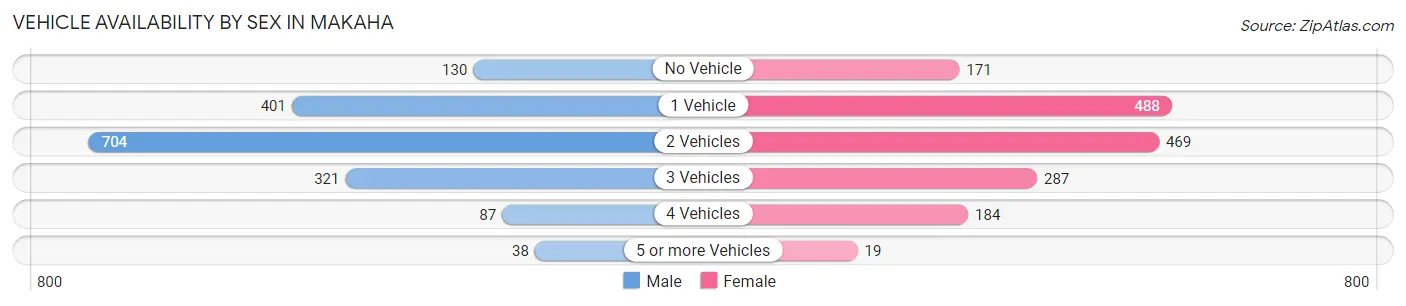
| Vehicles Available | Male | Female |
| No Vehicle | 130 (7.7%) | 171 (10.6%) |
| 1 Vehicle | 401 (23.8%) | 488 (30.2%) |
| 2 Vehicles | 704 (41.9%) | 469 (29.0%) |
| 3 Vehicles | 321 (19.1%) | 287 (17.7%) |
| 4 Vehicles | 87 (5.2%) | 184 (11.4%) |
| 5 or more Vehicles | 38 (2.3%) | 19 (1.2%) |
| Total | 1,681 (100.0%) | 1,618 (100.0%) |
Commute Time in Makaha
The most frequently occuring commute durations in Makaha are 45 to 59 minutes (707 commuters, 23.9%), 60 to 89 minutes (650 commuters, 21.9%), and 90 or more minutes (482 commuters, 16.3%).
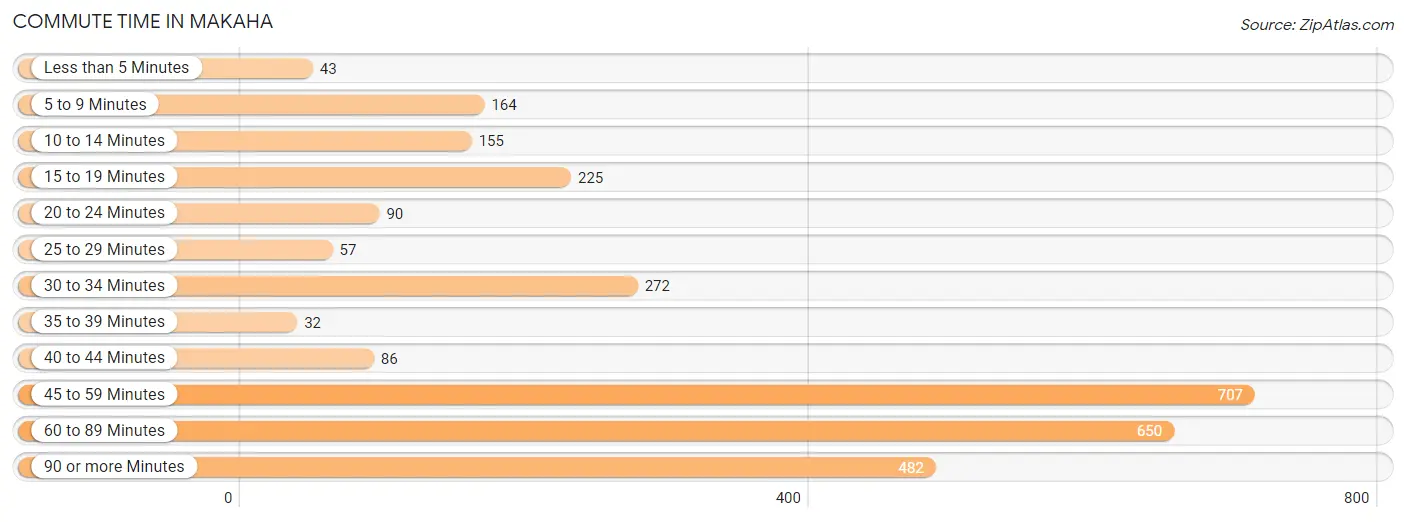
| Commute Time | # Commuters | % Commuters |
| Less than 5 Minutes | 43 | 1.5% |
| 5 to 9 Minutes | 164 | 5.5% |
| 10 to 14 Minutes | 155 | 5.2% |
| 15 to 19 Minutes | 225 | 7.6% |
| 20 to 24 Minutes | 90 | 3.0% |
| 25 to 29 Minutes | 57 | 1.9% |
| 30 to 34 Minutes | 272 | 9.2% |
| 35 to 39 Minutes | 32 | 1.1% |
| 40 to 44 Minutes | 86 | 2.9% |
| 45 to 59 Minutes | 707 | 23.9% |
| 60 to 89 Minutes | 650 | 21.9% |
| 90 or more Minutes | 482 | 16.3% |
Commute Time by Sex in Makaha
The most common commute times in Makaha are 45 to 59 minutes (500 commuters, 33.2%) for males and 60 to 89 minutes (331 commuters, 22.7%) for females.
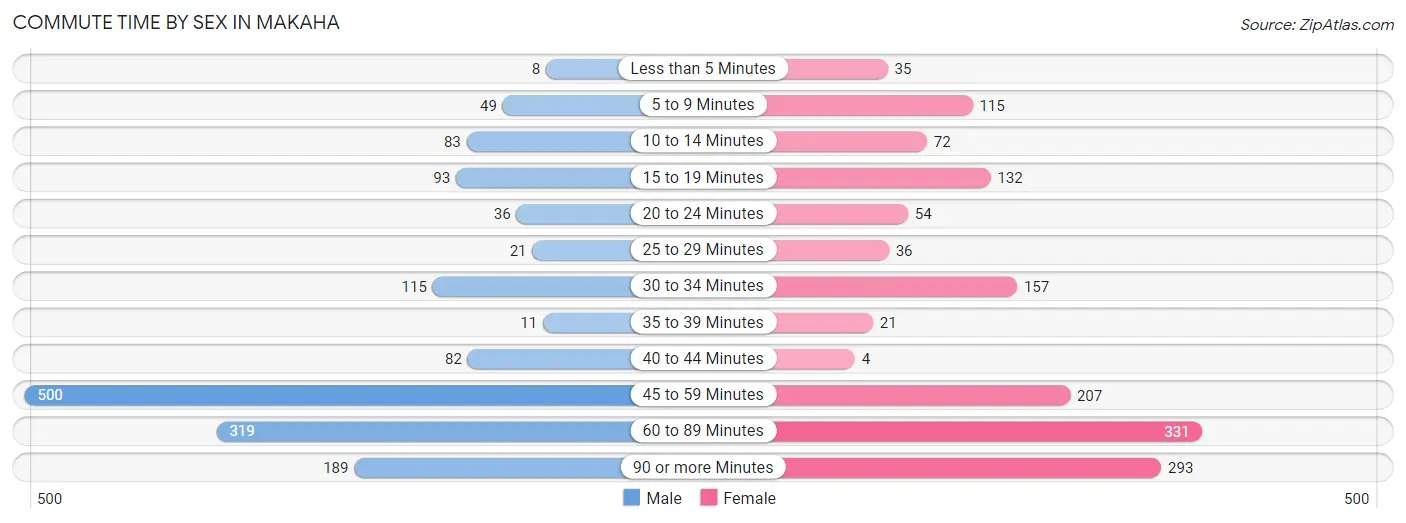
| Commute Time | Male | Female |
| Less than 5 Minutes | 8 (0.5%) | 35 (2.4%) |
| 5 to 9 Minutes | 49 (3.3%) | 115 (7.9%) |
| 10 to 14 Minutes | 83 (5.5%) | 72 (4.9%) |
| 15 to 19 Minutes | 93 (6.2%) | 132 (9.1%) |
| 20 to 24 Minutes | 36 (2.4%) | 54 (3.7%) |
| 25 to 29 Minutes | 21 (1.4%) | 36 (2.5%) |
| 30 to 34 Minutes | 115 (7.6%) | 157 (10.8%) |
| 35 to 39 Minutes | 11 (0.7%) | 21 (1.4%) |
| 40 to 44 Minutes | 82 (5.4%) | 4 (0.3%) |
| 45 to 59 Minutes | 500 (33.2%) | 207 (14.2%) |
| 60 to 89 Minutes | 319 (21.2%) | 331 (22.7%) |
| 90 or more Minutes | 189 (12.6%) | 293 (20.1%) |
Time of Departure to Work by Sex in Makaha
The most frequent times of departure to work in Makaha are 12:00 AM to 4:59 AM (336, 22.3%) for males and 7:00 AM to 7:29 AM (258, 17.7%) for females.
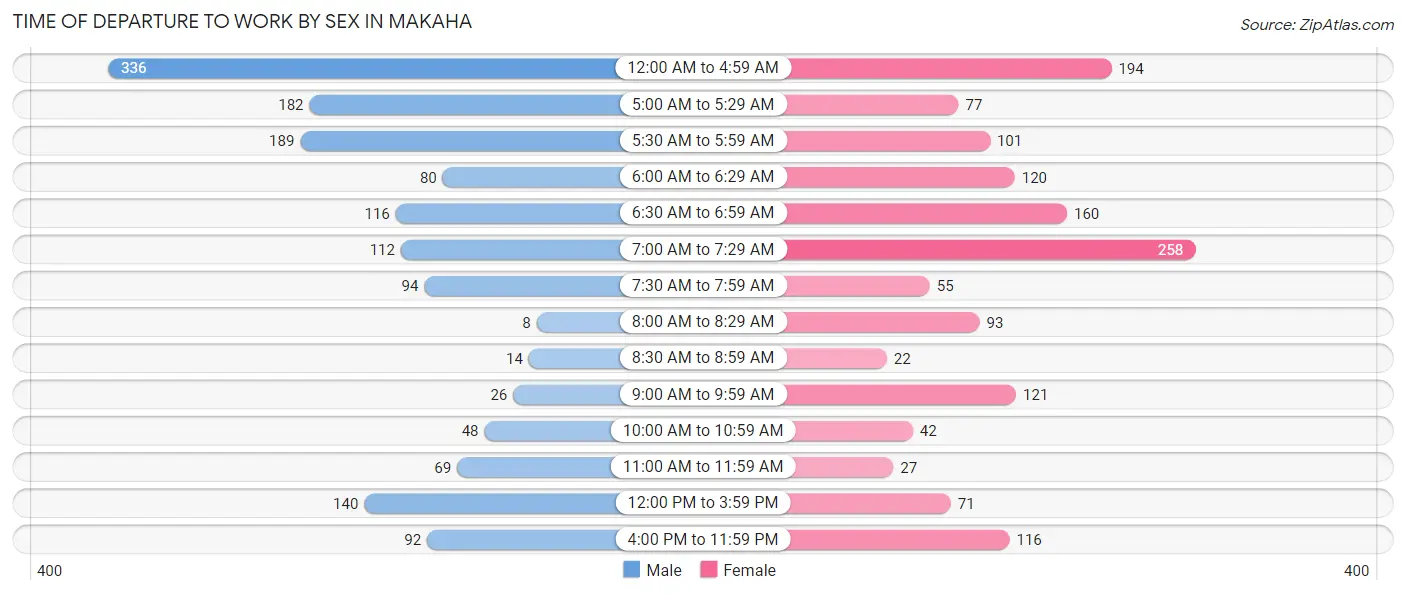
| Time of Departure | Male | Female |
| 12:00 AM to 4:59 AM | 336 (22.3%) | 194 (13.3%) |
| 5:00 AM to 5:29 AM | 182 (12.1%) | 77 (5.3%) |
| 5:30 AM to 5:59 AM | 189 (12.6%) | 101 (6.9%) |
| 6:00 AM to 6:29 AM | 80 (5.3%) | 120 (8.2%) |
| 6:30 AM to 6:59 AM | 116 (7.7%) | 160 (11.0%) |
| 7:00 AM to 7:29 AM | 112 (7.4%) | 258 (17.7%) |
| 7:30 AM to 7:59 AM | 94 (6.2%) | 55 (3.8%) |
| 8:00 AM to 8:29 AM | 8 (0.5%) | 93 (6.4%) |
| 8:30 AM to 8:59 AM | 14 (0.9%) | 22 (1.5%) |
| 9:00 AM to 9:59 AM | 26 (1.7%) | 121 (8.3%) |
| 10:00 AM to 10:59 AM | 48 (3.2%) | 42 (2.9%) |
| 11:00 AM to 11:59 AM | 69 (4.6%) | 27 (1.8%) |
| 12:00 PM to 3:59 PM | 140 (9.3%) | 71 (4.9%) |
| 4:00 PM to 11:59 PM | 92 (6.1%) | 116 (8.0%) |
| Total | 1,506 (100.0%) | 1,457 (100.0%) |
Housing Occupancy in Makaha
Occupancy by Ownership in Makaha
Of the total 3,285 dwellings in Makaha, owner-occupied units account for 1,327 (40.4%), while renter-occupied units make up 1,958 (59.6%).
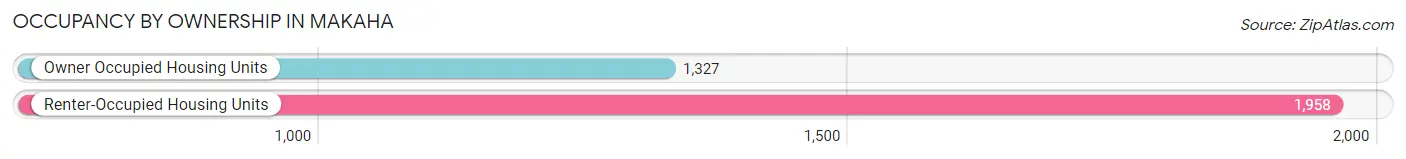
| Occupancy | # Housing Units | % Housing Units |
| Owner Occupied Housing Units | 1,327 | 40.4% |
| Renter-Occupied Housing Units | 1,958 | 59.6% |
| Total Occupied Housing Units | 3,285 | 100.0% |
Occupancy by Household Size in Makaha
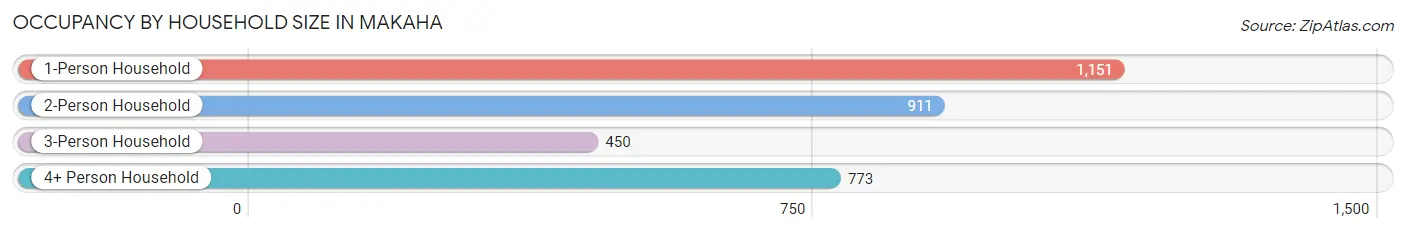
| Household Size | # Housing Units | % Housing Units |
| 1-Person Household | 1,151 | 35.0% |
| 2-Person Household | 911 | 27.7% |
| 3-Person Household | 450 | 13.7% |
| 4+ Person Household | 773 | 23.5% |
| Total Housing Units | 3,285 | 100.0% |
Occupancy by Ownership by Household Size in Makaha
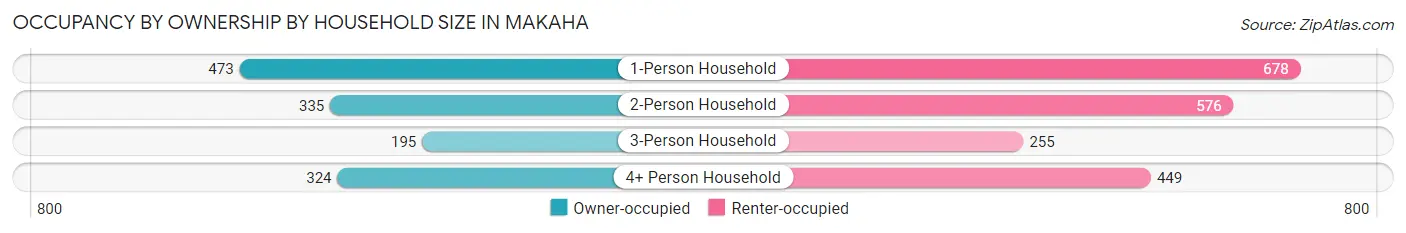
| Household Size | Owner-occupied | Renter-occupied |
| 1-Person Household | 473 (41.1%) | 678 (58.9%) |
| 2-Person Household | 335 (36.8%) | 576 (63.2%) |
| 3-Person Household | 195 (43.3%) | 255 (56.7%) |
| 4+ Person Household | 324 (41.9%) | 449 (58.1%) |
| Total Housing Units | 1,327 (40.4%) | 1,958 (59.6%) |
Occupancy by Educational Attainment in Makaha
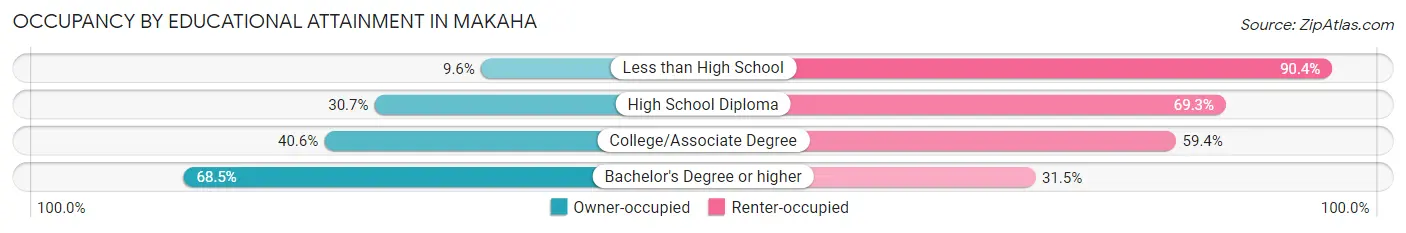
| Household Size | Owner-occupied | Renter-occupied |
| Less than High School | 26 (9.6%) | 245 (90.4%) |
| High School Diploma | 326 (30.7%) | 737 (69.3%) |
| College/Associate Degree | 527 (40.6%) | 770 (59.4%) |
| Bachelor's Degree or higher | 448 (68.5%) | 206 (31.5%) |
Occupancy by Age of Householder in Makaha
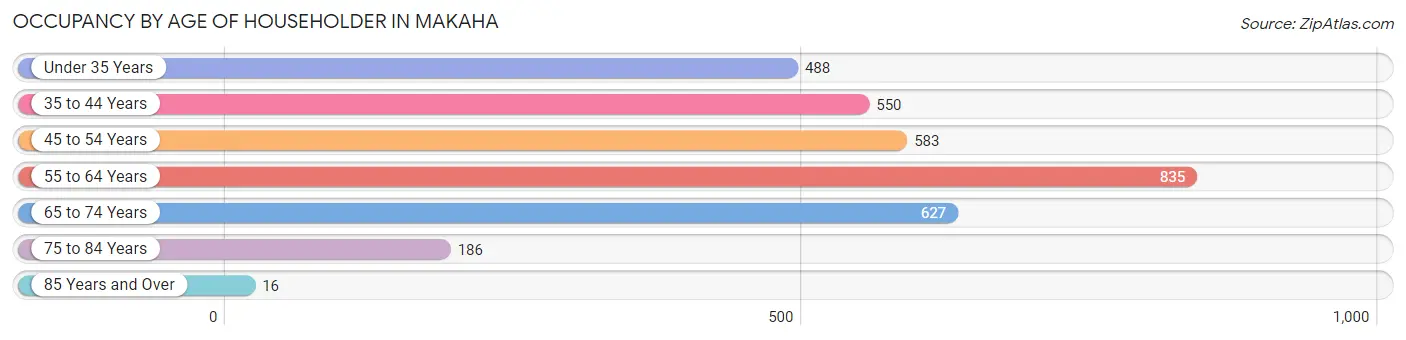
| Age Bracket | # Households | % Households |
| Under 35 Years | 488 | 14.9% |
| 35 to 44 Years | 550 | 16.7% |
| 45 to 54 Years | 583 | 17.7% |
| 55 to 64 Years | 835 | 25.4% |
| 65 to 74 Years | 627 | 19.1% |
| 75 to 84 Years | 186 | 5.7% |
| 85 Years and Over | 16 | 0.5% |
| Total | 3,285 | 100.0% |
Housing Finances in Makaha
Median Income by Occupancy in Makaha
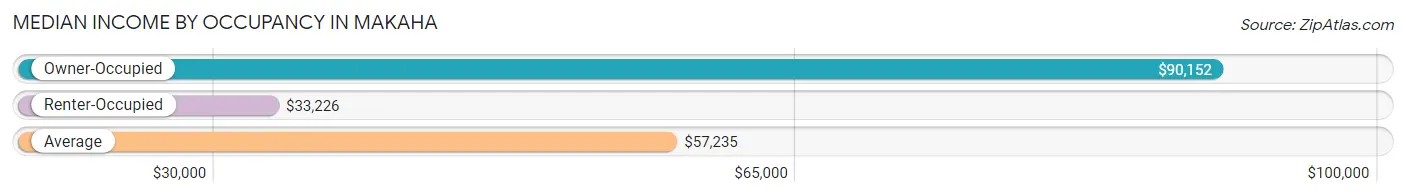
| Occupancy Type | # Households | Median Income |
| Owner-Occupied | 1,327 (40.4%) | $90,152 |
| Renter-Occupied | 1,958 (59.6%) | $33,226 |
| Average | 3,285 (100.0%) | $57,235 |
Occupancy by Householder Income Bracket in Makaha
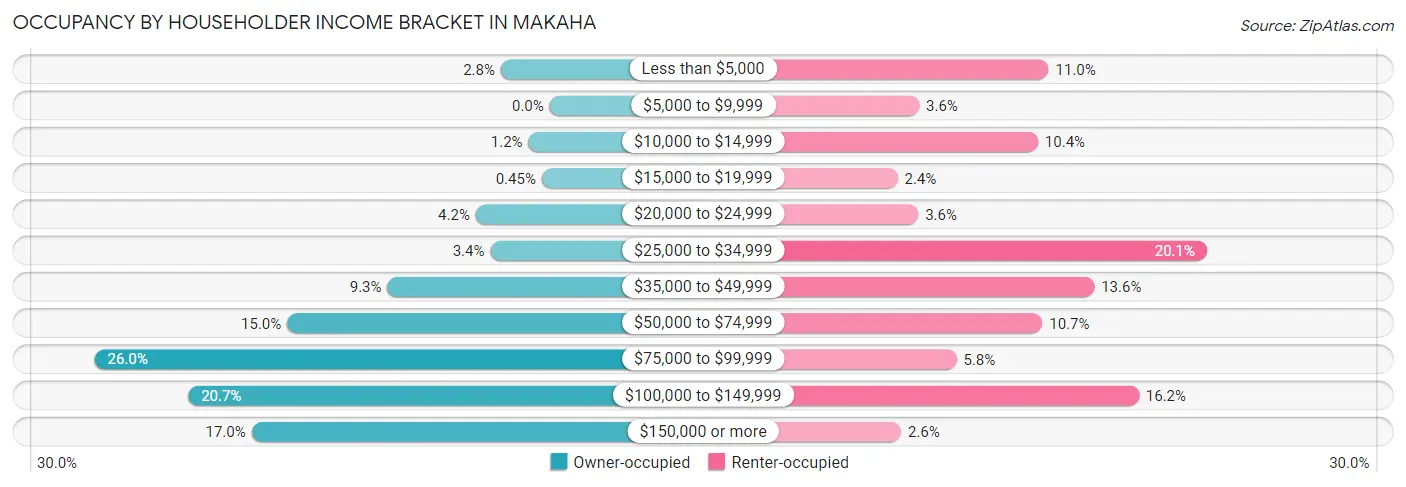
| Income Bracket | Owner-occupied | Renter-occupied |
| Less than $5,000 | 37 (2.8%) | 216 (11.0%) |
| $5,000 to $9,999 | 0 (0.0%) | 71 (3.6%) |
| $10,000 to $14,999 | 16 (1.2%) | 204 (10.4%) |
| $15,000 to $19,999 | 6 (0.4%) | 47 (2.4%) |
| $20,000 to $24,999 | 56 (4.2%) | 70 (3.6%) |
| $25,000 to $34,999 | 45 (3.4%) | 393 (20.1%) |
| $35,000 to $49,999 | 123 (9.3%) | 267 (13.6%) |
| $50,000 to $74,999 | 199 (15.0%) | 209 (10.7%) |
| $75,000 to $99,999 | 345 (26.0%) | 113 (5.8%) |
| $100,000 to $149,999 | 274 (20.6%) | 317 (16.2%) |
| $150,000 or more | 226 (17.0%) | 51 (2.6%) |
| Total | 1,327 (100.0%) | 1,958 (100.0%) |
Monthly Housing Cost Tiers in Makaha
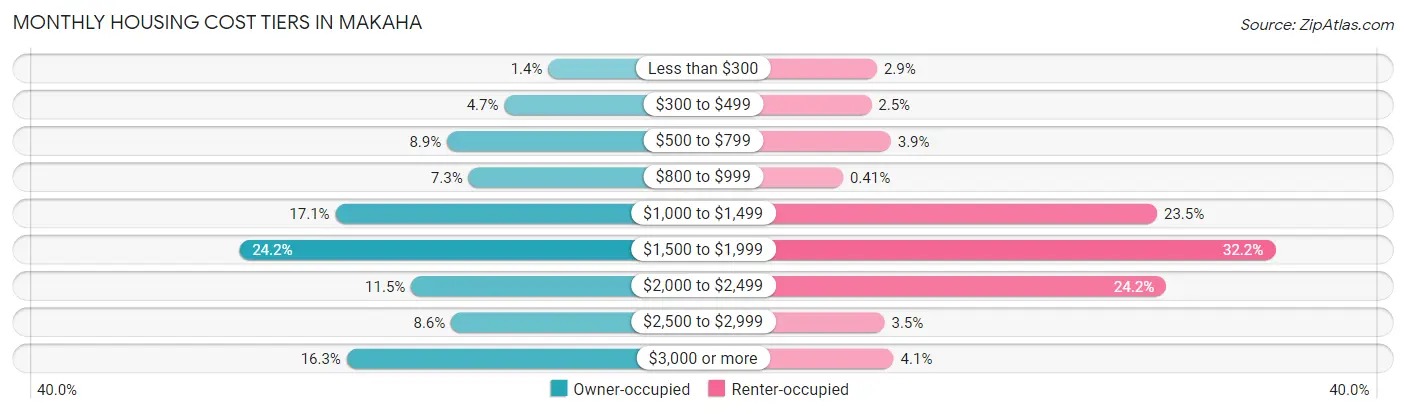
| Monthly Cost | Owner-occupied | Renter-occupied |
| Less than $300 | 19 (1.4%) | 57 (2.9%) |
| $300 to $499 | 62 (4.7%) | 49 (2.5%) |
| $500 to $799 | 118 (8.9%) | 77 (3.9%) |
| $800 to $999 | 97 (7.3%) | 8 (0.4%) |
| $1,000 to $1,499 | 227 (17.1%) | 461 (23.5%) |
| $1,500 to $1,999 | 321 (24.2%) | 631 (32.2%) |
| $2,000 to $2,499 | 153 (11.5%) | 474 (24.2%) |
| $2,500 to $2,999 | 114 (8.6%) | 68 (3.5%) |
| $3,000 or more | 216 (16.3%) | 81 (4.1%) |
| Total | 1,327 (100.0%) | 1,958 (100.0%) |
Physical Housing Characteristics in Makaha
Housing Structures in Makaha
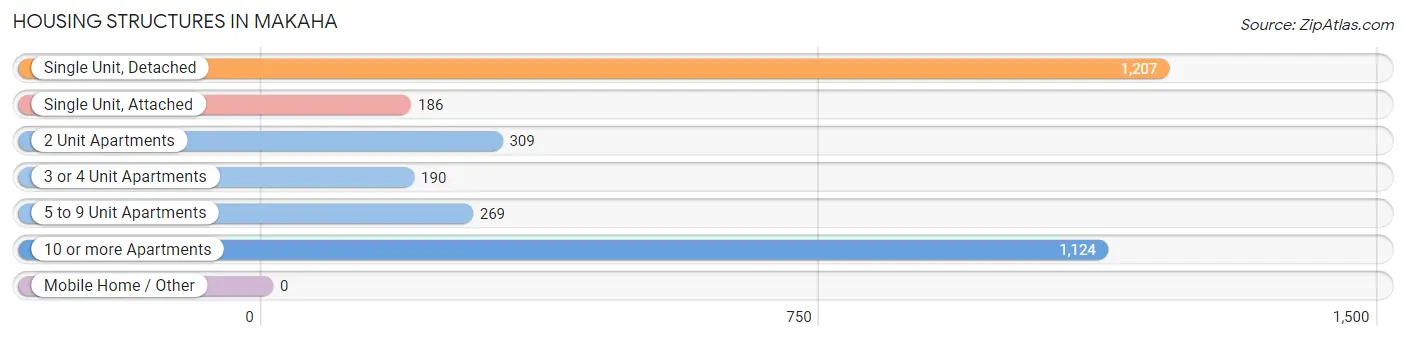
| Structure Type | # Housing Units | % Housing Units |
| Single Unit, Detached | 1,207 | 36.7% |
| Single Unit, Attached | 186 | 5.7% |
| 2 Unit Apartments | 309 | 9.4% |
| 3 or 4 Unit Apartments | 190 | 5.8% |
| 5 to 9 Unit Apartments | 269 | 8.2% |
| 10 or more Apartments | 1,124 | 34.2% |
| Mobile Home / Other | 0 | 0.0% |
| Total | 3,285 | 100.0% |
Housing Structures by Occupancy in Makaha
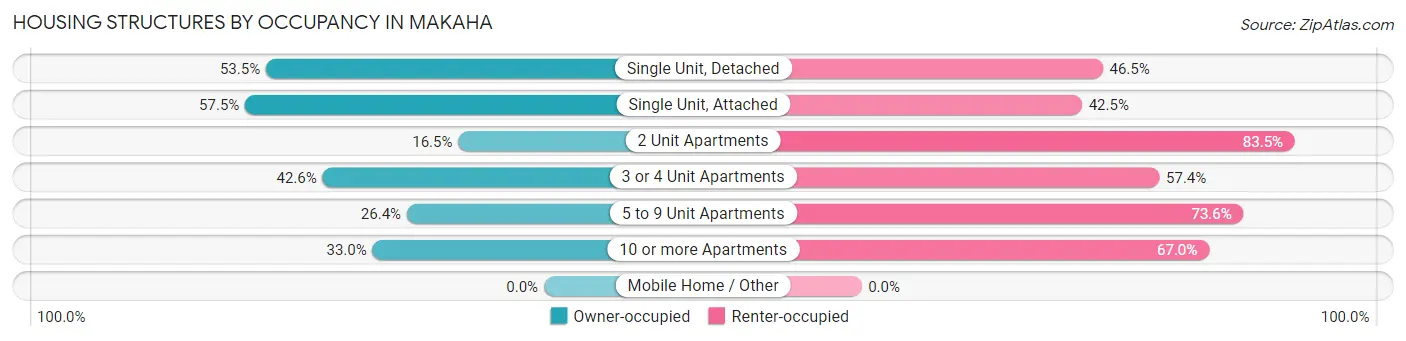
| Structure Type | Owner-occupied | Renter-occupied |
| Single Unit, Detached | 646 (53.5%) | 561 (46.5%) |
| Single Unit, Attached | 107 (57.5%) | 79 (42.5%) |
| 2 Unit Apartments | 51 (16.5%) | 258 (83.5%) |
| 3 or 4 Unit Apartments | 81 (42.6%) | 109 (57.4%) |
| 5 to 9 Unit Apartments | 71 (26.4%) | 198 (73.6%) |
| 10 or more Apartments | 371 (33.0%) | 753 (67.0%) |
| Mobile Home / Other | 0 (0.0%) | 0 (0.0%) |
| Total | 1,327 (40.4%) | 1,958 (59.6%) |
Housing Structures by Number of Rooms in Makaha
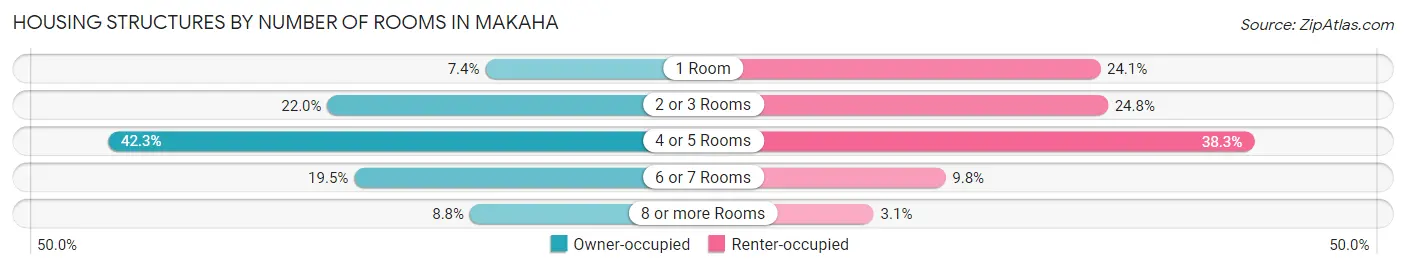
| Number of Rooms | Owner-occupied | Renter-occupied |
| 1 Room | 98 (7.4%) | 471 (24.1%) |
| 2 or 3 Rooms | 292 (22.0%) | 485 (24.8%) |
| 4 or 5 Rooms | 561 (42.3%) | 750 (38.3%) |
| 6 or 7 Rooms | 259 (19.5%) | 191 (9.8%) |
| 8 or more Rooms | 117 (8.8%) | 61 (3.1%) |
| Total | 1,327 (100.0%) | 1,958 (100.0%) |
Housing Structure by Heating Type in Makaha
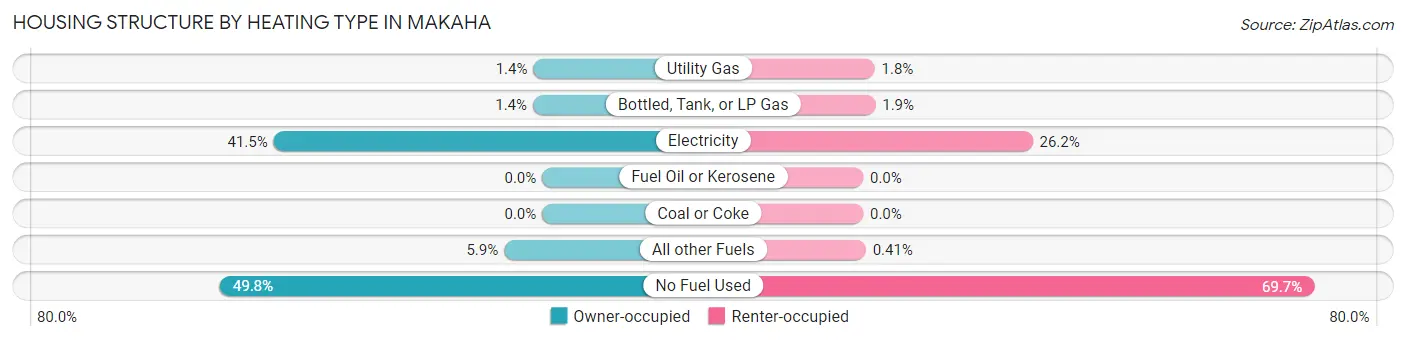
| Heating Type | Owner-occupied | Renter-occupied |
| Utility Gas | 18 (1.4%) | 35 (1.8%) |
| Bottled, Tank, or LP Gas | 19 (1.4%) | 37 (1.9%) |
| Electricity | 551 (41.5%) | 513 (26.2%) |
| Fuel Oil or Kerosene | 0 (0.0%) | 0 (0.0%) |
| Coal or Coke | 0 (0.0%) | 0 (0.0%) |
| All other Fuels | 78 (5.9%) | 8 (0.4%) |
| No Fuel Used | 661 (49.8%) | 1,365 (69.7%) |
| Total | 1,327 (100.0%) | 1,958 (100.0%) |
Household Vehicle Usage in Makaha
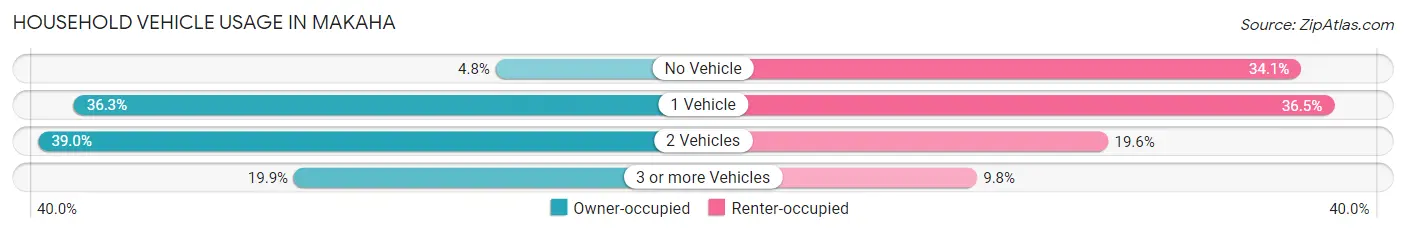
| Vehicles per Household | Owner-occupied | Renter-occupied |
| No Vehicle | 64 (4.8%) | 667 (34.1%) |
| 1 Vehicle | 482 (36.3%) | 715 (36.5%) |
| 2 Vehicles | 517 (39.0%) | 384 (19.6%) |
| 3 or more Vehicles | 264 (19.9%) | 192 (9.8%) |
| Total | 1,327 (100.0%) | 1,958 (100.0%) |
Real Estate & Mortgages in Makaha
Real Estate and Mortgage Overview in Makaha
| Characteristic | Without Mortgage | With Mortgage |
| Housing Units | 350 | 977 |
| Median Property Value | $266,200 | $438,400 |
| Median Household Income | $54,615 | $181 |
| Monthly Housing Costs | $782 | $216 |
| Real Estate Taxes | $563 | $114 |
Property Value by Mortgage Status in Makaha
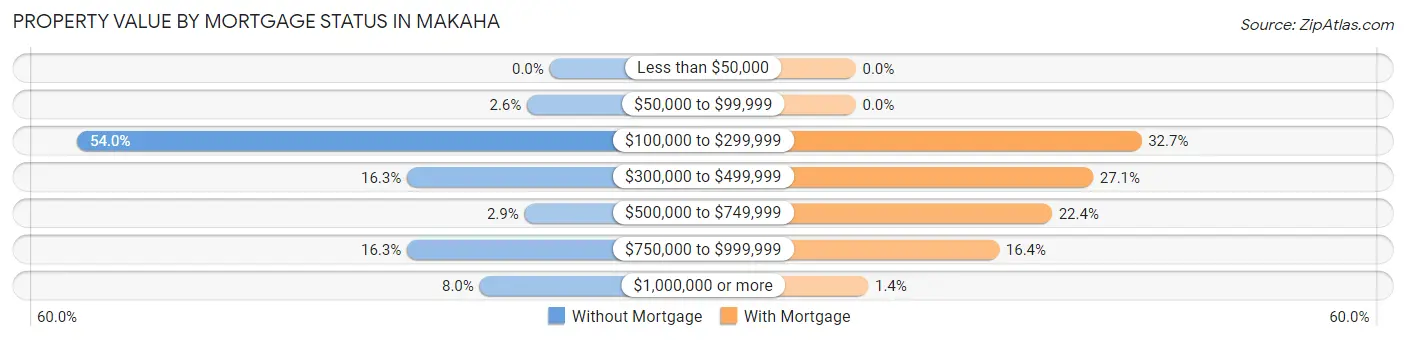
| Property Value | Without Mortgage | With Mortgage |
| Less than $50,000 | 0 (0.0%) | 0 (0.0%) |
| $50,000 to $99,999 | 9 (2.6%) | 0 (0.0%) |
| $100,000 to $299,999 | 189 (54.0%) | 319 (32.7%) |
| $300,000 to $499,999 | 57 (16.3%) | 265 (27.1%) |
| $500,000 to $749,999 | 10 (2.9%) | 219 (22.4%) |
| $750,000 to $999,999 | 57 (16.3%) | 160 (16.4%) |
| $1,000,000 or more | 28 (8.0%) | 14 (1.4%) |
| Total | 350 (100.0%) | 977 (100.0%) |
Household Income by Mortgage Status in Makaha
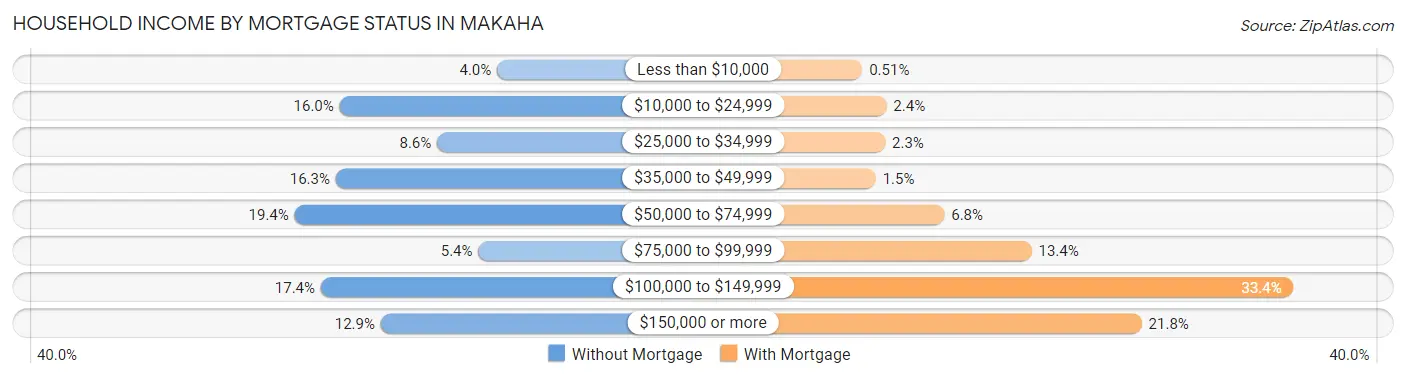
| Household Income | Without Mortgage | With Mortgage |
| Less than $10,000 | 14 (4.0%) | 5 (0.5%) |
| $10,000 to $24,999 | 56 (16.0%) | 23 (2.4%) |
| $25,000 to $34,999 | 30 (8.6%) | 22 (2.2%) |
| $35,000 to $49,999 | 57 (16.3%) | 15 (1.5%) |
| $50,000 to $74,999 | 68 (19.4%) | 66 (6.8%) |
| $75,000 to $99,999 | 19 (5.4%) | 131 (13.4%) |
| $100,000 to $149,999 | 61 (17.4%) | 326 (33.4%) |
| $150,000 or more | 45 (12.9%) | 213 (21.8%) |
| Total | 350 (100.0%) | 977 (100.0%) |
Property Value to Household Income Ratio in Makaha
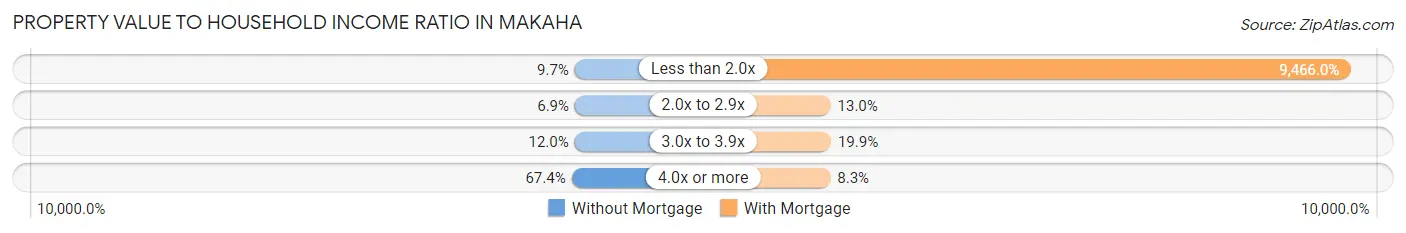
| Value-to-Income Ratio | Without Mortgage | With Mortgage |
| Less than 2.0x | 34 (9.7%) | 92,483 (9,466.0%) |
| 2.0x to 2.9x | 24 (6.9%) | 127 (13.0%) |
| 3.0x to 3.9x | 42 (12.0%) | 194 (19.9%) |
| 4.0x or more | 236 (67.4%) | 81 (8.3%) |
| Total | 350 (100.0%) | 977 (100.0%) |
Real Estate Taxes by Mortgage Status in Makaha
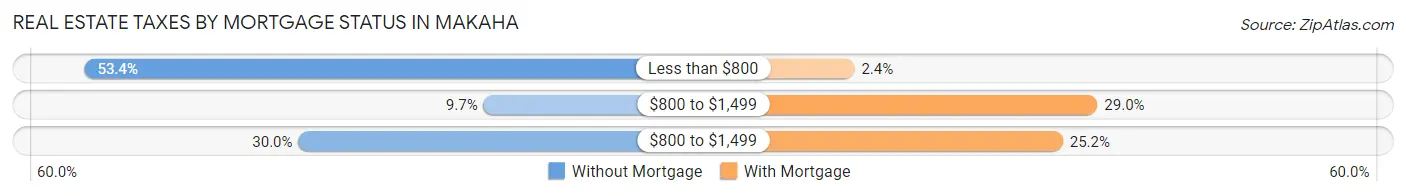
| Property Taxes | Without Mortgage | With Mortgage |
| Less than $800 | 187 (53.4%) | 23 (2.4%) |
| $800 to $1,499 | 34 (9.7%) | 283 (29.0%) |
| $800 to $1,499 | 105 (30.0%) | 246 (25.2%) |
| Total | 350 (100.0%) | 977 (100.0%) |
Health & Disability in Makaha
Health Insurance Coverage by Age in Makaha
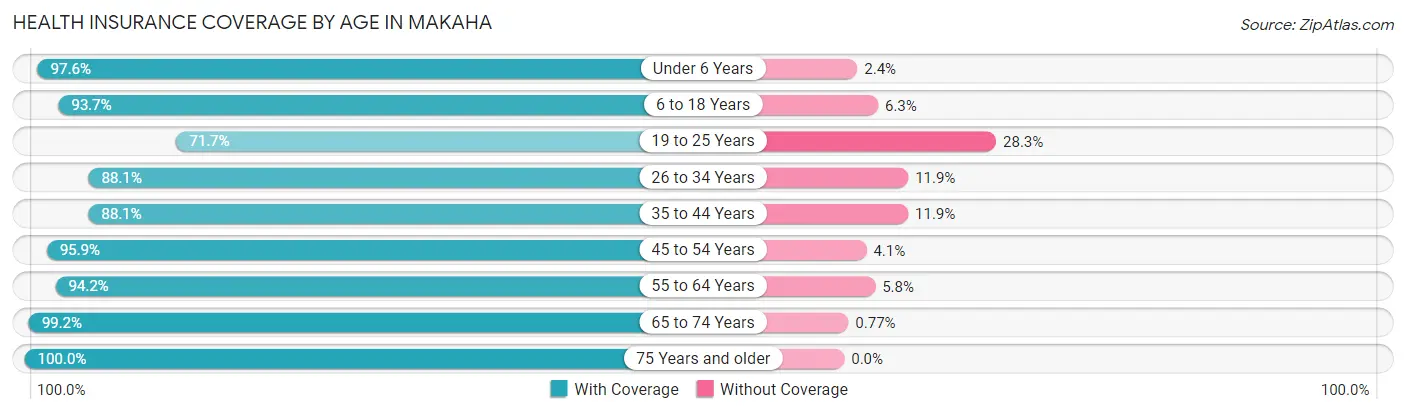
| Age Bracket | With Coverage | Without Coverage |
| Under 6 Years | 1,041 (97.6%) | 26 (2.4%) |
| 6 to 18 Years | 1,891 (93.7%) | 127 (6.3%) |
| 19 to 25 Years | 519 (71.7%) | 205 (28.3%) |
| 26 to 34 Years | 791 (88.1%) | 107 (11.9%) |
| 35 to 44 Years | 1,332 (88.1%) | 180 (11.9%) |
| 45 to 54 Years | 905 (95.9%) | 39 (4.1%) |
| 55 to 64 Years | 1,277 (94.2%) | 78 (5.8%) |
| 65 to 74 Years | 1,030 (99.2%) | 8 (0.8%) |
| 75 Years and older | 336 (100.0%) | 0 (0.0%) |
| Total | 9,122 (92.2%) | 770 (7.8%) |
Health Insurance Coverage by Citizenship Status in Makaha
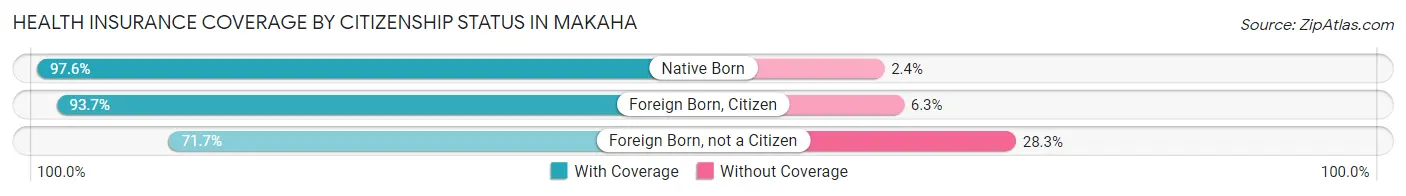
| Citizenship Status | With Coverage | Without Coverage |
| Native Born | 1,041 (97.6%) | 26 (2.4%) |
| Foreign Born, Citizen | 1,891 (93.7%) | 127 (6.3%) |
| Foreign Born, not a Citizen | 519 (71.7%) | 205 (28.3%) |
Health Insurance Coverage by Household Income in Makaha
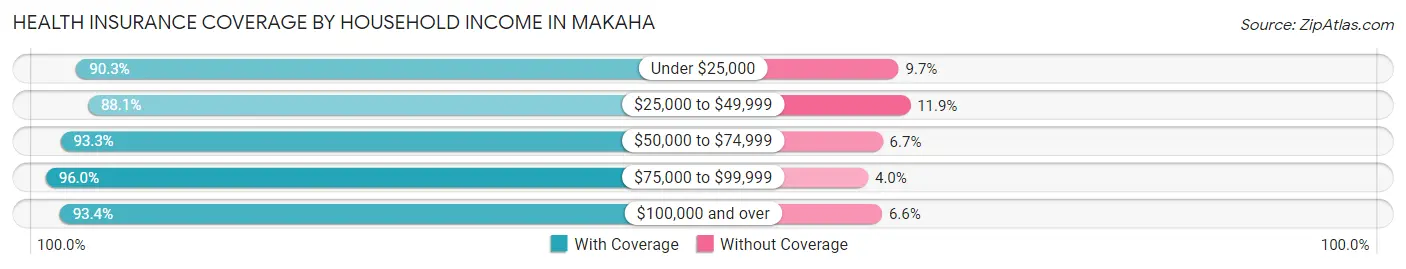
| Household Income | With Coverage | Without Coverage |
| Under $25,000 | 1,618 (90.3%) | 174 (9.7%) |
| $25,000 to $49,999 | 1,676 (88.1%) | 226 (11.9%) |
| $50,000 to $74,999 | 1,637 (93.3%) | 118 (6.7%) |
| $75,000 to $99,999 | 1,256 (96.0%) | 52 (4.0%) |
| $100,000 and over | 2,836 (93.4%) | 200 (6.6%) |
Public vs Private Health Insurance Coverage by Age in Makaha
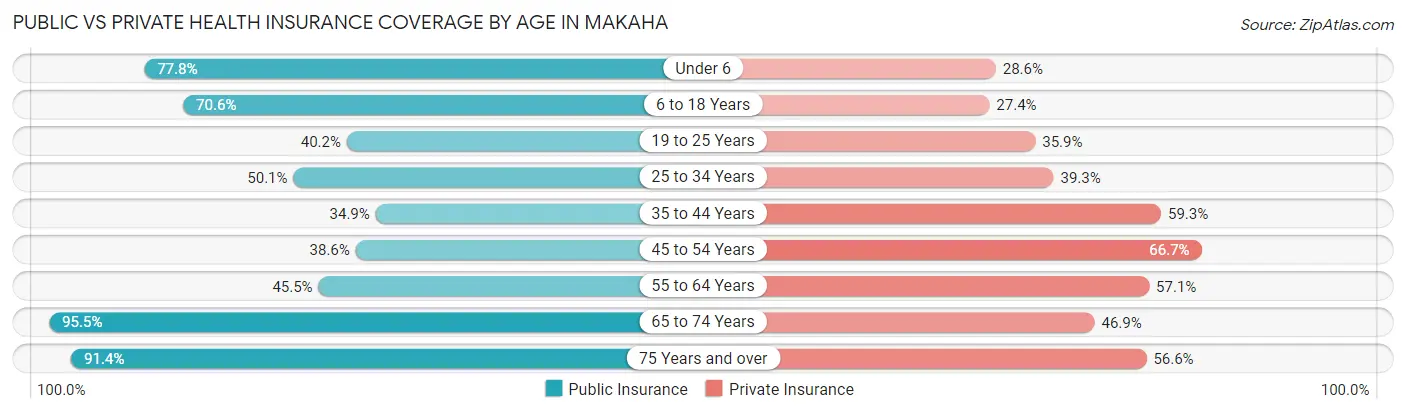
| Age Bracket | Public Insurance | Private Insurance |
| Under 6 | 830 (77.8%) | 305 (28.6%) |
| 6 to 18 Years | 1,424 (70.6%) | 553 (27.4%) |
| 19 to 25 Years | 291 (40.2%) | 260 (35.9%) |
| 25 to 34 Years | 450 (50.1%) | 353 (39.3%) |
| 35 to 44 Years | 527 (34.8%) | 896 (59.3%) |
| 45 to 54 Years | 364 (38.6%) | 630 (66.7%) |
| 55 to 64 Years | 616 (45.5%) | 773 (57.1%) |
| 65 to 74 Years | 991 (95.5%) | 487 (46.9%) |
| 75 Years and over | 307 (91.4%) | 190 (56.6%) |
| Total | 5,800 (58.6%) | 4,447 (45.0%) |
Disability Status by Sex by Age in Makaha
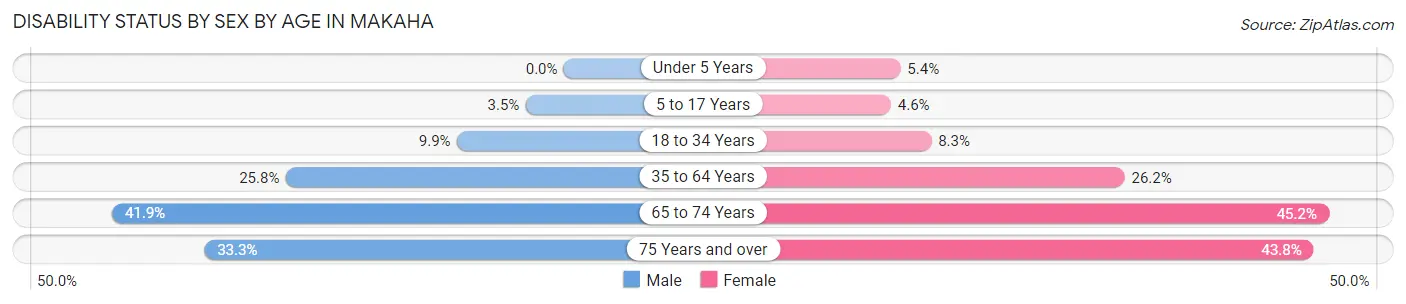
| Age Bracket | Male | Female |
| Under 5 Years | 0 (0.0%) | 21 (5.4%) |
| 5 to 17 Years | 35 (3.5%) | 45 (4.5%) |
| 18 to 34 Years | 86 (9.9%) | 73 (8.3%) |
| 35 to 64 Years | 486 (25.8%) | 506 (26.2%) |
| 65 to 74 Years | 217 (41.9%) | 235 (45.2%) |
| 75 Years and over | 45 (33.3%) | 88 (43.8%) |
Disability Class by Sex by Age in Makaha
Disability Class: Hearing Difficulty
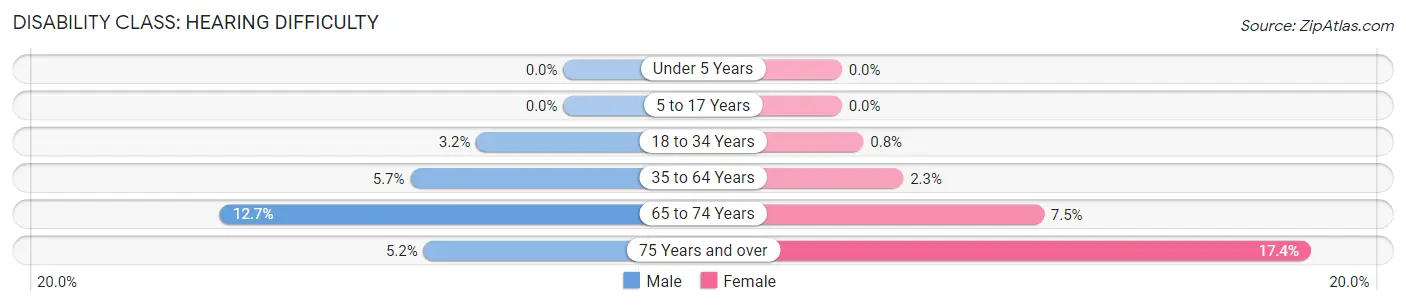
| Age Bracket | Male | Female |
| Under 5 Years | 0 (0.0%) | 0 (0.0%) |
| 5 to 17 Years | 0 (0.0%) | 0 (0.0%) |
| 18 to 34 Years | 28 (3.2%) | 7 (0.8%) |
| 35 to 64 Years | 107 (5.7%) | 44 (2.3%) |
| 65 to 74 Years | 66 (12.7%) | 39 (7.5%) |
| 75 Years and over | 7 (5.2%) | 35 (17.4%) |
Disability Class: Vision Difficulty
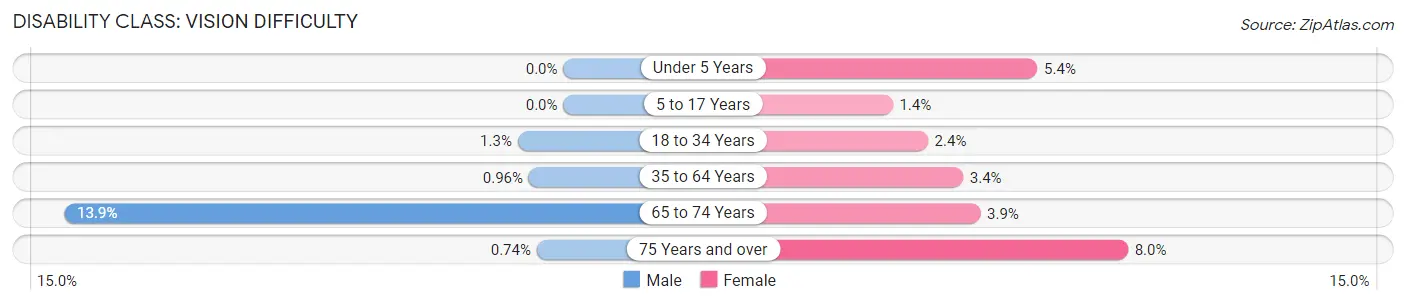
| Age Bracket | Male | Female |
| Under 5 Years | 0 (0.0%) | 21 (5.4%) |
| 5 to 17 Years | 0 (0.0%) | 14 (1.4%) |
| 18 to 34 Years | 11 (1.3%) | 21 (2.4%) |
| 35 to 64 Years | 18 (1.0%) | 65 (3.4%) |
| 65 to 74 Years | 72 (13.9%) | 20 (3.8%) |
| 75 Years and over | 1 (0.7%) | 16 (8.0%) |
Disability Class: Cognitive Difficulty
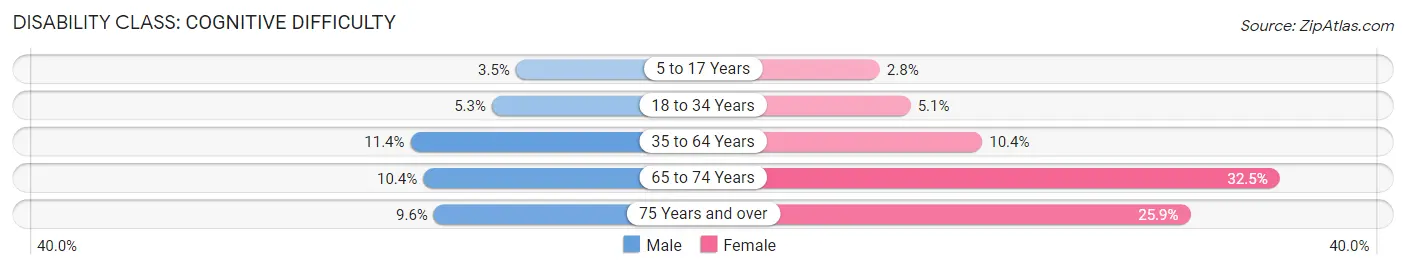
| Age Bracket | Male | Female |
| 5 to 17 Years | 35 (3.5%) | 28 (2.8%) |
| 18 to 34 Years | 46 (5.3%) | 45 (5.1%) |
| 35 to 64 Years | 214 (11.4%) | 201 (10.4%) |
| 65 to 74 Years | 54 (10.4%) | 169 (32.5%) |
| 75 Years and over | 13 (9.6%) | 52 (25.9%) |
Disability Class: Ambulatory Difficulty
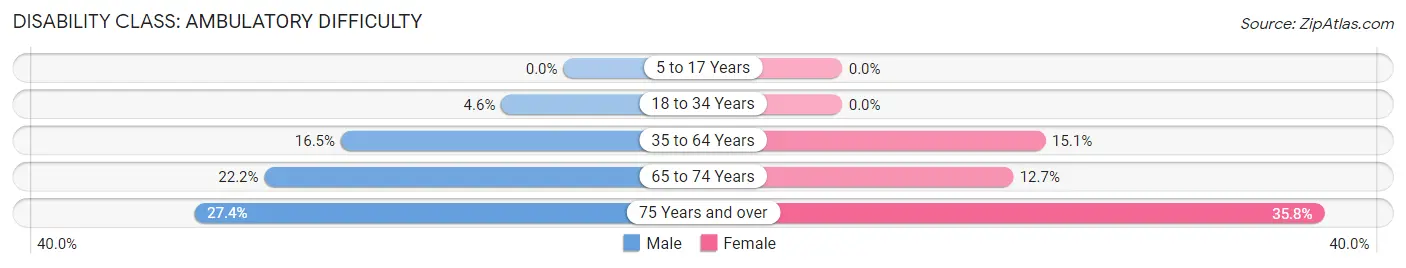
| Age Bracket | Male | Female |
| 5 to 17 Years | 0 (0.0%) | 0 (0.0%) |
| 18 to 34 Years | 40 (4.6%) | 0 (0.0%) |
| 35 to 64 Years | 311 (16.5%) | 291 (15.1%) |
| 65 to 74 Years | 115 (22.2%) | 66 (12.7%) |
| 75 Years and over | 37 (27.4%) | 72 (35.8%) |
Disability Class: Self-Care Difficulty
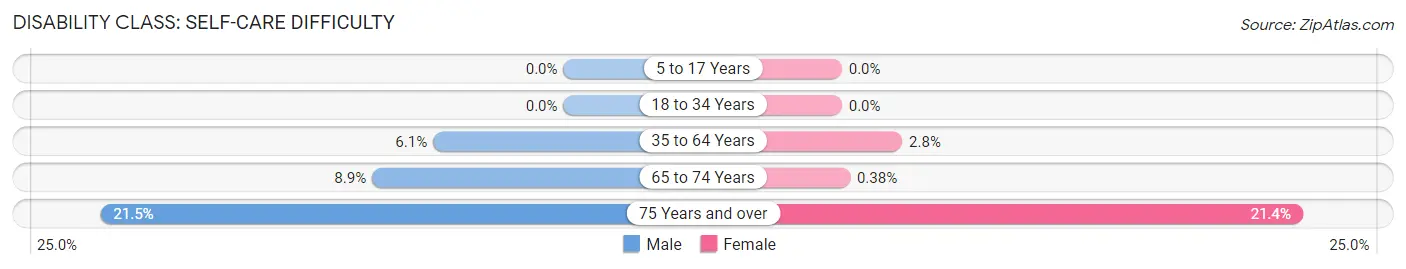
| Age Bracket | Male | Female |
| 5 to 17 Years | 0 (0.0%) | 0 (0.0%) |
| 18 to 34 Years | 0 (0.0%) | 0 (0.0%) |
| 35 to 64 Years | 114 (6.0%) | 54 (2.8%) |
| 65 to 74 Years | 46 (8.9%) | 2 (0.4%) |
| 75 Years and over | 29 (21.5%) | 43 (21.4%) |
Technology Access in Makaha
Computing Device Access in Makaha
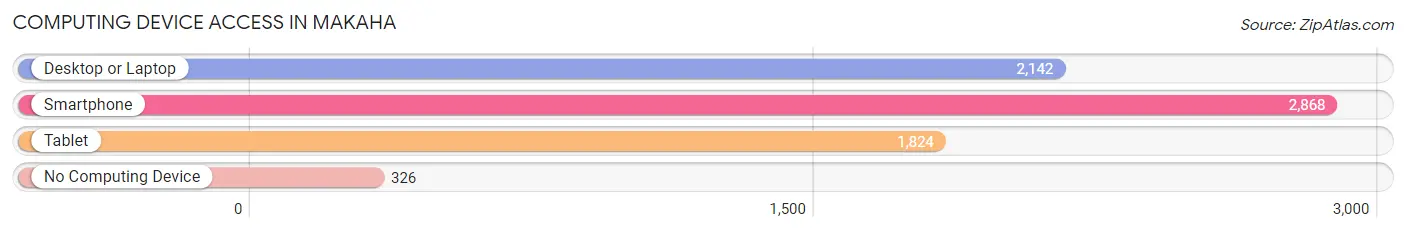
| Device Type | # Households | % Households |
| Desktop or Laptop | 2,142 | 65.2% |
| Smartphone | 2,868 | 87.3% |
| Tablet | 1,824 | 55.5% |
| No Computing Device | 326 | 9.9% |
| Total | 3,285 | 100.0% |
Internet Access in Makaha
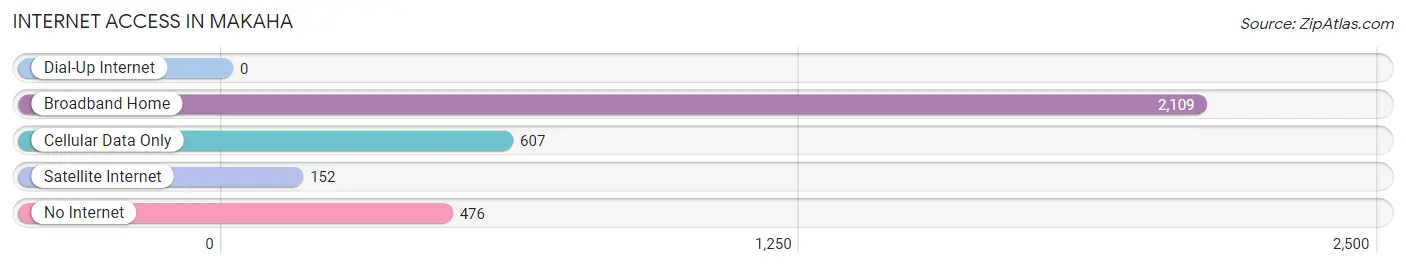
| Internet Type | # Households | % Households |
| Dial-Up Internet | 0 | 0.0% |
| Broadband Home | 2,109 | 64.2% |
| Cellular Data Only | 607 | 18.5% |
| Satellite Internet | 152 | 4.6% |
| No Internet | 476 | 14.5% |
| Total | 3,285 | 100.0% |
Makaha Summary
Makaha is a census-designated place (CDP) located in the Waianae District on the island of Oahu in the state of Hawaii. The population was 6,129 at the 2010 census. Makaha is located on the western coast of Oahu, approximately 25 miles (40 km) from Honolulu. It is a popular surfing destination and is known for its beautiful beaches and warm, clear waters.
Geography
Makaha is located at 21°30'17" North, 158°14'17" West (21.504722, -158.238333). It is bordered to the north by Waianae, to the east by Makua, and to the south by Waianae Valley. The total area of the CDP is 4.2 square miles (10.8 km2).
The terrain of Makaha is mostly flat, with some rolling hills. The area is mostly covered in tropical vegetation, including coconut palms, ironwood trees, and other native plants. The climate is tropical, with temperatures ranging from the mid-70s to the mid-80s Fahrenheit (21-30 Celsius).
Economy
Makaha is primarily a residential community, with most of its residents employed in the tourism and hospitality industries. The area is home to several resorts, including the Makaha Resort and Spa, the Makaha Valley Country Club, and the Makaha Beach Resort. There are also several restaurants, bars, and shops in the area.
The Makaha Valley Country Club is a popular destination for golfers, and the Makaha Beach Resort offers a variety of water sports, including surfing, snorkeling, and kayaking. The area is also home to several parks, including the Makaha Valley State Park and the Makaha Valley National Wildlife Refuge.
Demographics
As of the 2010 census, there were 6,129 people, 2,068 households, and 1,541 families residing in the CDP. The population density was 1,461.3 people per square mile (564.3/km2). There were 2,541 housing units at an average density of 609.3 per square mile (235.2/km2). The racial makeup of the CDP was 28.2% White, 0.7% African American, 0.3% Native American, 28.2% Asian, 8.2% Pacific Islander, 0.7% from other races, and 33.7% from two or more races. Hispanic or Latino of any race were 8.2% of the population.
There were 2,068 households, out of which 33.2% had children under the age of 18 living with them, 51.2% were married couples living together, 13.2% had a female householder with no husband present, and 28.2% were non-families. 22.2% of all households were made up of individuals, and 8.2% had someone living alone who was 65 years of age or older. The average household size was 2.94 and the average family size was 3.45.
In the CDP, the population was spread out, with 25.2% under the age of 18, 8.2% from 18 to 24, 28.2% from 25 to 44, 24.2% from 45 to 64, and 14.2% who were 65 years of age or older. The median age was 37 years. For every 100 females, there were 97.2 males. For every 100 females age 18 and over, there were 95.2 males.
The median income for a household in the CDP was $50,972, and the median income for a family was $54,972. Males had a median income of $35,972 versus $30,972 for females. The per capita income for the CDP was $20,972. About 8.2% of families and 11.2% of the population were below the poverty line, including 15.2% of those under age 18 and 8.2% of those age 65 or over.
Common Questions
What is Per Capita Income in Makaha?
Per Capita income in Makaha is $24,855.
What is the Median Family Income in Makaha?
Median Family Income in Makaha is $71,845.
What is the Median Household income in Makaha?
Median Household Income in Makaha is $57,235.
What is Income or Wage Gap in Makaha?
Income or Wage Gap in Makaha is 25.6%.
Women in Makaha earn 74.4 cents for every dollar earned by a man.
What is Inequality or Gini Index in Makaha?
Inequality or Gini Index in Makaha is 0.45.
What is the Total Population of Makaha?
Total Population of Makaha is 10,042.
What is the Total Male Population of Makaha?
Total Male Population of Makaha is 5,108.
What is the Total Female Population of Makaha?
Total Female Population of Makaha is 4,934.
What is the Ratio of Males per 100 Females in Makaha?
There are 103.53 Males per 100 Females in Makaha.
What is the Ratio of Females per 100 Males in Makaha?
There are 96.59 Females per 100 Males in Makaha.
What is the Median Population Age in Makaha?
Median Population Age in Makaha is 37.0 Years.
What is the Average Family Size in Makaha
Average Family Size in Makaha is 4.2 People.
What is the Average Household Size in Makaha
Average Household Size in Makaha is 3.0 People.
How Large is the Labor Force in Makaha?
There are 3,771 People in the Labor Forcein in Makaha.
What is the Percentage of People in the Labor Force in Makaha?
50.4% of People are in the Labor Force in Makaha.
What is the Unemployment Rate in Makaha?
Unemployment Rate in Makaha is 9.7%.