Clayton, OK Map & Demographics
Clayton Map
Clayton Overview
$19,043
PER CAPITA INCOME
$43,333
AVG FAMILY INCOME
$27,083
AVG HOUSEHOLD INCOME
53.0%
WAGE / INCOME GAP [ % ]
47.0¢/ $1
WAGE / INCOME GAP [ $ ]
0.47
INEQUALITY / GINI INDEX
662
TOTAL POPULATION
356
MALE POPULATION
306
FEMALE POPULATION
116.34
MALES / 100 FEMALES
85.96
FEMALES / 100 MALES
32.7
MEDIAN AGE
3.5
AVG FAMILY SIZE
2.4
AVG HOUSEHOLD SIZE
285
LABOR FORCE [ PEOPLE ]
52.8%
PERCENT IN LABOR FORCE
14.0%
UNEMPLOYMENT RATE
Clayton Zip Codes
Clayton Area Codes
Income in Clayton
Income Overview in Clayton
Per Capita Income in Clayton is $19,043, while median incomes of families and households are $43,333 and $27,083 respectively.
| Characteristic | Number | Measure |
| Per Capita Income | 662 | $19,043 |
| Median Family Income | 136 | $43,333 |
| Mean Family Income | 136 | $51,590 |
| Median Household Income | 278 | $27,083 |
| Mean Household Income | 278 | $42,658 |
| Income Deficit | 136 | $0 |
| Wage / Income Gap (%) | 662 | 52.97% |
| Wage / Income Gap ($) | 662 | 47.03¢ per $1 |
| Gini / Inequality Index | 662 | 0.47 |
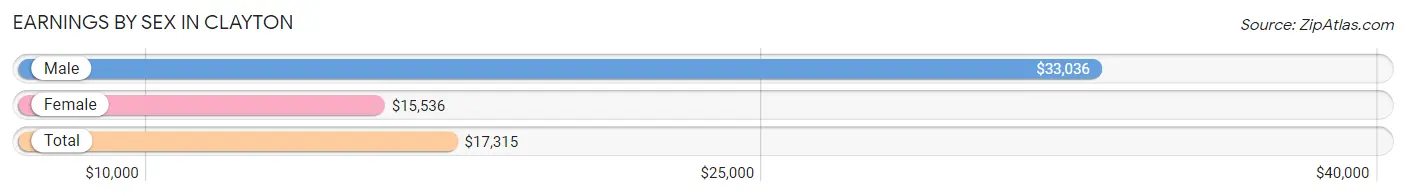
Earnings by Sex in Clayton
Average Earnings in Clayton are $17,315, $33,036 for men and $15,536 for women, a difference of 53.0%.
| Sex | Number | Average Earnings |
| Male | 127 (49.2%) | $33,036 |
| Female | 131 (50.8%) | $15,536 |
| Total | 258 (100.0%) | $17,315 |
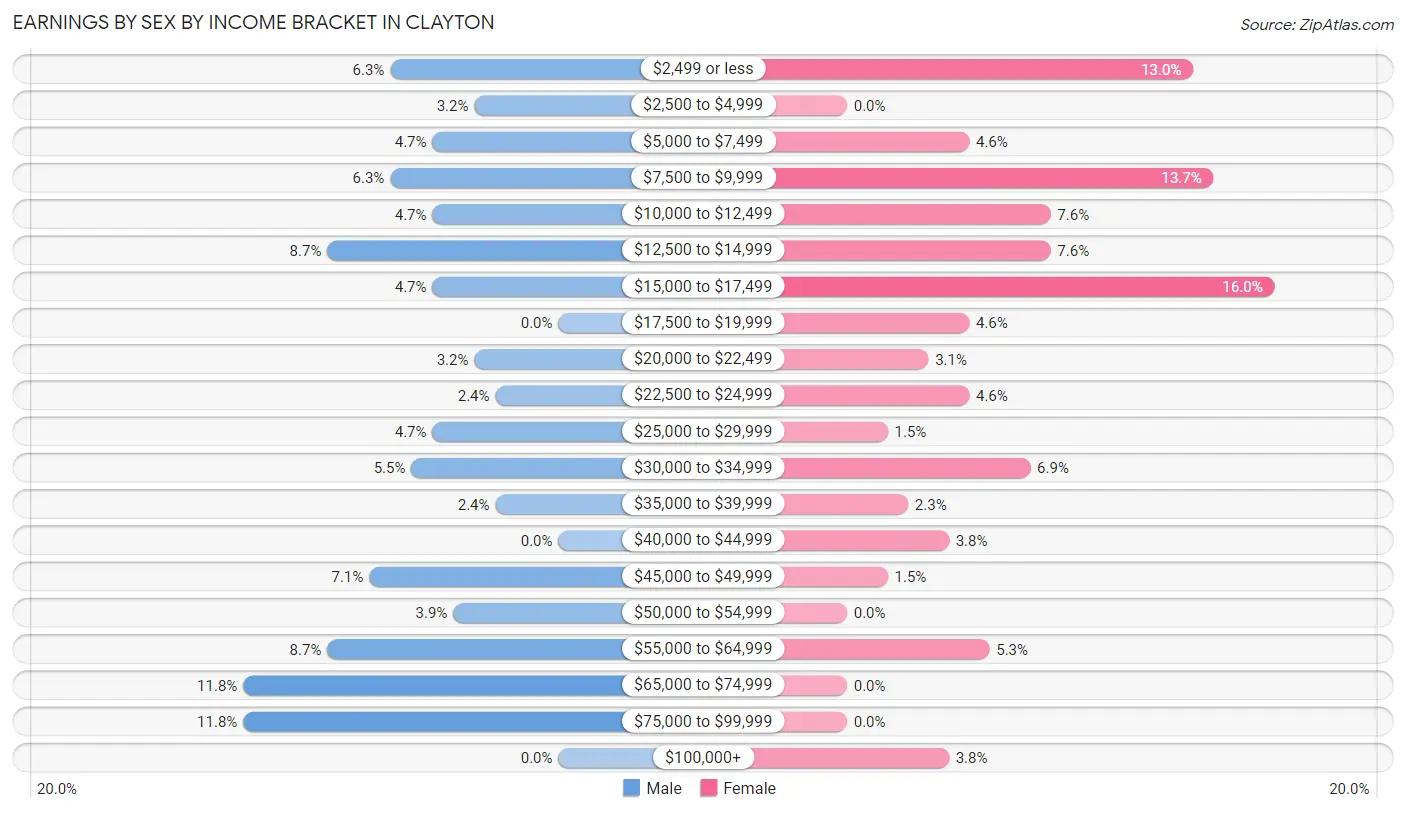
Earnings by Sex by Income Bracket in Clayton
The most common earnings brackets in Clayton are $65,000 to $74,999 for men (15 | 11.8%) and $15,000 to $17,499 for women (21 | 16.0%).
| Income | Male | Female |
| $2,499 or less | 8 (6.3%) | 17 (13.0%) |
| $2,500 to $4,999 | 4 (3.2%) | 0 (0.0%) |
| $5,000 to $7,499 | 6 (4.7%) | 6 (4.6%) |
| $7,500 to $9,999 | 8 (6.3%) | 18 (13.7%) |
| $10,000 to $12,499 | 6 (4.7%) | 10 (7.6%) |
| $12,500 to $14,999 | 11 (8.7%) | 10 (7.6%) |
| $15,000 to $17,499 | 6 (4.7%) | 21 (16.0%) |
| $17,500 to $19,999 | 0 (0.0%) | 6 (4.6%) |
| $20,000 to $22,499 | 4 (3.2%) | 4 (3.0%) |
| $22,500 to $24,999 | 3 (2.4%) | 6 (4.6%) |
| $25,000 to $29,999 | 6 (4.7%) | 2 (1.5%) |
| $30,000 to $34,999 | 7 (5.5%) | 9 (6.9%) |
| $35,000 to $39,999 | 3 (2.4%) | 3 (2.3%) |
| $40,000 to $44,999 | 0 (0.0%) | 5 (3.8%) |
| $45,000 to $49,999 | 9 (7.1%) | 2 (1.5%) |
| $50,000 to $54,999 | 5 (3.9%) | 0 (0.0%) |
| $55,000 to $64,999 | 11 (8.7%) | 7 (5.3%) |
| $65,000 to $74,999 | 15 (11.8%) | 0 (0.0%) |
| $75,000 to $99,999 | 15 (11.8%) | 0 (0.0%) |
| $100,000+ | 0 (0.0%) | 5 (3.8%) |
| Total | 127 (100.0%) | 131 (100.0%) |
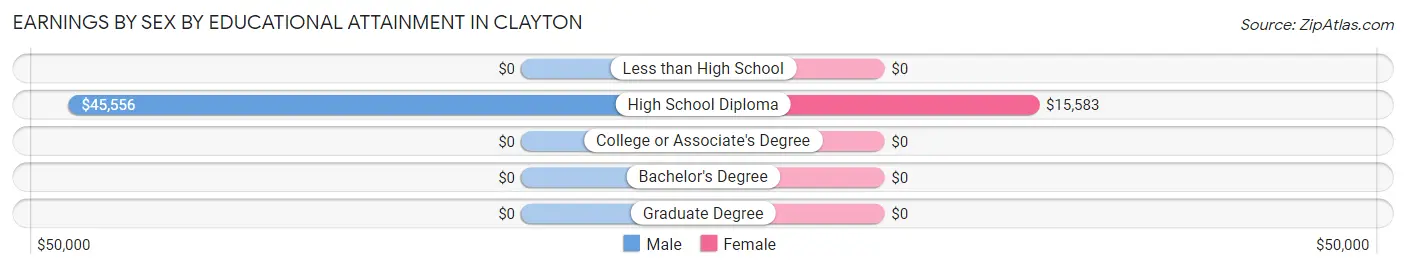
Earnings by Sex by Educational Attainment in Clayton
Average earnings in Clayton are $46,389 for men and $15,774 for women, a difference of 66.0%. Men with an educational attainment of high school diploma enjoy the highest average annual earnings of $45,556, while those with high school diploma education earn the least with $45,556. Women with an educational attainment of high school diploma earn the most with the average annual earnings of $15,583, while those with high school diploma education have the smallest earnings of $15,583.
| Educational Attainment | Male Income | Female Income |
| Less than High School | - | - |
| High School Diploma | $45,556 | $15,583 |
| College or Associate's Degree | - | - |
| Bachelor's Degree | - | - |
| Graduate Degree | - | - |
| Total | $46,389 | $15,774 |
Family Income in Clayton
Family Income Brackets in Clayton
According to the Clayton family income data, there are 29 families falling into the $50,000 to $74,999 income range, which is the most common income bracket and makes up 21.3% of all families. Conversely, the $200,000+ income bracket is the least frequent group with only 2 families (1.5%) belonging to this category.
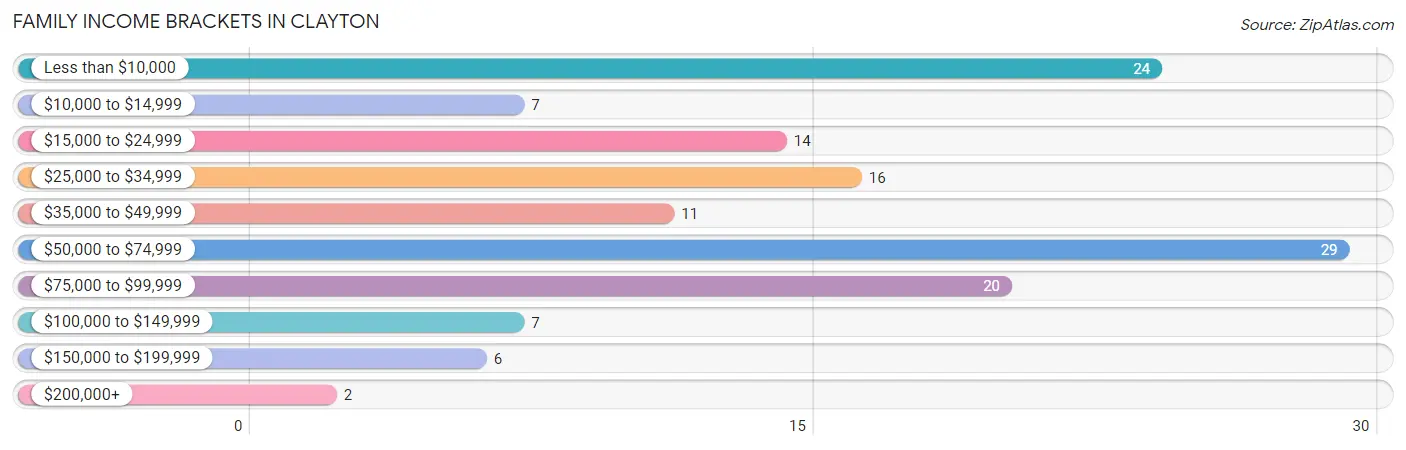
| Income Bracket | # Families | % Families |
| Less than $10,000 | 24 | 17.6% |
| $10,000 to $14,999 | 7 | 5.1% |
| $15,000 to $24,999 | 14 | 10.3% |
| $25,000 to $34,999 | 16 | 11.8% |
| $35,000 to $49,999 | 11 | 8.1% |
| $50,000 to $74,999 | 29 | 21.3% |
| $75,000 to $99,999 | 20 | 14.7% |
| $100,000 to $149,999 | 7 | 5.1% |
| $150,000 to $199,999 | 6 | 4.4% |
| $200,000+ | 2 | 1.5% |
Family Income by Famaliy Size in Clayton
4-person families (25 | 18.4%) account for the highest median family income in Clayton with $73,438 per family, while 4-person families (25 | 18.4%) have the highest median income of $18,360 per family member.
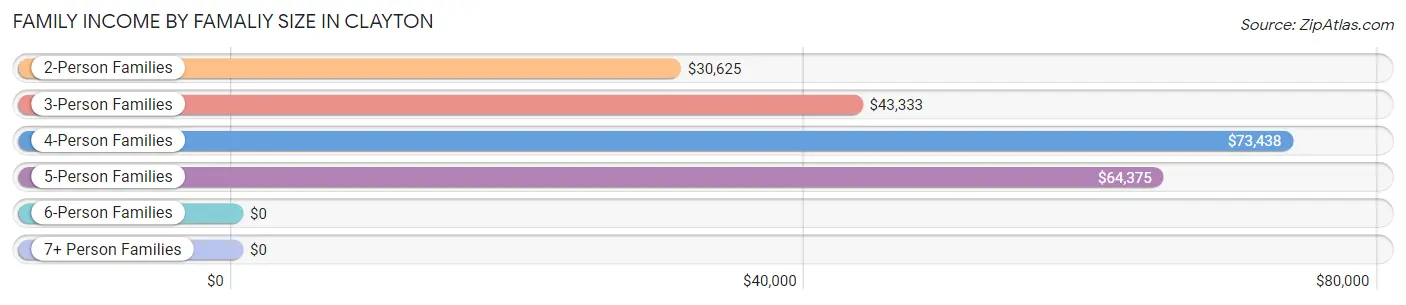
| Income Bracket | # Families | Median Income |
| 2-Person Families | 74 (54.4%) | $30,625 |
| 3-Person Families | 28 (20.6%) | $43,333 |
| 4-Person Families | 25 (18.4%) | $73,438 |
| 5-Person Families | 9 (6.6%) | $64,375 |
| 6-Person Families | 0 (0.0%) | $0 |
| 7+ Person Families | 0 (0.0%) | $0 |
| Total | 136 (100.0%) | $43,333 |
Family Income by Number of Earners in Clayton
The median family income in Clayton is $43,333, with families comprising 2 earners (36) having the highest median family income of $76,250, while families with no earners (33) have the lowest median family income of $26,042, accounting for 26.5% and 24.3% of families, respectively.
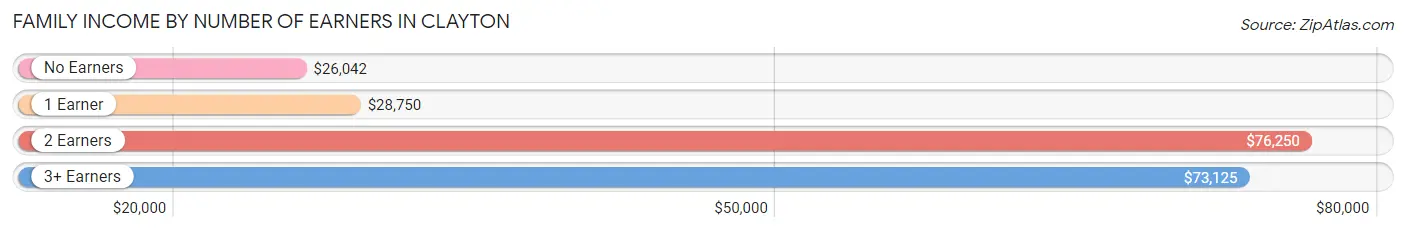
| Number of Earners | # Families | Median Income |
| No Earners | 33 (24.3%) | $26,042 |
| 1 Earner | 57 (41.9%) | $28,750 |
| 2 Earners | 36 (26.5%) | $76,250 |
| 3+ Earners | 10 (7.3%) | $73,125 |
| Total | 136 (100.0%) | $43,333 |
Household Income in Clayton
Household Income Brackets in Clayton
With 67 households falling in the category, the $50,000 to $74,999 income range is the most frequent in Clayton, accounting for 24.1% of all households. In contrast, only 2 households (0.7%) fall into the $200,000+ income bracket, making it the least populous group.
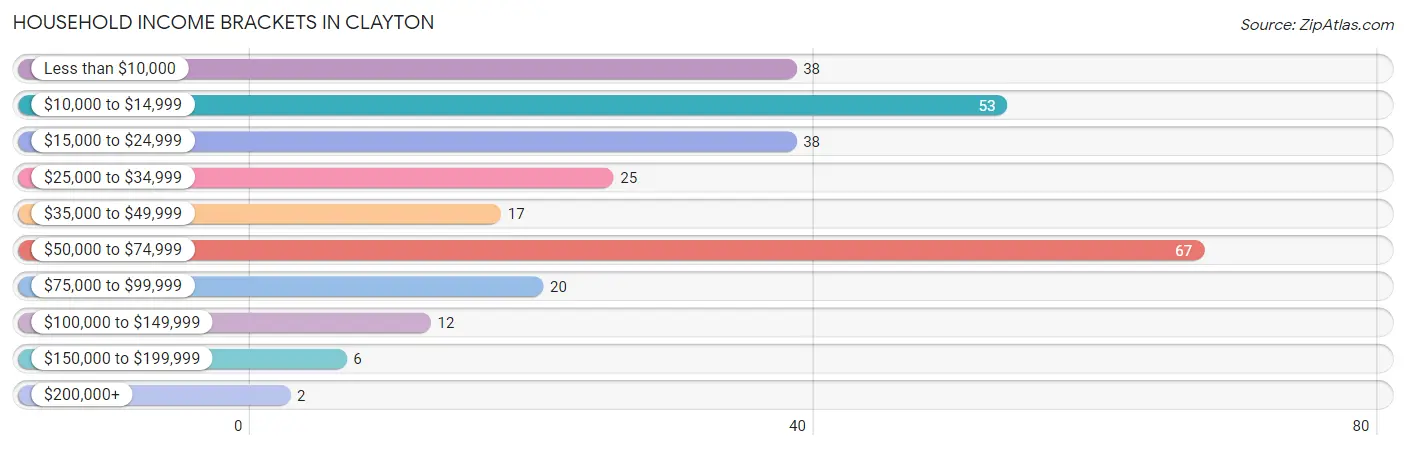
| Income Bracket | # Households | % Households |
| Less than $10,000 | 38 | 13.7% |
| $10,000 to $14,999 | 53 | 19.1% |
| $15,000 to $24,999 | 38 | 13.7% |
| $25,000 to $34,999 | 25 | 9.0% |
| $35,000 to $49,999 | 17 | 6.1% |
| $50,000 to $74,999 | 67 | 24.1% |
| $75,000 to $99,999 | 20 | 7.2% |
| $100,000 to $149,999 | 12 | 4.3% |
| $150,000 to $199,999 | 6 | 2.2% |
| $200,000+ | 2 | 0.7% |
Household Income by Householder Age in Clayton
The median household income in Clayton is $27,083, with the highest median household income of $52,083 found in the 15 to 24 years age bracket for the primary householder. A total of 7 households (2.5%) fall into this category. Meanwhile, the 65+ years age bracket for the primary householder has the lowest median household income of $0, with 112 households (40.3%) in this group.
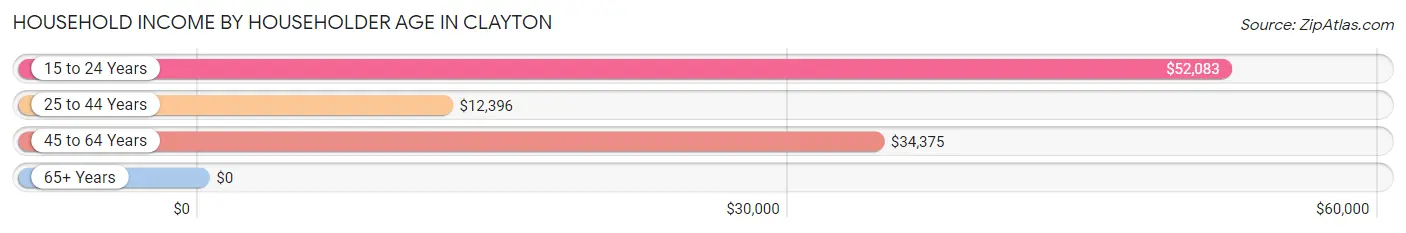
| Income Bracket | # Households | Median Income |
| 15 to 24 Years | 7 (2.5%) | $52,083 |
| 25 to 44 Years | 94 (33.8%) | $12,396 |
| 45 to 64 Years | 65 (23.4%) | $34,375 |
| 65+ Years | 112 (40.3%) | $0 |
| Total | 278 (100.0%) | $27,083 |
Poverty in Clayton
Income Below Poverty by Sex and Age in Clayton
With 29.5% poverty level for males and 34.8% for females among the residents of Clayton, 5 year old males and 16 and 17 year old females are the most vulnerable to poverty, with 2 males (100.0%) and 1 females (100.0%) in their respective age groups living below the poverty level.
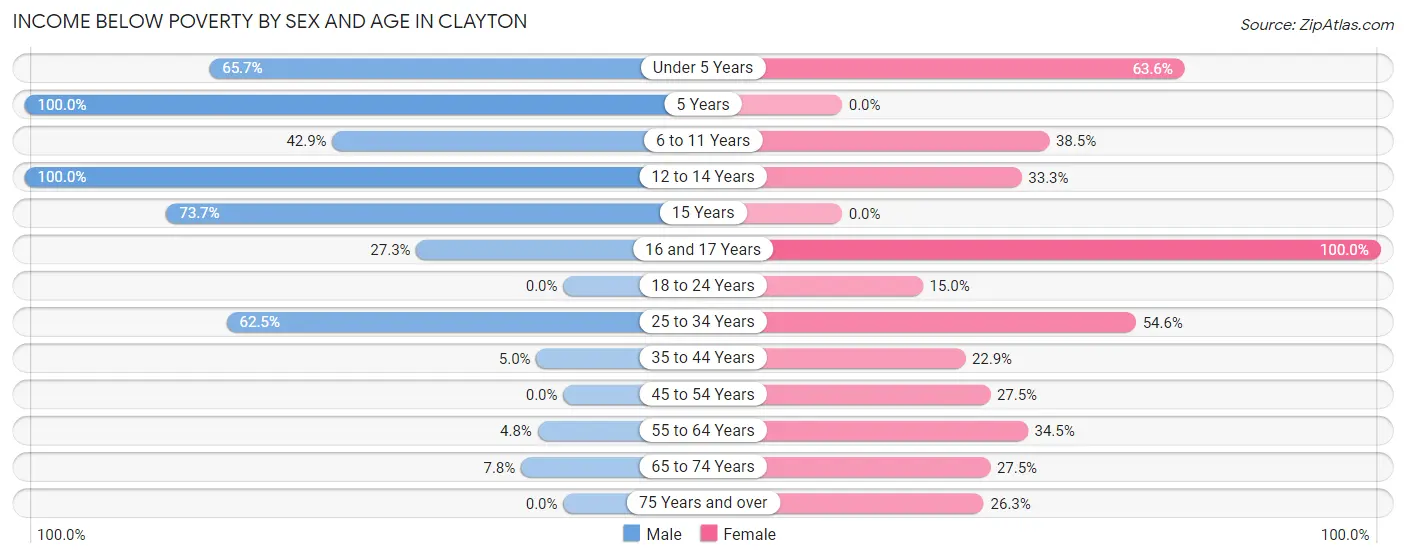
| Age Bracket | Male | Female |
| Under 5 Years | 23 (65.7%) | 14 (63.6%) |
| 5 Years | 2 (100.0%) | 0 (0.0%) |
| 6 to 11 Years | 6 (42.9%) | 5 (38.5%) |
| 12 to 14 Years | 4 (100.0%) | 2 (33.3%) |
| 15 Years | 14 (73.7%) | 0 (0.0%) |
| 16 and 17 Years | 9 (27.3%) | 1 (100.0%) |
| 18 to 24 Years | 0 (0.0%) | 3 (15.0%) |
| 25 to 34 Years | 40 (62.5%) | 30 (54.5%) |
| 35 to 44 Years | 1 (5.0%) | 8 (22.9%) |
| 45 to 54 Years | 0 (0.0%) | 11 (27.5%) |
| 55 to 64 Years | 2 (4.8%) | 10 (34.5%) |
| 65 to 74 Years | 4 (7.8%) | 11 (27.5%) |
| 75 Years and over | 0 (0.0%) | 10 (26.3%) |
| Total | 105 (29.5%) | 105 (34.8%) |
Income Above Poverty by Sex and Age in Clayton
According to the poverty statistics in Clayton, males aged 18 to 24 years and females aged 15 years are the age groups that are most secure financially, with 100.0% of males and 100.0% of females in these age groups living above the poverty line.
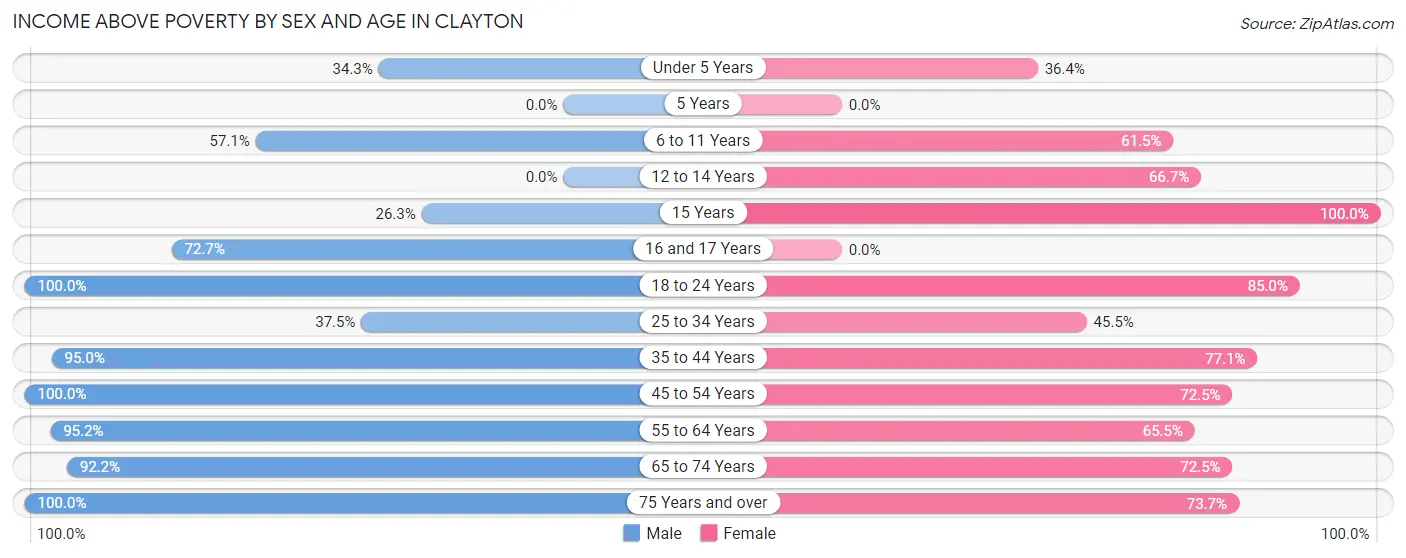
| Age Bracket | Male | Female |
| Under 5 Years | 12 (34.3%) | 8 (36.4%) |
| 5 Years | 0 (0.0%) | 0 (0.0%) |
| 6 to 11 Years | 8 (57.1%) | 8 (61.5%) |
| 12 to 14 Years | 0 (0.0%) | 4 (66.7%) |
| 15 Years | 5 (26.3%) | 3 (100.0%) |
| 16 and 17 Years | 24 (72.7%) | 0 (0.0%) |
| 18 to 24 Years | 48 (100.0%) | 17 (85.0%) |
| 25 to 34 Years | 24 (37.5%) | 25 (45.5%) |
| 35 to 44 Years | 19 (95.0%) | 27 (77.1%) |
| 45 to 54 Years | 12 (100.0%) | 29 (72.5%) |
| 55 to 64 Years | 40 (95.2%) | 19 (65.5%) |
| 65 to 74 Years | 47 (92.2%) | 29 (72.5%) |
| 75 Years and over | 12 (100.0%) | 28 (73.7%) |
| Total | 251 (70.5%) | 197 (65.2%) |
Income Below Poverty Among Married-Couple Families in Clayton
The poverty statistics for married-couple families in Clayton show that 2.9% or 2 of the total 70 families live below the poverty line. Families with 1 or 2 children have the highest poverty rate of 9.1%, comprising of 2 families. On the other hand, families with no children have the lowest poverty rate of 0.0%, which includes 0 families.
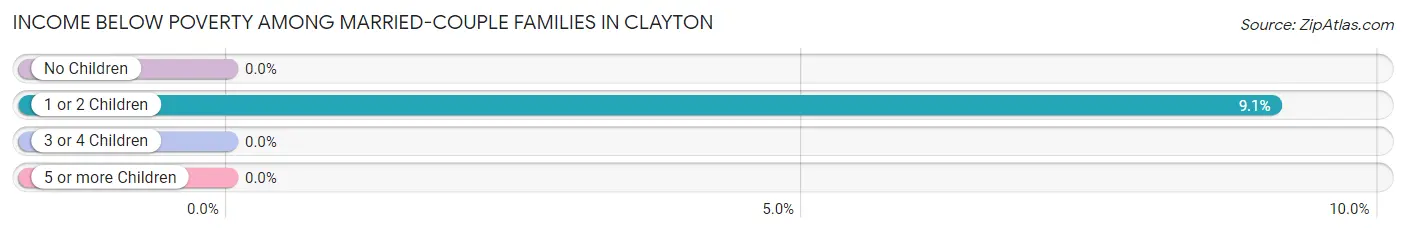
| Children | Above Poverty | Below Poverty |
| No Children | 47 (100.0%) | 0 (0.0%) |
| 1 or 2 Children | 20 (90.9%) | 2 (9.1%) |
| 3 or 4 Children | 1 (100.0%) | 0 (0.0%) |
| 5 or more Children | 0 (0.0%) | 0 (0.0%) |
| Total | 68 (97.1%) | 2 (2.9%) |
Income Below Poverty Among Single-Parent Households in Clayton
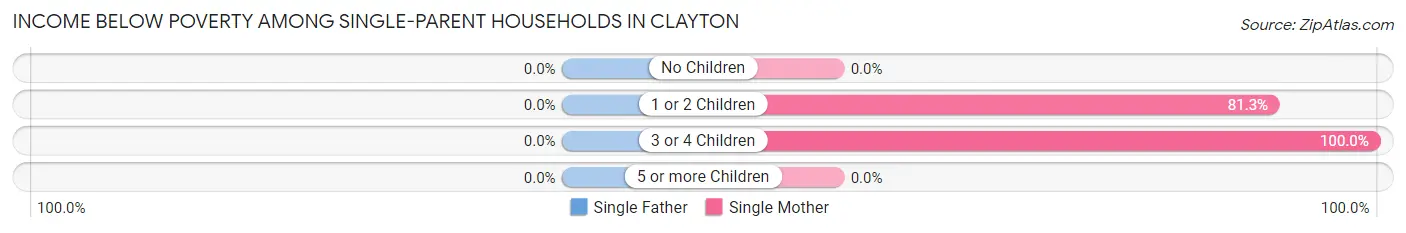
| Children | Single Father | Single Mother |
| No Children | 0 (0.0%) | 0 (0.0%) |
| 1 or 2 Children | 0 (0.0%) | 26 (81.2%) |
| 3 or 4 Children | 0 (0.0%) | 8 (100.0%) |
| 5 or more Children | 0 (0.0%) | 0 (0.0%) |
| Total | 0 (0.0%) | 34 (68.0%) |
Income Below Poverty Among Married-Couple vs Single-Parent Households in Clayton
The poverty data for Clayton shows that 2 of the married-couple family households (2.9%) and 34 of the single-parent households (51.5%) are living below the poverty level. Within the married-couple family households, those with 1 or 2 children have the highest poverty rate, with 2 households (9.1%) falling below the poverty line. Among the single-parent households, those with 3 or 4 children have the highest poverty rate, with 8 household (100.0%) living below poverty.
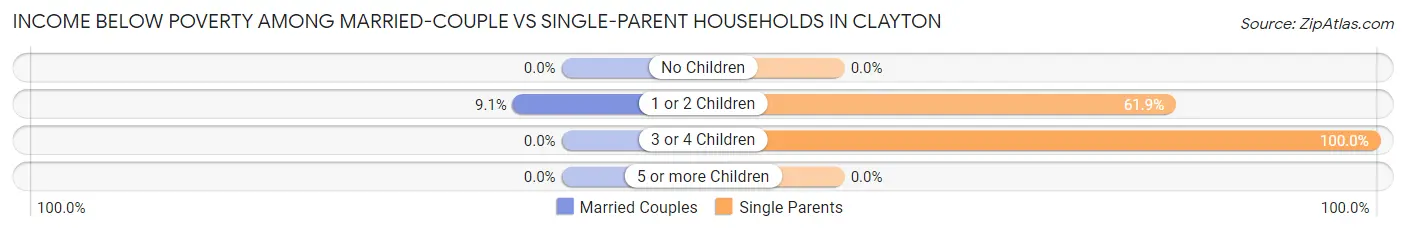
| Children | Married-Couple Families | Single-Parent Households |
| No Children | 0 (0.0%) | 0 (0.0%) |
| 1 or 2 Children | 2 (9.1%) | 26 (61.9%) |
| 3 or 4 Children | 0 (0.0%) | 8 (100.0%) |
| 5 or more Children | 0 (0.0%) | 0 (0.0%) |
| Total | 2 (2.9%) | 34 (51.5%) |
Race in Clayton
The most populous races in Clayton are White / Caucasian (396 | 59.8%), Two or more Races (128 | 19.3%), and Native / Alaskan (112 | 16.9%).
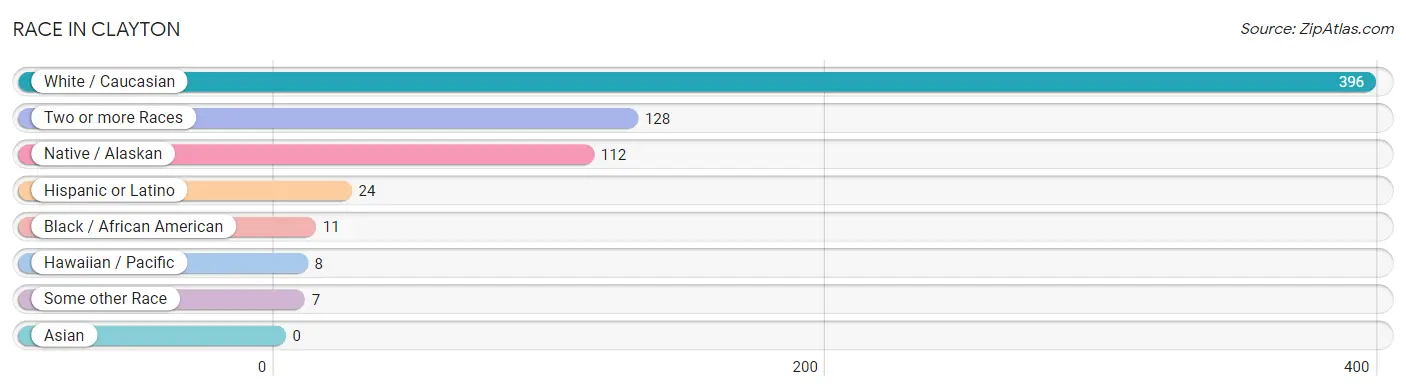
| Race | # Population | % Population |
| Asian | 0 | 0.0% |
| Black / African American | 11 | 1.7% |
| Hawaiian / Pacific | 8 | 1.2% |
| Hispanic or Latino | 24 | 3.6% |
| Native / Alaskan | 112 | 16.9% |
| White / Caucasian | 396 | 59.8% |
| Two or more Races | 128 | 19.3% |
| Some other Race | 7 | 1.1% |
| Total | 662 | 100.0% |
Ancestry in Clayton
The most populous ancestries reported in Clayton are Choctaw (177 | 26.7%), Irish (166 | 25.1%), German (71 | 10.7%), English (66 | 10.0%), and Cherokee (47 | 7.1%), together accounting for 79.6% of all Clayton residents.
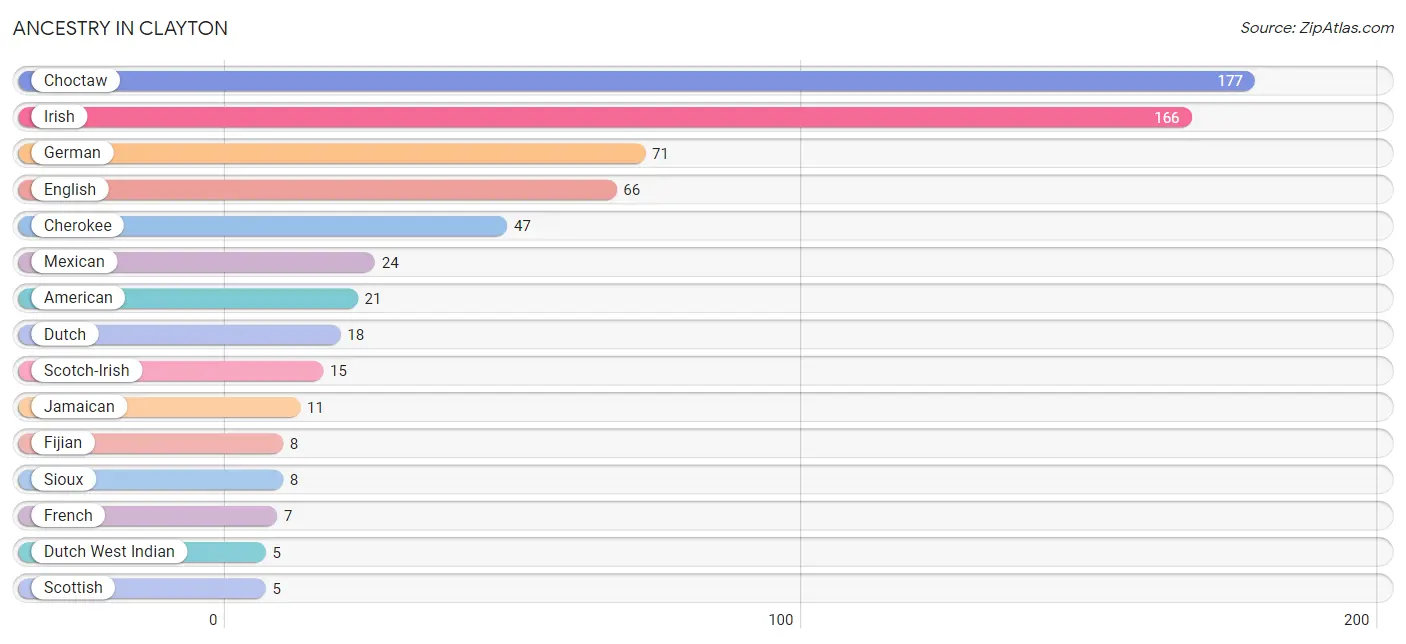
| Ancestry | # Population | % Population |
| American | 21 | 3.2% |
| Cajun | 2 | 0.3% |
| Cherokee | 47 | 7.1% |
| Choctaw | 177 | 26.7% |
| Creek | 1 | 0.2% |
| Danish | 1 | 0.2% |
| Dutch | 18 | 2.7% |
| Dutch West Indian | 5 | 0.8% |
| English | 66 | 10.0% |
| Fijian | 8 | 1.2% |
| French | 7 | 1.1% |
| German | 71 | 10.7% |
| Irish | 166 | 25.1% |
| Italian | 2 | 0.3% |
| Jamaican | 11 | 1.7% |
| Mexican | 24 | 3.6% |
| Potawatomi | 4 | 0.6% |
| Scandinavian | 1 | 0.2% |
| Scotch-Irish | 15 | 2.3% |
| Scottish | 5 | 0.8% |
| Sioux | 8 | 1.2% |
| Swedish | 2 | 0.3% | View All 22 Rows |
Immigrants in Clayton
The most numerous immigrant groups reported in Clayton came from , and Oceania (5 | 0.8%), together accounting for 0.8% of all Clayton residents.

| Immigration Origin | # Population | % Population |
| Oceania | 5 | 0.8% | View All 1 Rows |
Sex and Age in Clayton
Sex and Age in Clayton
The most populous age groups in Clayton are 15 to 19 Years (87 | 24.4%) for men and 25 to 29 Years (39 | 12.8%) for women.
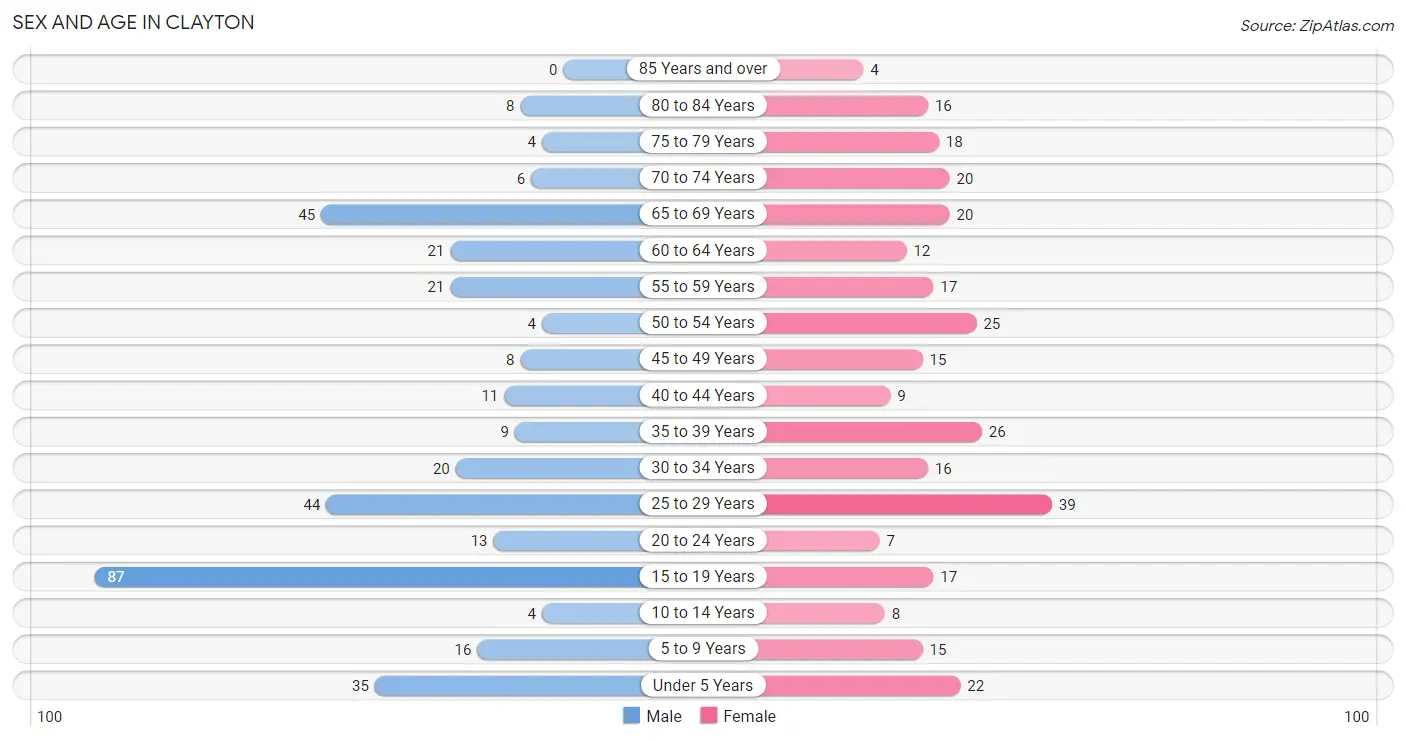
| Age Bracket | Male | Female |
| Under 5 Years | 35 (9.8%) | 22 (7.2%) |
| 5 to 9 Years | 16 (4.5%) | 15 (4.9%) |
| 10 to 14 Years | 4 (1.1%) | 8 (2.6%) |
| 15 to 19 Years | 87 (24.4%) | 17 (5.6%) |
| 20 to 24 Years | 13 (3.6%) | 7 (2.3%) |
| 25 to 29 Years | 44 (12.4%) | 39 (12.8%) |
| 30 to 34 Years | 20 (5.6%) | 16 (5.2%) |
| 35 to 39 Years | 9 (2.5%) | 26 (8.5%) |
| 40 to 44 Years | 11 (3.1%) | 9 (2.9%) |
| 45 to 49 Years | 8 (2.2%) | 15 (4.9%) |
| 50 to 54 Years | 4 (1.1%) | 25 (8.2%) |
| 55 to 59 Years | 21 (5.9%) | 17 (5.6%) |
| 60 to 64 Years | 21 (5.9%) | 12 (3.9%) |
| 65 to 69 Years | 45 (12.6%) | 20 (6.5%) |
| 70 to 74 Years | 6 (1.7%) | 20 (6.5%) |
| 75 to 79 Years | 4 (1.1%) | 18 (5.9%) |
| 80 to 84 Years | 8 (2.2%) | 16 (5.2%) |
| 85 Years and over | 0 (0.0%) | 4 (1.3%) |
| Total | 356 (100.0%) | 306 (100.0%) |
Families and Households in Clayton
Median Family Size in Clayton
The median family size in Clayton is 3.46 persons per family, with married-couple families (70 | 51.5%) accounting for the largest median family size of 3.59 persons per family. On the other hand, single male/father families (16 | 11.8%) represent the smallest median family size with 3.31 persons per family.
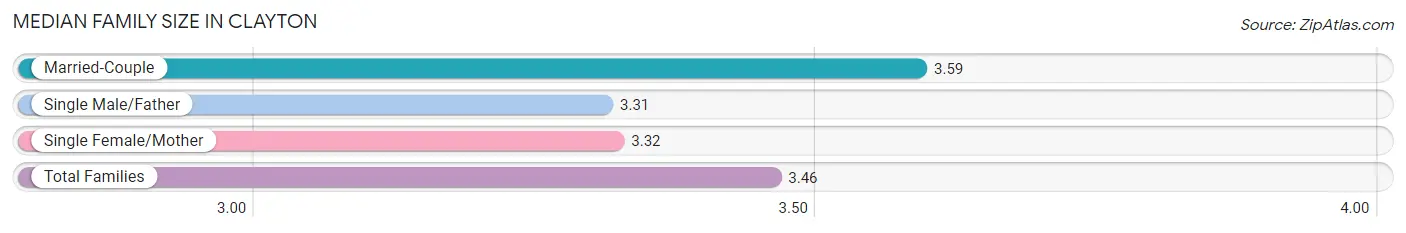
| Family Type | # Families | Family Size |
| Married-Couple | 70 (51.5%) | 3.59 |
| Single Male/Father | 16 (11.8%) | 3.31 |
| Single Female/Mother | 50 (36.8%) | 3.32 |
| Total Families | 136 (100.0%) | 3.46 |
Median Household Size in Clayton
The median household size in Clayton is 2.38 persons per household, with single female/mother households (50 | 18.0%) accounting for the largest median household size of 3.86 persons per household. non-family households (142 | 51.1%) represent the smallest median household size with 1.06 persons per household.
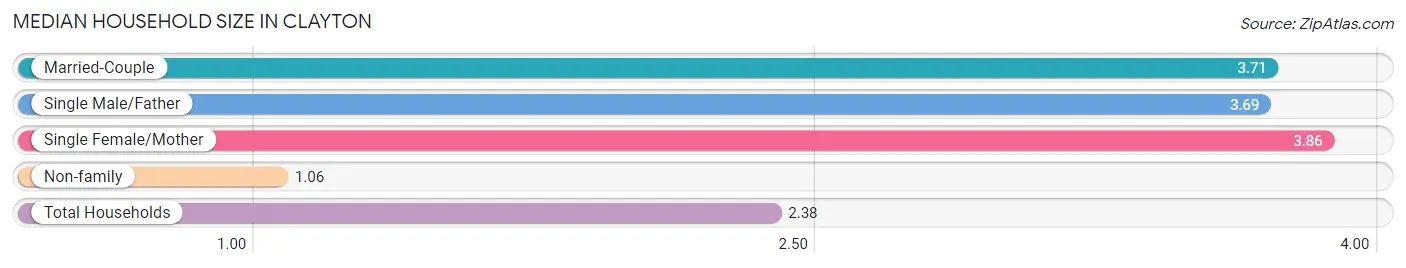
| Household Type | # Households | Household Size |
| Married-Couple | 70 (25.2%) | 3.71 |
| Single Male/Father | 16 (5.8%) | 3.69 |
| Single Female/Mother | 50 (18.0%) | 3.86 |
| Non-family | 142 (51.1%) | 1.06 |
| Total Households | 278 (100.0%) | 2.38 |
Household Size by Marriage Status in Clayton
Out of a total of 278 households in Clayton, 136 (48.9%) are family households, while 142 (51.1%) are nonfamily households. The most numerous type of family households are 2-person households, comprising 67, and the most common type of nonfamily households are 1-person households, comprising 104.
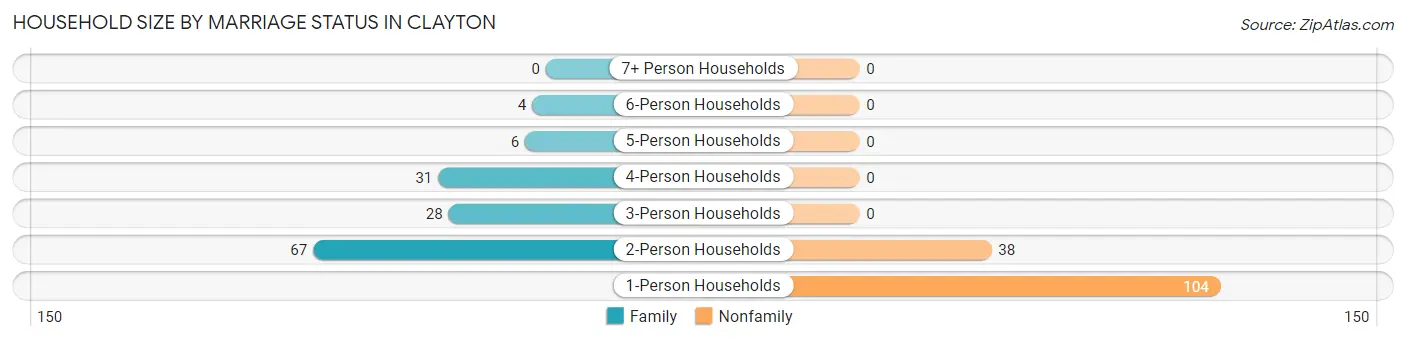
| Household Size | Family Households | Nonfamily Households |
| 1-Person Households | - | 104 (37.4%) |
| 2-Person Households | 67 (24.1%) | 38 (13.7%) |
| 3-Person Households | 28 (10.1%) | 0 (0.0%) |
| 4-Person Households | 31 (11.2%) | 0 (0.0%) |
| 5-Person Households | 6 (2.2%) | 0 (0.0%) |
| 6-Person Households | 4 (1.4%) | 0 (0.0%) |
| 7+ Person Households | 0 (0.0%) | 0 (0.0%) |
| Total | 136 (48.9%) | 142 (51.1%) |
Female Fertility in Clayton
Fertility by Age in Clayton
Average fertility rate in Clayton is 106.0 births per 1,000 women. Women in the age bracket of 20 to 34 years have the highest fertility rate with 242.0 births per 1,000 women. Women in the age bracket of 20 to 34 years acount for 100.0% of all women with births.
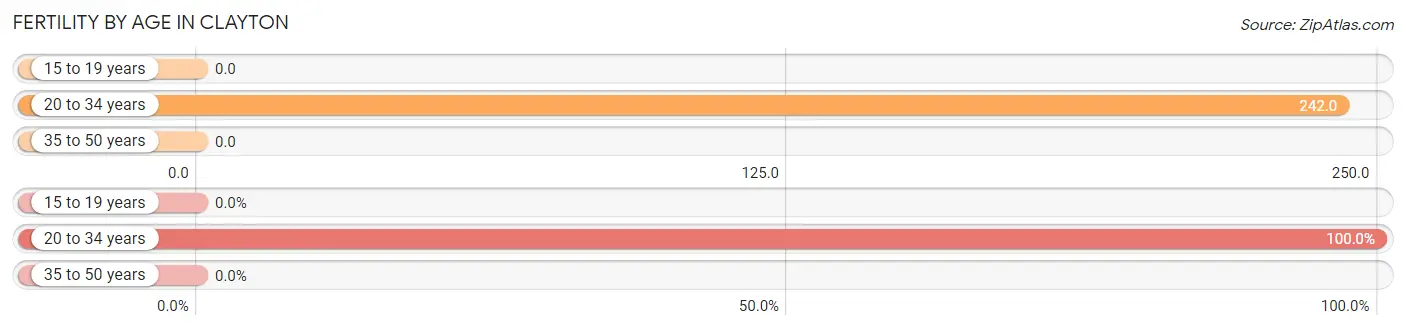
| Age Bracket | Women with Births | Births / 1,000 Women |
| 15 to 19 years | 0 (0.0%) | 0.0 |
| 20 to 34 years | 15 (100.0%) | 242.0 |
| 35 to 50 years | 0 (0.0%) | 0.0 |
| Total | 15 (100.0%) | 106.0 |
Fertility by Age by Marriage Status in Clayton
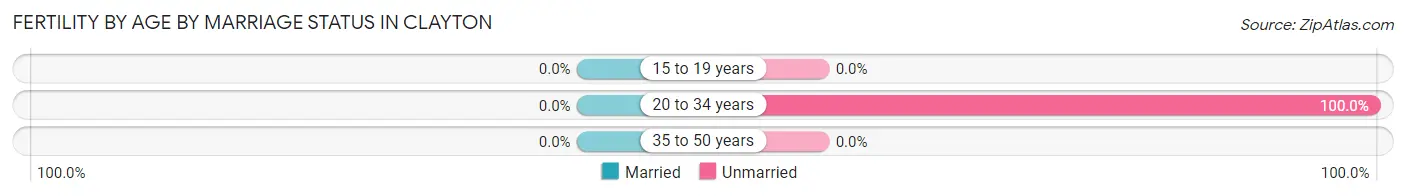
| Age Bracket | Married | Unmarried |
| 15 to 19 years | 0 (0.0%) | 0 (0.0%) |
| 20 to 34 years | 0 (0.0%) | 15 (100.0%) |
| 35 to 50 years | 0 (0.0%) | 0 (0.0%) |
| Total | 0 (0.0%) | 15 (100.0%) |
Fertility by Education in Clayton
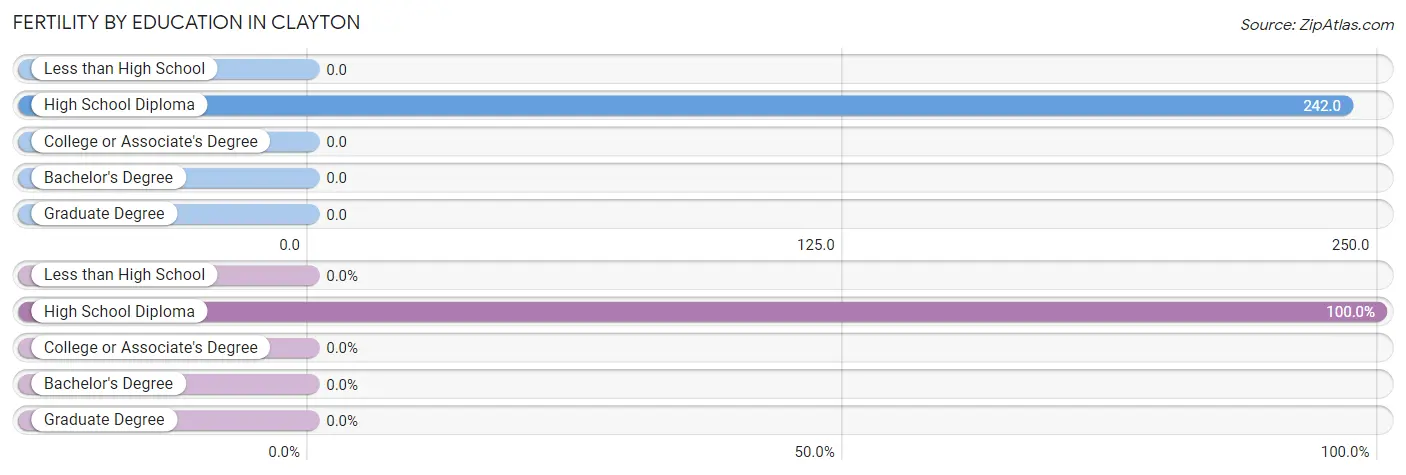
| Educational Attainment | Women with Births | Births / 1,000 Women |
| Less than High School | 0 (0.0%) | 0.0 |
| High School Diploma | 15 (100.0%) | 242.0 |
| College or Associate's Degree | 0 (0.0%) | 0.0 |
| Bachelor's Degree | 0 (0.0%) | 0.0 |
| Graduate Degree | 0 (0.0%) | 0.0 |
| Total | 15 (100.0%) | 106.0 |
Fertility by Education by Marriage Status in Clayton
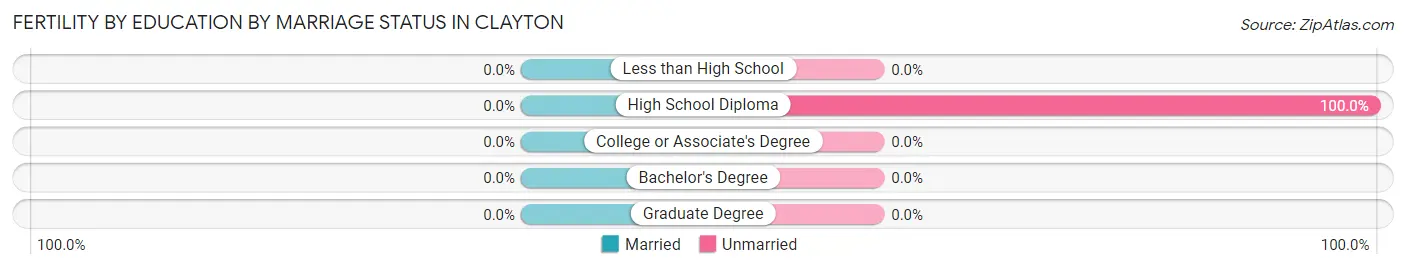
| Educational Attainment | Married | Unmarried |
| Less than High School | 0 (0.0%) | 0 (0.0%) |
| High School Diploma | 0 (0.0%) | 15 (100.0%) |
| College or Associate's Degree | 0 (0.0%) | 0 (0.0%) |
| Bachelor's Degree | 0 (0.0%) | 0 (0.0%) |
| Graduate Degree | 0 (0.0%) | 0 (0.0%) |
| Total | 0 (0.0%) | 15 (100.0%) |
Employment Characteristics in Clayton
Employment by Class of Employer in Clayton
Among the 225 employed individuals in Clayton, private company employees (140 | 62.2%), state government employees (25 | 11.1%), and local government employees (20 | 8.9%) make up the most common classes of employment.
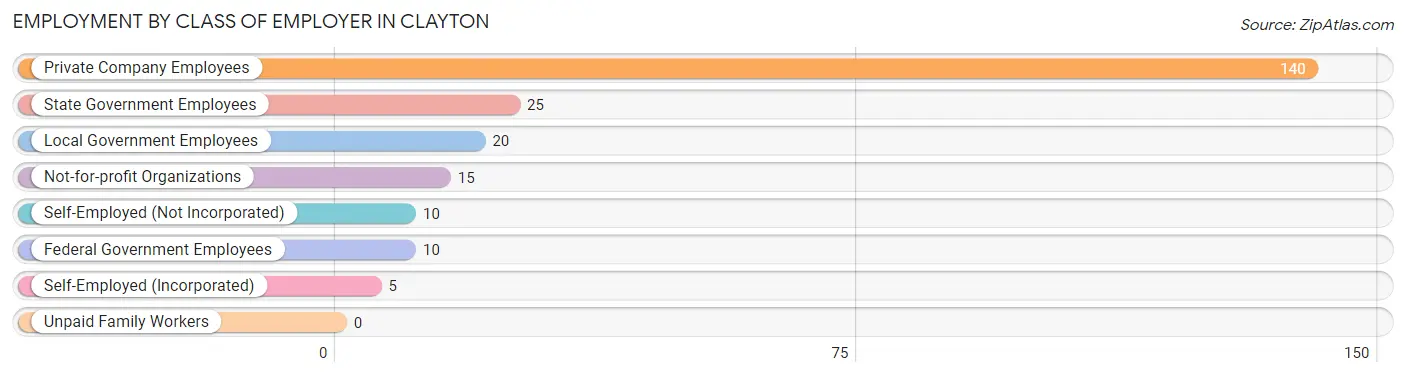
| Employer Class | # Employees | % Employees |
| Private Company Employees | 140 | 62.2% |
| Self-Employed (Incorporated) | 5 | 2.2% |
| Self-Employed (Not Incorporated) | 10 | 4.4% |
| Not-for-profit Organizations | 15 | 6.7% |
| Local Government Employees | 20 | 8.9% |
| State Government Employees | 25 | 11.1% |
| Federal Government Employees | 10 | 4.4% |
| Unpaid Family Workers | 0 | 0.0% |
| Total | 225 | 100.0% |
Employment Status by Age in Clayton
According to the labor force statistics for Clayton, out of the total population over 16 years of age (540), 52.8% or 285 individuals are in the labor force, with 14.0% or 40 of them unemployed. The age group with the highest labor force participation rate is 35 to 44 years, with 92.7% or 51 individuals in the labor force. Within the labor force, the 16 to 19 years age range has the highest percentage of unemployed individuals, with 40.4% or 19 of them being unemployed.
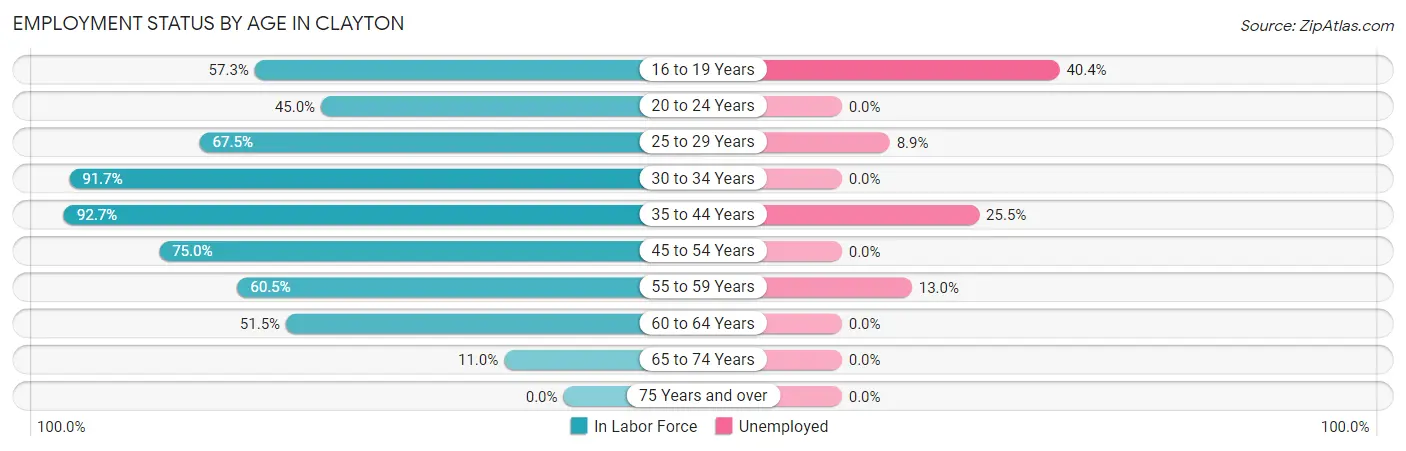
| Age Bracket | In Labor Force | Unemployed |
| 16 to 19 Years | 47 (57.3%) | 19 (40.4%) |
| 20 to 24 Years | 9 (45.0%) | 0 (0.0%) |
| 25 to 29 Years | 56 (67.5%) | 5 (8.9%) |
| 30 to 34 Years | 33 (91.7%) | 0 (0.0%) |
| 35 to 44 Years | 51 (92.7%) | 13 (25.5%) |
| 45 to 54 Years | 39 (75.0%) | 0 (0.0%) |
| 55 to 59 Years | 23 (60.5%) | 3 (13.0%) |
| 60 to 64 Years | 17 (51.5%) | 0 (0.0%) |
| 65 to 74 Years | 10 (11.0%) | 0 (0.0%) |
| 75 Years and over | 0 (0.0%) | 0 (0.0%) |
| Total | 285 (52.8%) | 40 (14.0%) |
Employment Status by Educational Attainment in Clayton
According to labor force statistics for Clayton, 73.7% of individuals (219) out of the total population between 25 and 64 years of age (297) are in the labor force, with 9.6% or 21 of them being unemployed. The group with the highest labor force participation rate are those with the educational attainment of less than high school, with 84.2% or 32 individuals in the labor force. Within the labor force, individuals with high school diploma education have the highest percentage of unemployment, with 16.7% or 19 of them being unemployed.
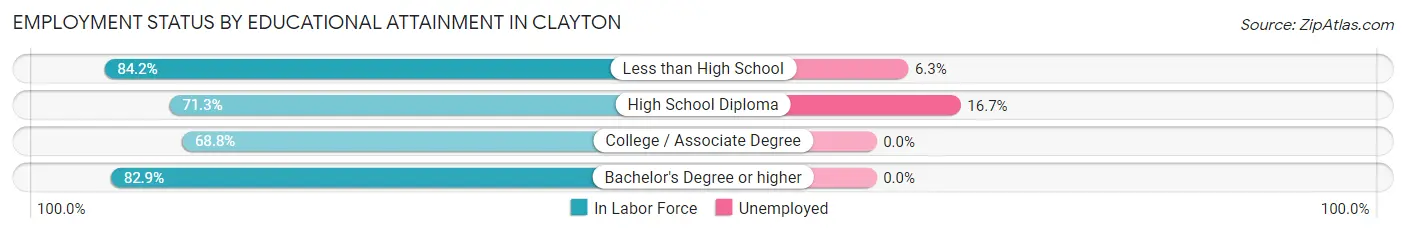
| Educational Attainment | In Labor Force | Unemployed |
| Less than High School | 32 (84.2%) | 2 (6.3%) |
| High School Diploma | 114 (71.3%) | 27 (16.7%) |
| College / Associate Degree | 44 (68.8%) | 0 (0.0%) |
| Bachelor's Degree or higher | 29 (82.9%) | 0 (0.0%) |
| Total | 219 (73.7%) | 29 (9.6%) |
Employment Occupations by Sex in Clayton
Management, Business, Science and Arts Occupations
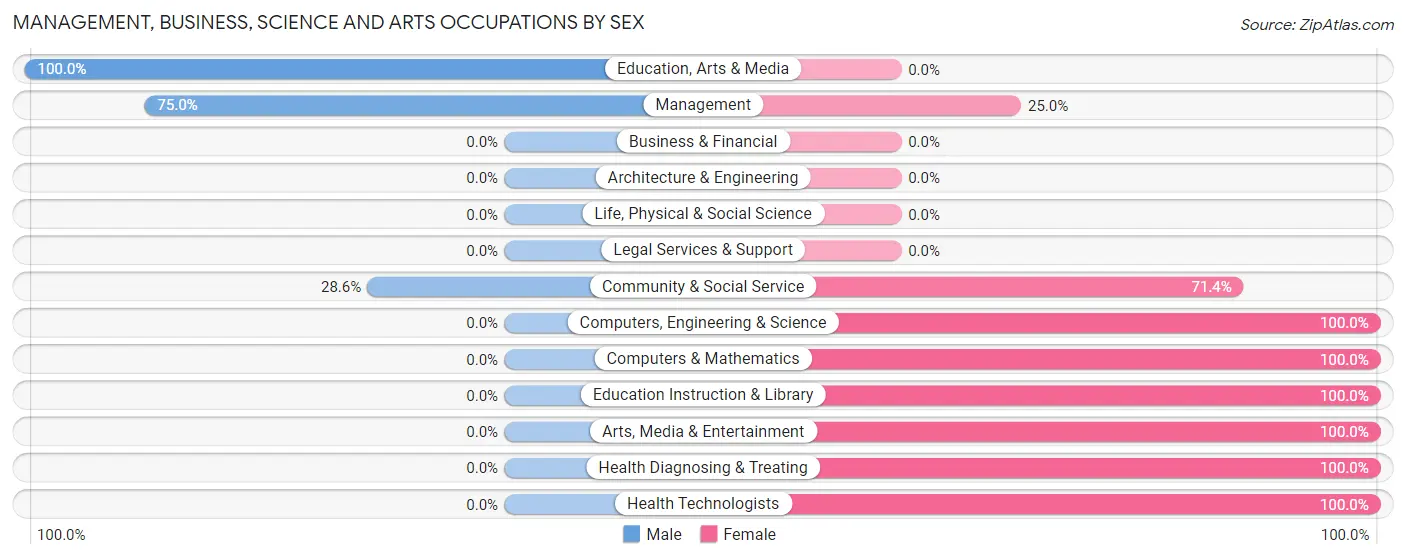
The most common Management, Business, Science and Arts occupations in Clayton are Management (12 | 4.9%), Community & Social Service (7 | 2.9%), Education Instruction & Library (3 | 1.2%), Health Diagnosing & Treating (3 | 1.2%), and Health Technologists (3 | 1.2%).
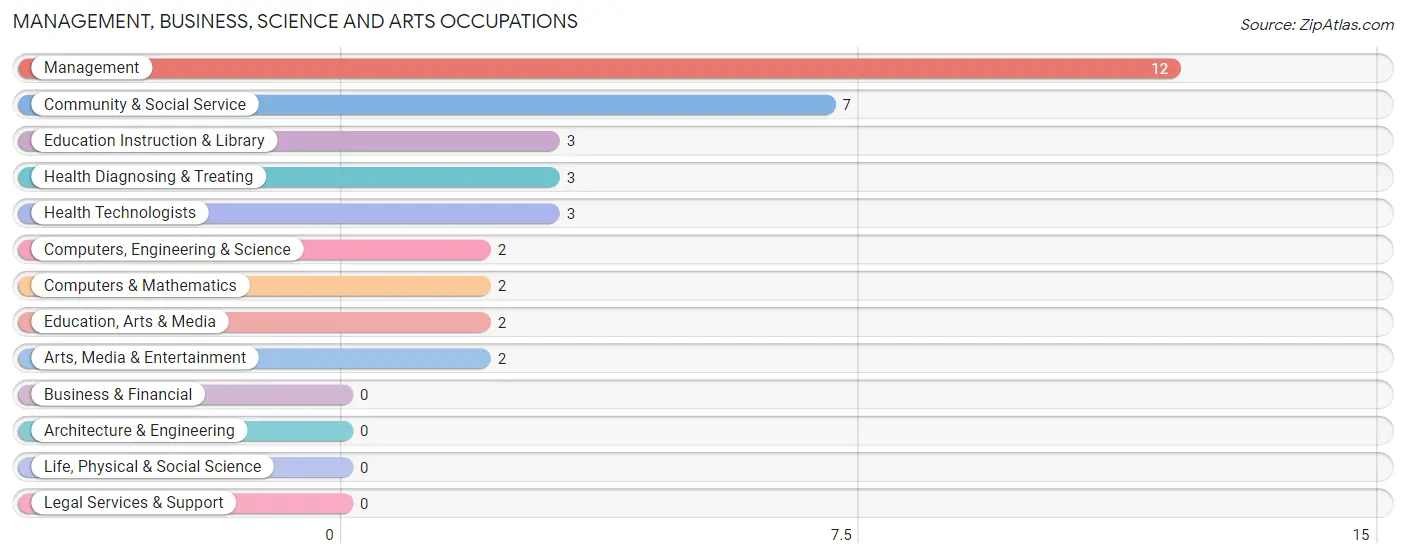
Management, Business, Science and Arts Occupations by Sex
Within the Management, Business, Science and Arts occupations in Clayton, the most male-oriented occupations are Education, Arts & Media (100.0%), Management (75.0%), and Community & Social Service (28.6%), while the most female-oriented occupations are Computers, Engineering & Science (100.0%), Computers & Mathematics (100.0%), and Education Instruction & Library (100.0%).
| Occupation | Male | Female |
| Management | 9 (75.0%) | 3 (25.0%) |
| Business & Financial | 0 (0.0%) | 0 (0.0%) |
| Computers, Engineering & Science | 0 (0.0%) | 2 (100.0%) |
| Computers & Mathematics | 0 (0.0%) | 2 (100.0%) |
| Architecture & Engineering | 0 (0.0%) | 0 (0.0%) |
| Life, Physical & Social Science | 0 (0.0%) | 0 (0.0%) |
| Community & Social Service | 2 (28.6%) | 5 (71.4%) |
| Education, Arts & Media | 2 (100.0%) | 0 (0.0%) |
| Legal Services & Support | 0 (0.0%) | 0 (0.0%) |
| Education Instruction & Library | 0 (0.0%) | 3 (100.0%) |
| Arts, Media & Entertainment | 0 (0.0%) | 2 (100.0%) |
| Health Diagnosing & Treating | 0 (0.0%) | 3 (100.0%) |
| Health Technologists | 0 (0.0%) | 3 (100.0%) |
| Total (Category) | 11 (45.8%) | 13 (54.2%) |
| Total (Overall) | 122 (49.8%) | 123 (50.2%) |
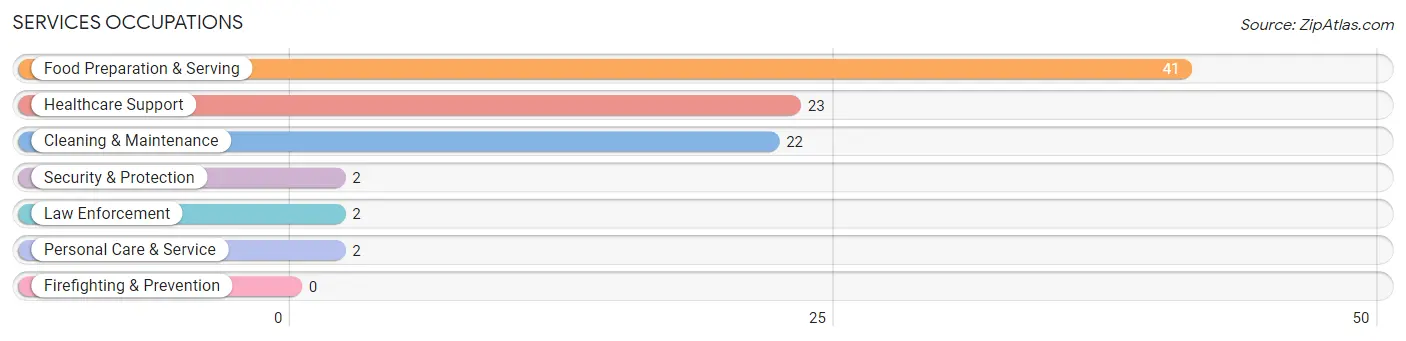
Services Occupations
The most common Services occupations in Clayton are Food Preparation & Serving (41 | 16.7%), Healthcare Support (23 | 9.4%), Cleaning & Maintenance (22 | 9.0%), Security & Protection (2 | 0.8%), and Law Enforcement (2 | 0.8%).
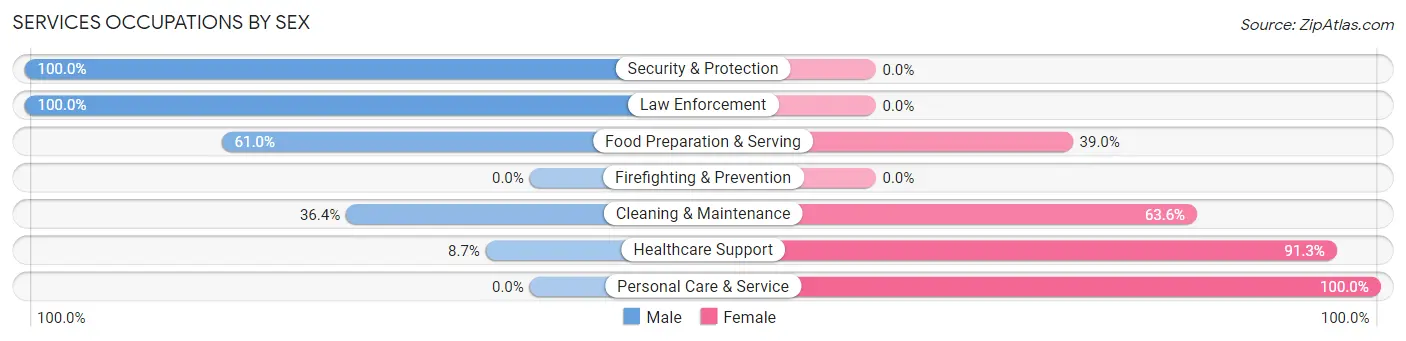
Services Occupations by Sex
Within the Services occupations in Clayton, the most male-oriented occupations are Security & Protection (100.0%), Law Enforcement (100.0%), and Food Preparation & Serving (61.0%), while the most female-oriented occupations are Personal Care & Service (100.0%), Healthcare Support (91.3%), and Cleaning & Maintenance (63.6%).
| Occupation | Male | Female |
| Healthcare Support | 2 (8.7%) | 21 (91.3%) |
| Security & Protection | 2 (100.0%) | 0 (0.0%) |
| Firefighting & Prevention | 0 (0.0%) | 0 (0.0%) |
| Law Enforcement | 2 (100.0%) | 0 (0.0%) |
| Food Preparation & Serving | 25 (61.0%) | 16 (39.0%) |
| Cleaning & Maintenance | 8 (36.4%) | 14 (63.6%) |
| Personal Care & Service | 0 (0.0%) | 2 (100.0%) |
| Total (Category) | 37 (41.1%) | 53 (58.9%) |
| Total (Overall) | 122 (49.8%) | 123 (50.2%) |
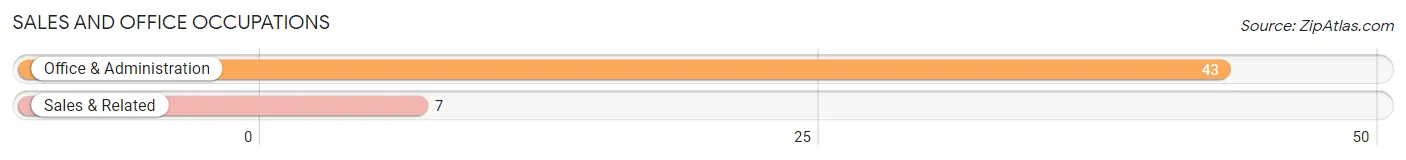
Sales and Office Occupations
The most common Sales and Office occupations in Clayton are Office & Administration (43 | 17.5%), and Sales & Related (7 | 2.9%).
Sales and Office Occupations by Sex
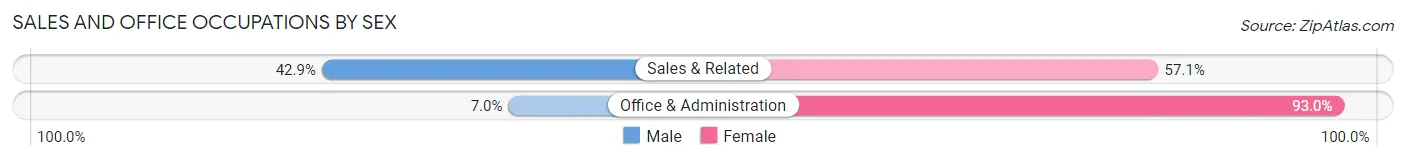
| Occupation | Male | Female |
| Sales & Related | 3 (42.9%) | 4 (57.1%) |
| Office & Administration | 3 (7.0%) | 40 (93.0%) |
| Total (Category) | 6 (12.0%) | 44 (88.0%) |
| Total (Overall) | 122 (49.8%) | 123 (50.2%) |
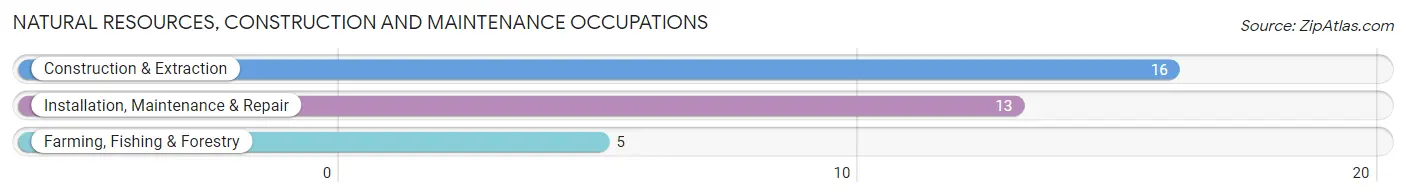
Natural Resources, Construction and Maintenance Occupations
The most common Natural Resources, Construction and Maintenance occupations in Clayton are Construction & Extraction (16 | 6.5%), Installation, Maintenance & Repair (13 | 5.3%), and Farming, Fishing & Forestry (5 | 2.0%).
Natural Resources, Construction and Maintenance Occupations by Sex
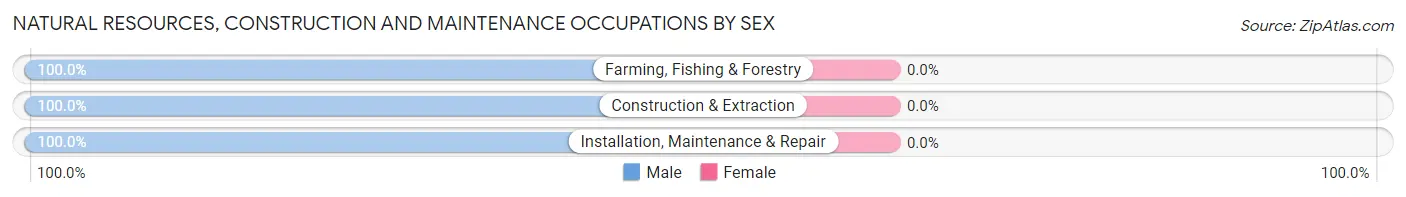
| Occupation | Male | Female |
| Farming, Fishing & Forestry | 5 (100.0%) | 0 (0.0%) |
| Construction & Extraction | 16 (100.0%) | 0 (0.0%) |
| Installation, Maintenance & Repair | 13 (100.0%) | 0 (0.0%) |
| Total (Category) | 34 (100.0%) | 0 (0.0%) |
| Total (Overall) | 122 (49.8%) | 123 (50.2%) |
Production, Transportation and Moving Occupations
The most common Production, Transportation and Moving occupations in Clayton are Production (27 | 11.0%), Material Moving (11 | 4.5%), and Transportation (9 | 3.7%).
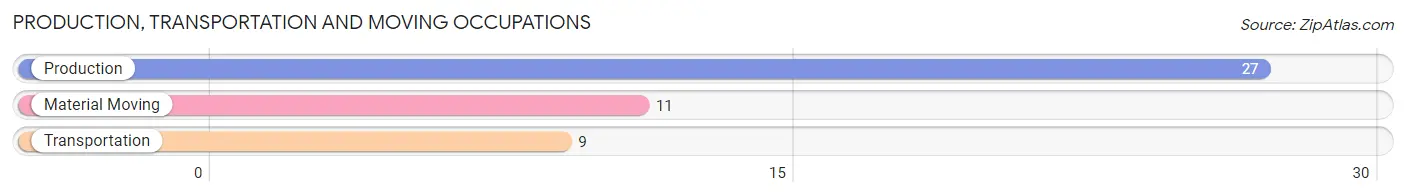
Production, Transportation and Moving Occupations by Sex
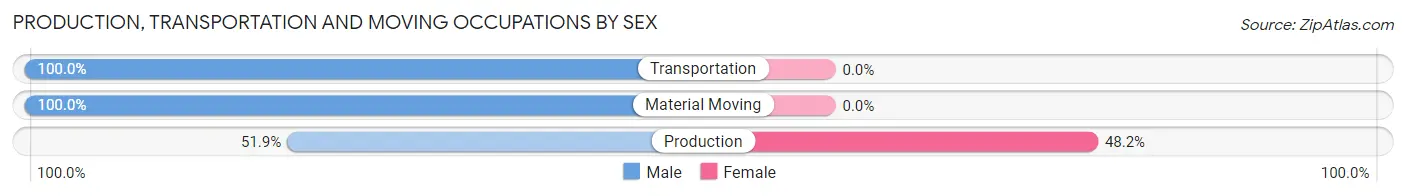
| Occupation | Male | Female |
| Production | 14 (51.8%) | 13 (48.1%) |
| Transportation | 9 (100.0%) | 0 (0.0%) |
| Material Moving | 11 (100.0%) | 0 (0.0%) |
| Total (Category) | 34 (72.3%) | 13 (27.7%) |
| Total (Overall) | 122 (49.8%) | 123 (50.2%) |
Employment Industries by Sex in Clayton
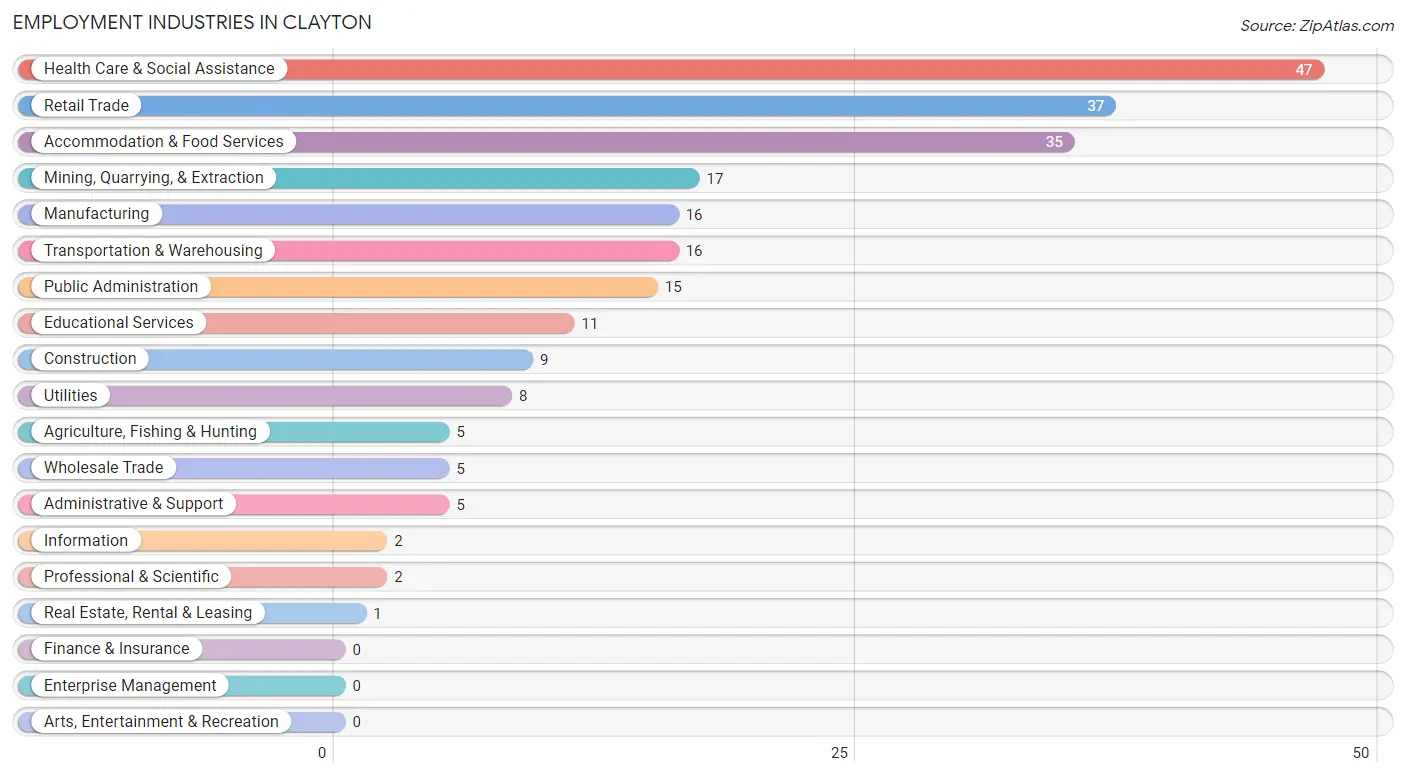
Employment Industries in Clayton
The major employment industries in Clayton include Health Care & Social Assistance (47 | 19.2%), Retail Trade (37 | 15.1%), Accommodation & Food Services (35 | 14.3%), Mining, Quarrying, & Extraction (17 | 6.9%), and Manufacturing (16 | 6.5%).
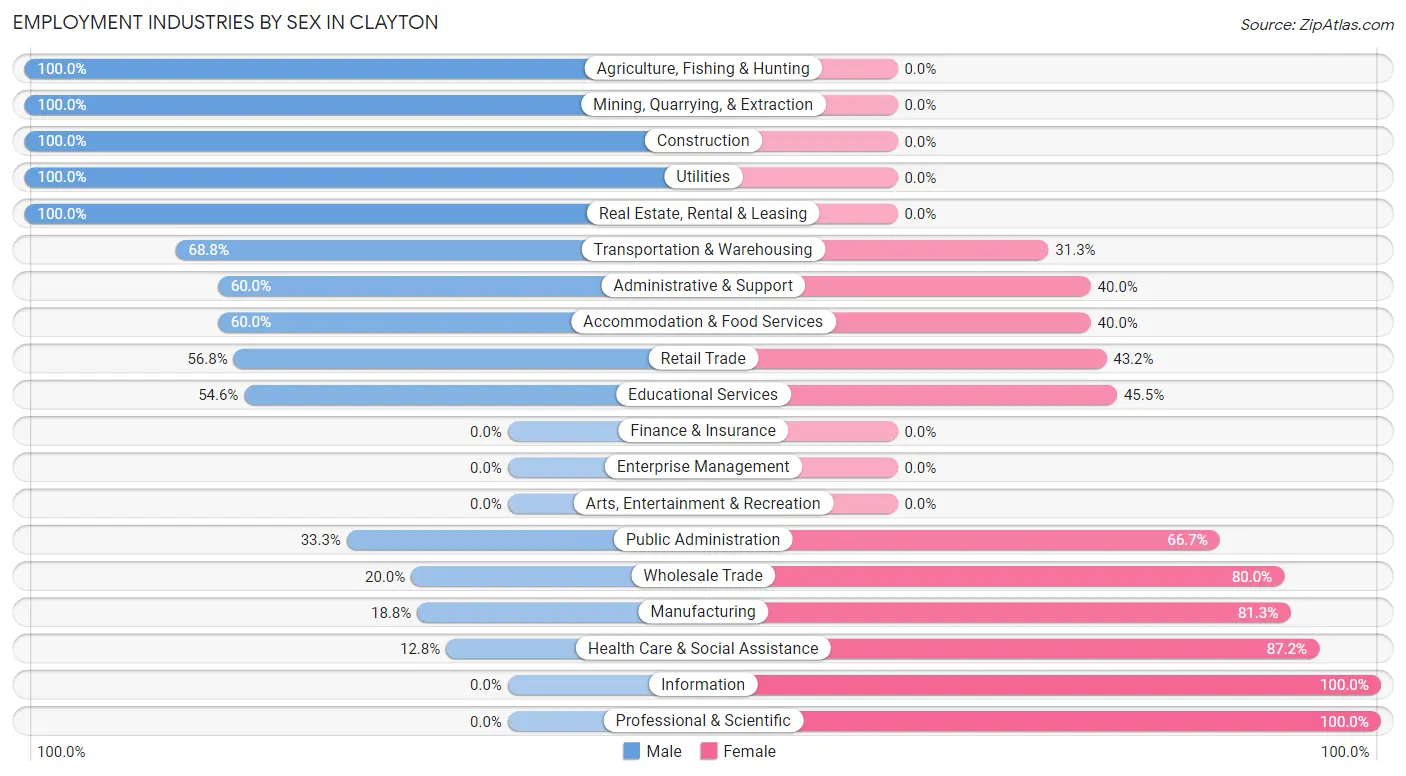
Employment Industries by Sex in Clayton
The Clayton industries that see more men than women are Agriculture, Fishing & Hunting (100.0%), Mining, Quarrying, & Extraction (100.0%), and Construction (100.0%), whereas the industries that tend to have a higher number of women are Information (100.0%), Professional & Scientific (100.0%), and Health Care & Social Assistance (87.2%).
| Industry | Male | Female |
| Agriculture, Fishing & Hunting | 5 (100.0%) | 0 (0.0%) |
| Mining, Quarrying, & Extraction | 17 (100.0%) | 0 (0.0%) |
| Construction | 9 (100.0%) | 0 (0.0%) |
| Manufacturing | 3 (18.8%) | 13 (81.2%) |
| Wholesale Trade | 1 (20.0%) | 4 (80.0%) |
| Retail Trade | 21 (56.8%) | 16 (43.2%) |
| Transportation & Warehousing | 11 (68.8%) | 5 (31.2%) |
| Utilities | 8 (100.0%) | 0 (0.0%) |
| Information | 0 (0.0%) | 2 (100.0%) |
| Finance & Insurance | 0 (0.0%) | 0 (0.0%) |
| Real Estate, Rental & Leasing | 1 (100.0%) | 0 (0.0%) |
| Professional & Scientific | 0 (0.0%) | 2 (100.0%) |
| Enterprise Management | 0 (0.0%) | 0 (0.0%) |
| Administrative & Support | 3 (60.0%) | 2 (40.0%) |
| Educational Services | 6 (54.5%) | 5 (45.5%) |
| Health Care & Social Assistance | 6 (12.8%) | 41 (87.2%) |
| Arts, Entertainment & Recreation | 0 (0.0%) | 0 (0.0%) |
| Accommodation & Food Services | 21 (60.0%) | 14 (40.0%) |
| Public Administration | 5 (33.3%) | 10 (66.7%) |
| Total | 122 (49.8%) | 123 (50.2%) |
Education in Clayton
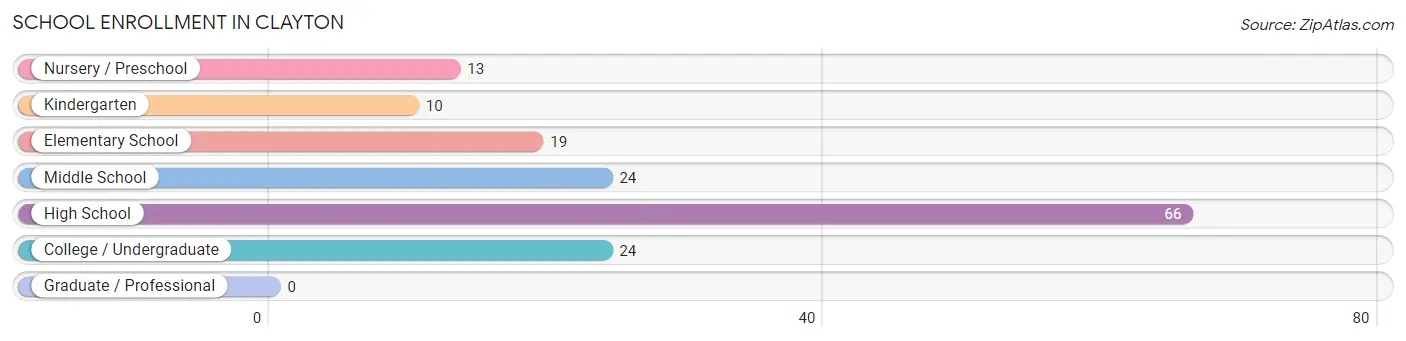
School Enrollment in Clayton
The most common levels of schooling among the 156 students in Clayton are high school (66 | 42.3%), middle school (24 | 15.4%), and college / undergraduate (24 | 15.4%).
| School Level | # Students | % Students |
| Nursery / Preschool | 13 | 8.3% |
| Kindergarten | 10 | 6.4% |
| Elementary School | 19 | 12.2% |
| Middle School | 24 | 15.4% |
| High School | 66 | 42.3% |
| College / Undergraduate | 24 | 15.4% |
| Graduate / Professional | 0 | 0.0% |
| Total | 156 | 100.0% |
School Enrollment by Age by Funding Source in Clayton
Out of a total of 156 students who are enrolled in schools in Clayton, 10 (6.4%) attend a private institution, while the remaining 146 (93.6%) are enrolled in public schools. The age group of 15 to 17 year olds has the highest likelihood of being enrolled in private schools, with 10 (17.9% in the age bracket) enrolled. Conversely, the age group of 3 to 4 year olds has the lowest likelihood of being enrolled in a private school, with 13 (100.0% in the age bracket) attending a public institution.
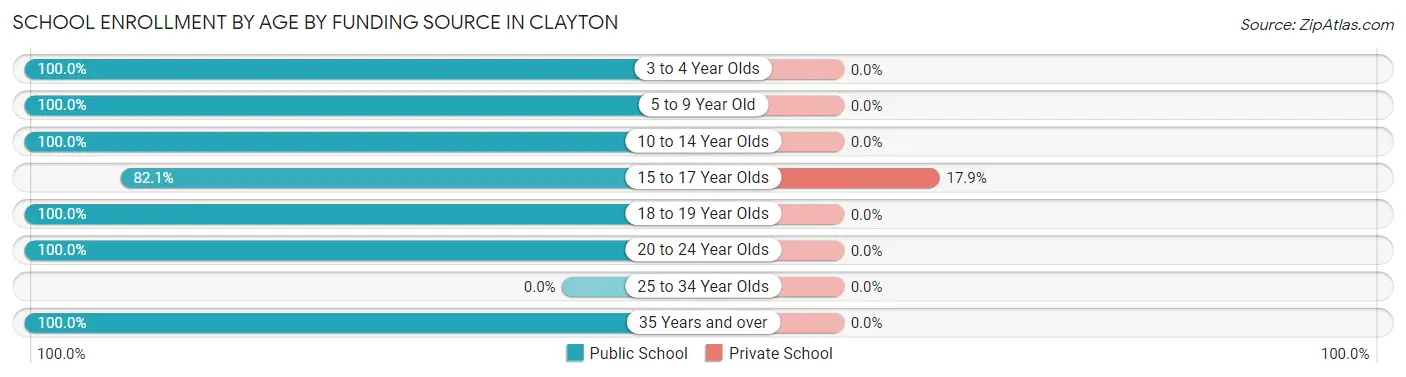
| Age Bracket | Public School | Private School |
| 3 to 4 Year Olds | 13 (100.0%) | 0 (0.0%) |
| 5 to 9 Year Old | 29 (100.0%) | 0 (0.0%) |
| 10 to 14 Year Olds | 12 (100.0%) | 0 (0.0%) |
| 15 to 17 Year Olds | 46 (82.1%) | 10 (17.9%) |
| 18 to 19 Year Olds | 33 (100.0%) | 0 (0.0%) |
| 20 to 24 Year Olds | 11 (100.0%) | 0 (0.0%) |
| 25 to 34 Year Olds | 0 (0.0%) | 0 (0.0%) |
| 35 Years and over | 2 (100.0%) | 0 (0.0%) |
| Total | 146 (93.6%) | 10 (6.4%) |
Educational Attainment by Field of Study in Clayton
Physical & health sciences (12 | 30.0%), science & technology (9 | 22.5%), engineering (5 | 12.5%), education (5 | 12.5%), and arts & humanities (3 | 7.5%) are the most common fields of study among 40 individuals in Clayton who have obtained a bachelor's degree or higher.
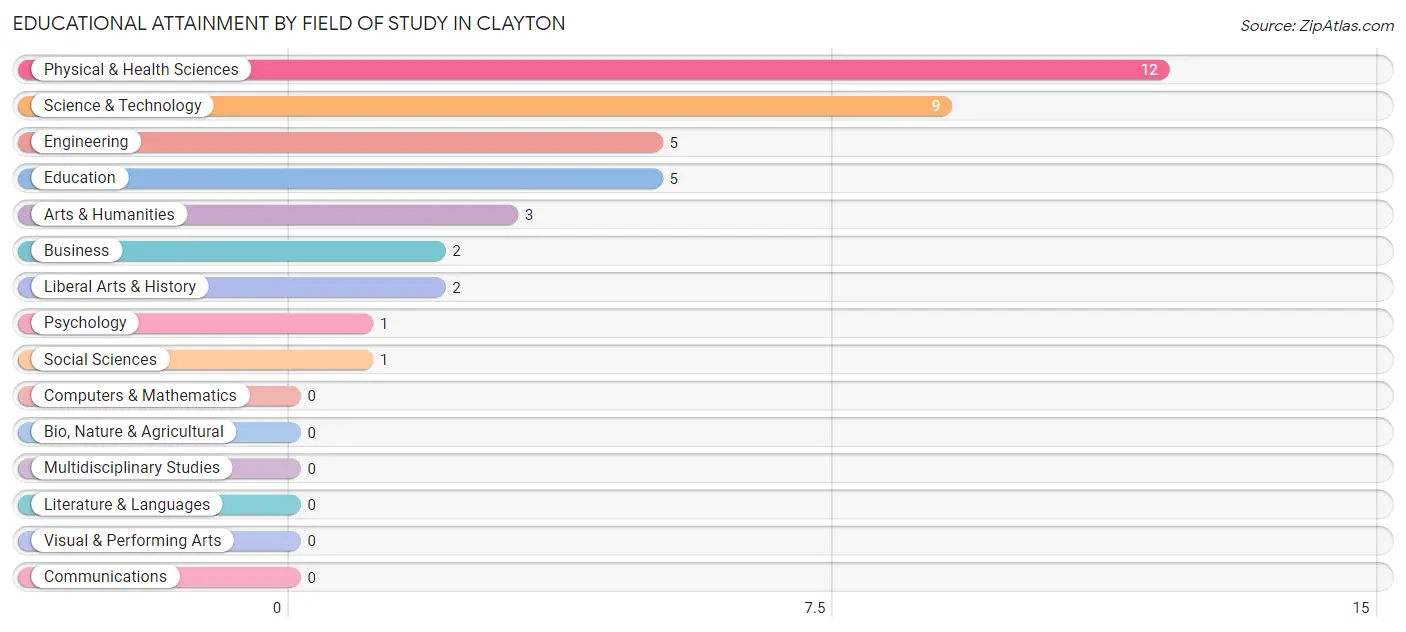
| Field of Study | # Graduates | % Graduates |
| Computers & Mathematics | 0 | 0.0% |
| Bio, Nature & Agricultural | 0 | 0.0% |
| Physical & Health Sciences | 12 | 30.0% |
| Psychology | 1 | 2.5% |
| Social Sciences | 1 | 2.5% |
| Engineering | 5 | 12.5% |
| Multidisciplinary Studies | 0 | 0.0% |
| Science & Technology | 9 | 22.5% |
| Business | 2 | 5.0% |
| Education | 5 | 12.5% |
| Literature & Languages | 0 | 0.0% |
| Liberal Arts & History | 2 | 5.0% |
| Visual & Performing Arts | 0 | 0.0% |
| Communications | 0 | 0.0% |
| Arts & Humanities | 3 | 7.5% |
| Total | 40 | 100.0% |
Transportation & Commute in Clayton
Vehicle Availability by Sex in Clayton
The most prevalent vehicle ownership categories in Clayton are males with 2 vehicles (45, accounting for 39.1%) and females with 2 vehicles (41, making up 40.9%).
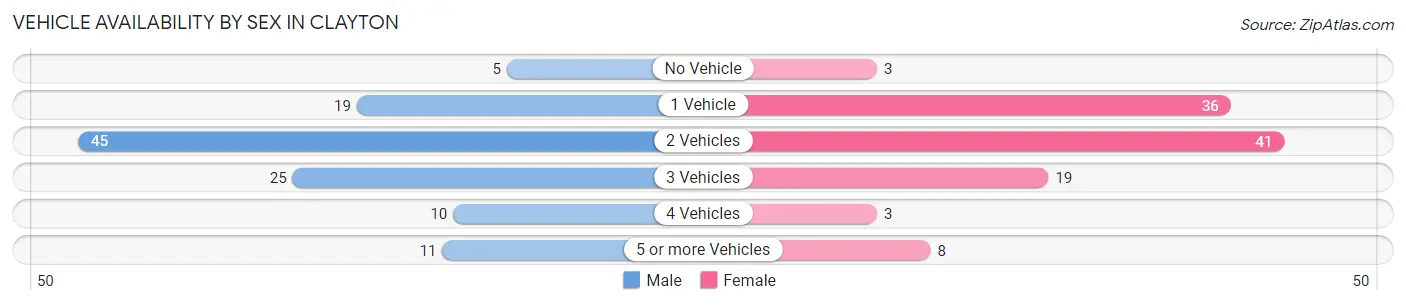
| Vehicles Available | Male | Female |
| No Vehicle | 5 (4.3%) | 3 (2.7%) |
| 1 Vehicle | 19 (16.5%) | 36 (32.7%) |
| 2 Vehicles | 45 (39.1%) | 41 (37.3%) |
| 3 Vehicles | 25 (21.7%) | 19 (17.3%) |
| 4 Vehicles | 10 (8.7%) | 3 (2.7%) |
| 5 or more Vehicles | 11 (9.6%) | 8 (7.3%) |
| Total | 115 (100.0%) | 110 (100.0%) |
Commute Time in Clayton
The most frequently occuring commute durations in Clayton are 5 to 9 minutes (51 commuters, 23.2%), less than 5 minutes (41 commuters, 18.6%), and 10 to 14 minutes (30 commuters, 13.6%).
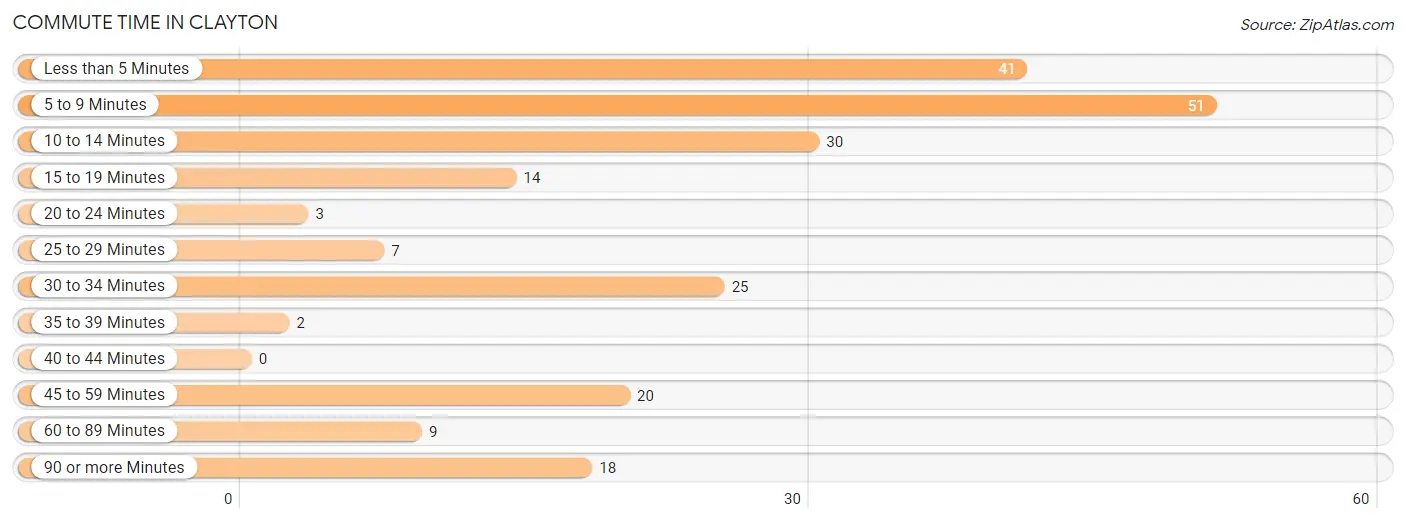
| Commute Time | # Commuters | % Commuters |
| Less than 5 Minutes | 41 | 18.6% |
| 5 to 9 Minutes | 51 | 23.2% |
| 10 to 14 Minutes | 30 | 13.6% |
| 15 to 19 Minutes | 14 | 6.4% |
| 20 to 24 Minutes | 3 | 1.4% |
| 25 to 29 Minutes | 7 | 3.2% |
| 30 to 34 Minutes | 25 | 11.4% |
| 35 to 39 Minutes | 2 | 0.9% |
| 40 to 44 Minutes | 0 | 0.0% |
| 45 to 59 Minutes | 20 | 9.1% |
| 60 to 89 Minutes | 9 | 4.1% |
| 90 or more Minutes | 18 | 8.2% |
Commute Time by Sex in Clayton
The most common commute times in Clayton are less than 5 minutes (24 commuters, 21.6%) for males and 5 to 9 minutes (35 commuters, 32.1%) for females.
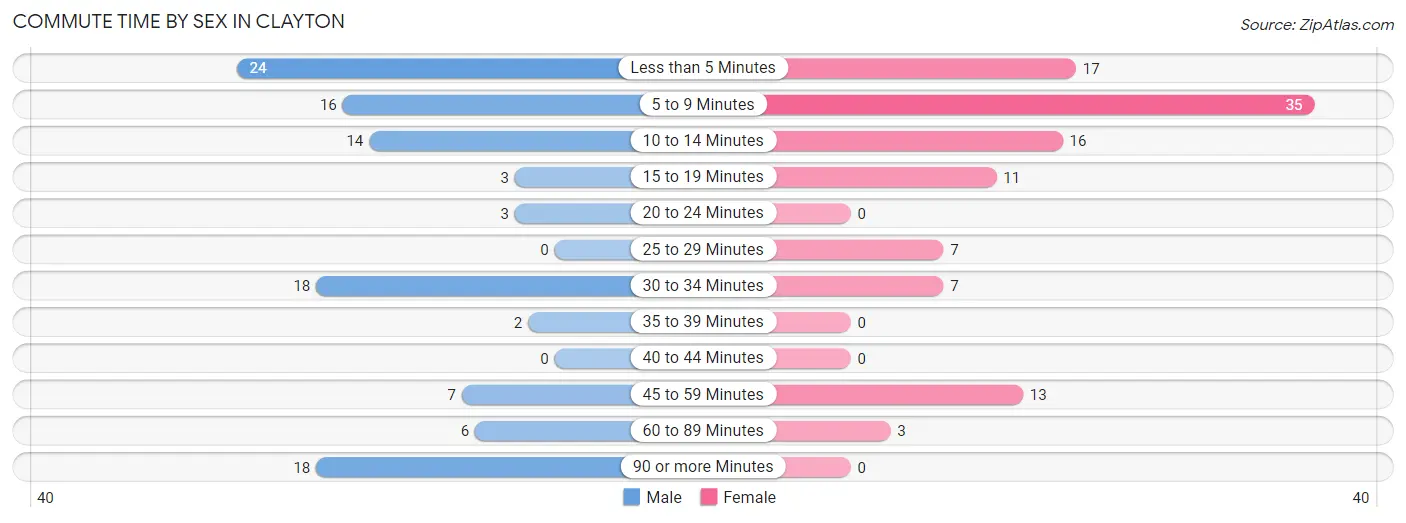
| Commute Time | Male | Female |
| Less than 5 Minutes | 24 (21.6%) | 17 (15.6%) |
| 5 to 9 Minutes | 16 (14.4%) | 35 (32.1%) |
| 10 to 14 Minutes | 14 (12.6%) | 16 (14.7%) |
| 15 to 19 Minutes | 3 (2.7%) | 11 (10.1%) |
| 20 to 24 Minutes | 3 (2.7%) | 0 (0.0%) |
| 25 to 29 Minutes | 0 (0.0%) | 7 (6.4%) |
| 30 to 34 Minutes | 18 (16.2%) | 7 (6.4%) |
| 35 to 39 Minutes | 2 (1.8%) | 0 (0.0%) |
| 40 to 44 Minutes | 0 (0.0%) | 0 (0.0%) |
| 45 to 59 Minutes | 7 (6.3%) | 13 (11.9%) |
| 60 to 89 Minutes | 6 (5.4%) | 3 (2.8%) |
| 90 or more Minutes | 18 (16.2%) | 0 (0.0%) |
Time of Departure to Work by Sex in Clayton
The most frequent times of departure to work in Clayton are 12:00 PM to 3:59 PM (30, 27.0%) for males and 8:00 AM to 8:29 AM (21, 19.3%) for females.
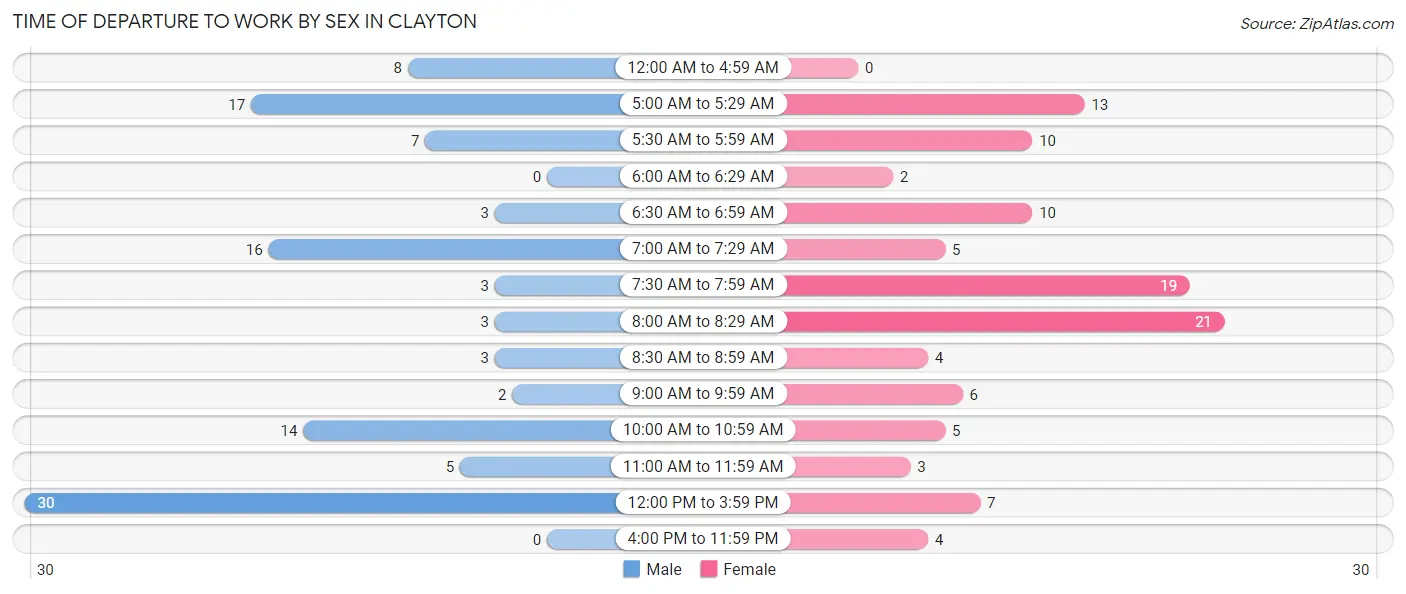
| Time of Departure | Male | Female |
| 12:00 AM to 4:59 AM | 8 (7.2%) | 0 (0.0%) |
| 5:00 AM to 5:29 AM | 17 (15.3%) | 13 (11.9%) |
| 5:30 AM to 5:59 AM | 7 (6.3%) | 10 (9.2%) |
| 6:00 AM to 6:29 AM | 0 (0.0%) | 2 (1.8%) |
| 6:30 AM to 6:59 AM | 3 (2.7%) | 10 (9.2%) |
| 7:00 AM to 7:29 AM | 16 (14.4%) | 5 (4.6%) |
| 7:30 AM to 7:59 AM | 3 (2.7%) | 19 (17.4%) |
| 8:00 AM to 8:29 AM | 3 (2.7%) | 21 (19.3%) |
| 8:30 AM to 8:59 AM | 3 (2.7%) | 4 (3.7%) |
| 9:00 AM to 9:59 AM | 2 (1.8%) | 6 (5.5%) |
| 10:00 AM to 10:59 AM | 14 (12.6%) | 5 (4.6%) |
| 11:00 AM to 11:59 AM | 5 (4.5%) | 3 (2.8%) |
| 12:00 PM to 3:59 PM | 30 (27.0%) | 7 (6.4%) |
| 4:00 PM to 11:59 PM | 0 (0.0%) | 4 (3.7%) |
| Total | 111 (100.0%) | 109 (100.0%) |
Housing Occupancy in Clayton
Occupancy by Ownership in Clayton
Of the total 278 dwellings in Clayton, owner-occupied units account for 130 (46.8%), while renter-occupied units make up 148 (53.2%).
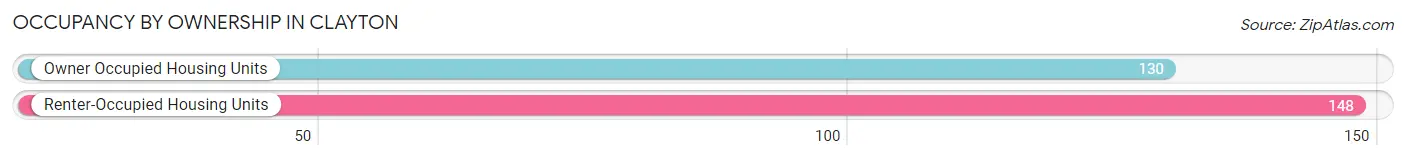
| Occupancy | # Housing Units | % Housing Units |
| Owner Occupied Housing Units | 130 | 46.8% |
| Renter-Occupied Housing Units | 148 | 53.2% |
| Total Occupied Housing Units | 278 | 100.0% |
Occupancy by Household Size in Clayton
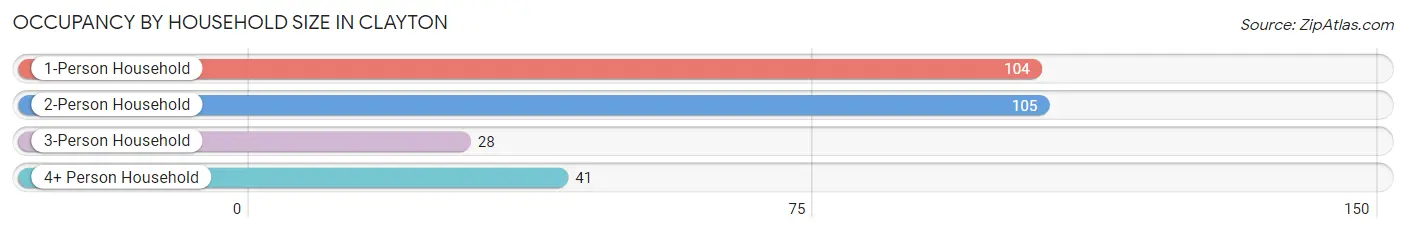
| Household Size | # Housing Units | % Housing Units |
| 1-Person Household | 104 | 37.4% |
| 2-Person Household | 105 | 37.8% |
| 3-Person Household | 28 | 10.1% |
| 4+ Person Household | 41 | 14.7% |
| Total Housing Units | 278 | 100.0% |
Occupancy by Ownership by Household Size in Clayton
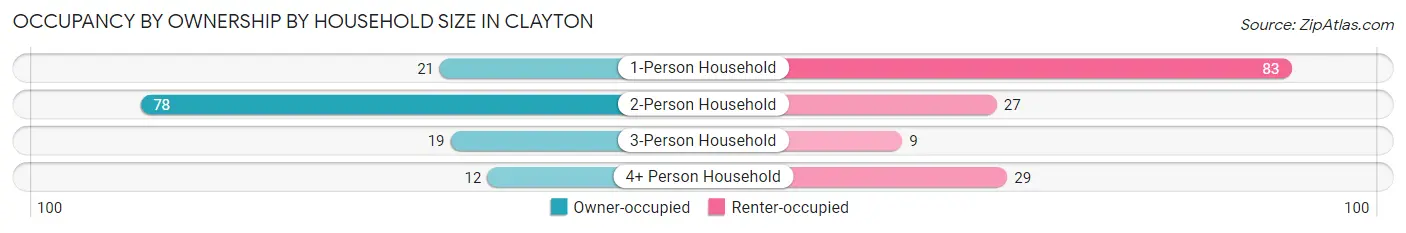
| Household Size | Owner-occupied | Renter-occupied |
| 1-Person Household | 21 (20.2%) | 83 (79.8%) |
| 2-Person Household | 78 (74.3%) | 27 (25.7%) |
| 3-Person Household | 19 (67.9%) | 9 (32.1%) |
| 4+ Person Household | 12 (29.3%) | 29 (70.7%) |
| Total Housing Units | 130 (46.8%) | 148 (53.2%) |
Occupancy by Educational Attainment in Clayton
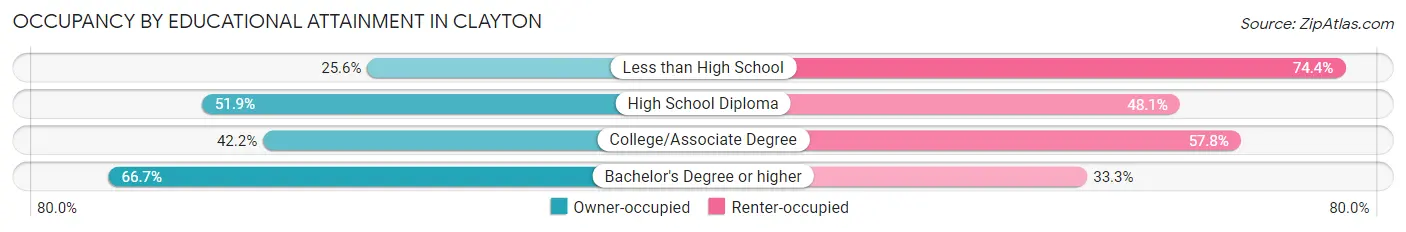
| Household Size | Owner-occupied | Renter-occupied |
| Less than High School | 10 (25.6%) | 29 (74.4%) |
| High School Diploma | 83 (51.9%) | 77 (48.1%) |
| College/Associate Degree | 27 (42.2%) | 37 (57.8%) |
| Bachelor's Degree or higher | 10 (66.7%) | 5 (33.3%) |
Occupancy by Age of Householder in Clayton
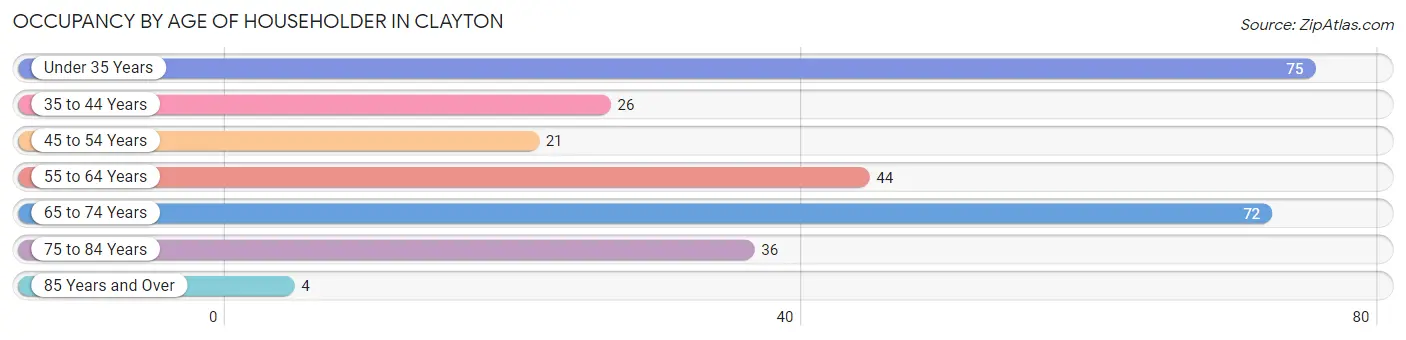
| Age Bracket | # Households | % Households |
| Under 35 Years | 75 | 27.0% |
| 35 to 44 Years | 26 | 9.3% |
| 45 to 54 Years | 21 | 7.5% |
| 55 to 64 Years | 44 | 15.8% |
| 65 to 74 Years | 72 | 25.9% |
| 75 to 84 Years | 36 | 13.0% |
| 85 Years and Over | 4 | 1.4% |
| Total | 278 | 100.0% |
Housing Finances in Clayton
Median Income by Occupancy in Clayton
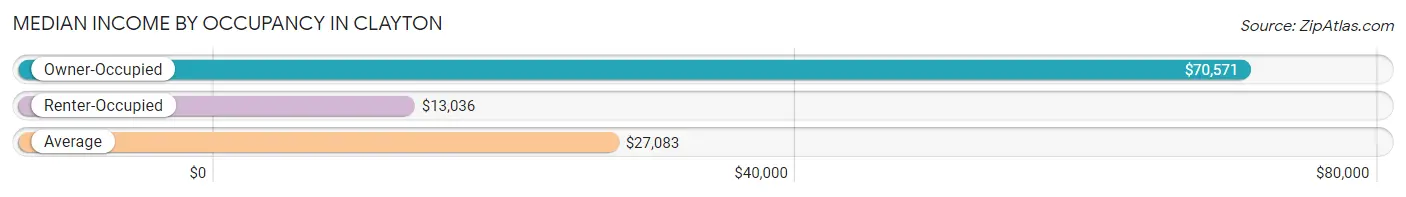
| Occupancy Type | # Households | Median Income |
| Owner-Occupied | 130 (46.8%) | $70,571 |
| Renter-Occupied | 148 (53.2%) | $13,036 |
| Average | 278 (100.0%) | $27,083 |
Occupancy by Householder Income Bracket in Clayton
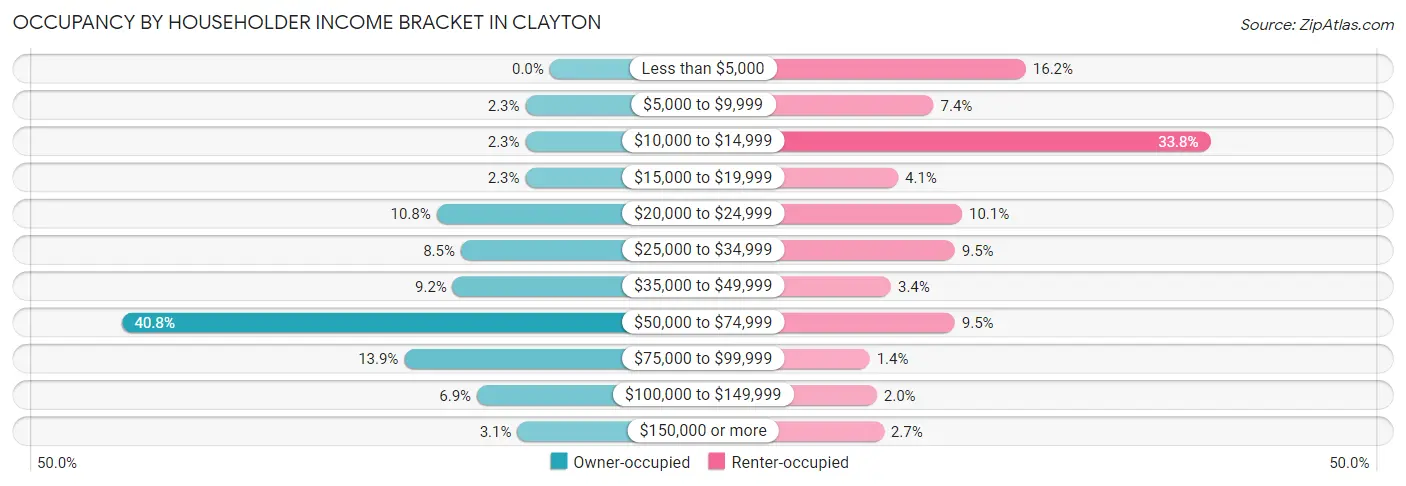
| Income Bracket | Owner-occupied | Renter-occupied |
| Less than $5,000 | 0 (0.0%) | 24 (16.2%) |
| $5,000 to $9,999 | 3 (2.3%) | 11 (7.4%) |
| $10,000 to $14,999 | 3 (2.3%) | 50 (33.8%) |
| $15,000 to $19,999 | 3 (2.3%) | 6 (4.1%) |
| $20,000 to $24,999 | 14 (10.8%) | 15 (10.1%) |
| $25,000 to $34,999 | 11 (8.5%) | 14 (9.5%) |
| $35,000 to $49,999 | 12 (9.2%) | 5 (3.4%) |
| $50,000 to $74,999 | 53 (40.8%) | 14 (9.5%) |
| $75,000 to $99,999 | 18 (13.9%) | 2 (1.3%) |
| $100,000 to $149,999 | 9 (6.9%) | 3 (2.0%) |
| $150,000 or more | 4 (3.1%) | 4 (2.7%) |
| Total | 130 (100.0%) | 148 (100.0%) |
Monthly Housing Cost Tiers in Clayton
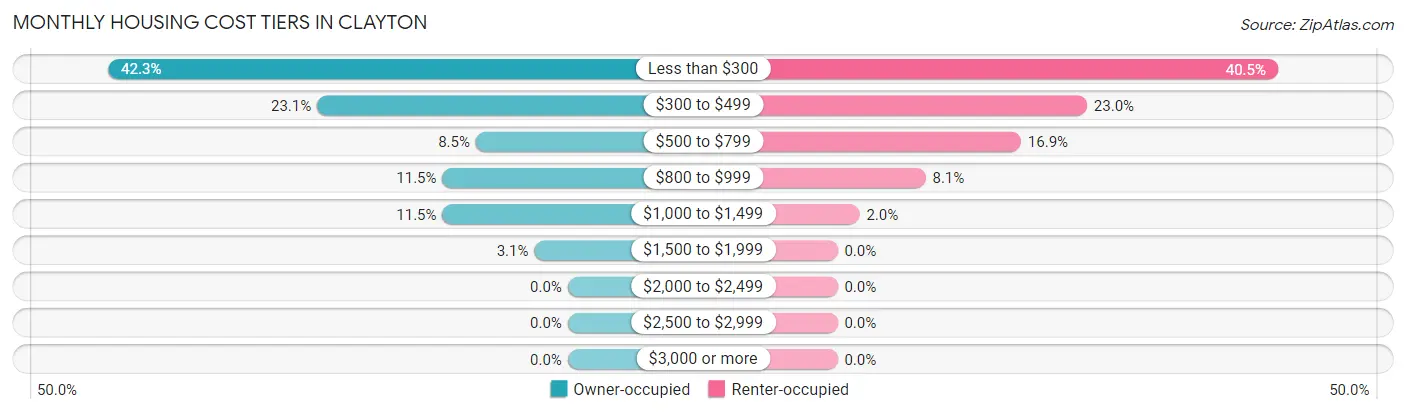
| Monthly Cost | Owner-occupied | Renter-occupied |
| Less than $300 | 55 (42.3%) | 60 (40.5%) |
| $300 to $499 | 30 (23.1%) | 34 (23.0%) |
| $500 to $799 | 11 (8.5%) | 25 (16.9%) |
| $800 to $999 | 15 (11.5%) | 12 (8.1%) |
| $1,000 to $1,499 | 15 (11.5%) | 3 (2.0%) |
| $1,500 to $1,999 | 4 (3.1%) | 0 (0.0%) |
| $2,000 to $2,499 | 0 (0.0%) | 0 (0.0%) |
| $2,500 to $2,999 | 0 (0.0%) | 0 (0.0%) |
| $3,000 or more | 0 (0.0%) | 0 (0.0%) |
| Total | 130 (100.0%) | 148 (100.0%) |
Physical Housing Characteristics in Clayton
Housing Structures in Clayton
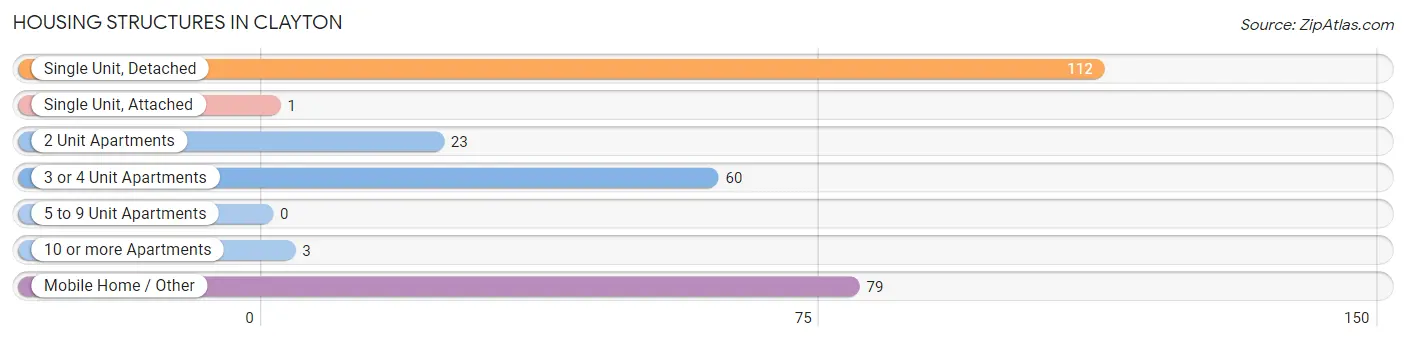
| Structure Type | # Housing Units | % Housing Units |
| Single Unit, Detached | 112 | 40.3% |
| Single Unit, Attached | 1 | 0.4% |
| 2 Unit Apartments | 23 | 8.3% |
| 3 or 4 Unit Apartments | 60 | 21.6% |
| 5 to 9 Unit Apartments | 0 | 0.0% |
| 10 or more Apartments | 3 | 1.1% |
| Mobile Home / Other | 79 | 28.4% |
| Total | 278 | 100.0% |
Housing Structures by Occupancy in Clayton
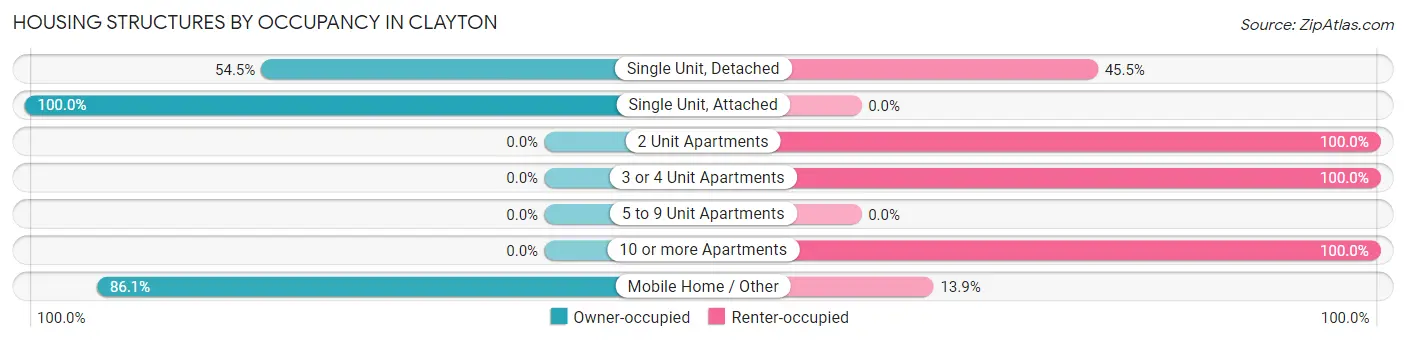
| Structure Type | Owner-occupied | Renter-occupied |
| Single Unit, Detached | 61 (54.5%) | 51 (45.5%) |
| Single Unit, Attached | 1 (100.0%) | 0 (0.0%) |
| 2 Unit Apartments | 0 (0.0%) | 23 (100.0%) |
| 3 or 4 Unit Apartments | 0 (0.0%) | 60 (100.0%) |
| 5 to 9 Unit Apartments | 0 (0.0%) | 0 (0.0%) |
| 10 or more Apartments | 0 (0.0%) | 3 (100.0%) |
| Mobile Home / Other | 68 (86.1%) | 11 (13.9%) |
| Total | 130 (46.8%) | 148 (53.2%) |
Housing Structures by Number of Rooms in Clayton
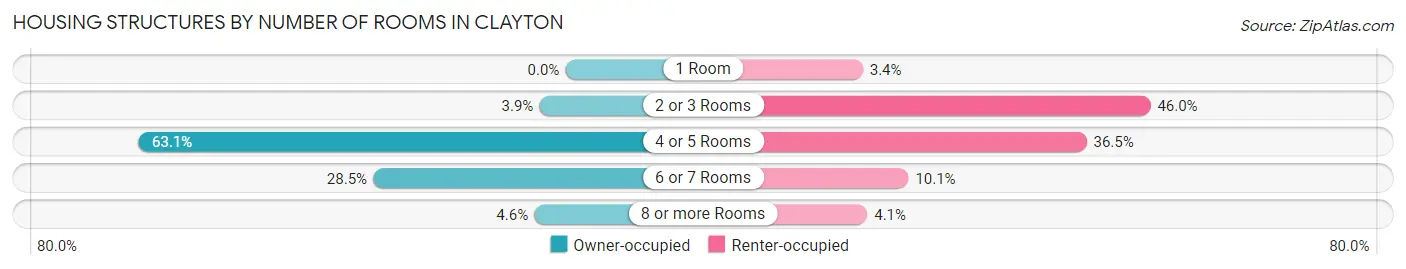
| Number of Rooms | Owner-occupied | Renter-occupied |
| 1 Room | 0 (0.0%) | 5 (3.4%) |
| 2 or 3 Rooms | 5 (3.8%) | 68 (46.0%) |
| 4 or 5 Rooms | 82 (63.1%) | 54 (36.5%) |
| 6 or 7 Rooms | 37 (28.5%) | 15 (10.1%) |
| 8 or more Rooms | 6 (4.6%) | 6 (4.1%) |
| Total | 130 (100.0%) | 148 (100.0%) |
Housing Structure by Heating Type in Clayton
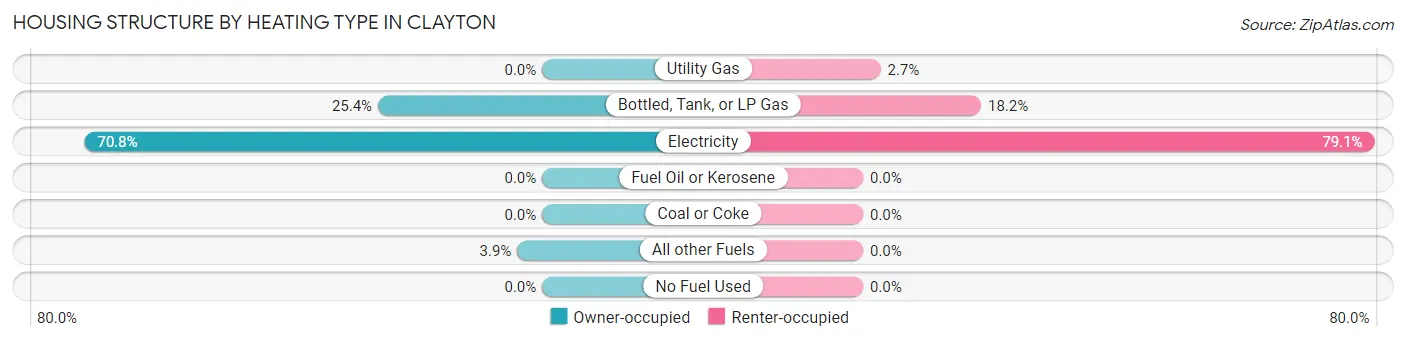
| Heating Type | Owner-occupied | Renter-occupied |
| Utility Gas | 0 (0.0%) | 4 (2.7%) |
| Bottled, Tank, or LP Gas | 33 (25.4%) | 27 (18.2%) |
| Electricity | 92 (70.8%) | 117 (79.0%) |
| Fuel Oil or Kerosene | 0 (0.0%) | 0 (0.0%) |
| Coal or Coke | 0 (0.0%) | 0 (0.0%) |
| All other Fuels | 5 (3.8%) | 0 (0.0%) |
| No Fuel Used | 0 (0.0%) | 0 (0.0%) |
| Total | 130 (100.0%) | 148 (100.0%) |
Household Vehicle Usage in Clayton
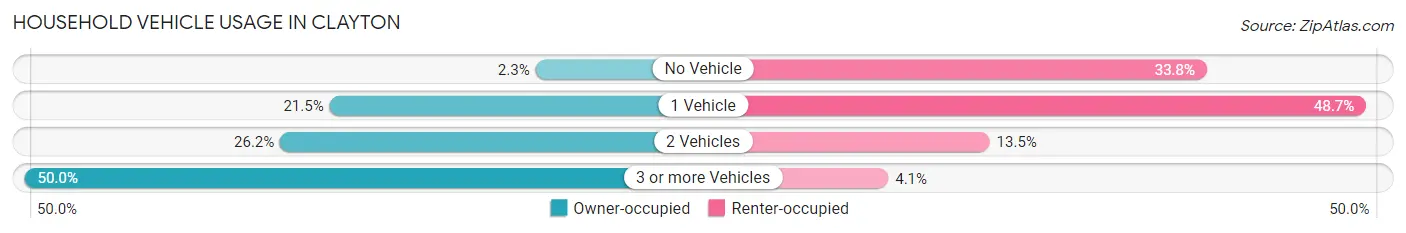
| Vehicles per Household | Owner-occupied | Renter-occupied |
| No Vehicle | 3 (2.3%) | 50 (33.8%) |
| 1 Vehicle | 28 (21.5%) | 72 (48.6%) |
| 2 Vehicles | 34 (26.2%) | 20 (13.5%) |
| 3 or more Vehicles | 65 (50.0%) | 6 (4.1%) |
| Total | 130 (100.0%) | 148 (100.0%) |
Real Estate & Mortgages in Clayton
Real Estate and Mortgage Overview in Clayton
| Characteristic | Without Mortgage | With Mortgage |
| Housing Units | 100 | 30 |
| Median Property Value | $25,600 | $80,000 |
| Median Household Income | $70,500 | $2 |
| Monthly Housing Costs | $238 | $0 |
| Real Estate Taxes | $199 | $0 |
Property Value by Mortgage Status in Clayton
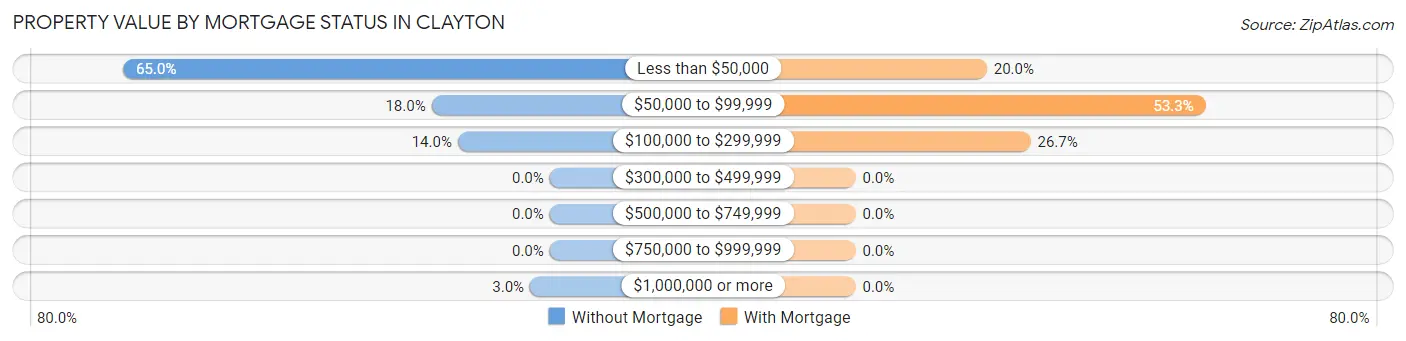
| Property Value | Without Mortgage | With Mortgage |
| Less than $50,000 | 65 (65.0%) | 6 (20.0%) |
| $50,000 to $99,999 | 18 (18.0%) | 16 (53.3%) |
| $100,000 to $299,999 | 14 (14.0%) | 8 (26.7%) |
| $300,000 to $499,999 | 0 (0.0%) | 0 (0.0%) |
| $500,000 to $749,999 | 0 (0.0%) | 0 (0.0%) |
| $750,000 to $999,999 | 0 (0.0%) | 0 (0.0%) |
| $1,000,000 or more | 3 (3.0%) | 0 (0.0%) |
| Total | 100 (100.0%) | 30 (100.0%) |
Household Income by Mortgage Status in Clayton
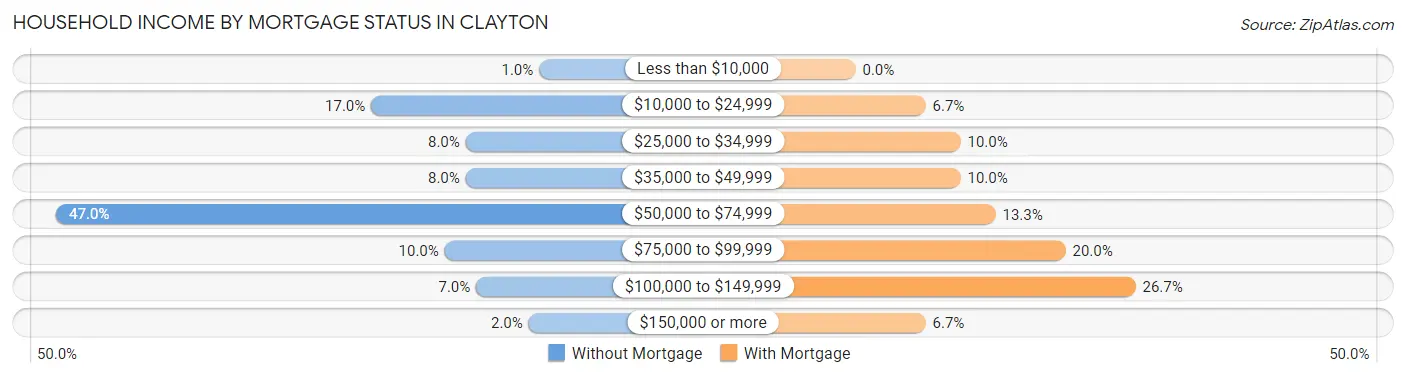
| Household Income | Without Mortgage | With Mortgage |
| Less than $10,000 | 1 (1.0%) | 0 (0.0%) |
| $10,000 to $24,999 | 17 (17.0%) | 2 (6.7%) |
| $25,000 to $34,999 | 8 (8.0%) | 3 (10.0%) |
| $35,000 to $49,999 | 8 (8.0%) | 3 (10.0%) |
| $50,000 to $74,999 | 47 (47.0%) | 4 (13.3%) |
| $75,000 to $99,999 | 10 (10.0%) | 6 (20.0%) |
| $100,000 to $149,999 | 7 (7.0%) | 8 (26.7%) |
| $150,000 or more | 2 (2.0%) | 2 (6.7%) |
| Total | 100 (100.0%) | 30 (100.0%) |
Property Value to Household Income Ratio in Clayton
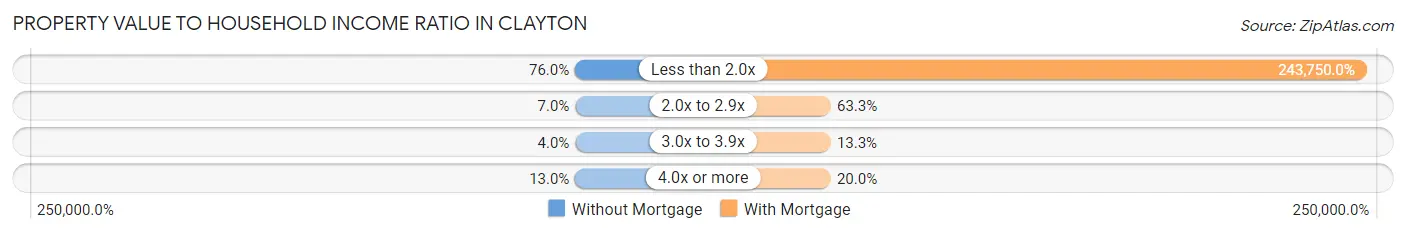
| Value-to-Income Ratio | Without Mortgage | With Mortgage |
| Less than 2.0x | 76 (76.0%) | 73,125 (243,750.0%) |
| 2.0x to 2.9x | 7 (7.0%) | 19 (63.3%) |
| 3.0x to 3.9x | 4 (4.0%) | 4 (13.3%) |
| 4.0x or more | 13 (13.0%) | 6 (20.0%) |
| Total | 100 (100.0%) | 30 (100.0%) |
Real Estate Taxes by Mortgage Status in Clayton
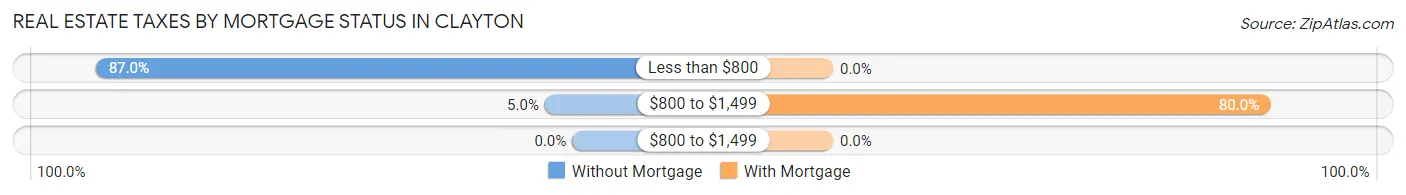
| Property Taxes | Without Mortgage | With Mortgage |
| Less than $800 | 87 (87.0%) | 0 (0.0%) |
| $800 to $1,499 | 5 (5.0%) | 24 (80.0%) |
| $800 to $1,499 | 0 (0.0%) | 0 (0.0%) |
| Total | 100 (100.0%) | 30 (100.0%) |
Health & Disability in Clayton
Health Insurance Coverage by Age in Clayton
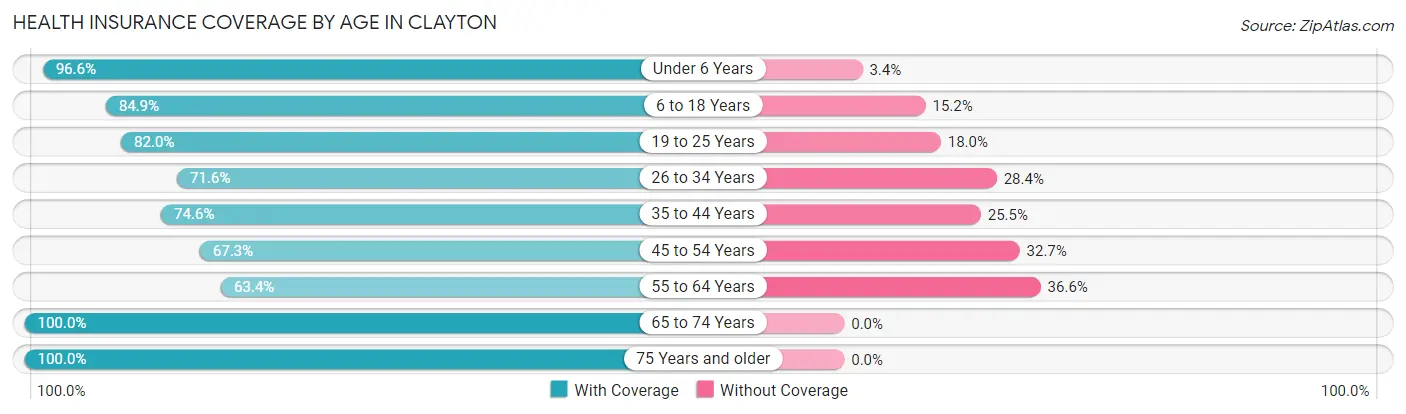
| Age Bracket | With Coverage | Without Coverage |
| Under 6 Years | 57 (96.6%) | 2 (3.4%) |
| 6 to 18 Years | 112 (84.9%) | 20 (15.1%) |
| 19 to 25 Years | 41 (82.0%) | 9 (18.0%) |
| 26 to 34 Years | 73 (71.6%) | 29 (28.4%) |
| 35 to 44 Years | 41 (74.6%) | 14 (25.5%) |
| 45 to 54 Years | 35 (67.3%) | 17 (32.7%) |
| 55 to 64 Years | 45 (63.4%) | 26 (36.6%) |
| 65 to 74 Years | 91 (100.0%) | 0 (0.0%) |
| 75 Years and older | 50 (100.0%) | 0 (0.0%) |
| Total | 545 (82.3%) | 117 (17.7%) |
Health Insurance Coverage by Citizenship Status in Clayton
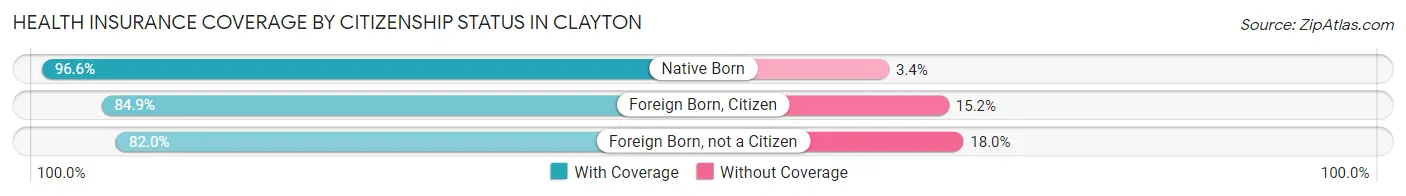
| Citizenship Status | With Coverage | Without Coverage |
| Native Born | 57 (96.6%) | 2 (3.4%) |
| Foreign Born, Citizen | 112 (84.9%) | 20 (15.1%) |
| Foreign Born, not a Citizen | 41 (82.0%) | 9 (18.0%) |
Health Insurance Coverage by Household Income in Clayton
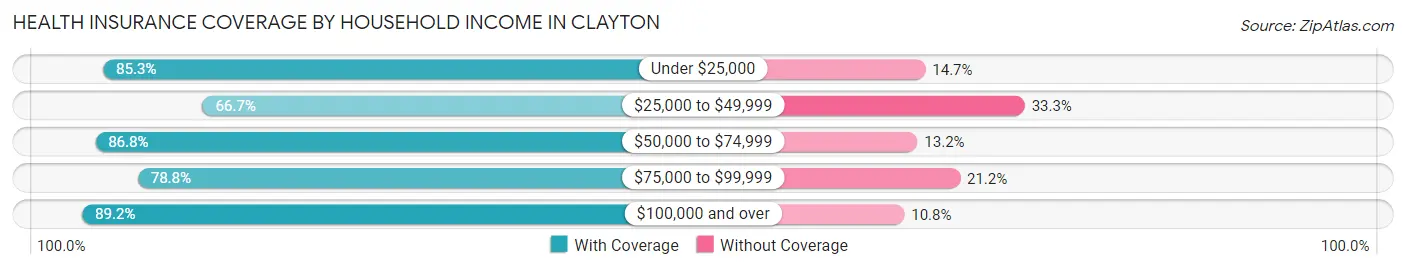
| Household Income | With Coverage | Without Coverage |
| Under $25,000 | 197 (85.3%) | 34 (14.7%) |
| $25,000 to $49,999 | 74 (66.7%) | 37 (33.3%) |
| $50,000 to $74,999 | 164 (86.8%) | 25 (13.2%) |
| $75,000 to $99,999 | 52 (78.8%) | 14 (21.2%) |
| $100,000 and over | 58 (89.2%) | 7 (10.8%) |
Public vs Private Health Insurance Coverage by Age in Clayton
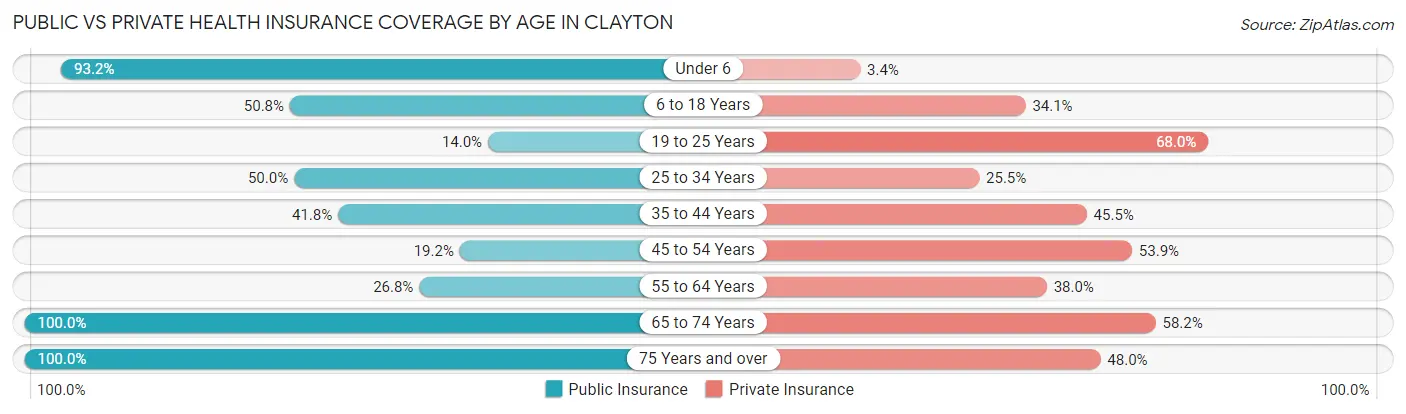
| Age Bracket | Public Insurance | Private Insurance |
| Under 6 | 55 (93.2%) | 2 (3.4%) |
| 6 to 18 Years | 67 (50.8%) | 45 (34.1%) |
| 19 to 25 Years | 7 (14.0%) | 34 (68.0%) |
| 25 to 34 Years | 51 (50.0%) | 26 (25.5%) |
| 35 to 44 Years | 23 (41.8%) | 25 (45.5%) |
| 45 to 54 Years | 10 (19.2%) | 28 (53.8%) |
| 55 to 64 Years | 19 (26.8%) | 27 (38.0%) |
| 65 to 74 Years | 91 (100.0%) | 53 (58.2%) |
| 75 Years and over | 50 (100.0%) | 24 (48.0%) |
| Total | 373 (56.3%) | 264 (39.9%) |
Disability Status by Sex by Age in Clayton
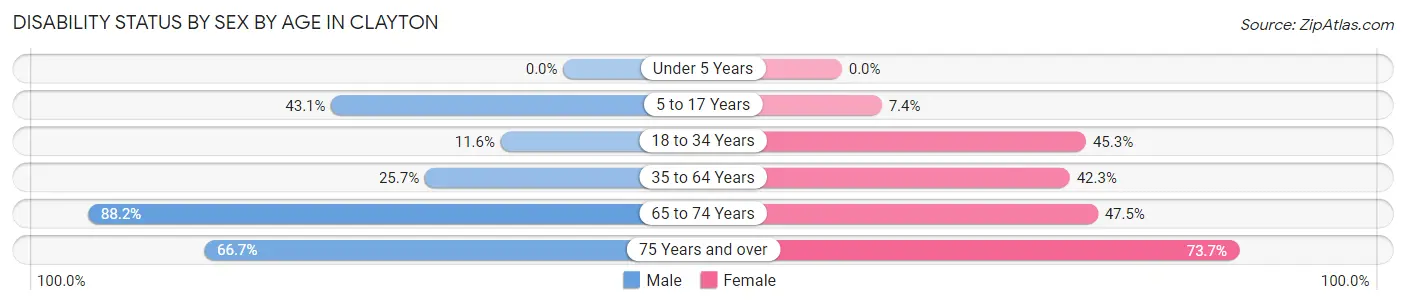
| Age Bracket | Male | Female |
| Under 5 Years | 0 (0.0%) | 0 (0.0%) |
| 5 to 17 Years | 31 (43.1%) | 2 (7.4%) |
| 18 to 34 Years | 13 (11.6%) | 34 (45.3%) |
| 35 to 64 Years | 19 (25.7%) | 44 (42.3%) |
| 65 to 74 Years | 45 (88.2%) | 19 (47.5%) |
| 75 Years and over | 8 (66.7%) | 28 (73.7%) |
Disability Class by Sex by Age in Clayton
Disability Class: Hearing Difficulty
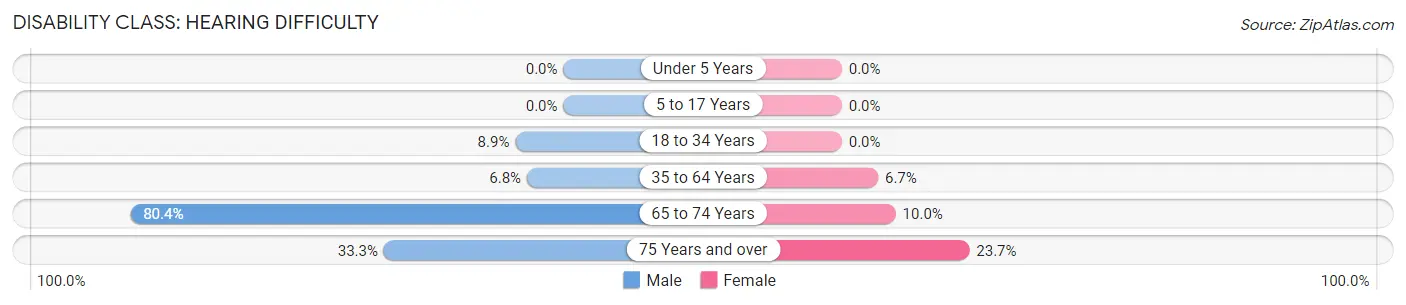
| Age Bracket | Male | Female |
| Under 5 Years | 0 (0.0%) | 0 (0.0%) |
| 5 to 17 Years | 0 (0.0%) | 0 (0.0%) |
| 18 to 34 Years | 10 (8.9%) | 0 (0.0%) |
| 35 to 64 Years | 5 (6.8%) | 7 (6.7%) |
| 65 to 74 Years | 41 (80.4%) | 4 (10.0%) |
| 75 Years and over | 4 (33.3%) | 9 (23.7%) |
Disability Class: Vision Difficulty
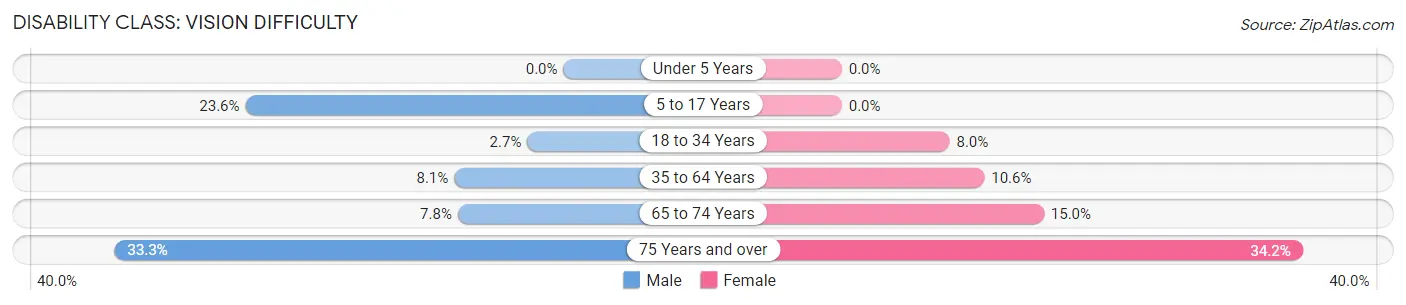
| Age Bracket | Male | Female |
| Under 5 Years | 0 (0.0%) | 0 (0.0%) |
| 5 to 17 Years | 17 (23.6%) | 0 (0.0%) |
| 18 to 34 Years | 3 (2.7%) | 6 (8.0%) |
| 35 to 64 Years | 6 (8.1%) | 11 (10.6%) |
| 65 to 74 Years | 4 (7.8%) | 6 (15.0%) |
| 75 Years and over | 4 (33.3%) | 13 (34.2%) |
Disability Class: Cognitive Difficulty
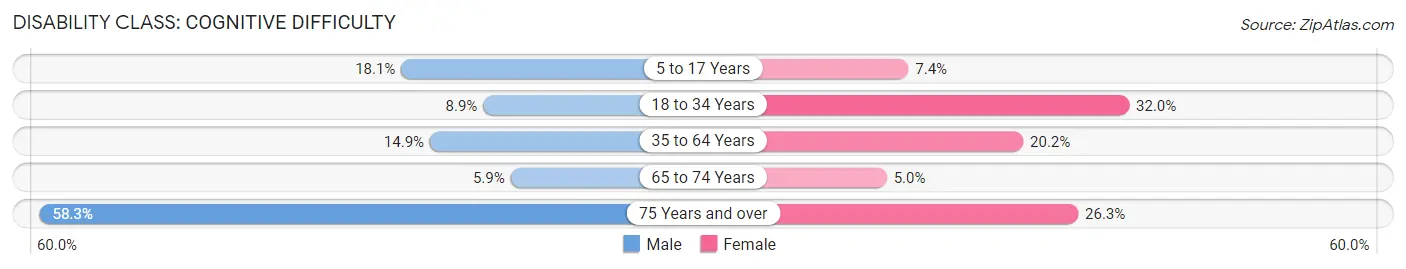
| Age Bracket | Male | Female |
| 5 to 17 Years | 13 (18.1%) | 2 (7.4%) |
| 18 to 34 Years | 10 (8.9%) | 24 (32.0%) |
| 35 to 64 Years | 11 (14.9%) | 21 (20.2%) |
| 65 to 74 Years | 3 (5.9%) | 2 (5.0%) |
| 75 Years and over | 7 (58.3%) | 10 (26.3%) |
Disability Class: Ambulatory Difficulty
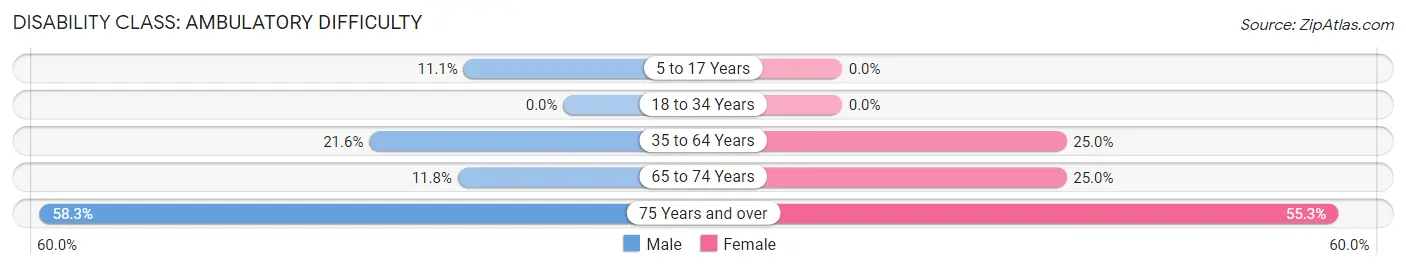
| Age Bracket | Male | Female |
| 5 to 17 Years | 8 (11.1%) | 0 (0.0%) |
| 18 to 34 Years | 0 (0.0%) | 0 (0.0%) |
| 35 to 64 Years | 16 (21.6%) | 26 (25.0%) |
| 65 to 74 Years | 6 (11.8%) | 10 (25.0%) |
| 75 Years and over | 7 (58.3%) | 21 (55.3%) |
Disability Class: Self-Care Difficulty
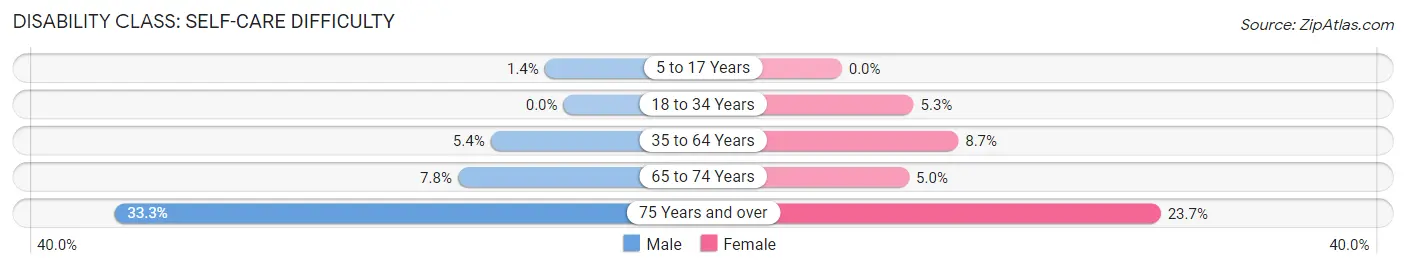
| Age Bracket | Male | Female |
| 5 to 17 Years | 1 (1.4%) | 0 (0.0%) |
| 18 to 34 Years | 0 (0.0%) | 4 (5.3%) |
| 35 to 64 Years | 4 (5.4%) | 9 (8.6%) |
| 65 to 74 Years | 4 (7.8%) | 2 (5.0%) |
| 75 Years and over | 4 (33.3%) | 9 (23.7%) |
Technology Access in Clayton
Computing Device Access in Clayton
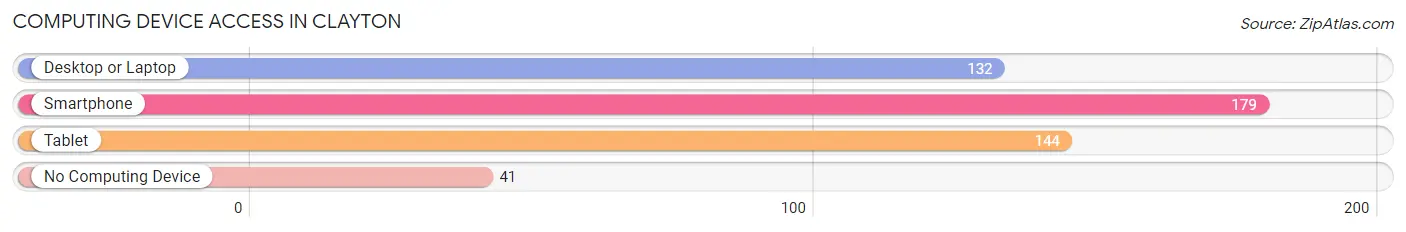
| Device Type | # Households | % Households |
| Desktop or Laptop | 132 | 47.5% |
| Smartphone | 179 | 64.4% |
| Tablet | 144 | 51.8% |
| No Computing Device | 41 | 14.7% |
| Total | 278 | 100.0% |
Internet Access in Clayton
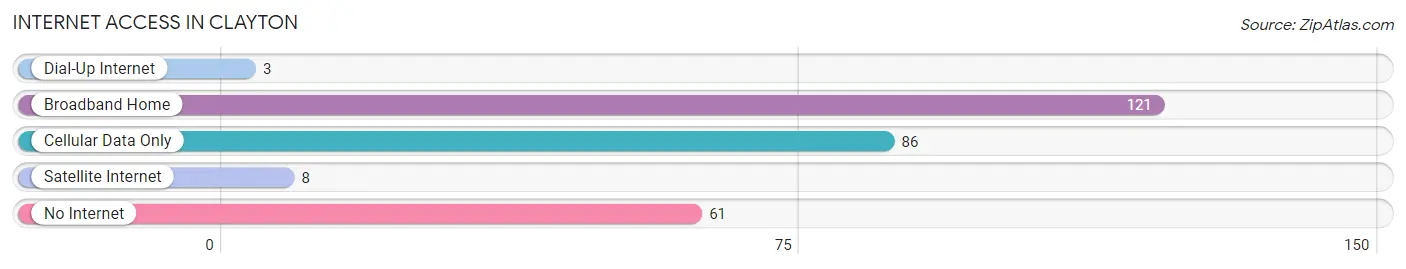
| Internet Type | # Households | % Households |
| Dial-Up Internet | 3 | 1.1% |
| Broadband Home | 121 | 43.5% |
| Cellular Data Only | 86 | 30.9% |
| Satellite Internet | 8 | 2.9% |
| No Internet | 61 | 21.9% |
| Total | 278 | 100.0% |
Clayton Summary
Clayton is a small town located in Pushmataha County, Oklahoma. It is situated in the southeastern part of the state, about 20 miles from the Arkansas border. The town was founded in 1891 and was named after the first postmaster, John Clayton. The population of Clayton was 1,072 in the 2010 census.
Geography
Clayton is located in the foothills of the Ouachita Mountains, which are part of the larger Appalachian Mountains. The town is situated in a valley surrounded by hills and mountains. The town is located at an elevation of 890 feet above sea level. The climate in Clayton is humid subtropical, with hot summers and mild winters. The average annual temperature is around 64 degrees Fahrenheit.
The town is located near the Kiamichi River, which is a tributary of the Red River. The Kiamichi River is a popular destination for fishing, canoeing, and kayaking. The town is also located near the Ouachita National Forest, which is a popular destination for camping, hiking, and other outdoor activities.
Economy
The economy of Clayton is largely based on agriculture and forestry. The town is home to several farms and ranches, which produce a variety of crops, including cotton, corn, soybeans, and wheat. The town is also home to several timber companies, which harvest timber from the surrounding forests.
The town is also home to several small businesses, including restaurants, retail stores, and service providers. The town is also home to a few manufacturing companies, which produce a variety of products, including furniture, clothing, and automotive parts.
Demographics
The population of Clayton was 1,072 in the 2010 census. The town is predominantly white, with a small minority population. The median household income in Clayton is $31,250, and the median age is 41. The town has a high rate of poverty, with nearly 25% of the population living below the poverty line.
The town is served by the Clayton Public School District, which includes one elementary school, one middle school, and one high school. The town is also home to a branch of Eastern Oklahoma State College.
Conclusion
Clayton is a small town located in Pushmataha County, Oklahoma. It is situated in the southeastern part of the state, about 20 miles from the Arkansas border. The town was founded in 1891 and was named after the first postmaster, John Clayton. The economy of Clayton is largely based on agriculture and forestry, and the town is home to several small businesses. The population of Clayton was 1,072 in the 2010 census, and the town is predominantly white, with a small minority population. The town is served by the Clayton Public School District, and is home to a branch of Eastern Oklahoma State College.
Common Questions
What is Per Capita Income in Clayton?
Per Capita income in Clayton is $19,043.
What is the Median Family Income in Clayton?
Median Family Income in Clayton is $43,333.
What is the Median Household income in Clayton?
Median Household Income in Clayton is $27,083.
What is Income or Wage Gap in Clayton?
Income or Wage Gap in Clayton is 53.0%.
Women in Clayton earn 47.0 cents for every dollar earned by a man.
What is Inequality or Gini Index in Clayton?
Inequality or Gini Index in Clayton is 0.47.
What is the Total Population of Clayton?
Total Population of Clayton is 662.
What is the Total Male Population of Clayton?
Total Male Population of Clayton is 356.
What is the Total Female Population of Clayton?
Total Female Population of Clayton is 306.
What is the Ratio of Males per 100 Females in Clayton?
There are 116.34 Males per 100 Females in Clayton.
What is the Ratio of Females per 100 Males in Clayton?
There are 85.96 Females per 100 Males in Clayton.
What is the Median Population Age in Clayton?
Median Population Age in Clayton is 32.7 Years.
What is the Average Family Size in Clayton
Average Family Size in Clayton is 3.5 People.
What is the Average Household Size in Clayton
Average Household Size in Clayton is 2.4 People.
How Large is the Labor Force in Clayton?
There are 285 People in the Labor Forcein in Clayton.
What is the Percentage of People in the Labor Force in Clayton?
52.8% of People are in the Labor Force in Clayton.
What is the Unemployment Rate in Clayton?
Unemployment Rate in Clayton is 14.0%.