Berryville, AR Map & Demographics
Berryville Map
Berryville Overview
$21,656
PER CAPITA INCOME
$46,750
AVG FAMILY INCOME
$43,388
AVG HOUSEHOLD INCOME
13.6%
WAGE / INCOME GAP [ % ]
86.4¢/ $1
WAGE / INCOME GAP [ $ ]
$10,131
FAMILY INCOME DEFICIT
0.43
INEQUALITY / GINI INDEX
5,667
TOTAL POPULATION
2,762
MALE POPULATION
2,905
FEMALE POPULATION
95.08
MALES / 100 FEMALES
105.18
FEMALES / 100 MALES
37.4
MEDIAN AGE
2.8
AVG FAMILY SIZE
2.4
AVG HOUSEHOLD SIZE
2,210
LABOR FORCE [ PEOPLE ]
49.6%
PERCENT IN LABOR FORCE
5.9%
UNEMPLOYMENT RATE
Berryville Zip Codes
Berryville Area Codes
Income in Berryville
Income Overview in Berryville
Per Capita Income in Berryville is $21,656, while median incomes of families and households are $46,750 and $43,388 respectively.
| Characteristic | Number | Measure |
| Per Capita Income | 5,667 | $21,656 |
| Median Family Income | 1,648 | $46,750 |
| Mean Family Income | 1,648 | $58,964 |
| Median Household Income | 2,315 | $43,388 |
| Mean Household Income | 2,315 | $54,062 |
| Income Deficit | 1,648 | $10,131 |
| Wage / Income Gap (%) | 5,667 | 13.63% |
| Wage / Income Gap ($) | 5,667 | 86.37¢ per $1 |
| Gini / Inequality Index | 5,667 | 0.43 |
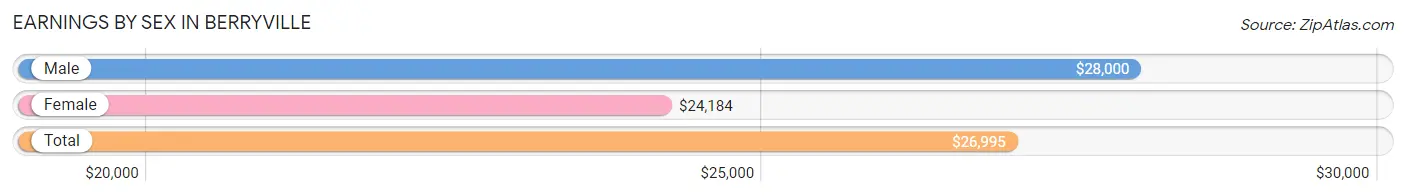
Earnings by Sex in Berryville
Average Earnings in Berryville are $26,995, $28,000 for men and $24,184 for women, a difference of 13.6%.
| Sex | Number | Average Earnings |
| Male | 1,244 (50.5%) | $28,000 |
| Female | 1,218 (49.5%) | $24,184 |
| Total | 2,462 (100.0%) | $26,995 |
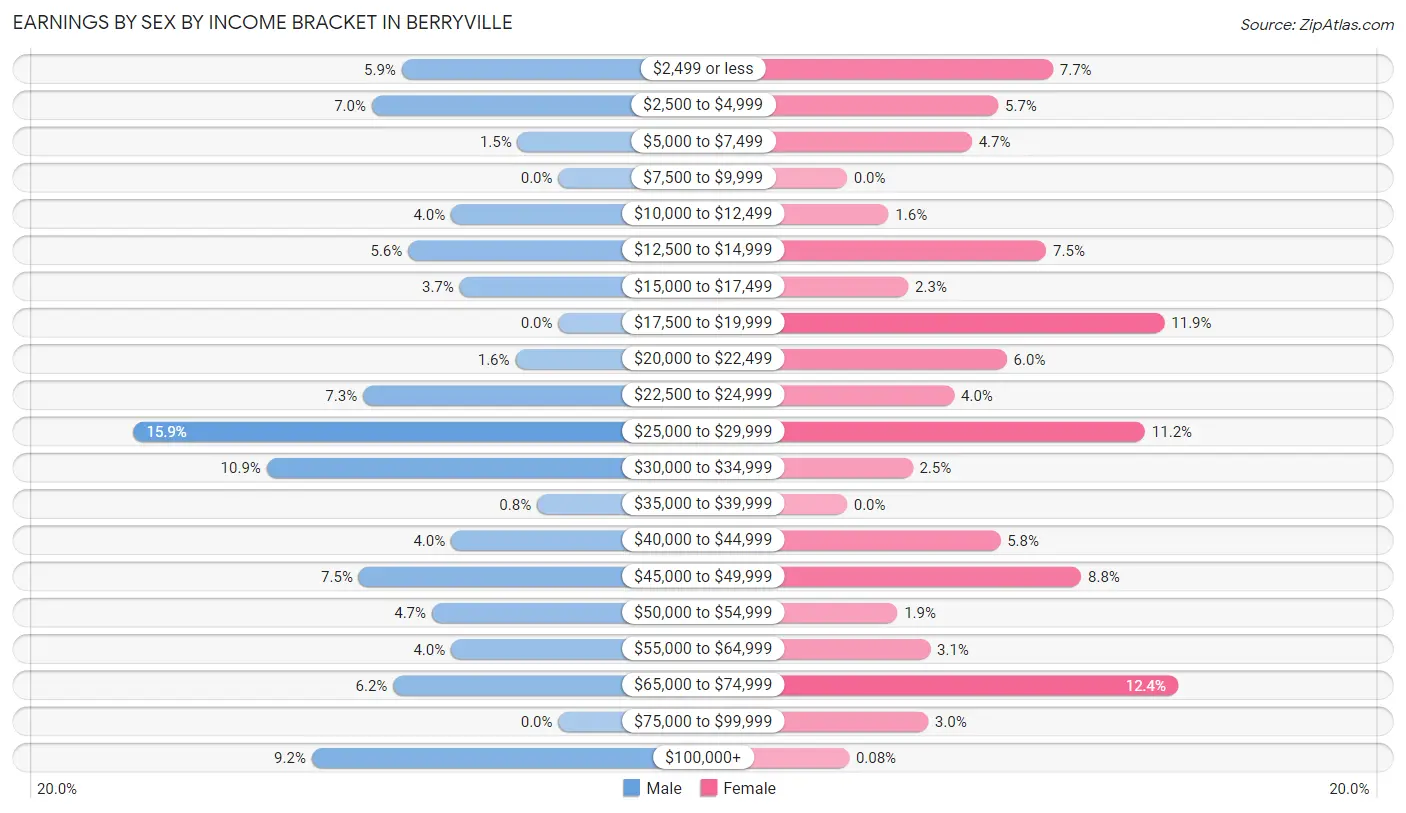
Earnings by Sex by Income Bracket in Berryville
The most common earnings brackets in Berryville are $25,000 to $29,999 for men (198 | 15.9%) and $65,000 to $74,999 for women (151 | 12.4%).
| Income | Male | Female |
| $2,499 or less | 73 (5.9%) | 94 (7.7%) |
| $2,500 to $4,999 | 87 (7.0%) | 69 (5.7%) |
| $5,000 to $7,499 | 19 (1.5%) | 57 (4.7%) |
| $7,500 to $9,999 | 0 (0.0%) | 0 (0.0%) |
| $10,000 to $12,499 | 50 (4.0%) | 19 (1.6%) |
| $12,500 to $14,999 | 70 (5.6%) | 91 (7.5%) |
| $15,000 to $17,499 | 46 (3.7%) | 28 (2.3%) |
| $17,500 to $19,999 | 0 (0.0%) | 145 (11.9%) |
| $20,000 to $22,499 | 20 (1.6%) | 73 (6.0%) |
| $22,500 to $24,999 | 91 (7.3%) | 49 (4.0%) |
| $25,000 to $29,999 | 198 (15.9%) | 136 (11.2%) |
| $30,000 to $34,999 | 136 (10.9%) | 30 (2.5%) |
| $35,000 to $39,999 | 10 (0.8%) | 0 (0.0%) |
| $40,000 to $44,999 | 50 (4.0%) | 70 (5.8%) |
| $45,000 to $49,999 | 93 (7.5%) | 107 (8.8%) |
| $50,000 to $54,999 | 59 (4.7%) | 23 (1.9%) |
| $55,000 to $64,999 | 50 (4.0%) | 38 (3.1%) |
| $65,000 to $74,999 | 77 (6.2%) | 151 (12.4%) |
| $75,000 to $99,999 | 0 (0.0%) | 37 (3.0%) |
| $100,000+ | 115 (9.2%) | 1 (0.1%) |
| Total | 1,244 (100.0%) | 1,218 (100.0%) |
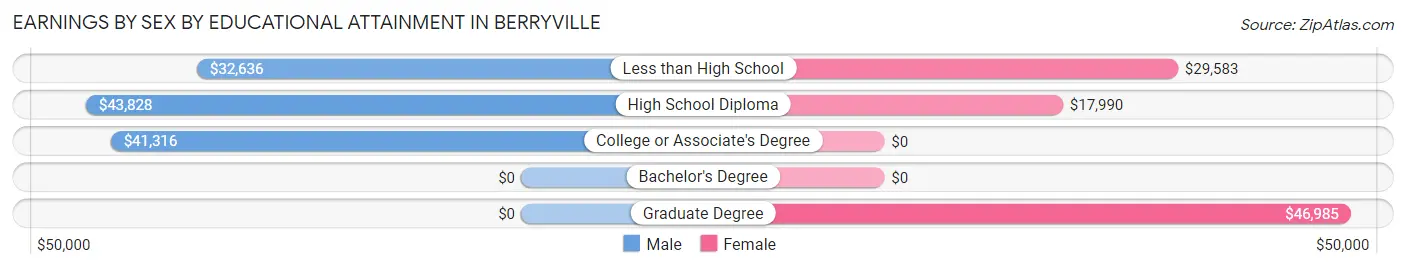
Earnings by Sex by Educational Attainment in Berryville
Average earnings in Berryville are $33,159 for men and $29,269 for women, a difference of 11.7%. Men with an educational attainment of high school diploma enjoy the highest average annual earnings of $43,828, while those with less than high school education earn the least with $32,636. Women with an educational attainment of graduate degree earn the most with the average annual earnings of $46,985, while those with high school diploma education have the smallest earnings of $17,990.
| Educational Attainment | Male Income | Female Income |
| Less than High School | $32,636 | $29,583 |
| High School Diploma | $43,828 | $17,990 |
| College or Associate's Degree | $41,316 | $0 |
| Bachelor's Degree | - | - |
| Graduate Degree | - | - |
| Total | $33,159 | $29,269 |
Family Income in Berryville
Family Income Brackets in Berryville
According to the Berryville family income data, there are 428 families falling into the $35,000 to $49,999 income range, which is the most common income bracket and makes up 26.0% of all families. Conversely, the $150,000 to $199,999 income bracket is the least frequent group with only 16 families (1.0%) belonging to this category.
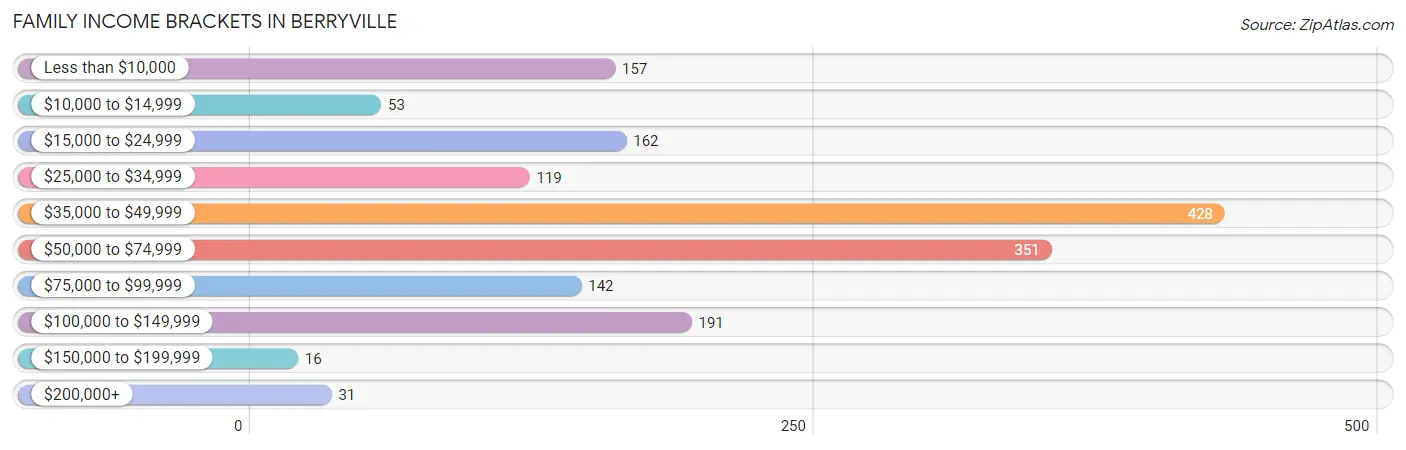
| Income Bracket | # Families | % Families |
| Less than $10,000 | 157 | 9.5% |
| $10,000 to $14,999 | 53 | 3.2% |
| $15,000 to $24,999 | 162 | 9.8% |
| $25,000 to $34,999 | 119 | 7.2% |
| $35,000 to $49,999 | 428 | 26.0% |
| $50,000 to $74,999 | 351 | 21.3% |
| $75,000 to $99,999 | 142 | 8.6% |
| $100,000 to $149,999 | 191 | 11.6% |
| $150,000 to $199,999 | 16 | 1.0% |
| $200,000+ | 31 | 1.9% |
Family Income by Famaliy Size in Berryville
4-person families (133 | 8.1%) account for the highest median family income in Berryville with $94,688 per family, while 4-person families (133 | 8.1%) have the highest median income of $23,672 per family member.
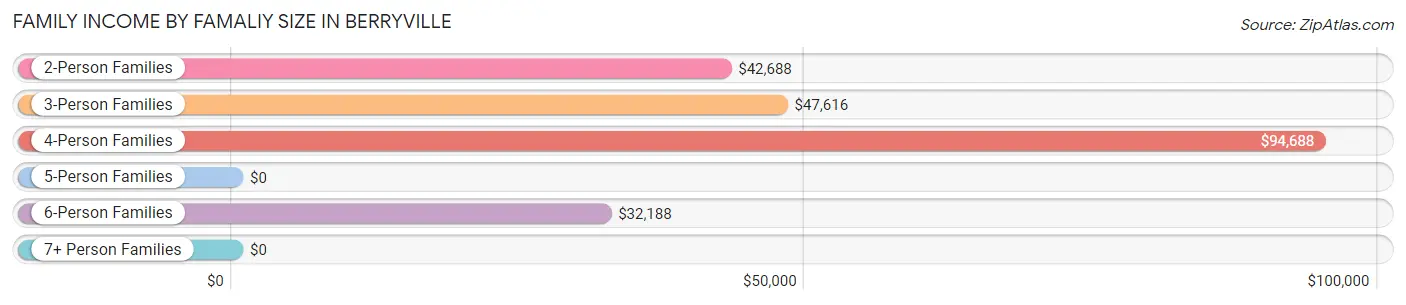
| Income Bracket | # Families | Median Income |
| 2-Person Families | 729 (44.2%) | $42,688 |
| 3-Person Families | 437 (26.5%) | $47,616 |
| 4-Person Families | 133 (8.1%) | $94,688 |
| 5-Person Families | 182 (11.0%) | $0 |
| 6-Person Families | 147 (8.9%) | $32,188 |
| 7+ Person Families | 20 (1.2%) | $0 |
| Total | 1,648 (100.0%) | $46,750 |
Family Income by Number of Earners in Berryville
The median family income in Berryville is $46,750, with families comprising 3+ earners (130) having the highest median family income of $98,636, while families with 1 earner (815) have the lowest median family income of $38,084, accounting for 7.9% and 49.4% of families, respectively.
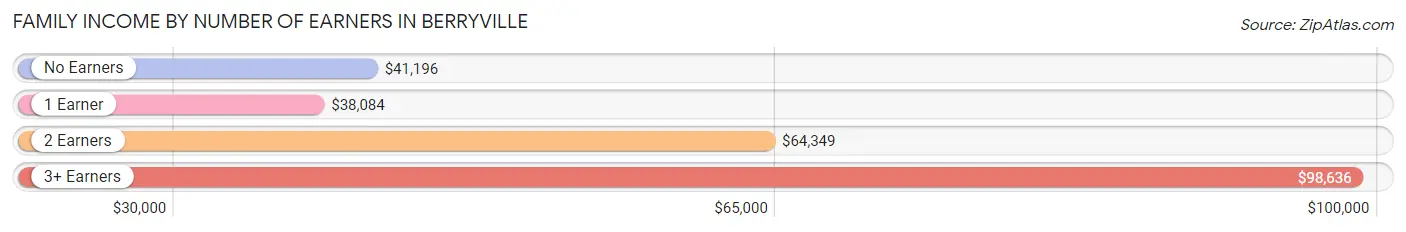
| Number of Earners | # Families | Median Income |
| No Earners | 244 (14.8%) | $41,196 |
| 1 Earner | 815 (49.4%) | $38,084 |
| 2 Earners | 459 (27.9%) | $64,349 |
| 3+ Earners | 130 (7.9%) | $98,636 |
| Total | 1,648 (100.0%) | $46,750 |
Household Income in Berryville
Household Income Brackets in Berryville
With 472 households falling in the category, the $35,000 to $49,999 income range is the most frequent in Berryville, accounting for 20.4% of all households. In contrast, only 16 households (0.7%) fall into the $150,000 to $199,999 income bracket, making it the least populous group.
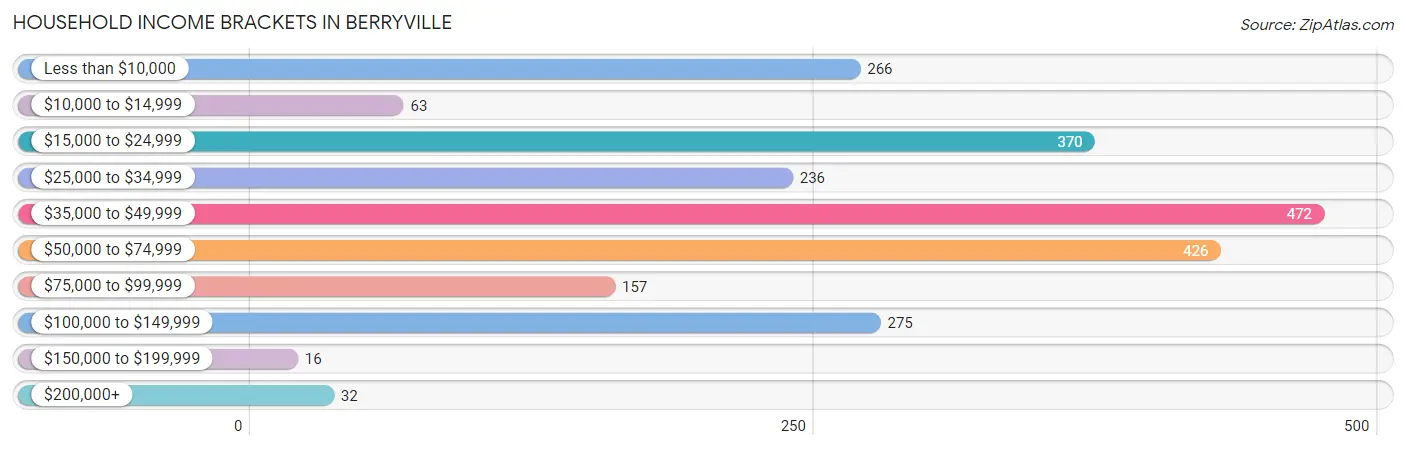
| Income Bracket | # Households | % Households |
| Less than $10,000 | 266 | 11.5% |
| $10,000 to $14,999 | 63 | 2.7% |
| $15,000 to $24,999 | 370 | 16.0% |
| $25,000 to $34,999 | 236 | 10.2% |
| $35,000 to $49,999 | 472 | 20.4% |
| $50,000 to $74,999 | 426 | 18.4% |
| $75,000 to $99,999 | 157 | 6.8% |
| $100,000 to $149,999 | 275 | 11.9% |
| $150,000 to $199,999 | 16 | 0.7% |
| $200,000+ | 32 | 1.4% |
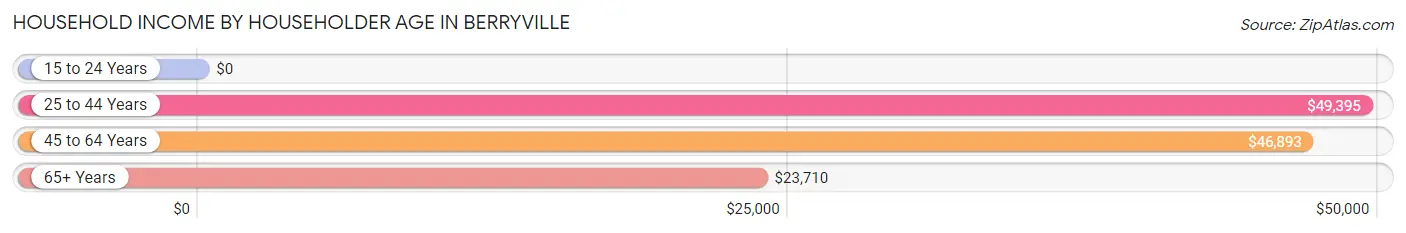
Household Income by Householder Age in Berryville
The median household income in Berryville is $43,388, with the highest median household income of $49,395 found in the 25 to 44 years age bracket for the primary householder. A total of 783 households (33.8%) fall into this category. Meanwhile, the 15 to 24 years age bracket for the primary householder has the lowest median household income of $0, with 45 households (1.9%) in this group.
| Income Bracket | # Households | Median Income |
| 15 to 24 Years | 45 (1.9%) | $0 |
| 25 to 44 Years | 783 (33.8%) | $49,395 |
| 45 to 64 Years | 657 (28.4%) | $46,893 |
| 65+ Years | 830 (35.8%) | $23,710 |
| Total | 2,315 (100.0%) | $43,388 |
Poverty in Berryville
Income Below Poverty by Sex and Age in Berryville
With 18.8% poverty level for males and 17.3% for females among the residents of Berryville, 5 year old males and 65 to 74 year old females are the most vulnerable to poverty, with 108 males (73.0%) and 172 females (44.9%) in their respective age groups living below the poverty level.
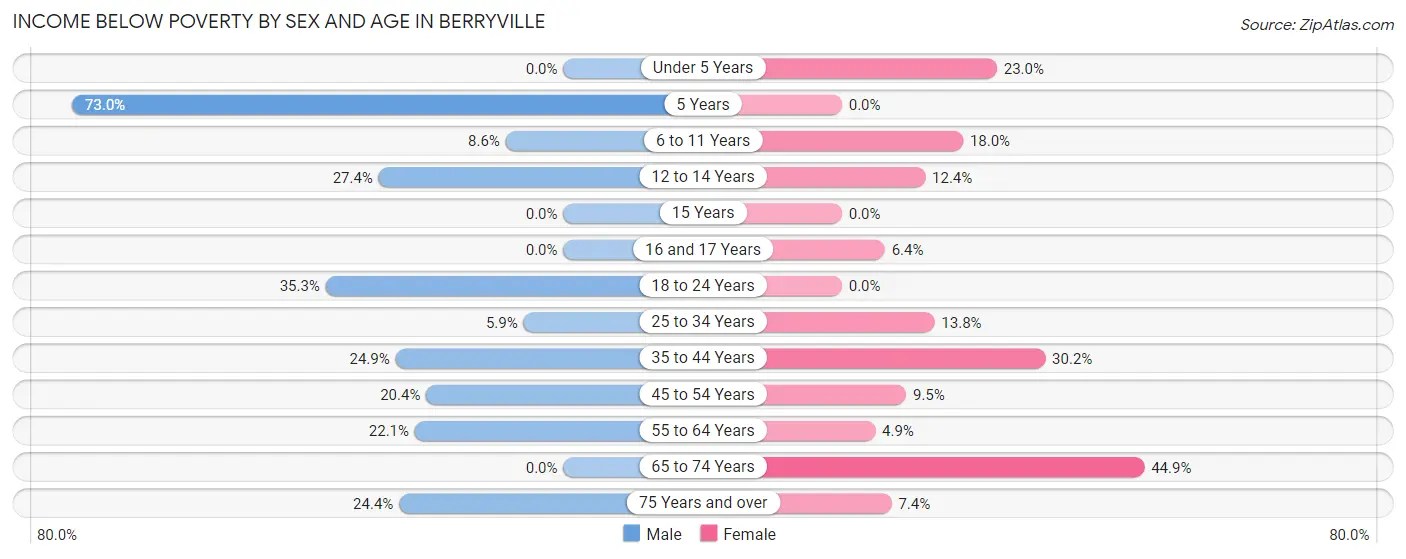
| Age Bracket | Male | Female |
| Under 5 Years | 0 (0.0%) | 29 (23.0%) |
| 5 Years | 108 (73.0%) | 0 (0.0%) |
| 6 to 11 Years | 30 (8.6%) | 25 (18.0%) |
| 12 to 14 Years | 17 (27.4%) | 23 (12.4%) |
| 15 Years | 0 (0.0%) | 0 (0.0%) |
| 16 and 17 Years | 0 (0.0%) | 10 (6.4%) |
| 18 to 24 Years | 72 (35.3%) | 0 (0.0%) |
| 25 to 34 Years | 22 (5.9%) | 51 (13.8%) |
| 35 to 44 Years | 74 (24.9%) | 122 (30.2%) |
| 45 to 54 Years | 34 (20.4%) | 25 (9.5%) |
| 55 to 64 Years | 84 (22.1%) | 12 (4.9%) |
| 65 to 74 Years | 0 (0.0%) | 172 (44.9%) |
| 75 Years and over | 59 (24.4%) | 25 (7.4%) |
| Total | 500 (18.8%) | 494 (17.3%) |
Income Above Poverty by Sex and Age in Berryville
According to the poverty statistics in Berryville, males aged under 5 years and females aged 5 years are the age groups that are most secure financially, with 100.0% of males and 100.0% of females in these age groups living above the poverty line.
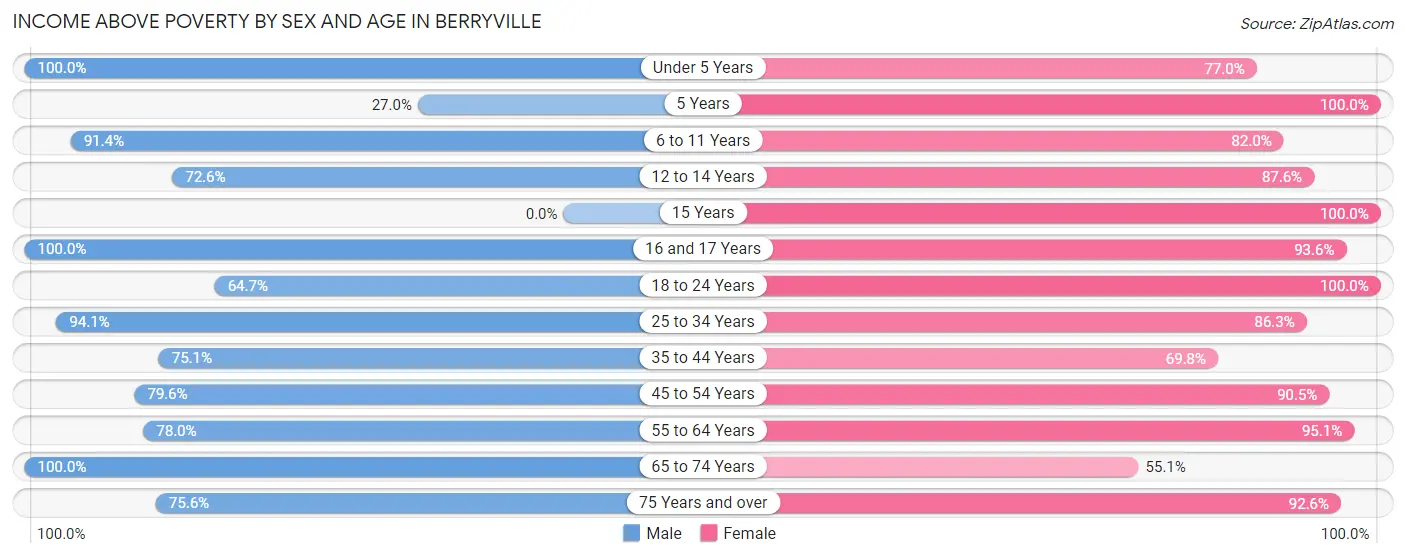
| Age Bracket | Male | Female |
| Under 5 Years | 90 (100.0%) | 97 (77.0%) |
| 5 Years | 40 (27.0%) | 85 (100.0%) |
| 6 to 11 Years | 320 (91.4%) | 114 (82.0%) |
| 12 to 14 Years | 45 (72.6%) | 163 (87.6%) |
| 15 Years | 0 (0.0%) | 26 (100.0%) |
| 16 and 17 Years | 191 (100.0%) | 147 (93.6%) |
| 18 to 24 Years | 132 (64.7%) | 138 (100.0%) |
| 25 to 34 Years | 350 (94.1%) | 320 (86.3%) |
| 35 to 44 Years | 223 (75.1%) | 282 (69.8%) |
| 45 to 54 Years | 133 (79.6%) | 237 (90.5%) |
| 55 to 64 Years | 297 (77.9%) | 231 (95.1%) |
| 65 to 74 Years | 153 (100.0%) | 211 (55.1%) |
| 75 Years and over | 183 (75.6%) | 314 (92.6%) |
| Total | 2,157 (81.2%) | 2,365 (82.7%) |
Income Below Poverty Among Married-Couple Families in Berryville
The poverty statistics for married-couple families in Berryville show that 11.2% or 119 of the total 1,063 families live below the poverty line. Families with 3 or 4 children have the highest poverty rate of 36.0%, comprising of 102 families. On the other hand, families with 1 or 2 children have the lowest poverty rate of 0.0%, which includes 0 families.
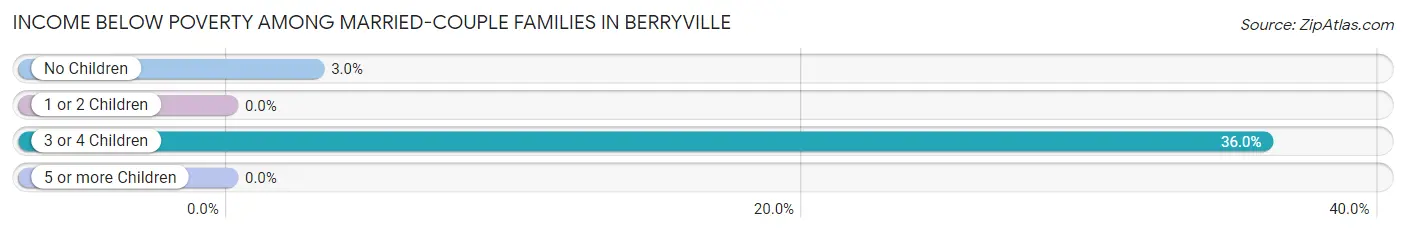
| Children | Above Poverty | Below Poverty |
| No Children | 550 (97.0%) | 17 (3.0%) |
| 1 or 2 Children | 213 (100.0%) | 0 (0.0%) |
| 3 or 4 Children | 181 (64.0%) | 102 (36.0%) |
| 5 or more Children | 0 (0.0%) | 0 (0.0%) |
| Total | 944 (88.8%) | 119 (11.2%) |
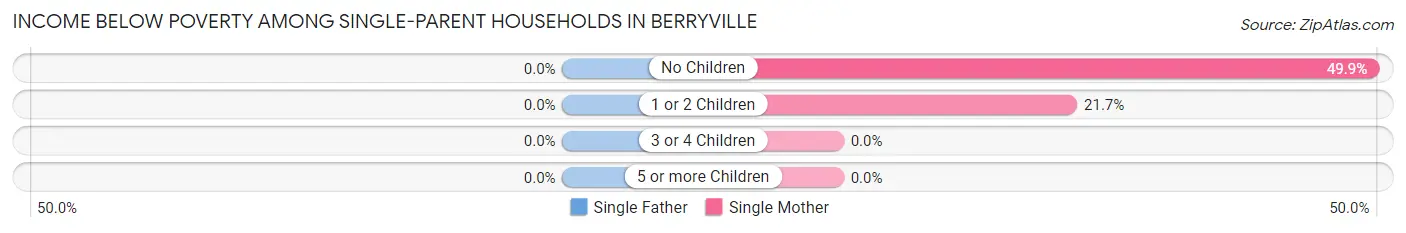
Income Below Poverty Among Single-Parent Households in Berryville
| Children | Single Father | Single Mother |
| No Children | 0 (0.0%) | 171 (49.8%) |
| 1 or 2 Children | 0 (0.0%) | 35 (21.7%) |
| 3 or 4 Children | 0 (0.0%) | 0 (0.0%) |
| 5 or more Children | 0 (0.0%) | 0 (0.0%) |
| Total | 0 (0.0%) | 206 (39.3%) |
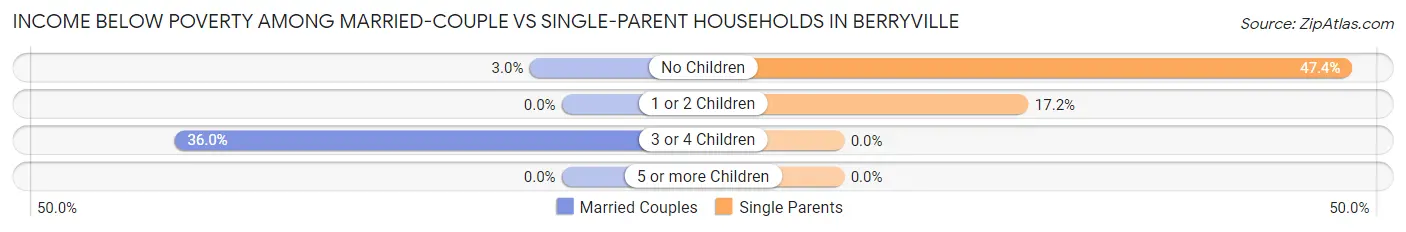
Income Below Poverty Among Married-Couple vs Single-Parent Households in Berryville
The poverty data for Berryville shows that 119 of the married-couple family households (11.2%) and 206 of the single-parent households (35.2%) are living below the poverty level. Within the married-couple family households, those with 3 or 4 children have the highest poverty rate, with 102 households (36.0%) falling below the poverty line. Among the single-parent households, those with no children have the highest poverty rate, with 171 household (47.4%) living below poverty.
| Children | Married-Couple Families | Single-Parent Households |
| No Children | 17 (3.0%) | 171 (47.4%) |
| 1 or 2 Children | 0 (0.0%) | 35 (17.2%) |
| 3 or 4 Children | 102 (36.0%) | 0 (0.0%) |
| 5 or more Children | 0 (0.0%) | 0 (0.0%) |
| Total | 119 (11.2%) | 206 (35.2%) |
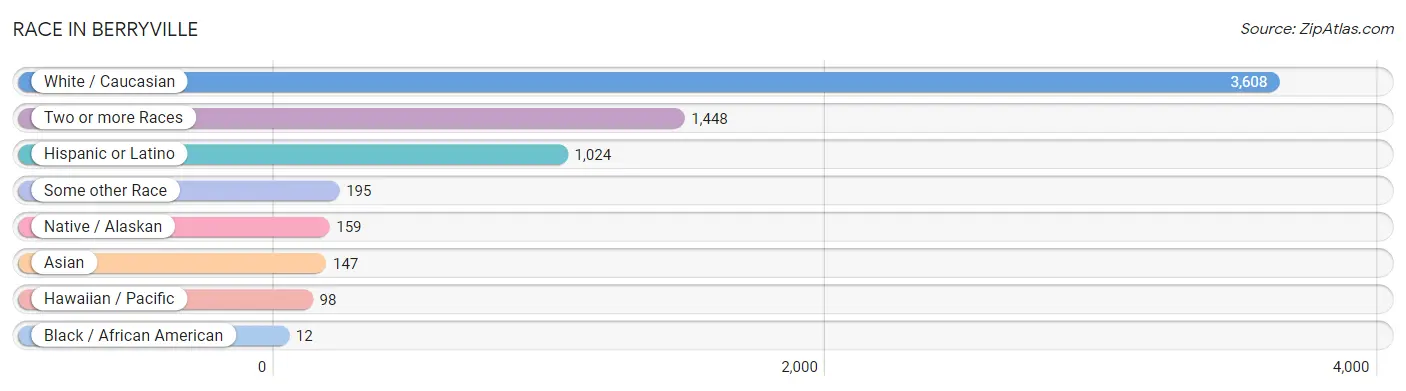
Race in Berryville
The most populous races in Berryville are White / Caucasian (3,608 | 63.7%), Two or more Races (1,448 | 25.6%), and Hispanic or Latino (1,024 | 18.1%).
| Race | # Population | % Population |
| Asian | 147 | 2.6% |
| Black / African American | 12 | 0.2% |
| Hawaiian / Pacific | 98 | 1.7% |
| Hispanic or Latino | 1,024 | 18.1% |
| Native / Alaskan | 159 | 2.8% |
| White / Caucasian | 3,608 | 63.7% |
| Two or more Races | 1,448 | 25.6% |
| Some other Race | 195 | 3.4% |
| Total | 5,667 | 100.0% |
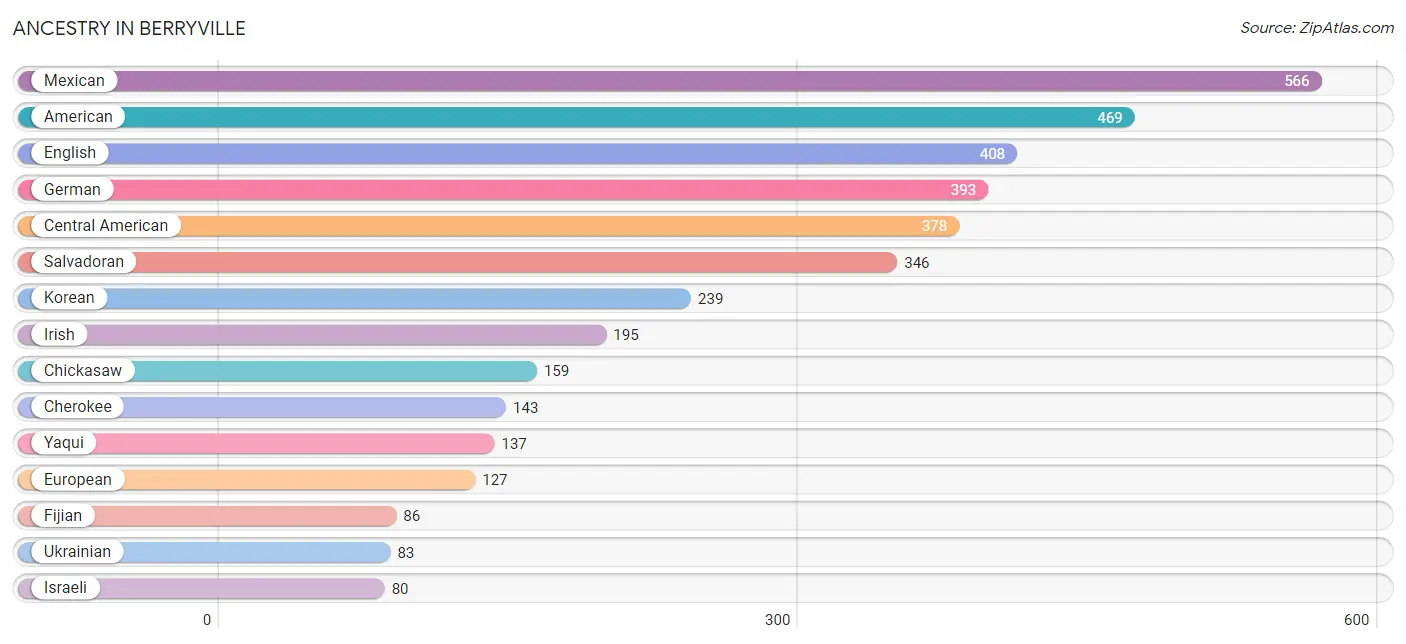
Ancestry in Berryville
The most populous ancestries reported in Berryville are Mexican (566 | 10.0%), American (469 | 8.3%), English (408 | 7.2%), German (393 | 6.9%), and Central American (378 | 6.7%), together accounting for 39.1% of all Berryville residents.
| Ancestry | # Population | % Population |
| American | 469 | 8.3% |
| British | 22 | 0.4% |
| Central American | 378 | 6.7% |
| Cherokee | 143 | 2.5% |
| Chickasaw | 159 | 2.8% |
| Choctaw | 7 | 0.1% |
| Dutch | 18 | 0.3% |
| Eastern European | 54 | 0.9% |
| English | 408 | 7.2% |
| European | 127 | 2.2% |
| Fijian | 86 | 1.5% |
| French | 10 | 0.2% |
| German | 393 | 6.9% |
| Guatemalan | 32 | 0.6% |
| Irish | 195 | 3.4% |
| Israeli | 80 | 1.4% |
| Korean | 239 | 4.2% |
| Mexican | 566 | 10.0% |
| Native Hawaiian | 67 | 1.2% |
| Polish | 1 | 0.0% |
| Puerto Rican | 80 | 1.4% |
| Salvadoran | 346 | 6.1% |
| Scotch-Irish | 47 | 0.8% |
| Scottish | 36 | 0.6% |
| Swedish | 9 | 0.2% |
| Swiss | 24 | 0.4% |
| Ukrainian | 83 | 1.5% |
| Welsh | 35 | 0.6% |
| Yaqui | 137 | 2.4% | View All 29 Rows |
Immigrants in Berryville
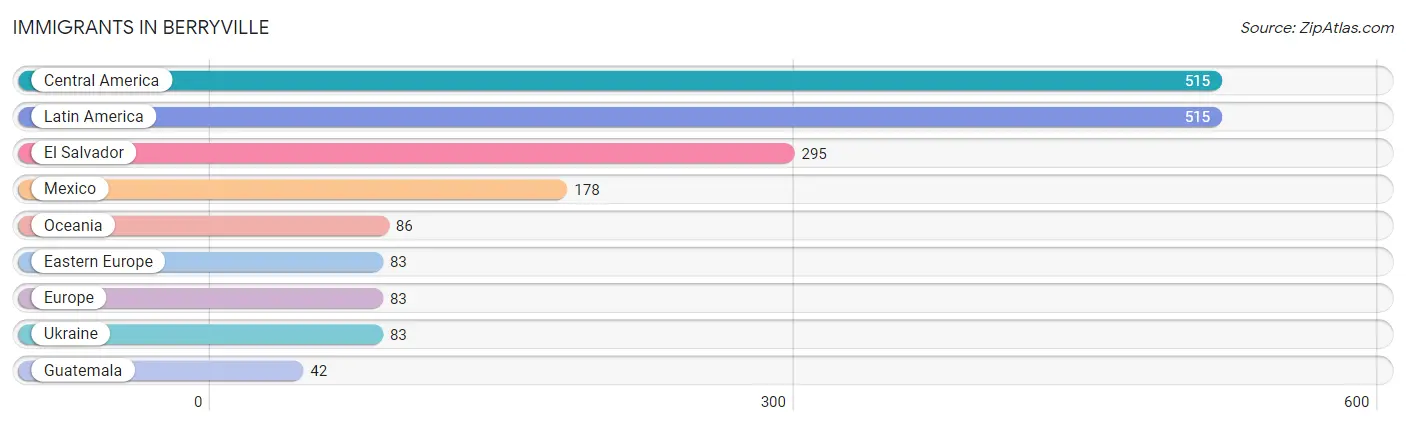
The most numerous immigrant groups reported in Berryville came from Central America (515 | 9.1%), Latin America (515 | 9.1%), El Salvador (295 | 5.2%), Mexico (178 | 3.1%), and Oceania (86 | 1.5%), together accounting for 28.0% of all Berryville residents.
| Immigration Origin | # Population | % Population |
| Central America | 515 | 9.1% |
| Eastern Europe | 83 | 1.5% |
| El Salvador | 295 | 5.2% |
| Europe | 83 | 1.5% |
| Guatemala | 42 | 0.7% |
| Latin America | 515 | 9.1% |
| Mexico | 178 | 3.1% |
| Oceania | 86 | 1.5% |
| Ukraine | 83 | 1.5% | View All 9 Rows |
Sex and Age in Berryville
Sex and Age in Berryville
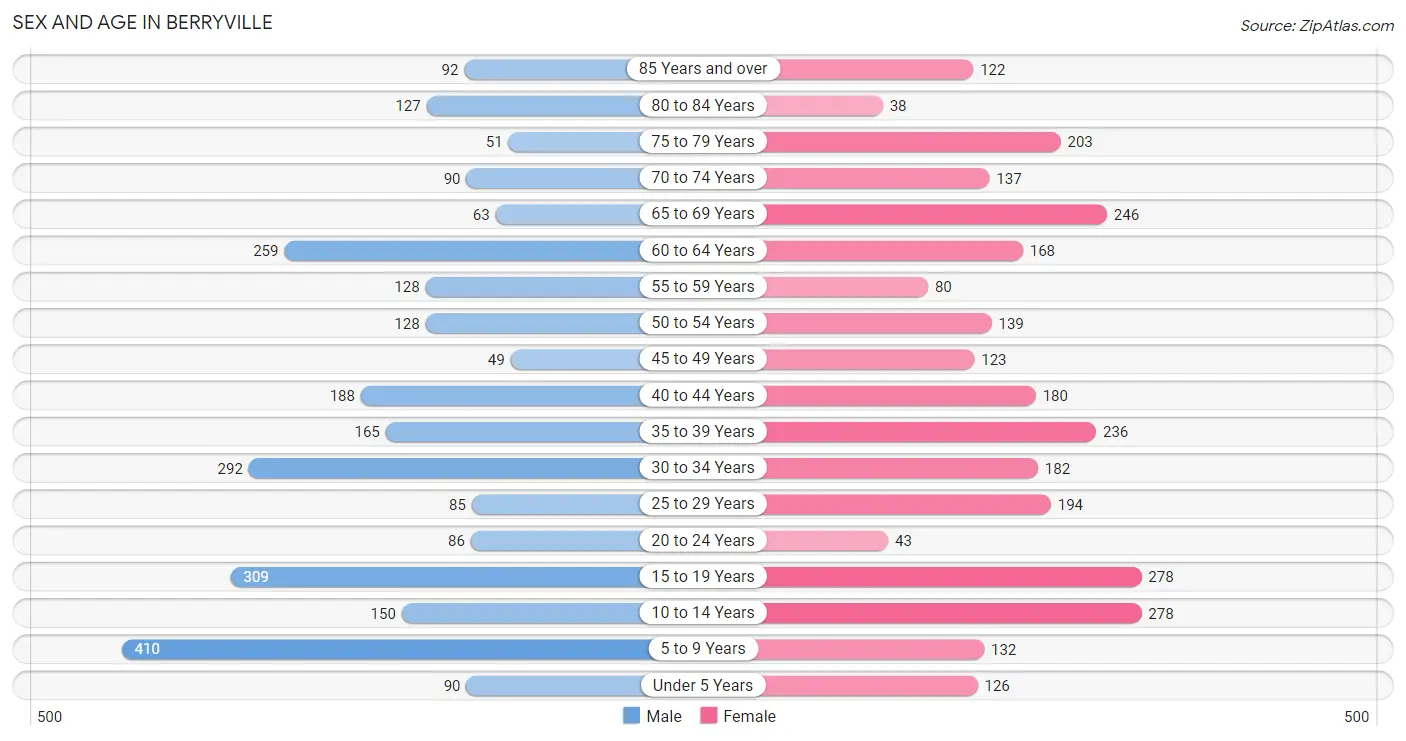
The most populous age groups in Berryville are 5 to 9 Years (410 | 14.8%) for men and 10 to 14 Years (278 | 9.6%) for women.
| Age Bracket | Male | Female |
| Under 5 Years | 90 (3.3%) | 126 (4.3%) |
| 5 to 9 Years | 410 (14.8%) | 132 (4.5%) |
| 10 to 14 Years | 150 (5.4%) | 278 (9.6%) |
| 15 to 19 Years | 309 (11.2%) | 278 (9.6%) |
| 20 to 24 Years | 86 (3.1%) | 43 (1.5%) |
| 25 to 29 Years | 85 (3.1%) | 194 (6.7%) |
| 30 to 34 Years | 292 (10.6%) | 182 (6.3%) |
| 35 to 39 Years | 165 (6.0%) | 236 (8.1%) |
| 40 to 44 Years | 188 (6.8%) | 180 (6.2%) |
| 45 to 49 Years | 49 (1.8%) | 123 (4.2%) |
| 50 to 54 Years | 128 (4.6%) | 139 (4.8%) |
| 55 to 59 Years | 128 (4.6%) | 80 (2.8%) |
| 60 to 64 Years | 259 (9.4%) | 168 (5.8%) |
| 65 to 69 Years | 63 (2.3%) | 246 (8.5%) |
| 70 to 74 Years | 90 (3.3%) | 137 (4.7%) |
| 75 to 79 Years | 51 (1.8%) | 203 (7.0%) |
| 80 to 84 Years | 127 (4.6%) | 38 (1.3%) |
| 85 Years and over | 92 (3.3%) | 122 (4.2%) |
| Total | 2,762 (100.0%) | 2,905 (100.0%) |
Families and Households in Berryville
Median Family Size in Berryville
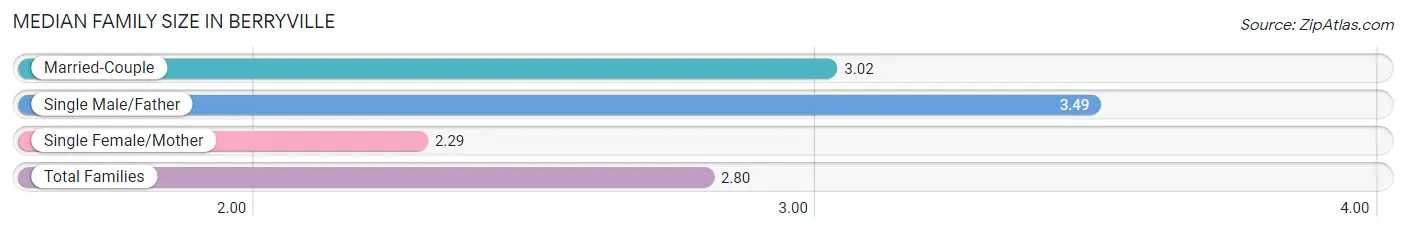
The median family size in Berryville is 2.80 persons per family, with single male/father families (61 | 3.7%) accounting for the largest median family size of 3.49 persons per family. On the other hand, single female/mother families (524 | 31.8%) represent the smallest median family size with 2.29 persons per family.
| Family Type | # Families | Family Size |
| Married-Couple | 1,063 (64.5%) | 3.02 |
| Single Male/Father | 61 (3.7%) | 3.49 |
| Single Female/Mother | 524 (31.8%) | 2.29 |
| Total Families | 1,648 (100.0%) | 2.80 |
Median Household Size in Berryville
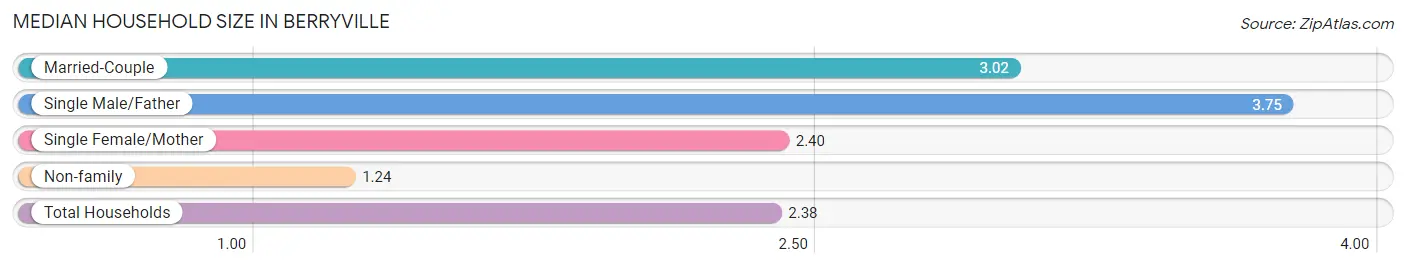
The median household size in Berryville is 2.38 persons per household, with single male/father households (61 | 2.6%) accounting for the largest median household size of 3.75 persons per household. non-family households (667 | 28.8%) represent the smallest median household size with 1.24 persons per household.
| Household Type | # Households | Household Size |
| Married-Couple | 1,063 (45.9%) | 3.02 |
| Single Male/Father | 61 (2.6%) | 3.75 |
| Single Female/Mother | 524 (22.6%) | 2.40 |
| Non-family | 667 (28.8%) | 1.24 |
| Total Households | 2,315 (100.0%) | 2.38 |
Household Size by Marriage Status in Berryville
Out of a total of 2,315 households in Berryville, 1,648 (71.2%) are family households, while 667 (28.8%) are nonfamily households. The most numerous type of family households are 2-person households, comprising 704, and the most common type of nonfamily households are 1-person households, comprising 541.
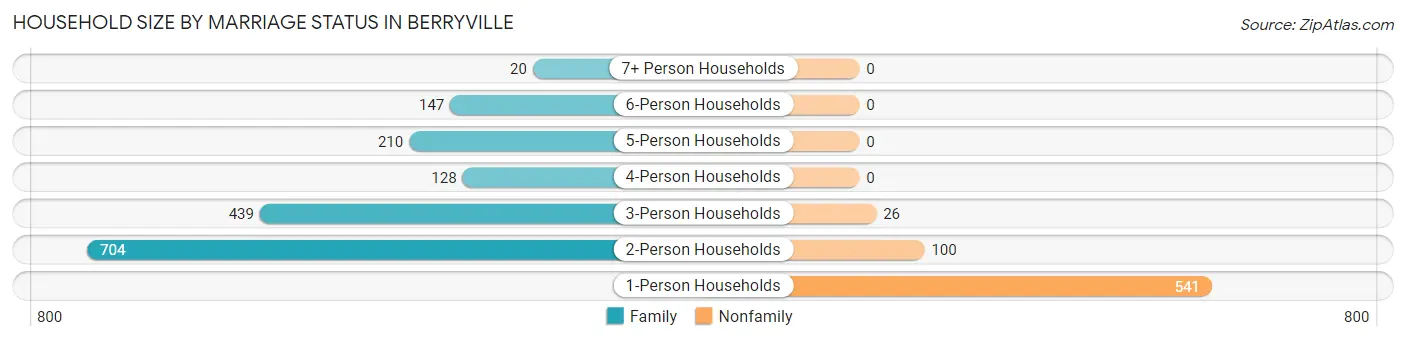
| Household Size | Family Households | Nonfamily Households |
| 1-Person Households | - | 541 (23.4%) |
| 2-Person Households | 704 (30.4%) | 100 (4.3%) |
| 3-Person Households | 439 (19.0%) | 26 (1.1%) |
| 4-Person Households | 128 (5.5%) | 0 (0.0%) |
| 5-Person Households | 210 (9.1%) | 0 (0.0%) |
| 6-Person Households | 147 (6.4%) | 0 (0.0%) |
| 7+ Person Households | 20 (0.9%) | 0 (0.0%) |
| Total | 1,648 (71.2%) | 667 (28.8%) |
Female Fertility in Berryville
Fertility by Age in Berryville
Average fertility rate in Berryville is 51.0 births per 1,000 women. Women in the age bracket of 20 to 34 years have the highest fertility rate with 153.0 births per 1,000 women. Women in the age bracket of 20 to 34 years acount for 100.0% of all women with births.
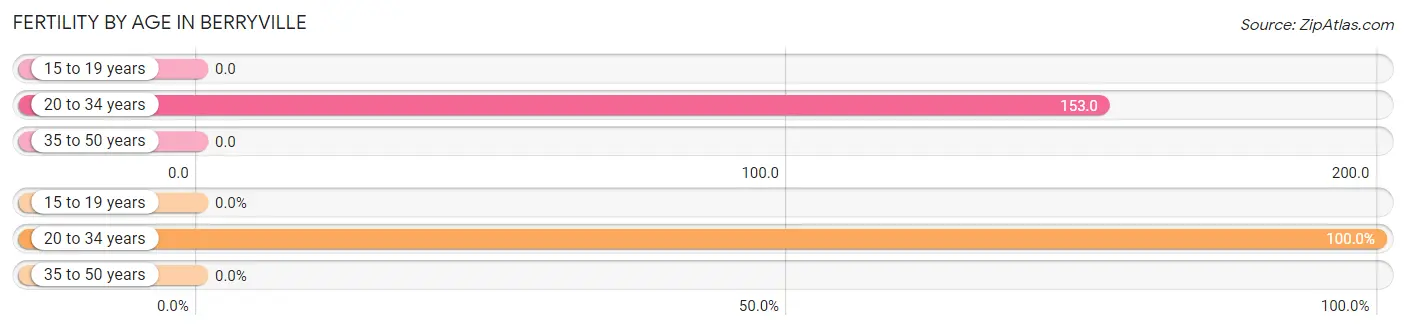
| Age Bracket | Women with Births | Births / 1,000 Women |
| 15 to 19 years | 0 (0.0%) | 0.0 |
| 20 to 34 years | 64 (100.0%) | 153.0 |
| 35 to 50 years | 0 (0.0%) | 0.0 |
| Total | 64 (100.0%) | 51.0 |
Fertility by Age by Marriage Status in Berryville
64.1% of women with births (64) in Berryville are married. The highest percentage of unmarried women with births falls into 20 to 34 years age bracket with 35.9% of them unmarried at the time of birth, while the lowest percentage of unmarried women with births belong to 20 to 34 years age bracket with 35.9% of them unmarried.
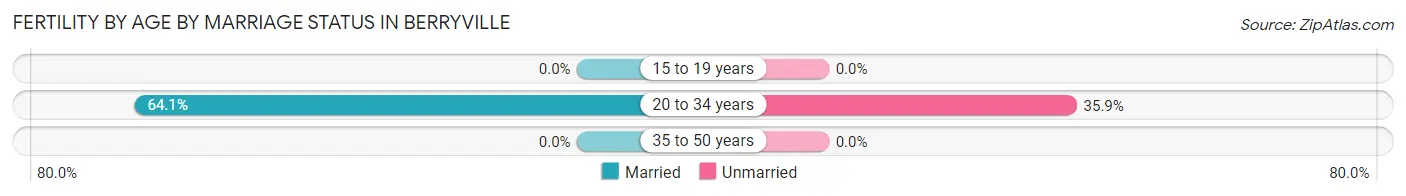
| Age Bracket | Married | Unmarried |
| 15 to 19 years | 0 (0.0%) | 0 (0.0%) |
| 20 to 34 years | 41 (64.1%) | 23 (35.9%) |
| 35 to 50 years | 0 (0.0%) | 0 (0.0%) |
| Total | 41 (64.1%) | 23 (35.9%) |
Fertility by Education in Berryville
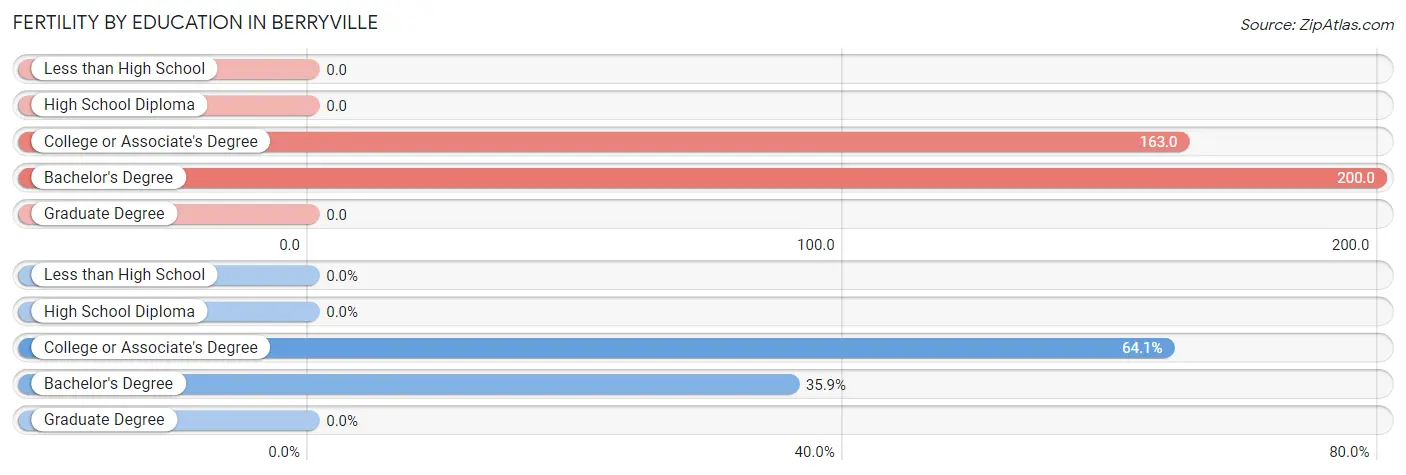
| Educational Attainment | Women with Births | Births / 1,000 Women |
| Less than High School | 0 (0.0%) | 0.0 |
| High School Diploma | 0 (0.0%) | 0.0 |
| College or Associate's Degree | 41 (64.1%) | 163.0 |
| Bachelor's Degree | 23 (35.9%) | 200.0 |
| Graduate Degree | 0 (0.0%) | 0.0 |
| Total | 64 (100.0%) | 51.0 |
Fertility by Education by Marriage Status in Berryville
35.9% of women with births in Berryville are unmarried. Women with the educational attainment of college or associate's degree are most likely to be married with 100.0% of them married at childbirth, while women with the educational attainment of bachelor's degree are least likely to be married with 100.0% of them unmarried at childbirth.
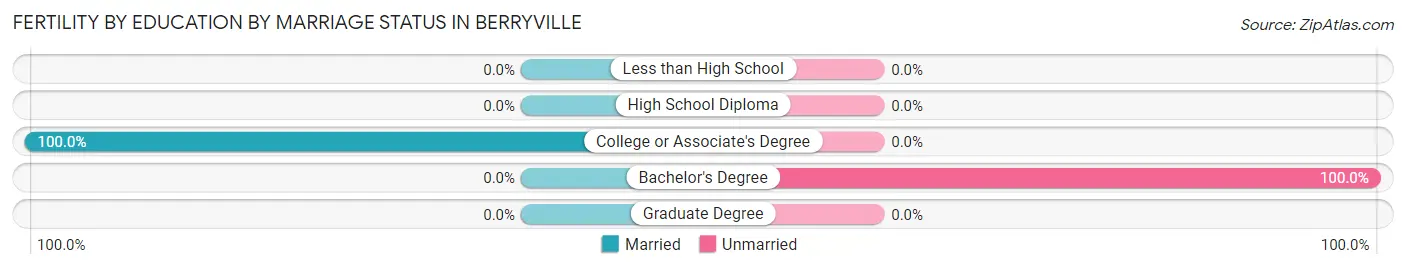
| Educational Attainment | Married | Unmarried |
| Less than High School | 0 (0.0%) | 0 (0.0%) |
| High School Diploma | 0 (0.0%) | 0 (0.0%) |
| College or Associate's Degree | 41 (100.0%) | 0 (0.0%) |
| Bachelor's Degree | 0 (0.0%) | 23 (100.0%) |
| Graduate Degree | 0 (0.0%) | 0 (0.0%) |
| Total | 41 (64.1%) | 23 (35.9%) |
Employment Characteristics in Berryville
Employment by Class of Employer in Berryville
Among the 2,056 employed individuals in Berryville, private company employees (1,448 | 70.4%), local government employees (155 | 7.5%), and not-for-profit organizations (142 | 6.9%) make up the most common classes of employment.
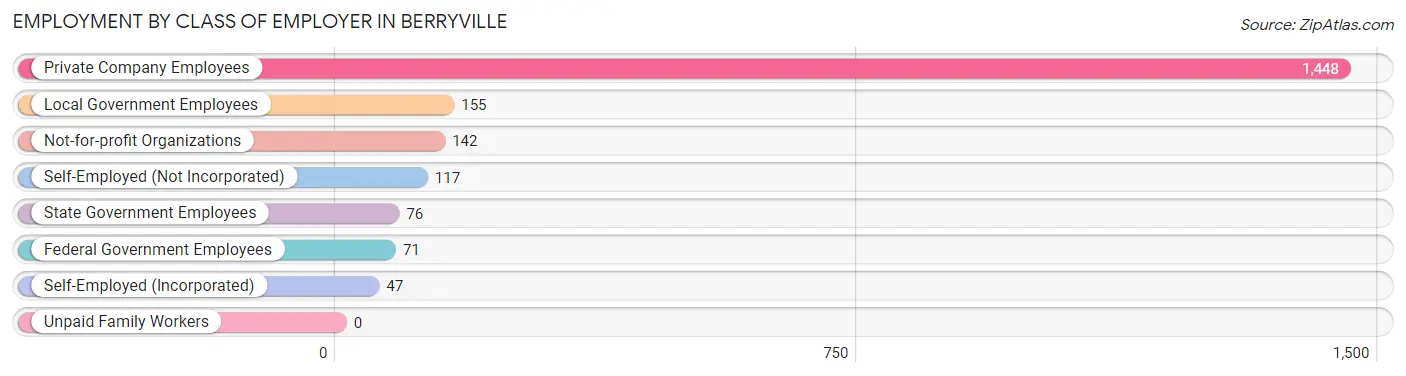
| Employer Class | # Employees | % Employees |
| Private Company Employees | 1,448 | 70.4% |
| Self-Employed (Incorporated) | 47 | 2.3% |
| Self-Employed (Not Incorporated) | 117 | 5.7% |
| Not-for-profit Organizations | 142 | 6.9% |
| Local Government Employees | 155 | 7.5% |
| State Government Employees | 76 | 3.7% |
| Federal Government Employees | 71 | 3.5% |
| Unpaid Family Workers | 0 | 0.0% |
| Total | 2,056 | 100.0% |
Employment Status by Age in Berryville
According to the labor force statistics for Berryville, out of the total population over 16 years of age (4,455), 49.6% or 2,210 individuals are in the labor force, with 5.9% or 130 of them unemployed. The age group with the highest labor force participation rate is 25 to 29 years, with 77.8% or 217 individuals in the labor force. Within the labor force, the 16 to 19 years age range has the highest percentage of unemployed individuals, with 31.1% or 61 of them being unemployed.
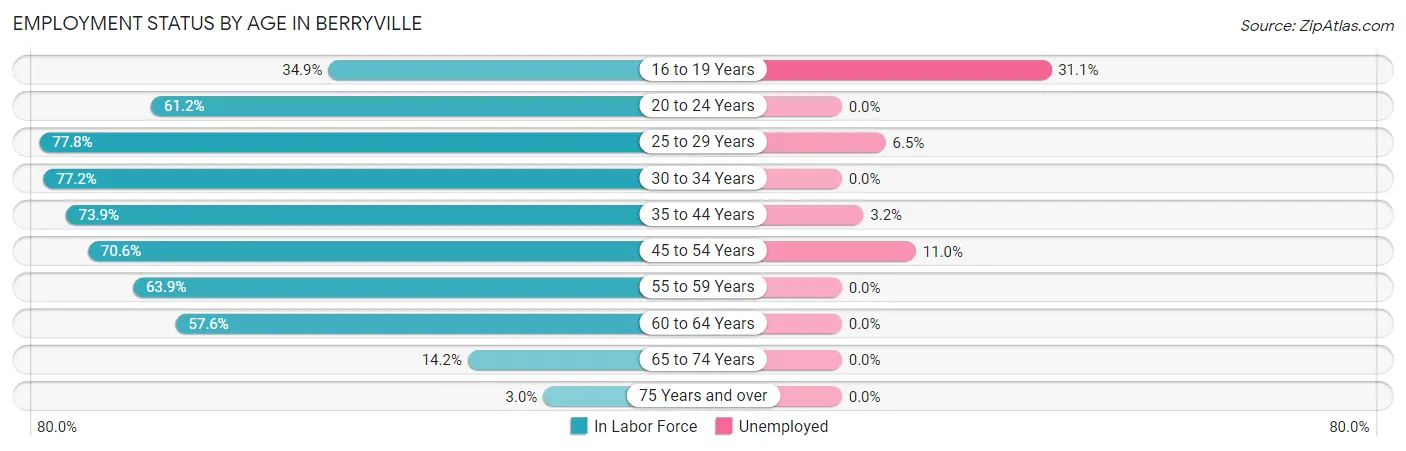
| Age Bracket | In Labor Force | Unemployed |
| 16 to 19 Years | 196 (34.9%) | 61 (31.1%) |
| 20 to 24 Years | 79 (61.2%) | 0 (0.0%) |
| 25 to 29 Years | 217 (77.8%) | 14 (6.5%) |
| 30 to 34 Years | 366 (77.2%) | 0 (0.0%) |
| 35 to 44 Years | 568 (73.9%) | 18 (3.2%) |
| 45 to 54 Years | 310 (70.6%) | 34 (11.0%) |
| 55 to 59 Years | 133 (63.9%) | 0 (0.0%) |
| 60 to 64 Years | 246 (57.6%) | 0 (0.0%) |
| 65 to 74 Years | 76 (14.2%) | 0 (0.0%) |
| 75 Years and over | 19 (3.0%) | 0 (0.0%) |
| Total | 2,210 (49.6%) | 130 (5.9%) |
Employment Status by Educational Attainment in Berryville
According to labor force statistics for Berryville, 70.9% of individuals (1,841) out of the total population between 25 and 64 years of age (2,596) are in the labor force, with 3.7% or 68 of them being unemployed. The group with the highest labor force participation rate are those with the educational attainment of less than high school, with 79.1% or 459 individuals in the labor force. Within the labor force, individuals with college / associate degree education have the highest percentage of unemployment, with 7.2% or 36 of them being unemployed.
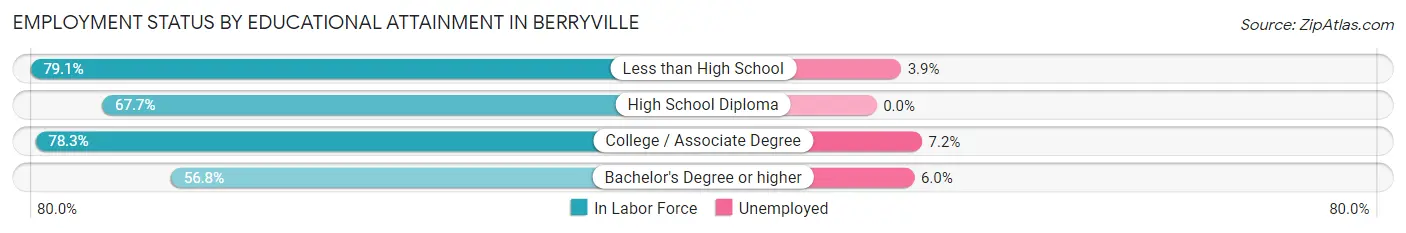
| Educational Attainment | In Labor Force | Unemployed |
| Less than High School | 459 (79.1%) | 23 (3.9%) |
| High School Diploma | 615 (67.7%) | 0 (0.0%) |
| College / Associate Degree | 498 (78.3%) | 46 (7.2%) |
| Bachelor's Degree or higher | 268 (56.8%) | 28 (6.0%) |
| Total | 1,841 (70.9%) | 96 (3.7%) |
Employment Occupations by Sex in Berryville
Management, Business, Science and Arts Occupations
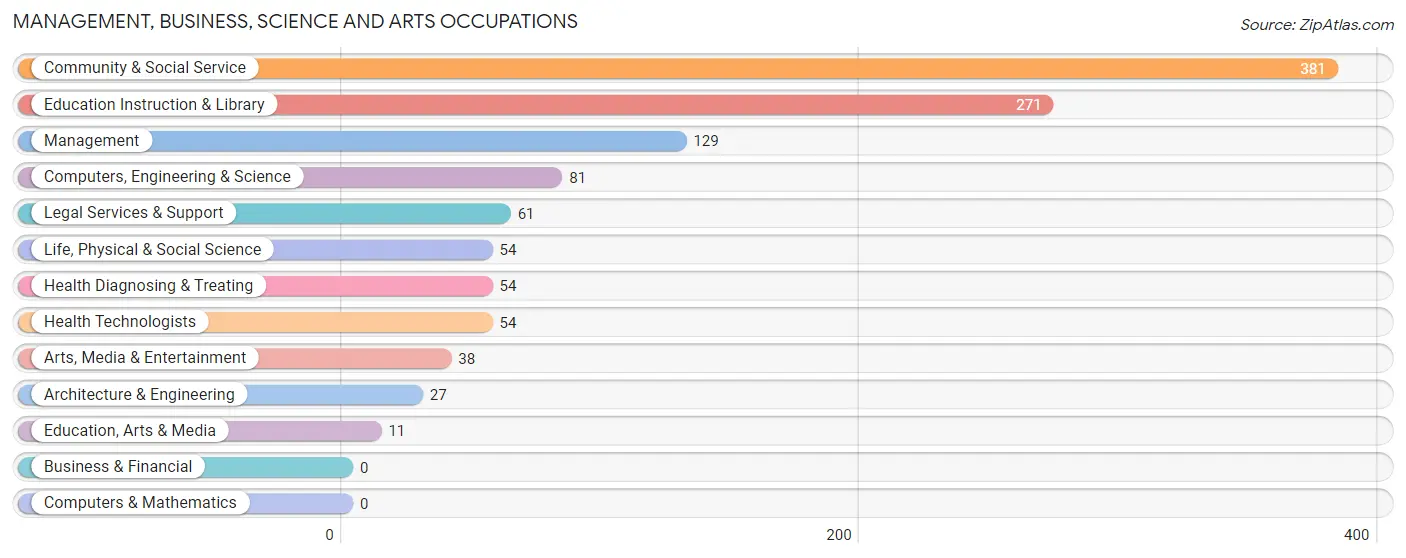
The most common Management, Business, Science and Arts occupations in Berryville are Community & Social Service (381 | 18.8%), Education Instruction & Library (271 | 13.4%), Management (129 | 6.4%), Computers, Engineering & Science (81 | 4.0%), and Legal Services & Support (61 | 3.0%).
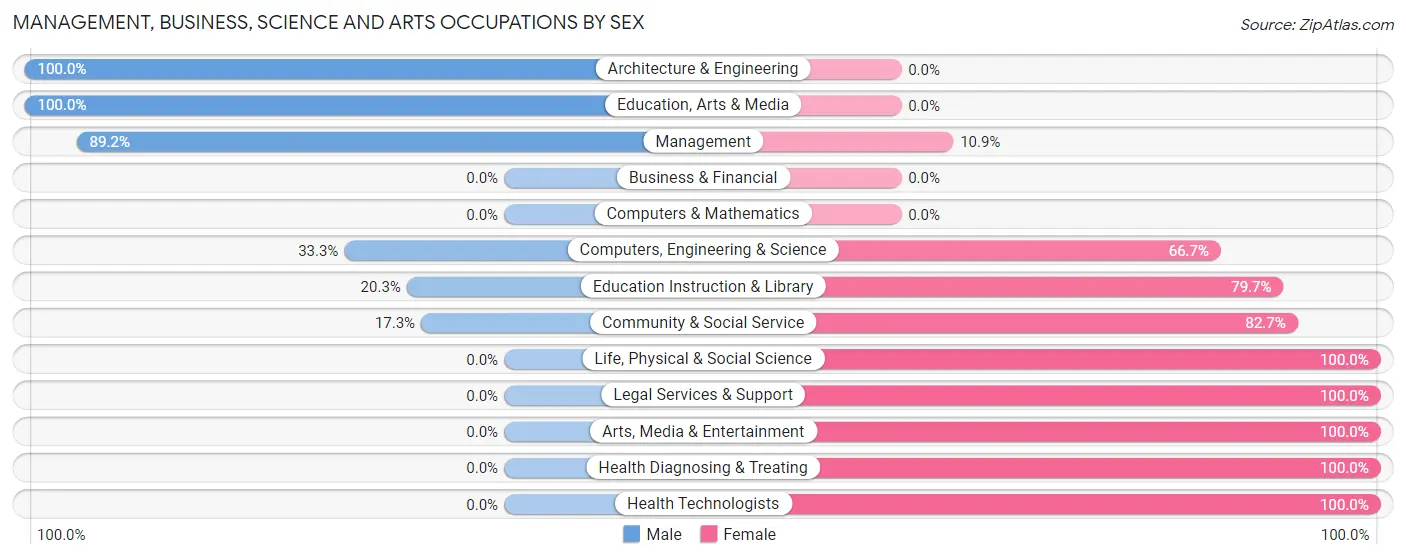
Management, Business, Science and Arts Occupations by Sex
Within the Management, Business, Science and Arts occupations in Berryville, the most male-oriented occupations are Architecture & Engineering (100.0%), Education, Arts & Media (100.0%), and Management (89.1%), while the most female-oriented occupations are Life, Physical & Social Science (100.0%), Legal Services & Support (100.0%), and Arts, Media & Entertainment (100.0%).
| Occupation | Male | Female |
| Management | 115 (89.1%) | 14 (10.8%) |
| Business & Financial | 0 (0.0%) | 0 (0.0%) |
| Computers, Engineering & Science | 27 (33.3%) | 54 (66.7%) |
| Computers & Mathematics | 0 (0.0%) | 0 (0.0%) |
| Architecture & Engineering | 27 (100.0%) | 0 (0.0%) |
| Life, Physical & Social Science | 0 (0.0%) | 54 (100.0%) |
| Community & Social Service | 66 (17.3%) | 315 (82.7%) |
| Education, Arts & Media | 11 (100.0%) | 0 (0.0%) |
| Legal Services & Support | 0 (0.0%) | 61 (100.0%) |
| Education Instruction & Library | 55 (20.3%) | 216 (79.7%) |
| Arts, Media & Entertainment | 0 (0.0%) | 38 (100.0%) |
| Health Diagnosing & Treating | 0 (0.0%) | 54 (100.0%) |
| Health Technologists | 0 (0.0%) | 54 (100.0%) |
| Total (Category) | 208 (32.3%) | 437 (67.7%) |
| Total (Overall) | 1,025 (50.5%) | 1,003 (49.5%) |
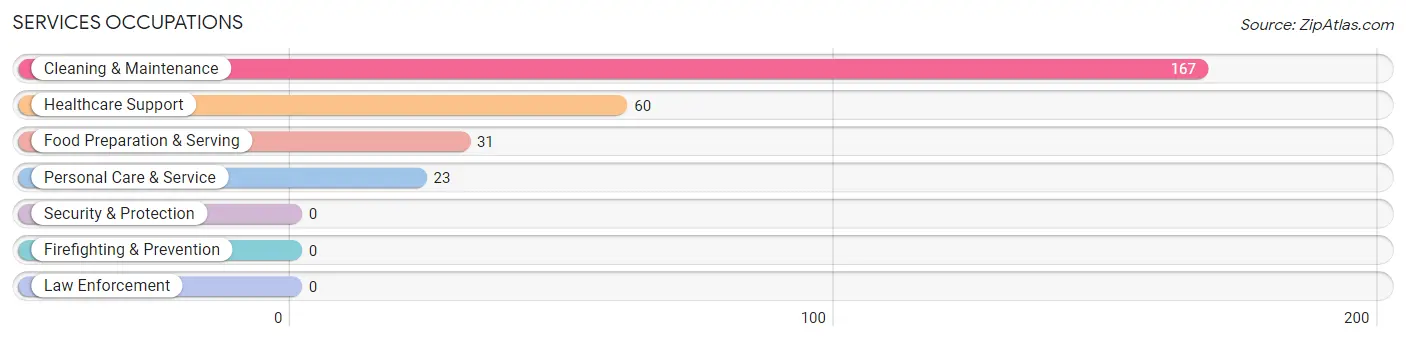
Services Occupations
The most common Services occupations in Berryville are Cleaning & Maintenance (167 | 8.2%), Healthcare Support (60 | 3.0%), Food Preparation & Serving (31 | 1.5%), and Personal Care & Service (23 | 1.1%).
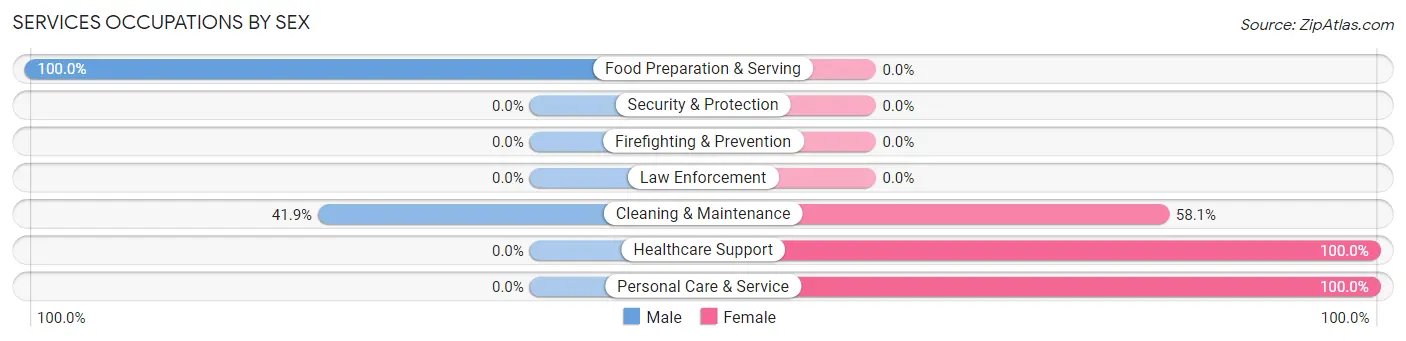
Services Occupations by Sex
Within the Services occupations in Berryville, the most male-oriented occupations are Food Preparation & Serving (100.0%), and Cleaning & Maintenance (41.9%), while the most female-oriented occupations are Healthcare Support (100.0%), Personal Care & Service (100.0%), and Cleaning & Maintenance (58.1%).
| Occupation | Male | Female |
| Healthcare Support | 0 (0.0%) | 60 (100.0%) |
| Security & Protection | 0 (0.0%) | 0 (0.0%) |
| Firefighting & Prevention | 0 (0.0%) | 0 (0.0%) |
| Law Enforcement | 0 (0.0%) | 0 (0.0%) |
| Food Preparation & Serving | 31 (100.0%) | 0 (0.0%) |
| Cleaning & Maintenance | 70 (41.9%) | 97 (58.1%) |
| Personal Care & Service | 0 (0.0%) | 23 (100.0%) |
| Total (Category) | 101 (35.9%) | 180 (64.1%) |
| Total (Overall) | 1,025 (50.5%) | 1,003 (49.5%) |
Sales and Office Occupations
The most common Sales and Office occupations in Berryville are Office & Administration (139 | 6.9%), and Sales & Related (111 | 5.5%).

Sales and Office Occupations by Sex

| Occupation | Male | Female |
| Sales & Related | 44 (39.6%) | 67 (60.4%) |
| Office & Administration | 21 (15.1%) | 118 (84.9%) |
| Total (Category) | 65 (26.0%) | 185 (74.0%) |
| Total (Overall) | 1,025 (50.5%) | 1,003 (49.5%) |
Natural Resources, Construction and Maintenance Occupations
The most common Natural Resources, Construction and Maintenance occupations in Berryville are Farming, Fishing & Forestry (198 | 9.8%), Construction & Extraction (113 | 5.6%), and Installation, Maintenance & Repair (104 | 5.1%).
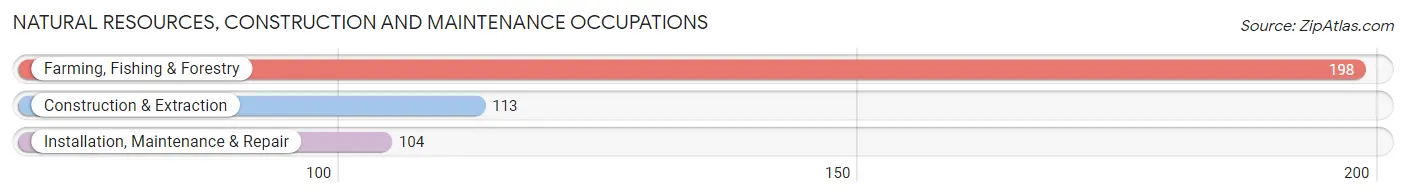
Natural Resources, Construction and Maintenance Occupations by Sex

| Occupation | Male | Female |
| Farming, Fishing & Forestry | 198 (100.0%) | 0 (0.0%) |
| Construction & Extraction | 113 (100.0%) | 0 (0.0%) |
| Installation, Maintenance & Repair | 104 (100.0%) | 0 (0.0%) |
| Total (Category) | 415 (100.0%) | 0 (0.0%) |
| Total (Overall) | 1,025 (50.5%) | 1,003 (49.5%) |
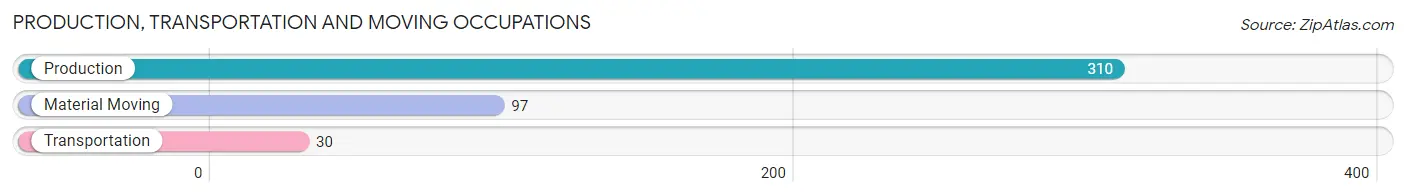
Production, Transportation and Moving Occupations
The most common Production, Transportation and Moving occupations in Berryville are Production (310 | 15.3%), Material Moving (97 | 4.8%), and Transportation (30 | 1.5%).
Production, Transportation and Moving Occupations by Sex
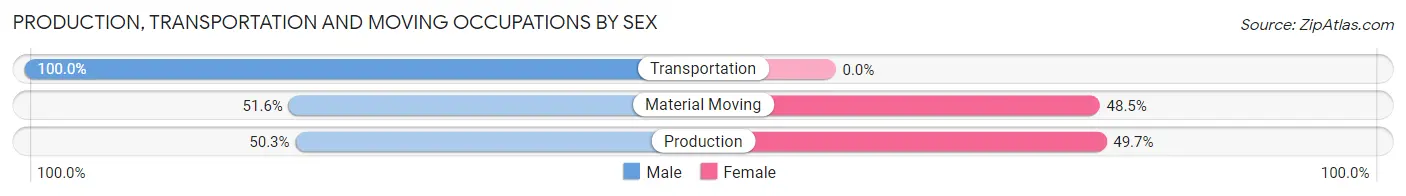
| Occupation | Male | Female |
| Production | 156 (50.3%) | 154 (49.7%) |
| Transportation | 30 (100.0%) | 0 (0.0%) |
| Material Moving | 50 (51.5%) | 47 (48.4%) |
| Total (Category) | 236 (54.0%) | 201 (46.0%) |
| Total (Overall) | 1,025 (50.5%) | 1,003 (49.5%) |
Employment Industries by Sex in Berryville
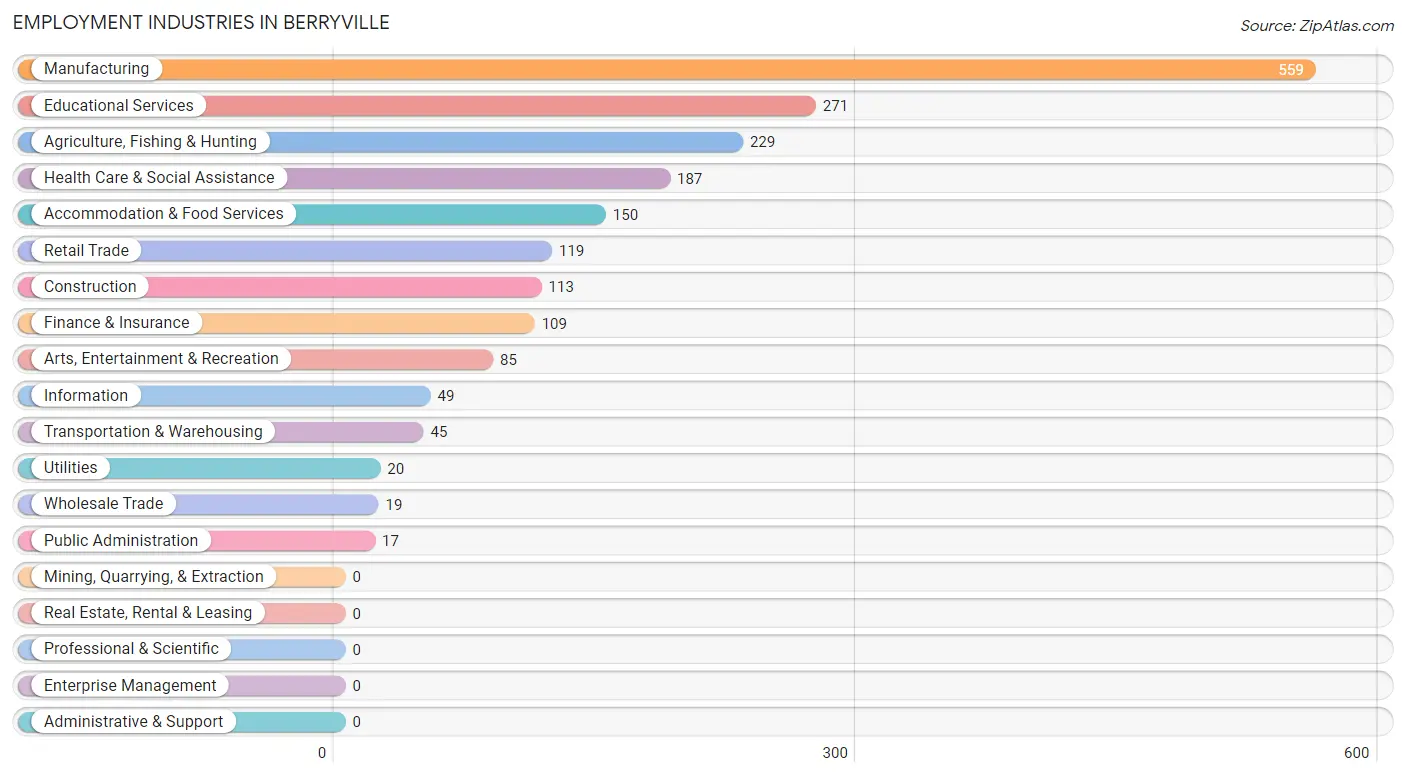
Employment Industries in Berryville
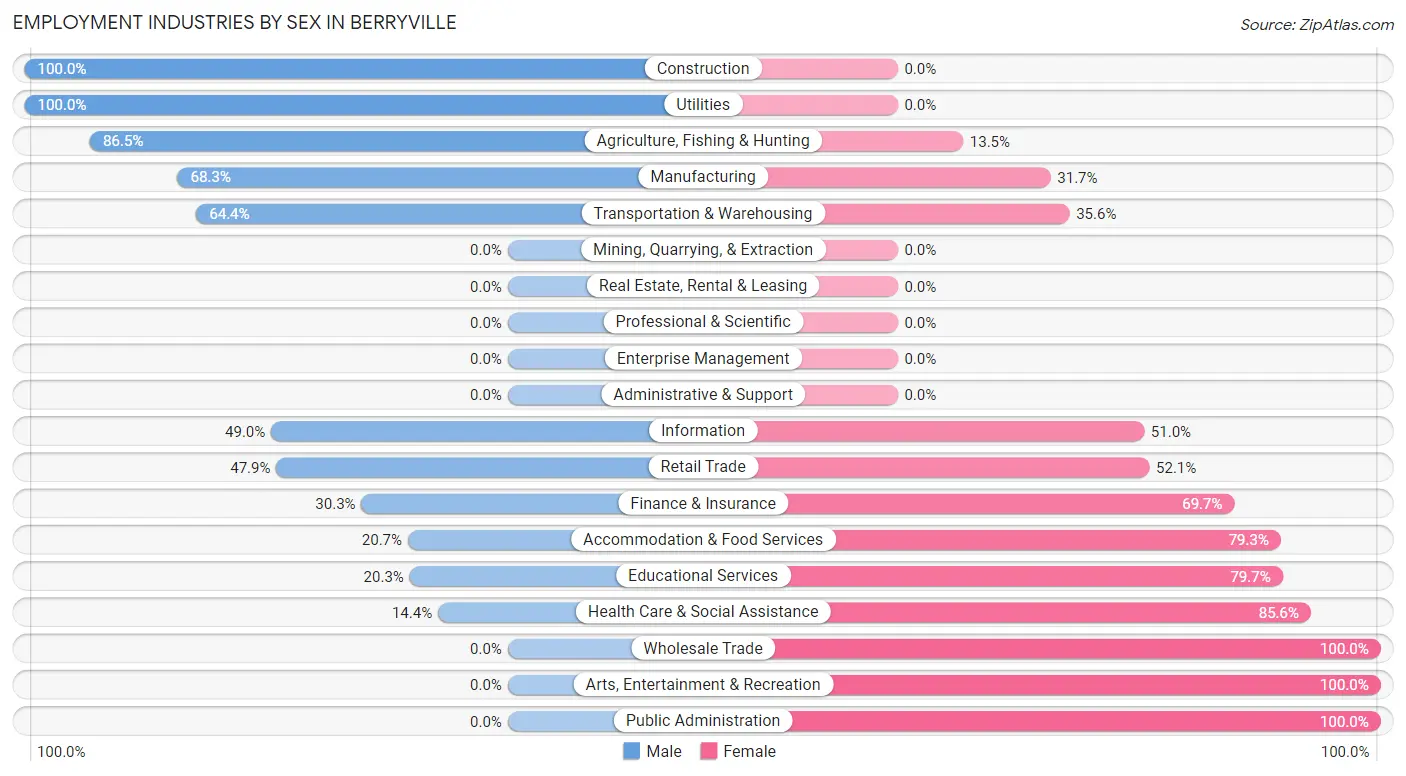
The major employment industries in Berryville include Manufacturing (559 | 27.6%), Educational Services (271 | 13.4%), Agriculture, Fishing & Hunting (229 | 11.3%), Health Care & Social Assistance (187 | 9.2%), and Accommodation & Food Services (150 | 7.4%).
Employment Industries by Sex in Berryville
The Berryville industries that see more men than women are Construction (100.0%), Utilities (100.0%), and Agriculture, Fishing & Hunting (86.5%), whereas the industries that tend to have a higher number of women are Wholesale Trade (100.0%), Arts, Entertainment & Recreation (100.0%), and Public Administration (100.0%).
| Industry | Male | Female |
| Agriculture, Fishing & Hunting | 198 (86.5%) | 31 (13.5%) |
| Mining, Quarrying, & Extraction | 0 (0.0%) | 0 (0.0%) |
| Construction | 113 (100.0%) | 0 (0.0%) |
| Manufacturing | 382 (68.3%) | 177 (31.7%) |
| Wholesale Trade | 0 (0.0%) | 19 (100.0%) |
| Retail Trade | 57 (47.9%) | 62 (52.1%) |
| Transportation & Warehousing | 29 (64.4%) | 16 (35.6%) |
| Utilities | 20 (100.0%) | 0 (0.0%) |
| Information | 24 (49.0%) | 25 (51.0%) |
| Finance & Insurance | 33 (30.3%) | 76 (69.7%) |
| Real Estate, Rental & Leasing | 0 (0.0%) | 0 (0.0%) |
| Professional & Scientific | 0 (0.0%) | 0 (0.0%) |
| Enterprise Management | 0 (0.0%) | 0 (0.0%) |
| Administrative & Support | 0 (0.0%) | 0 (0.0%) |
| Educational Services | 55 (20.3%) | 216 (79.7%) |
| Health Care & Social Assistance | 27 (14.4%) | 160 (85.6%) |
| Arts, Entertainment & Recreation | 0 (0.0%) | 85 (100.0%) |
| Accommodation & Food Services | 31 (20.7%) | 119 (79.3%) |
| Public Administration | 0 (0.0%) | 17 (100.0%) |
| Total | 1,025 (50.5%) | 1,003 (49.5%) |
Education in Berryville
School Enrollment in Berryville
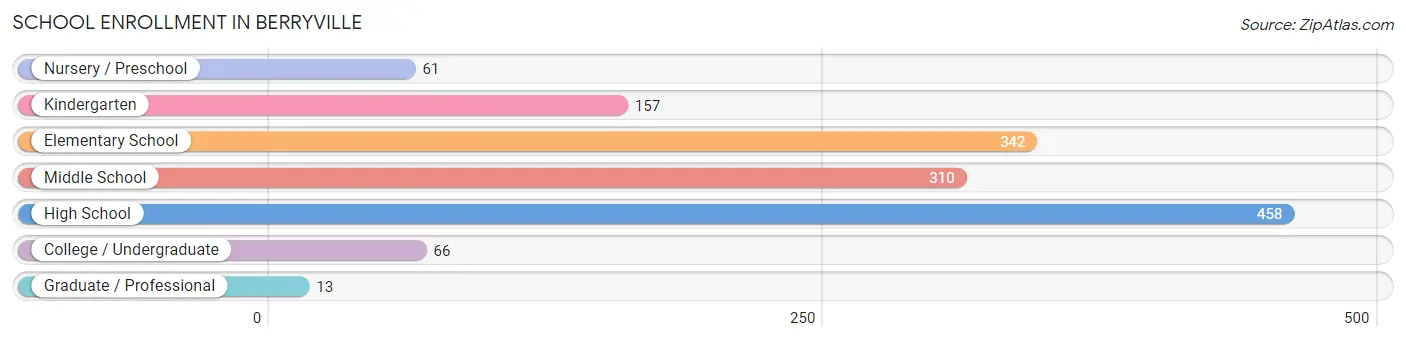
The most common levels of schooling among the 1,407 students in Berryville are high school (458 | 32.6%), elementary school (342 | 24.3%), and middle school (310 | 22.0%).
| School Level | # Students | % Students |
| Nursery / Preschool | 61 | 4.3% |
| Kindergarten | 157 | 11.2% |
| Elementary School | 342 | 24.3% |
| Middle School | 310 | 22.0% |
| High School | 458 | 32.6% |
| College / Undergraduate | 66 | 4.7% |
| Graduate / Professional | 13 | 0.9% |
| Total | 1,407 | 100.0% |
School Enrollment by Age by Funding Source in Berryville
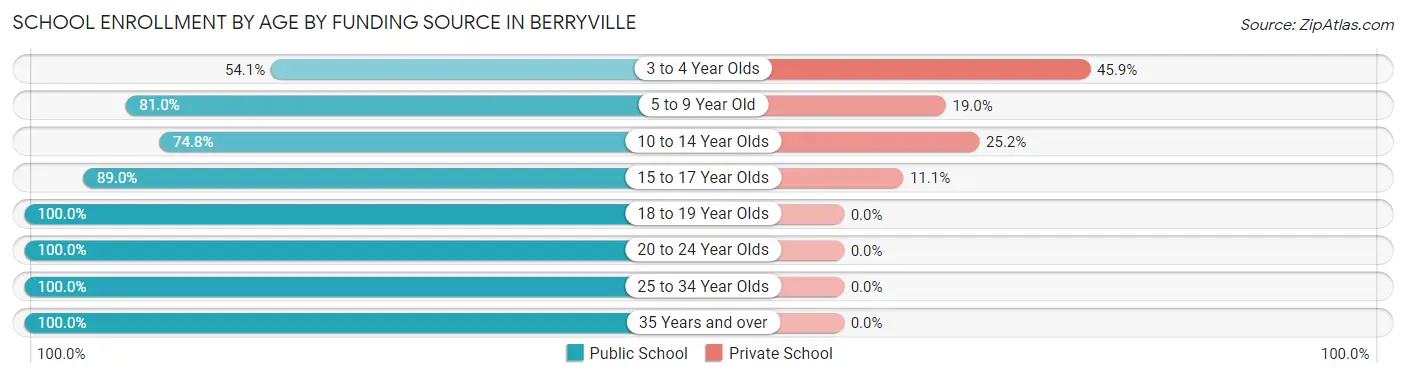
Out of a total of 1,407 students who are enrolled in schools in Berryville, 259 (18.4%) attend a private institution, while the remaining 1,148 (81.6%) are enrolled in public schools. The age group of 3 to 4 year olds has the highest likelihood of being enrolled in private schools, with 28 (45.9% in the age bracket) enrolled. Conversely, the age group of 18 to 19 year olds has the lowest likelihood of being enrolled in a private school, with 30 (100.0% in the age bracket) attending a public institution.
| Age Bracket | Public School | Private School |
| 3 to 4 Year Olds | 33 (54.1%) | 28 (45.9%) |
| 5 to 9 Year Old | 363 (81.0%) | 85 (19.0%) |
| 10 to 14 Year Olds | 320 (74.8%) | 108 (25.2%) |
| 15 to 17 Year Olds | 306 (88.9%) | 38 (11.1%) |
| 18 to 19 Year Olds | 30 (100.0%) | 0 (0.0%) |
| 20 to 24 Year Olds | 34 (100.0%) | 0 (0.0%) |
| 25 to 34 Year Olds | 25 (100.0%) | 0 (0.0%) |
| 35 Years and over | 37 (100.0%) | 0 (0.0%) |
| Total | 1,148 (81.6%) | 259 (18.4%) |
Educational Attainment by Field of Study in Berryville
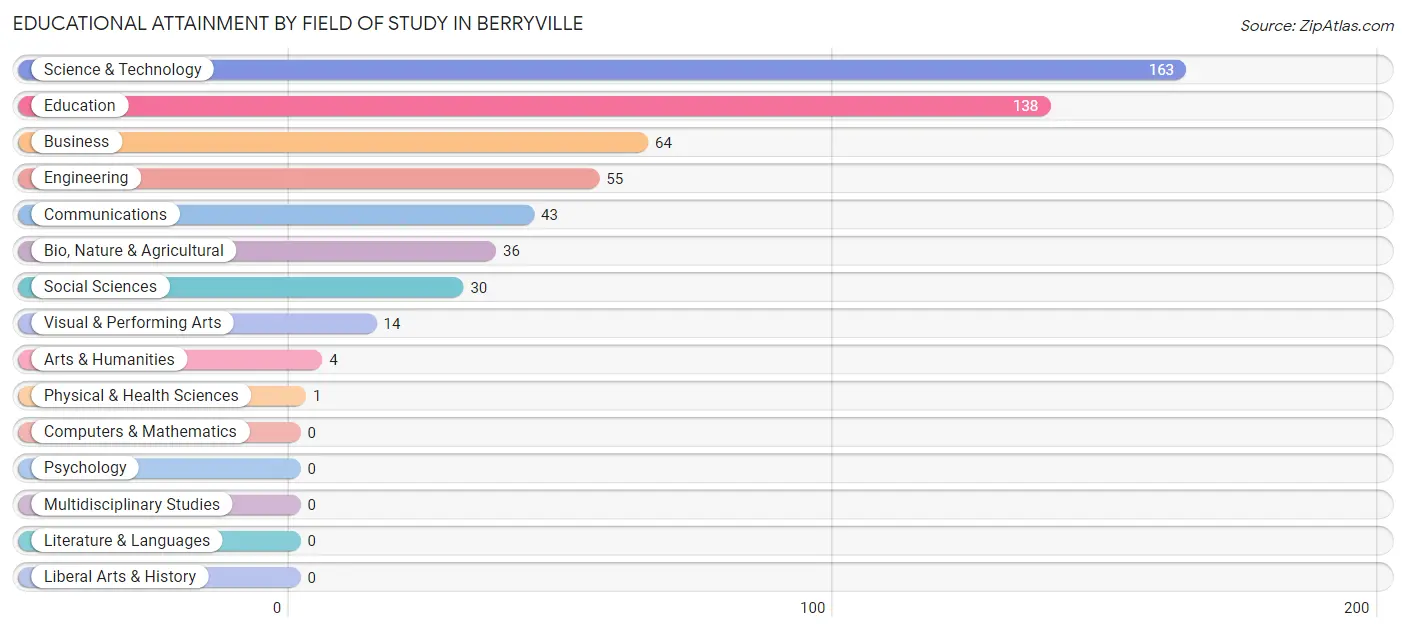
Science & technology (163 | 29.7%), education (138 | 25.2%), business (64 | 11.7%), engineering (55 | 10.0%), and communications (43 | 7.9%) are the most common fields of study among 548 individuals in Berryville who have obtained a bachelor's degree or higher.
| Field of Study | # Graduates | % Graduates |
| Computers & Mathematics | 0 | 0.0% |
| Bio, Nature & Agricultural | 36 | 6.6% |
| Physical & Health Sciences | 1 | 0.2% |
| Psychology | 0 | 0.0% |
| Social Sciences | 30 | 5.5% |
| Engineering | 55 | 10.0% |
| Multidisciplinary Studies | 0 | 0.0% |
| Science & Technology | 163 | 29.7% |
| Business | 64 | 11.7% |
| Education | 138 | 25.2% |
| Literature & Languages | 0 | 0.0% |
| Liberal Arts & History | 0 | 0.0% |
| Visual & Performing Arts | 14 | 2.5% |
| Communications | 43 | 7.9% |
| Arts & Humanities | 4 | 0.7% |
| Total | 548 | 100.0% |
Transportation & Commute in Berryville
Vehicle Availability by Sex in Berryville
The most prevalent vehicle ownership categories in Berryville are males with 2 vehicles (412, accounting for 41.3%) and females with 2 vehicles (524, making up 39.0%).
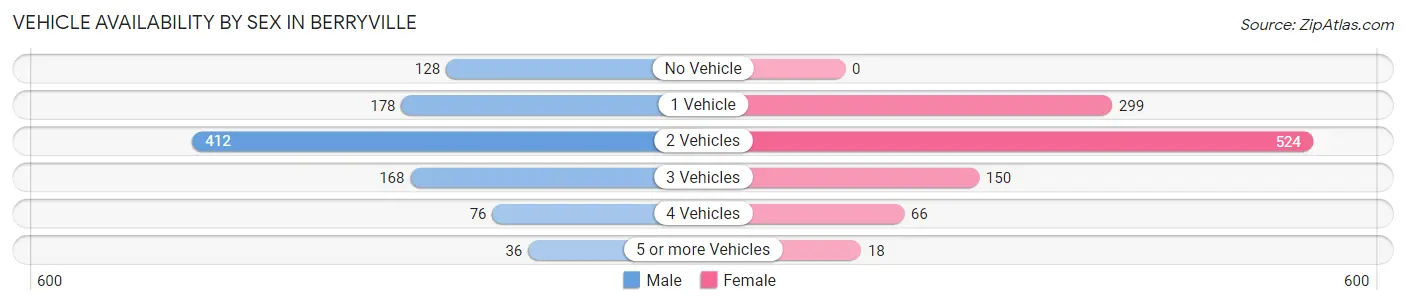
| Vehicles Available | Male | Female |
| No Vehicle | 128 (12.8%) | 0 (0.0%) |
| 1 Vehicle | 178 (17.8%) | 299 (28.3%) |
| 2 Vehicles | 412 (41.3%) | 524 (49.6%) |
| 3 Vehicles | 168 (16.8%) | 150 (14.2%) |
| 4 Vehicles | 76 (7.6%) | 66 (6.2%) |
| 5 or more Vehicles | 36 (3.6%) | 18 (1.7%) |
| Total | 998 (100.0%) | 1,057 (100.0%) |
Commute Time in Berryville
The most frequently occuring commute durations in Berryville are 5 to 9 minutes (590 commuters, 29.6%), 10 to 14 minutes (512 commuters, 25.7%), and 15 to 19 minutes (321 commuters, 16.1%).
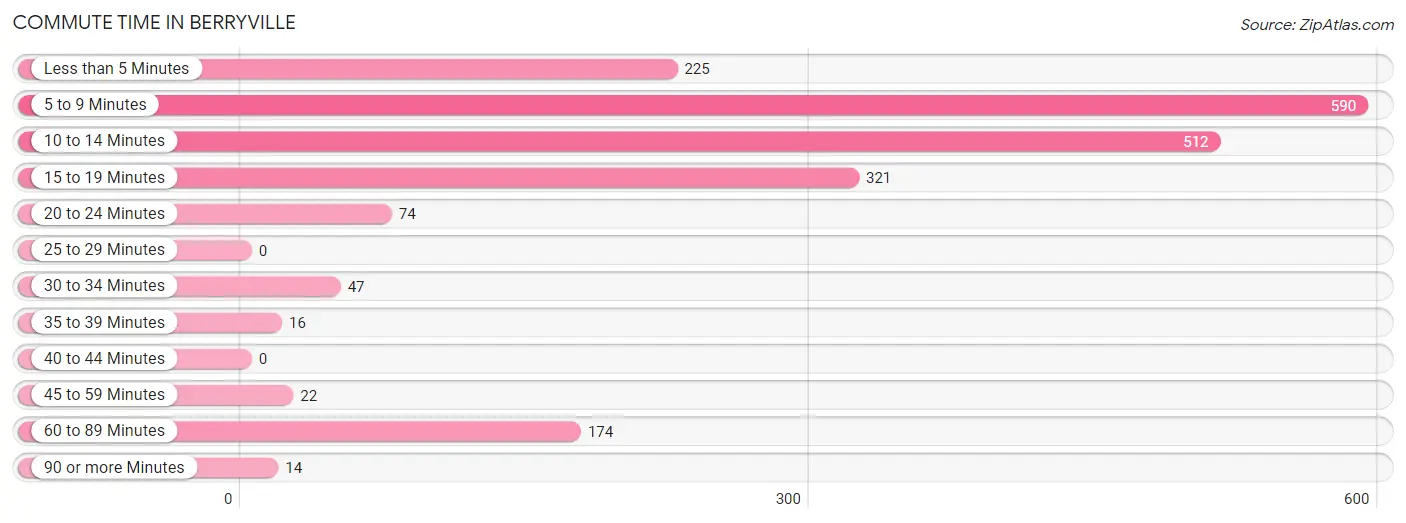
| Commute Time | # Commuters | % Commuters |
| Less than 5 Minutes | 225 | 11.3% |
| 5 to 9 Minutes | 590 | 29.6% |
| 10 to 14 Minutes | 512 | 25.7% |
| 15 to 19 Minutes | 321 | 16.1% |
| 20 to 24 Minutes | 74 | 3.7% |
| 25 to 29 Minutes | 0 | 0.0% |
| 30 to 34 Minutes | 47 | 2.4% |
| 35 to 39 Minutes | 16 | 0.8% |
| 40 to 44 Minutes | 0 | 0.0% |
| 45 to 59 Minutes | 22 | 1.1% |
| 60 to 89 Minutes | 174 | 8.7% |
| 90 or more Minutes | 14 | 0.7% |
Commute Time by Sex in Berryville
The most common commute times in Berryville are 10 to 14 minutes (297 commuters, 30.4%) for males and 5 to 9 minutes (450 commuters, 44.3%) for females.
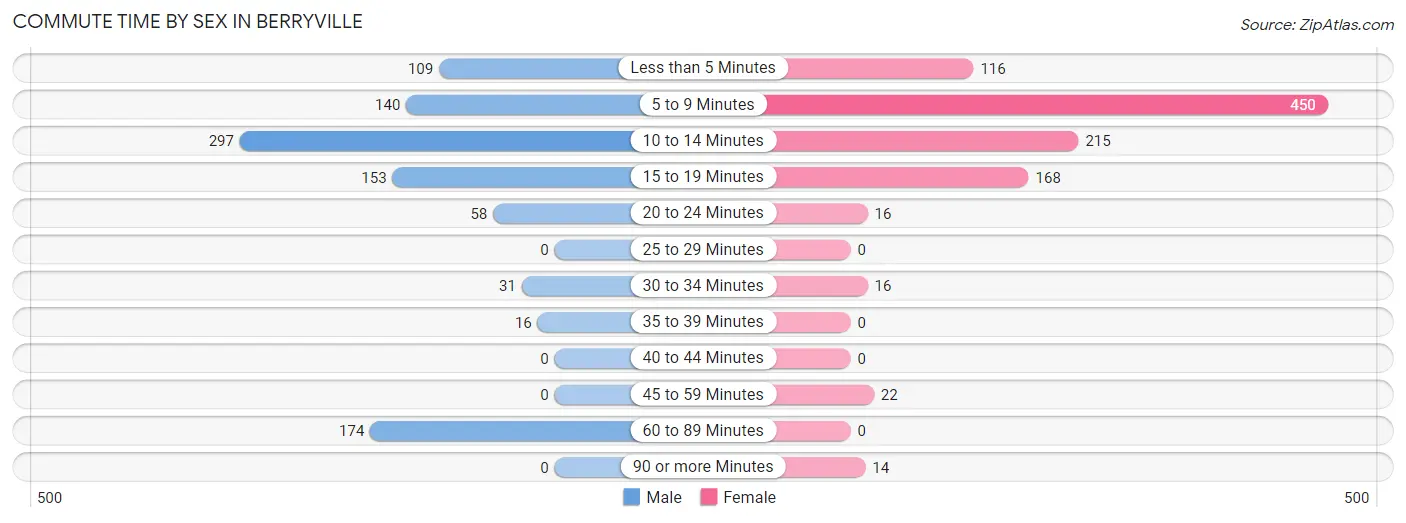
| Commute Time | Male | Female |
| Less than 5 Minutes | 109 (11.2%) | 116 (11.4%) |
| 5 to 9 Minutes | 140 (14.3%) | 450 (44.3%) |
| 10 to 14 Minutes | 297 (30.4%) | 215 (21.1%) |
| 15 to 19 Minutes | 153 (15.6%) | 168 (16.5%) |
| 20 to 24 Minutes | 58 (5.9%) | 16 (1.6%) |
| 25 to 29 Minutes | 0 (0.0%) | 0 (0.0%) |
| 30 to 34 Minutes | 31 (3.2%) | 16 (1.6%) |
| 35 to 39 Minutes | 16 (1.6%) | 0 (0.0%) |
| 40 to 44 Minutes | 0 (0.0%) | 0 (0.0%) |
| 45 to 59 Minutes | 0 (0.0%) | 22 (2.2%) |
| 60 to 89 Minutes | 174 (17.8%) | 0 (0.0%) |
| 90 or more Minutes | 0 (0.0%) | 14 (1.4%) |
Time of Departure to Work by Sex in Berryville
The most frequent times of departure to work in Berryville are 12:00 PM to 3:59 PM (362, 37.0%) for males and 7:00 AM to 7:29 AM (190, 18.7%) for females.
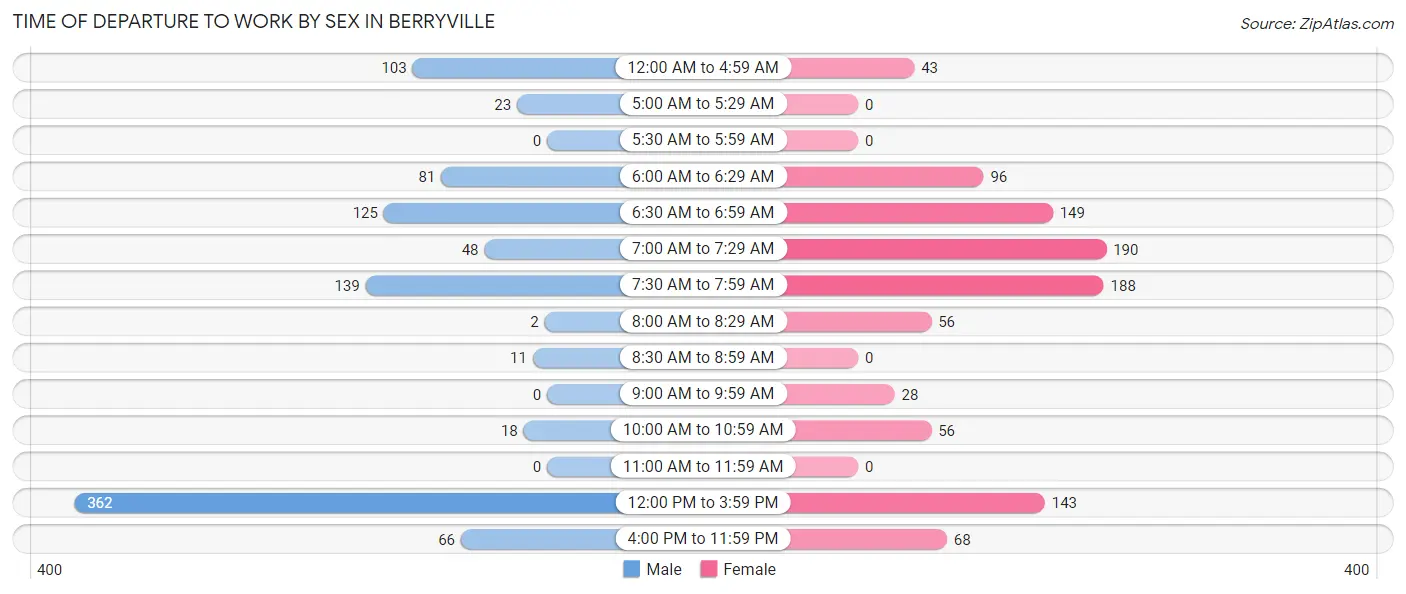
| Time of Departure | Male | Female |
| 12:00 AM to 4:59 AM | 103 (10.5%) | 43 (4.2%) |
| 5:00 AM to 5:29 AM | 23 (2.4%) | 0 (0.0%) |
| 5:30 AM to 5:59 AM | 0 (0.0%) | 0 (0.0%) |
| 6:00 AM to 6:29 AM | 81 (8.3%) | 96 (9.4%) |
| 6:30 AM to 6:59 AM | 125 (12.8%) | 149 (14.6%) |
| 7:00 AM to 7:29 AM | 48 (4.9%) | 190 (18.7%) |
| 7:30 AM to 7:59 AM | 139 (14.2%) | 188 (18.5%) |
| 8:00 AM to 8:29 AM | 2 (0.2%) | 56 (5.5%) |
| 8:30 AM to 8:59 AM | 11 (1.1%) | 0 (0.0%) |
| 9:00 AM to 9:59 AM | 0 (0.0%) | 28 (2.8%) |
| 10:00 AM to 10:59 AM | 18 (1.8%) | 56 (5.5%) |
| 11:00 AM to 11:59 AM | 0 (0.0%) | 0 (0.0%) |
| 12:00 PM to 3:59 PM | 362 (37.0%) | 143 (14.1%) |
| 4:00 PM to 11:59 PM | 66 (6.8%) | 68 (6.7%) |
| Total | 978 (100.0%) | 1,017 (100.0%) |
Housing Occupancy in Berryville
Occupancy by Ownership in Berryville
Of the total 2,315 dwellings in Berryville, owner-occupied units account for 1,480 (63.9%), while renter-occupied units make up 835 (36.1%).
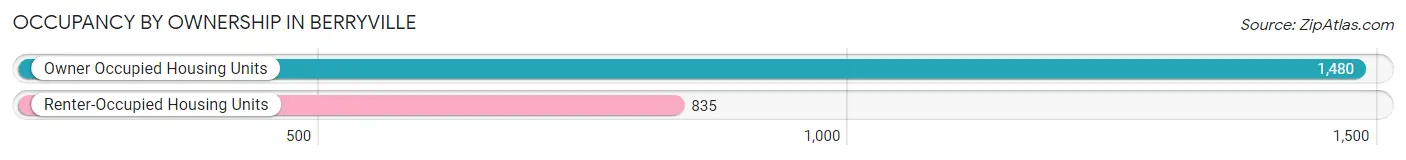
| Occupancy | # Housing Units | % Housing Units |
| Owner Occupied Housing Units | 1,480 | 63.9% |
| Renter-Occupied Housing Units | 835 | 36.1% |
| Total Occupied Housing Units | 2,315 | 100.0% |
Occupancy by Household Size in Berryville
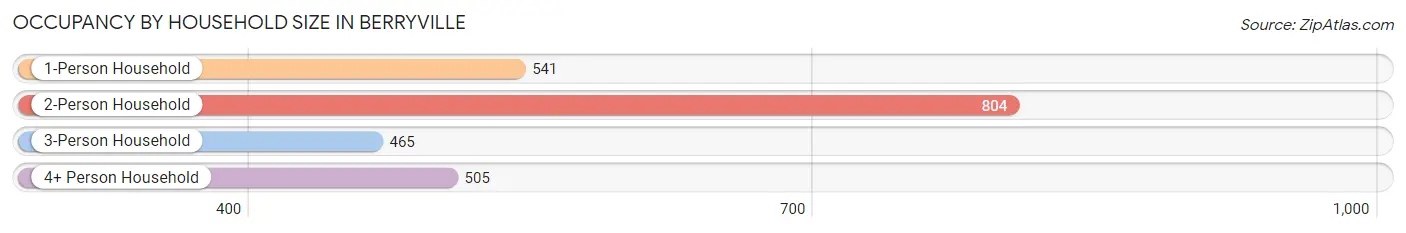
| Household Size | # Housing Units | % Housing Units |
| 1-Person Household | 541 | 23.4% |
| 2-Person Household | 804 | 34.7% |
| 3-Person Household | 465 | 20.1% |
| 4+ Person Household | 505 | 21.8% |
| Total Housing Units | 2,315 | 100.0% |
Occupancy by Ownership by Household Size in Berryville
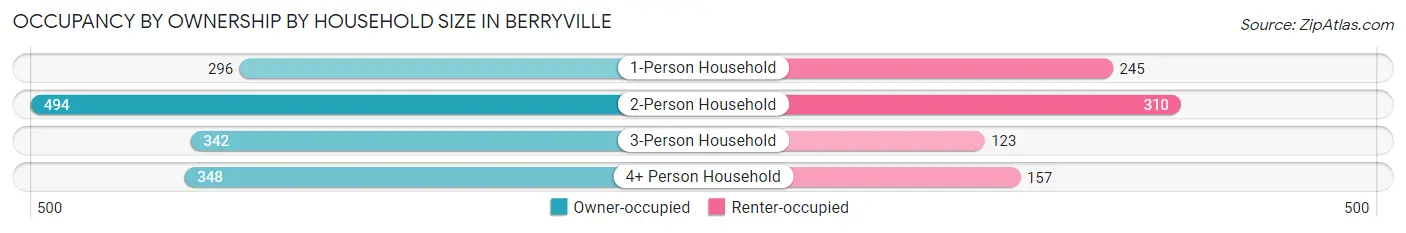
| Household Size | Owner-occupied | Renter-occupied |
| 1-Person Household | 296 (54.7%) | 245 (45.3%) |
| 2-Person Household | 494 (61.4%) | 310 (38.6%) |
| 3-Person Household | 342 (73.6%) | 123 (26.5%) |
| 4+ Person Household | 348 (68.9%) | 157 (31.1%) |
| Total Housing Units | 1,480 (63.9%) | 835 (36.1%) |
Occupancy by Educational Attainment in Berryville
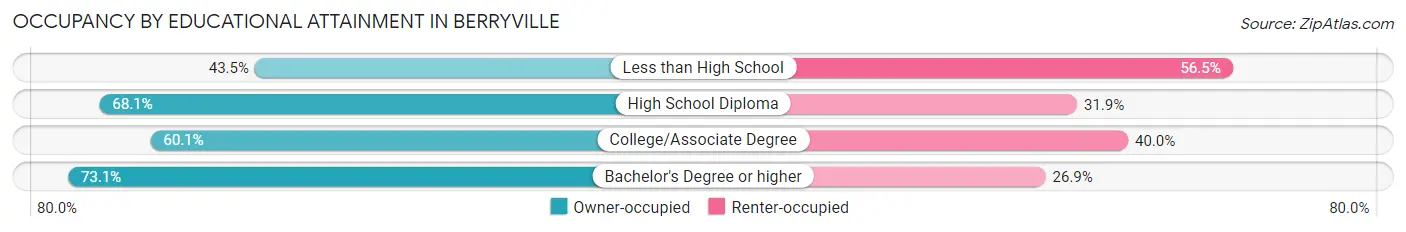
| Household Size | Owner-occupied | Renter-occupied |
| Less than High School | 147 (43.5%) | 191 (56.5%) |
| High School Diploma | 819 (68.1%) | 383 (31.9%) |
| College/Associate Degree | 242 (60.1%) | 161 (40.0%) |
| Bachelor's Degree or higher | 272 (73.1%) | 100 (26.9%) |
Occupancy by Age of Householder in Berryville
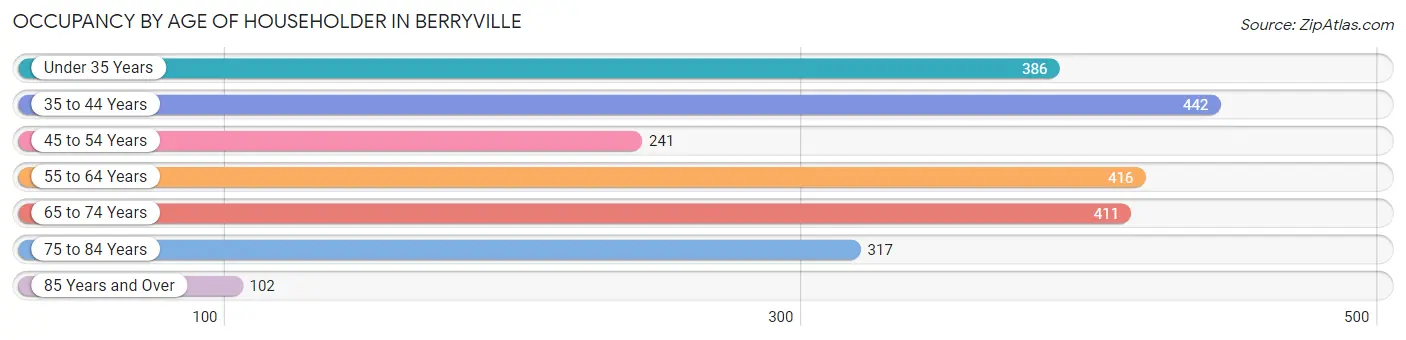
| Age Bracket | # Households | % Households |
| Under 35 Years | 386 | 16.7% |
| 35 to 44 Years | 442 | 19.1% |
| 45 to 54 Years | 241 | 10.4% |
| 55 to 64 Years | 416 | 18.0% |
| 65 to 74 Years | 411 | 17.7% |
| 75 to 84 Years | 317 | 13.7% |
| 85 Years and Over | 102 | 4.4% |
| Total | 2,315 | 100.0% |
Housing Finances in Berryville
Median Income by Occupancy in Berryville
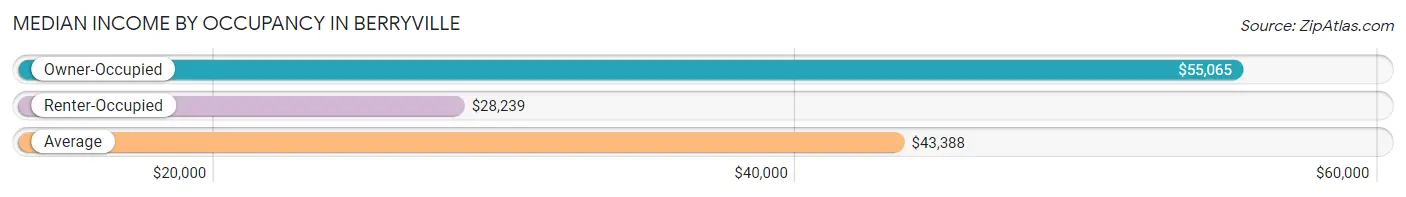
| Occupancy Type | # Households | Median Income |
| Owner-Occupied | 1,480 (63.9%) | $55,065 |
| Renter-Occupied | 835 (36.1%) | $28,239 |
| Average | 2,315 (100.0%) | $43,388 |
Occupancy by Householder Income Bracket in Berryville
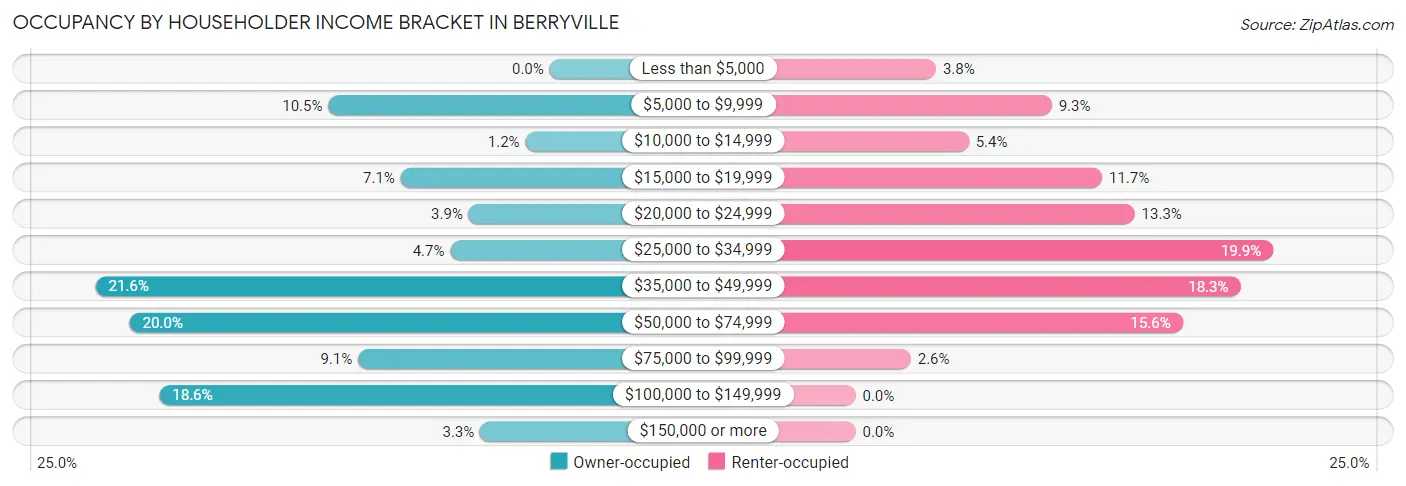
| Income Bracket | Owner-occupied | Renter-occupied |
| Less than $5,000 | 0 (0.0%) | 32 (3.8%) |
| $5,000 to $9,999 | 156 (10.5%) | 78 (9.3%) |
| $10,000 to $14,999 | 17 (1.1%) | 45 (5.4%) |
| $15,000 to $19,999 | 105 (7.1%) | 98 (11.7%) |
| $20,000 to $24,999 | 57 (3.8%) | 111 (13.3%) |
| $25,000 to $34,999 | 70 (4.7%) | 166 (19.9%) |
| $35,000 to $49,999 | 320 (21.6%) | 153 (18.3%) |
| $50,000 to $74,999 | 296 (20.0%) | 130 (15.6%) |
| $75,000 to $99,999 | 135 (9.1%) | 22 (2.6%) |
| $100,000 to $149,999 | 275 (18.6%) | 0 (0.0%) |
| $150,000 or more | 49 (3.3%) | 0 (0.0%) |
| Total | 1,480 (100.0%) | 835 (100.0%) |
Monthly Housing Cost Tiers in Berryville
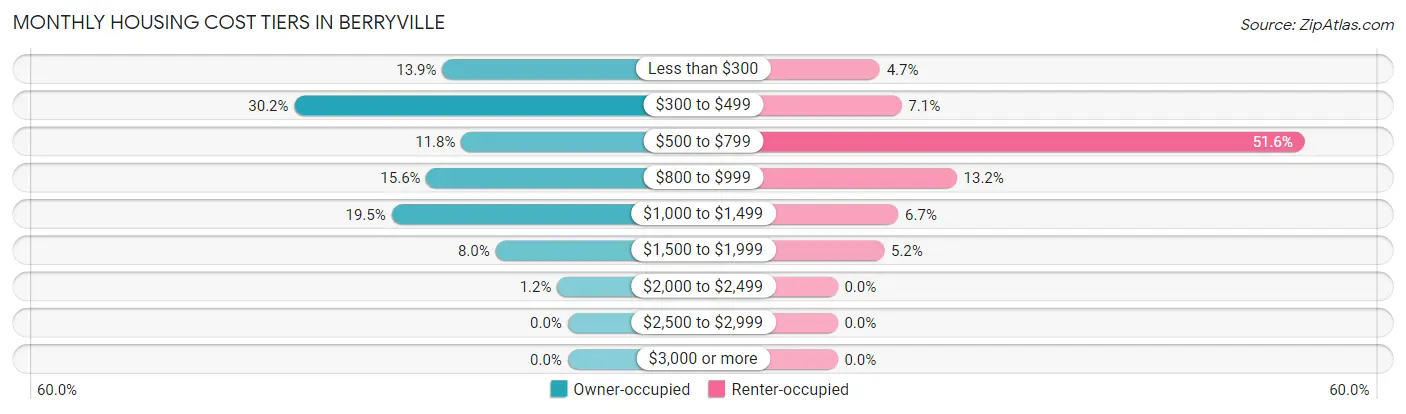
| Monthly Cost | Owner-occupied | Renter-occupied |
| Less than $300 | 205 (13.9%) | 39 (4.7%) |
| $300 to $499 | 447 (30.2%) | 59 (7.1%) |
| $500 to $799 | 174 (11.8%) | 431 (51.6%) |
| $800 to $999 | 231 (15.6%) | 110 (13.2%) |
| $1,000 to $1,499 | 288 (19.5%) | 56 (6.7%) |
| $1,500 to $1,999 | 118 (8.0%) | 43 (5.1%) |
| $2,000 to $2,499 | 17 (1.1%) | 0 (0.0%) |
| $2,500 to $2,999 | 0 (0.0%) | 0 (0.0%) |
| $3,000 or more | 0 (0.0%) | 0 (0.0%) |
| Total | 1,480 (100.0%) | 835 (100.0%) |
Physical Housing Characteristics in Berryville
Housing Structures in Berryville
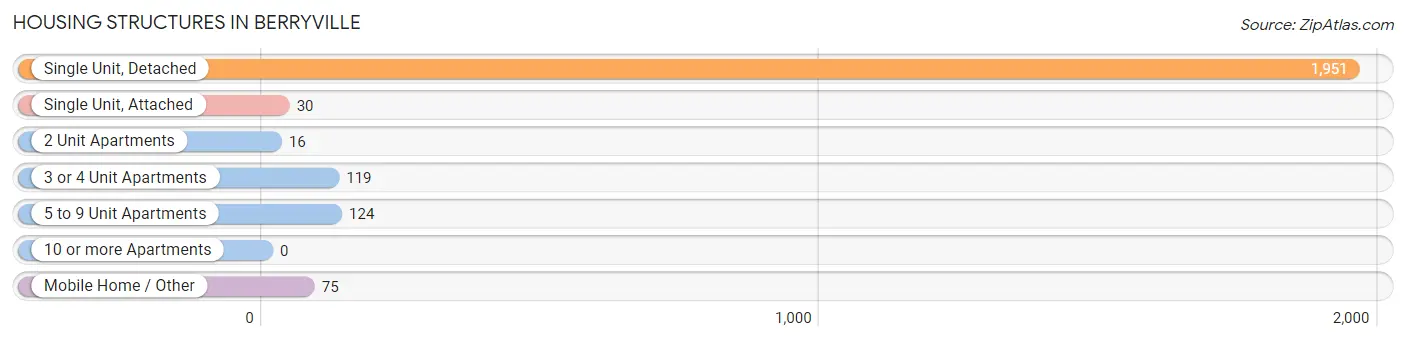
| Structure Type | # Housing Units | % Housing Units |
| Single Unit, Detached | 1,951 | 84.3% |
| Single Unit, Attached | 30 | 1.3% |
| 2 Unit Apartments | 16 | 0.7% |
| 3 or 4 Unit Apartments | 119 | 5.1% |
| 5 to 9 Unit Apartments | 124 | 5.4% |
| 10 or more Apartments | 0 | 0.0% |
| Mobile Home / Other | 75 | 3.2% |
| Total | 2,315 | 100.0% |
Housing Structures by Occupancy in Berryville
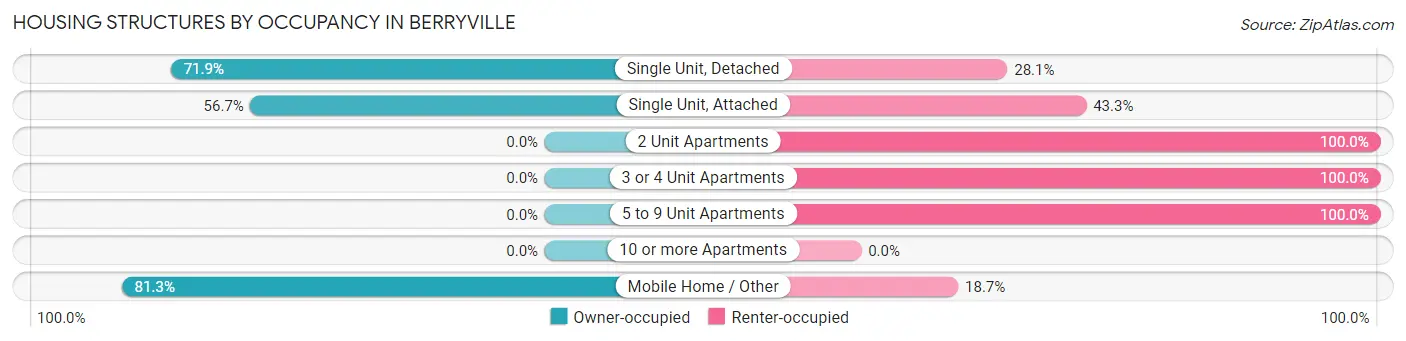
| Structure Type | Owner-occupied | Renter-occupied |
| Single Unit, Detached | 1,402 (71.9%) | 549 (28.1%) |
| Single Unit, Attached | 17 (56.7%) | 13 (43.3%) |
| 2 Unit Apartments | 0 (0.0%) | 16 (100.0%) |
| 3 or 4 Unit Apartments | 0 (0.0%) | 119 (100.0%) |
| 5 to 9 Unit Apartments | 0 (0.0%) | 124 (100.0%) |
| 10 or more Apartments | 0 (0.0%) | 0 (0.0%) |
| Mobile Home / Other | 61 (81.3%) | 14 (18.7%) |
| Total | 1,480 (63.9%) | 835 (36.1%) |
Housing Structures by Number of Rooms in Berryville
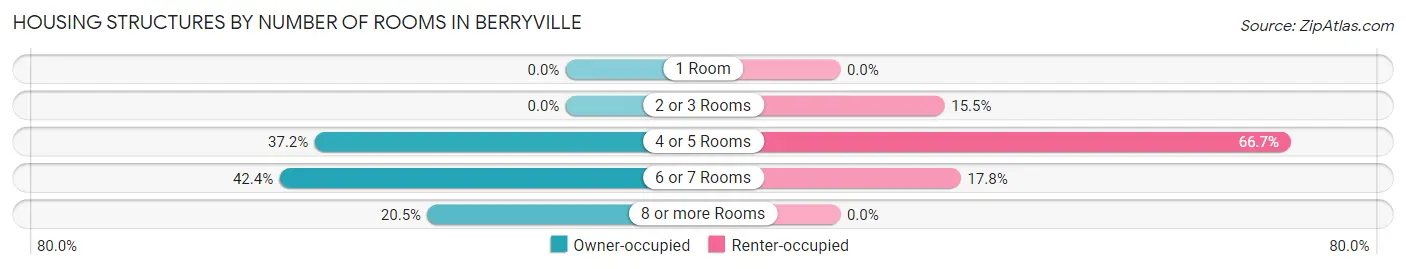
| Number of Rooms | Owner-occupied | Renter-occupied |
| 1 Room | 0 (0.0%) | 0 (0.0%) |
| 2 or 3 Rooms | 0 (0.0%) | 129 (15.4%) |
| 4 or 5 Rooms | 550 (37.2%) | 557 (66.7%) |
| 6 or 7 Rooms | 627 (42.4%) | 149 (17.8%) |
| 8 or more Rooms | 303 (20.5%) | 0 (0.0%) |
| Total | 1,480 (100.0%) | 835 (100.0%) |
Housing Structure by Heating Type in Berryville
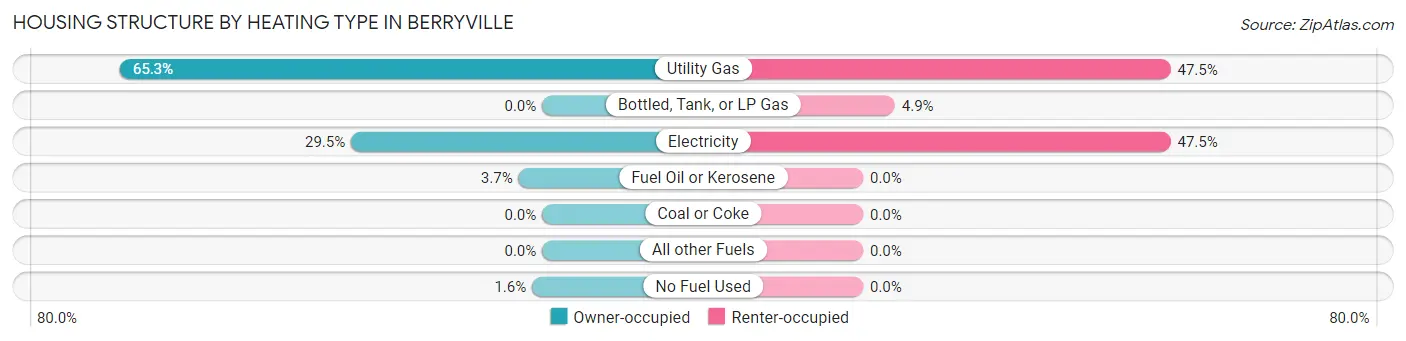
| Heating Type | Owner-occupied | Renter-occupied |
| Utility Gas | 966 (65.3%) | 397 (47.5%) |
| Bottled, Tank, or LP Gas | 0 (0.0%) | 41 (4.9%) |
| Electricity | 437 (29.5%) | 397 (47.5%) |
| Fuel Oil or Kerosene | 54 (3.6%) | 0 (0.0%) |
| Coal or Coke | 0 (0.0%) | 0 (0.0%) |
| All other Fuels | 0 (0.0%) | 0 (0.0%) |
| No Fuel Used | 23 (1.5%) | 0 (0.0%) |
| Total | 1,480 (100.0%) | 835 (100.0%) |
Household Vehicle Usage in Berryville
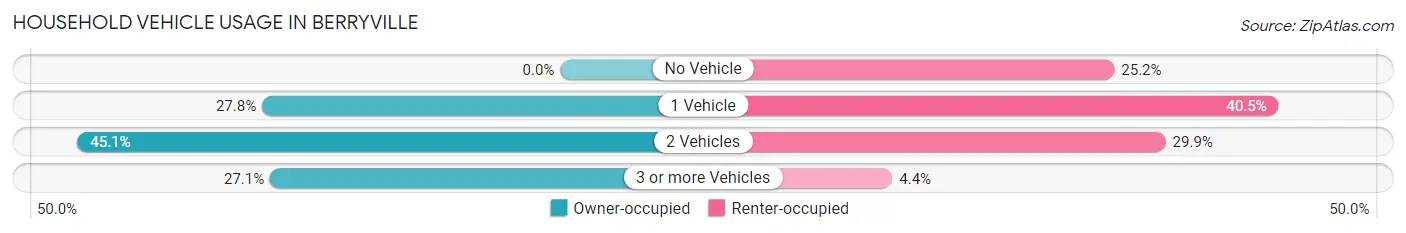
| Vehicles per Household | Owner-occupied | Renter-occupied |
| No Vehicle | 0 (0.0%) | 210 (25.2%) |
| 1 Vehicle | 412 (27.8%) | 338 (40.5%) |
| 2 Vehicles | 667 (45.1%) | 250 (29.9%) |
| 3 or more Vehicles | 401 (27.1%) | 37 (4.4%) |
| Total | 1,480 (100.0%) | 835 (100.0%) |
Real Estate & Mortgages in Berryville
Real Estate and Mortgage Overview in Berryville
| Characteristic | Without Mortgage | With Mortgage |
| Housing Units | 782 | 698 |
| Median Property Value | $92,200 | $177,500 |
| Median Household Income | $39,931 | $32 |
| Monthly Housing Costs | $380 | $0 |
| Real Estate Taxes | $849 | $13 |
Property Value by Mortgage Status in Berryville
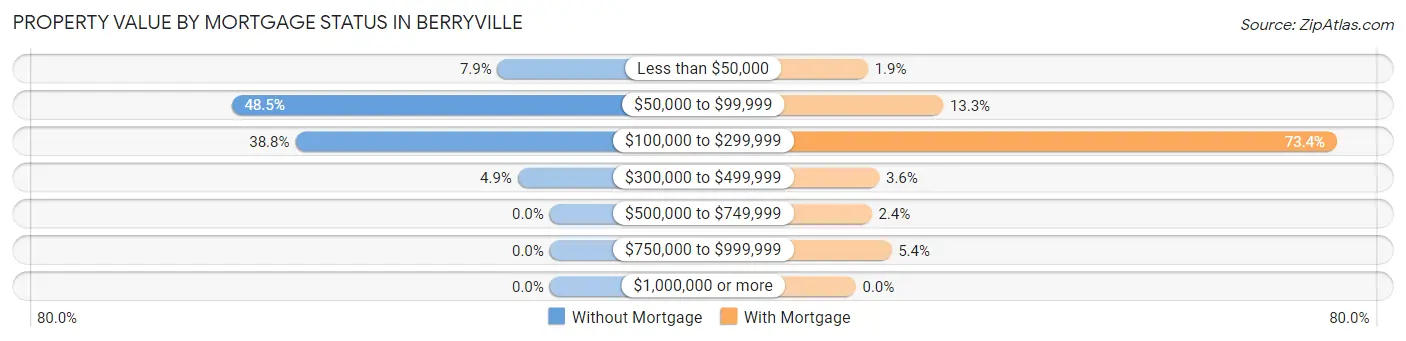
| Property Value | Without Mortgage | With Mortgage |
| Less than $50,000 | 62 (7.9%) | 13 (1.9%) |
| $50,000 to $99,999 | 379 (48.5%) | 93 (13.3%) |
| $100,000 to $299,999 | 303 (38.8%) | 512 (73.4%) |
| $300,000 to $499,999 | 38 (4.9%) | 25 (3.6%) |
| $500,000 to $749,999 | 0 (0.0%) | 17 (2.4%) |
| $750,000 to $999,999 | 0 (0.0%) | 38 (5.4%) |
| $1,000,000 or more | 0 (0.0%) | 0 (0.0%) |
| Total | 782 (100.0%) | 698 (100.0%) |
Household Income by Mortgage Status in Berryville
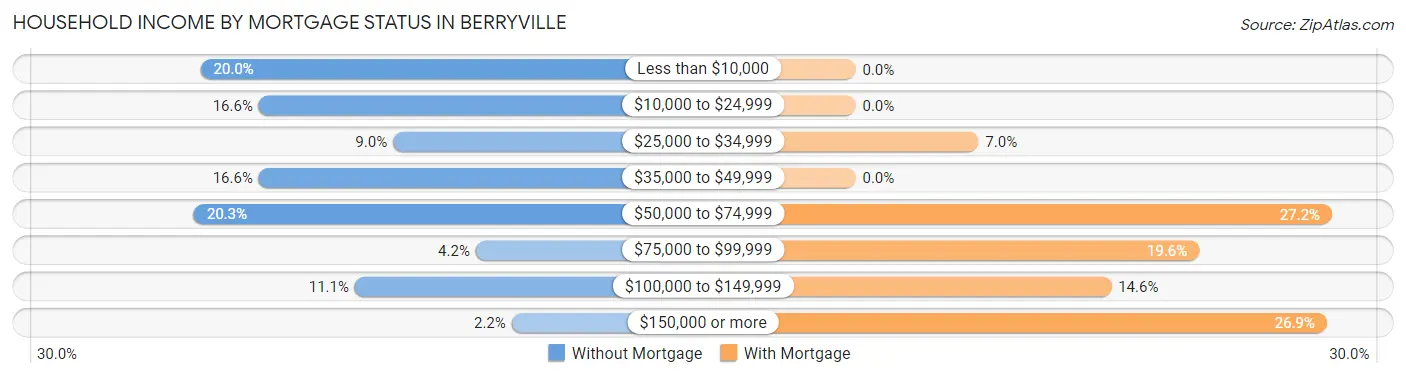
| Household Income | Without Mortgage | With Mortgage |
| Less than $10,000 | 156 (20.0%) | 0 (0.0%) |
| $10,000 to $24,999 | 130 (16.6%) | 0 (0.0%) |
| $25,000 to $34,999 | 70 (8.9%) | 49 (7.0%) |
| $35,000 to $49,999 | 130 (16.6%) | 0 (0.0%) |
| $50,000 to $74,999 | 159 (20.3%) | 190 (27.2%) |
| $75,000 to $99,999 | 33 (4.2%) | 137 (19.6%) |
| $100,000 to $149,999 | 87 (11.1%) | 102 (14.6%) |
| $150,000 or more | 17 (2.2%) | 188 (26.9%) |
| Total | 782 (100.0%) | 698 (100.0%) |
Property Value to Household Income Ratio in Berryville
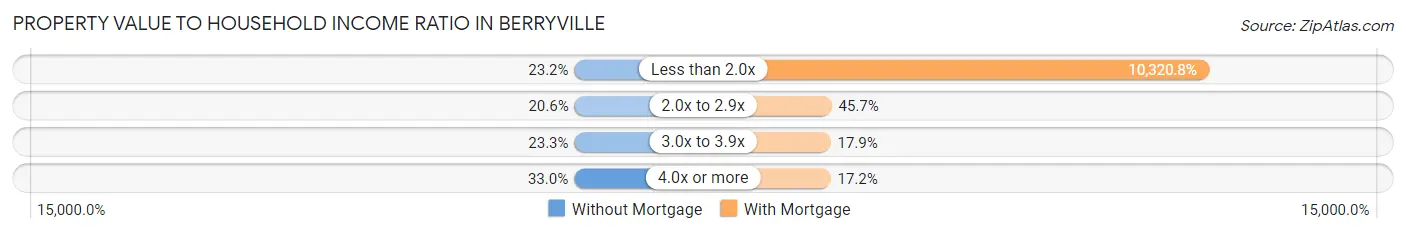
| Value-to-Income Ratio | Without Mortgage | With Mortgage |
| Less than 2.0x | 181 (23.2%) | 72,039 (10,320.8%) |
| 2.0x to 2.9x | 161 (20.6%) | 319 (45.7%) |
| 3.0x to 3.9x | 182 (23.3%) | 125 (17.9%) |
| 4.0x or more | 258 (33.0%) | 120 (17.2%) |
| Total | 782 (100.0%) | 698 (100.0%) |
Real Estate Taxes by Mortgage Status in Berryville
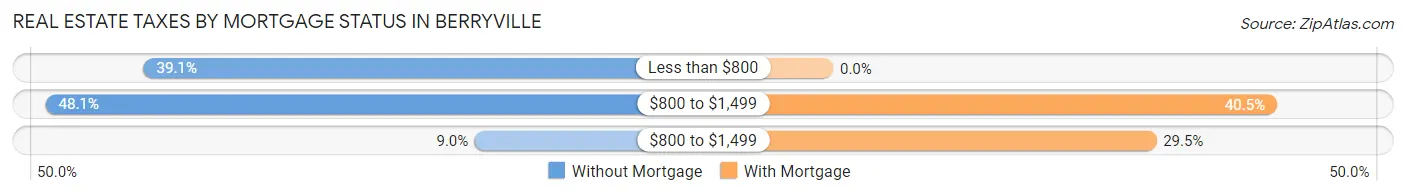
| Property Taxes | Without Mortgage | With Mortgage |
| Less than $800 | 306 (39.1%) | 0 (0.0%) |
| $800 to $1,499 | 376 (48.1%) | 283 (40.5%) |
| $800 to $1,499 | 70 (8.9%) | 206 (29.5%) |
| Total | 782 (100.0%) | 698 (100.0%) |
Health & Disability in Berryville
Health Insurance Coverage by Age in Berryville
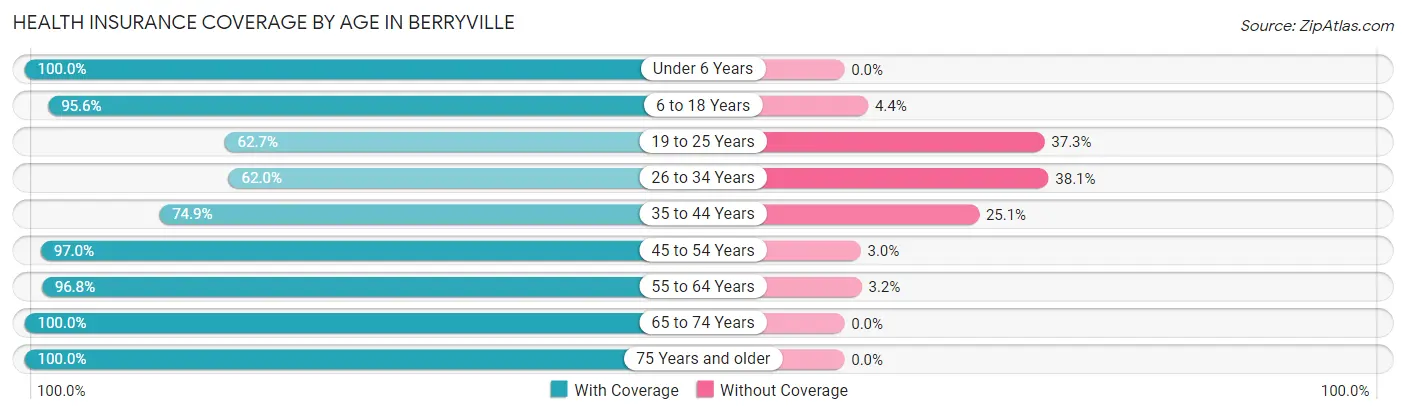
| Age Bracket | With Coverage | Without Coverage |
| Under 6 Years | 449 (100.0%) | 0 (0.0%) |
| 6 to 18 Years | 1,170 (95.6%) | 54 (4.4%) |
| 19 to 25 Years | 163 (62.7%) | 97 (37.3%) |
| 26 to 34 Years | 407 (62.0%) | 250 (38.1%) |
| 35 to 44 Years | 525 (74.9%) | 176 (25.1%) |
| 45 to 54 Years | 416 (97.0%) | 13 (3.0%) |
| 55 to 64 Years | 604 (96.8%) | 20 (3.2%) |
| 65 to 74 Years | 536 (100.0%) | 0 (0.0%) |
| 75 Years and older | 581 (100.0%) | 0 (0.0%) |
| Total | 4,851 (88.8%) | 610 (11.2%) |
Health Insurance Coverage by Citizenship Status in Berryville
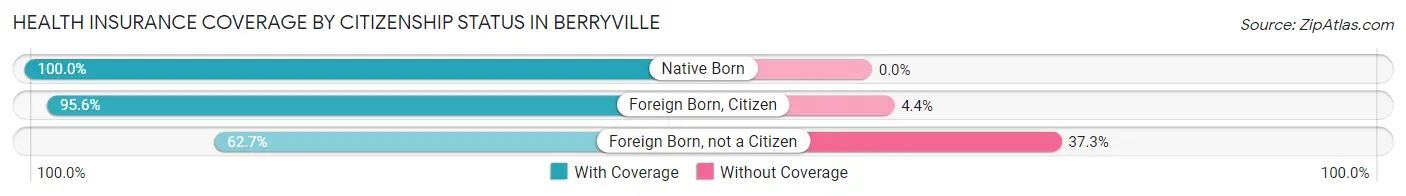
| Citizenship Status | With Coverage | Without Coverage |
| Native Born | 449 (100.0%) | 0 (0.0%) |
| Foreign Born, Citizen | 1,170 (95.6%) | 54 (4.4%) |
| Foreign Born, not a Citizen | 163 (62.7%) | 97 (37.3%) |
Health Insurance Coverage by Household Income in Berryville
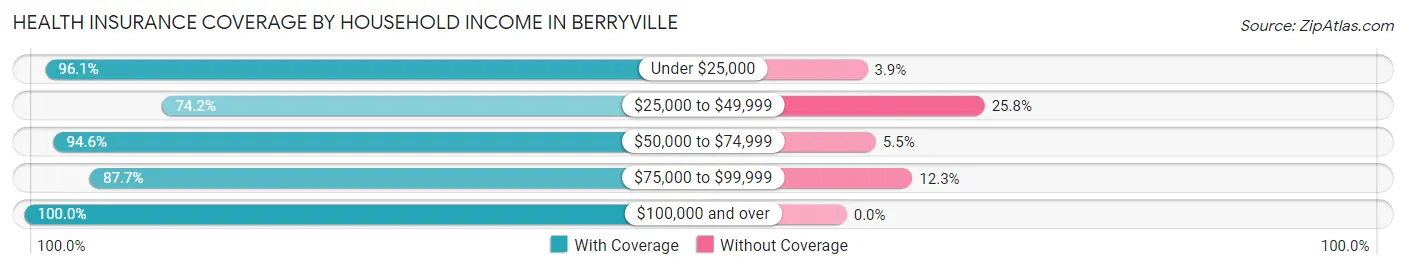
| Household Income | With Coverage | Without Coverage |
| Under $25,000 | 892 (96.1%) | 36 (3.9%) |
| $25,000 to $49,999 | 1,240 (74.2%) | 432 (25.8%) |
| $50,000 to $74,999 | 1,093 (94.6%) | 63 (5.4%) |
| $75,000 to $99,999 | 564 (87.7%) | 79 (12.3%) |
| $100,000 and over | 1,061 (100.0%) | 0 (0.0%) |
Public vs Private Health Insurance Coverage by Age in Berryville
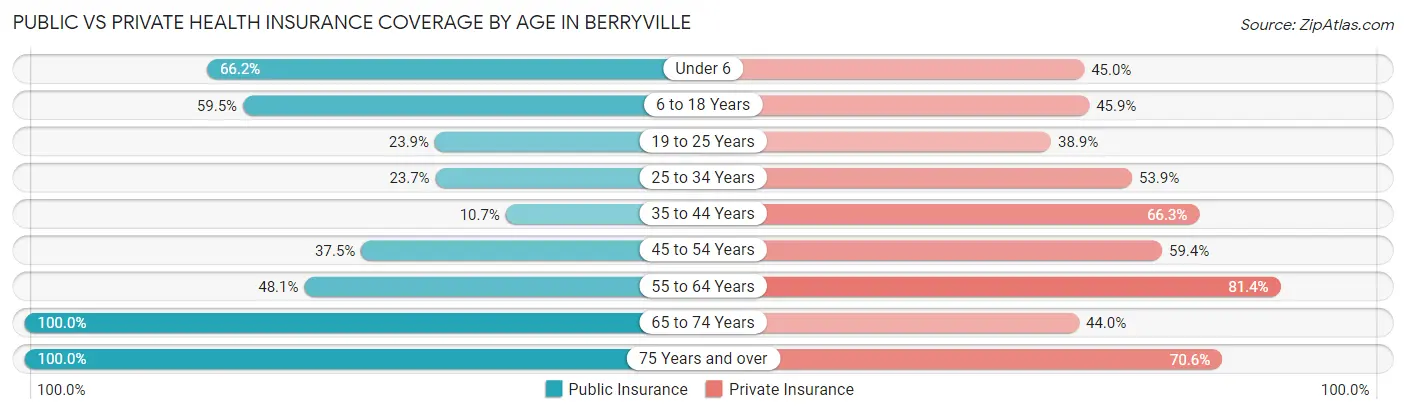
| Age Bracket | Public Insurance | Private Insurance |
| Under 6 | 297 (66.1%) | 202 (45.0%) |
| 6 to 18 Years | 728 (59.5%) | 562 (45.9%) |
| 19 to 25 Years | 62 (23.8%) | 101 (38.9%) |
| 25 to 34 Years | 156 (23.7%) | 354 (53.9%) |
| 35 to 44 Years | 75 (10.7%) | 465 (66.3%) |
| 45 to 54 Years | 161 (37.5%) | 255 (59.4%) |
| 55 to 64 Years | 300 (48.1%) | 508 (81.4%) |
| 65 to 74 Years | 536 (100.0%) | 236 (44.0%) |
| 75 Years and over | 581 (100.0%) | 410 (70.6%) |
| Total | 2,896 (53.0%) | 3,093 (56.6%) |
Disability Status by Sex by Age in Berryville
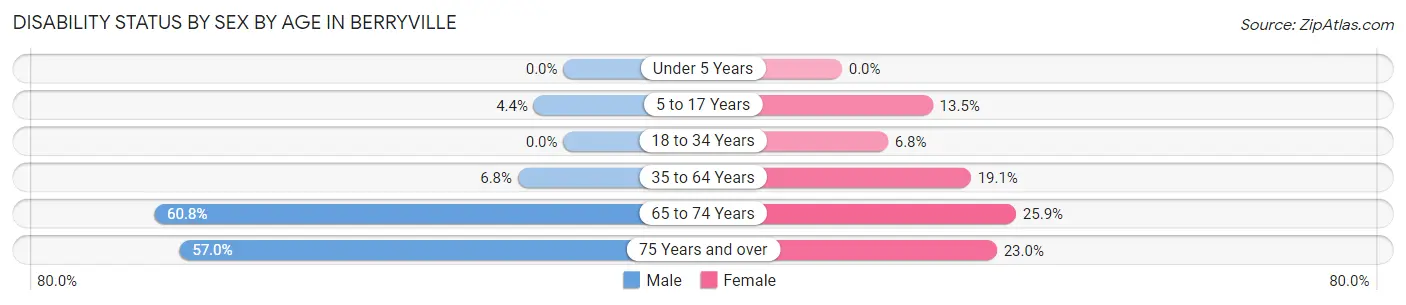
| Age Bracket | Male | Female |
| Under 5 Years | 0 (0.0%) | 0 (0.0%) |
| 5 to 17 Years | 33 (4.4%) | 80 (13.5%) |
| 18 to 34 Years | 0 (0.0%) | 31 (6.8%) |
| 35 to 64 Years | 57 (6.8%) | 174 (19.1%) |
| 65 to 74 Years | 93 (60.8%) | 99 (25.9%) |
| 75 Years and over | 138 (57.0%) | 78 (23.0%) |
Disability Class by Sex by Age in Berryville
Disability Class: Hearing Difficulty
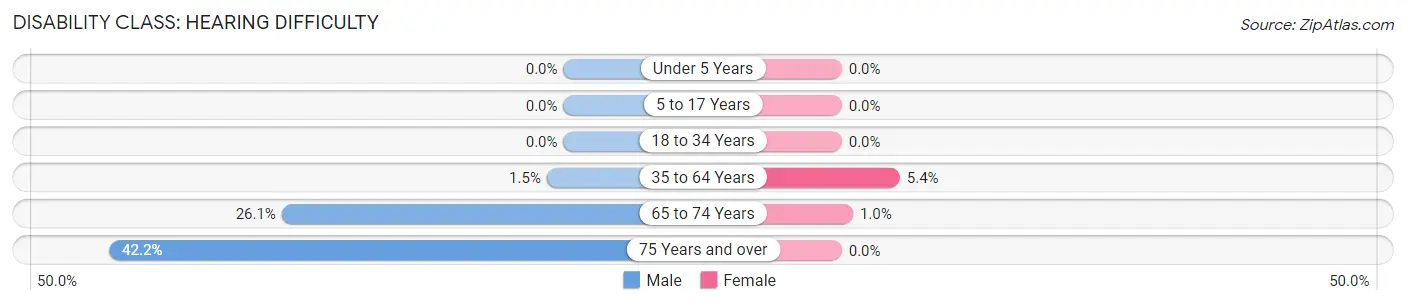
| Age Bracket | Male | Female |
| Under 5 Years | 0 (0.0%) | 0 (0.0%) |
| 5 to 17 Years | 0 (0.0%) | 0 (0.0%) |
| 18 to 34 Years | 0 (0.0%) | 0 (0.0%) |
| 35 to 64 Years | 13 (1.5%) | 49 (5.4%) |
| 65 to 74 Years | 40 (26.1%) | 4 (1.0%) |
| 75 Years and over | 102 (42.1%) | 0 (0.0%) |
Disability Class: Vision Difficulty
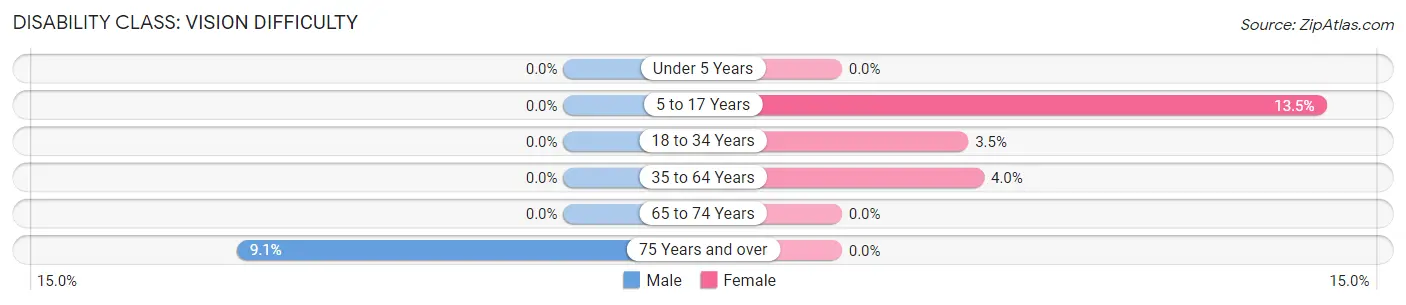
| Age Bracket | Male | Female |
| Under 5 Years | 0 (0.0%) | 0 (0.0%) |
| 5 to 17 Years | 0 (0.0%) | 80 (13.5%) |
| 18 to 34 Years | 0 (0.0%) | 16 (3.5%) |
| 35 to 64 Years | 0 (0.0%) | 36 (4.0%) |
| 65 to 74 Years | 0 (0.0%) | 0 (0.0%) |
| 75 Years and over | 22 (9.1%) | 0 (0.0%) |
Disability Class: Cognitive Difficulty
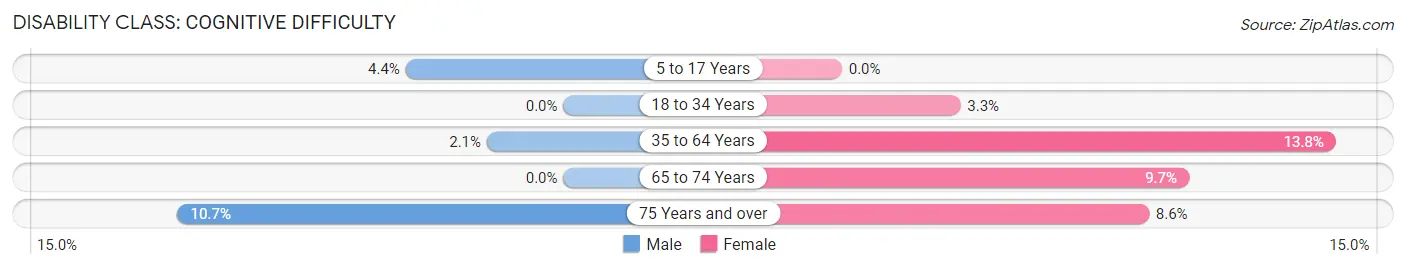
| Age Bracket | Male | Female |
| 5 to 17 Years | 33 (4.4%) | 0 (0.0%) |
| 18 to 34 Years | 0 (0.0%) | 15 (3.3%) |
| 35 to 64 Years | 18 (2.1%) | 125 (13.8%) |
| 65 to 74 Years | 0 (0.0%) | 37 (9.7%) |
| 75 Years and over | 26 (10.7%) | 29 (8.6%) |
Disability Class: Ambulatory Difficulty
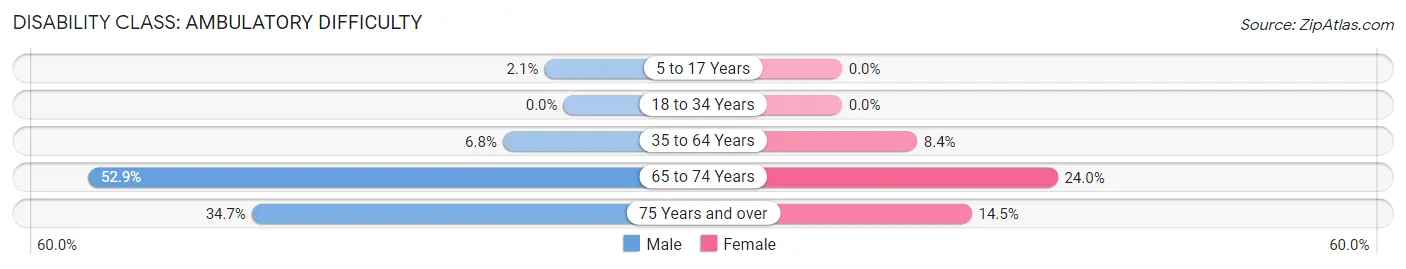
| Age Bracket | Male | Female |
| 5 to 17 Years | 16 (2.1%) | 0 (0.0%) |
| 18 to 34 Years | 0 (0.0%) | 0 (0.0%) |
| 35 to 64 Years | 57 (6.8%) | 76 (8.4%) |
| 65 to 74 Years | 81 (52.9%) | 92 (24.0%) |
| 75 Years and over | 84 (34.7%) | 49 (14.4%) |
Disability Class: Self-Care Difficulty
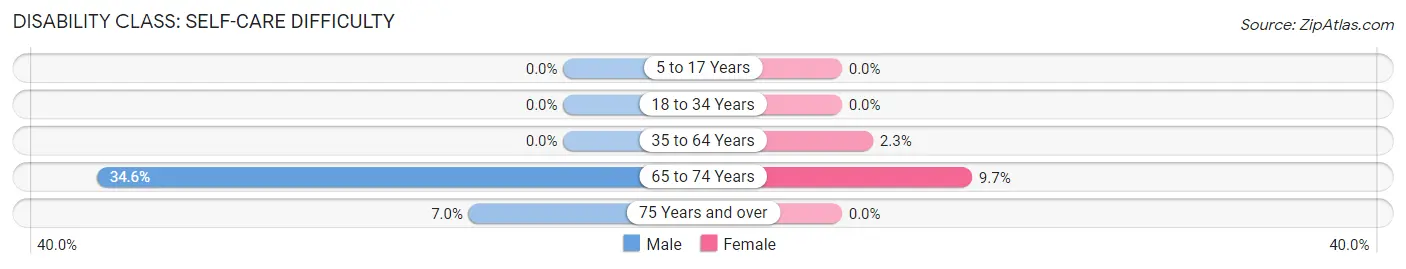
| Age Bracket | Male | Female |
| 5 to 17 Years | 0 (0.0%) | 0 (0.0%) |
| 18 to 34 Years | 0 (0.0%) | 0 (0.0%) |
| 35 to 64 Years | 0 (0.0%) | 21 (2.3%) |
| 65 to 74 Years | 53 (34.6%) | 37 (9.7%) |
| 75 Years and over | 17 (7.0%) | 0 (0.0%) |
Technology Access in Berryville
Computing Device Access in Berryville
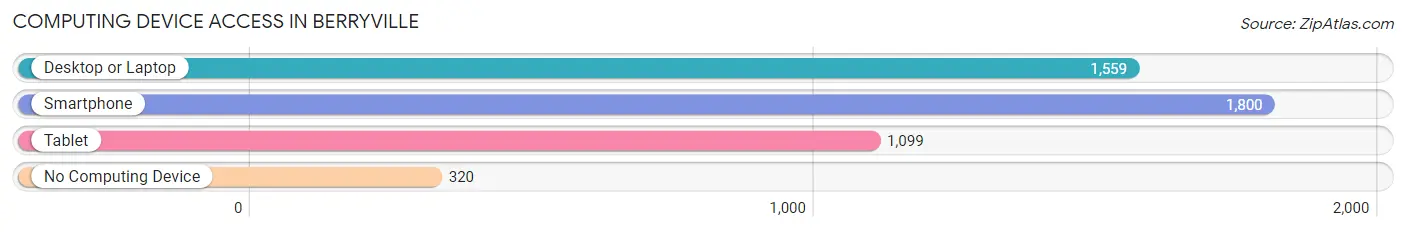
| Device Type | # Households | % Households |
| Desktop or Laptop | 1,559 | 67.3% |
| Smartphone | 1,800 | 77.7% |
| Tablet | 1,099 | 47.5% |
| No Computing Device | 320 | 13.8% |
| Total | 2,315 | 100.0% |
Internet Access in Berryville
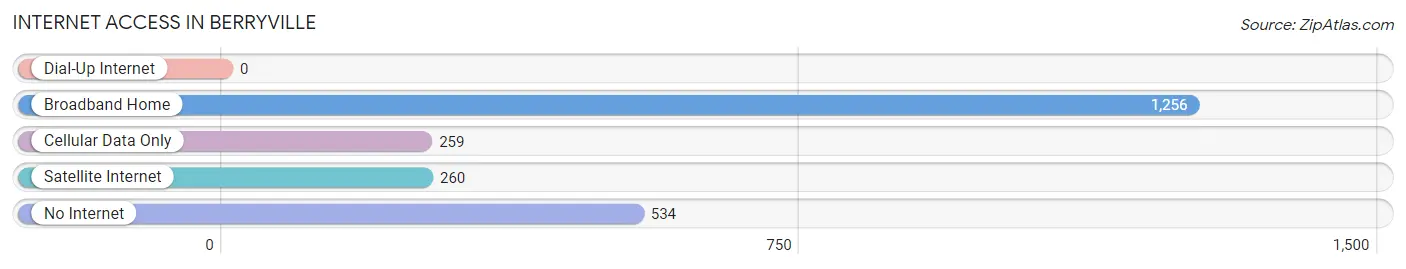
| Internet Type | # Households | % Households |
| Dial-Up Internet | 0 | 0.0% |
| Broadband Home | 1,256 | 54.2% |
| Cellular Data Only | 259 | 11.2% |
| Satellite Internet | 260 | 11.2% |
| No Internet | 534 | 23.1% |
| Total | 2,315 | 100.0% |
Berryville Summary
History
The city of Berryville, Arkansas is located in the northwest corner of the state in Carroll County. It is the county seat and the largest city in the county. The city was founded in 1842 and was named after the Berry family, who were early settlers in the area. The city was incorporated in 1883 and has a population of 5,356 as of the 2010 census.
The city of Berryville has a rich history that dates back to the early 1800s. The first settlers in the area were the Osage Indians, who were driven out by the Cherokee in the early 1800s. The first white settlers in the area were the Berry family, who arrived in 1820. The Berry family established a trading post and a ferry across the White River. The city was officially founded in 1842 and was named after the Berry family.
The city of Berryville grew rapidly in the late 1800s and early 1900s. The city was a major stop on the St. Louis-San Francisco Railway, which brought many new settlers to the area. The city also became a major agricultural center, with cotton, corn, and wheat being the main crops. The city also became a major timber producer, with the White River providing an abundance of timber.
The city of Berryville experienced a period of growth and prosperity in the early 1900s. The city was home to several businesses, including a cotton gin, a sawmill, a grist mill, and a brick factory. The city also had several churches, schools, and a hospital.
The city of Berryville experienced a period of decline in the mid-1900s. The Great Depression and the Dust Bowl caused many people to leave the area in search of work. The city also experienced a decline in the timber industry, as the White River was no longer a major source of timber.
Geography
Berryville is located in the northwest corner of Arkansas in Carroll County. The city is situated in the Ozark Mountains and is surrounded by rolling hills and forests. The White River runs through the city and provides a source of recreation for the residents. The city is located about 40 miles east of Fayetteville and about 60 miles west of Little Rock.
The city of Berryville has a total area of 4.2 square miles, all of which is land. The city has a humid subtropical climate, with hot, humid summers and mild winters. The average temperature in the summer is around 80 degrees Fahrenheit and the average temperature in the winter is around 40 degrees Fahrenheit.
Economy
The economy of Berryville is largely based on agriculture and tourism. The city is home to several farms that produce cotton, corn, and wheat. The city is also home to several timber companies that harvest timber from the White River.
The city is also home to several manufacturing companies, including a furniture factory, a plastics factory, and a metal fabrication plant. The city is also home to several retail stores, restaurants, and hotels.
The city of Berryville is also home to several educational institutions, including a community college and a technical school. The city is also home to several medical facilities, including a hospital and several clinics.
Demographics
As of the 2010 census, the city of Berryville had a population of 5,356. The racial makeup of the city was 95.3% White, 0.7% African American, 0.3% Native American, 0.5% Asian, 0.1% Pacific Islander, 1.2% from other races, and 2.0% from two or more races. Hispanic or Latino of any race were 3.2% of the population.
The median income for a household in the city was $32,917 and the median income for a family was $41,917. The per capita income for the city was $17,845. About 15.2% of the population was below the poverty line.
Common Questions
What is Per Capita Income in Berryville?
Per Capita income in Berryville is $21,656.
What is the Median Family Income in Berryville?
Median Family Income in Berryville is $46,750.
What is the Median Household income in Berryville?
Median Household Income in Berryville is $43,388.
What is Income or Wage Gap in Berryville?
Income or Wage Gap in Berryville is 13.6%.
Women in Berryville earn 86.4 cents for every dollar earned by a man.
What is Family Income Deficit in Berryville?
Family Income Deficit in Berryville is $10,131.
Families that are below poverty line in Berryville earn $10,131 less on average than the poverty threshold level.
What is Inequality or Gini Index in Berryville?
Inequality or Gini Index in Berryville is 0.43.
What is the Total Population of Berryville?
Total Population of Berryville is 5,667.
What is the Total Male Population of Berryville?
Total Male Population of Berryville is 2,762.
What is the Total Female Population of Berryville?
Total Female Population of Berryville is 2,905.
What is the Ratio of Males per 100 Females in Berryville?
There are 95.08 Males per 100 Females in Berryville.
What is the Ratio of Females per 100 Males in Berryville?
There are 105.18 Females per 100 Males in Berryville.
What is the Median Population Age in Berryville?
Median Population Age in Berryville is 37.4 Years.
What is the Average Family Size in Berryville
Average Family Size in Berryville is 2.8 People.
What is the Average Household Size in Berryville
Average Household Size in Berryville is 2.4 People.
How Large is the Labor Force in Berryville?
There are 2,210 People in the Labor Forcein in Berryville.
What is the Percentage of People in the Labor Force in Berryville?
49.6% of People are in the Labor Force in Berryville.
What is the Unemployment Rate in Berryville?
Unemployment Rate in Berryville is 5.9%.