Lowell, AR Map & Demographics
Lowell Map
Lowell Overview
$33,829
PER CAPITA INCOME
$91,524
AVG FAMILY INCOME
$83,827
AVG HOUSEHOLD INCOME
23.4%
WAGE / INCOME GAP [ % ]
76.6¢/ $1
WAGE / INCOME GAP [ $ ]
0.39
INEQUALITY / GINI INDEX
10,005
TOTAL POPULATION
4,887
MALE POPULATION
5,118
FEMALE POPULATION
95.49
MALES / 100 FEMALES
104.73
FEMALES / 100 MALES
34.2
MEDIAN AGE
3.3
AVG FAMILY SIZE
2.9
AVG HOUSEHOLD SIZE
4,945
LABOR FORCE [ PEOPLE ]
65.8%
PERCENT IN LABOR FORCE
0.9%
UNEMPLOYMENT RATE
Lowell Zip Codes
Lowell Area Codes
Income in Lowell
Income Overview in Lowell
Per Capita Income in Lowell is $33,829, while median incomes of families and households are $91,524 and $83,827 respectively.
| Characteristic | Number | Measure |
| Per Capita Income | 10,005 | $33,829 |
| Median Family Income | 2,612 | $91,524 |
| Mean Family Income | 2,612 | $107,922 |
| Median Household Income | 3,465 | $83,827 |
| Mean Household Income | 3,465 | $96,879 |
| Income Deficit | 2,612 | $0 |
| Wage / Income Gap (%) | 10,005 | 23.39% |
| Wage / Income Gap ($) | 10,005 | 76.61¢ per $1 |
| Gini / Inequality Index | 10,005 | 0.39 |
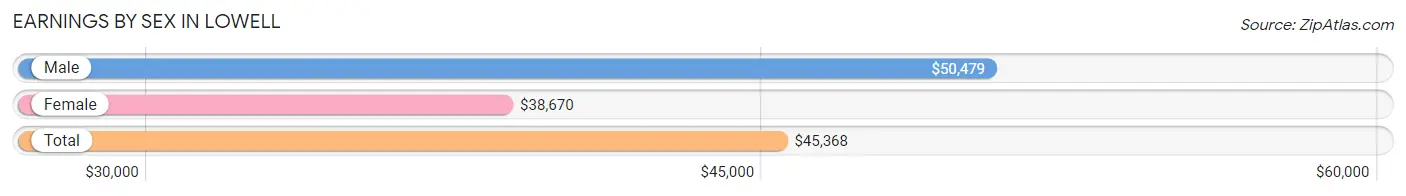
Earnings by Sex in Lowell
Average Earnings in Lowell are $45,368, $50,479 for men and $38,670 for women, a difference of 23.4%.
| Sex | Number | Average Earnings |
| Male | 2,844 (56.1%) | $50,479 |
| Female | 2,222 (43.9%) | $38,670 |
| Total | 5,066 (100.0%) | $45,368 |
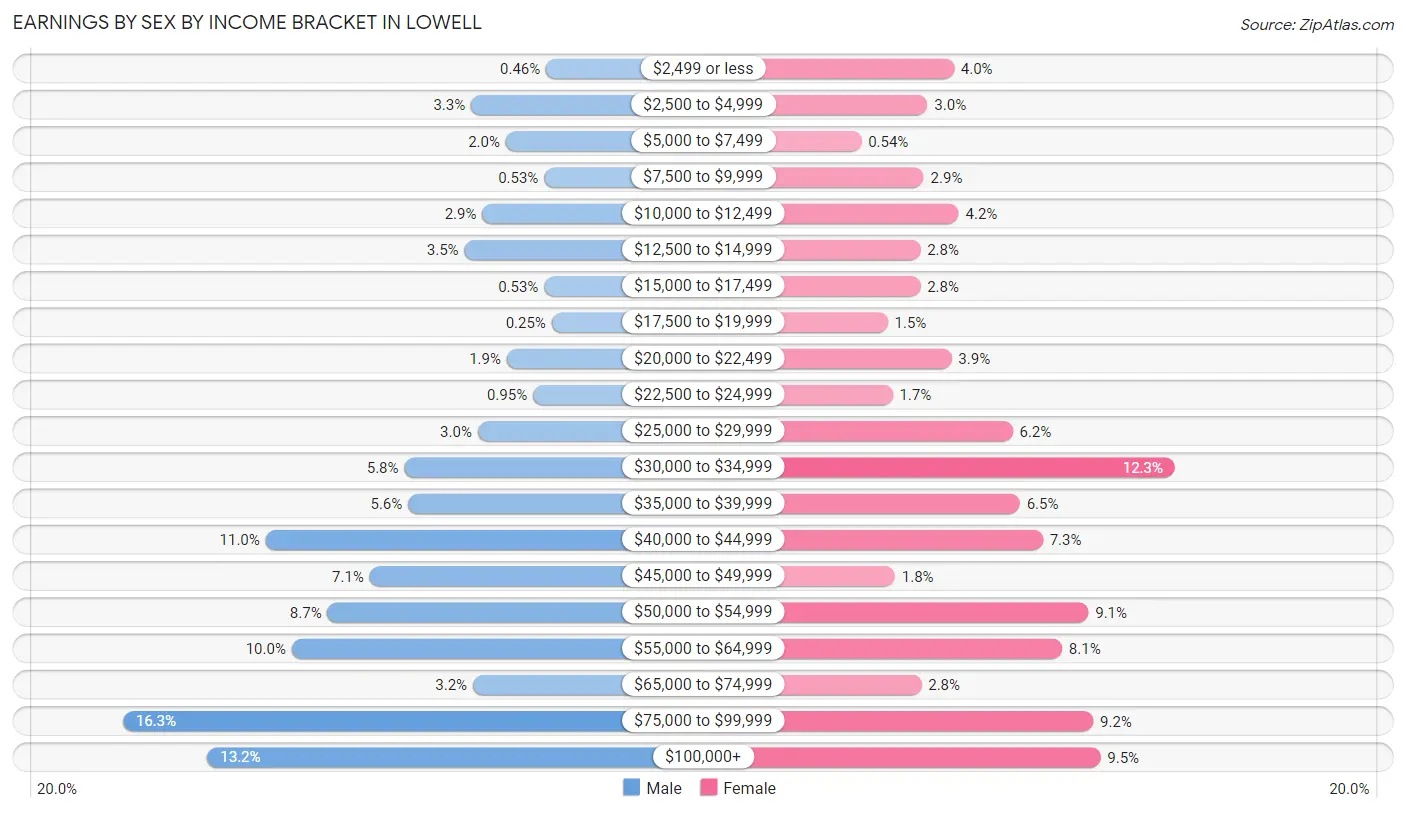
Earnings by Sex by Income Bracket in Lowell
The most common earnings brackets in Lowell are $75,000 to $99,999 for men (464 | 16.3%) and $30,000 to $34,999 for women (273 | 12.3%).
| Income | Male | Female |
| $2,499 or less | 13 (0.5%) | 89 (4.0%) |
| $2,500 to $4,999 | 93 (3.3%) | 67 (3.0%) |
| $5,000 to $7,499 | 56 (2.0%) | 12 (0.5%) |
| $7,500 to $9,999 | 15 (0.5%) | 64 (2.9%) |
| $10,000 to $12,499 | 81 (2.9%) | 93 (4.2%) |
| $12,500 to $14,999 | 100 (3.5%) | 61 (2.8%) |
| $15,000 to $17,499 | 15 (0.5%) | 61 (2.8%) |
| $17,500 to $19,999 | 7 (0.3%) | 34 (1.5%) |
| $20,000 to $22,499 | 55 (1.9%) | 87 (3.9%) |
| $22,500 to $24,999 | 27 (0.9%) | 38 (1.7%) |
| $25,000 to $29,999 | 86 (3.0%) | 138 (6.2%) |
| $30,000 to $34,999 | 164 (5.8%) | 273 (12.3%) |
| $35,000 to $39,999 | 160 (5.6%) | 144 (6.5%) |
| $40,000 to $44,999 | 312 (11.0%) | 163 (7.3%) |
| $45,000 to $49,999 | 201 (7.1%) | 40 (1.8%) |
| $50,000 to $54,999 | 246 (8.6%) | 201 (9.0%) |
| $55,000 to $64,999 | 284 (10.0%) | 179 (8.1%) |
| $65,000 to $74,999 | 91 (3.2%) | 62 (2.8%) |
| $75,000 to $99,999 | 464 (16.3%) | 205 (9.2%) |
| $100,000+ | 374 (13.2%) | 211 (9.5%) |
| Total | 2,844 (100.0%) | 2,222 (100.0%) |
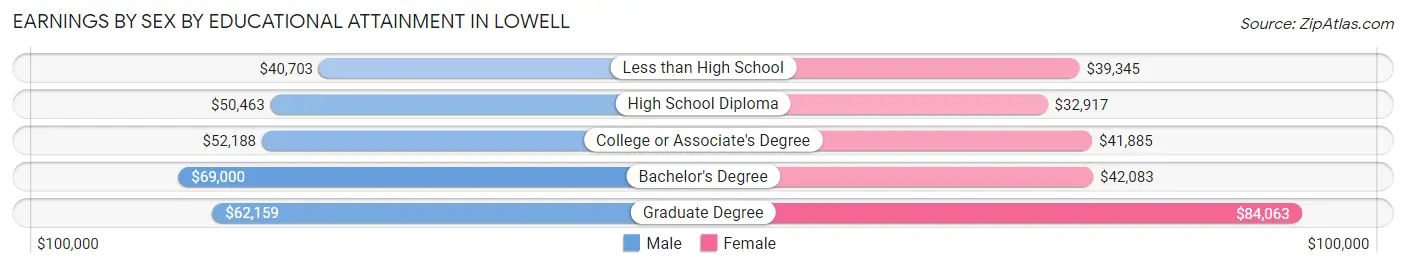
Earnings by Sex by Educational Attainment in Lowell
Average earnings in Lowell are $51,762 for men and $40,665 for women, a difference of 21.4%. Men with an educational attainment of bachelor's degree enjoy the highest average annual earnings of $69,000, while those with less than high school education earn the least with $40,703. Women with an educational attainment of graduate degree earn the most with the average annual earnings of $84,063, while those with high school diploma education have the smallest earnings of $32,917.
| Educational Attainment | Male Income | Female Income |
| Less than High School | $40,703 | $39,345 |
| High School Diploma | $50,463 | $32,917 |
| College or Associate's Degree | $52,188 | $41,885 |
| Bachelor's Degree | $69,000 | $42,083 |
| Graduate Degree | $62,159 | $84,063 |
| Total | $51,762 | $40,665 |
Family Income in Lowell
Family Income Brackets in Lowell
According to the Lowell family income data, there are 721 families falling into the $100,000 to $149,999 income range, which is the most common income bracket and makes up 27.6% of all families. Conversely, the $15,000 to $24,999 income bracket is the least frequent group with only 8 families (0.3%) belonging to this category.
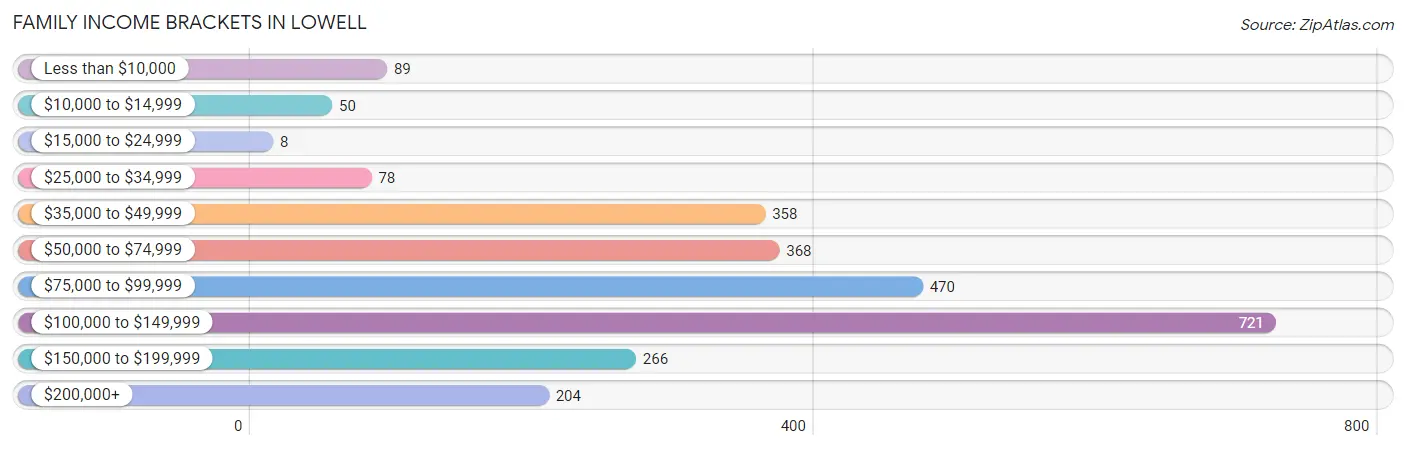
| Income Bracket | # Families | % Families |
| Less than $10,000 | 89 | 3.4% |
| $10,000 to $14,999 | 50 | 1.9% |
| $15,000 to $24,999 | 8 | 0.3% |
| $25,000 to $34,999 | 78 | 3.0% |
| $35,000 to $49,999 | 358 | 13.7% |
| $50,000 to $74,999 | 368 | 14.1% |
| $75,000 to $99,999 | 470 | 18.0% |
| $100,000 to $149,999 | 721 | 27.6% |
| $150,000 to $199,999 | 266 | 10.2% |
| $200,000+ | 204 | 7.8% |
Family Income by Famaliy Size in Lowell
6-person families (154 | 5.9%) account for the highest median family income in Lowell with $126,010 per family, while 2-person families (1,098 | 42.0%) have the highest median income of $39,340 per family member.
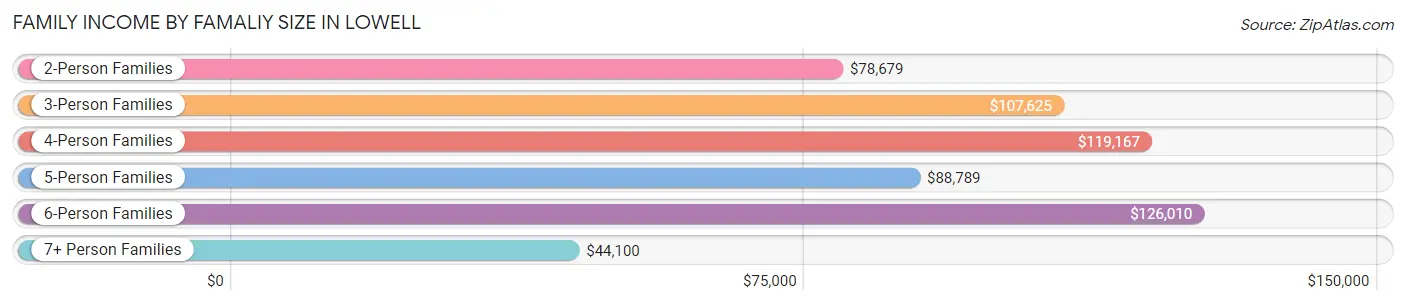
| Income Bracket | # Families | Median Income |
| 2-Person Families | 1,098 (42.0%) | $78,679 |
| 3-Person Families | 647 (24.8%) | $107,625 |
| 4-Person Families | 402 (15.4%) | $119,167 |
| 5-Person Families | 247 (9.5%) | $88,789 |
| 6-Person Families | 154 (5.9%) | $126,010 |
| 7+ Person Families | 64 (2.5%) | $44,100 |
| Total | 2,612 (100.0%) | $91,524 |
Family Income by Number of Earners in Lowell
The median family income in Lowell is $91,524, with families comprising 3+ earners (267) having the highest median family income of $121,125, while families with no earners (289) have the lowest median family income of $26,650, accounting for 10.2% and 11.1% of families, respectively.
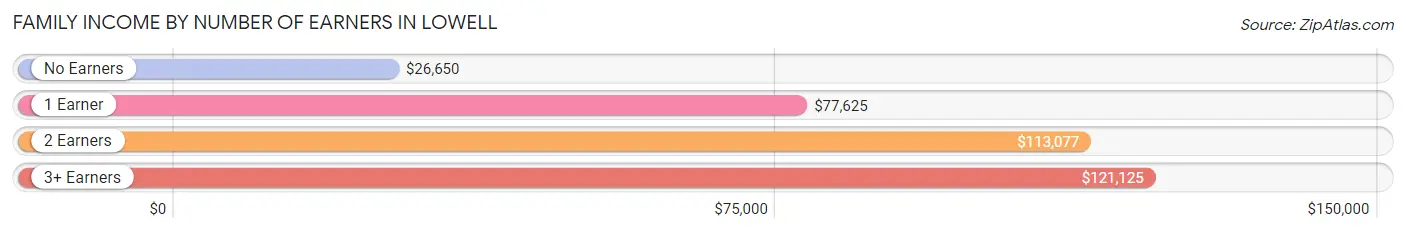
| Number of Earners | # Families | Median Income |
| No Earners | 289 (11.1%) | $26,650 |
| 1 Earner | 834 (31.9%) | $77,625 |
| 2 Earners | 1,222 (46.8%) | $113,077 |
| 3+ Earners | 267 (10.2%) | $121,125 |
| Total | 2,612 (100.0%) | $91,524 |
Household Income in Lowell
Household Income Brackets in Lowell
With 818 households falling in the category, the $100,000 to $149,999 income range is the most frequent in Lowell, accounting for 23.6% of all households. In contrast, only 52 households (1.5%) fall into the less than $10,000 income bracket, making it the least populous group.
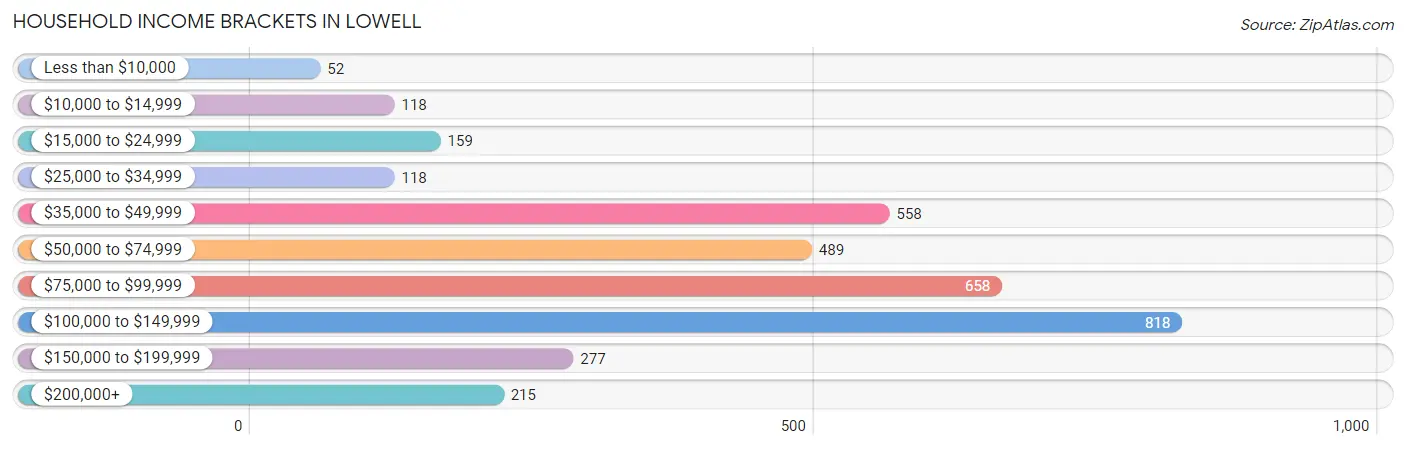
| Income Bracket | # Households | % Households |
| Less than $10,000 | 52 | 1.5% |
| $10,000 to $14,999 | 118 | 3.4% |
| $15,000 to $24,999 | 159 | 4.6% |
| $25,000 to $34,999 | 118 | 3.4% |
| $35,000 to $49,999 | 558 | 16.1% |
| $50,000 to $74,999 | 489 | 14.1% |
| $75,000 to $99,999 | 658 | 19.0% |
| $100,000 to $149,999 | 818 | 23.6% |
| $150,000 to $199,999 | 277 | 8.0% |
| $200,000+ | 215 | 6.2% |
Household Income by Householder Age in Lowell
The median household income in Lowell is $83,827, with the highest median household income of $95,709 found in the 25 to 44 years age bracket for the primary householder. A total of 1,532 households (44.2%) fall into this category. Meanwhile, the 15 to 24 years age bracket for the primary householder has the lowest median household income of $0, with 223 households (6.4%) in this group.
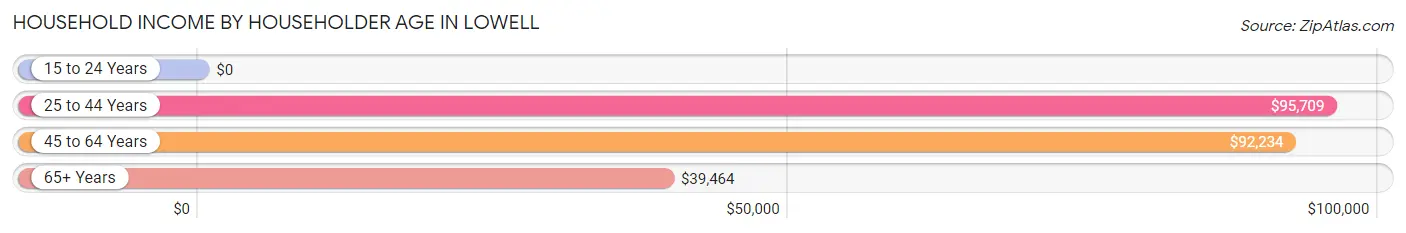
| Income Bracket | # Households | Median Income |
| 15 to 24 Years | 223 (6.4%) | $0 |
| 25 to 44 Years | 1,532 (44.2%) | $95,709 |
| 45 to 64 Years | 1,015 (29.3%) | $92,234 |
| 65+ Years | 695 (20.1%) | $39,464 |
| Total | 3,465 (100.0%) | $83,827 |
Poverty in Lowell
Income Below Poverty by Sex and Age in Lowell
With 8.7% poverty level for males and 9.2% for females among the residents of Lowell, 75 year old and over males and 18 to 24 year old females are the most vulnerable to poverty, with 28 males (43.8%) and 180 females (32.4%) in their respective age groups living below the poverty level.
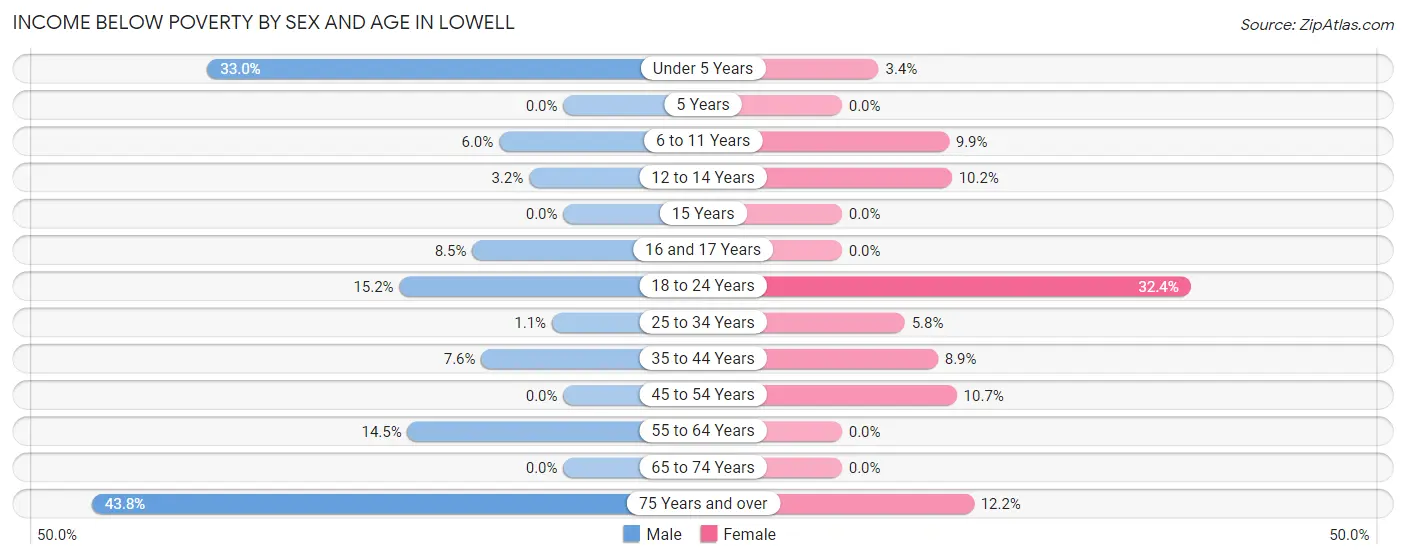
| Age Bracket | Male | Female |
| Under 5 Years | 143 (33.0%) | 13 (3.4%) |
| 5 Years | 0 (0.0%) | 0 (0.0%) |
| 6 to 11 Years | 22 (6.0%) | 41 (9.9%) |
| 12 to 14 Years | 7 (3.2%) | 35 (10.2%) |
| 15 Years | 0 (0.0%) | 0 (0.0%) |
| 16 and 17 Years | 6 (8.5%) | 0 (0.0%) |
| 18 to 24 Years | 59 (15.2%) | 180 (32.4%) |
| 25 to 34 Years | 7 (1.1%) | 42 (5.8%) |
| 35 to 44 Years | 65 (7.6%) | 57 (8.9%) |
| 45 to 54 Years | 0 (0.0%) | 61 (10.7%) |
| 55 to 64 Years | 81 (14.5%) | 0 (0.0%) |
| 65 to 74 Years | 0 (0.0%) | 0 (0.0%) |
| 75 Years and over | 28 (43.8%) | 42 (12.2%) |
| Total | 418 (8.7%) | 471 (9.2%) |
Income Above Poverty by Sex and Age in Lowell
According to the poverty statistics in Lowell, males aged 5 years and females aged 5 years are the age groups that are most secure financially, with 100.0% of males and 100.0% of females in these age groups living above the poverty line.
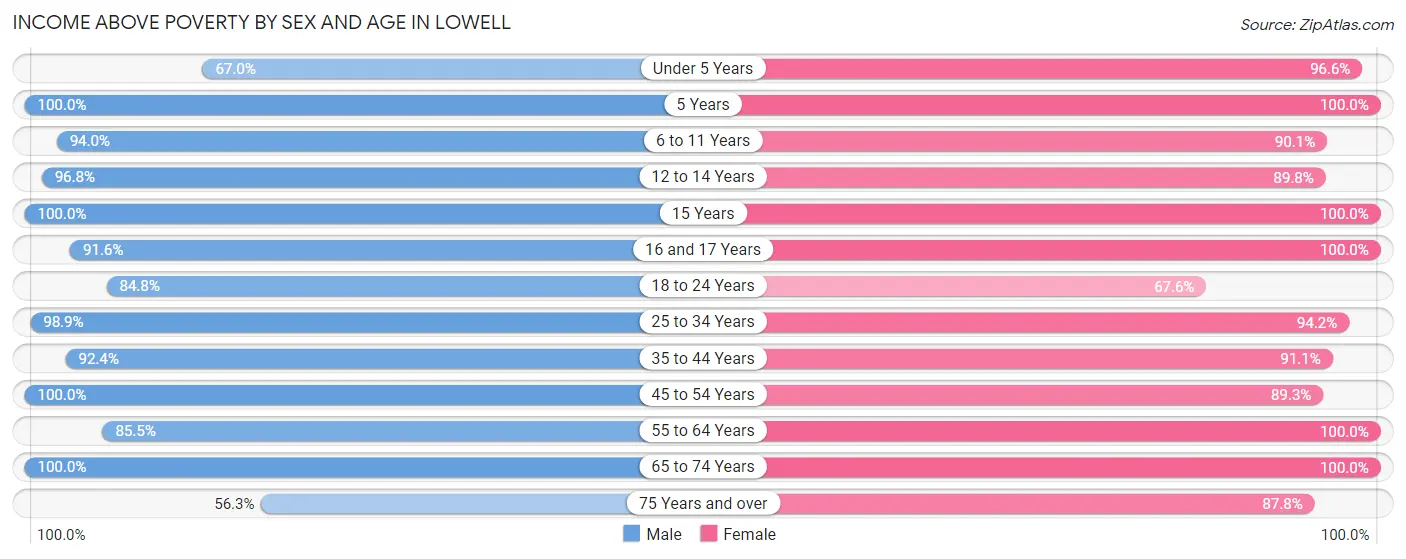
| Age Bracket | Male | Female |
| Under 5 Years | 290 (67.0%) | 368 (96.6%) |
| 5 Years | 75 (100.0%) | 77 (100.0%) |
| 6 to 11 Years | 347 (94.0%) | 372 (90.1%) |
| 12 to 14 Years | 213 (96.8%) | 308 (89.8%) |
| 15 Years | 57 (100.0%) | 43 (100.0%) |
| 16 and 17 Years | 65 (91.5%) | 231 (100.0%) |
| 18 to 24 Years | 329 (84.8%) | 376 (67.6%) |
| 25 to 34 Years | 653 (98.9%) | 677 (94.2%) |
| 35 to 44 Years | 789 (92.4%) | 583 (91.1%) |
| 45 to 54 Years | 564 (100.0%) | 511 (89.3%) |
| 55 to 64 Years | 479 (85.5%) | 416 (100.0%) |
| 65 to 74 Years | 509 (100.0%) | 368 (100.0%) |
| 75 Years and over | 36 (56.2%) | 301 (87.8%) |
| Total | 4,406 (91.3%) | 4,631 (90.8%) |
Income Below Poverty Among Married-Couple Families in Lowell
The poverty statistics for married-couple families in Lowell show that 4.1% or 86 of the total 2,088 families live below the poverty line. Families with 3 or 4 children have the highest poverty rate of 17.0%, comprising of 57 families. On the other hand, families with 1 or 2 children have the lowest poverty rate of 0.0%, which includes 0 families.
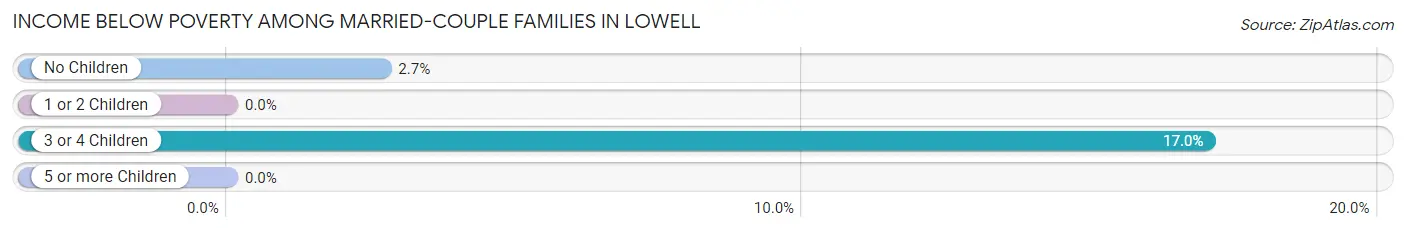
| Children | Above Poverty | Below Poverty |
| No Children | 1,057 (97.3%) | 29 (2.7%) |
| 1 or 2 Children | 667 (100.0%) | 0 (0.0%) |
| 3 or 4 Children | 278 (83.0%) | 57 (17.0%) |
| 5 or more Children | 0 (0.0%) | 0 (0.0%) |
| Total | 2,002 (95.9%) | 86 (4.1%) |
Income Below Poverty Among Single-Parent Households in Lowell
According to the poverty data in Lowell, 25.7% or 49 single-father households and 18.6% or 62 single-mother households are living below the poverty line. Among single-father households, those with no children have the highest poverty rate, with 49 households (44.1%) experiencing poverty. Likewise, among single-mother households, those with 3 or 4 children have the highest poverty rate, with 12 households (30.0%) falling below the poverty line.
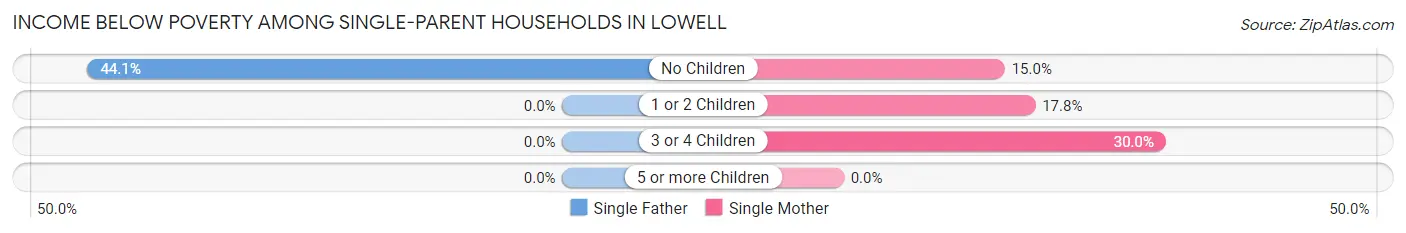
| Children | Single Father | Single Mother |
| No Children | 49 (44.1%) | 12 (15.0%) |
| 1 or 2 Children | 0 (0.0%) | 38 (17.8%) |
| 3 or 4 Children | 0 (0.0%) | 12 (30.0%) |
| 5 or more Children | 0 (0.0%) | 0 (0.0%) |
| Total | 49 (25.7%) | 62 (18.6%) |
Income Below Poverty Among Married-Couple vs Single-Parent Households in Lowell
The poverty data for Lowell shows that 86 of the married-couple family households (4.1%) and 111 of the single-parent households (21.2%) are living below the poverty level. Within the married-couple family households, those with 3 or 4 children have the highest poverty rate, with 57 households (17.0%) falling below the poverty line. Among the single-parent households, those with no children have the highest poverty rate, with 61 household (31.9%) living below poverty.
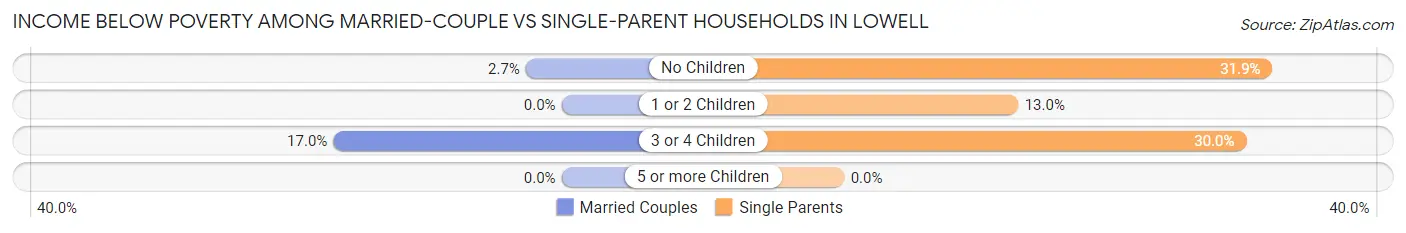
| Children | Married-Couple Families | Single-Parent Households |
| No Children | 29 (2.7%) | 61 (31.9%) |
| 1 or 2 Children | 0 (0.0%) | 38 (13.0%) |
| 3 or 4 Children | 57 (17.0%) | 12 (30.0%) |
| 5 or more Children | 0 (0.0%) | 0 (0.0%) |
| Total | 86 (4.1%) | 111 (21.2%) |
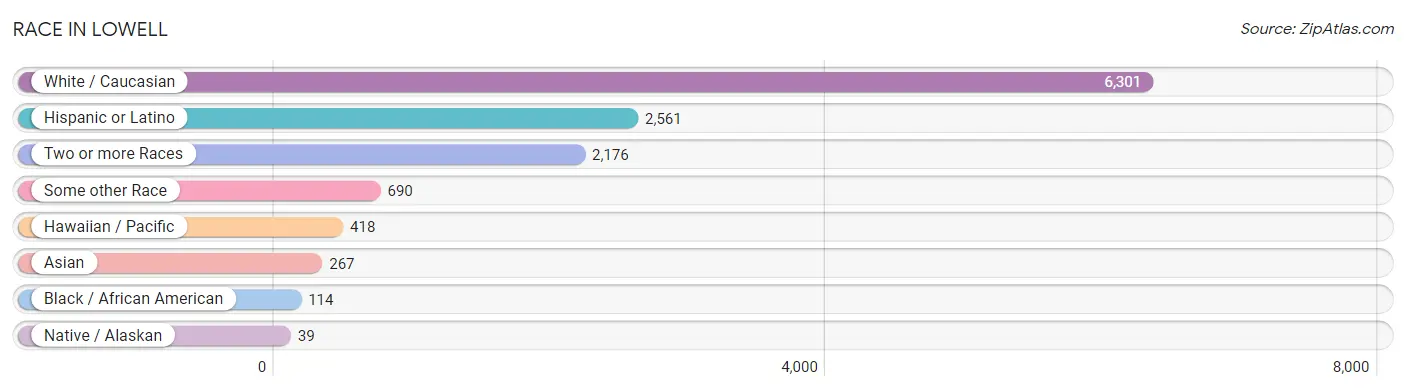
Race in Lowell
The most populous races in Lowell are White / Caucasian (6,301 | 63.0%), Hispanic or Latino (2,561 | 25.6%), and Two or more Races (2,176 | 21.7%).
| Race | # Population | % Population |
| Asian | 267 | 2.7% |
| Black / African American | 114 | 1.1% |
| Hawaiian / Pacific | 418 | 4.2% |
| Hispanic or Latino | 2,561 | 25.6% |
| Native / Alaskan | 39 | 0.4% |
| White / Caucasian | 6,301 | 63.0% |
| Two or more Races | 2,176 | 21.7% |
| Some other Race | 690 | 6.9% |
| Total | 10,005 | 100.0% |
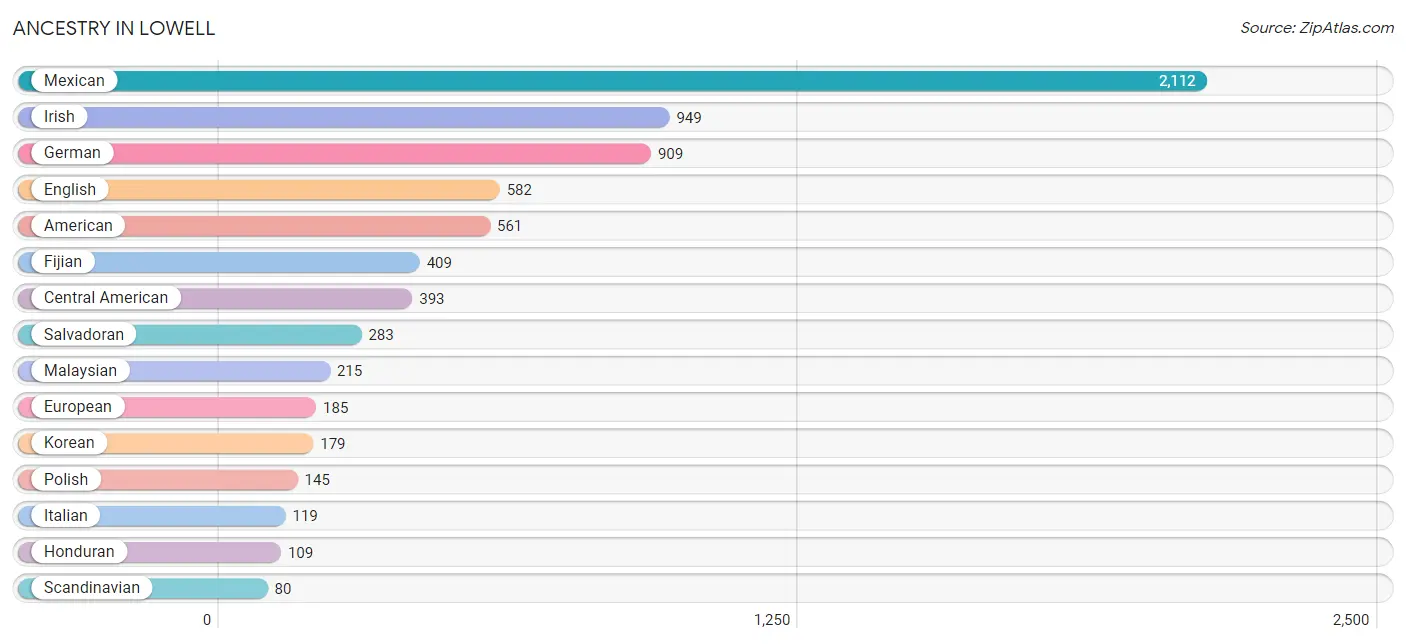
Ancestry in Lowell
The most populous ancestries reported in Lowell are Mexican (2,112 | 21.1%), Irish (949 | 9.5%), German (909 | 9.1%), English (582 | 5.8%), and American (561 | 5.6%), together accounting for 51.1% of all Lowell residents.
| Ancestry | # Population | % Population |
| African | 29 | 0.3% |
| American | 561 | 5.6% |
| Austrian | 13 | 0.1% |
| British | 60 | 0.6% |
| Central American | 393 | 3.9% |
| Central American Indian | 9 | 0.1% |
| Cherokee | 77 | 0.8% |
| Chinese | 50 | 0.5% |
| Czech | 5 | 0.1% |
| Dominican | 14 | 0.1% |
| Dutch | 69 | 0.7% |
| Ecuadorian | 17 | 0.2% |
| English | 582 | 5.8% |
| European | 185 | 1.8% |
| Fijian | 409 | 4.1% |
| French | 78 | 0.8% |
| French Canadian | 31 | 0.3% |
| German | 909 | 9.1% |
| Greek | 25 | 0.3% |
| Guatemalan | 1 | 0.0% |
| Honduran | 109 | 1.1% |
| Indian (Asian) | 19 | 0.2% |
| Irish | 949 | 9.5% |
| Italian | 119 | 1.2% |
| Korean | 179 | 1.8% |
| Malaysian | 215 | 2.1% |
| Mexican | 2,112 | 21.1% |
| Mexican American Indian | 9 | 0.1% |
| Native Hawaiian | 9 | 0.1% |
| Norwegian | 43 | 0.4% |
| Osage | 15 | 0.2% |
| Polish | 145 | 1.5% |
| Puerto Rican | 25 | 0.3% |
| Romanian | 12 | 0.1% |
| Russian | 13 | 0.1% |
| Salvadoran | 283 | 2.8% |
| Scandinavian | 80 | 0.8% |
| Scotch-Irish | 32 | 0.3% |
| Scottish | 55 | 0.5% |
| South American | 17 | 0.2% |
| Sri Lankan | 42 | 0.4% |
| Subsaharan African | 29 | 0.3% |
| Swedish | 23 | 0.2% |
| Welsh | 35 | 0.4% | View All 44 Rows |
Immigrants in Lowell
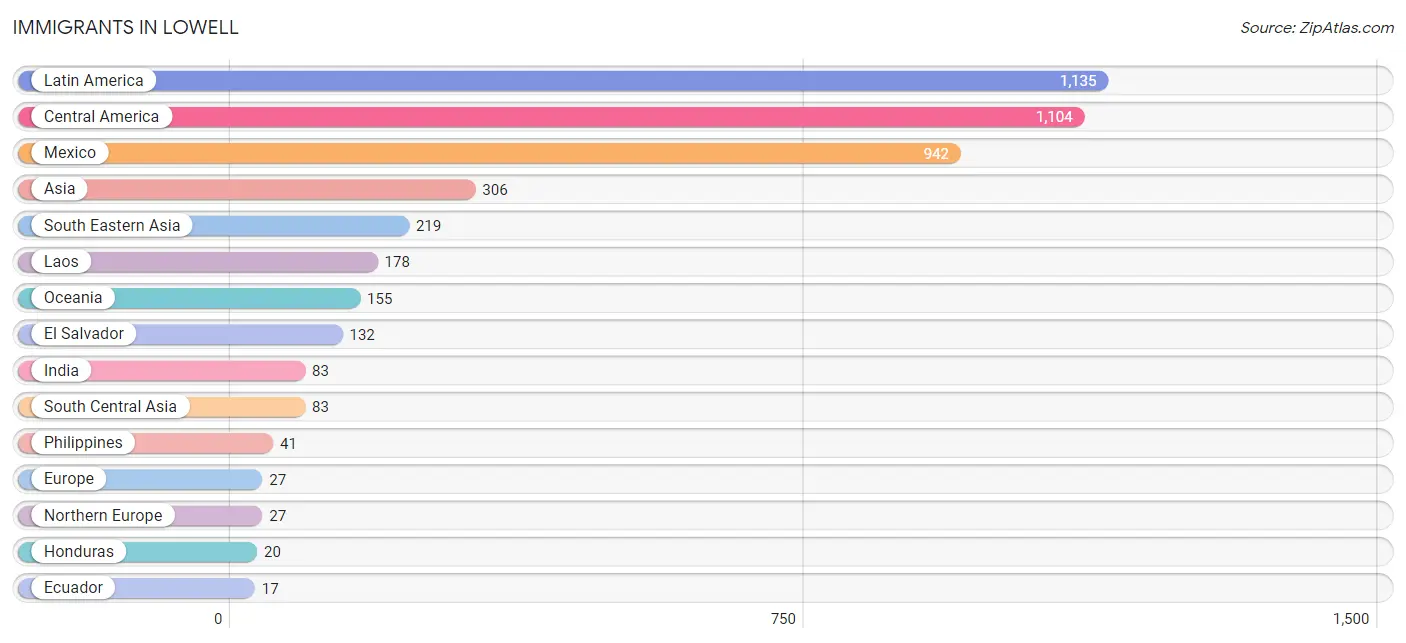
The most numerous immigrant groups reported in Lowell came from Latin America (1,135 | 11.3%), Central America (1,104 | 11.0%), Mexico (942 | 9.4%), Asia (306 | 3.1%), and South Eastern Asia (219 | 2.2%), together accounting for 37.0% of all Lowell residents.
| Immigration Origin | # Population | % Population |
| Asia | 306 | 3.1% |
| Caribbean | 14 | 0.1% |
| Central America | 1,104 | 11.0% |
| China | 4 | 0.0% |
| Costa Rica | 9 | 0.1% |
| Dominican Republic | 14 | 0.1% |
| Eastern Asia | 4 | 0.0% |
| Ecuador | 17 | 0.2% |
| El Salvador | 132 | 1.3% |
| Europe | 27 | 0.3% |
| Guatemala | 1 | 0.0% |
| Honduras | 20 | 0.2% |
| India | 83 | 0.8% |
| Laos | 178 | 1.8% |
| Latin America | 1,135 | 11.3% |
| Mexico | 942 | 9.4% |
| Northern Europe | 27 | 0.3% |
| Oceania | 155 | 1.5% |
| Philippines | 41 | 0.4% |
| South America | 17 | 0.2% |
| South Central Asia | 83 | 0.8% |
| South Eastern Asia | 219 | 2.2% | View All 22 Rows |
Sex and Age in Lowell
Sex and Age in Lowell
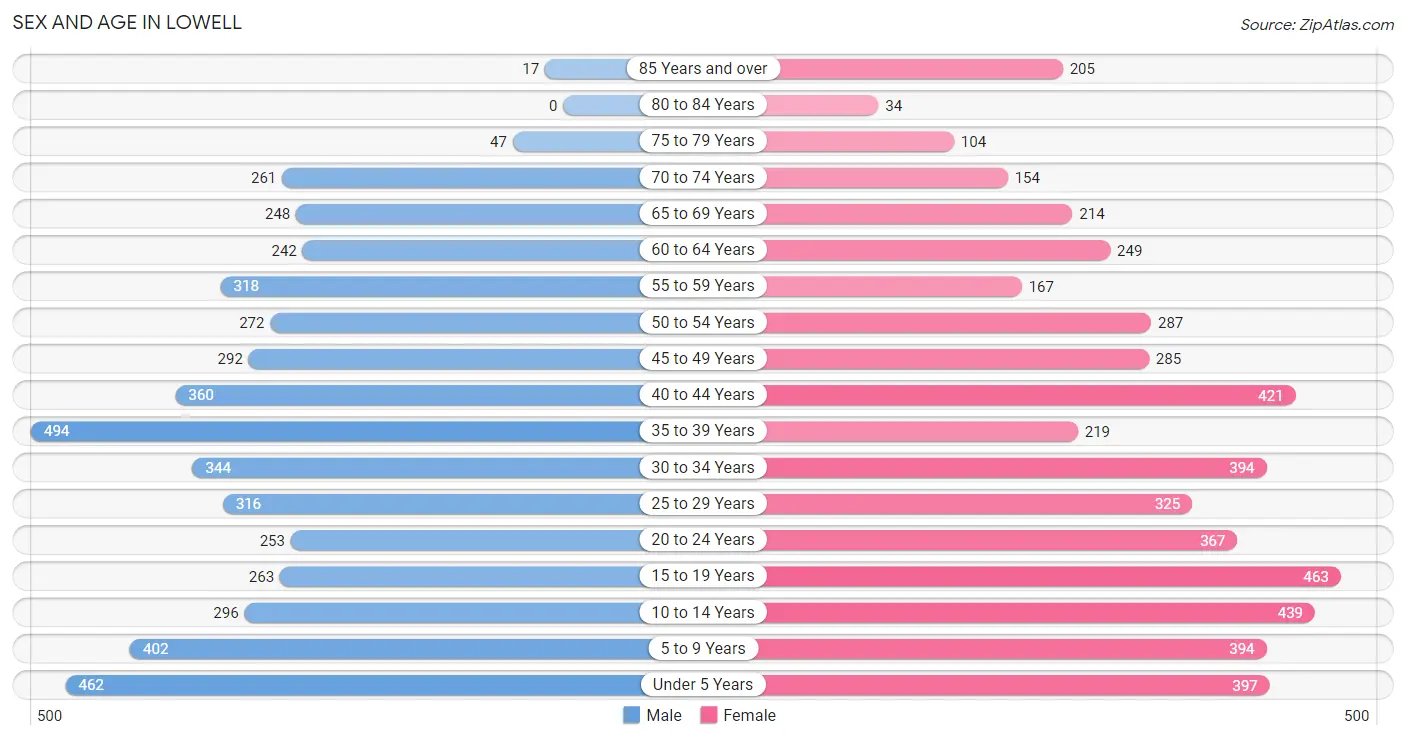
The most populous age groups in Lowell are 35 to 39 Years (494 | 10.1%) for men and 15 to 19 Years (463 | 9.0%) for women.
| Age Bracket | Male | Female |
| Under 5 Years | 462 (9.5%) | 397 (7.8%) |
| 5 to 9 Years | 402 (8.2%) | 394 (7.7%) |
| 10 to 14 Years | 296 (6.1%) | 439 (8.6%) |
| 15 to 19 Years | 263 (5.4%) | 463 (9.0%) |
| 20 to 24 Years | 253 (5.2%) | 367 (7.2%) |
| 25 to 29 Years | 316 (6.5%) | 325 (6.4%) |
| 30 to 34 Years | 344 (7.0%) | 394 (7.7%) |
| 35 to 39 Years | 494 (10.1%) | 219 (4.3%) |
| 40 to 44 Years | 360 (7.4%) | 421 (8.2%) |
| 45 to 49 Years | 292 (6.0%) | 285 (5.6%) |
| 50 to 54 Years | 272 (5.6%) | 287 (5.6%) |
| 55 to 59 Years | 318 (6.5%) | 167 (3.3%) |
| 60 to 64 Years | 242 (5.0%) | 249 (4.9%) |
| 65 to 69 Years | 248 (5.1%) | 214 (4.2%) |
| 70 to 74 Years | 261 (5.3%) | 154 (3.0%) |
| 75 to 79 Years | 47 (1.0%) | 104 (2.0%) |
| 80 to 84 Years | 0 (0.0%) | 34 (0.7%) |
| 85 Years and over | 17 (0.4%) | 205 (4.0%) |
| Total | 4,887 (100.0%) | 5,118 (100.0%) |
Families and Households in Lowell
Median Family Size in Lowell
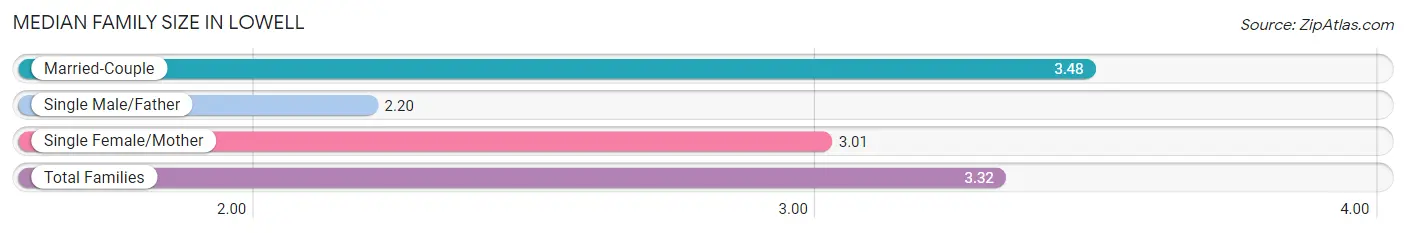
The median family size in Lowell is 3.32 persons per family, with married-couple families (2,088 | 79.9%) accounting for the largest median family size of 3.48 persons per family. On the other hand, single male/father families (191 | 7.3%) represent the smallest median family size with 2.20 persons per family.
| Family Type | # Families | Family Size |
| Married-Couple | 2,088 (79.9%) | 3.48 |
| Single Male/Father | 191 (7.3%) | 2.20 |
| Single Female/Mother | 333 (12.8%) | 3.01 |
| Total Families | 2,612 (100.0%) | 3.32 |
Median Household Size in Lowell
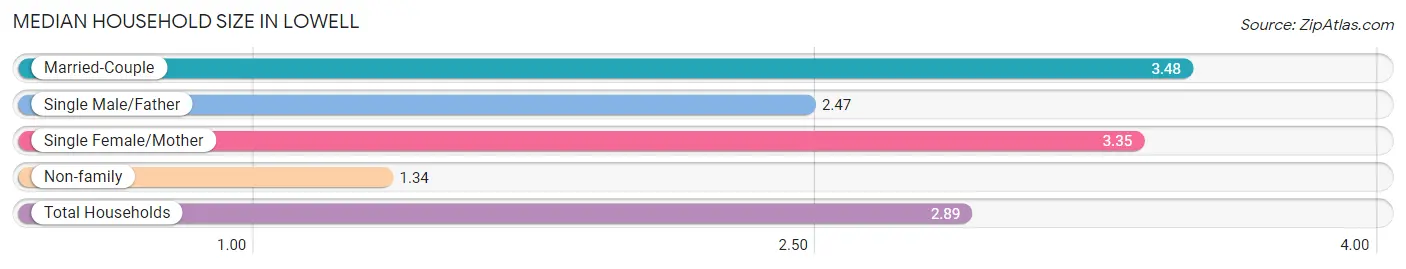
The median household size in Lowell is 2.89 persons per household, with married-couple households (2,088 | 60.3%) accounting for the largest median household size of 3.48 persons per household. non-family households (853 | 24.6%) represent the smallest median household size with 1.34 persons per household.
| Household Type | # Households | Household Size |
| Married-Couple | 2,088 (60.3%) | 3.48 |
| Single Male/Father | 191 (5.5%) | 2.47 |
| Single Female/Mother | 333 (9.6%) | 3.35 |
| Non-family | 853 (24.6%) | 1.34 |
| Total Households | 3,465 (100.0%) | 2.89 |
Household Size by Marriage Status in Lowell
Out of a total of 3,465 households in Lowell, 2,612 (75.4%) are family households, while 853 (24.6%) are nonfamily households. The most numerous type of family households are 2-person households, comprising 1,042, and the most common type of nonfamily households are 1-person households, comprising 700.
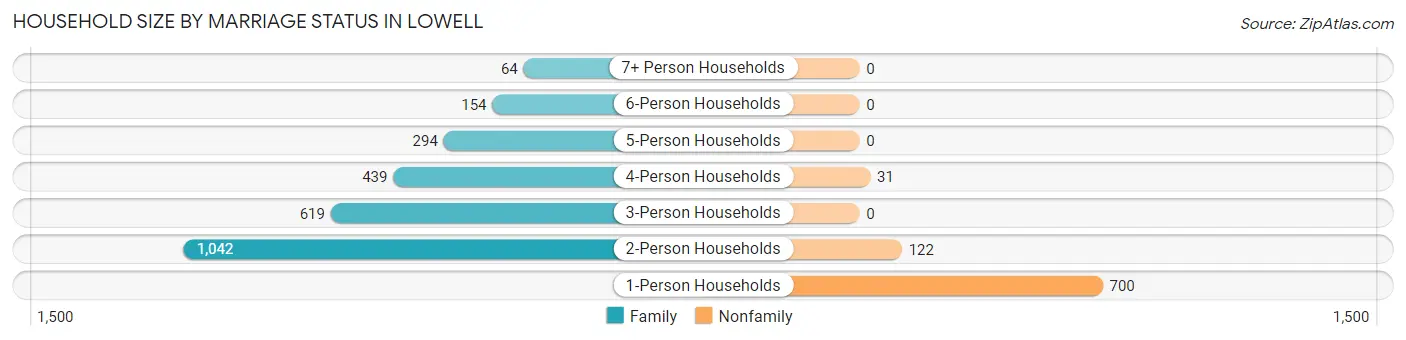
| Household Size | Family Households | Nonfamily Households |
| 1-Person Households | - | 700 (20.2%) |
| 2-Person Households | 1,042 (30.1%) | 122 (3.5%) |
| 3-Person Households | 619 (17.9%) | 0 (0.0%) |
| 4-Person Households | 439 (12.7%) | 31 (0.9%) |
| 5-Person Households | 294 (8.5%) | 0 (0.0%) |
| 6-Person Households | 154 (4.4%) | 0 (0.0%) |
| 7+ Person Households | 64 (1.8%) | 0 (0.0%) |
| Total | 2,612 (75.4%) | 853 (24.6%) |
Female Fertility in Lowell
Fertility by Age in Lowell
Average fertility rate in Lowell is 69.0 births per 1,000 women. Women in the age bracket of 20 to 34 years have the highest fertility rate with 114.0 births per 1,000 women. Women in the age bracket of 20 to 34 years acount for 70.1% of all women with births.
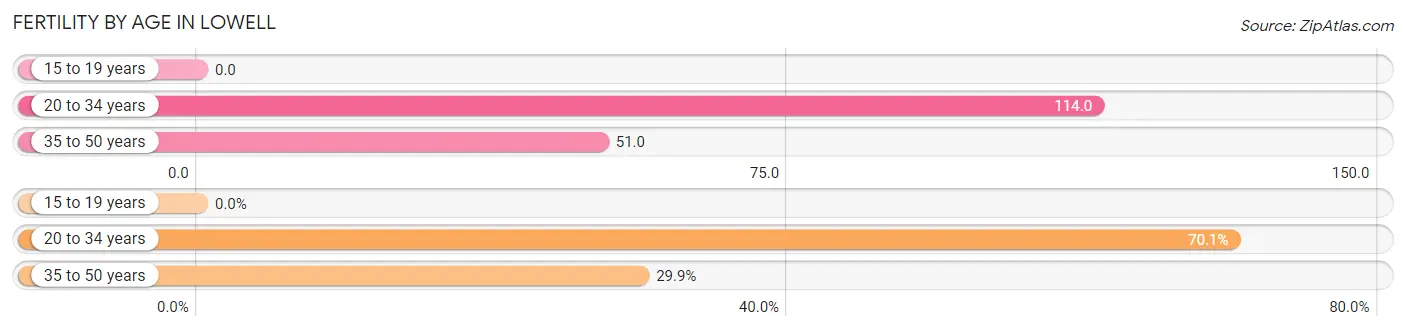
| Age Bracket | Women with Births | Births / 1,000 Women |
| 15 to 19 years | 0 (0.0%) | 0.0 |
| 20 to 34 years | 124 (70.1%) | 114.0 |
| 35 to 50 years | 53 (29.9%) | 51.0 |
| Total | 177 (100.0%) | 69.0 |
Fertility by Age by Marriage Status in Lowell
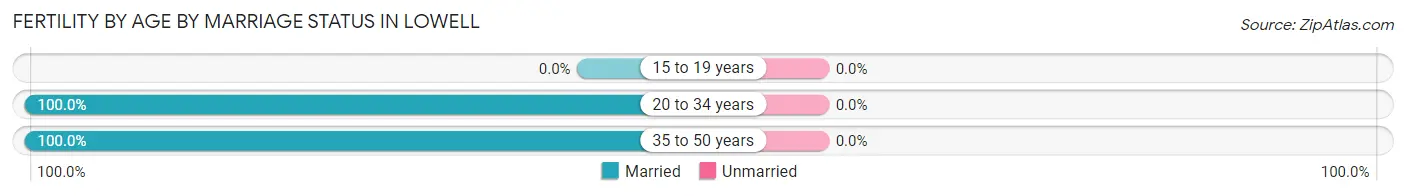
| Age Bracket | Married | Unmarried |
| 15 to 19 years | 0 (0.0%) | 0 (0.0%) |
| 20 to 34 years | 124 (100.0%) | 0 (0.0%) |
| 35 to 50 years | 53 (100.0%) | 0 (0.0%) |
| Total | 177 (100.0%) | 0 (0.0%) |
Fertility by Education in Lowell
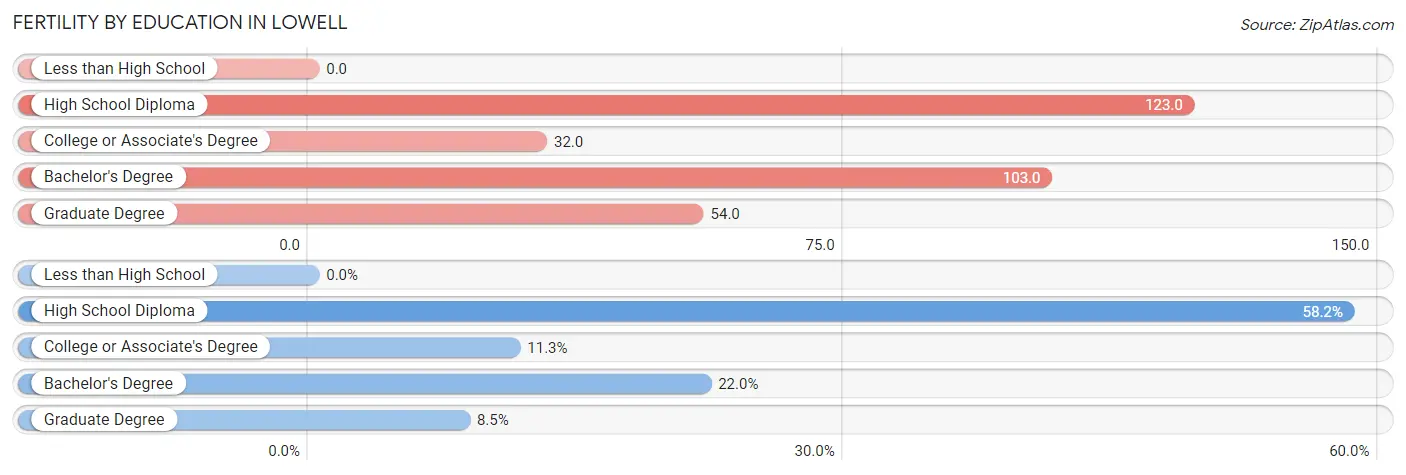
| Educational Attainment | Women with Births | Births / 1,000 Women |
| Less than High School | 0 (0.0%) | 0.0 |
| High School Diploma | 103 (58.2%) | 123.0 |
| College or Associate's Degree | 20 (11.3%) | 32.0 |
| Bachelor's Degree | 39 (22.0%) | 103.0 |
| Graduate Degree | 15 (8.5%) | 54.0 |
| Total | 177 (100.0%) | 69.0 |
Fertility by Education by Marriage Status in Lowell
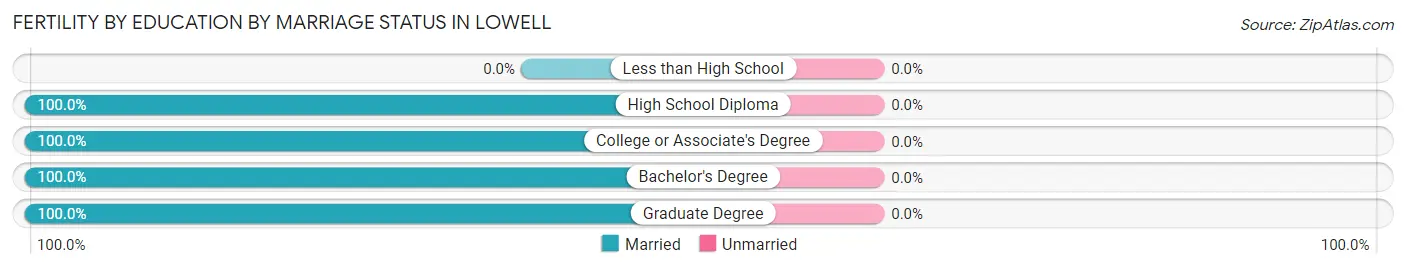
| Educational Attainment | Married | Unmarried |
| Less than High School | 0 (0.0%) | 0 (0.0%) |
| High School Diploma | 103 (100.0%) | 0 (0.0%) |
| College or Associate's Degree | 20 (100.0%) | 0 (0.0%) |
| Bachelor's Degree | 39 (100.0%) | 0 (0.0%) |
| Graduate Degree | 15 (100.0%) | 0 (0.0%) |
| Total | 177 (100.0%) | 0 (0.0%) |
Employment Characteristics in Lowell
Employment by Class of Employer in Lowell
Among the 4,849 employed individuals in Lowell, private company employees (3,528 | 72.8%), self-employed (not incorporated) (506 | 10.4%), and local government employees (244 | 5.0%) make up the most common classes of employment.
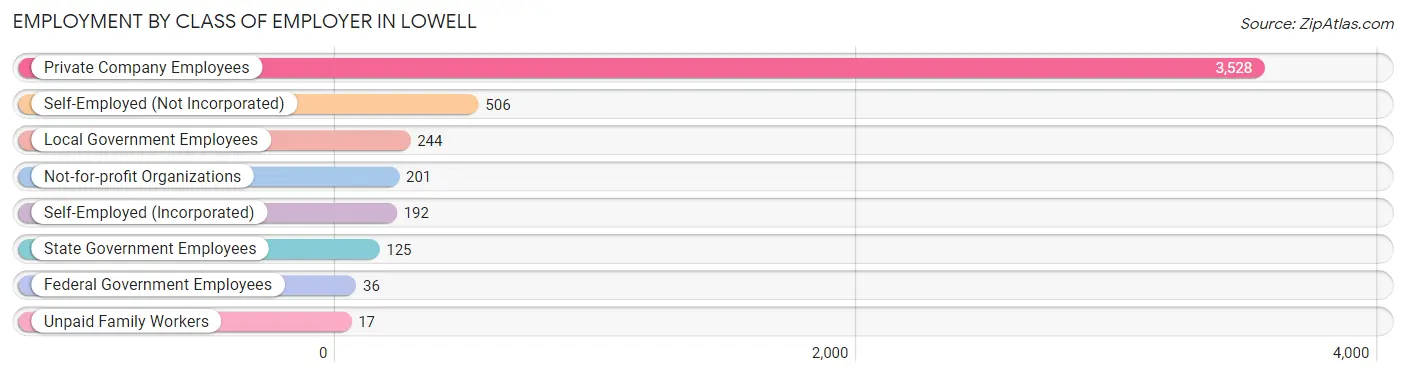
| Employer Class | # Employees | % Employees |
| Private Company Employees | 3,528 | 72.8% |
| Self-Employed (Incorporated) | 192 | 4.0% |
| Self-Employed (Not Incorporated) | 506 | 10.4% |
| Not-for-profit Organizations | 201 | 4.2% |
| Local Government Employees | 244 | 5.0% |
| State Government Employees | 125 | 2.6% |
| Federal Government Employees | 36 | 0.7% |
| Unpaid Family Workers | 17 | 0.4% |
| Total | 4,849 | 100.0% |
Employment Status by Age in Lowell
According to the labor force statistics for Lowell, out of the total population over 16 years of age (7,515), 65.8% or 4,945 individuals are in the labor force, with 0.9% or 45 of them unemployed. The age group with the highest labor force participation rate is 25 to 29 years, with 91.6% or 587 individuals in the labor force. Within the labor force, the 45 to 54 years age range has the highest percentage of unemployed individuals, with 3.9% or 39 of them being unemployed.
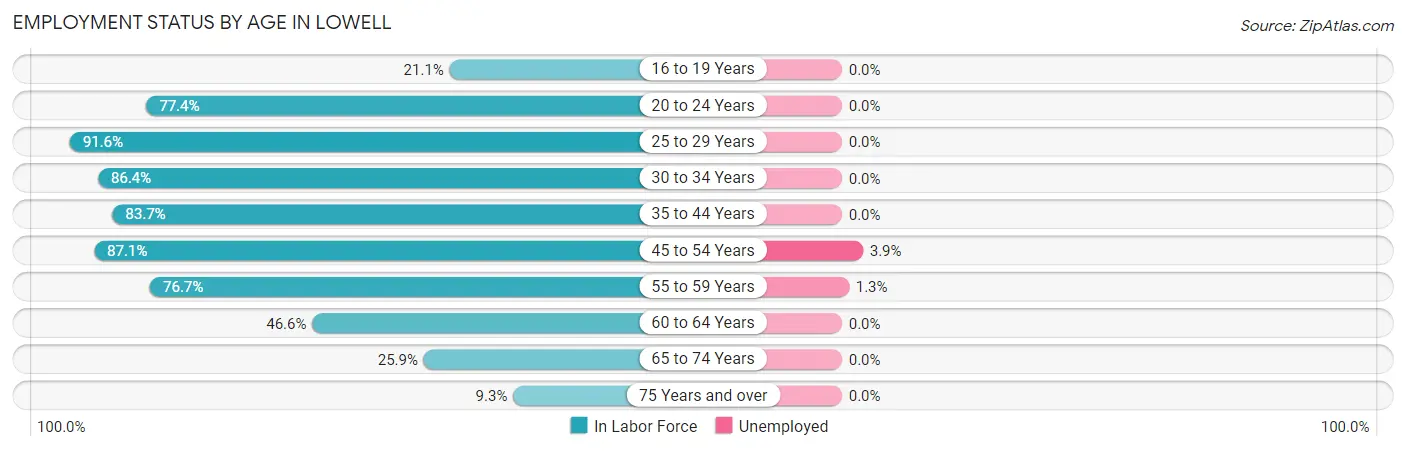
| Age Bracket | In Labor Force | Unemployed |
| 16 to 19 Years | 132 (21.1%) | 0 (0.0%) |
| 20 to 24 Years | 480 (77.4%) | 0 (0.0%) |
| 25 to 29 Years | 587 (91.6%) | 0 (0.0%) |
| 30 to 34 Years | 638 (86.4%) | 0 (0.0%) |
| 35 to 44 Years | 1,250 (83.7%) | 0 (0.0%) |
| 45 to 54 Years | 989 (87.1%) | 39 (3.9%) |
| 55 to 59 Years | 372 (76.7%) | 5 (1.3%) |
| 60 to 64 Years | 229 (46.6%) | 0 (0.0%) |
| 65 to 74 Years | 227 (25.9%) | 0 (0.0%) |
| 75 Years and over | 38 (9.3%) | 0 (0.0%) |
| Total | 4,945 (65.8%) | 45 (0.9%) |
Employment Status by Educational Attainment in Lowell
According to labor force statistics for Lowell, 81.6% of individuals (4,068) out of the total population between 25 and 64 years of age (4,985) are in the labor force, with 1.1% or 45 of them being unemployed. The group with the highest labor force participation rate are those with the educational attainment of bachelor's degree or higher, with 93.0% or 1,194 individuals in the labor force. Within the labor force, individuals with bachelor's degree or higher education have the highest percentage of unemployment, with 2.2% or 26 of them being unemployed.
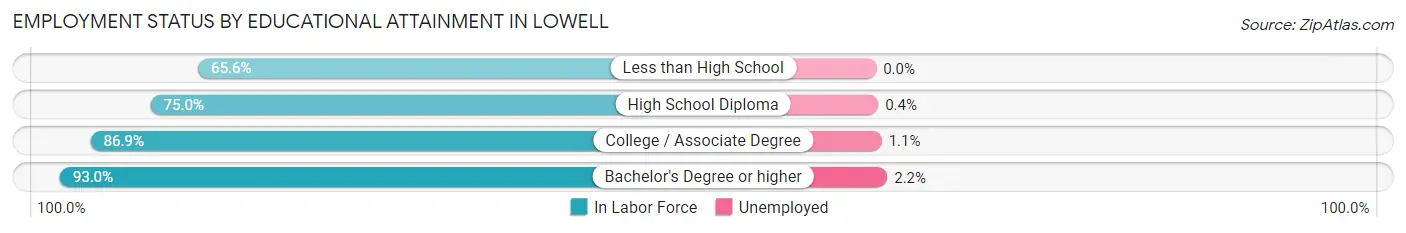
| Educational Attainment | In Labor Force | Unemployed |
| Less than High School | 467 (65.6%) | 0 (0.0%) |
| High School Diploma | 1,207 (75.0%) | 6 (0.4%) |
| College / Associate Degree | 1,199 (86.9%) | 15 (1.1%) |
| Bachelor's Degree or higher | 1,194 (93.0%) | 28 (2.2%) |
| Total | 4,068 (81.6%) | 55 (1.1%) |
Employment Occupations by Sex in Lowell
Management, Business, Science and Arts Occupations
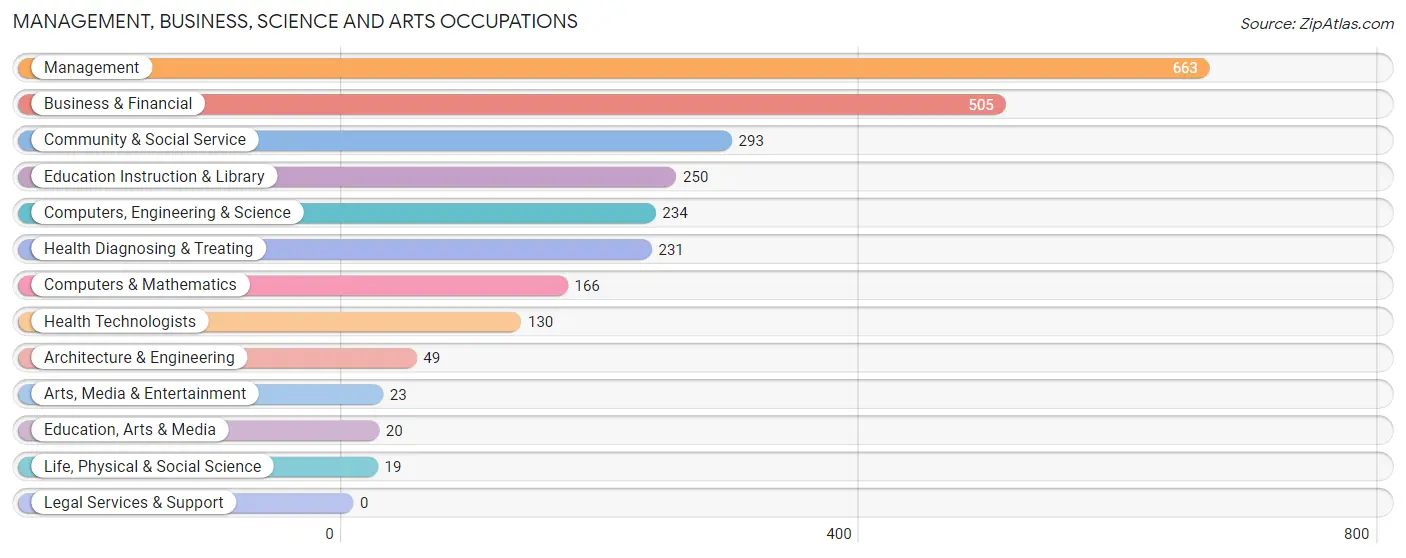
The most common Management, Business, Science and Arts occupations in Lowell are Management (663 | 13.5%), Business & Financial (505 | 10.3%), Community & Social Service (293 | 6.0%), Education Instruction & Library (250 | 5.1%), and Computers, Engineering & Science (234 | 4.8%).
Management, Business, Science and Arts Occupations by Sex
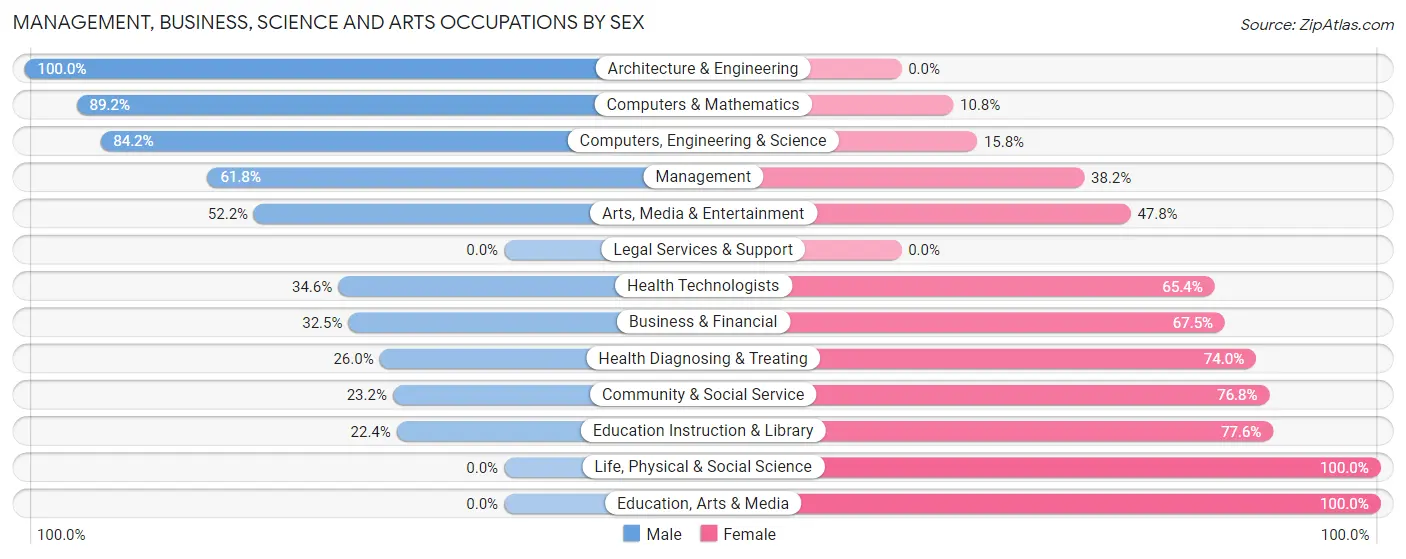
Within the Management, Business, Science and Arts occupations in Lowell, the most male-oriented occupations are Architecture & Engineering (100.0%), Computers & Mathematics (89.2%), and Computers, Engineering & Science (84.2%), while the most female-oriented occupations are Life, Physical & Social Science (100.0%), Education, Arts & Media (100.0%), and Education Instruction & Library (77.6%).
| Occupation | Male | Female |
| Management | 410 (61.8%) | 253 (38.2%) |
| Business & Financial | 164 (32.5%) | 341 (67.5%) |
| Computers, Engineering & Science | 197 (84.2%) | 37 (15.8%) |
| Computers & Mathematics | 148 (89.2%) | 18 (10.8%) |
| Architecture & Engineering | 49 (100.0%) | 0 (0.0%) |
| Life, Physical & Social Science | 0 (0.0%) | 19 (100.0%) |
| Community & Social Service | 68 (23.2%) | 225 (76.8%) |
| Education, Arts & Media | 0 (0.0%) | 20 (100.0%) |
| Legal Services & Support | 0 (0.0%) | 0 (0.0%) |
| Education Instruction & Library | 56 (22.4%) | 194 (77.6%) |
| Arts, Media & Entertainment | 12 (52.2%) | 11 (47.8%) |
| Health Diagnosing & Treating | 60 (26.0%) | 171 (74.0%) |
| Health Technologists | 45 (34.6%) | 85 (65.4%) |
| Total (Category) | 899 (46.7%) | 1,027 (53.3%) |
| Total (Overall) | 2,773 (56.6%) | 2,126 (43.4%) |
Services Occupations
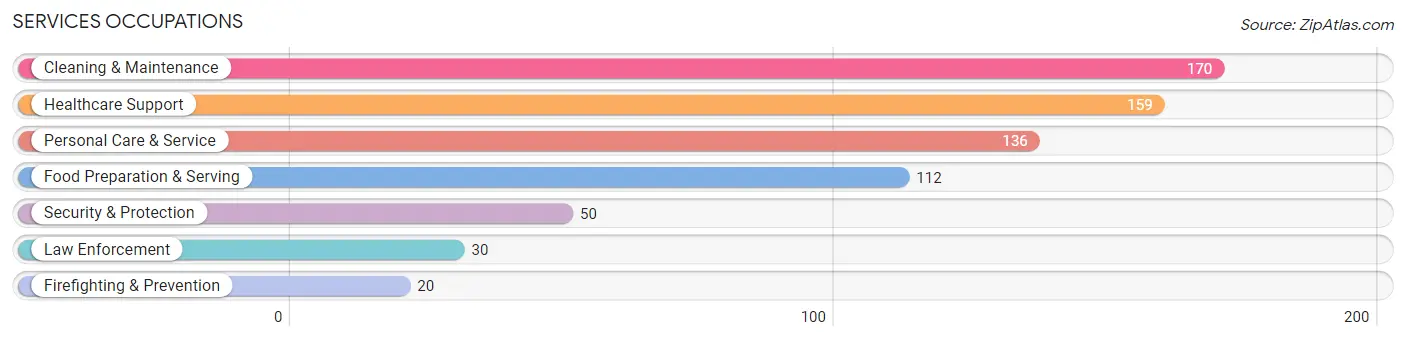
The most common Services occupations in Lowell are Cleaning & Maintenance (170 | 3.5%), Healthcare Support (159 | 3.3%), Personal Care & Service (136 | 2.8%), Food Preparation & Serving (112 | 2.3%), and Security & Protection (50 | 1.0%).
Services Occupations by Sex
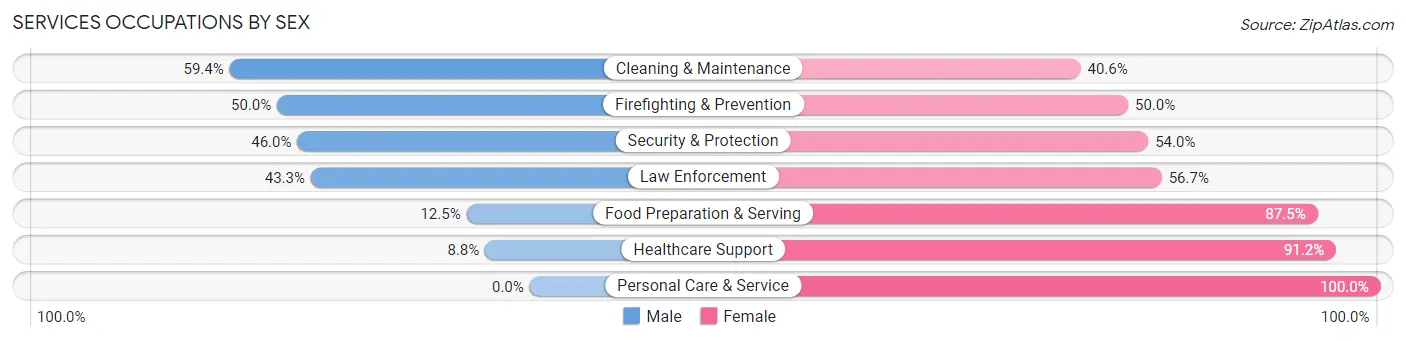
Within the Services occupations in Lowell, the most male-oriented occupations are Cleaning & Maintenance (59.4%), Firefighting & Prevention (50.0%), and Security & Protection (46.0%), while the most female-oriented occupations are Personal Care & Service (100.0%), Healthcare Support (91.2%), and Food Preparation & Serving (87.5%).
| Occupation | Male | Female |
| Healthcare Support | 14 (8.8%) | 145 (91.2%) |
| Security & Protection | 23 (46.0%) | 27 (54.0%) |
| Firefighting & Prevention | 10 (50.0%) | 10 (50.0%) |
| Law Enforcement | 13 (43.3%) | 17 (56.7%) |
| Food Preparation & Serving | 14 (12.5%) | 98 (87.5%) |
| Cleaning & Maintenance | 101 (59.4%) | 69 (40.6%) |
| Personal Care & Service | 0 (0.0%) | 136 (100.0%) |
| Total (Category) | 152 (24.2%) | 475 (75.8%) |
| Total (Overall) | 2,773 (56.6%) | 2,126 (43.4%) |
Sales and Office Occupations
The most common Sales and Office occupations in Lowell are Sales & Related (618 | 12.6%), and Office & Administration (370 | 7.5%).

Sales and Office Occupations by Sex
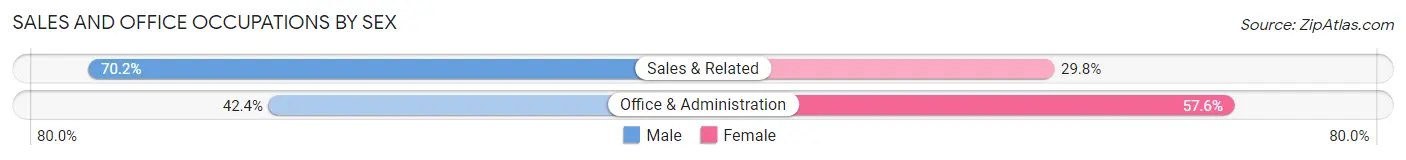
| Occupation | Male | Female |
| Sales & Related | 434 (70.2%) | 184 (29.8%) |
| Office & Administration | 157 (42.4%) | 213 (57.6%) |
| Total (Category) | 591 (59.8%) | 397 (40.2%) |
| Total (Overall) | 2,773 (56.6%) | 2,126 (43.4%) |
Natural Resources, Construction and Maintenance Occupations
The most common Natural Resources, Construction and Maintenance occupations in Lowell are Construction & Extraction (548 | 11.2%), and Installation, Maintenance & Repair (106 | 2.2%).
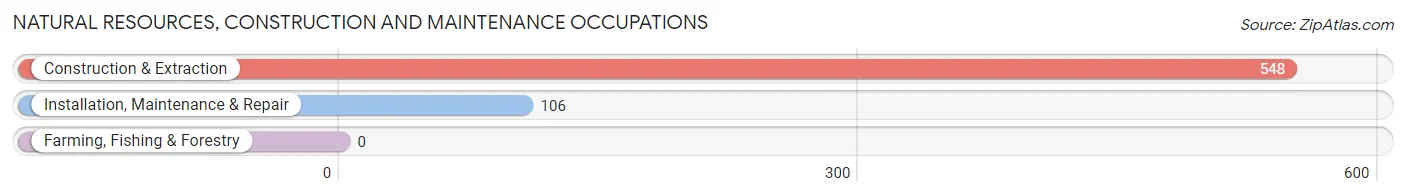
Natural Resources, Construction and Maintenance Occupations by Sex
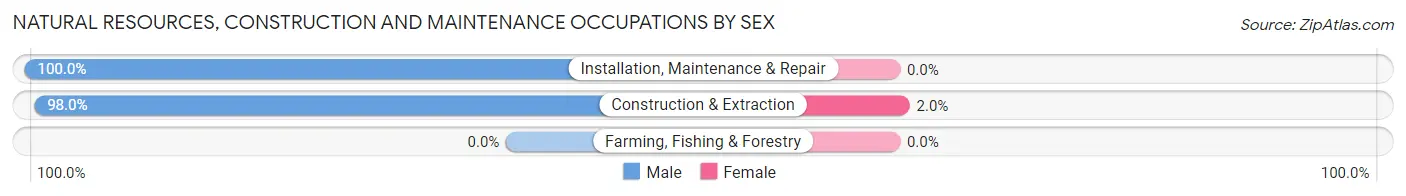
| Occupation | Male | Female |
| Farming, Fishing & Forestry | 0 (0.0%) | 0 (0.0%) |
| Construction & Extraction | 537 (98.0%) | 11 (2.0%) |
| Installation, Maintenance & Repair | 106 (100.0%) | 0 (0.0%) |
| Total (Category) | 643 (98.3%) | 11 (1.7%) |
| Total (Overall) | 2,773 (56.6%) | 2,126 (43.4%) |
Production, Transportation and Moving Occupations
The most common Production, Transportation and Moving occupations in Lowell are Production (299 | 6.1%), Transportation (206 | 4.2%), and Material Moving (199 | 4.1%).
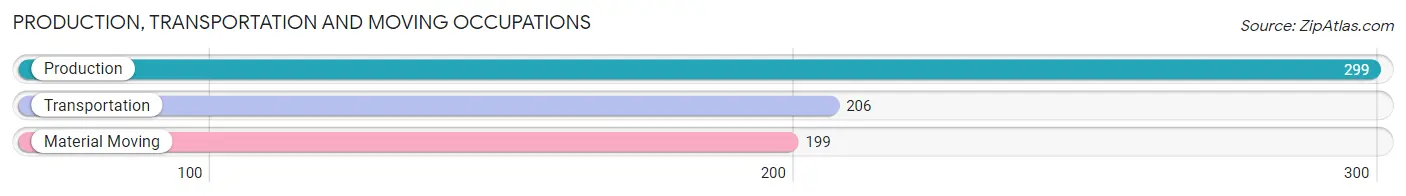
Production, Transportation and Moving Occupations by Sex
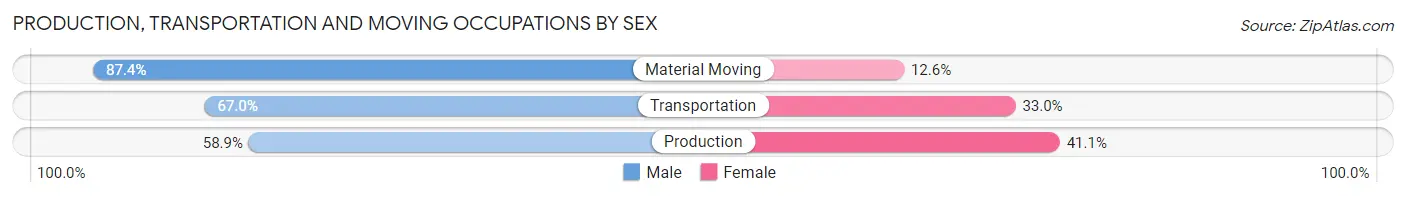
| Occupation | Male | Female |
| Production | 176 (58.9%) | 123 (41.1%) |
| Transportation | 138 (67.0%) | 68 (33.0%) |
| Material Moving | 174 (87.4%) | 25 (12.6%) |
| Total (Category) | 488 (69.3%) | 216 (30.7%) |
| Total (Overall) | 2,773 (56.6%) | 2,126 (43.4%) |
Employment Industries by Sex in Lowell
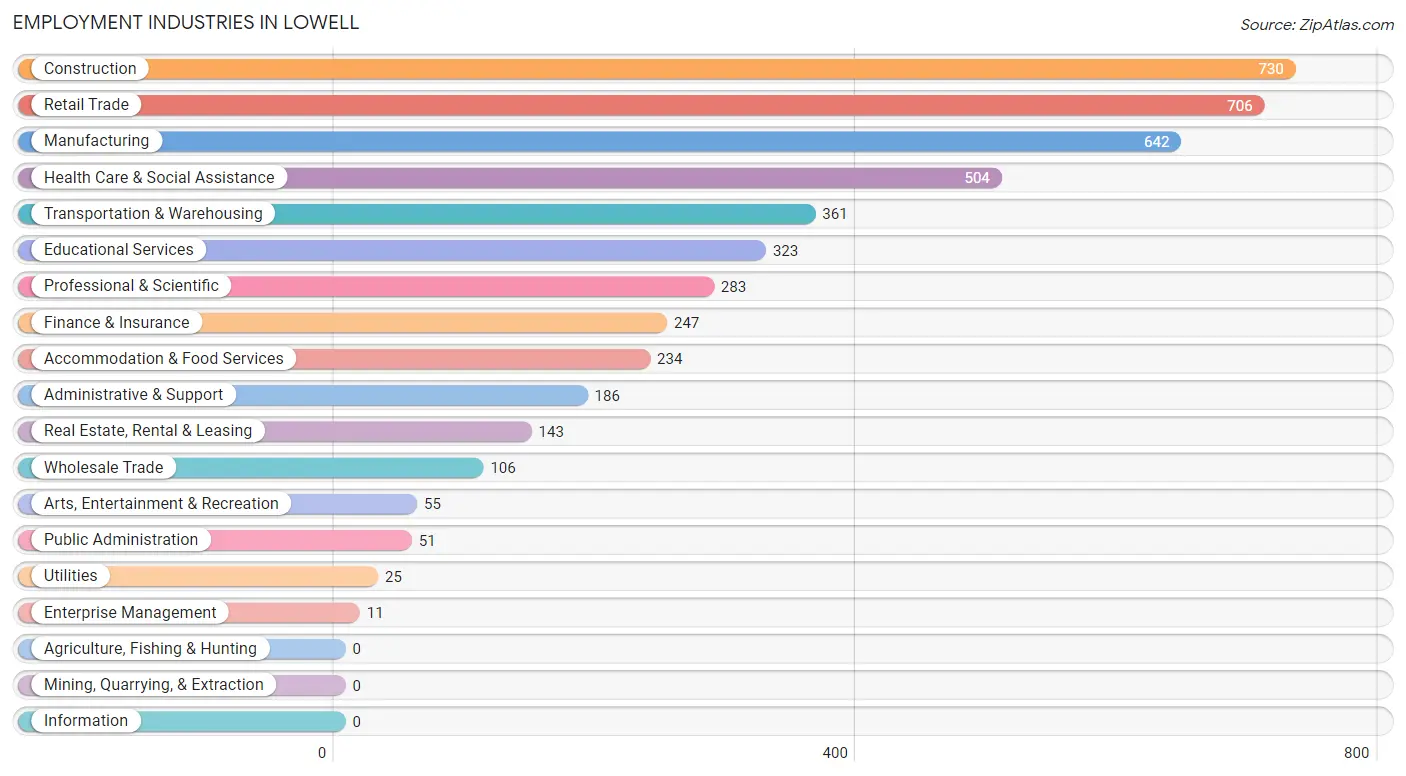
Employment Industries in Lowell
The major employment industries in Lowell include Construction (730 | 14.9%), Retail Trade (706 | 14.4%), Manufacturing (642 | 13.1%), Health Care & Social Assistance (504 | 10.3%), and Transportation & Warehousing (361 | 7.4%).
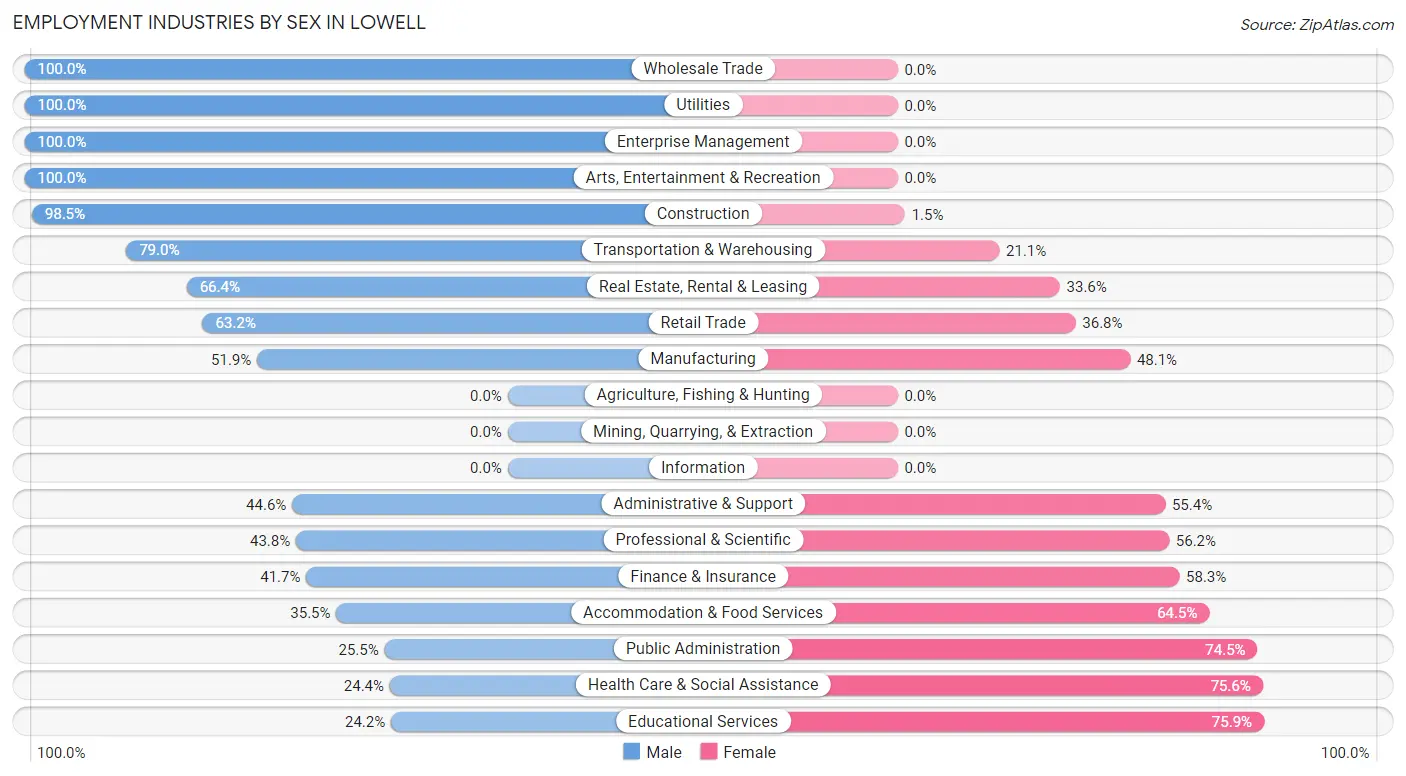
Employment Industries by Sex in Lowell
The Lowell industries that see more men than women are Wholesale Trade (100.0%), Utilities (100.0%), and Enterprise Management (100.0%), whereas the industries that tend to have a higher number of women are Educational Services (75.8%), Health Care & Social Assistance (75.6%), and Public Administration (74.5%).
| Industry | Male | Female |
| Agriculture, Fishing & Hunting | 0 (0.0%) | 0 (0.0%) |
| Mining, Quarrying, & Extraction | 0 (0.0%) | 0 (0.0%) |
| Construction | 719 (98.5%) | 11 (1.5%) |
| Manufacturing | 333 (51.9%) | 309 (48.1%) |
| Wholesale Trade | 106 (100.0%) | 0 (0.0%) |
| Retail Trade | 446 (63.2%) | 260 (36.8%) |
| Transportation & Warehousing | 285 (78.9%) | 76 (21.0%) |
| Utilities | 25 (100.0%) | 0 (0.0%) |
| Information | 0 (0.0%) | 0 (0.0%) |
| Finance & Insurance | 103 (41.7%) | 144 (58.3%) |
| Real Estate, Rental & Leasing | 95 (66.4%) | 48 (33.6%) |
| Professional & Scientific | 124 (43.8%) | 159 (56.2%) |
| Enterprise Management | 11 (100.0%) | 0 (0.0%) |
| Administrative & Support | 83 (44.6%) | 103 (55.4%) |
| Educational Services | 78 (24.1%) | 245 (75.8%) |
| Health Care & Social Assistance | 123 (24.4%) | 381 (75.6%) |
| Arts, Entertainment & Recreation | 55 (100.0%) | 0 (0.0%) |
| Accommodation & Food Services | 83 (35.5%) | 151 (64.5%) |
| Public Administration | 13 (25.5%) | 38 (74.5%) |
| Total | 2,773 (56.6%) | 2,126 (43.4%) |
Education in Lowell
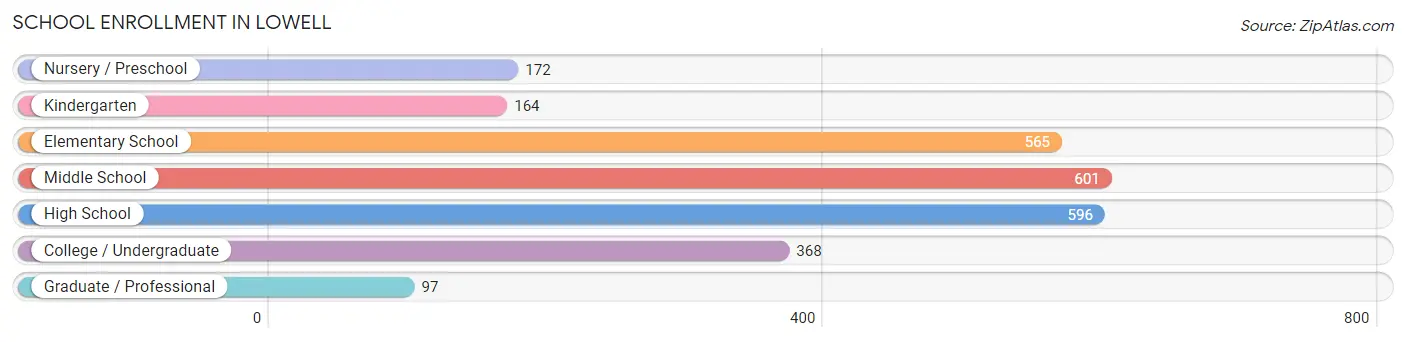
School Enrollment in Lowell
The most common levels of schooling among the 2,563 students in Lowell are middle school (601 | 23.4%), high school (596 | 23.3%), and elementary school (565 | 22.0%).
| School Level | # Students | % Students |
| Nursery / Preschool | 172 | 6.7% |
| Kindergarten | 164 | 6.4% |
| Elementary School | 565 | 22.0% |
| Middle School | 601 | 23.4% |
| High School | 596 | 23.3% |
| College / Undergraduate | 368 | 14.4% |
| Graduate / Professional | 97 | 3.8% |
| Total | 2,563 | 100.0% |
School Enrollment by Age by Funding Source in Lowell
Out of a total of 2,563 students who are enrolled in schools in Lowell, 464 (18.1%) attend a private institution, while the remaining 2,099 (81.9%) are enrolled in public schools. The age group of 3 to 4 year olds has the highest likelihood of being enrolled in private schools, with 62 (100.0% in the age bracket) enrolled. Conversely, the age group of 20 to 24 year olds has the lowest likelihood of being enrolled in a private school, with 126 (100.0% in the age bracket) attending a public institution.
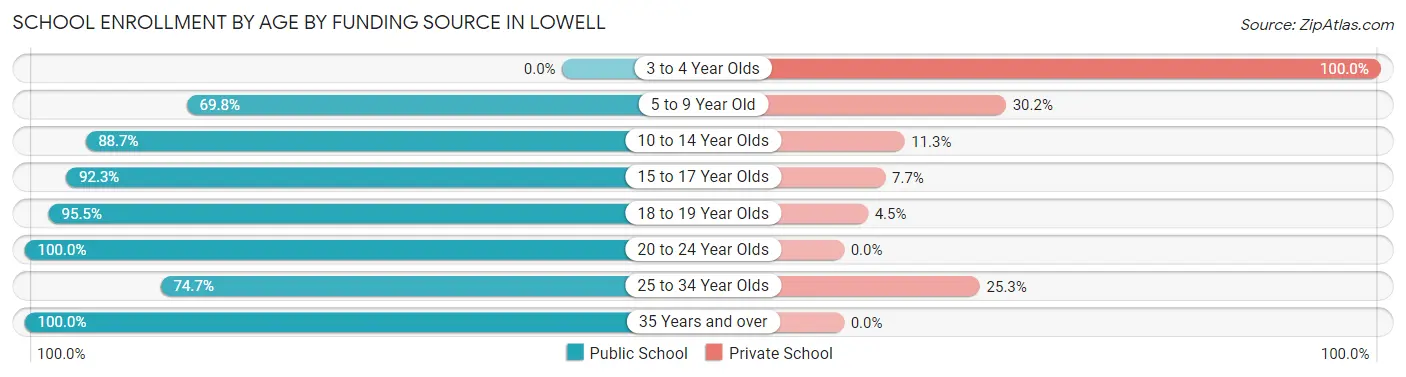
| Age Bracket | Public School | Private School |
| 3 to 4 Year Olds | 0 (0.0%) | 62 (100.0%) |
| 5 to 9 Year Old | 548 (69.8%) | 237 (30.2%) |
| 10 to 14 Year Olds | 652 (88.7%) | 83 (11.3%) |
| 15 to 17 Year Olds | 371 (92.3%) | 31 (7.7%) |
| 18 to 19 Year Olds | 256 (95.5%) | 12 (4.5%) |
| 20 to 24 Year Olds | 126 (100.0%) | 0 (0.0%) |
| 25 to 34 Year Olds | 115 (74.7%) | 39 (25.3%) |
| 35 Years and over | 31 (100.0%) | 0 (0.0%) |
| Total | 2,099 (81.9%) | 464 (18.1%) |
Educational Attainment by Field of Study in Lowell
Business (557 | 35.5%), education (169 | 10.8%), science & technology (150 | 9.6%), bio, nature & agricultural (107 | 6.8%), and psychology (99 | 6.3%) are the most common fields of study among 1,571 individuals in Lowell who have obtained a bachelor's degree or higher.
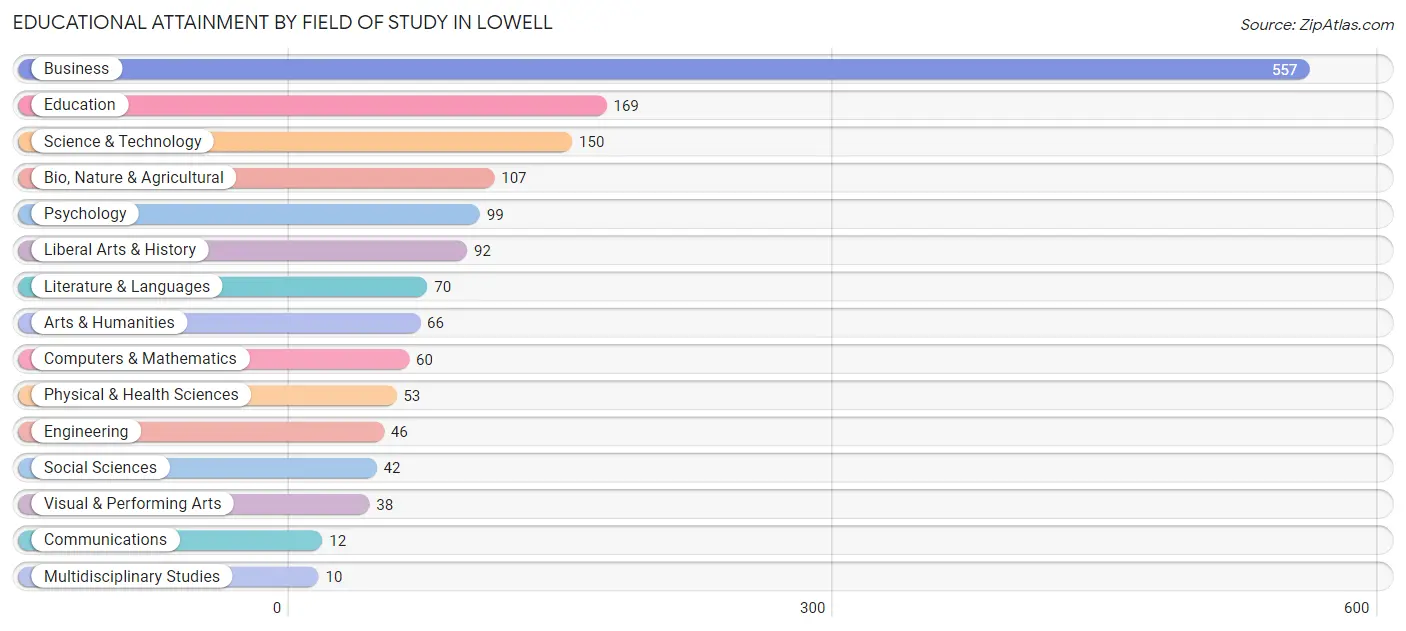
| Field of Study | # Graduates | % Graduates |
| Computers & Mathematics | 60 | 3.8% |
| Bio, Nature & Agricultural | 107 | 6.8% |
| Physical & Health Sciences | 53 | 3.4% |
| Psychology | 99 | 6.3% |
| Social Sciences | 42 | 2.7% |
| Engineering | 46 | 2.9% |
| Multidisciplinary Studies | 10 | 0.6% |
| Science & Technology | 150 | 9.6% |
| Business | 557 | 35.5% |
| Education | 169 | 10.8% |
| Literature & Languages | 70 | 4.5% |
| Liberal Arts & History | 92 | 5.9% |
| Visual & Performing Arts | 38 | 2.4% |
| Communications | 12 | 0.8% |
| Arts & Humanities | 66 | 4.2% |
| Total | 1,571 | 100.0% |
Transportation & Commute in Lowell
Vehicle Availability by Sex in Lowell
The most prevalent vehicle ownership categories in Lowell are males with 2 vehicles (1,318, accounting for 48.0%) and females with 2 vehicles (1,028, making up 62.6%).
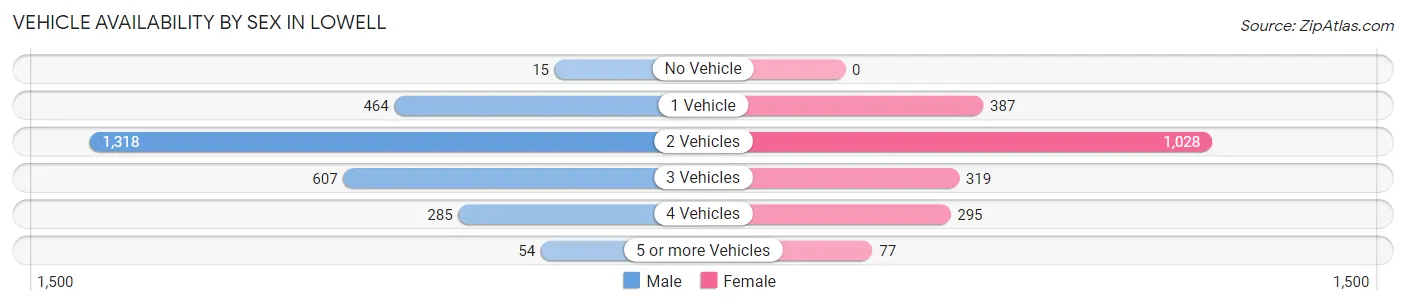
| Vehicles Available | Male | Female |
| No Vehicle | 15 (0.5%) | 0 (0.0%) |
| 1 Vehicle | 464 (16.9%) | 387 (18.4%) |
| 2 Vehicles | 1,318 (48.0%) | 1,028 (48.8%) |
| 3 Vehicles | 607 (22.1%) | 319 (15.1%) |
| 4 Vehicles | 285 (10.4%) | 295 (14.0%) |
| 5 or more Vehicles | 54 (2.0%) | 77 (3.7%) |
| Total | 2,743 (100.0%) | 2,106 (100.0%) |
Commute Time in Lowell
The most frequently occuring commute durations in Lowell are 15 to 19 minutes (945 commuters, 22.1%), 20 to 24 minutes (865 commuters, 20.2%), and 10 to 14 minutes (669 commuters, 15.6%).
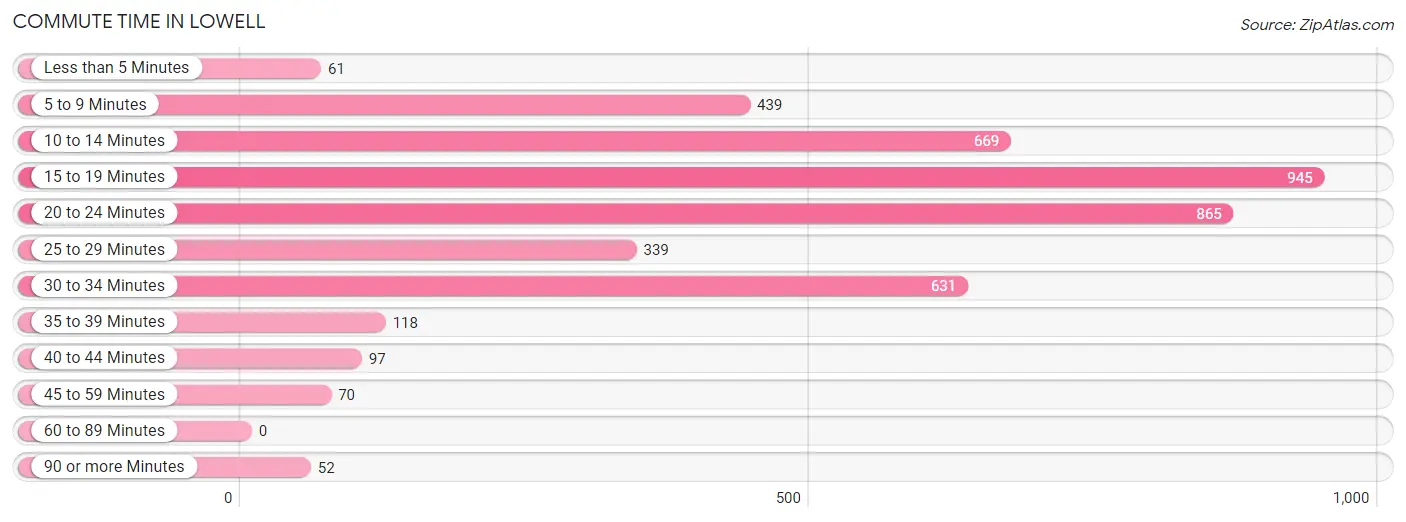
| Commute Time | # Commuters | % Commuters |
| Less than 5 Minutes | 61 | 1.4% |
| 5 to 9 Minutes | 439 | 10.2% |
| 10 to 14 Minutes | 669 | 15.6% |
| 15 to 19 Minutes | 945 | 22.1% |
| 20 to 24 Minutes | 865 | 20.2% |
| 25 to 29 Minutes | 339 | 7.9% |
| 30 to 34 Minutes | 631 | 14.7% |
| 35 to 39 Minutes | 118 | 2.8% |
| 40 to 44 Minutes | 97 | 2.3% |
| 45 to 59 Minutes | 70 | 1.6% |
| 60 to 89 Minutes | 0 | 0.0% |
| 90 or more Minutes | 52 | 1.2% |
Commute Time by Sex in Lowell
The most common commute times in Lowell are 15 to 19 minutes (528 commuters, 20.9%) for males and 15 to 19 minutes (417 commuters, 23.6%) for females.
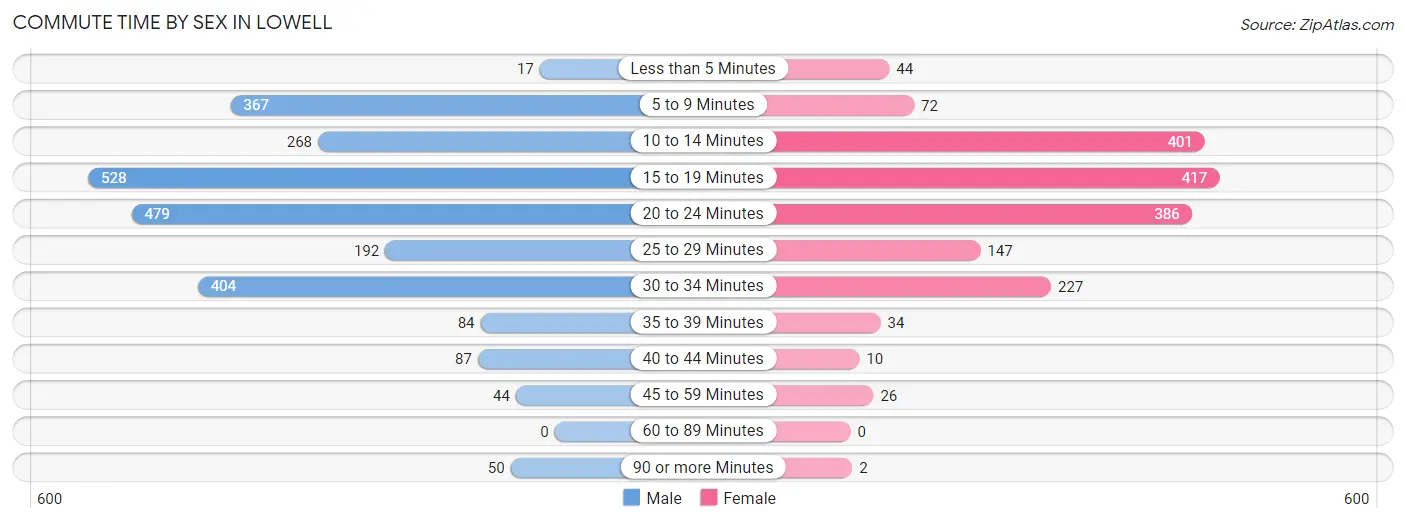
| Commute Time | Male | Female |
| Less than 5 Minutes | 17 (0.7%) | 44 (2.5%) |
| 5 to 9 Minutes | 367 (14.6%) | 72 (4.1%) |
| 10 to 14 Minutes | 268 (10.6%) | 401 (22.7%) |
| 15 to 19 Minutes | 528 (20.9%) | 417 (23.6%) |
| 20 to 24 Minutes | 479 (19.0%) | 386 (21.9%) |
| 25 to 29 Minutes | 192 (7.6%) | 147 (8.3%) |
| 30 to 34 Minutes | 404 (16.0%) | 227 (12.9%) |
| 35 to 39 Minutes | 84 (3.3%) | 34 (1.9%) |
| 40 to 44 Minutes | 87 (3.5%) | 10 (0.6%) |
| 45 to 59 Minutes | 44 (1.8%) | 26 (1.5%) |
| 60 to 89 Minutes | 0 (0.0%) | 0 (0.0%) |
| 90 or more Minutes | 50 (2.0%) | 2 (0.1%) |
Time of Departure to Work by Sex in Lowell
The most frequent times of departure to work in Lowell are 6:30 AM to 6:59 AM (599, 23.8%) for males and 7:00 AM to 7:29 AM (430, 24.3%) for females.
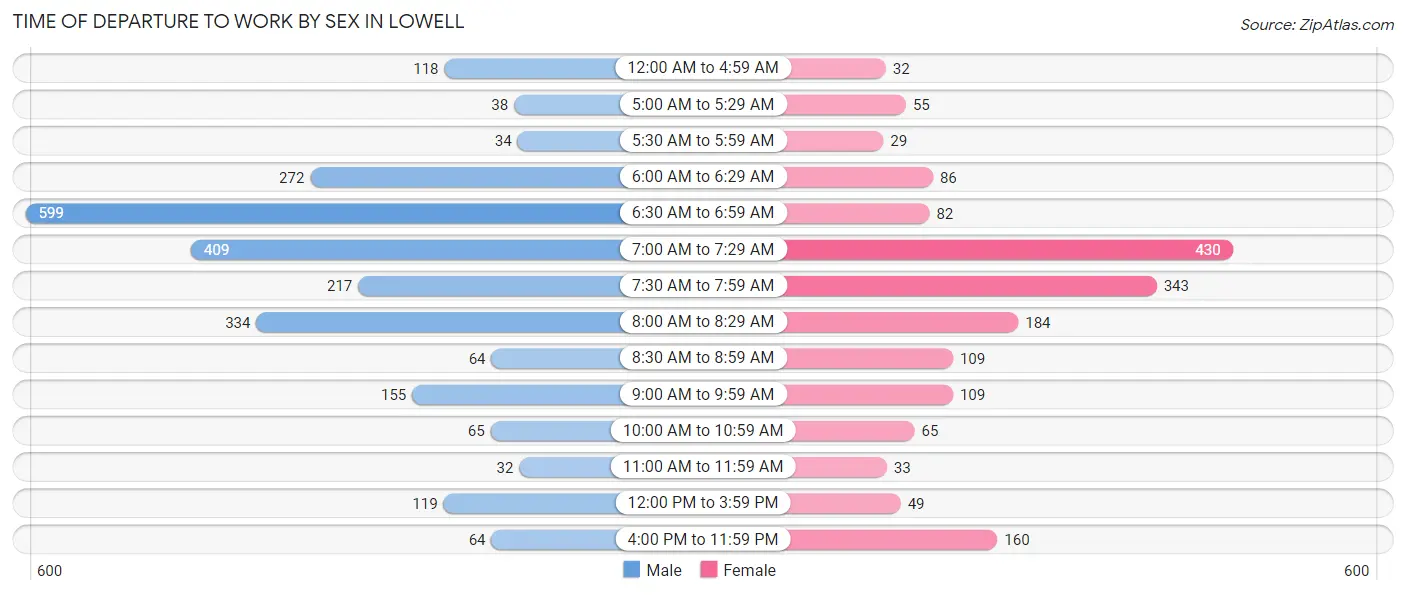
| Time of Departure | Male | Female |
| 12:00 AM to 4:59 AM | 118 (4.7%) | 32 (1.8%) |
| 5:00 AM to 5:29 AM | 38 (1.5%) | 55 (3.1%) |
| 5:30 AM to 5:59 AM | 34 (1.3%) | 29 (1.6%) |
| 6:00 AM to 6:29 AM | 272 (10.8%) | 86 (4.9%) |
| 6:30 AM to 6:59 AM | 599 (23.8%) | 82 (4.6%) |
| 7:00 AM to 7:29 AM | 409 (16.2%) | 430 (24.3%) |
| 7:30 AM to 7:59 AM | 217 (8.6%) | 343 (19.4%) |
| 8:00 AM to 8:29 AM | 334 (13.3%) | 184 (10.4%) |
| 8:30 AM to 8:59 AM | 64 (2.5%) | 109 (6.2%) |
| 9:00 AM to 9:59 AM | 155 (6.1%) | 109 (6.2%) |
| 10:00 AM to 10:59 AM | 65 (2.6%) | 65 (3.7%) |
| 11:00 AM to 11:59 AM | 32 (1.3%) | 33 (1.9%) |
| 12:00 PM to 3:59 PM | 119 (4.7%) | 49 (2.8%) |
| 4:00 PM to 11:59 PM | 64 (2.5%) | 160 (9.1%) |
| Total | 2,520 (100.0%) | 1,766 (100.0%) |
Housing Occupancy in Lowell
Occupancy by Ownership in Lowell
Of the total 3,465 dwellings in Lowell, owner-occupied units account for 2,280 (65.8%), while renter-occupied units make up 1,185 (34.2%).
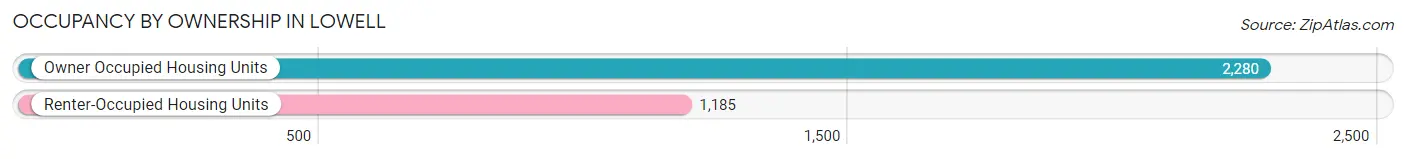
| Occupancy | # Housing Units | % Housing Units |
| Owner Occupied Housing Units | 2,280 | 65.8% |
| Renter-Occupied Housing Units | 1,185 | 34.2% |
| Total Occupied Housing Units | 3,465 | 100.0% |
Occupancy by Household Size in Lowell
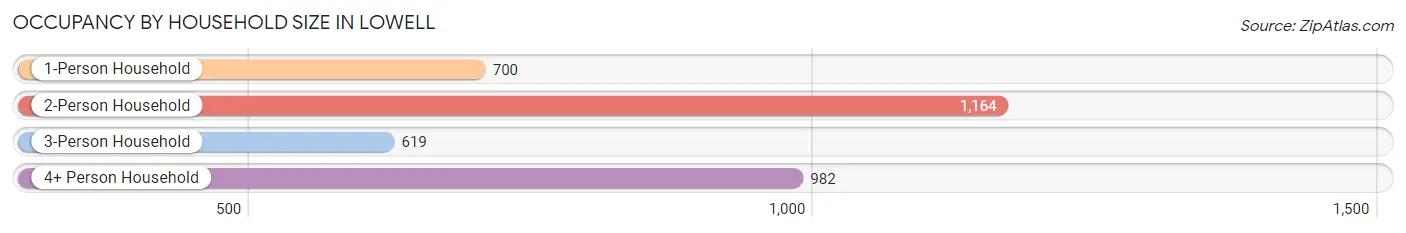
| Household Size | # Housing Units | % Housing Units |
| 1-Person Household | 700 | 20.2% |
| 2-Person Household | 1,164 | 33.6% |
| 3-Person Household | 619 | 17.9% |
| 4+ Person Household | 982 | 28.3% |
| Total Housing Units | 3,465 | 100.0% |
Occupancy by Ownership by Household Size in Lowell
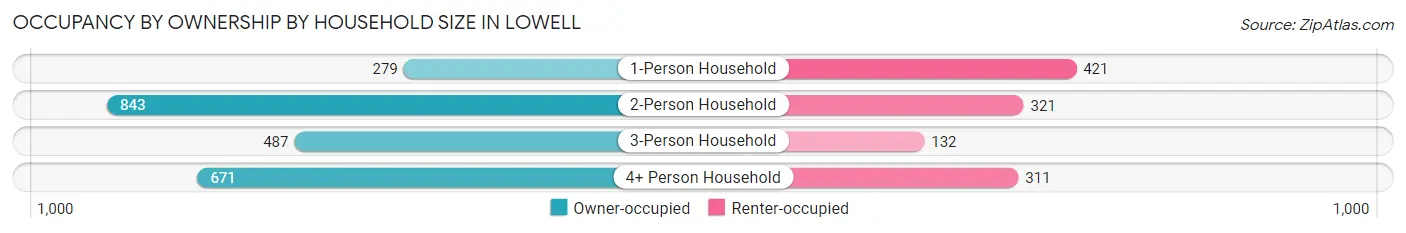
| Household Size | Owner-occupied | Renter-occupied |
| 1-Person Household | 279 (39.9%) | 421 (60.1%) |
| 2-Person Household | 843 (72.4%) | 321 (27.6%) |
| 3-Person Household | 487 (78.7%) | 132 (21.3%) |
| 4+ Person Household | 671 (68.3%) | 311 (31.7%) |
| Total Housing Units | 2,280 (65.8%) | 1,185 (34.2%) |
Occupancy by Educational Attainment in Lowell
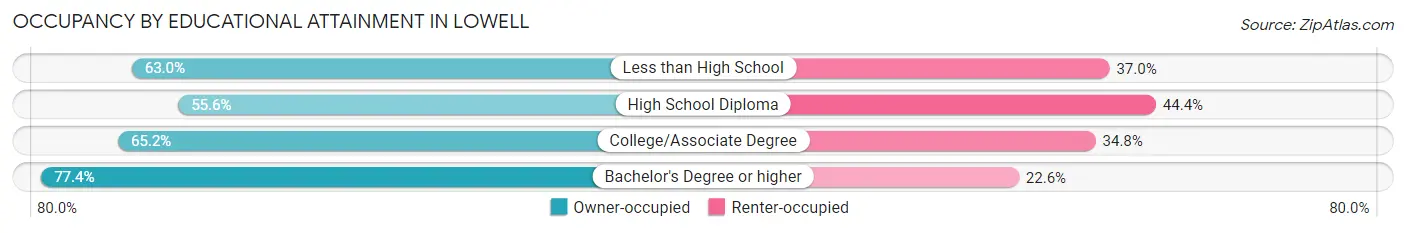
| Household Size | Owner-occupied | Renter-occupied |
| Less than High School | 274 (63.0%) | 161 (37.0%) |
| High School Diploma | 563 (55.6%) | 449 (44.4%) |
| College/Associate Degree | 633 (65.2%) | 338 (34.8%) |
| Bachelor's Degree or higher | 810 (77.4%) | 237 (22.6%) |
Occupancy by Age of Householder in Lowell
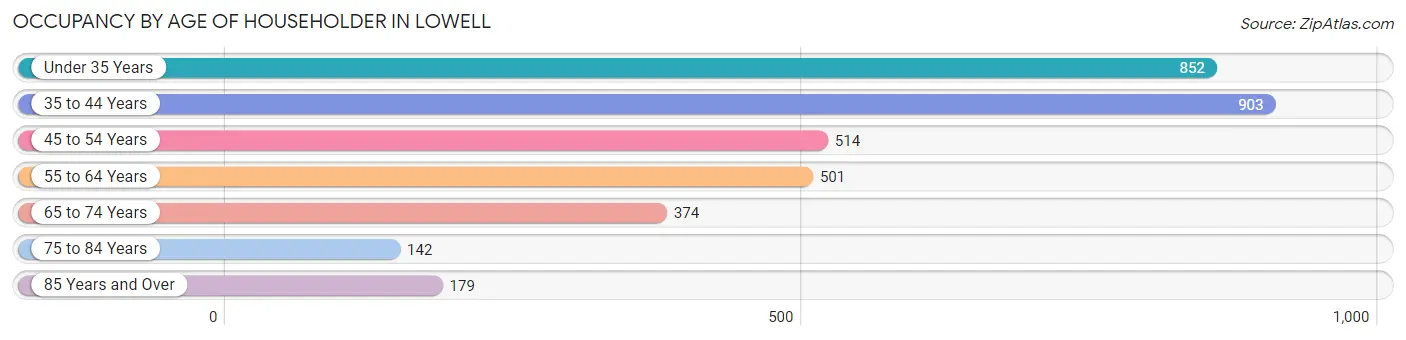
| Age Bracket | # Households | % Households |
| Under 35 Years | 852 | 24.6% |
| 35 to 44 Years | 903 | 26.1% |
| 45 to 54 Years | 514 | 14.8% |
| 55 to 64 Years | 501 | 14.5% |
| 65 to 74 Years | 374 | 10.8% |
| 75 to 84 Years | 142 | 4.1% |
| 85 Years and Over | 179 | 5.2% |
| Total | 3,465 | 100.0% |
Housing Finances in Lowell
Median Income by Occupancy in Lowell
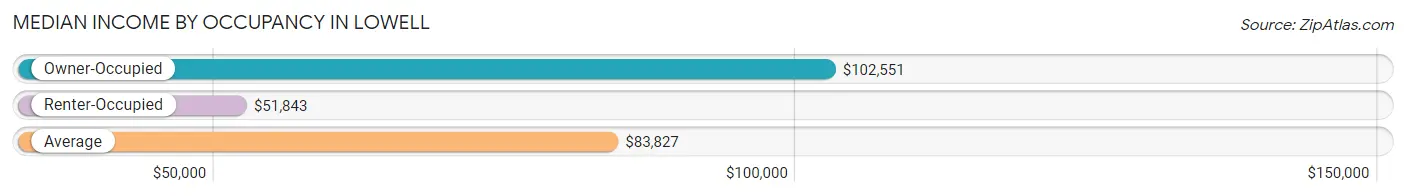
| Occupancy Type | # Households | Median Income |
| Owner-Occupied | 2,280 (65.8%) | $102,551 |
| Renter-Occupied | 1,185 (34.2%) | $51,843 |
| Average | 3,465 (100.0%) | $83,827 |
Occupancy by Householder Income Bracket in Lowell
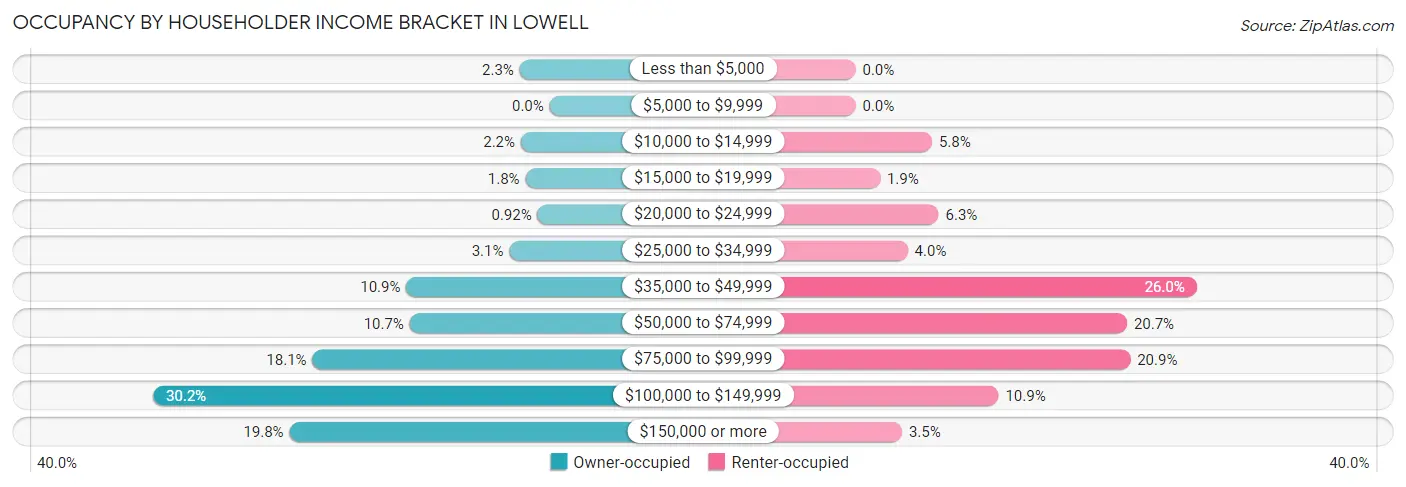
| Income Bracket | Owner-occupied | Renter-occupied |
| Less than $5,000 | 52 (2.3%) | 0 (0.0%) |
| $5,000 to $9,999 | 0 (0.0%) | 0 (0.0%) |
| $10,000 to $14,999 | 50 (2.2%) | 69 (5.8%) |
| $15,000 to $19,999 | 42 (1.8%) | 22 (1.9%) |
| $20,000 to $24,999 | 21 (0.9%) | 75 (6.3%) |
| $25,000 to $34,999 | 70 (3.1%) | 47 (4.0%) |
| $35,000 to $49,999 | 249 (10.9%) | 308 (26.0%) |
| $50,000 to $74,999 | 243 (10.7%) | 245 (20.7%) |
| $75,000 to $99,999 | 412 (18.1%) | 248 (20.9%) |
| $100,000 to $149,999 | 689 (30.2%) | 129 (10.9%) |
| $150,000 or more | 452 (19.8%) | 42 (3.5%) |
| Total | 2,280 (100.0%) | 1,185 (100.0%) |
Monthly Housing Cost Tiers in Lowell
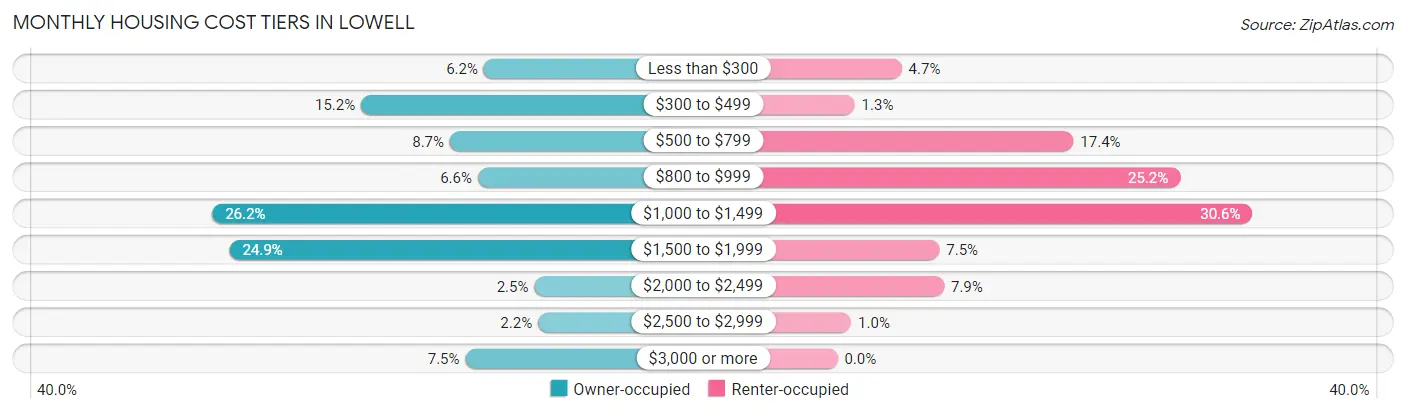
| Monthly Cost | Owner-occupied | Renter-occupied |
| Less than $300 | 141 (6.2%) | 56 (4.7%) |
| $300 to $499 | 347 (15.2%) | 15 (1.3%) |
| $500 to $799 | 198 (8.7%) | 206 (17.4%) |
| $800 to $999 | 151 (6.6%) | 299 (25.2%) |
| $1,000 to $1,499 | 597 (26.2%) | 362 (30.5%) |
| $1,500 to $1,999 | 568 (24.9%) | 89 (7.5%) |
| $2,000 to $2,499 | 56 (2.5%) | 93 (7.9%) |
| $2,500 to $2,999 | 50 (2.2%) | 12 (1.0%) |
| $3,000 or more | 172 (7.5%) | 0 (0.0%) |
| Total | 2,280 (100.0%) | 1,185 (100.0%) |
Physical Housing Characteristics in Lowell
Housing Structures in Lowell
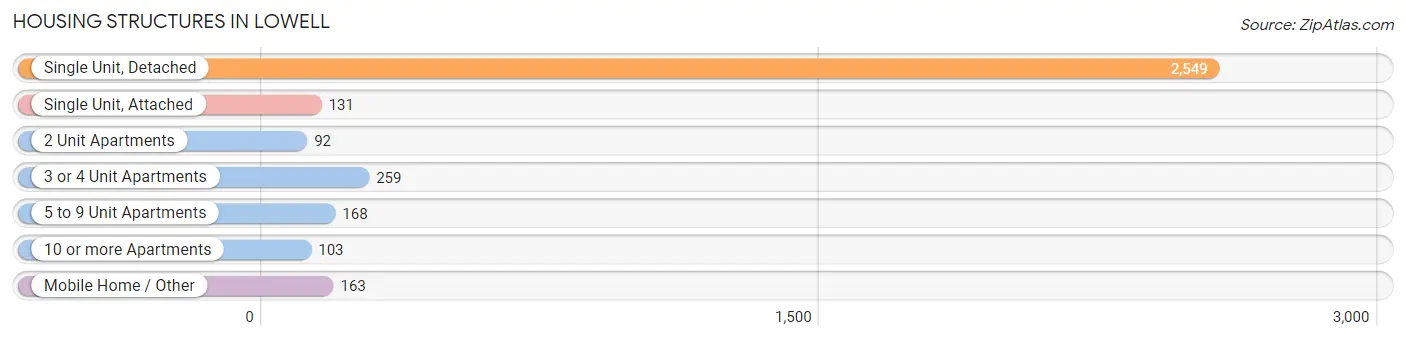
| Structure Type | # Housing Units | % Housing Units |
| Single Unit, Detached | 2,549 | 73.6% |
| Single Unit, Attached | 131 | 3.8% |
| 2 Unit Apartments | 92 | 2.7% |
| 3 or 4 Unit Apartments | 259 | 7.5% |
| 5 to 9 Unit Apartments | 168 | 4.9% |
| 10 or more Apartments | 103 | 3.0% |
| Mobile Home / Other | 163 | 4.7% |
| Total | 3,465 | 100.0% |
Housing Structures by Occupancy in Lowell
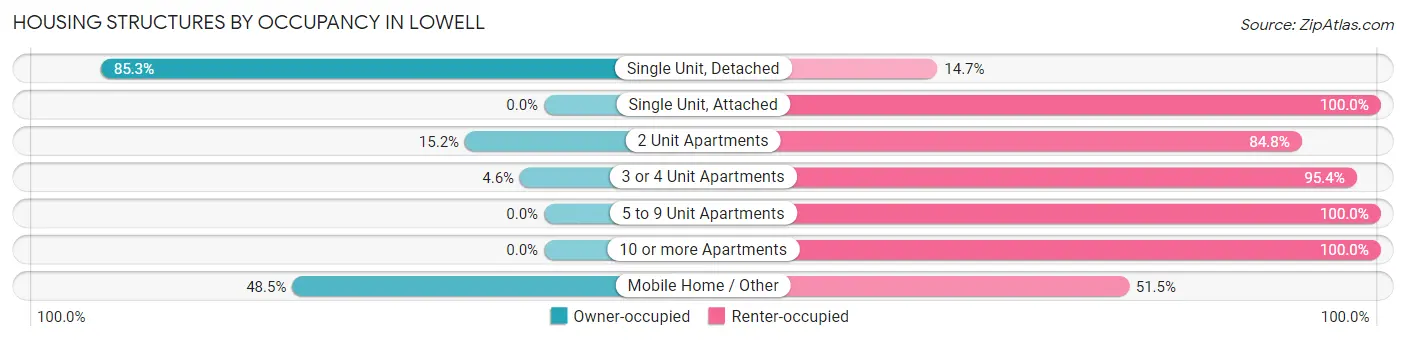
| Structure Type | Owner-occupied | Renter-occupied |
| Single Unit, Detached | 2,175 (85.3%) | 374 (14.7%) |
| Single Unit, Attached | 0 (0.0%) | 131 (100.0%) |
| 2 Unit Apartments | 14 (15.2%) | 78 (84.8%) |
| 3 or 4 Unit Apartments | 12 (4.6%) | 247 (95.4%) |
| 5 to 9 Unit Apartments | 0 (0.0%) | 168 (100.0%) |
| 10 or more Apartments | 0 (0.0%) | 103 (100.0%) |
| Mobile Home / Other | 79 (48.5%) | 84 (51.5%) |
| Total | 2,280 (65.8%) | 1,185 (34.2%) |
Housing Structures by Number of Rooms in Lowell
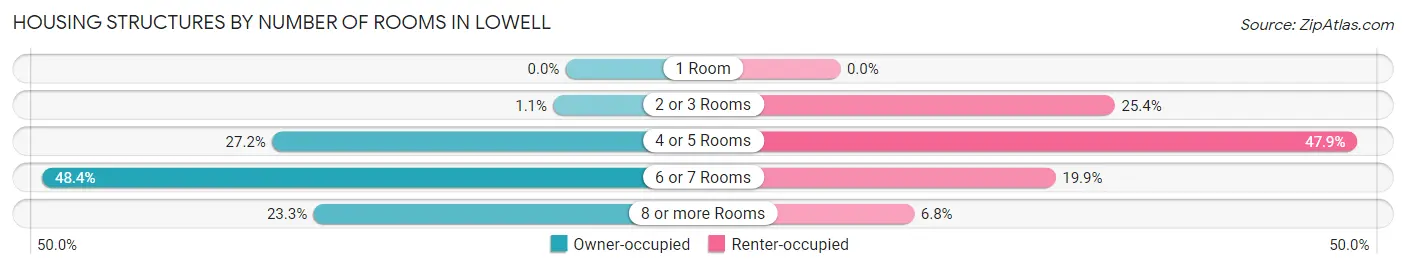
| Number of Rooms | Owner-occupied | Renter-occupied |
| 1 Room | 0 (0.0%) | 0 (0.0%) |
| 2 or 3 Rooms | 26 (1.1%) | 301 (25.4%) |
| 4 or 5 Rooms | 619 (27.2%) | 567 (47.8%) |
| 6 or 7 Rooms | 1,103 (48.4%) | 236 (19.9%) |
| 8 or more Rooms | 532 (23.3%) | 81 (6.8%) |
| Total | 2,280 (100.0%) | 1,185 (100.0%) |
Housing Structure by Heating Type in Lowell
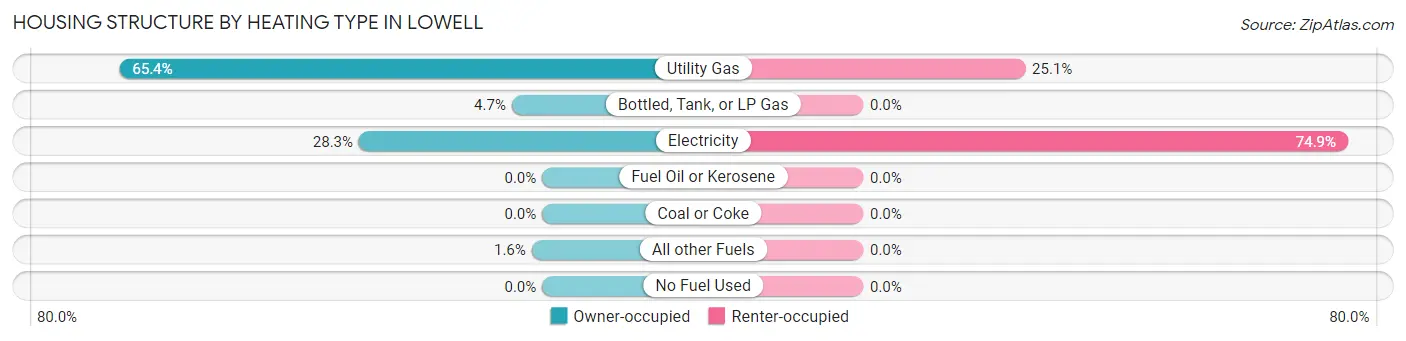
| Heating Type | Owner-occupied | Renter-occupied |
| Utility Gas | 1,490 (65.3%) | 297 (25.1%) |
| Bottled, Tank, or LP Gas | 107 (4.7%) | 0 (0.0%) |
| Electricity | 646 (28.3%) | 888 (74.9%) |
| Fuel Oil or Kerosene | 0 (0.0%) | 0 (0.0%) |
| Coal or Coke | 0 (0.0%) | 0 (0.0%) |
| All other Fuels | 37 (1.6%) | 0 (0.0%) |
| No Fuel Used | 0 (0.0%) | 0 (0.0%) |
| Total | 2,280 (100.0%) | 1,185 (100.0%) |
Household Vehicle Usage in Lowell
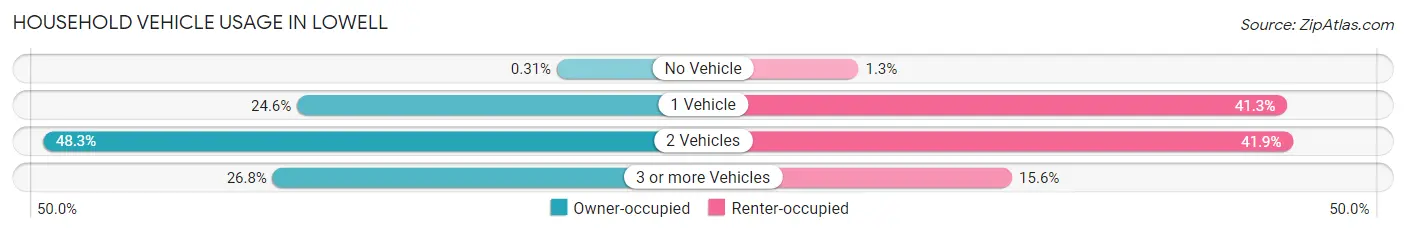
| Vehicles per Household | Owner-occupied | Renter-occupied |
| No Vehicle | 7 (0.3%) | 15 (1.3%) |
| 1 Vehicle | 560 (24.6%) | 489 (41.3%) |
| 2 Vehicles | 1,101 (48.3%) | 496 (41.9%) |
| 3 or more Vehicles | 612 (26.8%) | 185 (15.6%) |
| Total | 2,280 (100.0%) | 1,185 (100.0%) |
Real Estate & Mortgages in Lowell
Real Estate and Mortgage Overview in Lowell
| Characteristic | Without Mortgage | With Mortgage |
| Housing Units | 665 | 1,615 |
| Median Property Value | $154,500 | $242,600 |
| Median Household Income | $61,094 | $363 |
| Monthly Housing Costs | $421 | $172 |
| Real Estate Taxes | $1,279 | $67 |
Property Value by Mortgage Status in Lowell
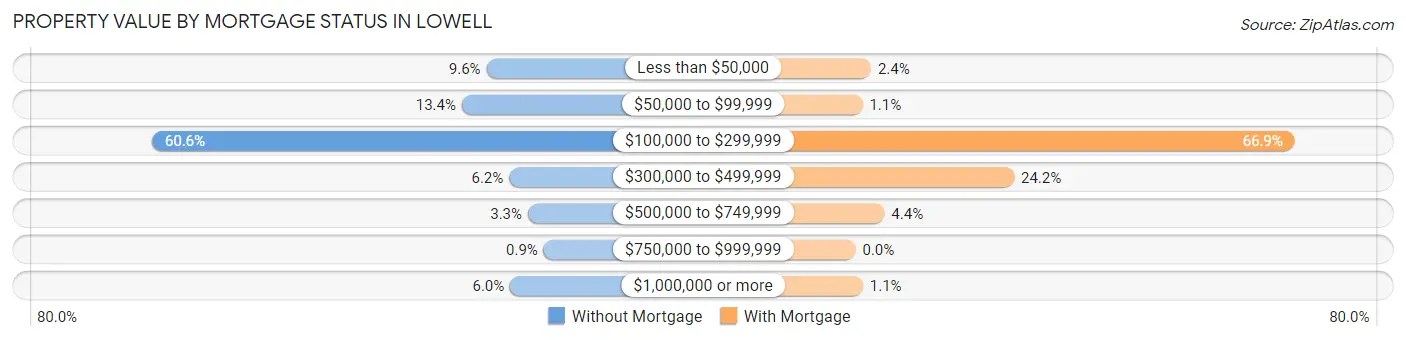
| Property Value | Without Mortgage | With Mortgage |
| Less than $50,000 | 64 (9.6%) | 38 (2.4%) |
| $50,000 to $99,999 | 89 (13.4%) | 17 (1.1%) |
| $100,000 to $299,999 | 403 (60.6%) | 1,081 (66.9%) |
| $300,000 to $499,999 | 41 (6.2%) | 390 (24.1%) |
| $500,000 to $749,999 | 22 (3.3%) | 71 (4.4%) |
| $750,000 to $999,999 | 6 (0.9%) | 0 (0.0%) |
| $1,000,000 or more | 40 (6.0%) | 18 (1.1%) |
| Total | 665 (100.0%) | 1,615 (100.0%) |
Household Income by Mortgage Status in Lowell
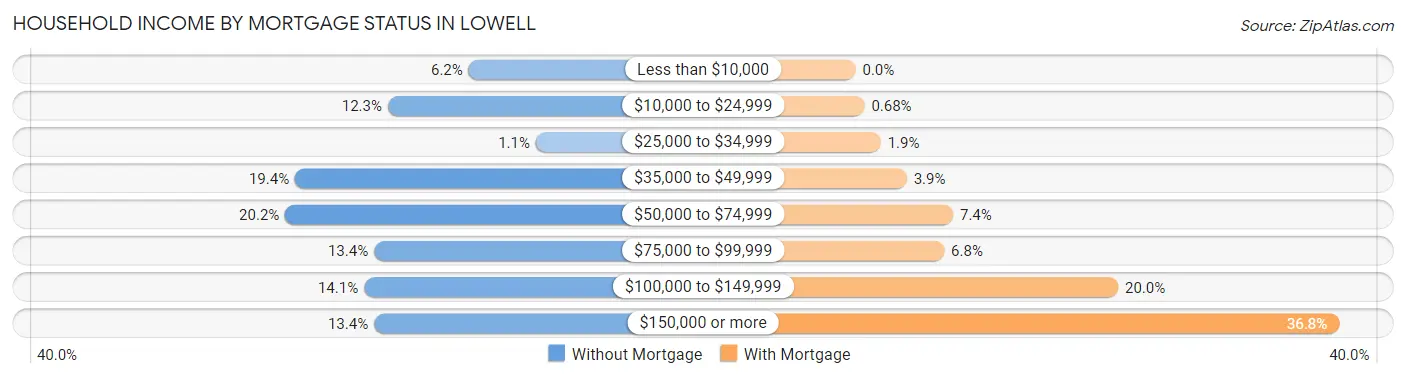
| Household Income | Without Mortgage | With Mortgage |
| Less than $10,000 | 41 (6.2%) | 0 (0.0%) |
| $10,000 to $24,999 | 82 (12.3%) | 11 (0.7%) |
| $25,000 to $34,999 | 7 (1.1%) | 31 (1.9%) |
| $35,000 to $49,999 | 129 (19.4%) | 63 (3.9%) |
| $50,000 to $74,999 | 134 (20.2%) | 120 (7.4%) |
| $75,000 to $99,999 | 89 (13.4%) | 109 (6.8%) |
| $100,000 to $149,999 | 94 (14.1%) | 323 (20.0%) |
| $150,000 or more | 89 (13.4%) | 595 (36.8%) |
| Total | 665 (100.0%) | 1,615 (100.0%) |
Property Value to Household Income Ratio in Lowell
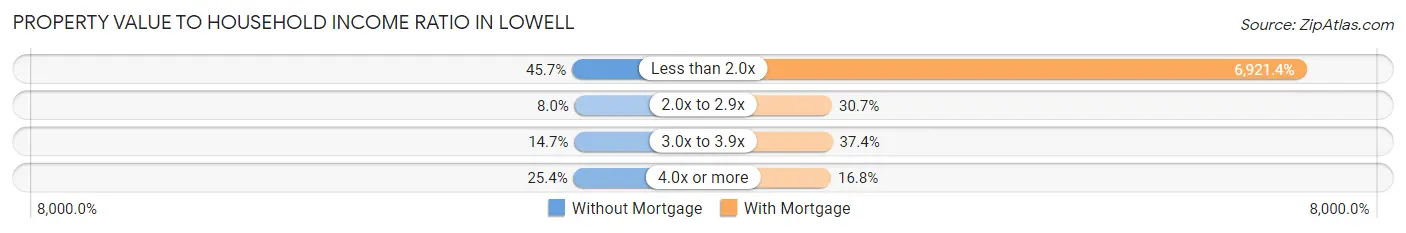
| Value-to-Income Ratio | Without Mortgage | With Mortgage |
| Less than 2.0x | 304 (45.7%) | 111,780 (6,921.4%) |
| 2.0x to 2.9x | 53 (8.0%) | 496 (30.7%) |
| 3.0x to 3.9x | 98 (14.7%) | 604 (37.4%) |
| 4.0x or more | 169 (25.4%) | 271 (16.8%) |
| Total | 665 (100.0%) | 1,615 (100.0%) |
Real Estate Taxes by Mortgage Status in Lowell
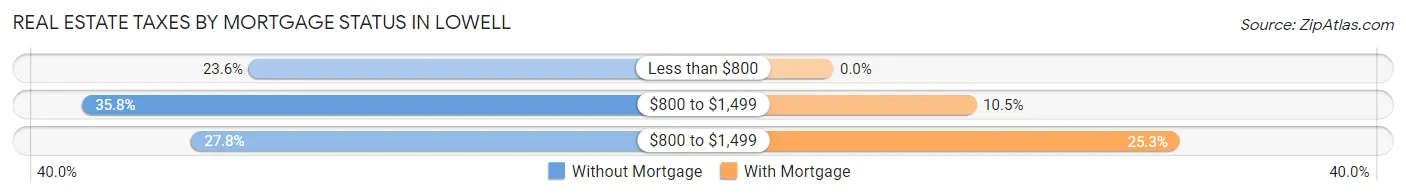
| Property Taxes | Without Mortgage | With Mortgage |
| Less than $800 | 157 (23.6%) | 0 (0.0%) |
| $800 to $1,499 | 238 (35.8%) | 169 (10.5%) |
| $800 to $1,499 | 185 (27.8%) | 409 (25.3%) |
| Total | 665 (100.0%) | 1,615 (100.0%) |
Health & Disability in Lowell
Health Insurance Coverage by Age in Lowell
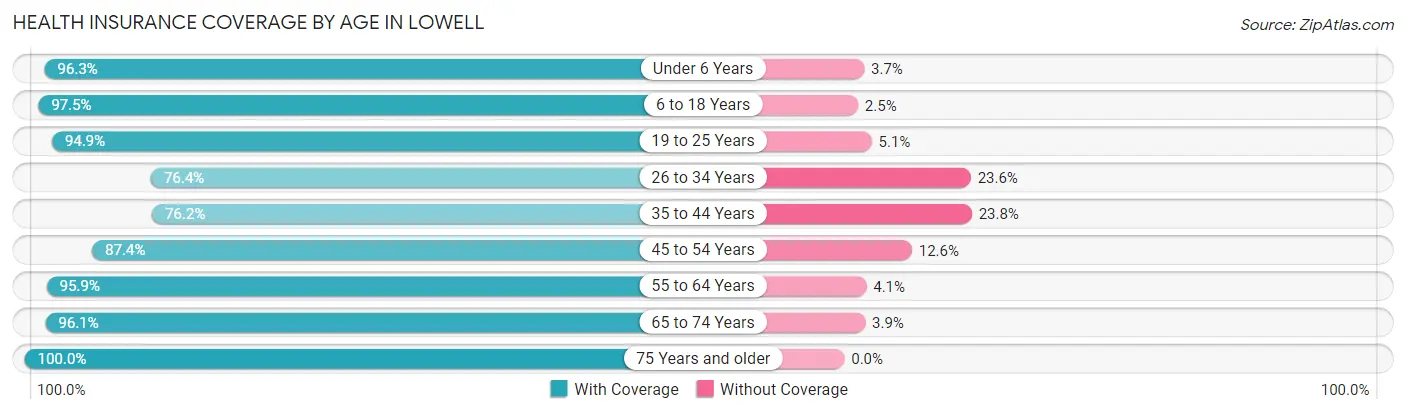
| Age Bracket | With Coverage | Without Coverage |
| Under 6 Years | 989 (96.3%) | 38 (3.7%) |
| 6 to 18 Years | 1,882 (97.5%) | 49 (2.5%) |
| 19 to 25 Years | 839 (94.9%) | 45 (5.1%) |
| 26 to 34 Years | 973 (76.4%) | 300 (23.6%) |
| 35 to 44 Years | 1,139 (76.2%) | 355 (23.8%) |
| 45 to 54 Years | 993 (87.4%) | 143 (12.6%) |
| 55 to 64 Years | 936 (95.9%) | 40 (4.1%) |
| 65 to 74 Years | 843 (96.1%) | 34 (3.9%) |
| 75 Years and older | 407 (100.0%) | 0 (0.0%) |
| Total | 9,001 (90.0%) | 1,004 (10.0%) |
Health Insurance Coverage by Citizenship Status in Lowell
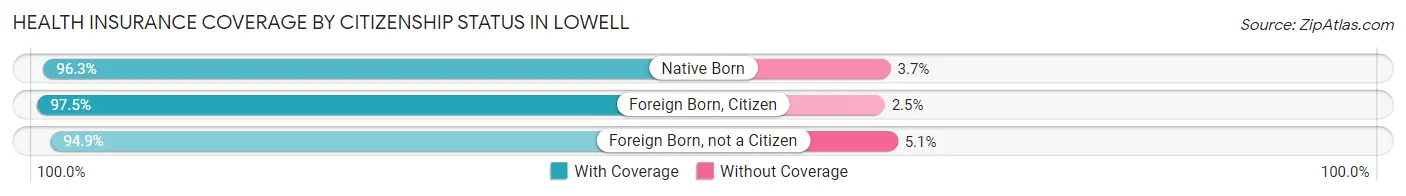
| Citizenship Status | With Coverage | Without Coverage |
| Native Born | 989 (96.3%) | 38 (3.7%) |
| Foreign Born, Citizen | 1,882 (97.5%) | 49 (2.5%) |
| Foreign Born, not a Citizen | 839 (94.9%) | 45 (5.1%) |
Health Insurance Coverage by Household Income in Lowell
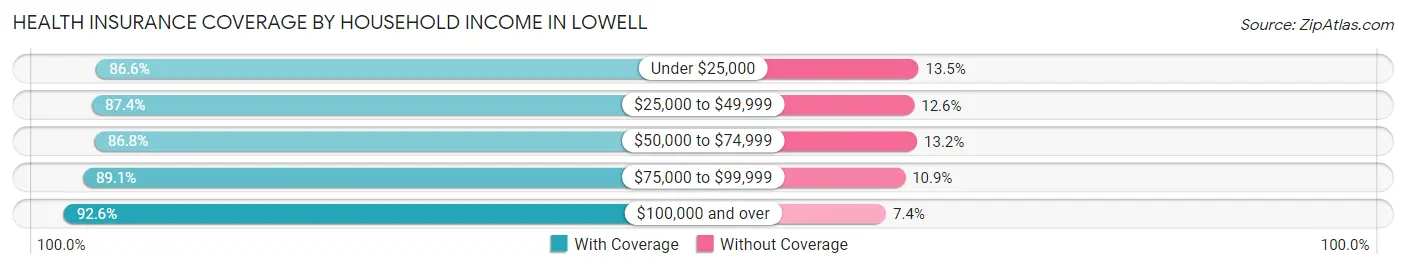
| Household Income | With Coverage | Without Coverage |
| Under $25,000 | 444 (86.6%) | 69 (13.5%) |
| $25,000 to $49,999 | 1,714 (87.4%) | 248 (12.6%) |
| $50,000 to $74,999 | 1,088 (86.8%) | 165 (13.2%) |
| $75,000 to $99,999 | 1,490 (89.1%) | 183 (10.9%) |
| $100,000 and over | 4,265 (92.6%) | 339 (7.4%) |
Public vs Private Health Insurance Coverage by Age in Lowell
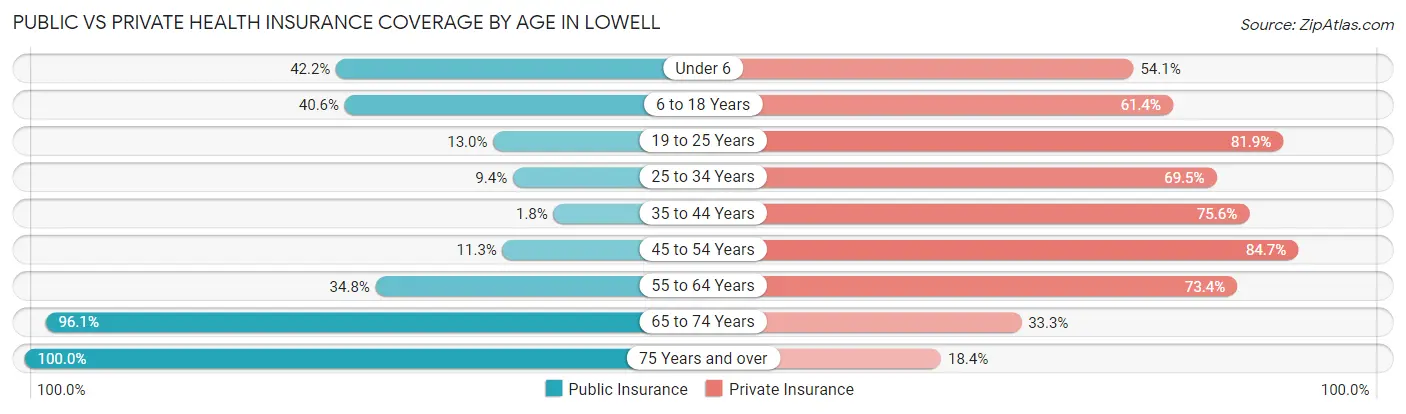
| Age Bracket | Public Insurance | Private Insurance |
| Under 6 | 433 (42.2%) | 556 (54.1%) |
| 6 to 18 Years | 783 (40.6%) | 1,186 (61.4%) |
| 19 to 25 Years | 115 (13.0%) | 724 (81.9%) |
| 25 to 34 Years | 119 (9.3%) | 885 (69.5%) |
| 35 to 44 Years | 27 (1.8%) | 1,129 (75.6%) |
| 45 to 54 Years | 128 (11.3%) | 962 (84.7%) |
| 55 to 64 Years | 340 (34.8%) | 716 (73.4%) |
| 65 to 74 Years | 843 (96.1%) | 292 (33.3%) |
| 75 Years and over | 407 (100.0%) | 75 (18.4%) |
| Total | 3,195 (31.9%) | 6,525 (65.2%) |
Disability Status by Sex by Age in Lowell
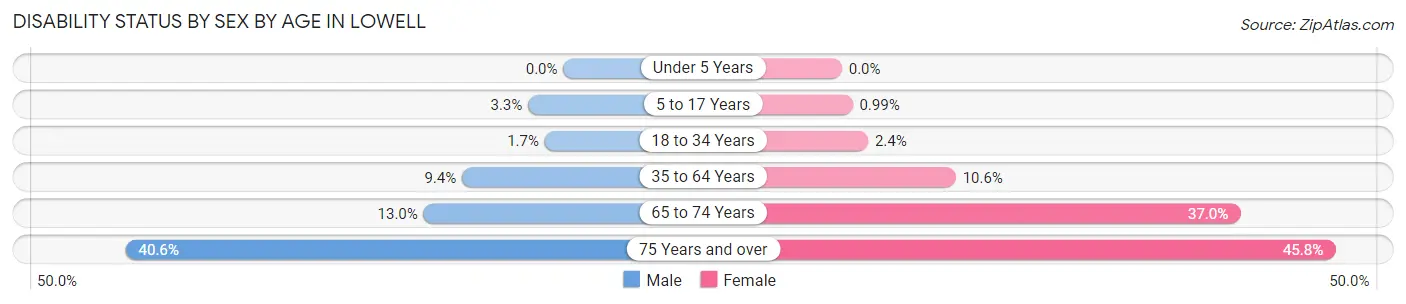
| Age Bracket | Male | Female |
| Under 5 Years | 0 (0.0%) | 0 (0.0%) |
| 5 to 17 Years | 27 (3.3%) | 11 (1.0%) |
| 18 to 34 Years | 18 (1.7%) | 31 (2.4%) |
| 35 to 64 Years | 186 (9.4%) | 172 (10.6%) |
| 65 to 74 Years | 66 (13.0%) | 136 (37.0%) |
| 75 Years and over | 26 (40.6%) | 157 (45.8%) |
Disability Class by Sex by Age in Lowell
Disability Class: Hearing Difficulty
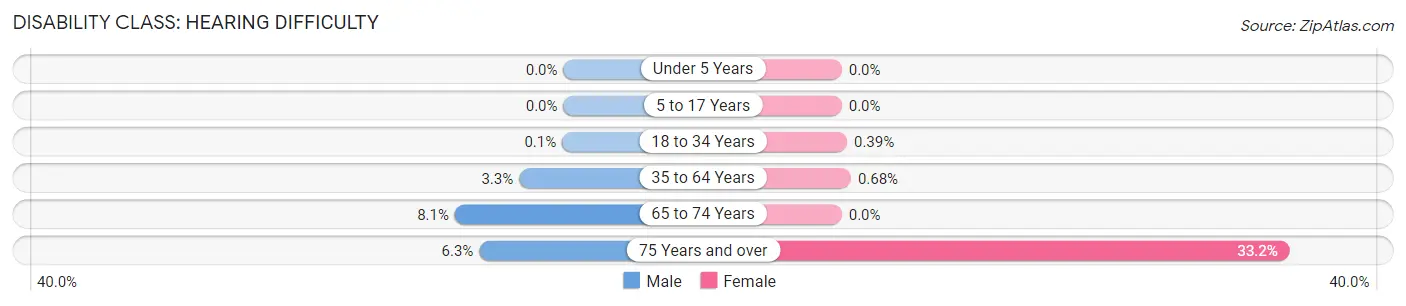
| Age Bracket | Male | Female |
| Under 5 Years | 0 (0.0%) | 0 (0.0%) |
| 5 to 17 Years | 0 (0.0%) | 0 (0.0%) |
| 18 to 34 Years | 1 (0.1%) | 5 (0.4%) |
| 35 to 64 Years | 65 (3.3%) | 11 (0.7%) |
| 65 to 74 Years | 41 (8.1%) | 0 (0.0%) |
| 75 Years and over | 4 (6.2%) | 114 (33.2%) |
Disability Class: Vision Difficulty
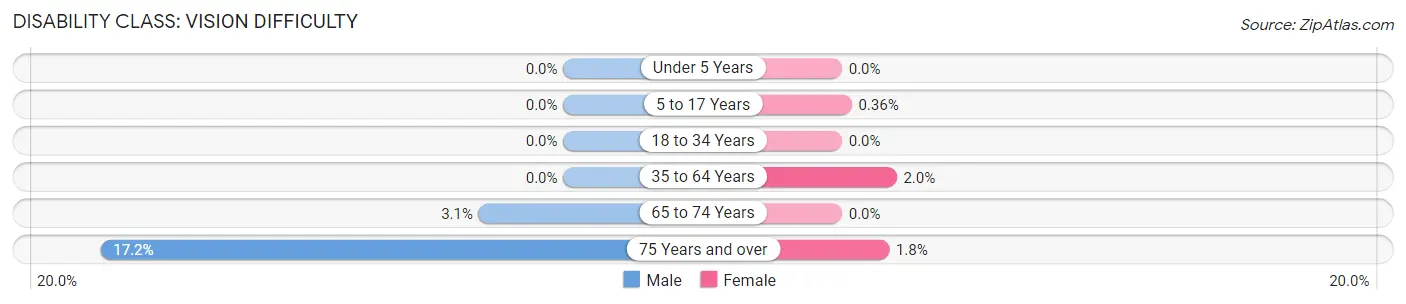
| Age Bracket | Male | Female |
| Under 5 Years | 0 (0.0%) | 0 (0.0%) |
| 5 to 17 Years | 0 (0.0%) | 4 (0.4%) |
| 18 to 34 Years | 0 (0.0%) | 0 (0.0%) |
| 35 to 64 Years | 0 (0.0%) | 33 (2.0%) |
| 65 to 74 Years | 16 (3.1%) | 0 (0.0%) |
| 75 Years and over | 11 (17.2%) | 6 (1.8%) |
Disability Class: Cognitive Difficulty
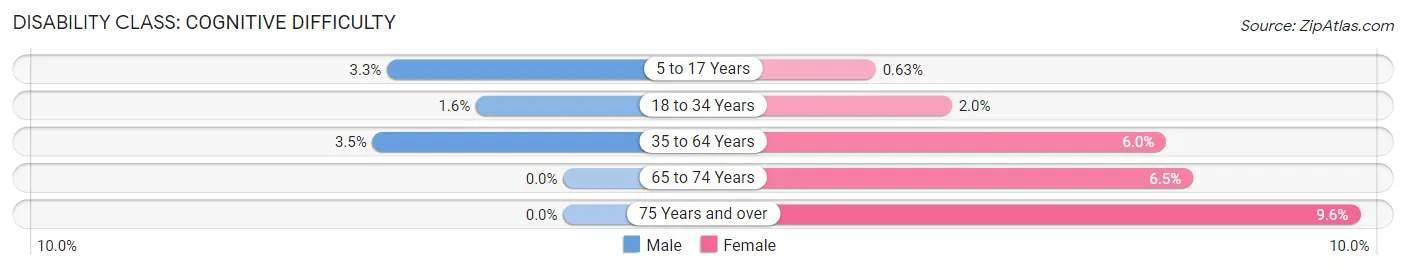
| Age Bracket | Male | Female |
| 5 to 17 Years | 27 (3.3%) | 7 (0.6%) |
| 18 to 34 Years | 17 (1.6%) | 26 (2.0%) |
| 35 to 64 Years | 70 (3.5%) | 98 (6.0%) |
| 65 to 74 Years | 0 (0.0%) | 24 (6.5%) |
| 75 Years and over | 0 (0.0%) | 33 (9.6%) |
Disability Class: Ambulatory Difficulty
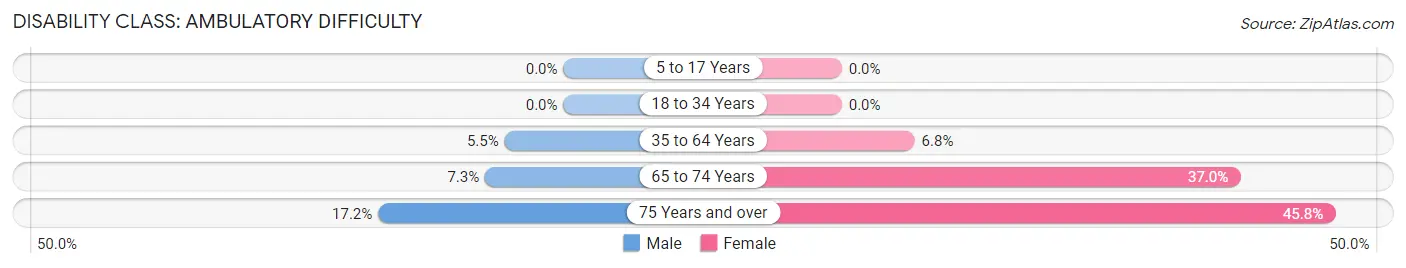
| Age Bracket | Male | Female |
| 5 to 17 Years | 0 (0.0%) | 0 (0.0%) |
| 18 to 34 Years | 0 (0.0%) | 0 (0.0%) |
| 35 to 64 Years | 108 (5.5%) | 110 (6.8%) |
| 65 to 74 Years | 37 (7.3%) | 136 (37.0%) |
| 75 Years and over | 11 (17.2%) | 157 (45.8%) |
Disability Class: Self-Care Difficulty
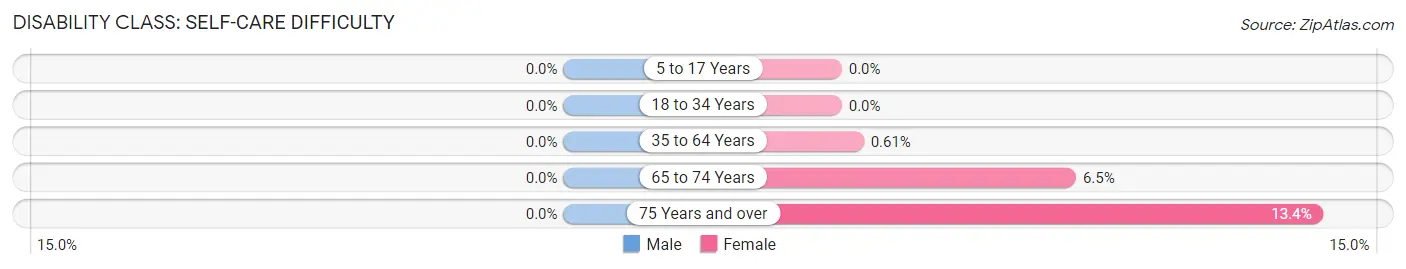
| Age Bracket | Male | Female |
| 5 to 17 Years | 0 (0.0%) | 0 (0.0%) |
| 18 to 34 Years | 0 (0.0%) | 0 (0.0%) |
| 35 to 64 Years | 0 (0.0%) | 10 (0.6%) |
| 65 to 74 Years | 0 (0.0%) | 24 (6.5%) |
| 75 Years and over | 0 (0.0%) | 46 (13.4%) |
Technology Access in Lowell
Computing Device Access in Lowell
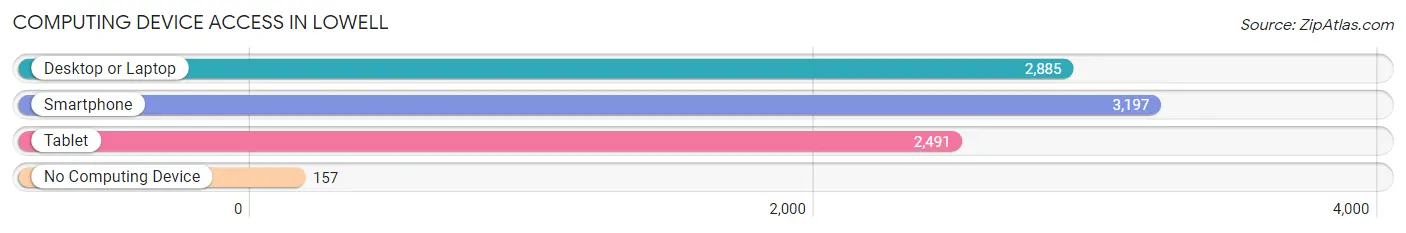
| Device Type | # Households | % Households |
| Desktop or Laptop | 2,885 | 83.3% |
| Smartphone | 3,197 | 92.3% |
| Tablet | 2,491 | 71.9% |
| No Computing Device | 157 | 4.5% |
| Total | 3,465 | 100.0% |
Internet Access in Lowell
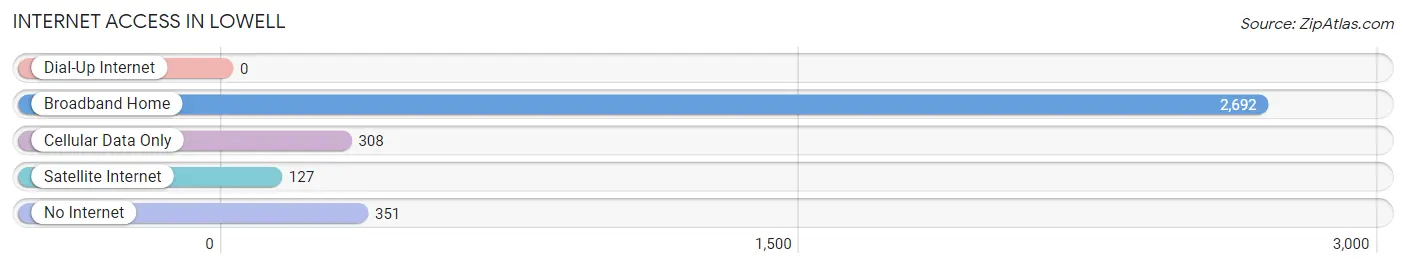
| Internet Type | # Households | % Households |
| Dial-Up Internet | 0 | 0.0% |
| Broadband Home | 2,692 | 77.7% |
| Cellular Data Only | 308 | 8.9% |
| Satellite Internet | 127 | 3.7% |
| No Internet | 351 | 10.1% |
| Total | 3,465 | 100.0% |
Lowell Summary
Lowell, Arkansas is a city located in Benton County in the northwest corner of the state. It is part of the Fayetteville-Springdale-Rogers Metropolitan Statistical Area and is the county seat of Benton County. The city has a population of approximately 8,000 people and is located in the Ozark Mountains.
History
Lowell was founded in 1887 by the St. Louis and San Francisco Railway. The city was named after the railroad's president, James H. Lowell. The city was incorporated in 1891 and was the first city in Benton County to be incorporated.
Lowell was a major center for the timber industry in the late 19th and early 20th centuries. The city was also home to a large number of sawmills and lumber yards. The city was also home to a large number of coal mines, which provided employment for many of the city's residents.
Geography
Lowell is located in the northwest corner of Arkansas, in the Ozark Mountains. The city is located at the intersection of Interstate 49 and U.S. Highway 71. The city is located approximately 30 miles north of Fayetteville and approximately 40 miles south of Bentonville.
The city is located in a hilly area and is surrounded by forests. The city is located at an elevation of 1,000 feet above sea level. The city is located in a humid subtropical climate zone and has hot, humid summers and mild winters.
Economy
Lowell's economy is largely based on the timber industry. The city is home to several sawmills and lumber yards. The city is also home to a number of manufacturing companies, including a paper mill, a plastics plant, and a metal fabrication plant.
The city is also home to a number of retail stores, restaurants, and other businesses. The city is also home to a number of medical facilities, including a hospital and several clinics.
Demographics
As of the 2010 census, Lowell had a population of 8,000 people. The city has a median household income of $41,000 and a median family income of $50,000. The city has a poverty rate of 16.3%.
The city is predominantly white, with a population that is 88.3% white, 5.3% Hispanic, 2.3% African American, and 1.3% Asian. The city is also home to a large number of Native Americans, with a population that is 4.3% Native American.
Lowell is a small city with a rich history and a diverse economy. The city is home to a number of businesses and industries, and is a great place to live and work. The city is also home to a number of parks and recreational areas, making it a great place to visit and explore.
Common Questions
What is Per Capita Income in Lowell?
Per Capita income in Lowell is $33,829.
What is the Median Family Income in Lowell?
Median Family Income in Lowell is $91,524.
What is the Median Household income in Lowell?
Median Household Income in Lowell is $83,827.
What is Income or Wage Gap in Lowell?
Income or Wage Gap in Lowell is 23.4%.
Women in Lowell earn 76.6 cents for every dollar earned by a man.
What is Inequality or Gini Index in Lowell?
Inequality or Gini Index in Lowell is 0.39.
What is the Total Population of Lowell?
Total Population of Lowell is 10,005.
What is the Total Male Population of Lowell?
Total Male Population of Lowell is 4,887.
What is the Total Female Population of Lowell?
Total Female Population of Lowell is 5,118.
What is the Ratio of Males per 100 Females in Lowell?
There are 95.49 Males per 100 Females in Lowell.
What is the Ratio of Females per 100 Males in Lowell?
There are 104.73 Females per 100 Males in Lowell.
What is the Median Population Age in Lowell?
Median Population Age in Lowell is 34.2 Years.
What is the Average Family Size in Lowell
Average Family Size in Lowell is 3.3 People.
What is the Average Household Size in Lowell
Average Household Size in Lowell is 2.9 People.
How Large is the Labor Force in Lowell?
There are 4,945 People in the Labor Forcein in Lowell.
What is the Percentage of People in the Labor Force in Lowell?
65.8% of People are in the Labor Force in Lowell.
What is the Unemployment Rate in Lowell?
Unemployment Rate in Lowell is 0.9%.