West Crossett, AR
West Crossett Map
West Crossett Overview
1,196
TOTAL POPULATION
519
MALE POPULATION
677
FEMALE POPULATION
76.66
MALES / 100 FEMALES
130.44
FEMALES / 100 MALES
51.9
MEDIAN AGE
3.3
AVG FAMILY SIZE
2.8
AVG HOUSEHOLD SIZE
$28,533
PER CAPITA INCOME
$62,070
AVG FAMILY INCOME
$58,906
AVG HOUSEHOLD INCOME
34.7%
WAGE / INCOME GAP [ % ]
65.3¢/ $1
WAGE / INCOME GAP [ $ ]
0.45
INEQUALITY / GINI INDEX
443
LABOR FORCE [ PEOPLE ]
48.4%
PERCENT IN LABOR FORCE
2.9%
UNEMPLOYMENT RATE
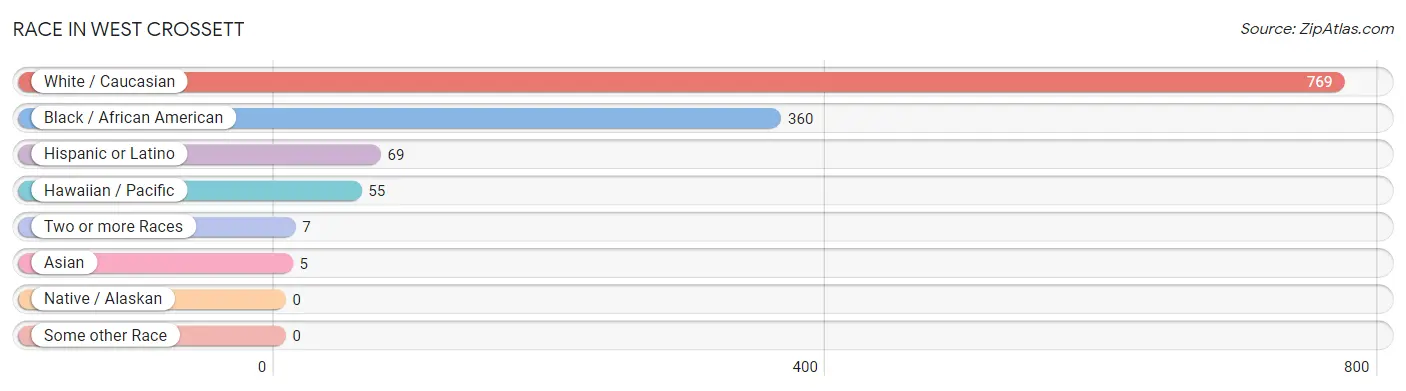
Race in West Crossett
The most populous races in West Crossett are White / Caucasian (769 | 64.3%), Black / African American (360 | 30.1%), and Hispanic or Latino (69 | 5.8%).
| Race | # Population | % Population |
| Asian | 5 | 0.4% |
| Black / African American | 360 | 30.1% |
| Hawaiian / Pacific | 55 | 4.6% |
| Hispanic or Latino | 69 | 5.8% |
| Native / Alaskan | 0 | 0.0% |
| White / Caucasian | 769 | 64.3% |
| Two or more Races | 7 | 0.6% |
| Some other Race | 0 | 0.0% |
| Total | 1,196 | 100.0% |
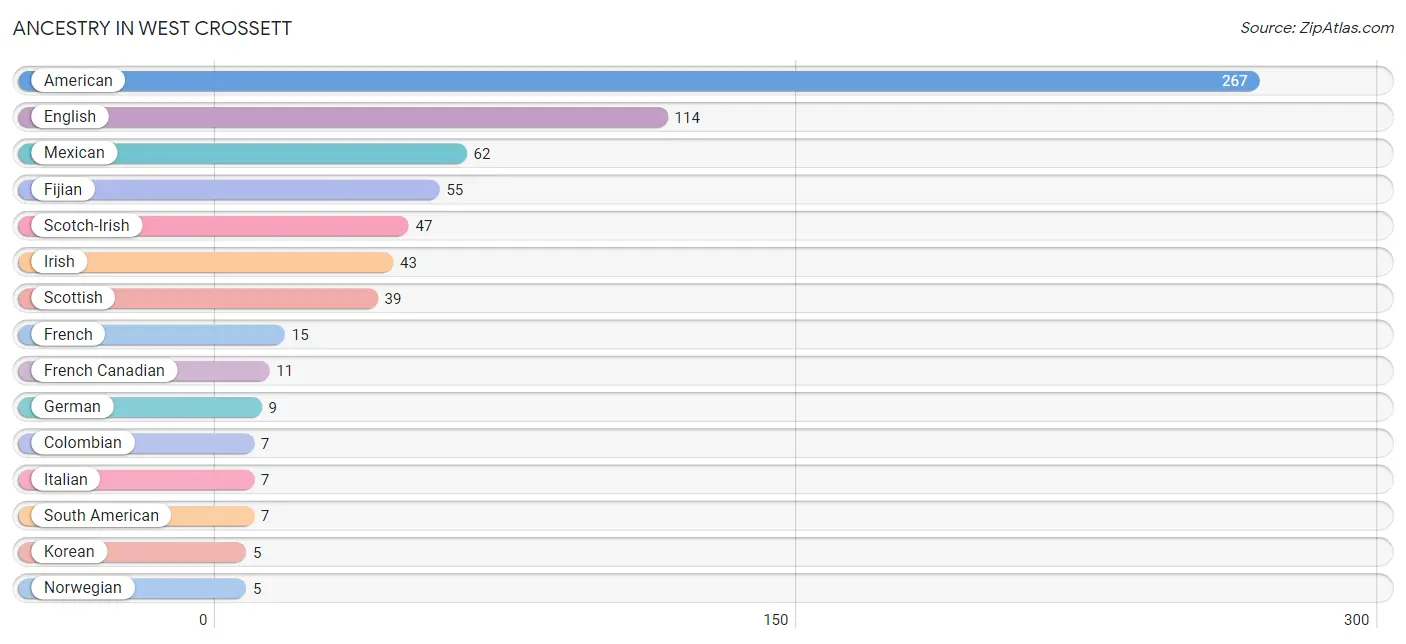
Ancestry in West Crossett
The most populous ancestries reported in West Crossett are American (267 | 22.3%), English (114 | 9.5%), Mexican (62 | 5.2%), Fijian (55 | 4.6%), and Scotch-Irish (47 | 3.9%), together accounting for 45.6% of all West Crossett residents.
| Ancestry | # Population | % Population |
| American | 267 | 22.3% |
| Arab | 4 | 0.3% |
| Colombian | 7 | 0.6% |
| English | 114 | 9.5% |
| Fijian | 55 | 4.6% |
| French | 15 | 1.3% |
| French Canadian | 11 | 0.9% |
| German | 9 | 0.7% |
| Irish | 43 | 3.6% |
| Italian | 7 | 0.6% |
| Korean | 5 | 0.4% |
| Lebanese | 4 | 0.3% |
| Mexican | 62 | 5.2% |
| Norwegian | 5 | 0.4% |
| Polish | 3 | 0.3% |
| Scotch-Irish | 47 | 3.9% |
| Scottish | 39 | 3.3% |
| South American | 7 | 0.6% | View All 18 Rows |
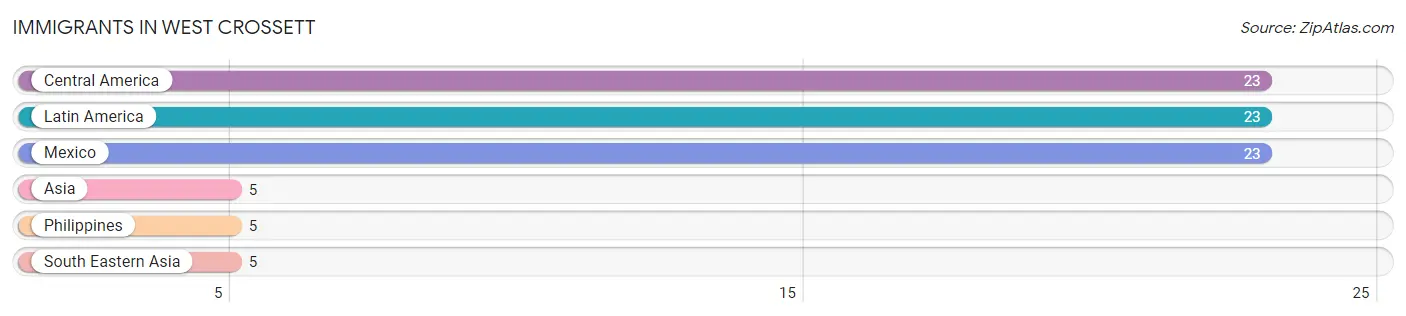
Immigrants in West Crossett
The most numerous immigrant groups reported in West Crossett came from Central America (23 | 1.9%), Latin America (23 | 1.9%), Mexico (23 | 1.9%), Asia (5 | 0.4%), and Philippines (5 | 0.4%), together accounting for 6.6% of all West Crossett residents.
| Immigration Origin | # Population | % Population |
| Asia | 5 | 0.4% |
| Central America | 23 | 1.9% |
| Latin America | 23 | 1.9% |
| Mexico | 23 | 1.9% |
| Philippines | 5 | 0.4% |
| South Eastern Asia | 5 | 0.4% | View All 6 Rows |
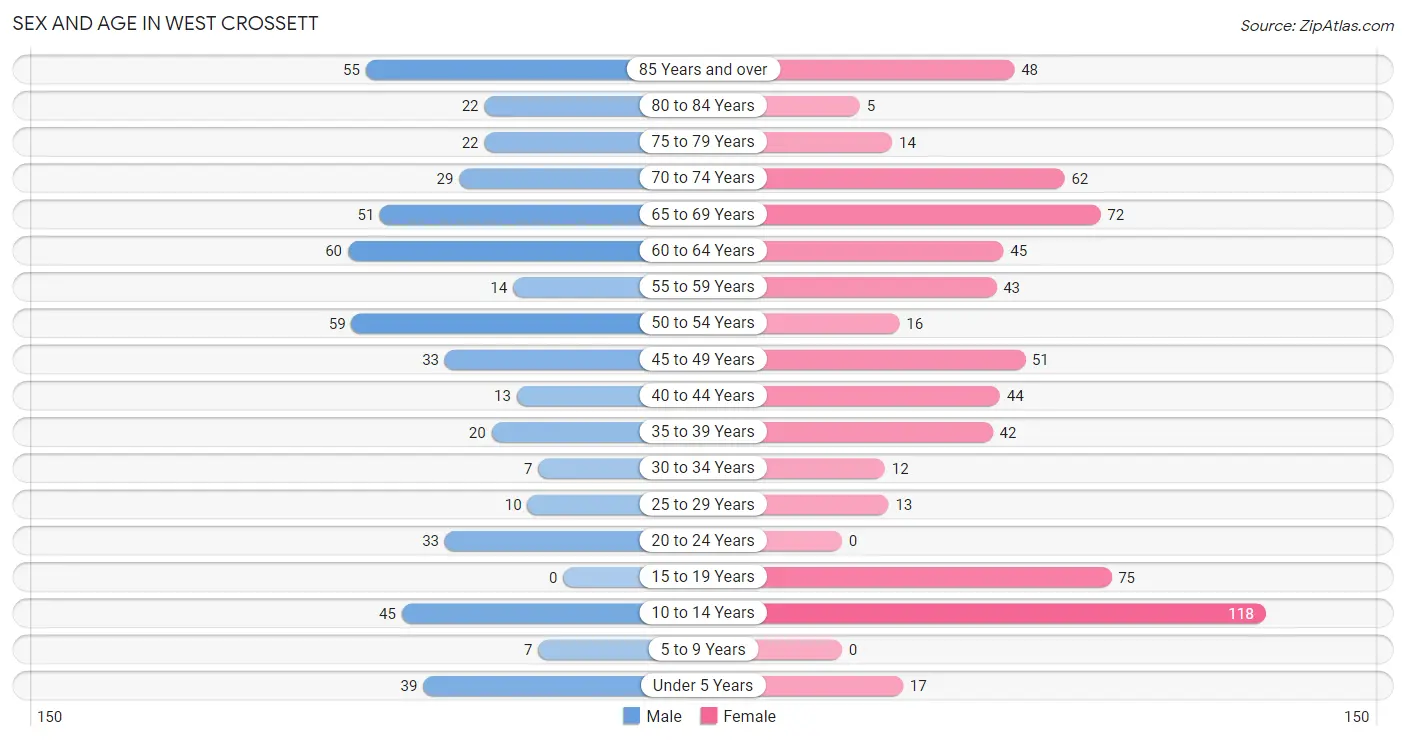
Sex and Age in West Crossett
Sex and Age in West Crossett
The most populous age groups in West Crossett are 60 to 64 Years (60 | 11.6%) for men and 10 to 14 Years (118 | 17.4%) for women.
| Age Bracket | Male | Female |
| Under 5 Years | 39 (7.5%) | 17 (2.5%) |
| 5 to 9 Years | 7 (1.3%) | 0 (0.0%) |
| 10 to 14 Years | 45 (8.7%) | 118 (17.4%) |
| 15 to 19 Years | 0 (0.0%) | 75 (11.1%) |
| 20 to 24 Years | 33 (6.4%) | 0 (0.0%) |
| 25 to 29 Years | 10 (1.9%) | 13 (1.9%) |
| 30 to 34 Years | 7 (1.3%) | 12 (1.8%) |
| 35 to 39 Years | 20 (3.8%) | 42 (6.2%) |
| 40 to 44 Years | 13 (2.5%) | 44 (6.5%) |
| 45 to 49 Years | 33 (6.4%) | 51 (7.5%) |
| 50 to 54 Years | 59 (11.4%) | 16 (2.4%) |
| 55 to 59 Years | 14 (2.7%) | 43 (6.4%) |
| 60 to 64 Years | 60 (11.6%) | 45 (6.7%) |
| 65 to 69 Years | 51 (9.8%) | 72 (10.6%) |
| 70 to 74 Years | 29 (5.6%) | 62 (9.2%) |
| 75 to 79 Years | 22 (4.2%) | 14 (2.1%) |
| 80 to 84 Years | 22 (4.2%) | 5 (0.7%) |
| 85 Years and over | 55 (10.6%) | 48 (7.1%) |
| Total | 519 (100.0%) | 677 (100.0%) |
Families and Households in West Crossett
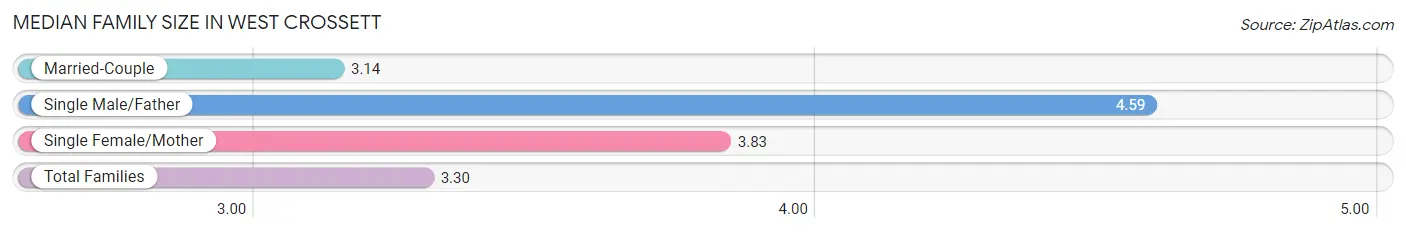
Median Family Size in West Crossett
The median family size in West Crossett is 3.30 persons per family, with single male/father families (17 | 5.0%) accounting for the largest median family size of 4.59 persons per family. On the other hand, married-couple families (279 | 82.8%) represent the smallest median family size with 3.14 persons per family.
| Family Type | # Families | Family Size |
| Married-Couple | 279 (82.8%) | 3.14 |
| Single Male/Father | 17 (5.0%) | 4.59 |
| Single Female/Mother | 41 (12.2%) | 3.83 |
| Total Families | 337 (100.0%) | 3.30 |
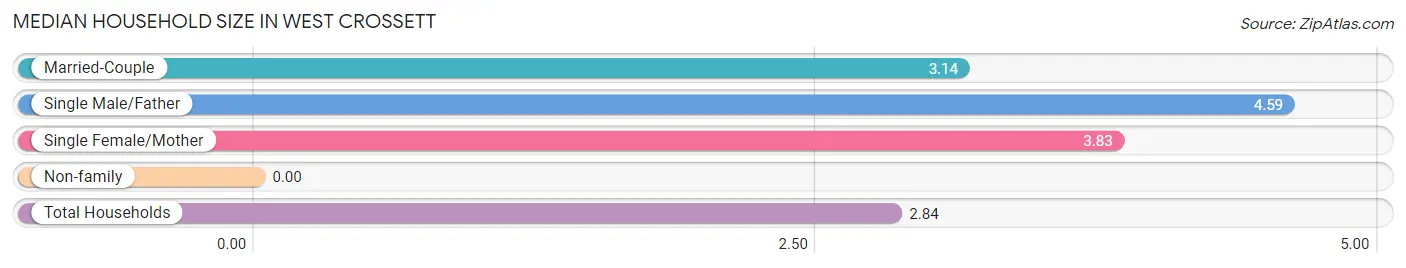
Median Household Size in West Crossett
| Household Type | # Households | Household Size |
| Married-Couple | 279 (66.3%) | 3.14 |
| Single Male/Father | 17 (4.0%) | 4.59 |
| Single Female/Mother | 41 (9.7%) | 3.83 |
| Non-family | 84 (20.0%) | - |
| Total Households | 421 (100.0%) | 2.84 |
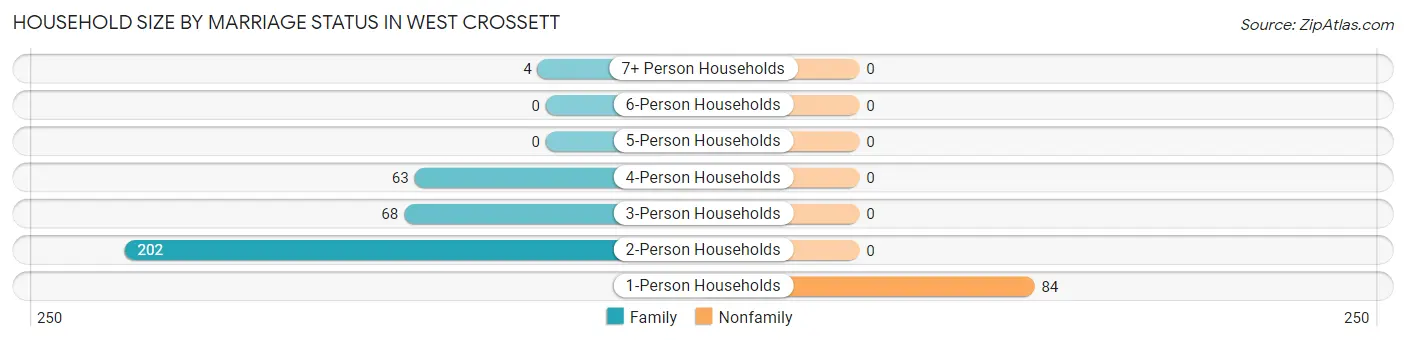
Household Size by Marriage Status in West Crossett
Out of a total of 421 households in West Crossett, 337 (80.0%) are family households, while 84 (20.0%) are nonfamily households. The most numerous type of family households are 2-person households, comprising 202, and the most common type of nonfamily households are 1-person households, comprising 84.
| Household Size | Family Households | Nonfamily Households |
| 1-Person Households | - | 84 (20.0%) |
| 2-Person Households | 202 (48.0%) | 0 (0.0%) |
| 3-Person Households | 68 (16.2%) | 0 (0.0%) |
| 4-Person Households | 63 (15.0%) | 0 (0.0%) |
| 5-Person Households | 0 (0.0%) | 0 (0.0%) |
| 6-Person Households | 0 (0.0%) | 0 (0.0%) |
| 7+ Person Households | 4 (0.9%) | 0 (0.0%) |
| Total | 337 (80.0%) | 84 (20.0%) |
Female Fertility in West Crossett
Fertility by Age in West Crossett
Average fertility rate in West Crossett is 101.0 births per 1,000 women. Women in the age bracket of 35 to 50 years have the highest fertility rate with 175.0 births per 1,000 women. Women in the age bracket of 35 to 50 years acount for 100.0% of all women with births.
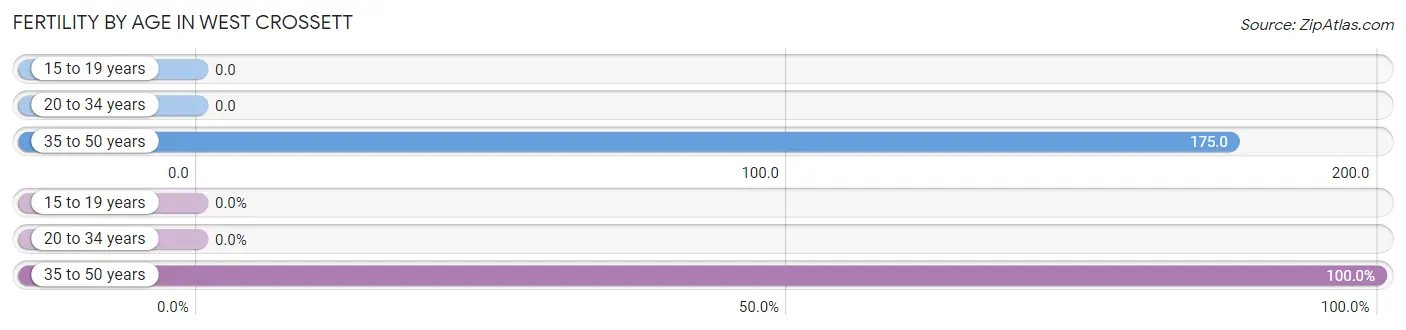
| Age Bracket | Women with Births | Births / 1,000 Women |
| 15 to 19 years | 0 (0.0%) | 0.0 |
| 20 to 34 years | 0 (0.0%) | 0.0 |
| 35 to 50 years | 24 (100.0%) | 175.0 |
| Total | 24 (100.0%) | 101.0 |
Fertility by Age by Marriage Status in West Crossett
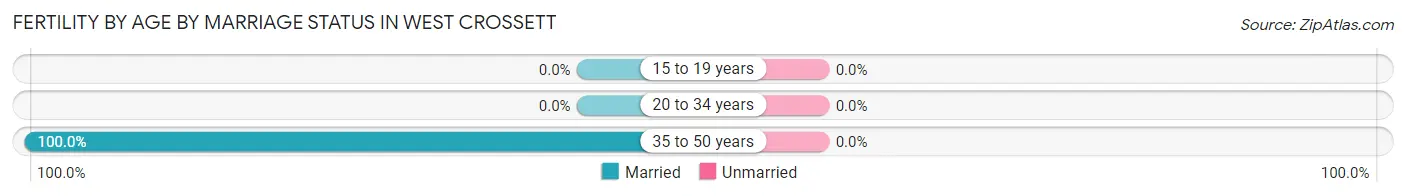
| Age Bracket | Married | Unmarried |
| 15 to 19 years | 0 (0.0%) | 0 (0.0%) |
| 20 to 34 years | 0 (0.0%) | 0 (0.0%) |
| 35 to 50 years | 24 (100.0%) | 0 (0.0%) |
| Total | 24 (100.0%) | 0 (0.0%) |
Fertility by Education in West Crossett
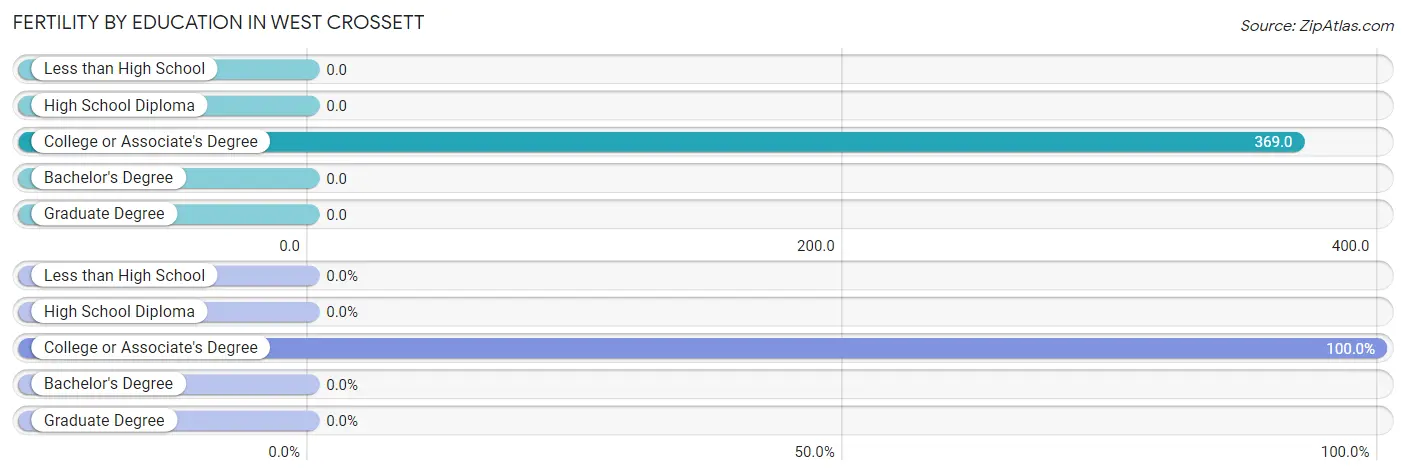
| Educational Attainment | Women with Births | Births / 1,000 Women |
| Less than High School | 0 (0.0%) | 0.0 |
| High School Diploma | 0 (0.0%) | 0.0 |
| College or Associate's Degree | 24 (100.0%) | 369.0 |
| Bachelor's Degree | 0 (0.0%) | 0.0 |
| Graduate Degree | 0 (0.0%) | 0.0 |
| Total | 24 (100.0%) | 101.0 |
Fertility by Education by Marriage Status in West Crossett
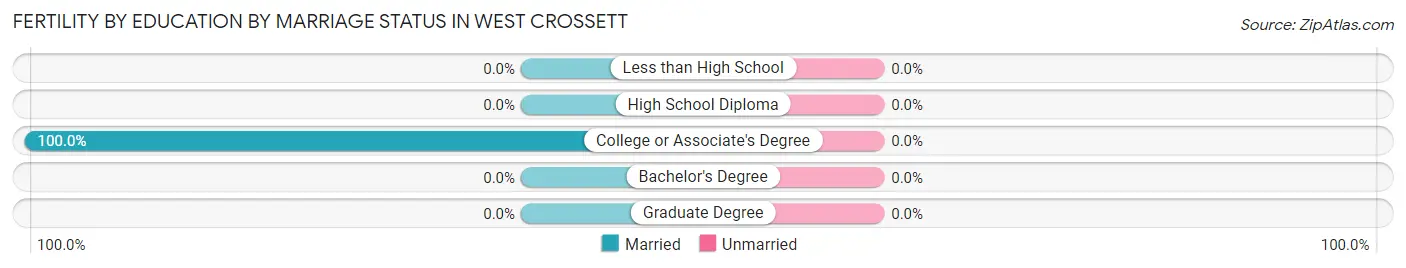
| Educational Attainment | Married | Unmarried |
| Less than High School | 0 (0.0%) | 0 (0.0%) |
| High School Diploma | 0 (0.0%) | 0 (0.0%) |
| College or Associate's Degree | 24 (100.0%) | 0 (0.0%) |
| Bachelor's Degree | 0 (0.0%) | 0 (0.0%) |
| Graduate Degree | 0 (0.0%) | 0 (0.0%) |
| Total | 24 (100.0%) | 0 (0.0%) |
Income in West Crossett
Income Overview in West Crossett
Per Capita Income in West Crossett is $28,533, while median incomes of families and households are $62,070 and $58,906 respectively.
| Characteristic | Number | Measure |
| Per Capita Income | 1,196 | $28,533 |
| Median Family Income | 337 | $62,070 |
| Mean Family Income | 337 | $90,384 |
| Median Household Income | 421 | $58,906 |
| Mean Household Income | 421 | $79,493 |
| Income Deficit | 337 | $0 |
| Wage / Income Gap (%) | 1,196 | 34.71% |
| Wage / Income Gap ($) | 1,196 | 65.29¢ per $1 |
| Gini / Inequality Index | 1,196 | 0.45 |
Earnings by Sex in West Crossett
Average Earnings in West Crossett are $26,889, $38,750 for men and $25,301 for women, a difference of 34.7%.
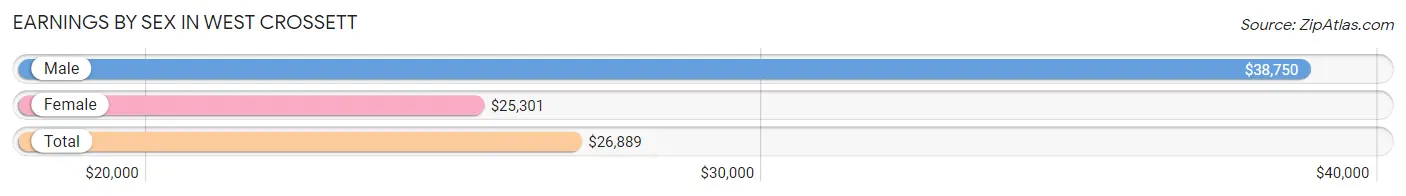
| Sex | Number | Average Earnings |
| Male | 160 (36.8%) | $38,750 |
| Female | 275 (63.2%) | $25,301 |
| Total | 435 (100.0%) | $26,889 |
Earnings by Sex by Income Bracket in West Crossett
The most common earnings brackets in West Crossett are $25,000 to $29,999 for men (34 | 21.2%) and $25,000 to $29,999 for women (62 | 22.6%).
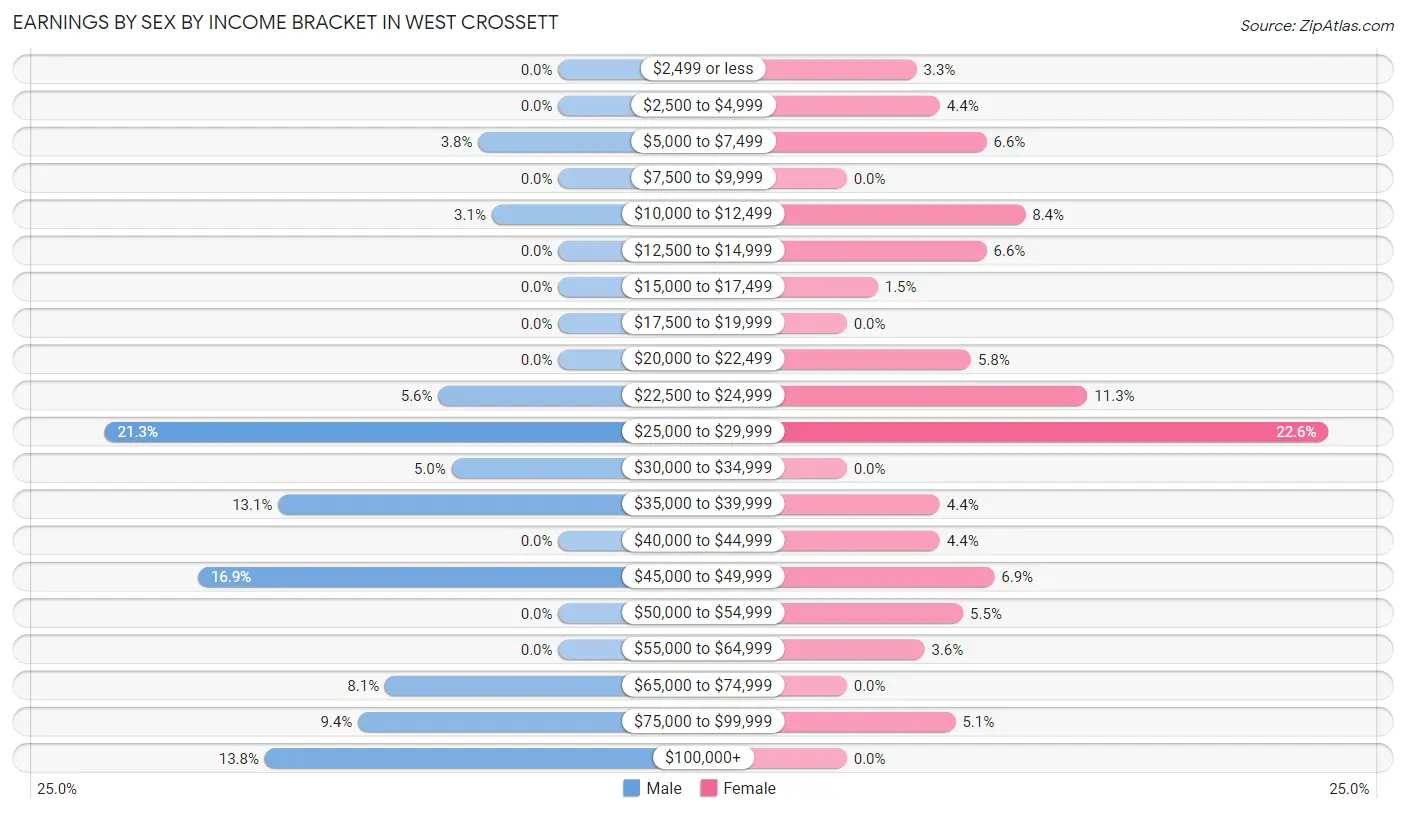
| Income | Male | Female |
| $2,499 or less | 0 (0.0%) | 9 (3.3%) |
| $2,500 to $4,999 | 0 (0.0%) | 12 (4.4%) |
| $5,000 to $7,499 | 6 (3.7%) | 18 (6.6%) |
| $7,500 to $9,999 | 0 (0.0%) | 0 (0.0%) |
| $10,000 to $12,499 | 5 (3.1%) | 23 (8.4%) |
| $12,500 to $14,999 | 0 (0.0%) | 18 (6.6%) |
| $15,000 to $17,499 | 0 (0.0%) | 4 (1.5%) |
| $17,500 to $19,999 | 0 (0.0%) | 0 (0.0%) |
| $20,000 to $22,499 | 0 (0.0%) | 16 (5.8%) |
| $22,500 to $24,999 | 9 (5.6%) | 31 (11.3%) |
| $25,000 to $29,999 | 34 (21.2%) | 62 (22.6%) |
| $30,000 to $34,999 | 8 (5.0%) | 0 (0.0%) |
| $35,000 to $39,999 | 21 (13.1%) | 12 (4.4%) |
| $40,000 to $44,999 | 0 (0.0%) | 12 (4.4%) |
| $45,000 to $49,999 | 27 (16.9%) | 19 (6.9%) |
| $50,000 to $54,999 | 0 (0.0%) | 15 (5.4%) |
| $55,000 to $64,999 | 0 (0.0%) | 10 (3.6%) |
| $65,000 to $74,999 | 13 (8.1%) | 0 (0.0%) |
| $75,000 to $99,999 | 15 (9.4%) | 14 (5.1%) |
| $100,000+ | 22 (13.8%) | 0 (0.0%) |
| Total | 160 (100.0%) | 275 (100.0%) |
Earnings by Sex by Educational Attainment in West Crossett
Average earnings in West Crossett are $47,688 for men and $25,625 for women, a difference of 46.3%. Men with an educational attainment of high school diploma enjoy the highest average annual earnings of $57,500, while those with high school diploma education earn the least with $57,500. Women with an educational attainment of bachelor's degree earn the most with the average annual earnings of $56,786, while those with college or associate's degree education have the smallest earnings of $24,718.
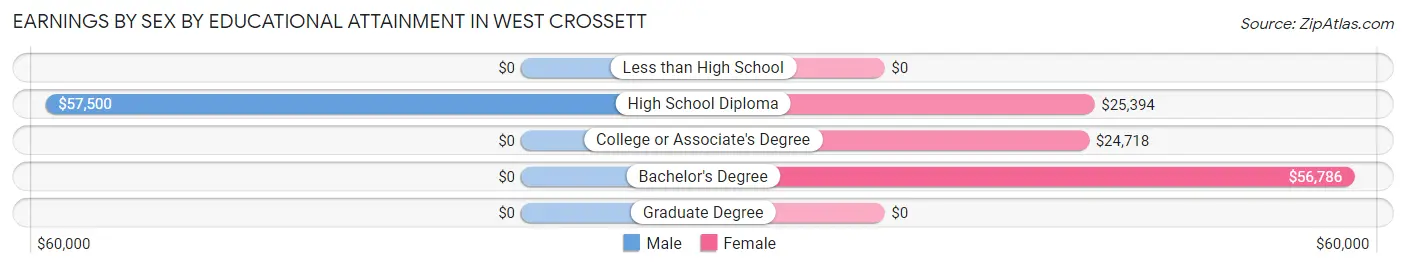
| Educational Attainment | Male Income | Female Income |
| Less than High School | - | - |
| High School Diploma | $57,500 | $25,394 |
| College or Associate's Degree | - | - |
| Bachelor's Degree | - | - |
| Graduate Degree | - | - |
| Total | $47,688 | $25,625 |
Family Income in West Crossett
Family Income Brackets in West Crossett
According to the West Crossett family income data, there are 99 families falling into the $50,000 to $74,999 income range, which is the most common income bracket and makes up 29.4% of all families.
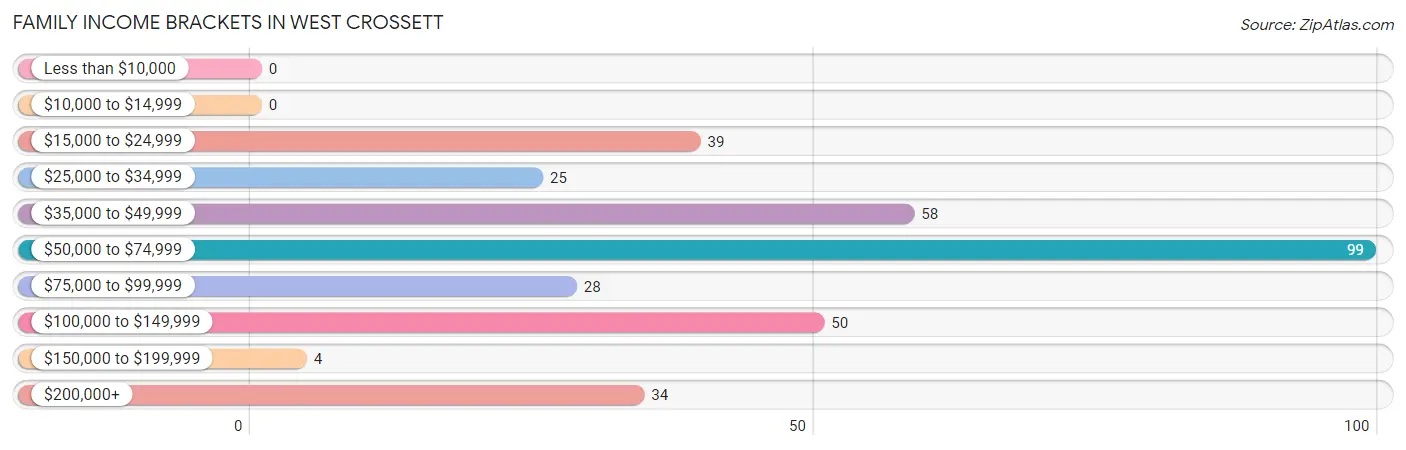
| Income Bracket | # Families | % Families |
| Less than $10,000 | 0 | 0.0% |
| $10,000 to $14,999 | 0 | 0.0% |
| $15,000 to $24,999 | 39 | 11.6% |
| $25,000 to $34,999 | 25 | 7.4% |
| $35,000 to $49,999 | 58 | 17.2% |
| $50,000 to $74,999 | 99 | 29.4% |
| $75,000 to $99,999 | 28 | 8.3% |
| $100,000 to $149,999 | 50 | 14.8% |
| $150,000 to $199,999 | 4 | 1.2% |
| $200,000+ | 34 | 10.1% |
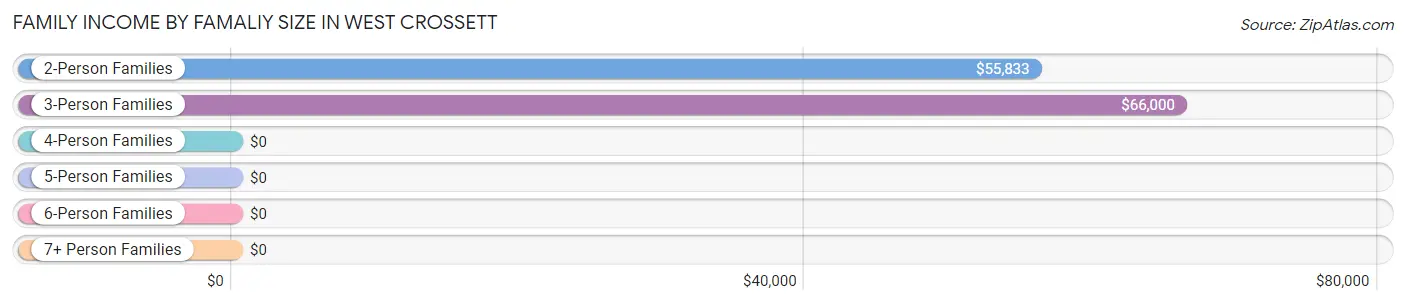
Family Income by Famaliy Size in West Crossett
3-person families (68 | 20.2%) account for the highest median family income in West Crossett with $66,000 per family, while 2-person families (202 | 59.9%) have the highest median income of $27,916 per family member.
| Income Bracket | # Families | Median Income |
| 2-Person Families | 202 (59.9%) | $55,833 |
| 3-Person Families | 68 (20.2%) | $66,000 |
| 4-Person Families | 63 (18.7%) | $0 |
| 5-Person Families | 0 (0.0%) | $0 |
| 6-Person Families | 0 (0.0%) | $0 |
| 7+ Person Families | 4 (1.2%) | $0 |
| Total | 337 (100.0%) | $62,070 |
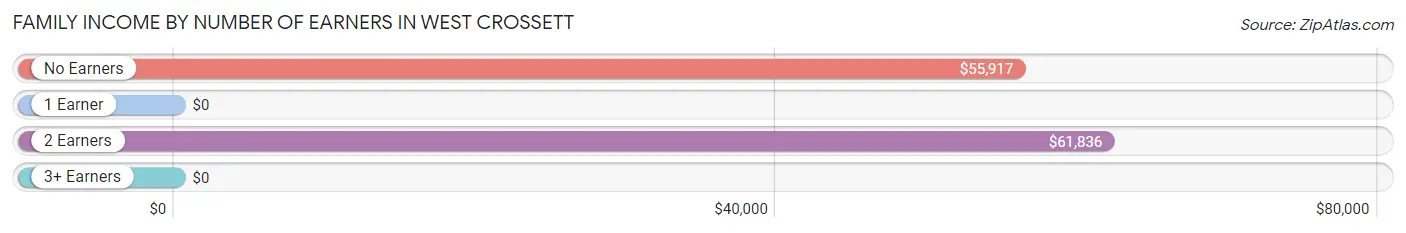
Family Income by Number of Earners in West Crossett
| Number of Earners | # Families | Median Income |
| No Earners | 83 (24.6%) | $55,917 |
| 1 Earner | 156 (46.3%) | $0 |
| 2 Earners | 61 (18.1%) | $61,836 |
| 3+ Earners | 37 (11.0%) | $0 |
| Total | 337 (100.0%) | $62,070 |
Household Income in West Crossett
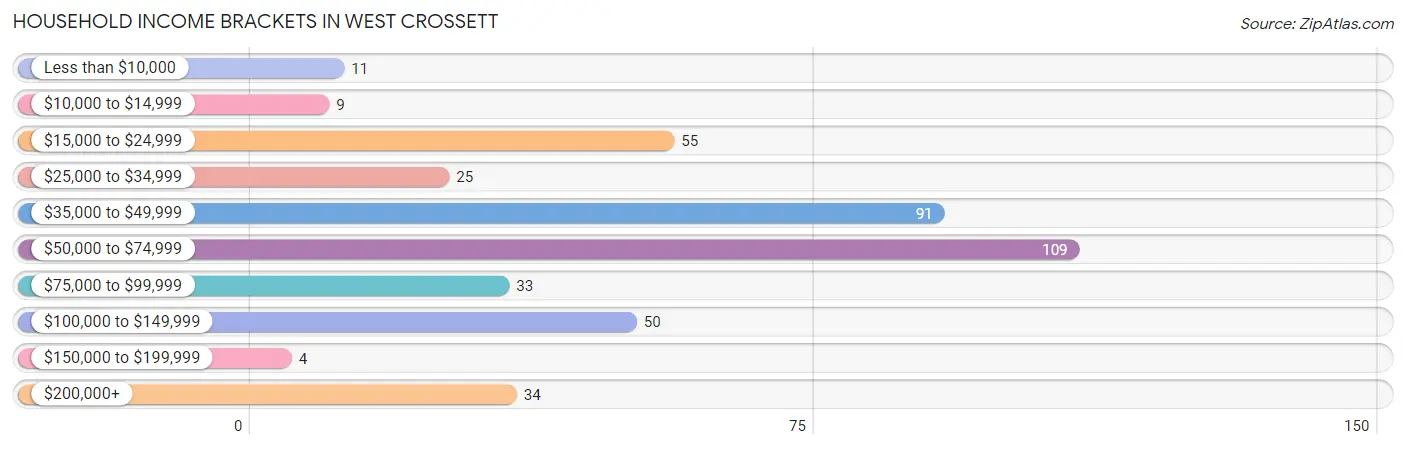
Household Income Brackets in West Crossett
With 109 households falling in the category, the $50,000 to $74,999 income range is the most frequent in West Crossett, accounting for 25.9% of all households. In contrast, only 4 households (0.9%) fall into the $150,000 to $199,999 income bracket, making it the least populous group.
| Income Bracket | # Households | % Households |
| Less than $10,000 | 11 | 2.6% |
| $10,000 to $14,999 | 9 | 2.1% |
| $15,000 to $24,999 | 55 | 13.1% |
| $25,000 to $34,999 | 25 | 5.9% |
| $35,000 to $49,999 | 91 | 21.6% |
| $50,000 to $74,999 | 109 | 25.9% |
| $75,000 to $99,999 | 33 | 7.8% |
| $100,000 to $149,999 | 50 | 11.9% |
| $150,000 to $199,999 | 4 | 1.0% |
| $200,000+ | 34 | 8.1% |
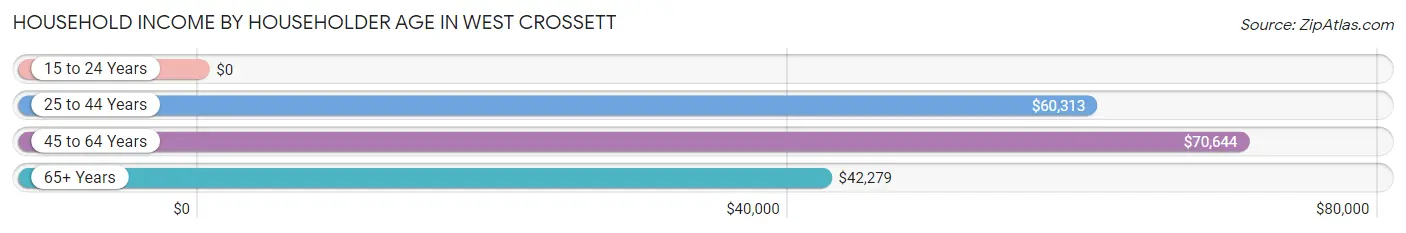
Household Income by Householder Age in West Crossett
The median household income in West Crossett is $58,906, with the highest median household income of $70,644 found in the 45 to 64 years age bracket for the primary householder. A total of 199 households (47.3%) fall into this category.
| Income Bracket | # Households | Median Income |
| 15 to 24 Years | 0 (0.0%) | $0 |
| 25 to 44 Years | 78 (18.5%) | $60,313 |
| 45 to 64 Years | 199 (47.3%) | $70,644 |
| 65+ Years | 144 (34.2%) | $42,279 |
| Total | 421 (100.0%) | $58,906 |
Poverty in West Crossett
Income Below Poverty by Sex and Age in West Crossett
With 15.6% poverty level for males and 15.1% for females among the residents of West Crossett, under 5 year old males and under 5 year old females are the most vulnerable to poverty, with 39 males (100.0%) and 17 females (100.0%) in their respective age groups living below the poverty level.
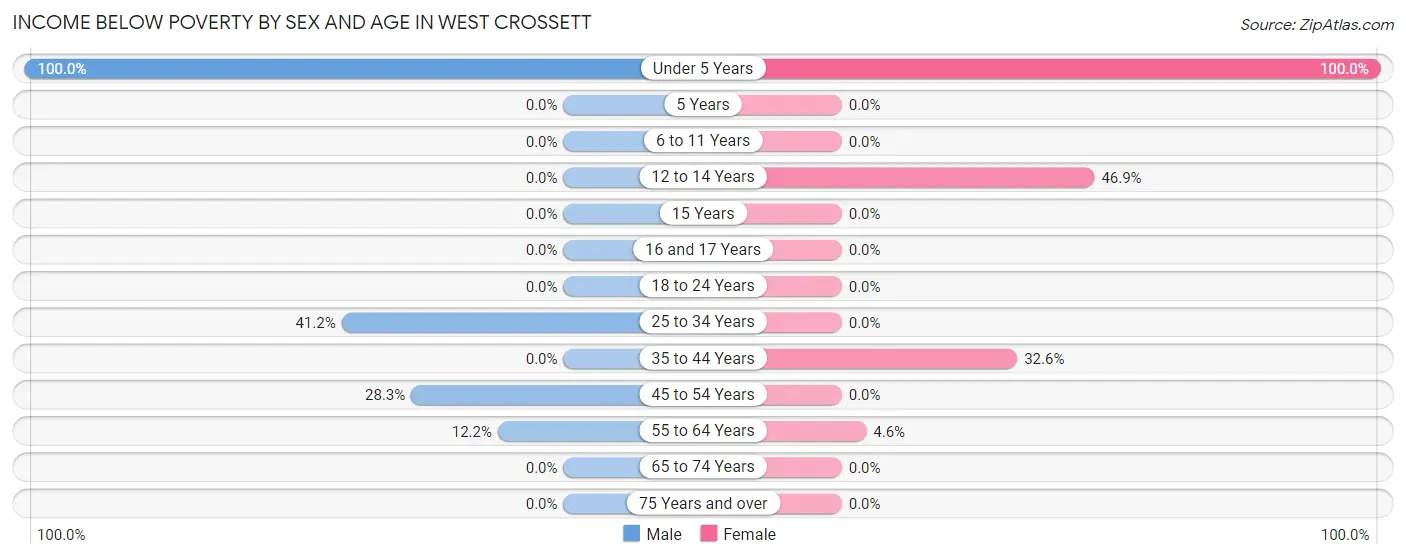
| Age Bracket | Male | Female |
| Under 5 Years | 39 (100.0%) | 17 (100.0%) |
| 5 Years | 0 (0.0%) | 0 (0.0%) |
| 6 to 11 Years | 0 (0.0%) | 0 (0.0%) |
| 12 to 14 Years | 0 (0.0%) | 53 (46.9%) |
| 15 Years | 0 (0.0%) | 0 (0.0%) |
| 16 and 17 Years | 0 (0.0%) | 0 (0.0%) |
| 18 to 24 Years | 0 (0.0%) | 0 (0.0%) |
| 25 to 34 Years | 7 (41.2%) | 0 (0.0%) |
| 35 to 44 Years | 0 (0.0%) | 28 (32.6%) |
| 45 to 54 Years | 26 (28.3%) | 0 (0.0%) |
| 55 to 64 Years | 9 (12.2%) | 4 (4.5%) |
| 65 to 74 Years | 0 (0.0%) | 0 (0.0%) |
| 75 Years and over | 0 (0.0%) | 0 (0.0%) |
| Total | 81 (15.6%) | 102 (15.1%) |
Income Above Poverty by Sex and Age in West Crossett
According to the poverty statistics in West Crossett, males aged 6 to 11 years and females aged 6 to 11 years are the age groups that are most secure financially, with 100.0% of males and 100.0% of females in these age groups living above the poverty line.
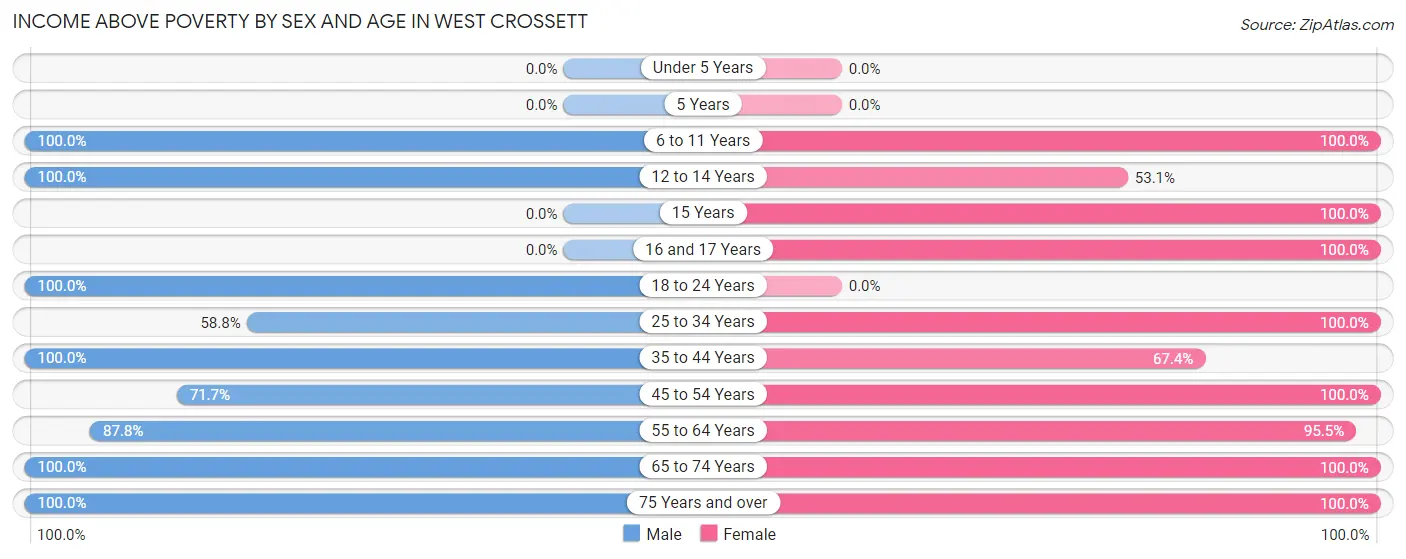
| Age Bracket | Male | Female |
| Under 5 Years | 0 (0.0%) | 0 (0.0%) |
| 5 Years | 0 (0.0%) | 0 (0.0%) |
| 6 to 11 Years | 21 (100.0%) | 5 (100.0%) |
| 12 to 14 Years | 31 (100.0%) | 60 (53.1%) |
| 15 Years | 0 (0.0%) | 55 (100.0%) |
| 16 and 17 Years | 0 (0.0%) | 20 (100.0%) |
| 18 to 24 Years | 33 (100.0%) | 0 (0.0%) |
| 25 to 34 Years | 10 (58.8%) | 25 (100.0%) |
| 35 to 44 Years | 33 (100.0%) | 58 (67.4%) |
| 45 to 54 Years | 66 (71.7%) | 67 (100.0%) |
| 55 to 64 Years | 65 (87.8%) | 84 (95.5%) |
| 65 to 74 Years | 80 (100.0%) | 134 (100.0%) |
| 75 Years and over | 99 (100.0%) | 67 (100.0%) |
| Total | 438 (84.4%) | 575 (84.9%) |
Income Below Poverty Among Married-Couple Families in West Crossett
The poverty statistics for married-couple families in West Crossett show that 9.3% or 26 of the total 279 families live below the poverty line. Families with 1 or 2 children have the highest poverty rate of 25.7%, comprising of 26 families. On the other hand, families with no children have the lowest poverty rate of 0.0%, which includes 0 families.
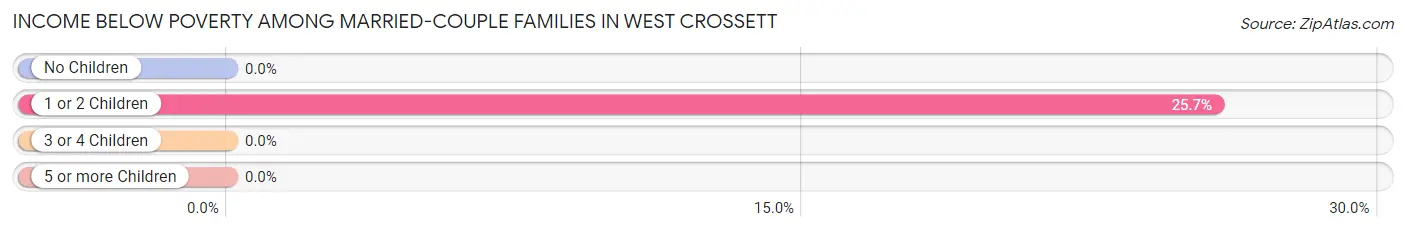
| Children | Above Poverty | Below Poverty |
| No Children | 174 (100.0%) | 0 (0.0%) |
| 1 or 2 Children | 75 (74.3%) | 26 (25.7%) |
| 3 or 4 Children | 4 (100.0%) | 0 (0.0%) |
| 5 or more Children | 0 (0.0%) | 0 (0.0%) |
| Total | 253 (90.7%) | 26 (9.3%) |
Income Below Poverty Among Single-Parent Households in West Crossett
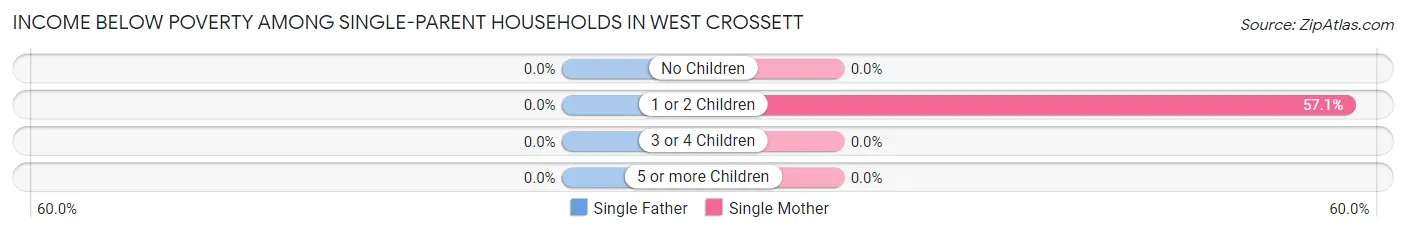
| Children | Single Father | Single Mother |
| No Children | 0 (0.0%) | 0 (0.0%) |
| 1 or 2 Children | 0 (0.0%) | 4 (57.1%) |
| 3 or 4 Children | 0 (0.0%) | 0 (0.0%) |
| 5 or more Children | 0 (0.0%) | 0 (0.0%) |
| Total | 0 (0.0%) | 4 (9.8%) |
Income Below Poverty Among Married-Couple vs Single-Parent Households in West Crossett
The poverty data for West Crossett shows that 26 of the married-couple family households (9.3%) and 4 of the single-parent households (6.9%) are living below the poverty level. Within the married-couple family households, those with 1 or 2 children have the highest poverty rate, with 26 households (25.7%) falling below the poverty line. Among the single-parent households, those with 1 or 2 children have the highest poverty rate, with 4 household (25.0%) living below poverty.
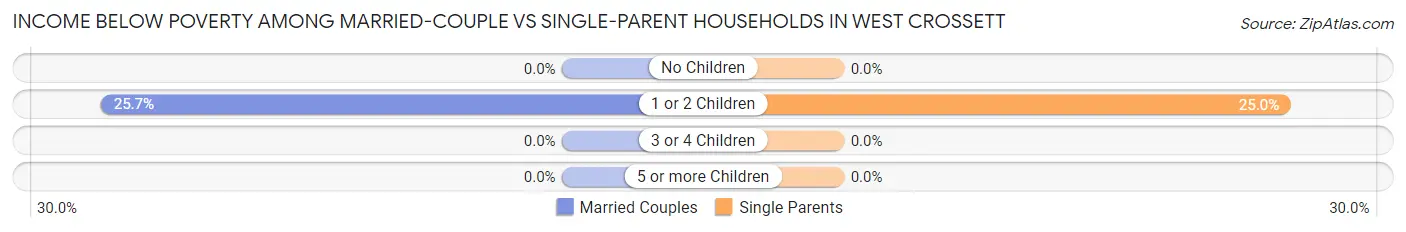
| Children | Married-Couple Families | Single-Parent Households |
| No Children | 0 (0.0%) | 0 (0.0%) |
| 1 or 2 Children | 26 (25.7%) | 4 (25.0%) |
| 3 or 4 Children | 0 (0.0%) | 0 (0.0%) |
| 5 or more Children | 0 (0.0%) | 0 (0.0%) |
| Total | 26 (9.3%) | 4 (6.9%) |
Employment Characteristics in West Crossett
Employment by Class of Employer in West Crossett
Among the 430 employed individuals in West Crossett, private company employees (278 | 64.6%), not-for-profit organizations (61 | 14.2%), and state government employees (38 | 8.8%) make up the most common classes of employment.
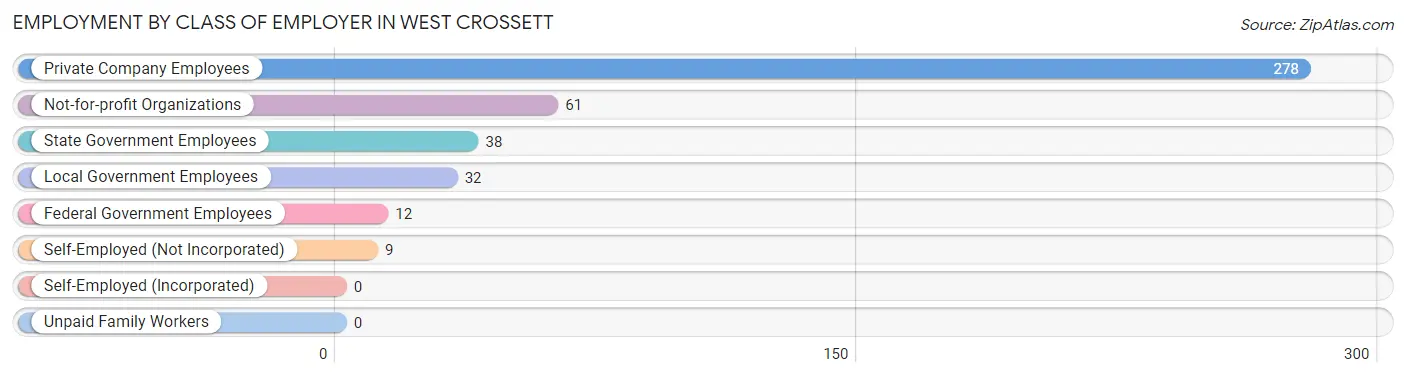
| Employer Class | # Employees | % Employees |
| Private Company Employees | 278 | 64.6% |
| Self-Employed (Incorporated) | 0 | 0.0% |
| Self-Employed (Not Incorporated) | 9 | 2.1% |
| Not-for-profit Organizations | 61 | 14.2% |
| Local Government Employees | 32 | 7.4% |
| State Government Employees | 38 | 8.8% |
| Federal Government Employees | 12 | 2.8% |
| Unpaid Family Workers | 0 | 0.0% |
| Total | 430 | 100.0% |
Employment Status by Age in West Crossett
According to the labor force statistics for West Crossett, out of the total population over 16 years of age (915), 48.4% or 443 individuals are in the labor force, with 2.9% or 13 of them unemployed. The age group with the highest labor force participation rate is 25 to 29 years, with 100.0% or 23 individuals in the labor force. Within the labor force, the 16 to 19 years age range has the highest percentage of unemployed individuals, with 35.7% or 5 of them being unemployed.
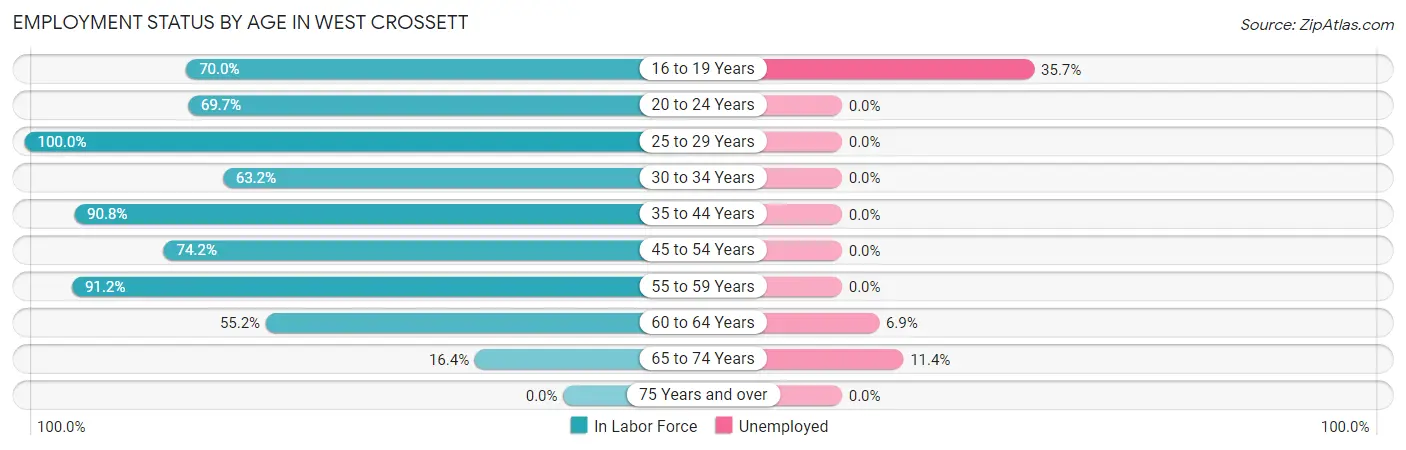
| Age Bracket | In Labor Force | Unemployed |
| 16 to 19 Years | 14 (70.0%) | 5 (35.7%) |
| 20 to 24 Years | 23 (69.7%) | 0 (0.0%) |
| 25 to 29 Years | 23 (100.0%) | 0 (0.0%) |
| 30 to 34 Years | 12 (63.2%) | 0 (0.0%) |
| 35 to 44 Years | 108 (90.8%) | 0 (0.0%) |
| 45 to 54 Years | 118 (74.2%) | 0 (0.0%) |
| 55 to 59 Years | 52 (91.2%) | 0 (0.0%) |
| 60 to 64 Years | 58 (55.2%) | 4 (6.9%) |
| 65 to 74 Years | 35 (16.4%) | 4 (11.4%) |
| 75 Years and over | 0 (0.0%) | 0 (0.0%) |
| Total | 443 (48.4%) | 13 (2.9%) |
Employment Status by Educational Attainment in West Crossett
According to labor force statistics for West Crossett, 77.0% of individuals (371) out of the total population between 25 and 64 years of age (482) are in the labor force, with 1.1% or 4 of them being unemployed. The group with the highest labor force participation rate are those with the educational attainment of bachelor's degree or higher, with 100.0% or 49 individuals in the labor force. Within the labor force, individuals with high school diploma education have the highest percentage of unemployment, with 2.2% or 4 of them being unemployed.
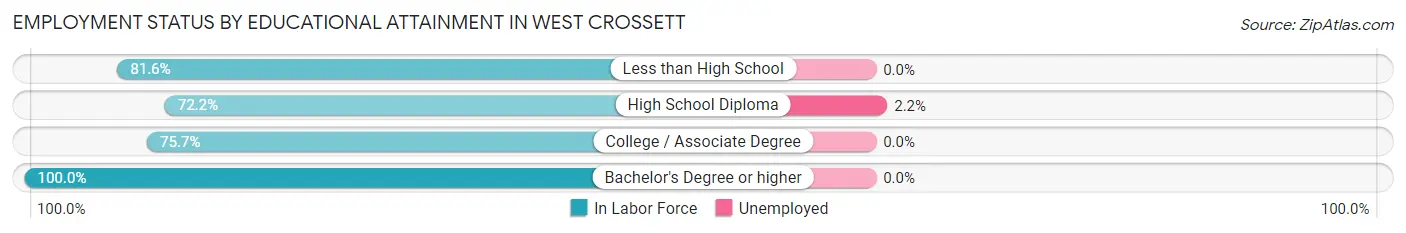
| Educational Attainment | In Labor Force | Unemployed |
| Less than High School | 40 (81.6%) | 0 (0.0%) |
| High School Diploma | 179 (72.2%) | 5 (2.2%) |
| College / Associate Degree | 103 (75.7%) | 0 (0.0%) |
| Bachelor's Degree or higher | 49 (100.0%) | 0 (0.0%) |
| Total | 371 (77.0%) | 5 (1.1%) |
Employment Occupations by Sex in West Crossett
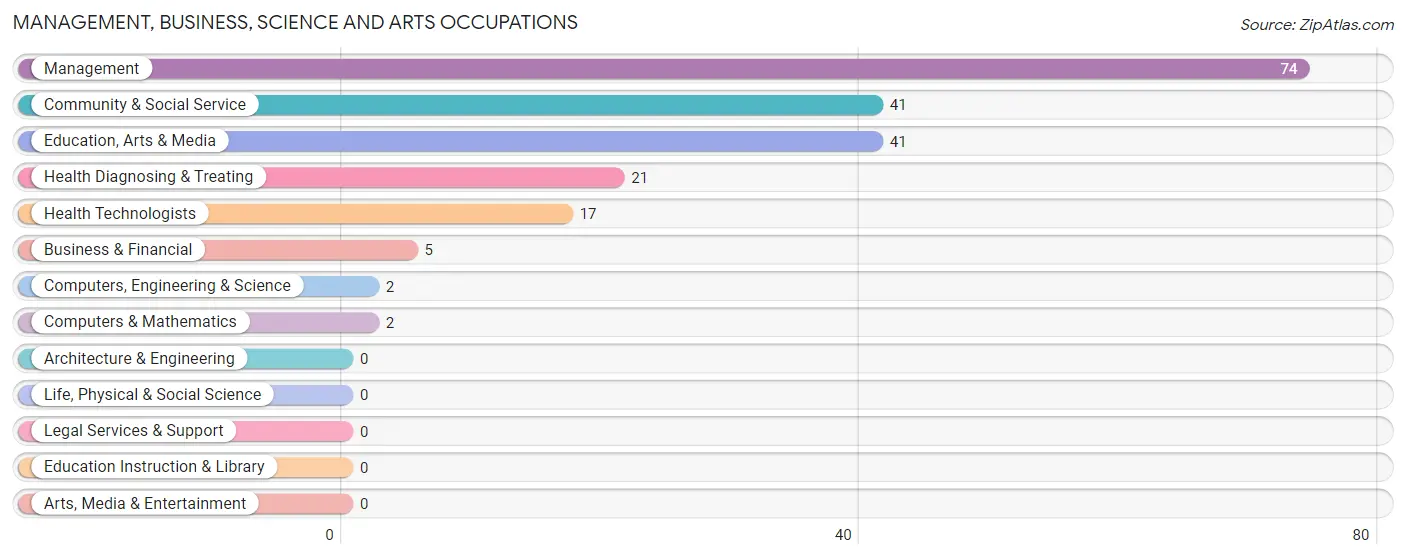
Management, Business, Science and Arts Occupations
The most common Management, Business, Science and Arts occupations in West Crossett are Management (74 | 17.2%), Community & Social Service (41 | 9.5%), Education, Arts & Media (41 | 9.5%), Health Diagnosing & Treating (21 | 4.9%), and Health Technologists (17 | 4.0%).
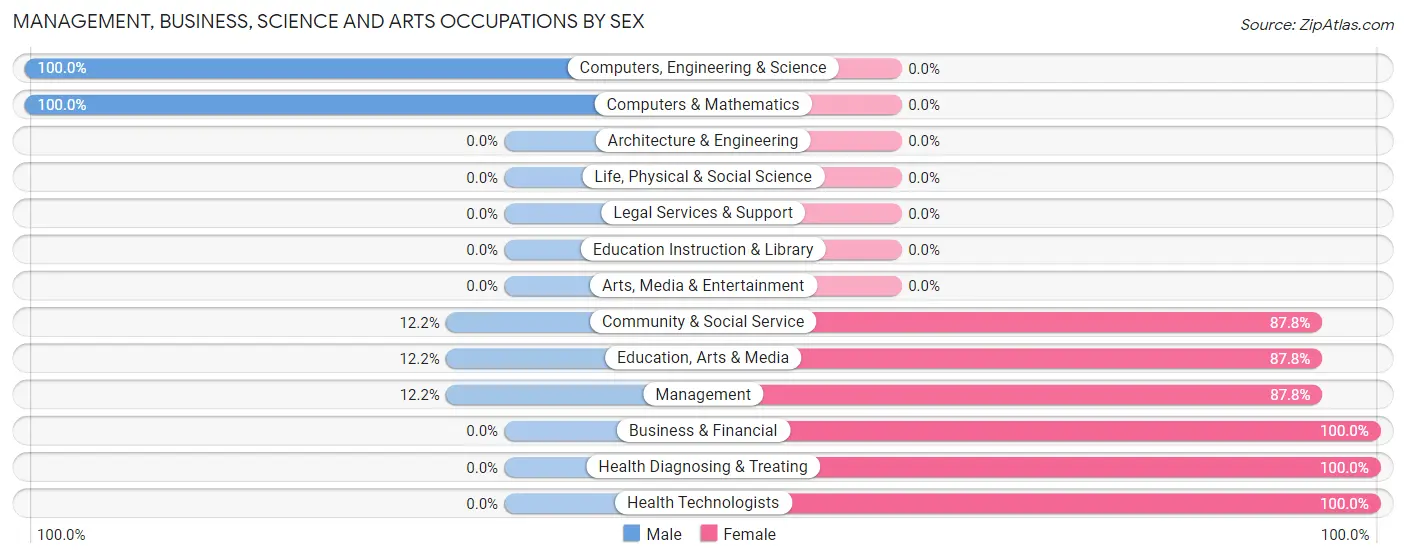
Management, Business, Science and Arts Occupations by Sex
Within the Management, Business, Science and Arts occupations in West Crossett, the most male-oriented occupations are Computers, Engineering & Science (100.0%), Computers & Mathematics (100.0%), and Community & Social Service (12.2%), while the most female-oriented occupations are Business & Financial (100.0%), Health Diagnosing & Treating (100.0%), and Health Technologists (100.0%).
| Occupation | Male | Female |
| Management | 9 (12.2%) | 65 (87.8%) |
| Business & Financial | 0 (0.0%) | 5 (100.0%) |
| Computers, Engineering & Science | 2 (100.0%) | 0 (0.0%) |
| Computers & Mathematics | 2 (100.0%) | 0 (0.0%) |
| Architecture & Engineering | 0 (0.0%) | 0 (0.0%) |
| Life, Physical & Social Science | 0 (0.0%) | 0 (0.0%) |
| Community & Social Service | 5 (12.2%) | 36 (87.8%) |
| Education, Arts & Media | 5 (12.2%) | 36 (87.8%) |
| Legal Services & Support | 0 (0.0%) | 0 (0.0%) |
| Education Instruction & Library | 0 (0.0%) | 0 (0.0%) |
| Arts, Media & Entertainment | 0 (0.0%) | 0 (0.0%) |
| Health Diagnosing & Treating | 0 (0.0%) | 21 (100.0%) |
| Health Technologists | 0 (0.0%) | 17 (100.0%) |
| Total (Category) | 16 (11.2%) | 127 (88.8%) |
| Total (Overall) | 160 (37.2%) | 270 (62.8%) |
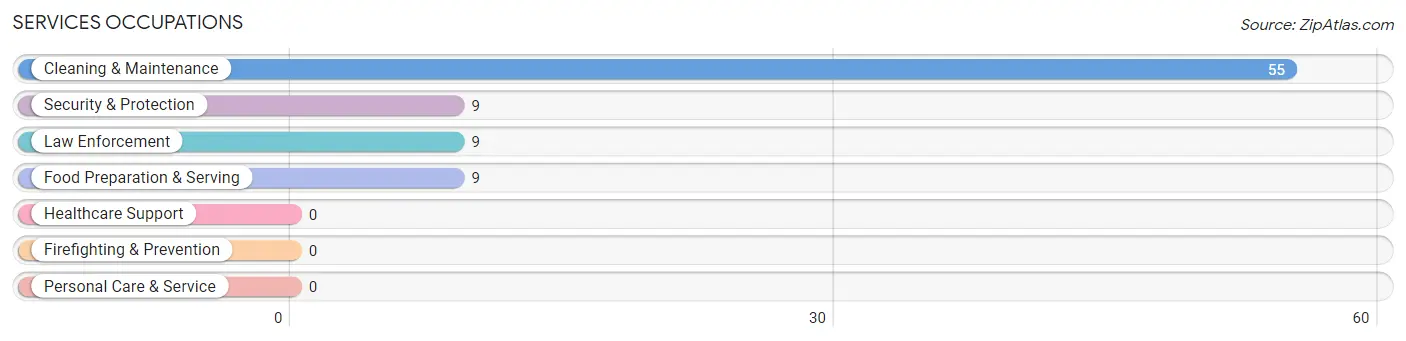
Services Occupations
The most common Services occupations in West Crossett are Cleaning & Maintenance (55 | 12.8%), Security & Protection (9 | 2.1%), Law Enforcement (9 | 2.1%), and Food Preparation & Serving (9 | 2.1%).
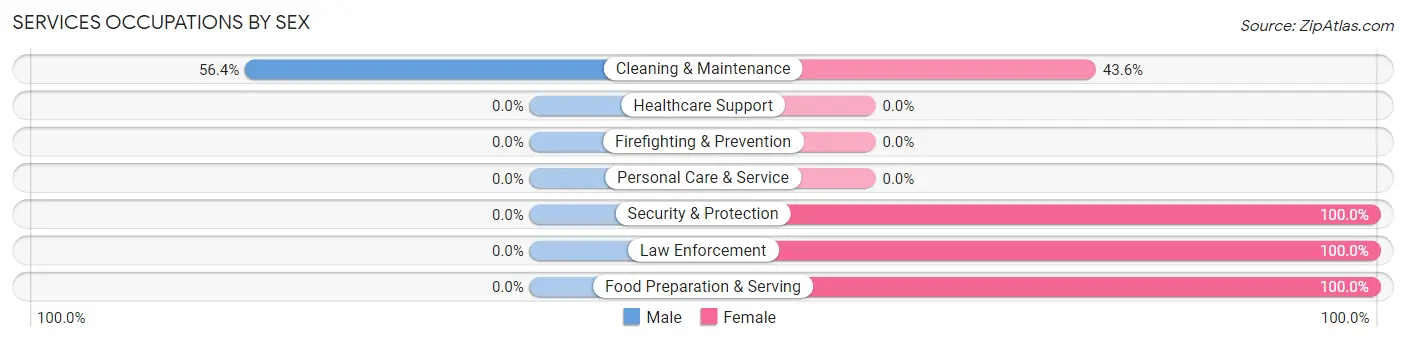
Services Occupations by Sex
| Occupation | Male | Female |
| Healthcare Support | 0 (0.0%) | 0 (0.0%) |
| Security & Protection | 0 (0.0%) | 9 (100.0%) |
| Firefighting & Prevention | 0 (0.0%) | 0 (0.0%) |
| Law Enforcement | 0 (0.0%) | 9 (100.0%) |
| Food Preparation & Serving | 0 (0.0%) | 9 (100.0%) |
| Cleaning & Maintenance | 31 (56.4%) | 24 (43.6%) |
| Personal Care & Service | 0 (0.0%) | 0 (0.0%) |
| Total (Category) | 31 (42.5%) | 42 (57.5%) |
| Total (Overall) | 160 (37.2%) | 270 (62.8%) |
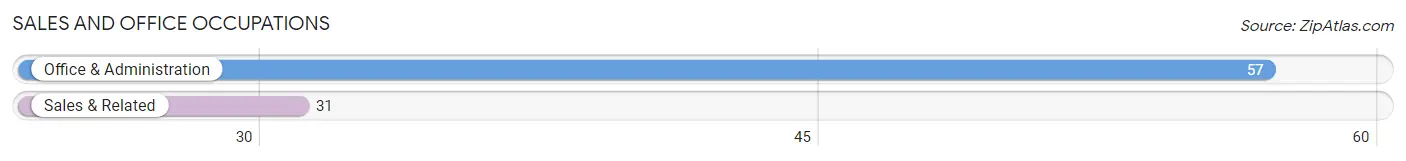
Sales and Office Occupations
The most common Sales and Office occupations in West Crossett are Office & Administration (57 | 13.3%), and Sales & Related (31 | 7.2%).
Sales and Office Occupations by Sex
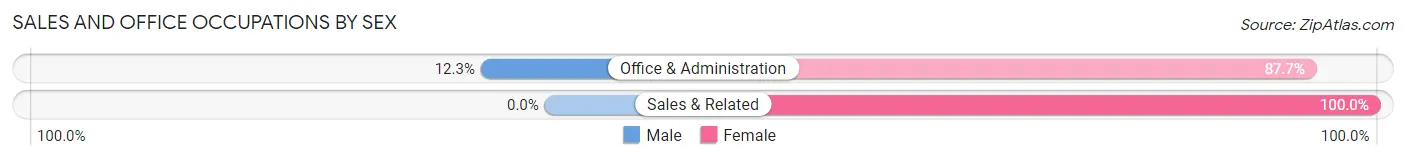
| Occupation | Male | Female |
| Sales & Related | 0 (0.0%) | 31 (100.0%) |
| Office & Administration | 7 (12.3%) | 50 (87.7%) |
| Total (Category) | 7 (8.0%) | 81 (92.0%) |
| Total (Overall) | 160 (37.2%) | 270 (62.8%) |
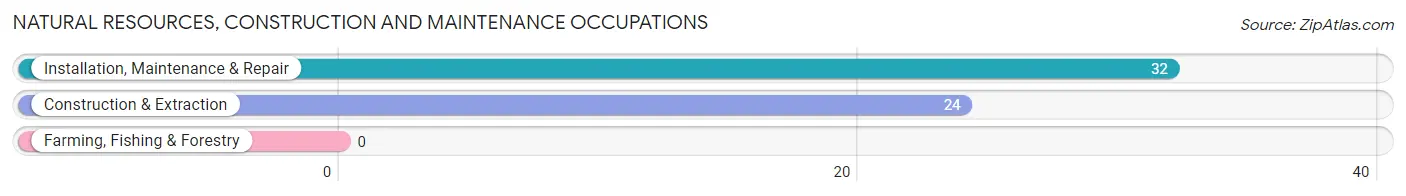
Natural Resources, Construction and Maintenance Occupations
The most common Natural Resources, Construction and Maintenance occupations in West Crossett are Installation, Maintenance & Repair (32 | 7.4%), and Construction & Extraction (24 | 5.6%).
Natural Resources, Construction and Maintenance Occupations by Sex
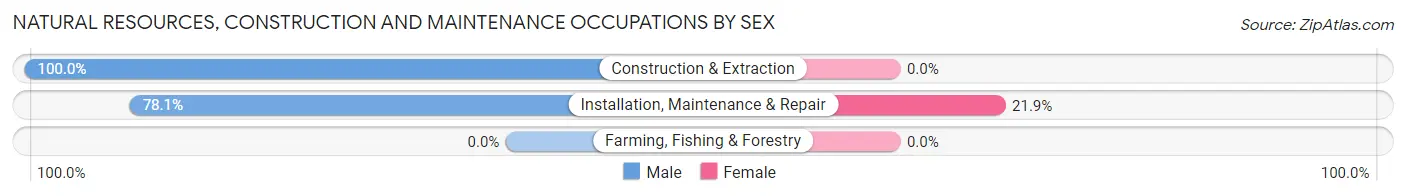
| Occupation | Male | Female |
| Farming, Fishing & Forestry | 0 (0.0%) | 0 (0.0%) |
| Construction & Extraction | 24 (100.0%) | 0 (0.0%) |
| Installation, Maintenance & Repair | 25 (78.1%) | 7 (21.9%) |
| Total (Category) | 49 (87.5%) | 7 (12.5%) |
| Total (Overall) | 160 (37.2%) | 270 (62.8%) |
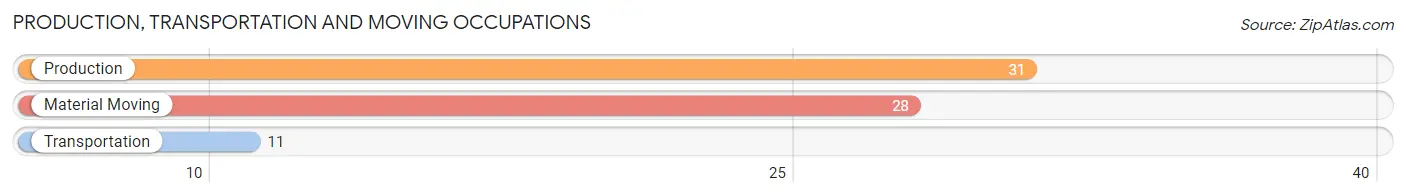
Production, Transportation and Moving Occupations
The most common Production, Transportation and Moving occupations in West Crossett are Production (31 | 7.2%), Material Moving (28 | 6.5%), and Transportation (11 | 2.6%).
Production, Transportation and Moving Occupations by Sex
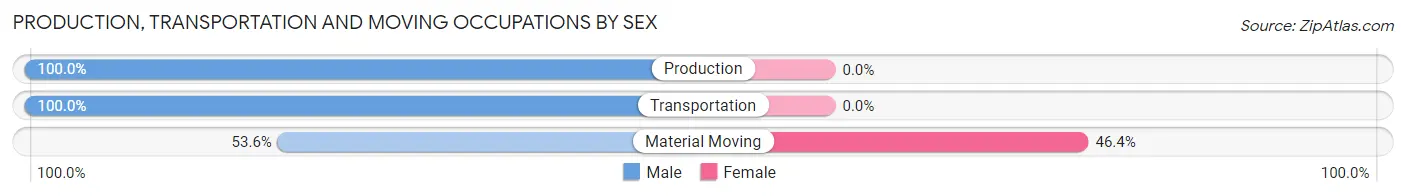
| Occupation | Male | Female |
| Production | 31 (100.0%) | 0 (0.0%) |
| Transportation | 11 (100.0%) | 0 (0.0%) |
| Material Moving | 15 (53.6%) | 13 (46.4%) |
| Total (Category) | 57 (81.4%) | 13 (18.6%) |
| Total (Overall) | 160 (37.2%) | 270 (62.8%) |
Employment Industries by Sex in West Crossett
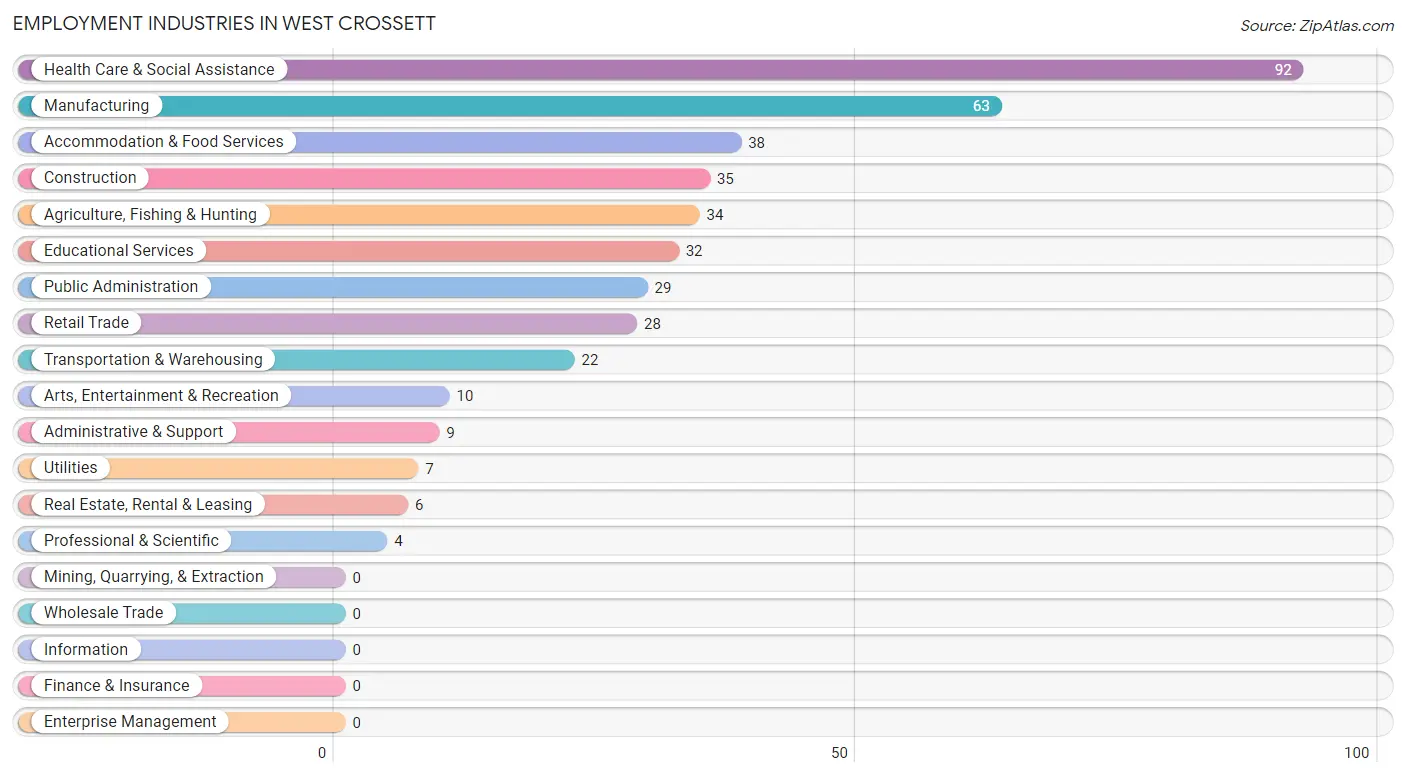
Employment Industries in West Crossett
The major employment industries in West Crossett include Health Care & Social Assistance (92 | 21.4%), Manufacturing (63 | 14.6%), Accommodation & Food Services (38 | 8.8%), Construction (35 | 8.1%), and Agriculture, Fishing & Hunting (34 | 7.9%).
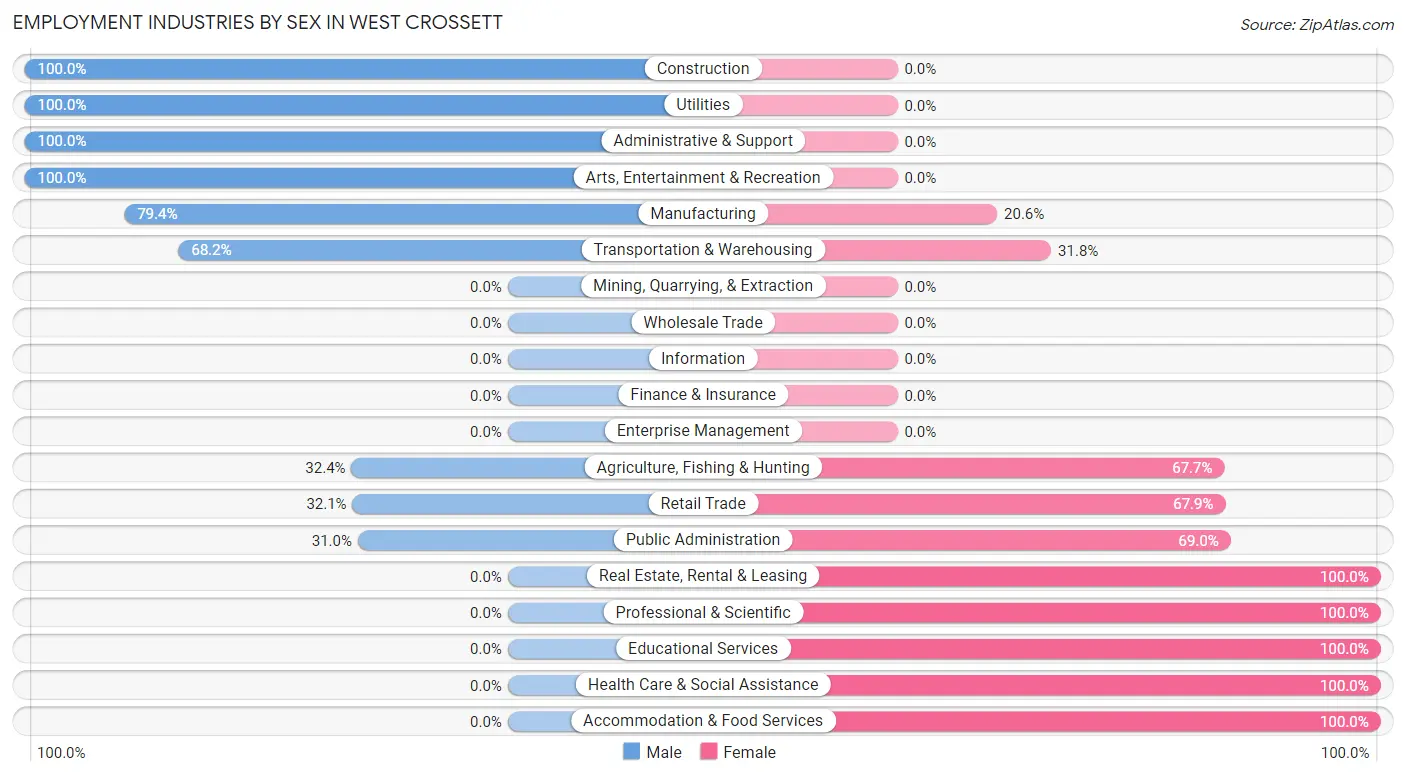
Employment Industries by Sex in West Crossett
The West Crossett industries that see more men than women are Construction (100.0%), Utilities (100.0%), and Administrative & Support (100.0%), whereas the industries that tend to have a higher number of women are Real Estate, Rental & Leasing (100.0%), Professional & Scientific (100.0%), and Educational Services (100.0%).
| Industry | Male | Female |
| Agriculture, Fishing & Hunting | 11 (32.4%) | 23 (67.6%) |
| Mining, Quarrying, & Extraction | 0 (0.0%) | 0 (0.0%) |
| Construction | 35 (100.0%) | 0 (0.0%) |
| Manufacturing | 50 (79.4%) | 13 (20.6%) |
| Wholesale Trade | 0 (0.0%) | 0 (0.0%) |
| Retail Trade | 9 (32.1%) | 19 (67.9%) |
| Transportation & Warehousing | 15 (68.2%) | 7 (31.8%) |
| Utilities | 7 (100.0%) | 0 (0.0%) |
| Information | 0 (0.0%) | 0 (0.0%) |
| Finance & Insurance | 0 (0.0%) | 0 (0.0%) |
| Real Estate, Rental & Leasing | 0 (0.0%) | 6 (100.0%) |
| Professional & Scientific | 0 (0.0%) | 4 (100.0%) |
| Enterprise Management | 0 (0.0%) | 0 (0.0%) |
| Administrative & Support | 9 (100.0%) | 0 (0.0%) |
| Educational Services | 0 (0.0%) | 32 (100.0%) |
| Health Care & Social Assistance | 0 (0.0%) | 92 (100.0%) |
| Arts, Entertainment & Recreation | 10 (100.0%) | 0 (0.0%) |
| Accommodation & Food Services | 0 (0.0%) | 38 (100.0%) |
| Public Administration | 9 (31.0%) | 20 (69.0%) |
| Total | 160 (37.2%) | 270 (62.8%) |
Education in West Crossett
School Enrollment in West Crossett
The most common levels of schooling among the 210 students in West Crossett are middle school (110 | 52.4%), high school (79 | 37.6%), and college / undergraduate (14 | 6.7%).
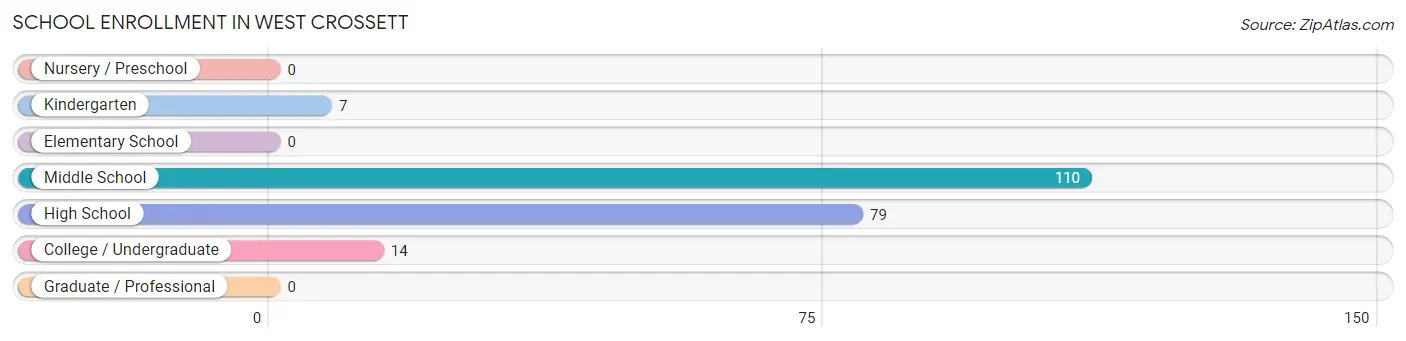
| School Level | # Students | % Students |
| Nursery / Preschool | 0 | 0.0% |
| Kindergarten | 7 | 3.3% |
| Elementary School | 0 | 0.0% |
| Middle School | 110 | 52.4% |
| High School | 79 | 37.6% |
| College / Undergraduate | 14 | 6.7% |
| Graduate / Professional | 0 | 0.0% |
| Total | 210 | 100.0% |
School Enrollment by Age by Funding Source in West Crossett
Out of a total of 210 students who are enrolled in schools in West Crossett, 10 (4.8%) attend a private institution, while the remaining 200 (95.2%) are enrolled in public schools. The age group of 35 years and over has the highest likelihood of being enrolled in private schools, with 4 (100.0% in the age bracket) enrolled. Conversely, the age group of 5 to 9 year old has the lowest likelihood of being enrolled in a private school, with 7 (100.0% in the age bracket) attending a public institution.
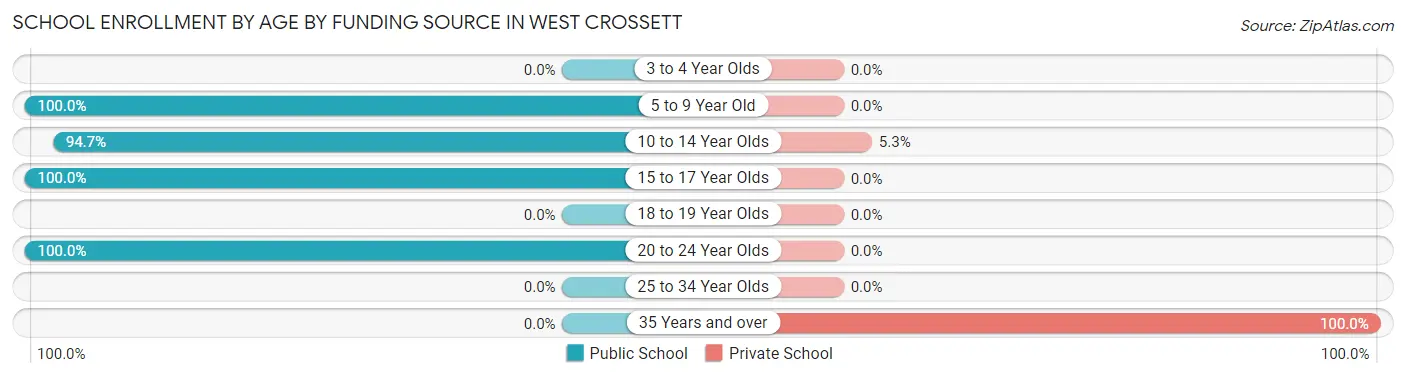
| Age Bracket | Public School | Private School |
| 3 to 4 Year Olds | 0 (0.0%) | 0 (0.0%) |
| 5 to 9 Year Old | 7 (100.0%) | 0 (0.0%) |
| 10 to 14 Year Olds | 108 (94.7%) | 6 (5.3%) |
| 15 to 17 Year Olds | 75 (100.0%) | 0 (0.0%) |
| 18 to 19 Year Olds | 0 (0.0%) | 0 (0.0%) |
| 20 to 24 Year Olds | 10 (100.0%) | 0 (0.0%) |
| 25 to 34 Year Olds | 0 (0.0%) | 0 (0.0%) |
| 35 Years and over | 0 (0.0%) | 4 (100.0%) |
| Total | 200 (95.2%) | 10 (4.8%) |
Educational Attainment by Field of Study in West Crossett
Liberal arts & history (18 | 21.4%), education (15 | 17.9%), business (12 | 14.3%), psychology (10 | 11.9%), and engineering (9 | 10.7%) are the most common fields of study among 84 individuals in West Crossett who have obtained a bachelor's degree or higher.
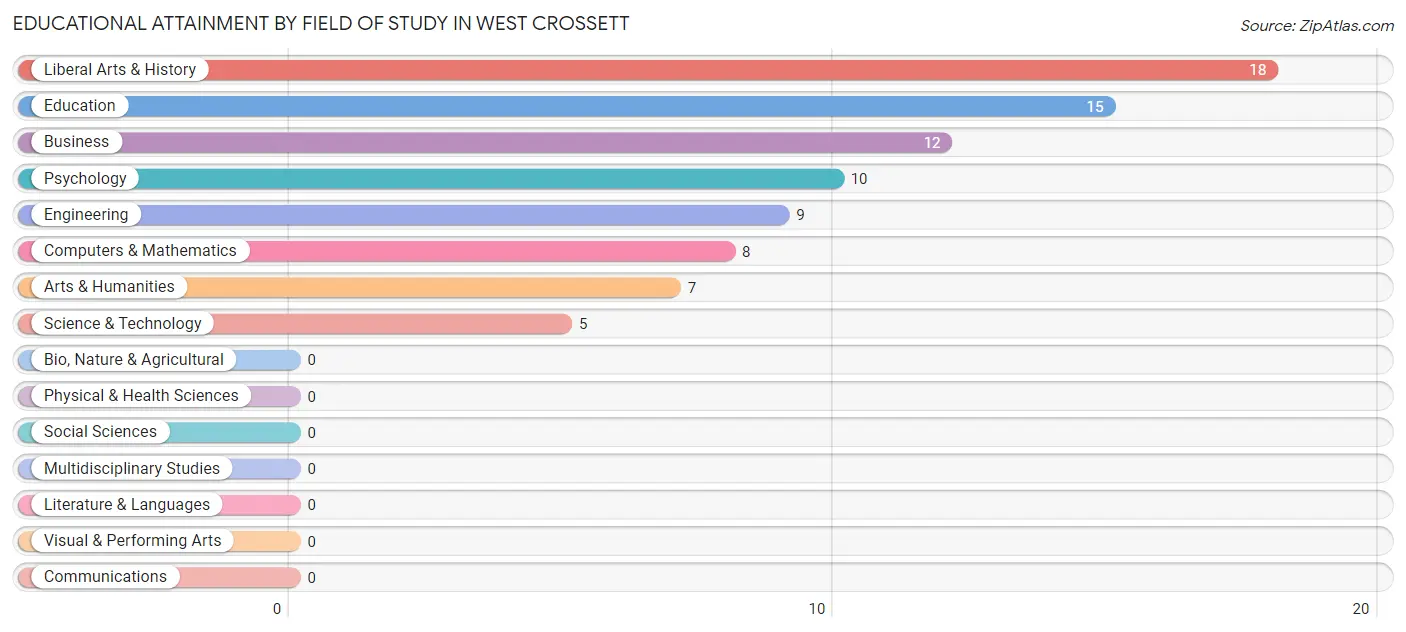
| Field of Study | # Graduates | % Graduates |
| Computers & Mathematics | 8 | 9.5% |
| Bio, Nature & Agricultural | 0 | 0.0% |
| Physical & Health Sciences | 0 | 0.0% |
| Psychology | 10 | 11.9% |
| Social Sciences | 0 | 0.0% |
| Engineering | 9 | 10.7% |
| Multidisciplinary Studies | 0 | 0.0% |
| Science & Technology | 5 | 5.9% |
| Business | 12 | 14.3% |
| Education | 15 | 17.9% |
| Literature & Languages | 0 | 0.0% |
| Liberal Arts & History | 18 | 21.4% |
| Visual & Performing Arts | 0 | 0.0% |
| Communications | 0 | 0.0% |
| Arts & Humanities | 7 | 8.3% |
| Total | 84 | 100.0% |
Transportation & Commute in West Crossett
Vehicle Availability by Sex in West Crossett
The most prevalent vehicle ownership categories in West Crossett are males with 2 vehicles (70, accounting for 43.8%) and females with 2 vehicles (98, making up 25.9%).
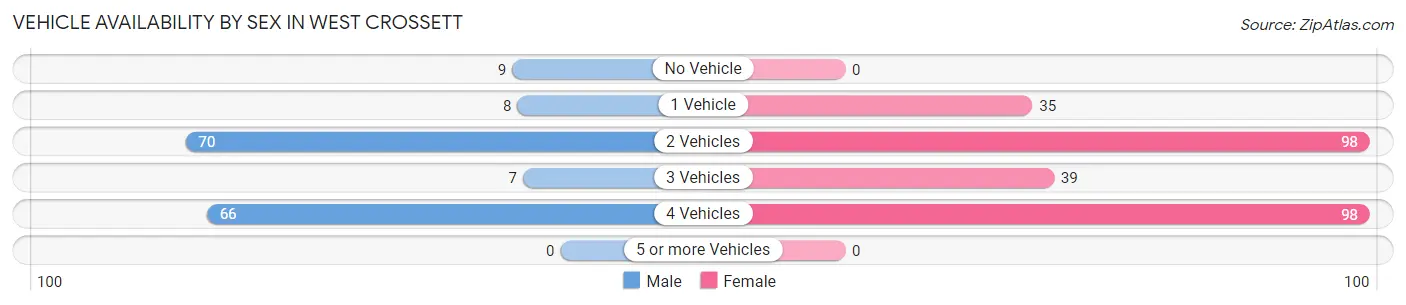
| Vehicles Available | Male | Female |
| No Vehicle | 9 (5.6%) | 0 (0.0%) |
| 1 Vehicle | 8 (5.0%) | 35 (13.0%) |
| 2 Vehicles | 70 (43.8%) | 98 (36.3%) |
| 3 Vehicles | 7 (4.4%) | 39 (14.4%) |
| 4 Vehicles | 66 (41.2%) | 98 (36.3%) |
| 5 or more Vehicles | 0 (0.0%) | 0 (0.0%) |
| Total | 160 (100.0%) | 270 (100.0%) |
Commute Time in West Crossett
The most frequently occuring commute durations in West Crossett are 10 to 14 minutes (137 commuters, 32.2%), 5 to 9 minutes (119 commuters, 28.0%), and 15 to 19 minutes (98 commuters, 23.1%).
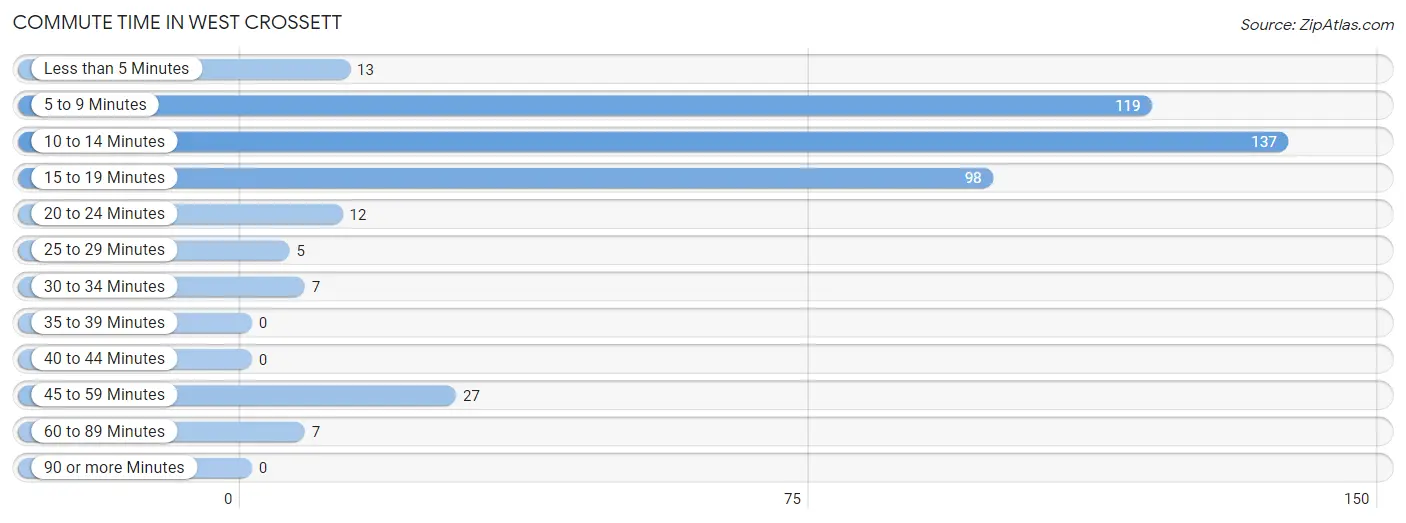
| Commute Time | # Commuters | % Commuters |
| Less than 5 Minutes | 13 | 3.1% |
| 5 to 9 Minutes | 119 | 28.0% |
| 10 to 14 Minutes | 137 | 32.2% |
| 15 to 19 Minutes | 98 | 23.1% |
| 20 to 24 Minutes | 12 | 2.8% |
| 25 to 29 Minutes | 5 | 1.2% |
| 30 to 34 Minutes | 7 | 1.7% |
| 35 to 39 Minutes | 0 | 0.0% |
| 40 to 44 Minutes | 0 | 0.0% |
| 45 to 59 Minutes | 27 | 6.4% |
| 60 to 89 Minutes | 7 | 1.7% |
| 90 or more Minutes | 0 | 0.0% |
Commute Time by Sex in West Crossett
The most common commute times in West Crossett are 5 to 9 minutes (65 commuters, 40.6%) for males and 10 to 14 minutes (99 commuters, 37.4%) for females.
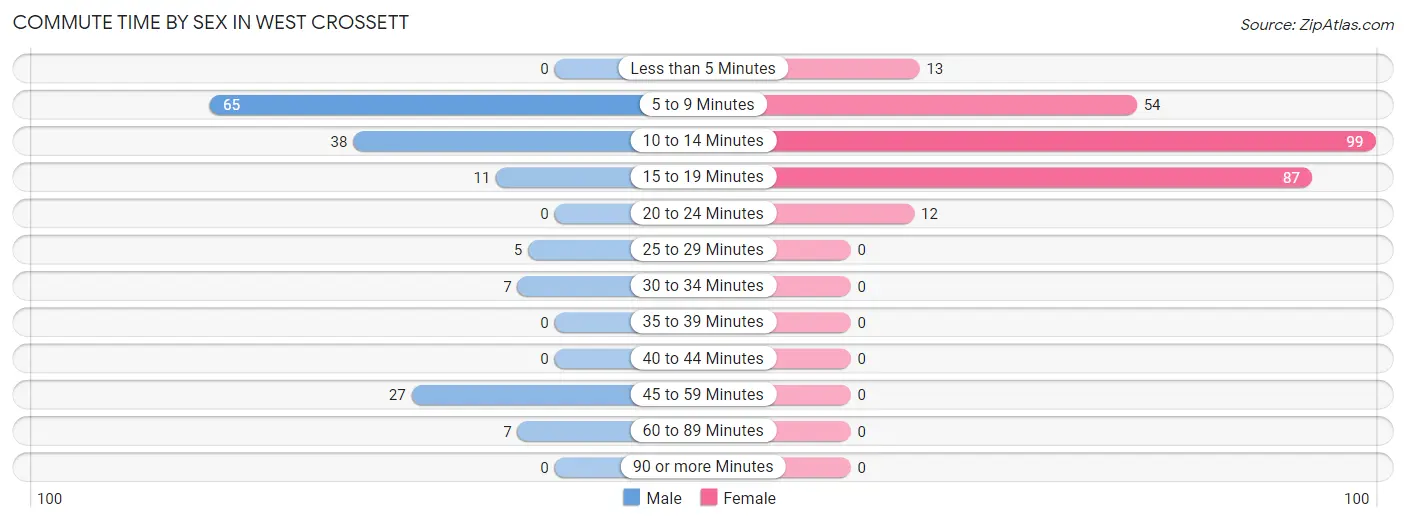
| Commute Time | Male | Female |
| Less than 5 Minutes | 0 (0.0%) | 13 (4.9%) |
| 5 to 9 Minutes | 65 (40.6%) | 54 (20.4%) |
| 10 to 14 Minutes | 38 (23.7%) | 99 (37.4%) |
| 15 to 19 Minutes | 11 (6.9%) | 87 (32.8%) |
| 20 to 24 Minutes | 0 (0.0%) | 12 (4.5%) |
| 25 to 29 Minutes | 5 (3.1%) | 0 (0.0%) |
| 30 to 34 Minutes | 7 (4.4%) | 0 (0.0%) |
| 35 to 39 Minutes | 0 (0.0%) | 0 (0.0%) |
| 40 to 44 Minutes | 0 (0.0%) | 0 (0.0%) |
| 45 to 59 Minutes | 27 (16.9%) | 0 (0.0%) |
| 60 to 89 Minutes | 7 (4.4%) | 0 (0.0%) |
| 90 or more Minutes | 0 (0.0%) | 0 (0.0%) |
Time of Departure to Work by Sex in West Crossett
The most frequent times of departure to work in West Crossett are 6:30 AM to 6:59 AM (53, 33.1%) for males and 7:30 AM to 7:59 AM (90, 34.0%) for females.
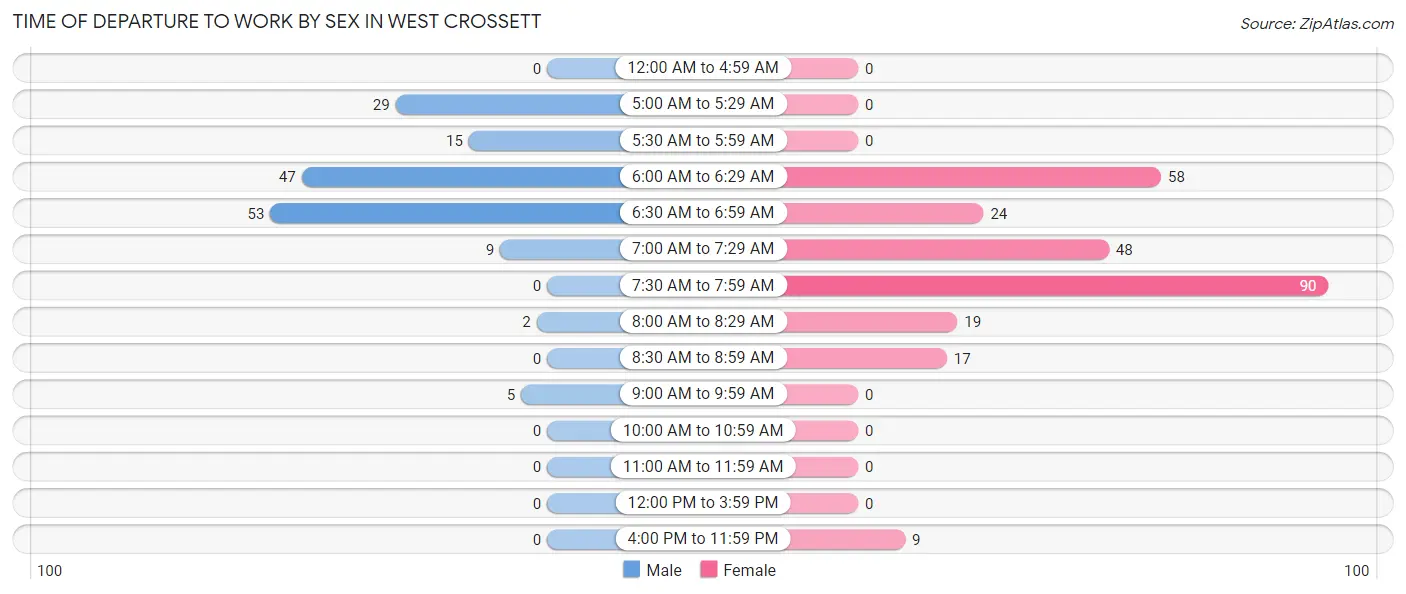
| Time of Departure | Male | Female |
| 12:00 AM to 4:59 AM | 0 (0.0%) | 0 (0.0%) |
| 5:00 AM to 5:29 AM | 29 (18.1%) | 0 (0.0%) |
| 5:30 AM to 5:59 AM | 15 (9.4%) | 0 (0.0%) |
| 6:00 AM to 6:29 AM | 47 (29.4%) | 58 (21.9%) |
| 6:30 AM to 6:59 AM | 53 (33.1%) | 24 (9.1%) |
| 7:00 AM to 7:29 AM | 9 (5.6%) | 48 (18.1%) |
| 7:30 AM to 7:59 AM | 0 (0.0%) | 90 (34.0%) |
| 8:00 AM to 8:29 AM | 2 (1.3%) | 19 (7.2%) |
| 8:30 AM to 8:59 AM | 0 (0.0%) | 17 (6.4%) |
| 9:00 AM to 9:59 AM | 5 (3.1%) | 0 (0.0%) |
| 10:00 AM to 10:59 AM | 0 (0.0%) | 0 (0.0%) |
| 11:00 AM to 11:59 AM | 0 (0.0%) | 0 (0.0%) |
| 12:00 PM to 3:59 PM | 0 (0.0%) | 0 (0.0%) |
| 4:00 PM to 11:59 PM | 0 (0.0%) | 9 (3.4%) |
| Total | 160 (100.0%) | 265 (100.0%) |
Housing Occupancy in West Crossett
Occupancy by Ownership in West Crossett
Of the total 421 dwellings in West Crossett, owner-occupied units account for 384 (91.2%), while renter-occupied units make up 37 (8.8%).
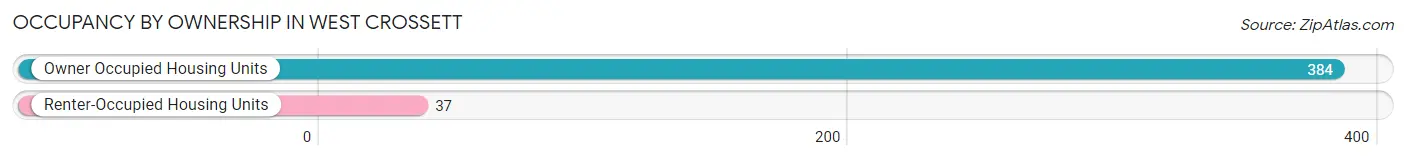
| Occupancy | # Housing Units | % Housing Units |
| Owner Occupied Housing Units | 384 | 91.2% |
| Renter-Occupied Housing Units | 37 | 8.8% |
| Total Occupied Housing Units | 421 | 100.0% |
Occupancy by Household Size in West Crossett
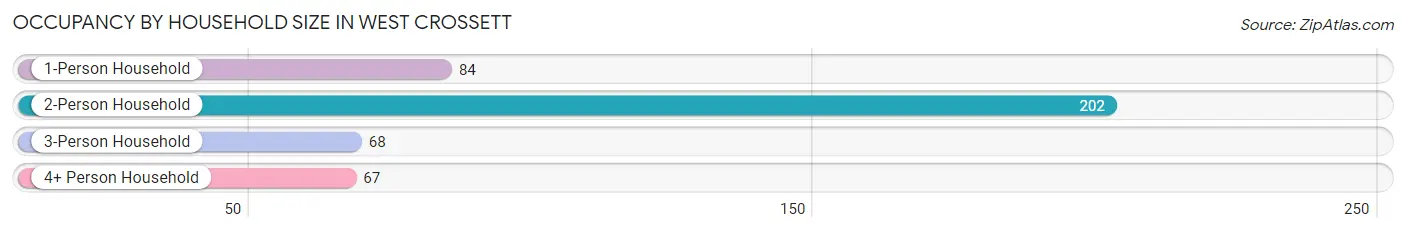
| Household Size | # Housing Units | % Housing Units |
| 1-Person Household | 84 | 20.0% |
| 2-Person Household | 202 | 48.0% |
| 3-Person Household | 68 | 16.2% |
| 4+ Person Household | 67 | 15.9% |
| Total Housing Units | 421 | 100.0% |
Occupancy by Ownership by Household Size in West Crossett
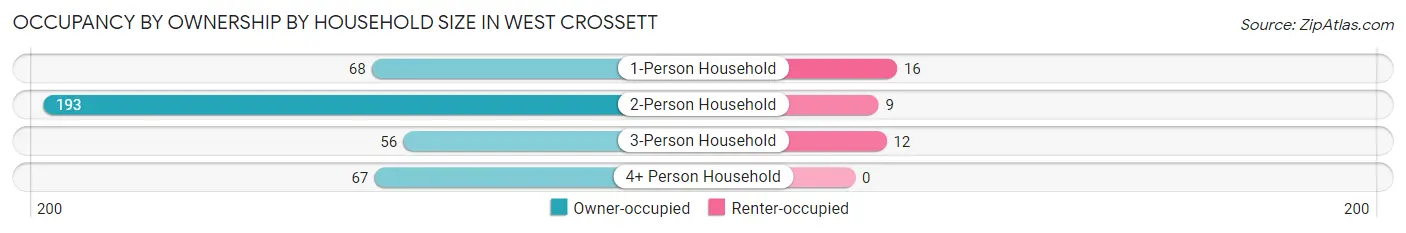
| Household Size | Owner-occupied | Renter-occupied |
| 1-Person Household | 68 (80.9%) | 16 (19.1%) |
| 2-Person Household | 193 (95.5%) | 9 (4.5%) |
| 3-Person Household | 56 (82.4%) | 12 (17.6%) |
| 4+ Person Household | 67 (100.0%) | 0 (0.0%) |
| Total Housing Units | 384 (91.2%) | 37 (8.8%) |
Occupancy by Educational Attainment in West Crossett
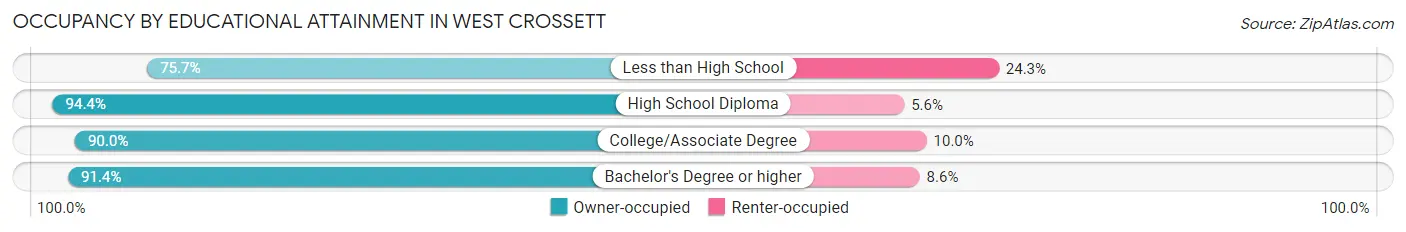
| Household Size | Owner-occupied | Renter-occupied |
| Less than High School | 28 (75.7%) | 9 (24.3%) |
| High School Diploma | 204 (94.4%) | 12 (5.6%) |
| College/Associate Degree | 99 (90.0%) | 11 (10.0%) |
| Bachelor's Degree or higher | 53 (91.4%) | 5 (8.6%) |
Occupancy by Age of Householder in West Crossett
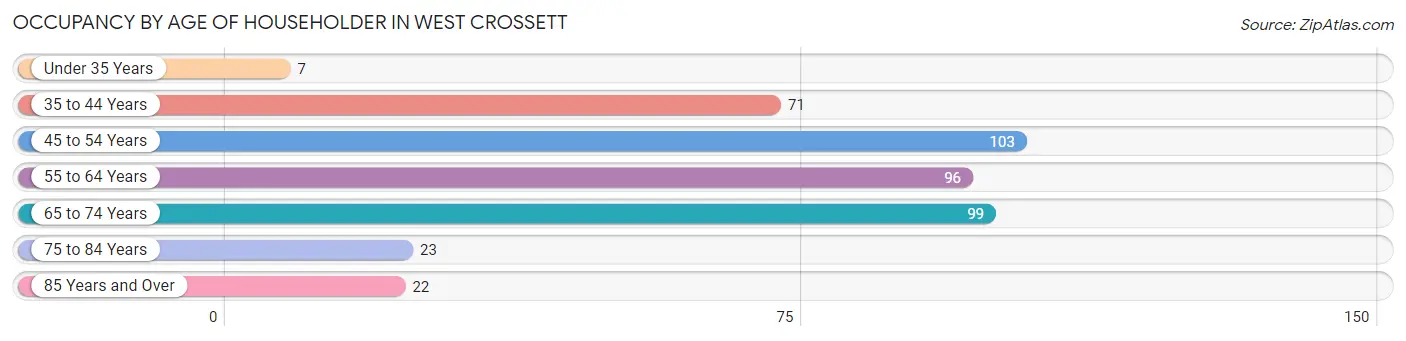
| Age Bracket | # Households | % Households |
| Under 35 Years | 7 | 1.7% |
| 35 to 44 Years | 71 | 16.9% |
| 45 to 54 Years | 103 | 24.5% |
| 55 to 64 Years | 96 | 22.8% |
| 65 to 74 Years | 99 | 23.5% |
| 75 to 84 Years | 23 | 5.5% |
| 85 Years and Over | 22 | 5.2% |
| Total | 421 | 100.0% |
Housing Finances in West Crossett
Median Income by Occupancy in West Crossett
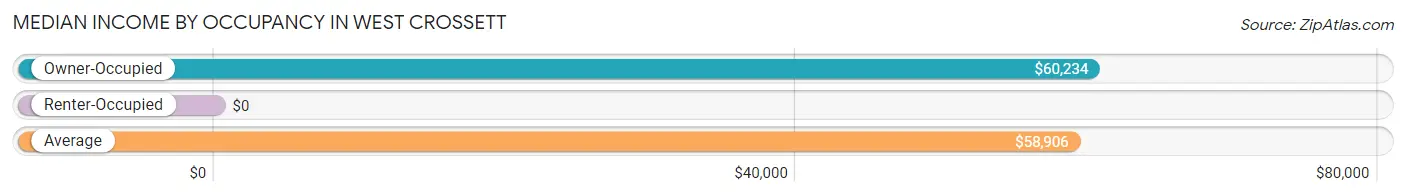
| Occupancy Type | # Households | Median Income |
| Owner-Occupied | 384 (91.2%) | $60,234 |
| Renter-Occupied | 37 (8.8%) | $0 |
| Average | 421 (100.0%) | $58,906 |
Occupancy by Householder Income Bracket in West Crossett
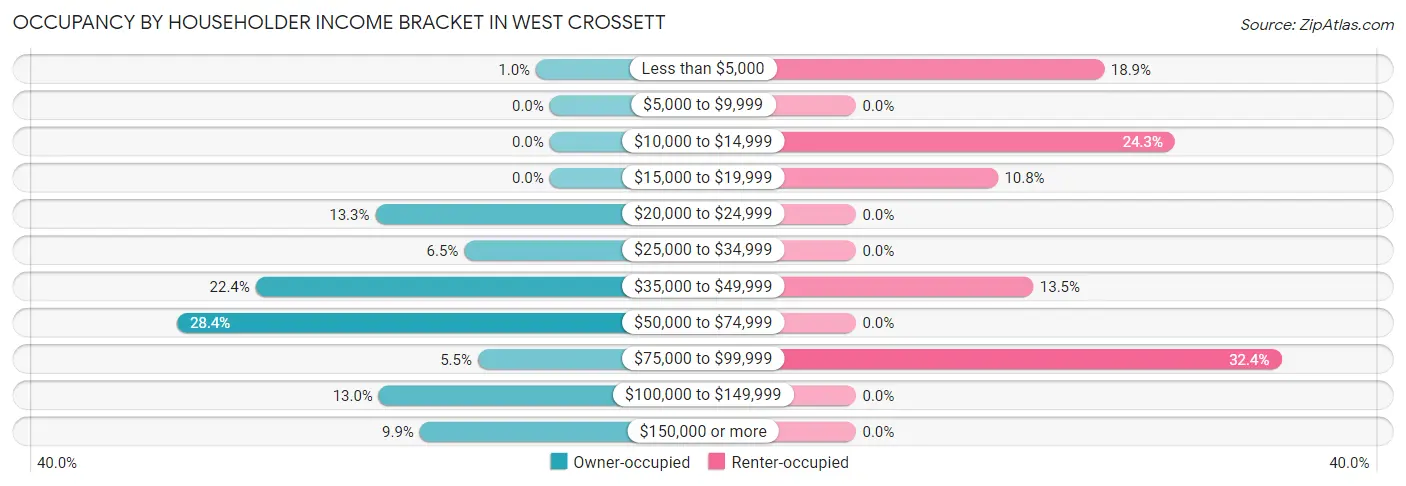
| Income Bracket | Owner-occupied | Renter-occupied |
| Less than $5,000 | 4 (1.0%) | 7 (18.9%) |
| $5,000 to $9,999 | 0 (0.0%) | 0 (0.0%) |
| $10,000 to $14,999 | 0 (0.0%) | 9 (24.3%) |
| $15,000 to $19,999 | 0 (0.0%) | 4 (10.8%) |
| $20,000 to $24,999 | 51 (13.3%) | 0 (0.0%) |
| $25,000 to $34,999 | 25 (6.5%) | 0 (0.0%) |
| $35,000 to $49,999 | 86 (22.4%) | 5 (13.5%) |
| $50,000 to $74,999 | 109 (28.4%) | 0 (0.0%) |
| $75,000 to $99,999 | 21 (5.5%) | 12 (32.4%) |
| $100,000 to $149,999 | 50 (13.0%) | 0 (0.0%) |
| $150,000 or more | 38 (9.9%) | 0 (0.0%) |
| Total | 384 (100.0%) | 37 (100.0%) |
Monthly Housing Cost Tiers in West Crossett
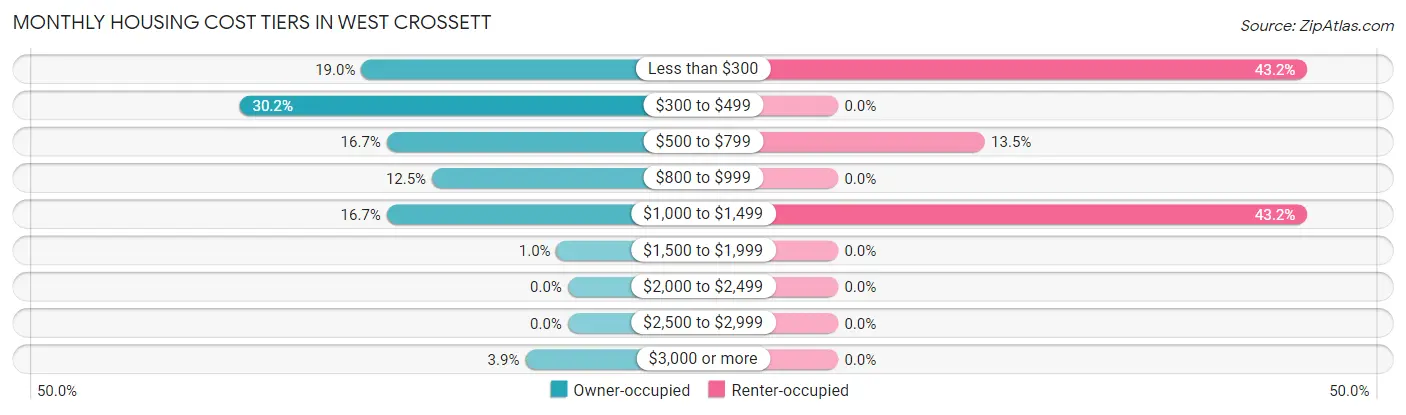
| Monthly Cost | Owner-occupied | Renter-occupied |
| Less than $300 | 73 (19.0%) | 16 (43.2%) |
| $300 to $499 | 116 (30.2%) | 0 (0.0%) |
| $500 to $799 | 64 (16.7%) | 5 (13.5%) |
| $800 to $999 | 48 (12.5%) | 0 (0.0%) |
| $1,000 to $1,499 | 64 (16.7%) | 16 (43.2%) |
| $1,500 to $1,999 | 4 (1.0%) | 0 (0.0%) |
| $2,000 to $2,499 | 0 (0.0%) | 0 (0.0%) |
| $2,500 to $2,999 | 0 (0.0%) | 0 (0.0%) |
| $3,000 or more | 15 (3.9%) | 0 (0.0%) |
| Total | 384 (100.0%) | 37 (100.0%) |
Physical Housing Characteristics in West Crossett
Housing Structures in West Crossett
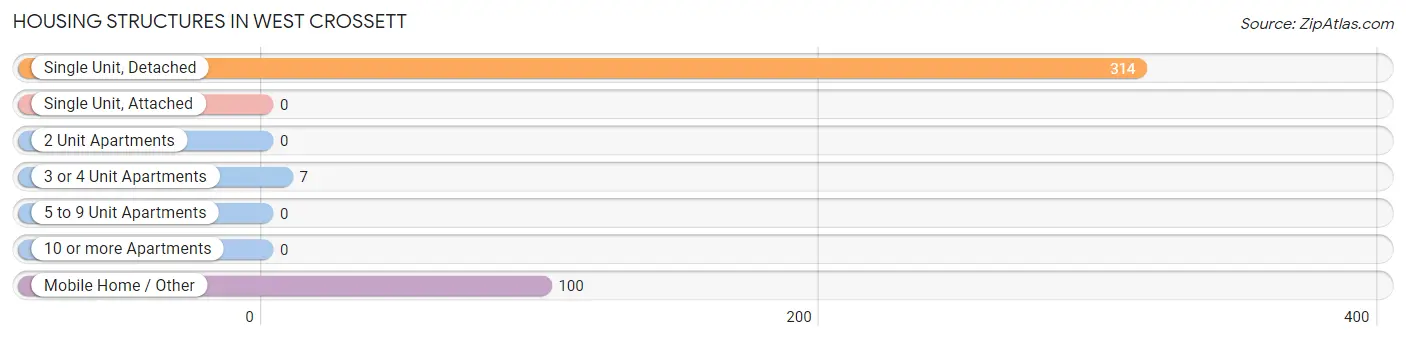
| Structure Type | # Housing Units | % Housing Units |
| Single Unit, Detached | 314 | 74.6% |
| Single Unit, Attached | 0 | 0.0% |
| 2 Unit Apartments | 0 | 0.0% |
| 3 or 4 Unit Apartments | 7 | 1.7% |
| 5 to 9 Unit Apartments | 0 | 0.0% |
| 10 or more Apartments | 0 | 0.0% |
| Mobile Home / Other | 100 | 23.7% |
| Total | 421 | 100.0% |
Housing Structures by Occupancy in West Crossett
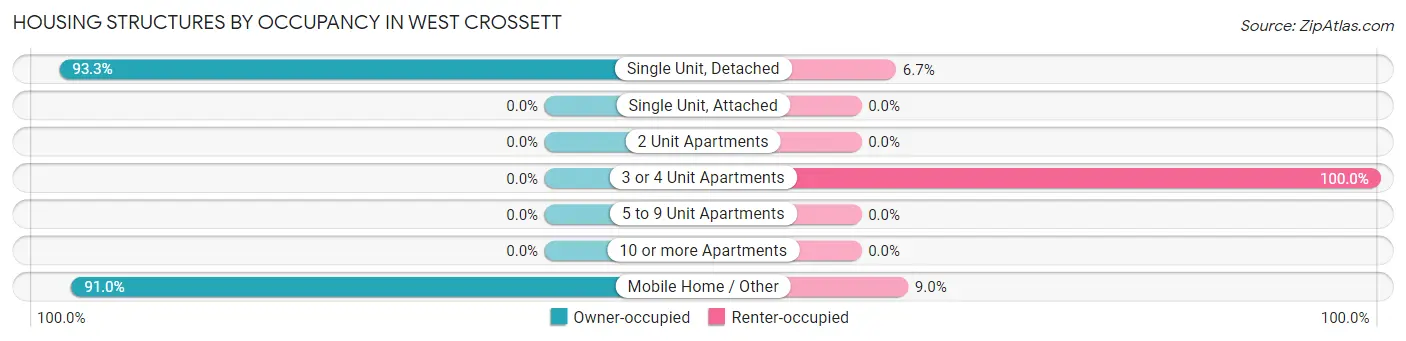
| Structure Type | Owner-occupied | Renter-occupied |
| Single Unit, Detached | 293 (93.3%) | 21 (6.7%) |
| Single Unit, Attached | 0 (0.0%) | 0 (0.0%) |
| 2 Unit Apartments | 0 (0.0%) | 0 (0.0%) |
| 3 or 4 Unit Apartments | 0 (0.0%) | 7 (100.0%) |
| 5 to 9 Unit Apartments | 0 (0.0%) | 0 (0.0%) |
| 10 or more Apartments | 0 (0.0%) | 0 (0.0%) |
| Mobile Home / Other | 91 (91.0%) | 9 (9.0%) |
| Total | 384 (91.2%) | 37 (8.8%) |
Housing Structures by Number of Rooms in West Crossett

| Number of Rooms | Owner-occupied | Renter-occupied |
| 1 Room | 0 (0.0%) | 0 (0.0%) |
| 2 or 3 Rooms | 0 (0.0%) | 7 (18.9%) |
| 4 or 5 Rooms | 106 (27.6%) | 9 (24.3%) |
| 6 or 7 Rooms | 222 (57.8%) | 16 (43.2%) |
| 8 or more Rooms | 56 (14.6%) | 5 (13.5%) |
| Total | 384 (100.0%) | 37 (100.0%) |
Housing Structure by Heating Type in West Crossett
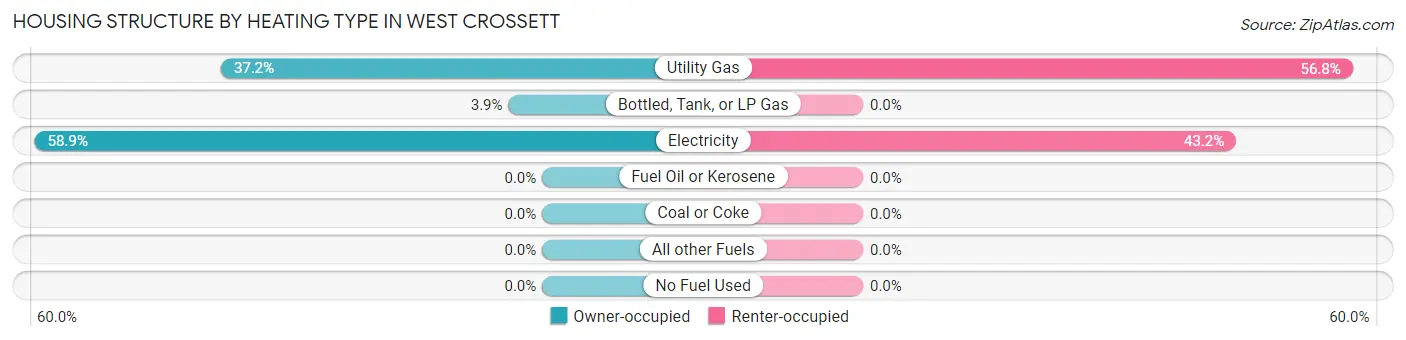
| Heating Type | Owner-occupied | Renter-occupied |
| Utility Gas | 143 (37.2%) | 21 (56.8%) |
| Bottled, Tank, or LP Gas | 15 (3.9%) | 0 (0.0%) |
| Electricity | 226 (58.9%) | 16 (43.2%) |
| Fuel Oil or Kerosene | 0 (0.0%) | 0 (0.0%) |
| Coal or Coke | 0 (0.0%) | 0 (0.0%) |
| All other Fuels | 0 (0.0%) | 0 (0.0%) |
| No Fuel Used | 0 (0.0%) | 0 (0.0%) |
| Total | 384 (100.0%) | 37 (100.0%) |
Household Vehicle Usage in West Crossett
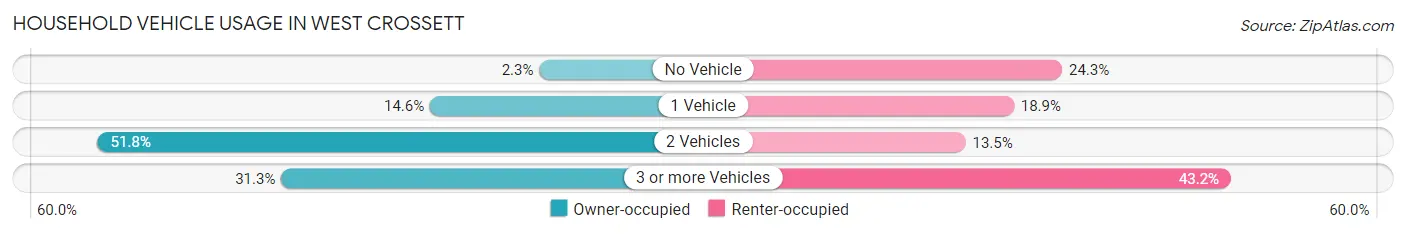
| Vehicles per Household | Owner-occupied | Renter-occupied |
| No Vehicle | 9 (2.3%) | 9 (24.3%) |
| 1 Vehicle | 56 (14.6%) | 7 (18.9%) |
| 2 Vehicles | 199 (51.8%) | 5 (13.5%) |
| 3 or more Vehicles | 120 (31.2%) | 16 (43.2%) |
| Total | 384 (100.0%) | 37 (100.0%) |
Real Estate & Mortgages in West Crossett
Real Estate and Mortgage Overview in West Crossett
| Characteristic | Without Mortgage | With Mortgage |
| Housing Units | 226 | 158 |
| Median Property Value | $93,500 | $79,300 |
| Median Household Income | $59,000 | $25 |
| Monthly Housing Costs | $348 | $15 |
| Real Estate Taxes | $851 | $30 |
Property Value by Mortgage Status in West Crossett
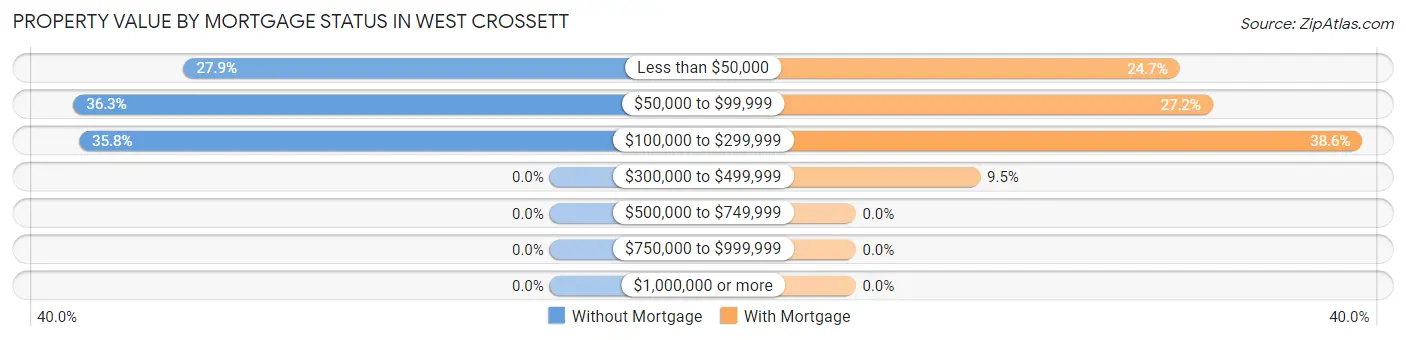
| Property Value | Without Mortgage | With Mortgage |
| Less than $50,000 | 63 (27.9%) | 39 (24.7%) |
| $50,000 to $99,999 | 82 (36.3%) | 43 (27.2%) |
| $100,000 to $299,999 | 81 (35.8%) | 61 (38.6%) |
| $300,000 to $499,999 | 0 (0.0%) | 15 (9.5%) |
| $500,000 to $749,999 | 0 (0.0%) | 0 (0.0%) |
| $750,000 to $999,999 | 0 (0.0%) | 0 (0.0%) |
| $1,000,000 or more | 0 (0.0%) | 0 (0.0%) |
| Total | 226 (100.0%) | 158 (100.0%) |
Household Income by Mortgage Status in West Crossett
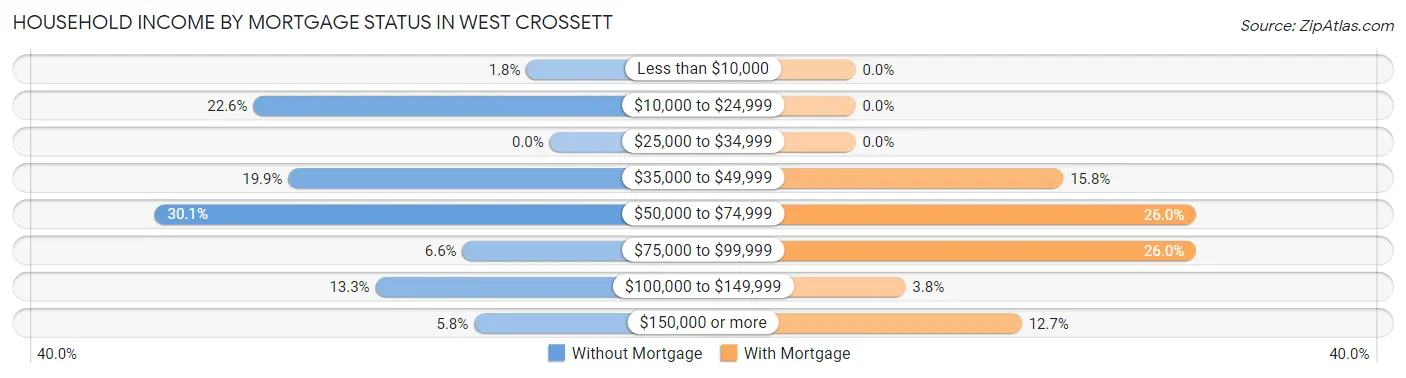
| Household Income | Without Mortgage | With Mortgage |
| Less than $10,000 | 4 (1.8%) | 0 (0.0%) |
| $10,000 to $24,999 | 51 (22.6%) | 0 (0.0%) |
| $25,000 to $34,999 | 0 (0.0%) | 0 (0.0%) |
| $35,000 to $49,999 | 45 (19.9%) | 25 (15.8%) |
| $50,000 to $74,999 | 68 (30.1%) | 41 (26.0%) |
| $75,000 to $99,999 | 15 (6.6%) | 41 (26.0%) |
| $100,000 to $149,999 | 30 (13.3%) | 6 (3.8%) |
| $150,000 or more | 13 (5.8%) | 20 (12.7%) |
| Total | 226 (100.0%) | 158 (100.0%) |
Property Value to Household Income Ratio in West Crossett
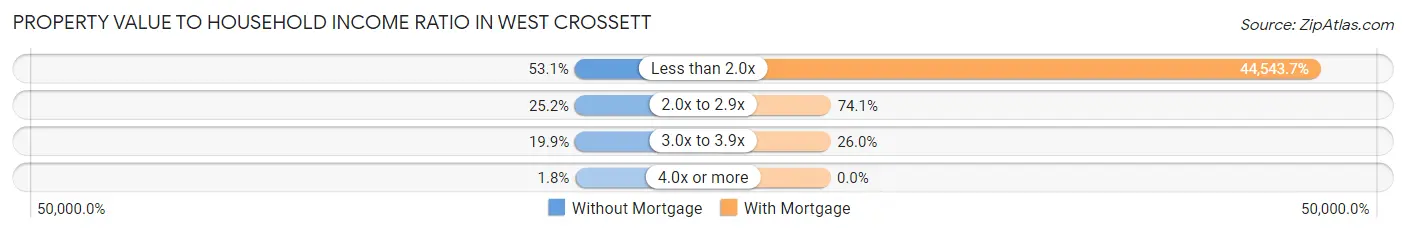
| Value-to-Income Ratio | Without Mortgage | With Mortgage |
| Less than 2.0x | 120 (53.1%) | 70,379 (44,543.7%) |
| 2.0x to 2.9x | 57 (25.2%) | 117 (74.1%) |
| 3.0x to 3.9x | 45 (19.9%) | 41 (26.0%) |
| 4.0x or more | 4 (1.8%) | 0 (0.0%) |
| Total | 226 (100.0%) | 158 (100.0%) |
Real Estate Taxes by Mortgage Status in West Crossett
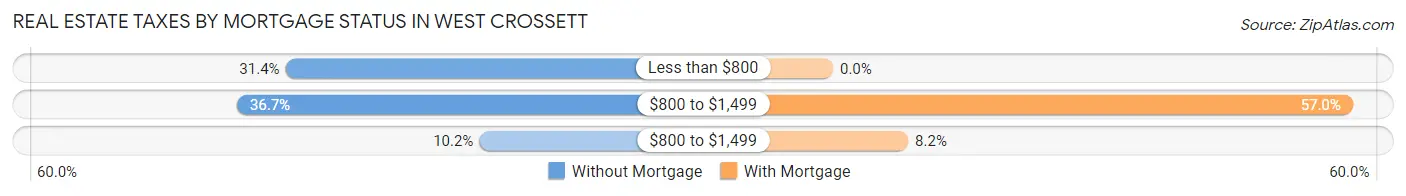
| Property Taxes | Without Mortgage | With Mortgage |
| Less than $800 | 71 (31.4%) | 0 (0.0%) |
| $800 to $1,499 | 83 (36.7%) | 90 (57.0%) |
| $800 to $1,499 | 23 (10.2%) | 13 (8.2%) |
| Total | 226 (100.0%) | 158 (100.0%) |
Health & Disability in West Crossett
Health Insurance Coverage by Age in West Crossett
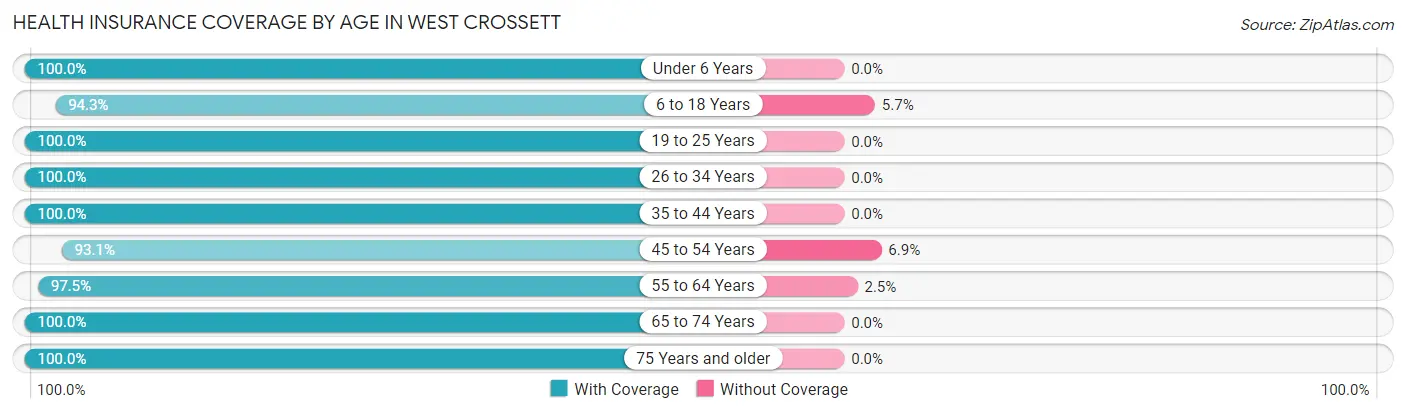
| Age Bracket | With Coverage | Without Coverage |
| Under 6 Years | 56 (100.0%) | 0 (0.0%) |
| 6 to 18 Years | 231 (94.3%) | 14 (5.7%) |
| 19 to 25 Years | 33 (100.0%) | 0 (0.0%) |
| 26 to 34 Years | 42 (100.0%) | 0 (0.0%) |
| 35 to 44 Years | 119 (100.0%) | 0 (0.0%) |
| 45 to 54 Years | 148 (93.1%) | 11 (6.9%) |
| 55 to 64 Years | 158 (97.5%) | 4 (2.5%) |
| 65 to 74 Years | 214 (100.0%) | 0 (0.0%) |
| 75 Years and older | 166 (100.0%) | 0 (0.0%) |
| Total | 1,167 (97.6%) | 29 (2.4%) |
Health Insurance Coverage by Citizenship Status in West Crossett
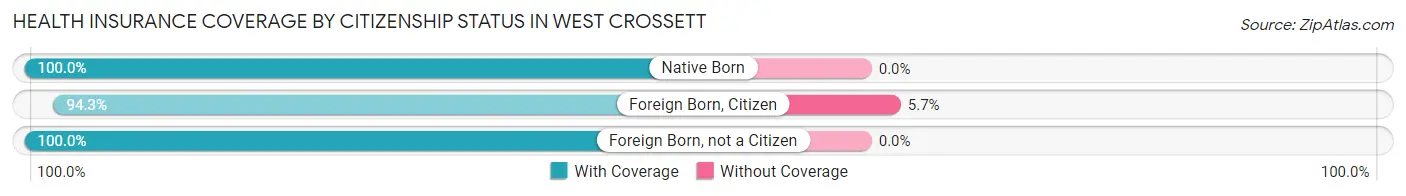
| Citizenship Status | With Coverage | Without Coverage |
| Native Born | 56 (100.0%) | 0 (0.0%) |
| Foreign Born, Citizen | 231 (94.3%) | 14 (5.7%) |
| Foreign Born, not a Citizen | 33 (100.0%) | 0 (0.0%) |
Health Insurance Coverage by Household Income in West Crossett
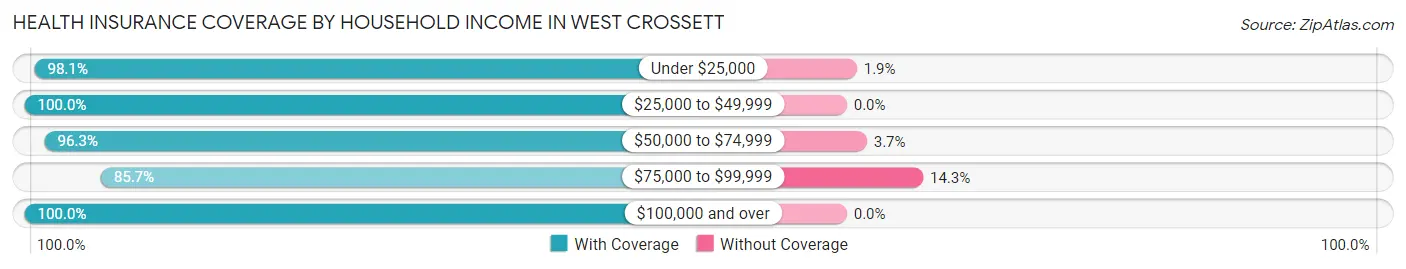
| Household Income | With Coverage | Without Coverage |
| Under $25,000 | 210 (98.1%) | 4 (1.9%) |
| $25,000 to $49,999 | 220 (100.0%) | 0 (0.0%) |
| $50,000 to $74,999 | 283 (96.3%) | 11 (3.7%) |
| $75,000 to $99,999 | 84 (85.7%) | 14 (14.3%) |
| $100,000 and over | 370 (100.0%) | 0 (0.0%) |
Public vs Private Health Insurance Coverage by Age in West Crossett
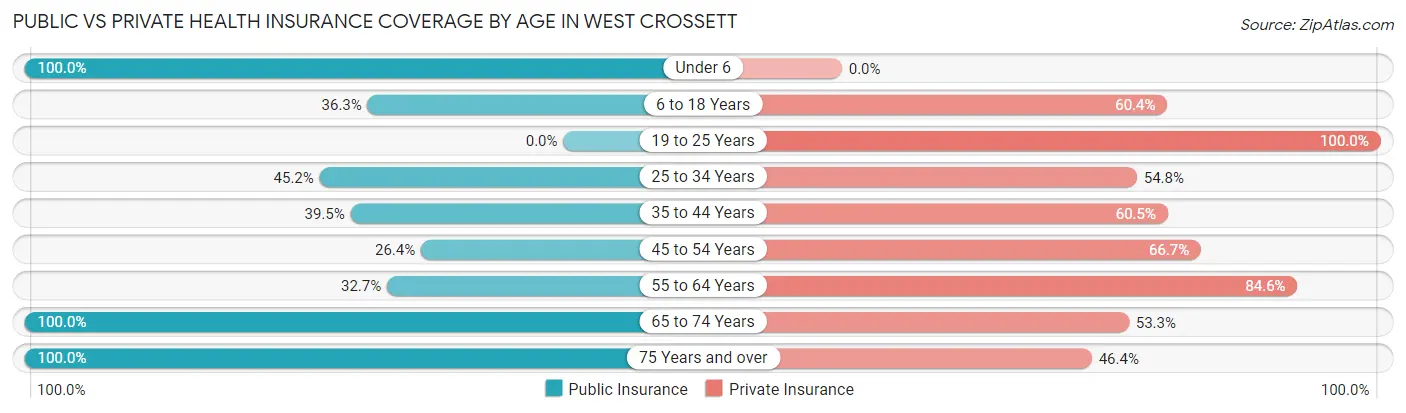
| Age Bracket | Public Insurance | Private Insurance |
| Under 6 | 56 (100.0%) | 0 (0.0%) |
| 6 to 18 Years | 89 (36.3%) | 148 (60.4%) |
| 19 to 25 Years | 0 (0.0%) | 33 (100.0%) |
| 25 to 34 Years | 19 (45.2%) | 23 (54.8%) |
| 35 to 44 Years | 47 (39.5%) | 72 (60.5%) |
| 45 to 54 Years | 42 (26.4%) | 106 (66.7%) |
| 55 to 64 Years | 53 (32.7%) | 137 (84.6%) |
| 65 to 74 Years | 214 (100.0%) | 114 (53.3%) |
| 75 Years and over | 166 (100.0%) | 77 (46.4%) |
| Total | 686 (57.4%) | 710 (59.4%) |
Disability Status by Sex by Age in West Crossett
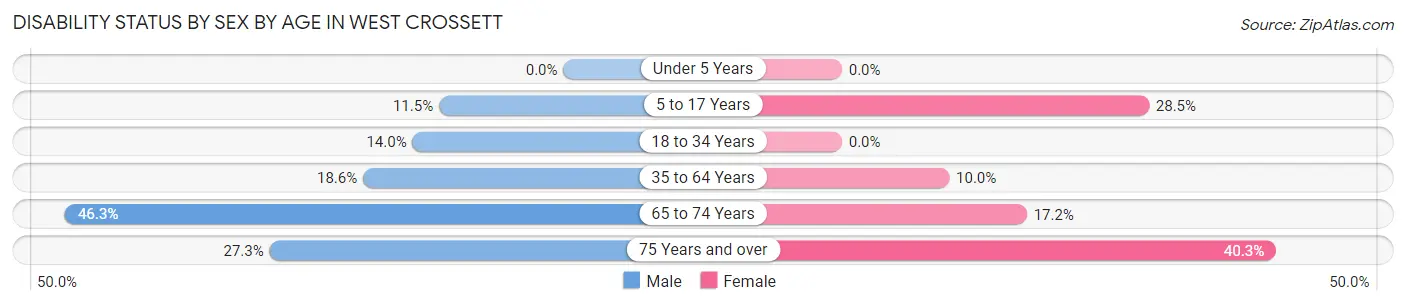
| Age Bracket | Male | Female |
| Under 5 Years | 0 (0.0%) | 0 (0.0%) |
| 5 to 17 Years | 6 (11.5%) | 55 (28.5%) |
| 18 to 34 Years | 7 (14.0%) | 0 (0.0%) |
| 35 to 64 Years | 37 (18.6%) | 24 (10.0%) |
| 65 to 74 Years | 37 (46.3%) | 23 (17.2%) |
| 75 Years and over | 27 (27.3%) | 27 (40.3%) |
Disability Class by Sex by Age in West Crossett
Disability Class: Hearing Difficulty
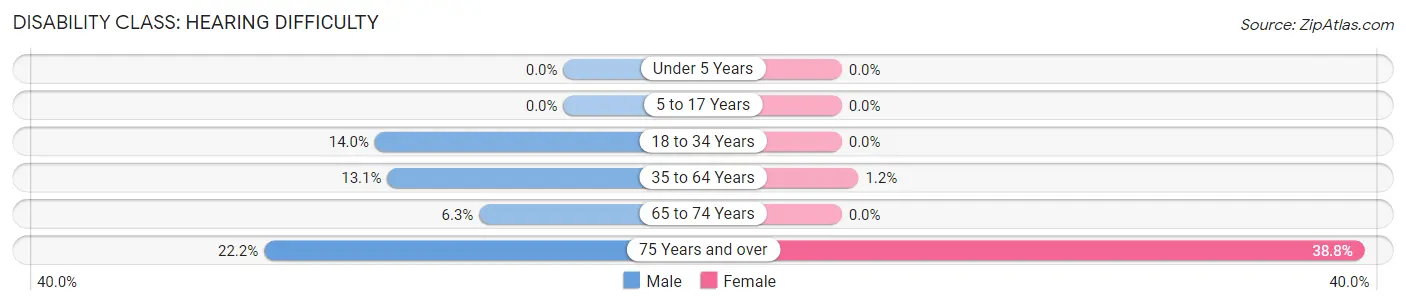
| Age Bracket | Male | Female |
| Under 5 Years | 0 (0.0%) | 0 (0.0%) |
| 5 to 17 Years | 0 (0.0%) | 0 (0.0%) |
| 18 to 34 Years | 7 (14.0%) | 0 (0.0%) |
| 35 to 64 Years | 26 (13.1%) | 3 (1.2%) |
| 65 to 74 Years | 5 (6.2%) | 0 (0.0%) |
| 75 Years and over | 22 (22.2%) | 26 (38.8%) |
Disability Class: Vision Difficulty
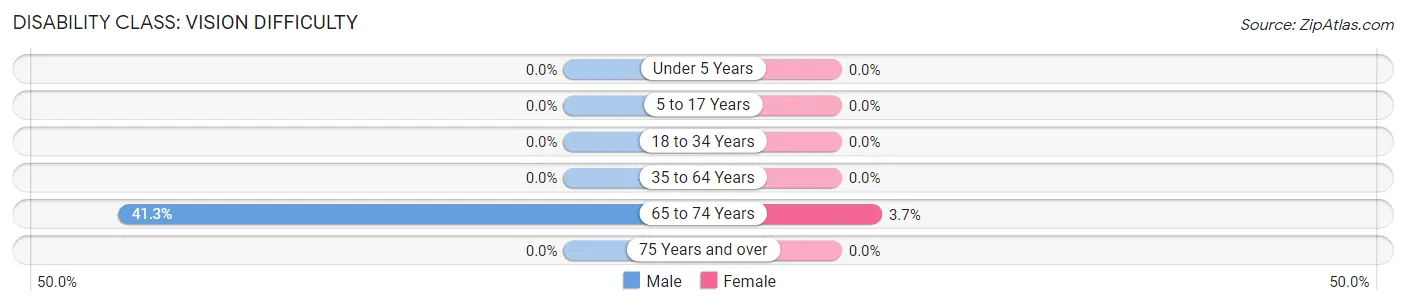
| Age Bracket | Male | Female |
| Under 5 Years | 0 (0.0%) | 0 (0.0%) |
| 5 to 17 Years | 0 (0.0%) | 0 (0.0%) |
| 18 to 34 Years | 0 (0.0%) | 0 (0.0%) |
| 35 to 64 Years | 0 (0.0%) | 0 (0.0%) |
| 65 to 74 Years | 33 (41.2%) | 5 (3.7%) |
| 75 Years and over | 0 (0.0%) | 0 (0.0%) |
Disability Class: Cognitive Difficulty
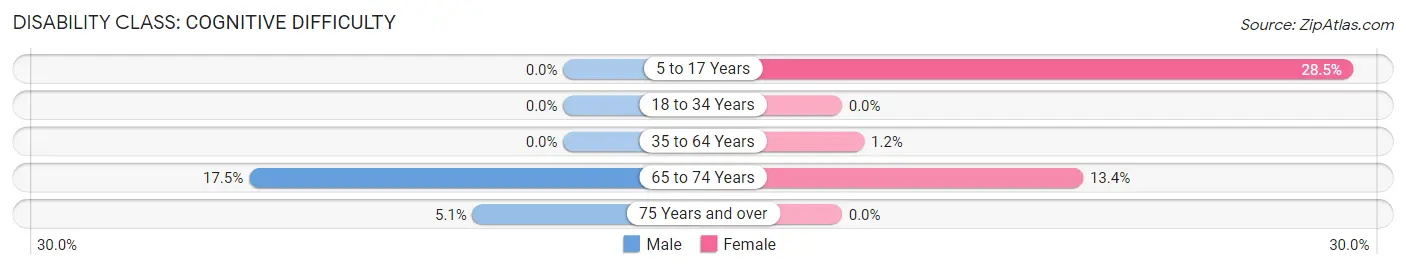
| Age Bracket | Male | Female |
| 5 to 17 Years | 0 (0.0%) | 55 (28.5%) |
| 18 to 34 Years | 0 (0.0%) | 0 (0.0%) |
| 35 to 64 Years | 0 (0.0%) | 3 (1.2%) |
| 65 to 74 Years | 14 (17.5%) | 18 (13.4%) |
| 75 Years and over | 5 (5.1%) | 0 (0.0%) |
Disability Class: Ambulatory Difficulty
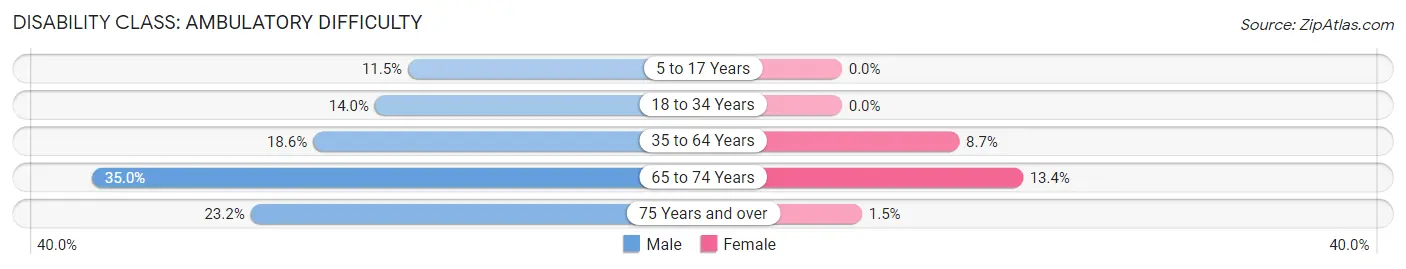
| Age Bracket | Male | Female |
| 5 to 17 Years | 6 (11.5%) | 0 (0.0%) |
| 18 to 34 Years | 7 (14.0%) | 0 (0.0%) |
| 35 to 64 Years | 37 (18.6%) | 21 (8.7%) |
| 65 to 74 Years | 28 (35.0%) | 18 (13.4%) |
| 75 Years and over | 23 (23.2%) | 1 (1.5%) |
Disability Class: Self-Care Difficulty
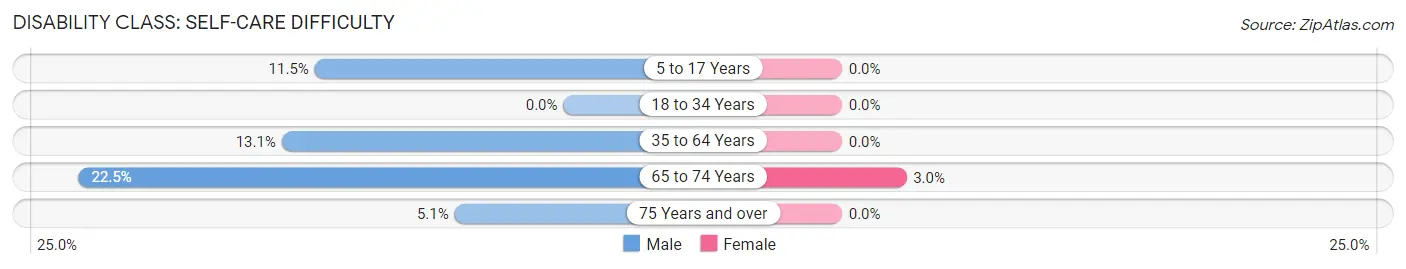
| Age Bracket | Male | Female |
| 5 to 17 Years | 6 (11.5%) | 0 (0.0%) |
| 18 to 34 Years | 0 (0.0%) | 0 (0.0%) |
| 35 to 64 Years | 26 (13.1%) | 0 (0.0%) |
| 65 to 74 Years | 18 (22.5%) | 4 (3.0%) |
| 75 Years and over | 5 (5.1%) | 0 (0.0%) |
Technology Access in West Crossett
Computing Device Access in West Crossett
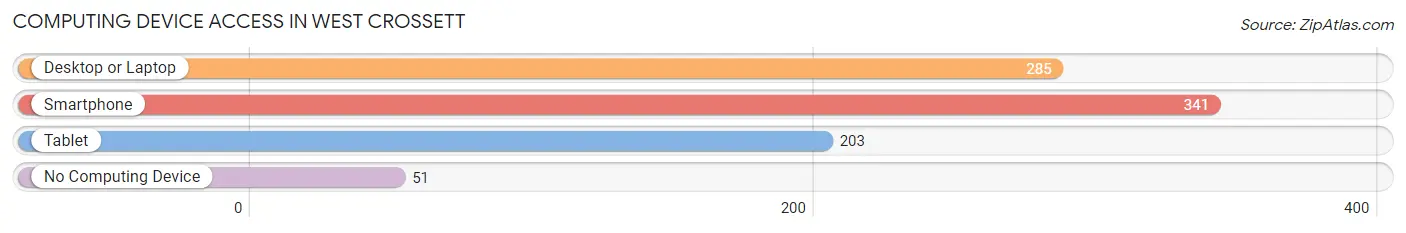
| Device Type | # Households | % Households |
| Desktop or Laptop | 285 | 67.7% |
| Smartphone | 341 | 81.0% |
| Tablet | 203 | 48.2% |
| No Computing Device | 51 | 12.1% |
| Total | 421 | 100.0% |
Internet Access in West Crossett
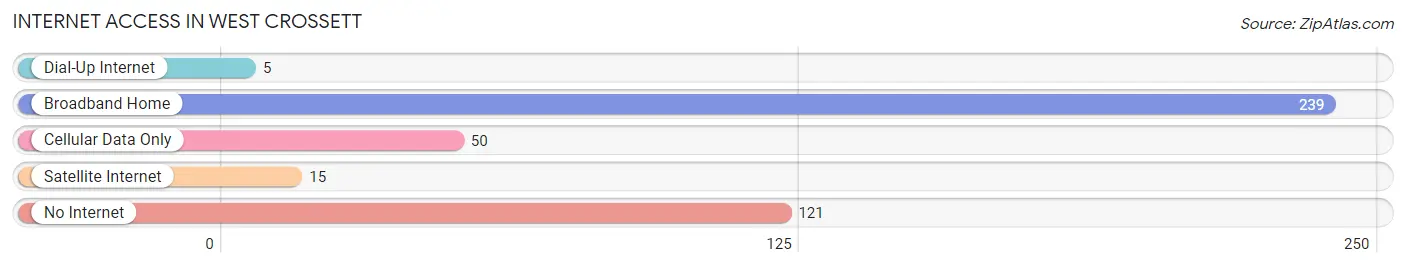
| Internet Type | # Households | % Households |
| Dial-Up Internet | 5 | 1.2% |
| Broadband Home | 239 | 56.8% |
| Cellular Data Only | 50 | 11.9% |
| Satellite Internet | 15 | 3.6% |
| No Internet | 121 | 28.7% |
| Total | 421 | 100.0% |
West Crossett Summary
Crossett, Arkansas is a small town located in Ashley County in the southeastern corner of the state. It is situated on the banks of the Saline River, approximately 30 miles south of El Dorado and 40 miles north of Monticello. The town was founded in 1883 by the Crossett Lumber Company, which was owned by the Crossett family. The company was one of the largest lumber producers in the South and was responsible for the development of the town.
Crossett is located in the heart of the Arkansas Timberlands, an area known for its vast forests and abundant wildlife. The town is surrounded by the Ouachita National Forest, which provides a variety of recreational activities such as camping, fishing, hunting, and hiking. The town is also home to the Crossett Experimental Forest, which is managed by the United States Forest Service.
Crossett has a population of approximately 5,000 people, with a median age of 38. The town is predominantly white, with African Americans making up about 10% of the population. The median household income is $31,000, and the median home value is $80,000. The town is served by the Ashley County School District, which includes two elementary schools, one middle school, and one high school.
The economy of Crossett is largely based on the timber industry. The Crossett Lumber Company is still the largest employer in the area, and the town is home to several other lumber-related businesses. The town is also home to several manufacturing companies, including a paper mill, a furniture factory, and a plastics plant.
Crossett is served by two major highways, US Highway 82 and Arkansas Highway 8. The town is also served by the Union Pacific Railroad, which provides freight service to the area. The town is home to several churches, including the First Baptist Church, the First United Methodist Church, and the Church of Christ.
Crossett is a small town with a rich history and a bright future. The town is home to a variety of businesses, churches, and recreational activities, making it an ideal place to live and work. With its close proximity to the Ouachita National Forest and the Crossett Experimental Forest, Crossett is a great place to explore the outdoors and enjoy the beauty of the Arkansas Timberlands.
Common Questions
What is the Total Population of West Crossett?
Total Population of West Crossett is 1,196.
What is the Total Male Population of West Crossett?
Total Male Population of West Crossett is 519.
What is the Total Female Population of West Crossett?
Total Female Population of West Crossett is 677.
What is the Ratio of Males per 100 Females in West Crossett?
There are 76.66 Males per 100 Females in West Crossett.
What is the Ratio of Females per 100 Males in West Crossett?
There are 130.44 Females per 100 Males in West Crossett.
What is the Median Population Age in West Crossett?
Median Population Age in West Crossett is 51.9 Years.
What is the Average Family Size in West Crossett
Average Family Size in West Crossett is 3.3 People.
What is the Average Household Size in West Crossett
Average Household Size in West Crossett is 2.8 People.
What is Per Capita Income in West Crossett?
Per Capita income in West Crossett is $28,533.
What is the Median Family Income in West Crossett?
Median Family Income in West Crossett is $62,070.
What is the Median Household income in West Crossett?
Median Household Income in West Crossett is $58,906.
What is Income or Wage Gap in West Crossett?
Income or Wage Gap in West Crossett is 34.7%.
Women in West Crossett earn 65.3 cents for every dollar earned by a man.
What is Inequality or Gini Index in West Crossett?
Inequality or Gini Index in West Crossett is 0.45.
How Large is the Labor Force in West Crossett?
There are 443 People in the Labor Forcein in West Crossett.
What is the Percentage of People in the Labor Force in West Crossett?
48.4% of People are in the Labor Force in West Crossett.
What is the Unemployment Rate in West Crossett?
Unemployment Rate in West Crossett is 2.9%.