Owyhee, NV Map & Demographics
Owyhee Map
Owyhee Overview
$22,464
PER CAPITA INCOME
$65,625
AVG FAMILY INCOME
$56,000
AVG HOUSEHOLD INCOME
26.4%
WAGE / INCOME GAP [ % ]
73.6¢/ $1
WAGE / INCOME GAP [ $ ]
0.40
INEQUALITY / GINI INDEX
1,012
TOTAL POPULATION
412
MALE POPULATION
600
FEMALE POPULATION
68.67
MALES / 100 FEMALES
145.63
FEMALES / 100 MALES
37.3
MEDIAN AGE
4.6
AVG FAMILY SIZE
3.4
AVG HOUSEHOLD SIZE
416
LABOR FORCE [ PEOPLE ]
55.6%
PERCENT IN LABOR FORCE
5.5%
UNEMPLOYMENT RATE
Owyhee Zip Codes
Owyhee Area Codes
Income in Owyhee
Income Overview in Owyhee
Per Capita Income in Owyhee is $22,464, while median incomes of families and households are $65,625 and $56,000 respectively.
| Characteristic | Number | Measure |
| Per Capita Income | 1,012 | $22,464 |
| Median Family Income | 179 | $65,625 |
| Mean Family Income | 179 | $66,701 |
| Median Household Income | 298 | $56,000 |
| Mean Household Income | 298 | $59,297 |
| Income Deficit | 179 | $0 |
| Wage / Income Gap (%) | 1,012 | 26.37% |
| Wage / Income Gap ($) | 1,012 | 73.63¢ per $1 |
| Gini / Inequality Index | 1,012 | 0.40 |
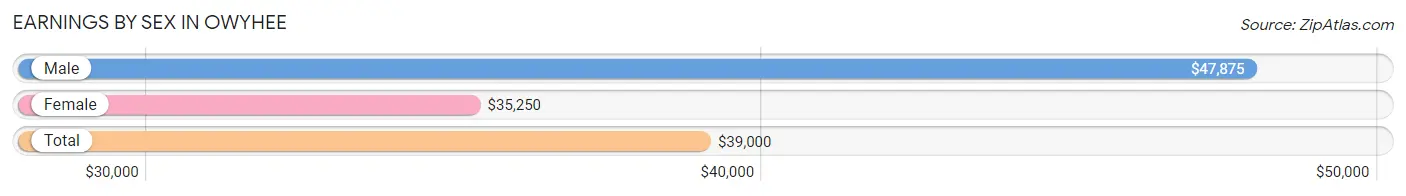
Earnings by Sex in Owyhee
Average Earnings in Owyhee are $39,000, $47,875 for men and $35,250 for women, a difference of 26.4%.
| Sex | Number | Average Earnings |
| Male | 217 (48.4%) | $47,875 |
| Female | 231 (51.6%) | $35,250 |
| Total | 448 (100.0%) | $39,000 |
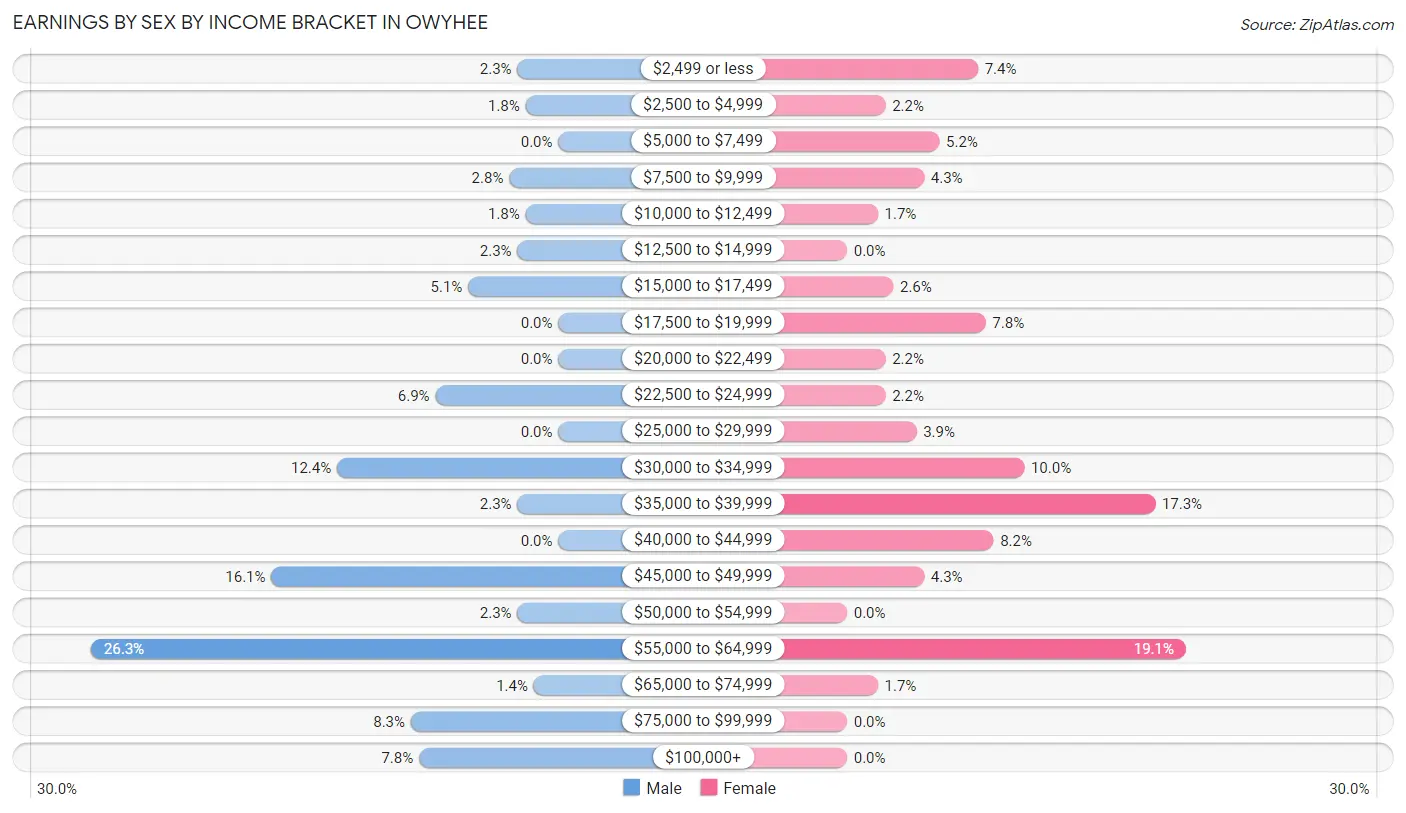
Earnings by Sex by Income Bracket in Owyhee
The most common earnings brackets in Owyhee are $55,000 to $64,999 for men (57 | 26.3%) and $55,000 to $64,999 for women (44 | 19.1%).
| Income | Male | Female |
| $2,499 or less | 5 (2.3%) | 17 (7.4%) |
| $2,500 to $4,999 | 4 (1.8%) | 5 (2.2%) |
| $5,000 to $7,499 | 0 (0.0%) | 12 (5.2%) |
| $7,500 to $9,999 | 6 (2.8%) | 10 (4.3%) |
| $10,000 to $12,499 | 4 (1.8%) | 4 (1.7%) |
| $12,500 to $14,999 | 5 (2.3%) | 0 (0.0%) |
| $15,000 to $17,499 | 11 (5.1%) | 6 (2.6%) |
| $17,500 to $19,999 | 0 (0.0%) | 18 (7.8%) |
| $20,000 to $22,499 | 0 (0.0%) | 5 (2.2%) |
| $22,500 to $24,999 | 15 (6.9%) | 5 (2.2%) |
| $25,000 to $29,999 | 0 (0.0%) | 9 (3.9%) |
| $30,000 to $34,999 | 27 (12.4%) | 23 (10.0%) |
| $35,000 to $39,999 | 5 (2.3%) | 40 (17.3%) |
| $40,000 to $44,999 | 0 (0.0%) | 19 (8.2%) |
| $45,000 to $49,999 | 35 (16.1%) | 10 (4.3%) |
| $50,000 to $54,999 | 5 (2.3%) | 0 (0.0%) |
| $55,000 to $64,999 | 57 (26.3%) | 44 (19.1%) |
| $65,000 to $74,999 | 3 (1.4%) | 4 (1.7%) |
| $75,000 to $99,999 | 18 (8.3%) | 0 (0.0%) |
| $100,000+ | 17 (7.8%) | 0 (0.0%) |
| Total | 217 (100.0%) | 231 (100.0%) |
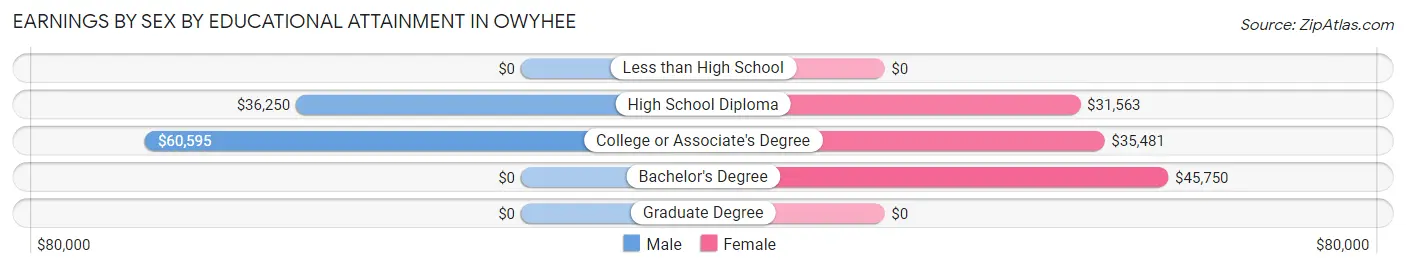
Earnings by Sex by Educational Attainment in Owyhee
Average earnings in Owyhee are $54,250 for men and $37,333 for women, a difference of 31.2%. Men with an educational attainment of college or associate's degree enjoy the highest average annual earnings of $60,595, while those with high school diploma education earn the least with $36,250. Women with an educational attainment of bachelor's degree earn the most with the average annual earnings of $45,750, while those with high school diploma education have the smallest earnings of $31,563.
| Educational Attainment | Male Income | Female Income |
| Less than High School | - | - |
| High School Diploma | $36,250 | $31,563 |
| College or Associate's Degree | $60,595 | $35,481 |
| Bachelor's Degree | - | - |
| Graduate Degree | - | - |
| Total | $54,250 | $37,333 |
Family Income in Owyhee
Family Income Brackets in Owyhee
According to the Owyhee family income data, there are 46 families falling into the $100,000 to $149,999 income range, which is the most common income bracket and makes up 25.7% of all families.
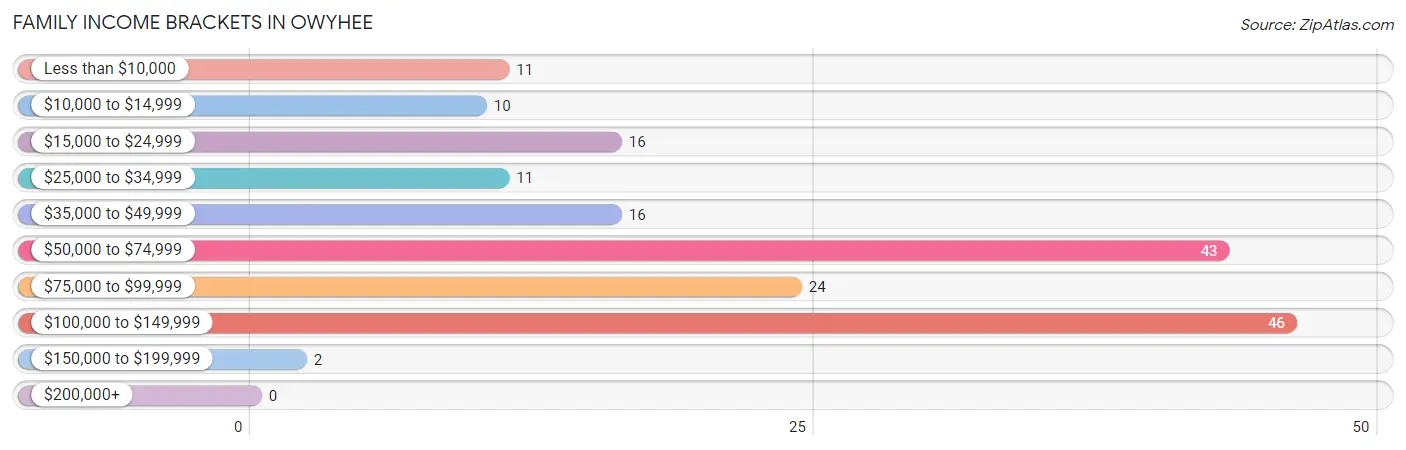
| Income Bracket | # Families | % Families |
| Less than $10,000 | 11 | 6.1% |
| $10,000 to $14,999 | 10 | 5.6% |
| $15,000 to $24,999 | 16 | 8.9% |
| $25,000 to $34,999 | 11 | 6.1% |
| $35,000 to $49,999 | 16 | 8.9% |
| $50,000 to $74,999 | 43 | 24.0% |
| $75,000 to $99,999 | 24 | 13.4% |
| $100,000 to $149,999 | 46 | 25.7% |
| $150,000 to $199,999 | 2 | 1.1% |
| $200,000+ | 0 | 0.0% |
Family Income by Famaliy Size in Owyhee
4-person families (36 | 20.1%) account for the highest median family income in Owyhee with $91,667 per family, while 2-person families (90 | 50.3%) have the highest median income of $27,574 per family member.
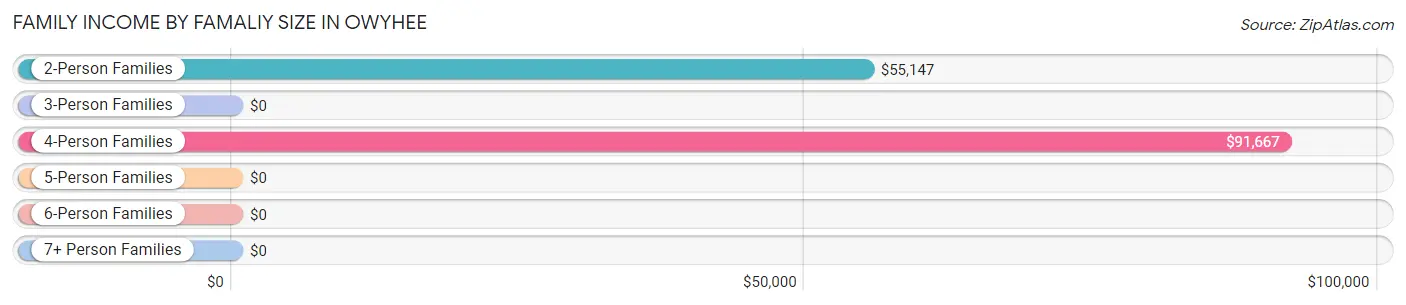
| Income Bracket | # Families | Median Income |
| 2-Person Families | 90 (50.3%) | $55,147 |
| 3-Person Families | 9 (5.0%) | $0 |
| 4-Person Families | 36 (20.1%) | $91,667 |
| 5-Person Families | 2 (1.1%) | $0 |
| 6-Person Families | 22 (12.3%) | $0 |
| 7+ Person Families | 20 (11.2%) | $0 |
| Total | 179 (100.0%) | $65,625 |
Family Income by Number of Earners in Owyhee
The median family income in Owyhee is $65,625, with families comprising 3+ earners (20) having the highest median family income of $134,375, while families with no earners (36) have the lowest median family income of $19,583, accounting for 11.2% and 20.1% of families, respectively.
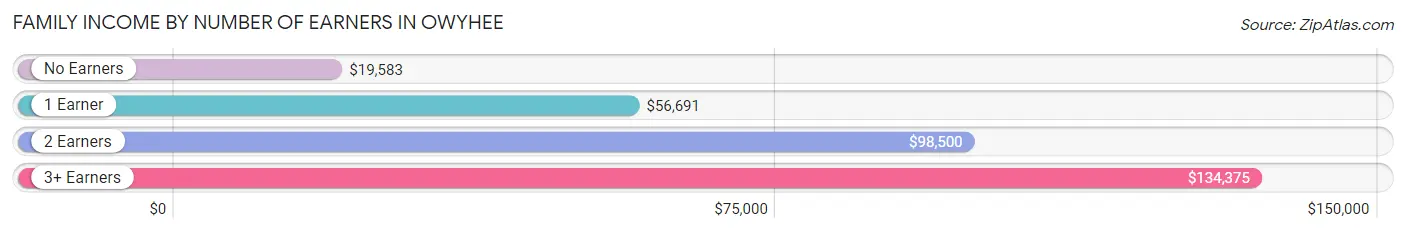
| Number of Earners | # Families | Median Income |
| No Earners | 36 (20.1%) | $19,583 |
| 1 Earner | 63 (35.2%) | $56,691 |
| 2 Earners | 60 (33.5%) | $98,500 |
| 3+ Earners | 20 (11.2%) | $134,375 |
| Total | 179 (100.0%) | $65,625 |
Household Income in Owyhee
Household Income Brackets in Owyhee
With 51 households falling in the category, the $50,000 to $74,999 income range is the most frequent in Owyhee, accounting for 17.1% of all households.
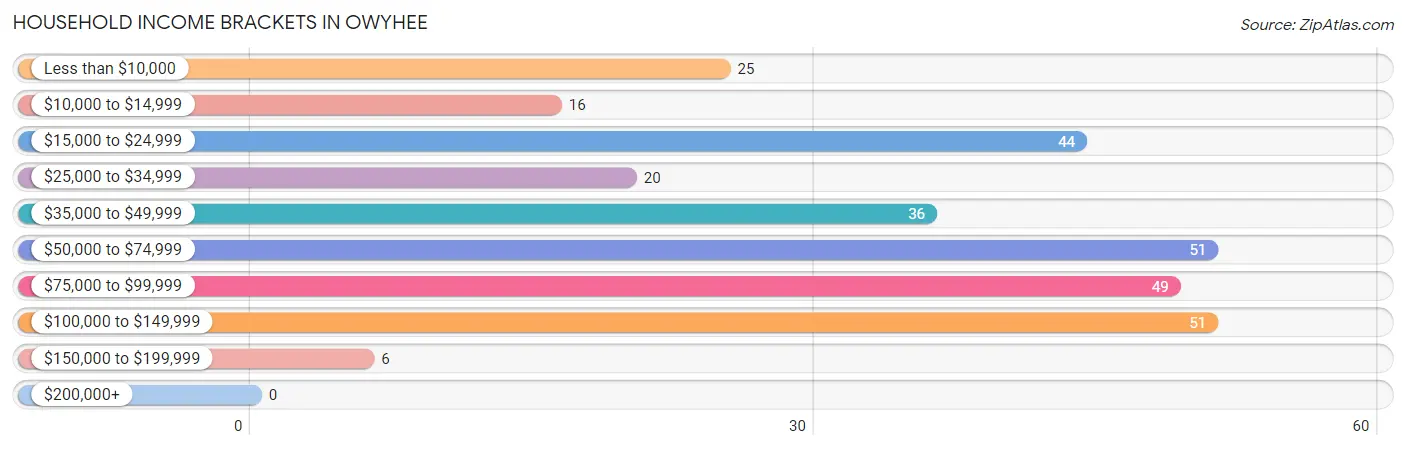
| Income Bracket | # Households | % Households |
| Less than $10,000 | 25 | 8.4% |
| $10,000 to $14,999 | 16 | 5.4% |
| $15,000 to $24,999 | 44 | 14.8% |
| $25,000 to $34,999 | 20 | 6.7% |
| $35,000 to $49,999 | 36 | 12.1% |
| $50,000 to $74,999 | 51 | 17.1% |
| $75,000 to $99,999 | 49 | 16.4% |
| $100,000 to $149,999 | 51 | 17.1% |
| $150,000 to $199,999 | 6 | 2.0% |
| $200,000+ | 0 | 0.0% |
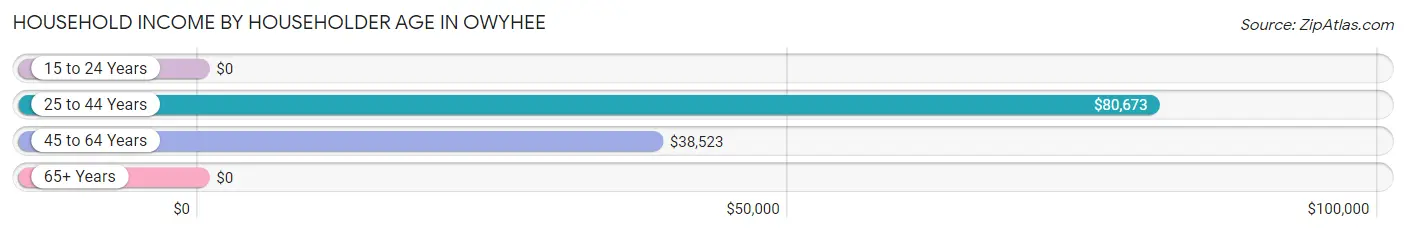
Household Income by Householder Age in Owyhee
The median household income in Owyhee is $56,000, with the highest median household income of $80,673 found in the 25 to 44 years age bracket for the primary householder. A total of 107 households (35.9%) fall into this category. Meanwhile, the 15 to 24 years age bracket for the primary householder has the lowest median household income of $0, with 5 households (1.7%) in this group.
| Income Bracket | # Households | Median Income |
| 15 to 24 Years | 5 (1.7%) | $0 |
| 25 to 44 Years | 107 (35.9%) | $80,673 |
| 45 to 64 Years | 127 (42.6%) | $38,523 |
| 65+ Years | 59 (19.8%) | $0 |
| Total | 298 (100.0%) | $56,000 |
Poverty in Owyhee
Income Below Poverty by Sex and Age in Owyhee
With 20.2% poverty level for males and 33.7% for females among the residents of Owyhee, 16 and 17 year old males and 35 to 44 year old females are the most vulnerable to poverty, with 6 males (75.0%) and 108 females (68.8%) in their respective age groups living below the poverty level.
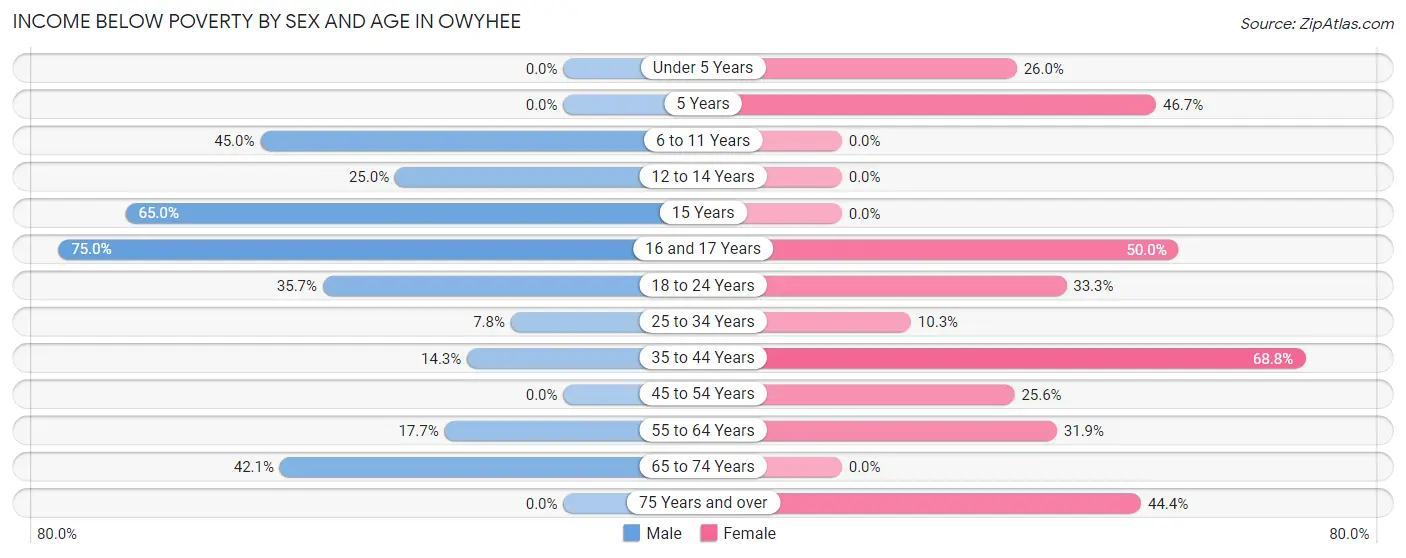
| Age Bracket | Male | Female |
| Under 5 Years | 0 (0.0%) | 20 (26.0%) |
| 5 Years | 0 (0.0%) | 7 (46.7%) |
| 6 to 11 Years | 9 (45.0%) | 0 (0.0%) |
| 12 to 14 Years | 7 (25.0%) | 0 (0.0%) |
| 15 Years | 13 (65.0%) | 0 (0.0%) |
| 16 and 17 Years | 6 (75.0%) | 13 (50.0%) |
| 18 to 24 Years | 10 (35.7%) | 5 (33.3%) |
| 25 to 34 Years | 5 (7.8%) | 8 (10.3%) |
| 35 to 44 Years | 10 (14.3%) | 108 (68.8%) |
| 45 to 54 Years | 0 (0.0%) | 10 (25.6%) |
| 55 to 64 Years | 12 (17.6%) | 23 (31.9%) |
| 65 to 74 Years | 8 (42.1%) | 0 (0.0%) |
| 75 Years and over | 0 (0.0%) | 8 (44.4%) |
| Total | 80 (20.2%) | 202 (33.7%) |
Income Above Poverty by Sex and Age in Owyhee
According to the poverty statistics in Owyhee, males aged under 5 years and females aged 6 to 11 years are the age groups that are most secure financially, with 100.0% of males and 100.0% of females in these age groups living above the poverty line.
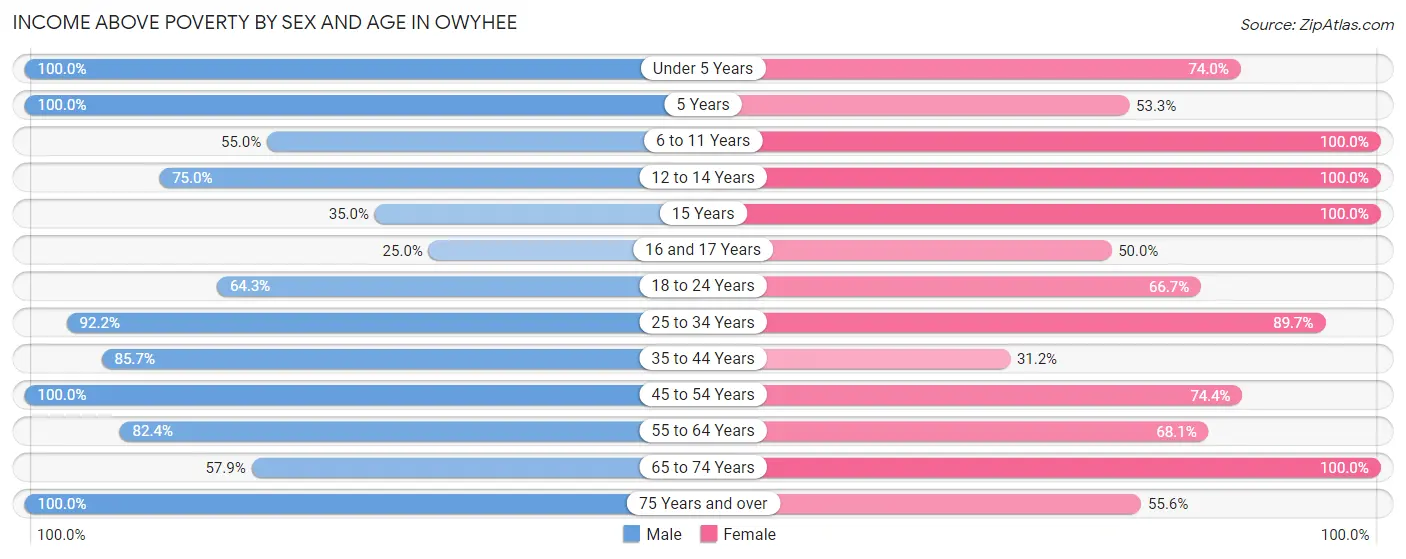
| Age Bracket | Male | Female |
| Under 5 Years | 15 (100.0%) | 57 (74.0%) |
| 5 Years | 3 (100.0%) | 8 (53.3%) |
| 6 to 11 Years | 11 (55.0%) | 66 (100.0%) |
| 12 to 14 Years | 21 (75.0%) | 8 (100.0%) |
| 15 Years | 7 (35.0%) | 5 (100.0%) |
| 16 and 17 Years | 2 (25.0%) | 13 (50.0%) |
| 18 to 24 Years | 18 (64.3%) | 10 (66.7%) |
| 25 to 34 Years | 59 (92.2%) | 70 (89.7%) |
| 35 to 44 Years | 60 (85.7%) | 49 (31.2%) |
| 45 to 54 Years | 40 (100.0%) | 29 (74.4%) |
| 55 to 64 Years | 56 (82.4%) | 49 (68.1%) |
| 65 to 74 Years | 11 (57.9%) | 23 (100.0%) |
| 75 Years and over | 14 (100.0%) | 10 (55.6%) |
| Total | 317 (79.8%) | 397 (66.3%) |
Income Below Poverty Among Married-Couple Families in Owyhee
The poverty statistics for married-couple families in Owyhee show that 6.5% or 5 of the total 77 families live below the poverty line. Families with 1 or 2 children have the highest poverty rate of 23.8%, comprising of 5 families. On the other hand, families with no children have the lowest poverty rate of 0.0%, which includes 0 families.
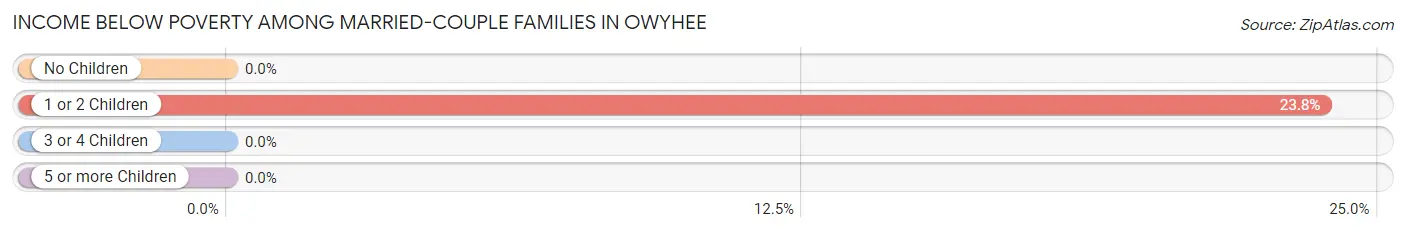
| Children | Above Poverty | Below Poverty |
| No Children | 26 (100.0%) | 0 (0.0%) |
| 1 or 2 Children | 16 (76.2%) | 5 (23.8%) |
| 3 or 4 Children | 30 (100.0%) | 0 (0.0%) |
| 5 or more Children | 0 (0.0%) | 0 (0.0%) |
| Total | 72 (93.5%) | 5 (6.5%) |
Income Below Poverty Among Single-Parent Households in Owyhee
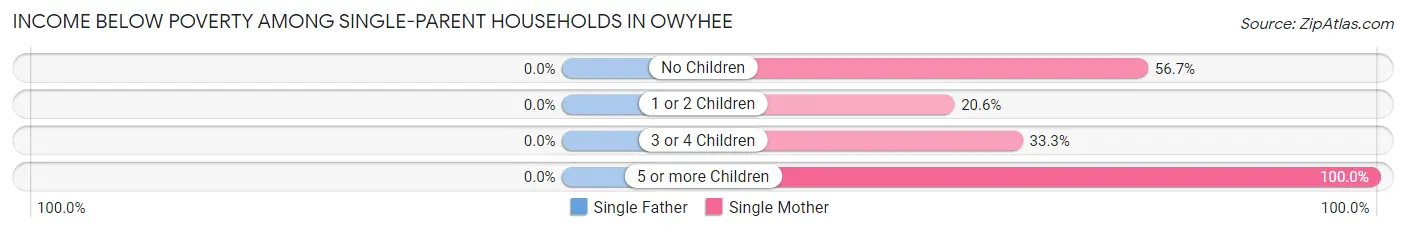
| Children | Single Father | Single Mother |
| No Children | 0 (0.0%) | 17 (56.7%) |
| 1 or 2 Children | 0 (0.0%) | 7 (20.6%) |
| 3 or 4 Children | 0 (0.0%) | 5 (33.3%) |
| 5 or more Children | 0 (0.0%) | 6 (100.0%) |
| Total | 0 (0.0%) | 35 (41.2%) |
Income Below Poverty Among Married-Couple vs Single-Parent Households in Owyhee
The poverty data for Owyhee shows that 5 of the married-couple family households (6.5%) and 35 of the single-parent households (34.3%) are living below the poverty level. Within the married-couple family households, those with 1 or 2 children have the highest poverty rate, with 5 households (23.8%) falling below the poverty line. Among the single-parent households, those with 5 or more children have the highest poverty rate, with 6 household (100.0%) living below poverty.
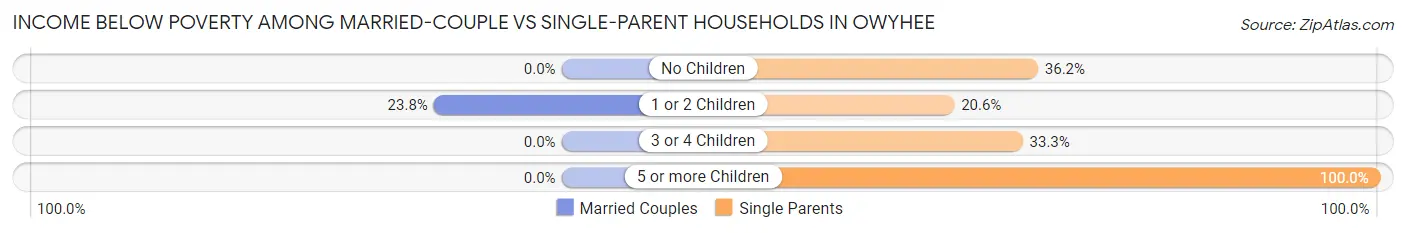
| Children | Married-Couple Families | Single-Parent Households |
| No Children | 0 (0.0%) | 17 (36.2%) |
| 1 or 2 Children | 5 (23.8%) | 7 (20.6%) |
| 3 or 4 Children | 0 (0.0%) | 5 (33.3%) |
| 5 or more Children | 0 (0.0%) | 6 (100.0%) |
| Total | 5 (6.5%) | 35 (34.3%) |
Race in Owyhee
The most populous races in Owyhee are Native / Alaskan (866 | 85.6%), Hispanic or Latino (130 | 12.9%), and Some other Race (75 | 7.4%).
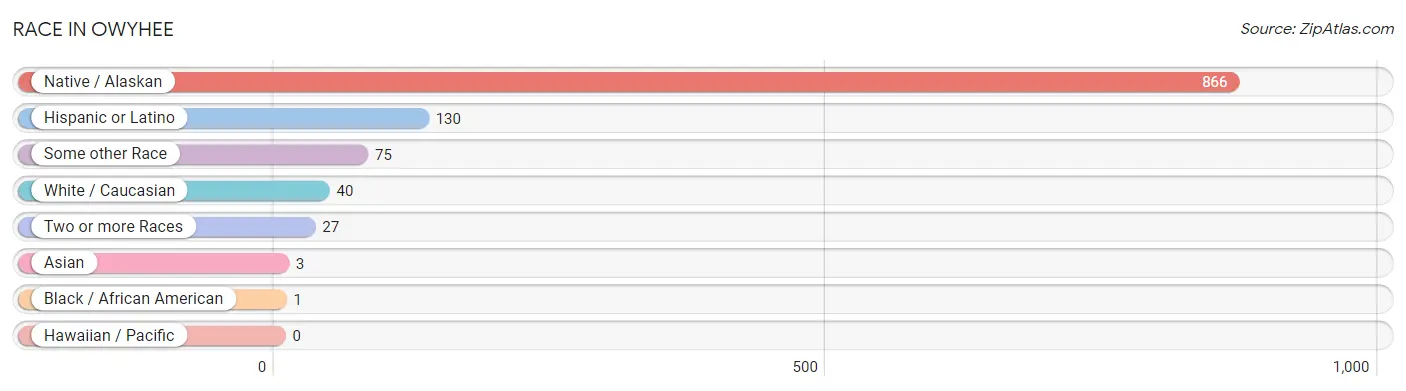
| Race | # Population | % Population |
| Asian | 3 | 0.3% |
| Black / African American | 1 | 0.1% |
| Hawaiian / Pacific | 0 | 0.0% |
| Hispanic or Latino | 130 | 12.9% |
| Native / Alaskan | 866 | 85.6% |
| White / Caucasian | 40 | 4.0% |
| Two or more Races | 27 | 2.7% |
| Some other Race | 75 | 7.4% |
| Total | 1,012 | 100.0% |
Ancestry in Owyhee
The most populous ancestries reported in Owyhee are Mexican (125 | 12.3%), Shoshone (88 | 8.7%), German (30 | 3.0%), Fijian (22 | 2.2%), and Paiute (19 | 1.9%), together accounting for 28.1% of all Owyhee residents.
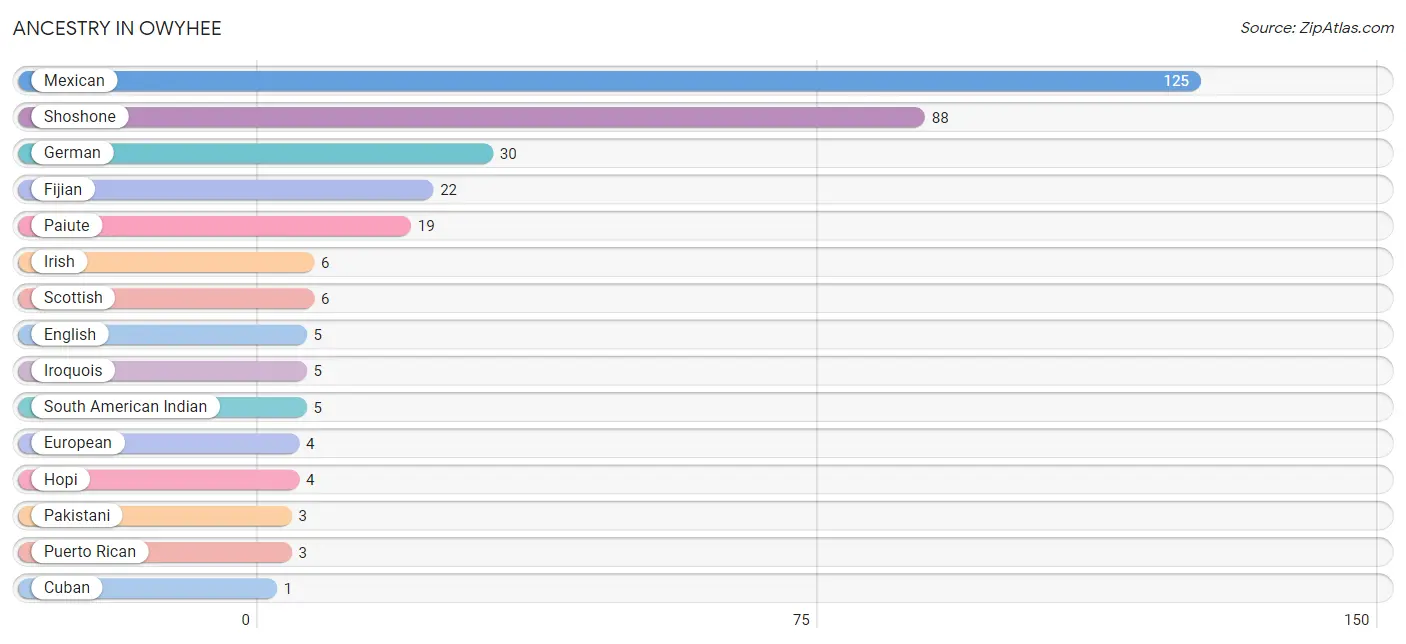
| Ancestry | # Population | % Population |
| Cuban | 1 | 0.1% |
| English | 5 | 0.5% |
| European | 4 | 0.4% |
| Fijian | 22 | 2.2% |
| German | 30 | 3.0% |
| Hopi | 4 | 0.4% |
| Inupiat | 1 | 0.1% |
| Irish | 6 | 0.6% |
| Iroquois | 5 | 0.5% |
| Mexican | 125 | 12.3% |
| Norwegian | 1 | 0.1% |
| Paiute | 19 | 1.9% |
| Pakistani | 3 | 0.3% |
| Puerto Rican | 3 | 0.3% |
| Scottish | 6 | 0.6% |
| Shoshone | 88 | 8.7% |
| South American Indian | 5 | 0.5% | View All 17 Rows |
Immigrants in Owyhee
The most numerous immigrant groups reported in Owyhee came from Latin America (12 | 1.2%), Central America (11 | 1.1%), Mexico (11 | 1.1%), Asia (3 | 0.3%), and South Eastern Asia (3 | 0.3%), together accounting for 4.0% of all Owyhee residents.
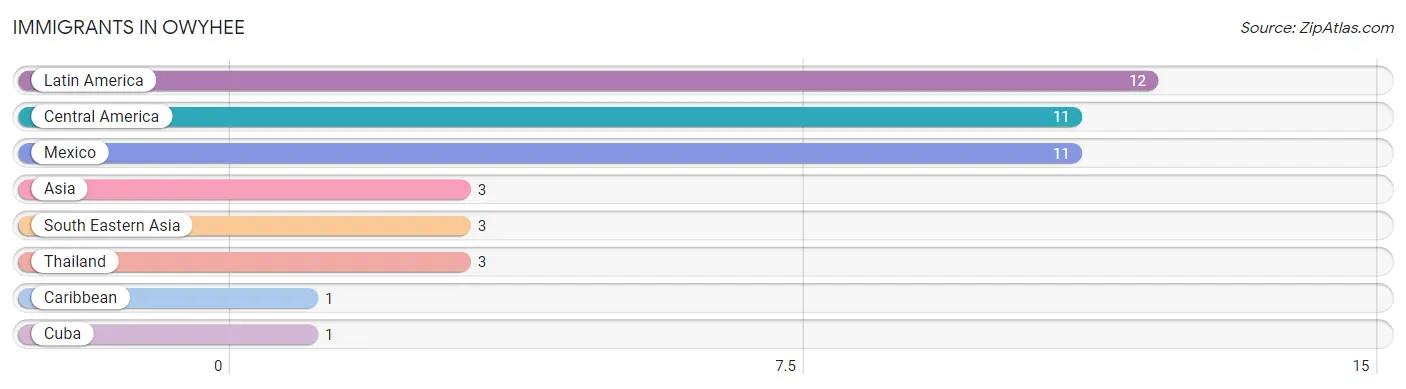
| Immigration Origin | # Population | % Population |
| Asia | 3 | 0.3% |
| Caribbean | 1 | 0.1% |
| Central America | 11 | 1.1% |
| Cuba | 1 | 0.1% |
| Latin America | 12 | 1.2% |
| Mexico | 11 | 1.1% |
| South Eastern Asia | 3 | 0.3% |
| Thailand | 3 | 0.3% | View All 8 Rows |
Sex and Age in Owyhee
Sex and Age in Owyhee
The most populous age groups in Owyhee are 10 to 14 Years (49 | 11.9%) for men and 35 to 39 Years (138 | 23.0%) for women.
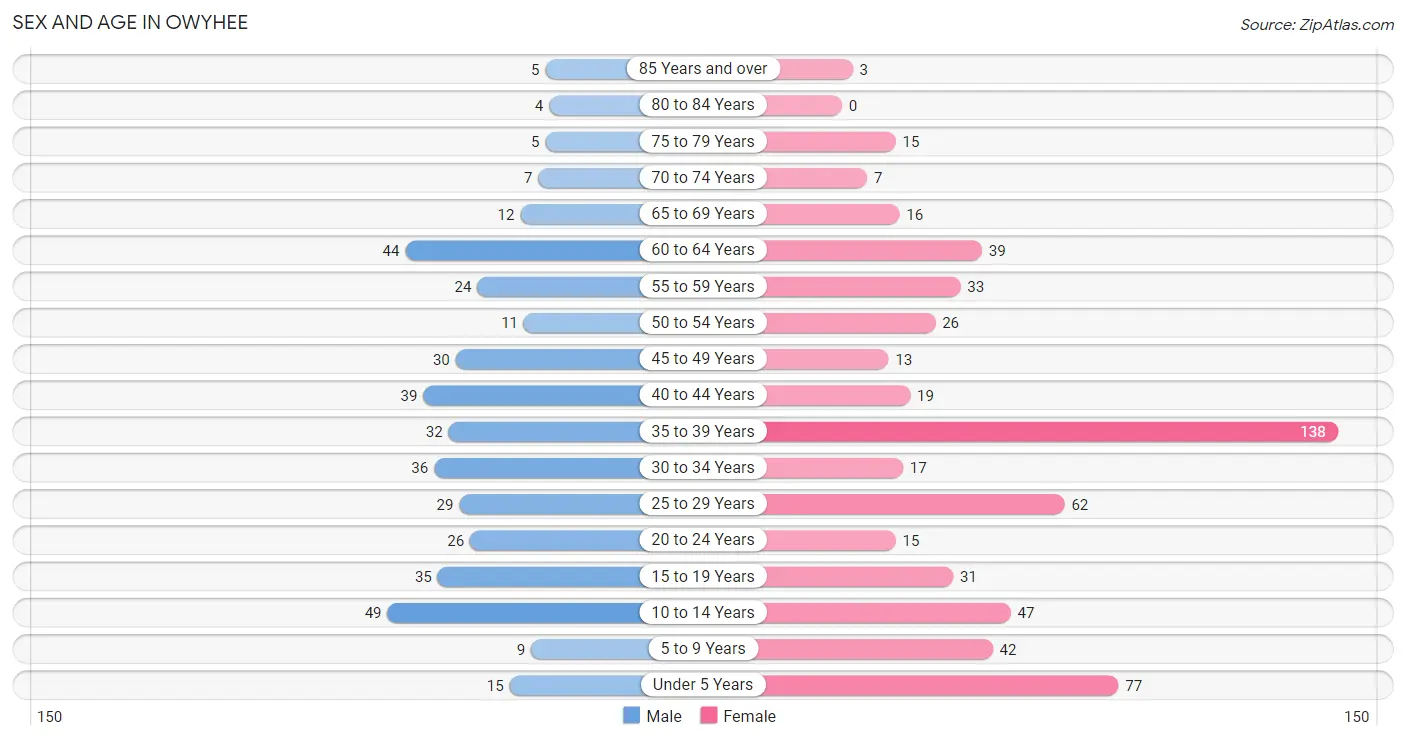
| Age Bracket | Male | Female |
| Under 5 Years | 15 (3.6%) | 77 (12.8%) |
| 5 to 9 Years | 9 (2.2%) | 42 (7.0%) |
| 10 to 14 Years | 49 (11.9%) | 47 (7.8%) |
| 15 to 19 Years | 35 (8.5%) | 31 (5.2%) |
| 20 to 24 Years | 26 (6.3%) | 15 (2.5%) |
| 25 to 29 Years | 29 (7.0%) | 62 (10.3%) |
| 30 to 34 Years | 36 (8.7%) | 17 (2.8%) |
| 35 to 39 Years | 32 (7.8%) | 138 (23.0%) |
| 40 to 44 Years | 39 (9.5%) | 19 (3.2%) |
| 45 to 49 Years | 30 (7.3%) | 13 (2.2%) |
| 50 to 54 Years | 11 (2.7%) | 26 (4.3%) |
| 55 to 59 Years | 24 (5.8%) | 33 (5.5%) |
| 60 to 64 Years | 44 (10.7%) | 39 (6.5%) |
| 65 to 69 Years | 12 (2.9%) | 16 (2.7%) |
| 70 to 74 Years | 7 (1.7%) | 7 (1.2%) |
| 75 to 79 Years | 5 (1.2%) | 15 (2.5%) |
| 80 to 84 Years | 4 (1.0%) | 0 (0.0%) |
| 85 Years and over | 5 (1.2%) | 3 (0.5%) |
| Total | 412 (100.0%) | 600 (100.0%) |
Families and Households in Owyhee
Median Family Size in Owyhee
The median family size in Owyhee is 4.57 persons per family, with single female/mother families (85 | 47.5%) accounting for the largest median family size of 5.75 persons per family. On the other hand, single male/father families (17 | 9.5%) represent the smallest median family size with 2.65 persons per family.
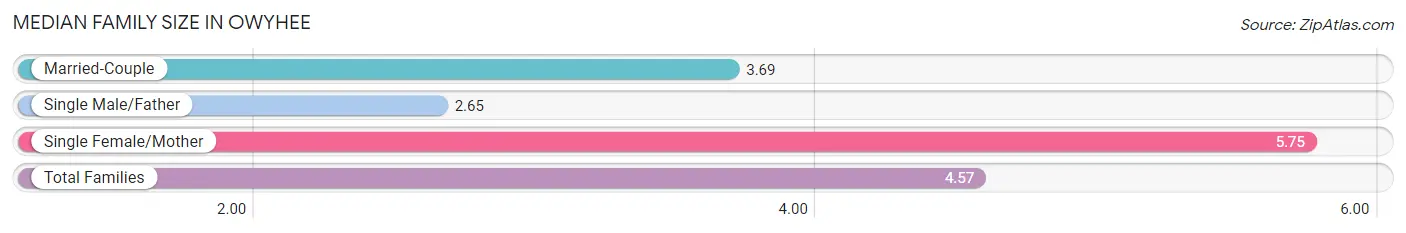
| Family Type | # Families | Family Size |
| Married-Couple | 77 (43.0%) | 3.69 |
| Single Male/Father | 17 (9.5%) | 2.65 |
| Single Female/Mother | 85 (47.5%) | 5.75 |
| Total Families | 179 (100.0%) | 4.57 |
Median Household Size in Owyhee
The median household size in Owyhee is 3.37 persons per household, with single female/mother households (85 | 28.5%) accounting for the largest median household size of 6.25 persons per household. non-family households (119 | 39.9%) represent the smallest median household size with 1.17 persons per household.
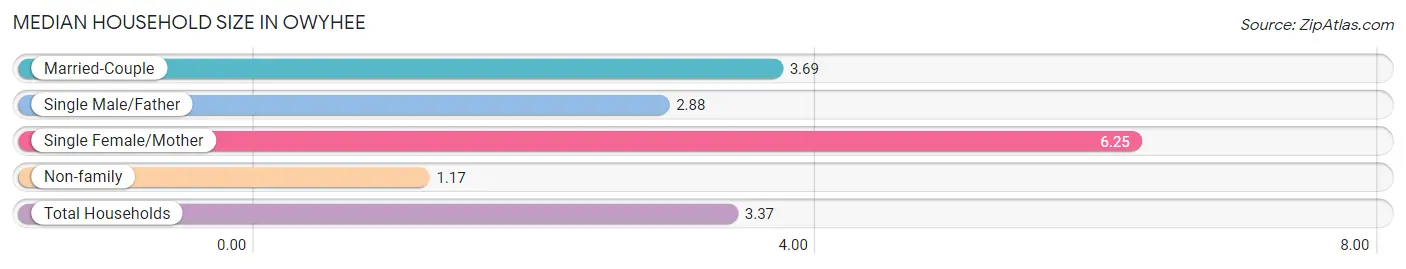
| Household Type | # Households | Household Size |
| Married-Couple | 77 (25.8%) | 3.69 |
| Single Male/Father | 17 (5.7%) | 2.88 |
| Single Female/Mother | 85 (28.5%) | 6.25 |
| Non-family | 119 (39.9%) | 1.17 |
| Total Households | 298 (100.0%) | 3.37 |
Household Size by Marriage Status in Owyhee
Out of a total of 298 households in Owyhee, 179 (60.1%) are family households, while 119 (39.9%) are nonfamily households. The most numerous type of family households are 2-person households, comprising 77, and the most common type of nonfamily households are 1-person households, comprising 100.
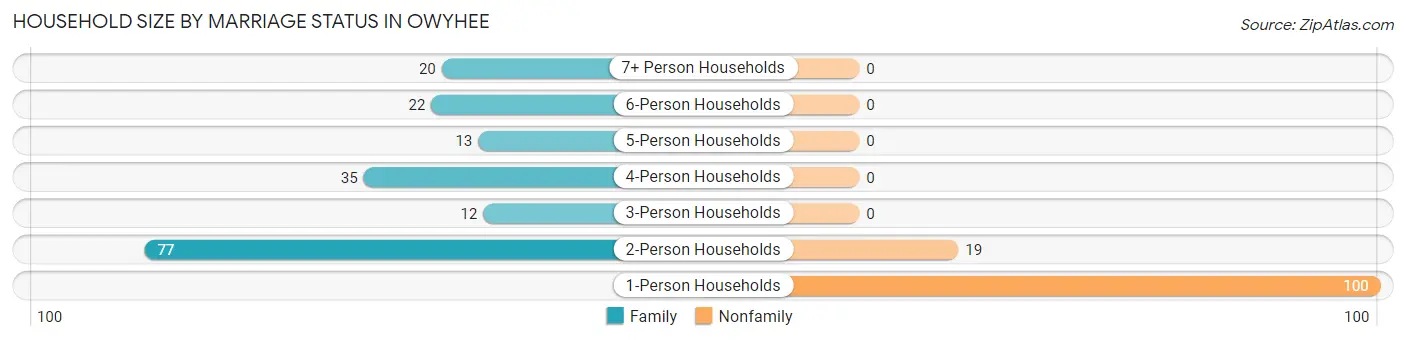
| Household Size | Family Households | Nonfamily Households |
| 1-Person Households | - | 100 (33.6%) |
| 2-Person Households | 77 (25.8%) | 19 (6.4%) |
| 3-Person Households | 12 (4.0%) | 0 (0.0%) |
| 4-Person Households | 35 (11.7%) | 0 (0.0%) |
| 5-Person Households | 13 (4.4%) | 0 (0.0%) |
| 6-Person Households | 22 (7.4%) | 0 (0.0%) |
| 7+ Person Households | 20 (6.7%) | 0 (0.0%) |
| Total | 179 (60.1%) | 119 (39.9%) |
Female Fertility in Owyhee
Fertility by Age in Owyhee
Average fertility rate in Owyhee is 16.0 births per 1,000 women. Women in the age bracket of 20 to 34 years have the highest fertility rate with 53.0 births per 1,000 women. Women in the age bracket of 20 to 34 years acount for 100.0% of all women with births.
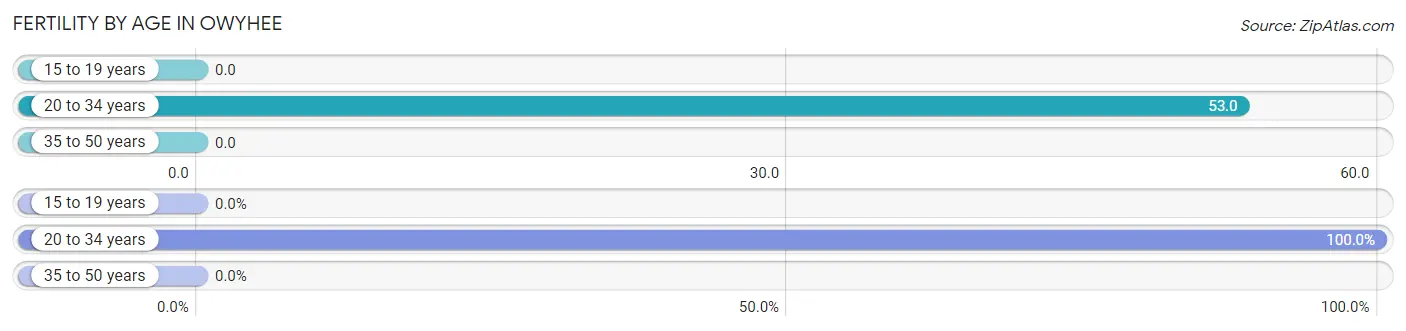
| Age Bracket | Women with Births | Births / 1,000 Women |
| 15 to 19 years | 0 (0.0%) | 0.0 |
| 20 to 34 years | 5 (100.0%) | 53.0 |
| 35 to 50 years | 0 (0.0%) | 0.0 |
| Total | 5 (100.0%) | 16.0 |
Fertility by Age by Marriage Status in Owyhee
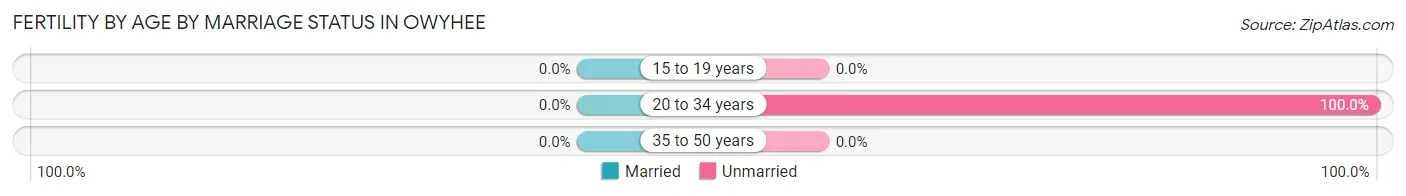
| Age Bracket | Married | Unmarried |
| 15 to 19 years | 0 (0.0%) | 0 (0.0%) |
| 20 to 34 years | 0 (0.0%) | 5 (100.0%) |
| 35 to 50 years | 0 (0.0%) | 0 (0.0%) |
| Total | 0 (0.0%) | 5 (100.0%) |
Fertility by Education in Owyhee
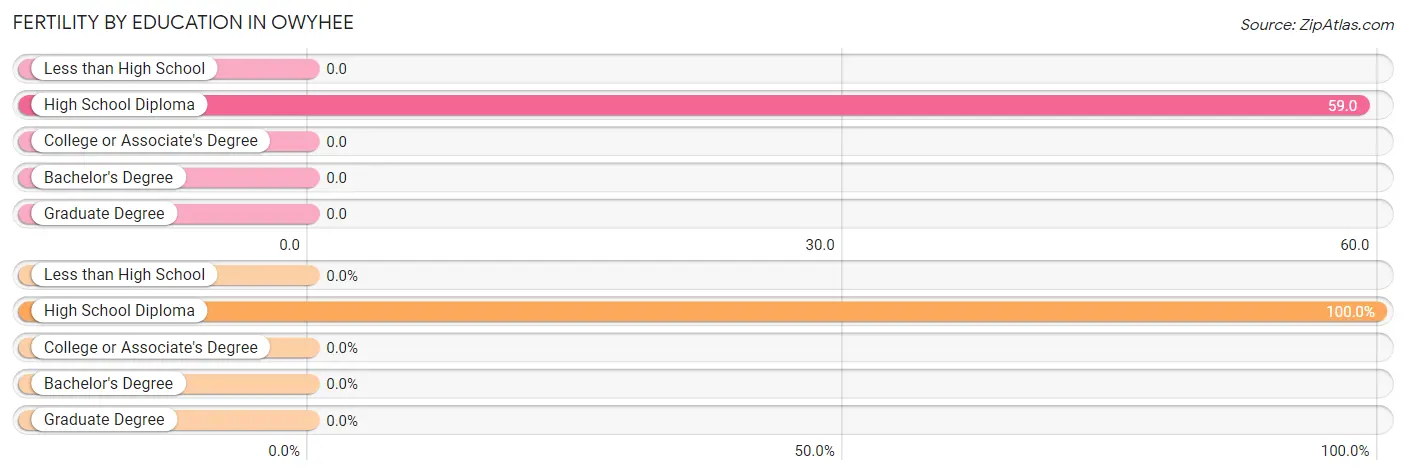
| Educational Attainment | Women with Births | Births / 1,000 Women |
| Less than High School | 0 (0.0%) | 0.0 |
| High School Diploma | 5 (100.0%) | 59.0 |
| College or Associate's Degree | 0 (0.0%) | 0.0 |
| Bachelor's Degree | 0 (0.0%) | 0.0 |
| Graduate Degree | 0 (0.0%) | 0.0 |
| Total | 5 (100.0%) | 16.0 |
Fertility by Education by Marriage Status in Owyhee
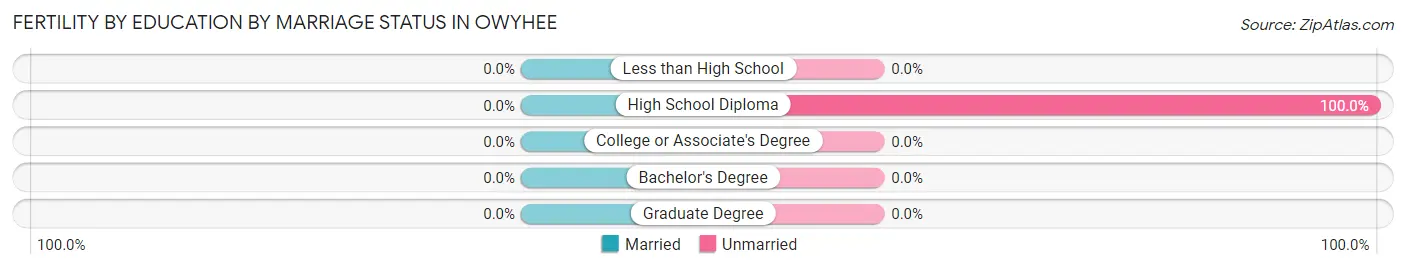
| Educational Attainment | Married | Unmarried |
| Less than High School | 0 (0.0%) | 0 (0.0%) |
| High School Diploma | 0 (0.0%) | 5 (100.0%) |
| College or Associate's Degree | 0 (0.0%) | 0 (0.0%) |
| Bachelor's Degree | 0 (0.0%) | 0 (0.0%) |
| Graduate Degree | 0 (0.0%) | 0 (0.0%) |
| Total | 0 (0.0%) | 5 (100.0%) |
Employment Characteristics in Owyhee
Employment by Class of Employer in Owyhee
Among the 363 employed individuals in Owyhee, local government employees (120 | 33.1%), private company employees (108 | 29.7%), and federal government employees (75 | 20.7%) make up the most common classes of employment.
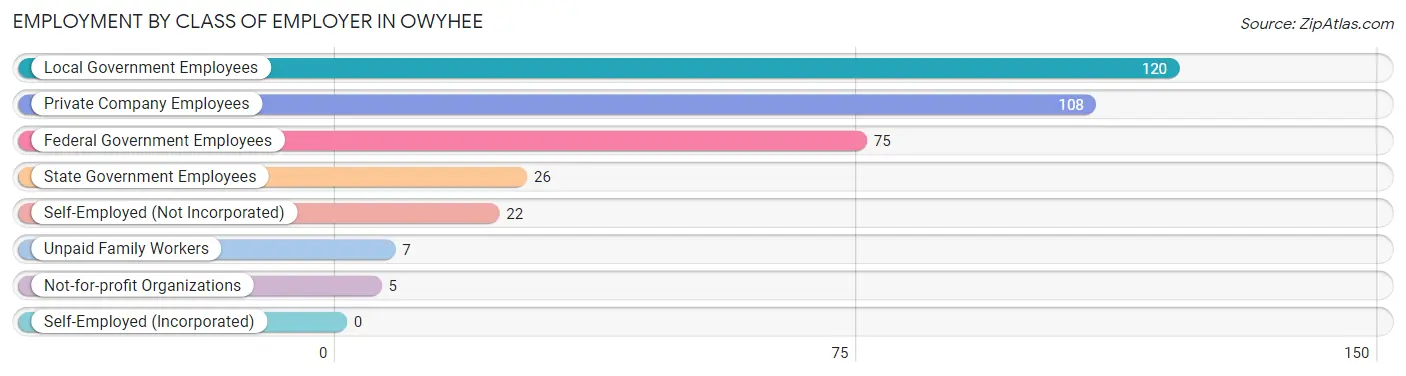
| Employer Class | # Employees | % Employees |
| Private Company Employees | 108 | 29.7% |
| Self-Employed (Incorporated) | 0 | 0.0% |
| Self-Employed (Not Incorporated) | 22 | 6.1% |
| Not-for-profit Organizations | 5 | 1.4% |
| Local Government Employees | 120 | 33.1% |
| State Government Employees | 26 | 7.2% |
| Federal Government Employees | 75 | 20.7% |
| Unpaid Family Workers | 7 | 1.9% |
| Total | 363 | 100.0% |
Employment Status by Age in Owyhee
According to the labor force statistics for Owyhee, out of the total population over 16 years of age (748), 55.6% or 416 individuals are in the labor force, with 5.5% or 23 of them unemployed. The age group with the highest labor force participation rate is 30 to 34 years, with 100.0% or 53 individuals in the labor force. Within the labor force, the 20 to 24 years age range has the highest percentage of unemployed individuals, with 17.4% or 4 of them being unemployed.
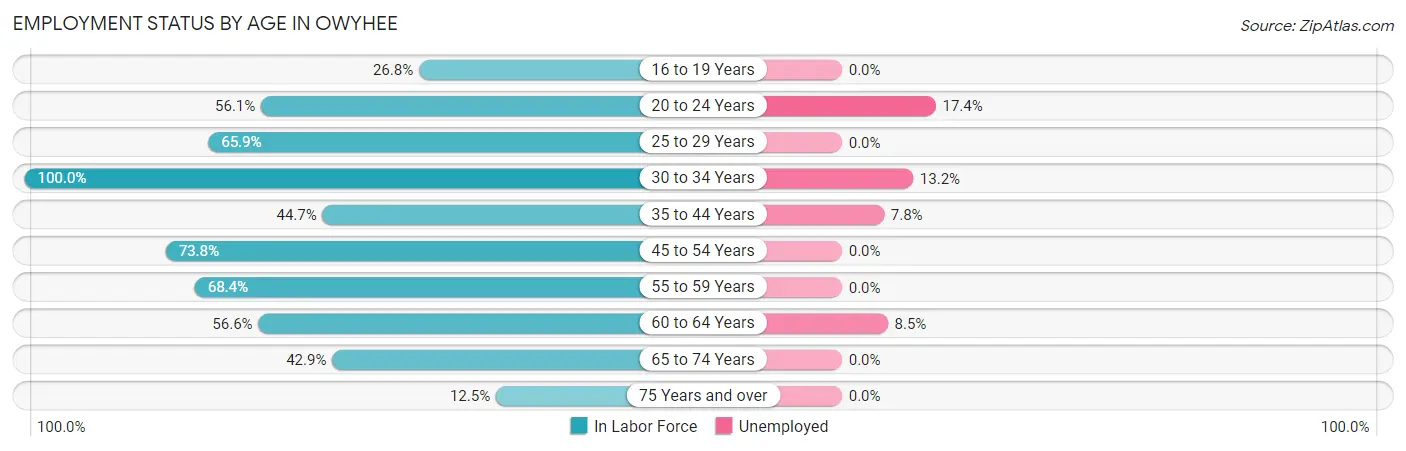
| Age Bracket | In Labor Force | Unemployed |
| 16 to 19 Years | 11 (26.8%) | 0 (0.0%) |
| 20 to 24 Years | 23 (56.1%) | 4 (17.4%) |
| 25 to 29 Years | 60 (65.9%) | 0 (0.0%) |
| 30 to 34 Years | 53 (100.0%) | 7 (13.2%) |
| 35 to 44 Years | 102 (44.7%) | 8 (7.8%) |
| 45 to 54 Years | 59 (73.8%) | 0 (0.0%) |
| 55 to 59 Years | 39 (68.4%) | 0 (0.0%) |
| 60 to 64 Years | 47 (56.6%) | 4 (8.5%) |
| 65 to 74 Years | 18 (42.9%) | 0 (0.0%) |
| 75 Years and over | 4 (12.5%) | 0 (0.0%) |
| Total | 416 (55.6%) | 23 (5.5%) |
Employment Status by Educational Attainment in Owyhee
According to labor force statistics for Owyhee, 60.8% of individuals (360) out of the total population between 25 and 64 years of age (592) are in the labor force, with 5.3% or 19 of them being unemployed. The group with the highest labor force participation rate are those with the educational attainment of bachelor's degree or higher, with 94.5% or 52 individuals in the labor force. Within the labor force, individuals with high school diploma education have the highest percentage of unemployment, with 13.2% or 15 of them being unemployed.
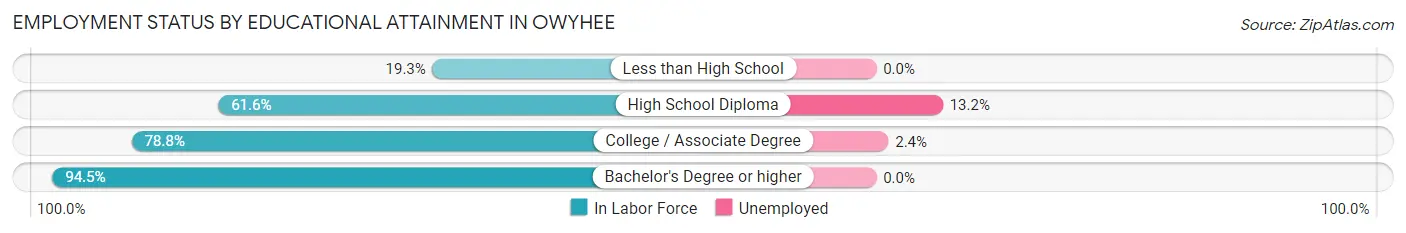
| Educational Attainment | In Labor Force | Unemployed |
| Less than High School | 27 (19.3%) | 0 (0.0%) |
| High School Diploma | 114 (61.6%) | 24 (13.2%) |
| College / Associate Degree | 167 (78.8%) | 5 (2.4%) |
| Bachelor's Degree or higher | 52 (94.5%) | 0 (0.0%) |
| Total | 360 (60.8%) | 31 (5.3%) |
Employment Occupations by Sex in Owyhee
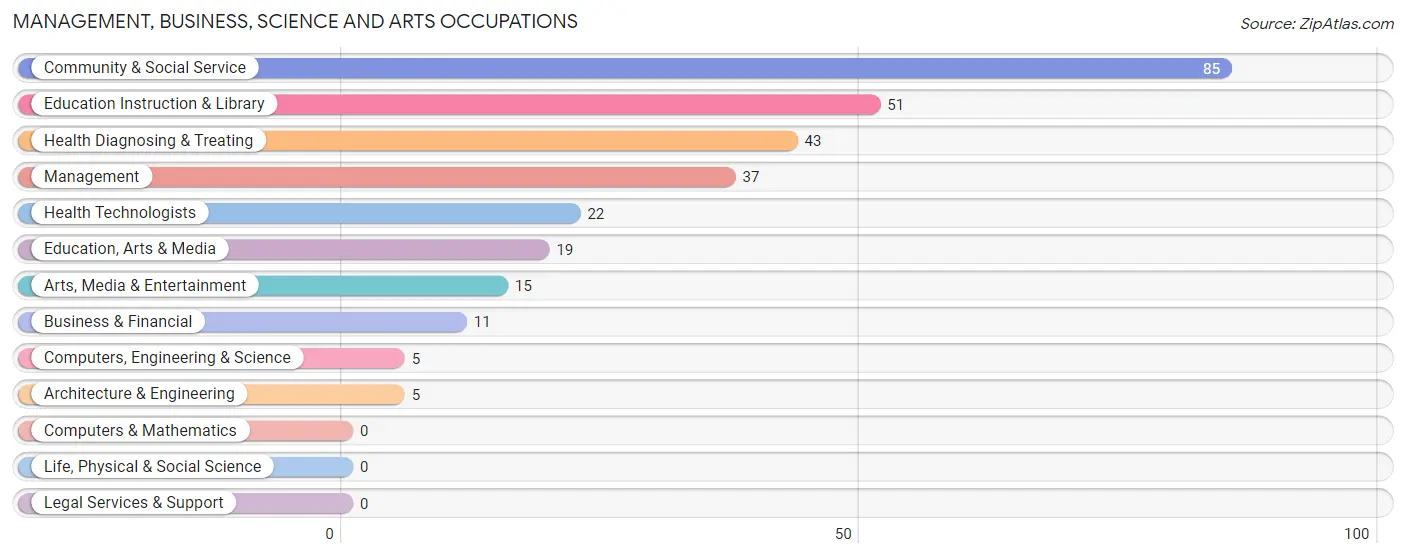
Management, Business, Science and Arts Occupations
The most common Management, Business, Science and Arts occupations in Owyhee are Community & Social Service (85 | 21.6%), Education Instruction & Library (51 | 13.0%), Health Diagnosing & Treating (43 | 10.9%), Management (37 | 9.4%), and Health Technologists (22 | 5.6%).
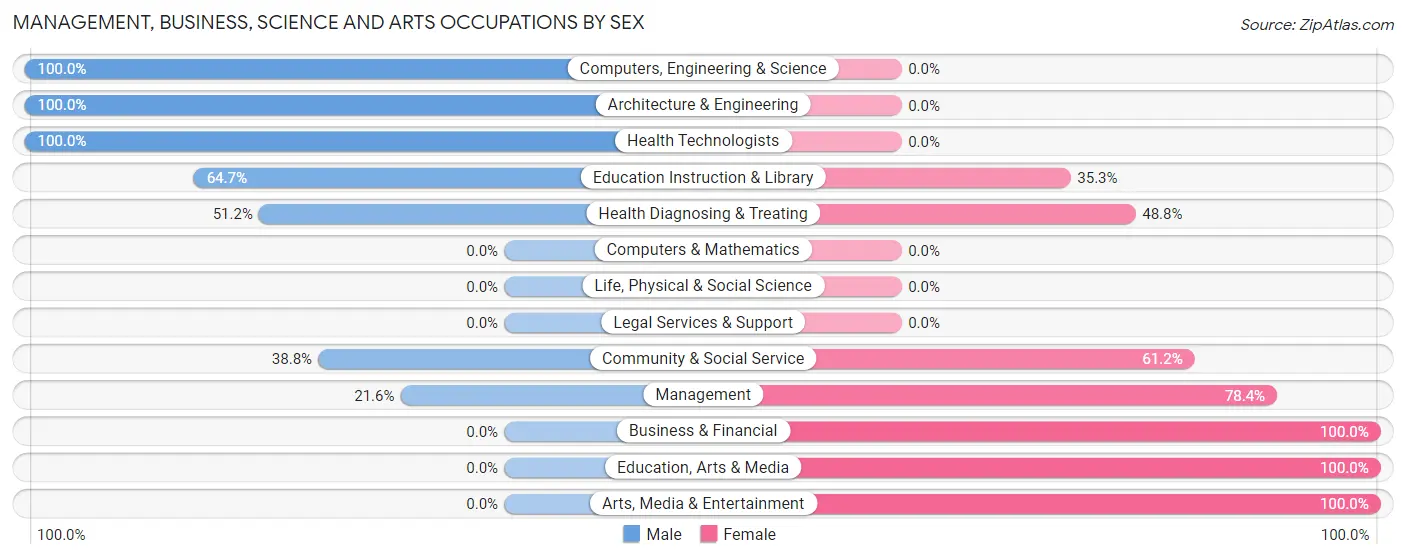
Management, Business, Science and Arts Occupations by Sex
Within the Management, Business, Science and Arts occupations in Owyhee, the most male-oriented occupations are Computers, Engineering & Science (100.0%), Architecture & Engineering (100.0%), and Health Technologists (100.0%), while the most female-oriented occupations are Business & Financial (100.0%), Education, Arts & Media (100.0%), and Arts, Media & Entertainment (100.0%).
| Occupation | Male | Female |
| Management | 8 (21.6%) | 29 (78.4%) |
| Business & Financial | 0 (0.0%) | 11 (100.0%) |
| Computers, Engineering & Science | 5 (100.0%) | 0 (0.0%) |
| Computers & Mathematics | 0 (0.0%) | 0 (0.0%) |
| Architecture & Engineering | 5 (100.0%) | 0 (0.0%) |
| Life, Physical & Social Science | 0 (0.0%) | 0 (0.0%) |
| Community & Social Service | 33 (38.8%) | 52 (61.2%) |
| Education, Arts & Media | 0 (0.0%) | 19 (100.0%) |
| Legal Services & Support | 0 (0.0%) | 0 (0.0%) |
| Education Instruction & Library | 33 (64.7%) | 18 (35.3%) |
| Arts, Media & Entertainment | 0 (0.0%) | 15 (100.0%) |
| Health Diagnosing & Treating | 22 (51.2%) | 21 (48.8%) |
| Health Technologists | 22 (100.0%) | 0 (0.0%) |
| Total (Category) | 68 (37.6%) | 113 (62.4%) |
| Total (Overall) | 195 (49.6%) | 198 (50.4%) |
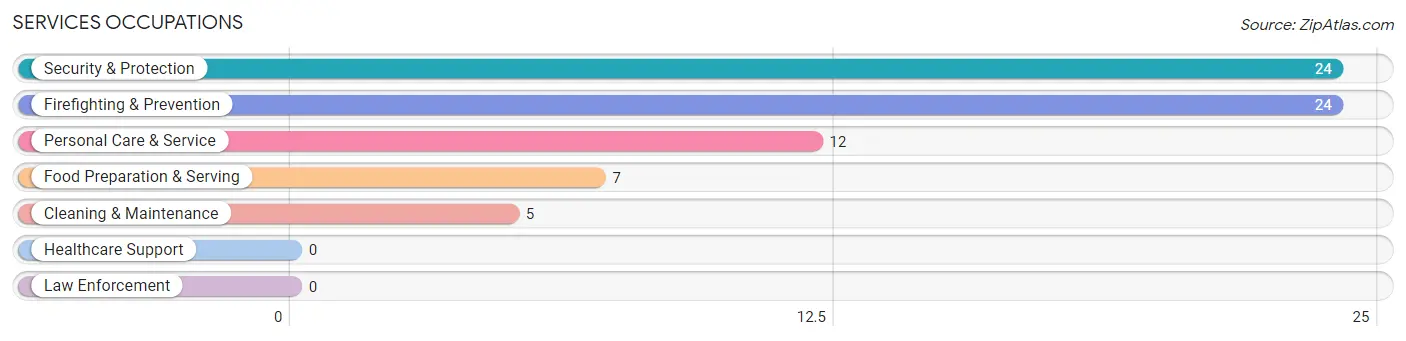
Services Occupations
The most common Services occupations in Owyhee are Security & Protection (24 | 6.1%), Firefighting & Prevention (24 | 6.1%), Personal Care & Service (12 | 3.0%), Food Preparation & Serving (7 | 1.8%), and Cleaning & Maintenance (5 | 1.3%).
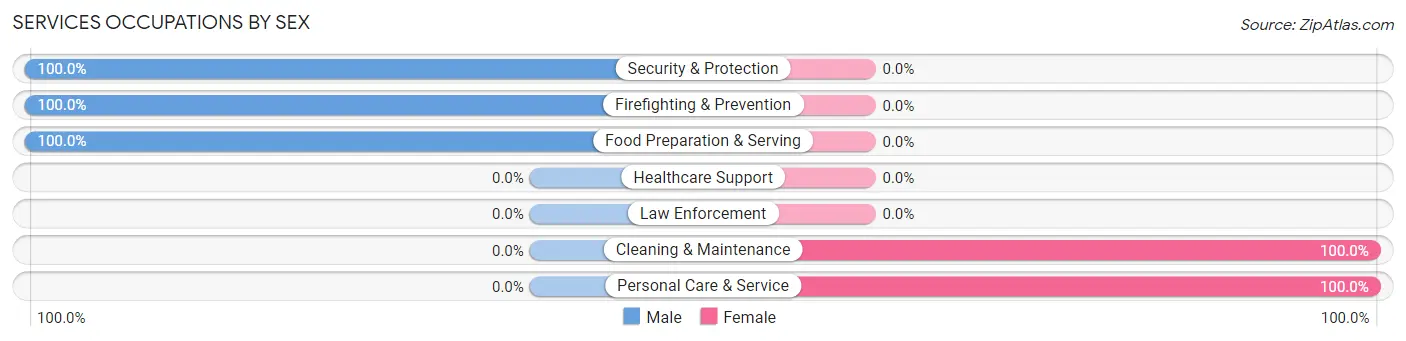
Services Occupations by Sex
Within the Services occupations in Owyhee, the most male-oriented occupations are Security & Protection (100.0%), Firefighting & Prevention (100.0%), and Food Preparation & Serving (100.0%), while the most female-oriented occupations are Cleaning & Maintenance (100.0%), and Personal Care & Service (100.0%).
| Occupation | Male | Female |
| Healthcare Support | 0 (0.0%) | 0 (0.0%) |
| Security & Protection | 24 (100.0%) | 0 (0.0%) |
| Firefighting & Prevention | 24 (100.0%) | 0 (0.0%) |
| Law Enforcement | 0 (0.0%) | 0 (0.0%) |
| Food Preparation & Serving | 7 (100.0%) | 0 (0.0%) |
| Cleaning & Maintenance | 0 (0.0%) | 5 (100.0%) |
| Personal Care & Service | 0 (0.0%) | 12 (100.0%) |
| Total (Category) | 31 (64.6%) | 17 (35.4%) |
| Total (Overall) | 195 (49.6%) | 198 (50.4%) |
Sales and Office Occupations
The most common Sales and Office occupations in Owyhee are Office & Administration (73 | 18.6%), and Sales & Related (11 | 2.8%).
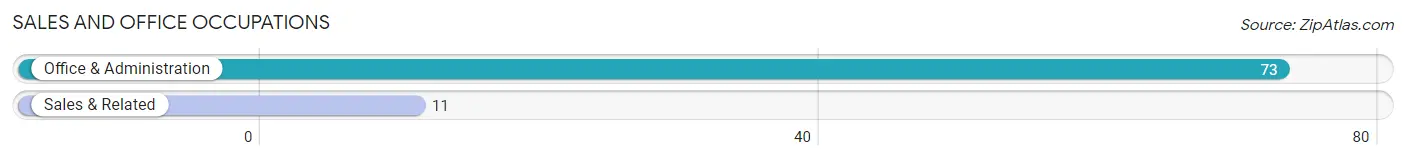
Sales and Office Occupations by Sex

| Occupation | Male | Female |
| Sales & Related | 11 (100.0%) | 0 (0.0%) |
| Office & Administration | 21 (28.8%) | 52 (71.2%) |
| Total (Category) | 32 (38.1%) | 52 (61.9%) |
| Total (Overall) | 195 (49.6%) | 198 (50.4%) |
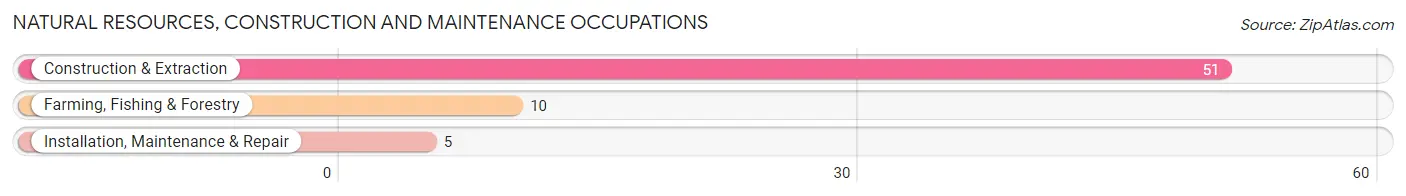
Natural Resources, Construction and Maintenance Occupations
The most common Natural Resources, Construction and Maintenance occupations in Owyhee are Construction & Extraction (51 | 13.0%), Farming, Fishing & Forestry (10 | 2.5%), and Installation, Maintenance & Repair (5 | 1.3%).
Natural Resources, Construction and Maintenance Occupations by Sex
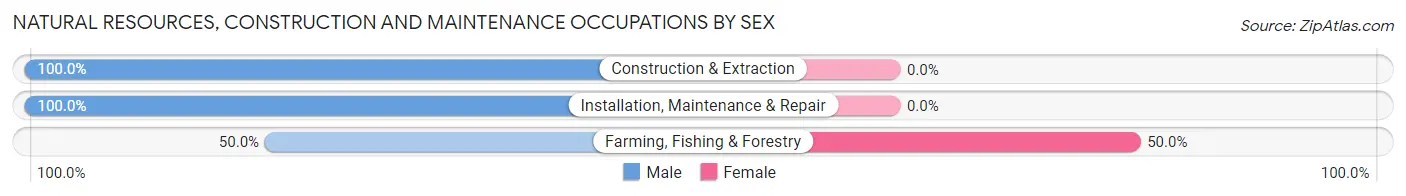
| Occupation | Male | Female |
| Farming, Fishing & Forestry | 5 (50.0%) | 5 (50.0%) |
| Construction & Extraction | 51 (100.0%) | 0 (0.0%) |
| Installation, Maintenance & Repair | 5 (100.0%) | 0 (0.0%) |
| Total (Category) | 61 (92.4%) | 5 (7.6%) |
| Total (Overall) | 195 (49.6%) | 198 (50.4%) |
Production, Transportation and Moving Occupations
The most common Production, Transportation and Moving occupations in Owyhee are Transportation (9 | 2.3%), and Material Moving (5 | 1.3%).
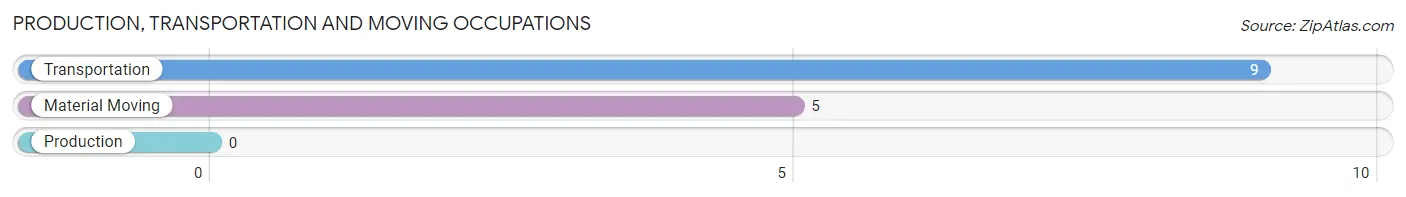
Production, Transportation and Moving Occupations by Sex
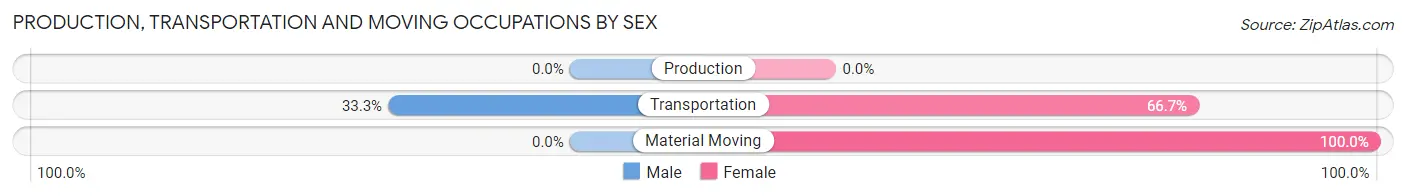
| Occupation | Male | Female |
| Production | 0 (0.0%) | 0 (0.0%) |
| Transportation | 3 (33.3%) | 6 (66.7%) |
| Material Moving | 0 (0.0%) | 5 (100.0%) |
| Total (Category) | 3 (21.4%) | 11 (78.6%) |
| Total (Overall) | 195 (49.6%) | 198 (50.4%) |
Employment Industries by Sex in Owyhee
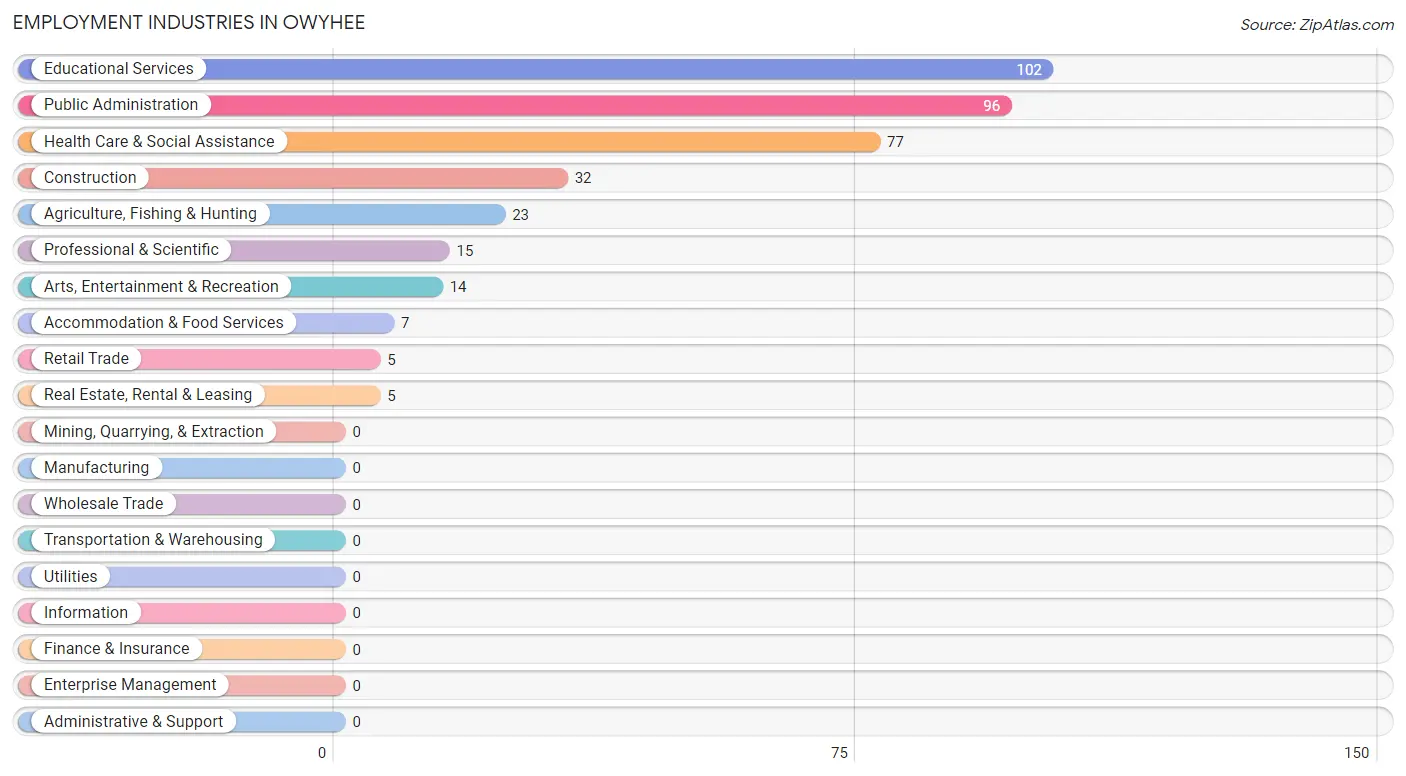
Employment Industries in Owyhee
The major employment industries in Owyhee include Educational Services (102 | 26.0%), Public Administration (96 | 24.4%), Health Care & Social Assistance (77 | 19.6%), Construction (32 | 8.1%), and Agriculture, Fishing & Hunting (23 | 5.9%).
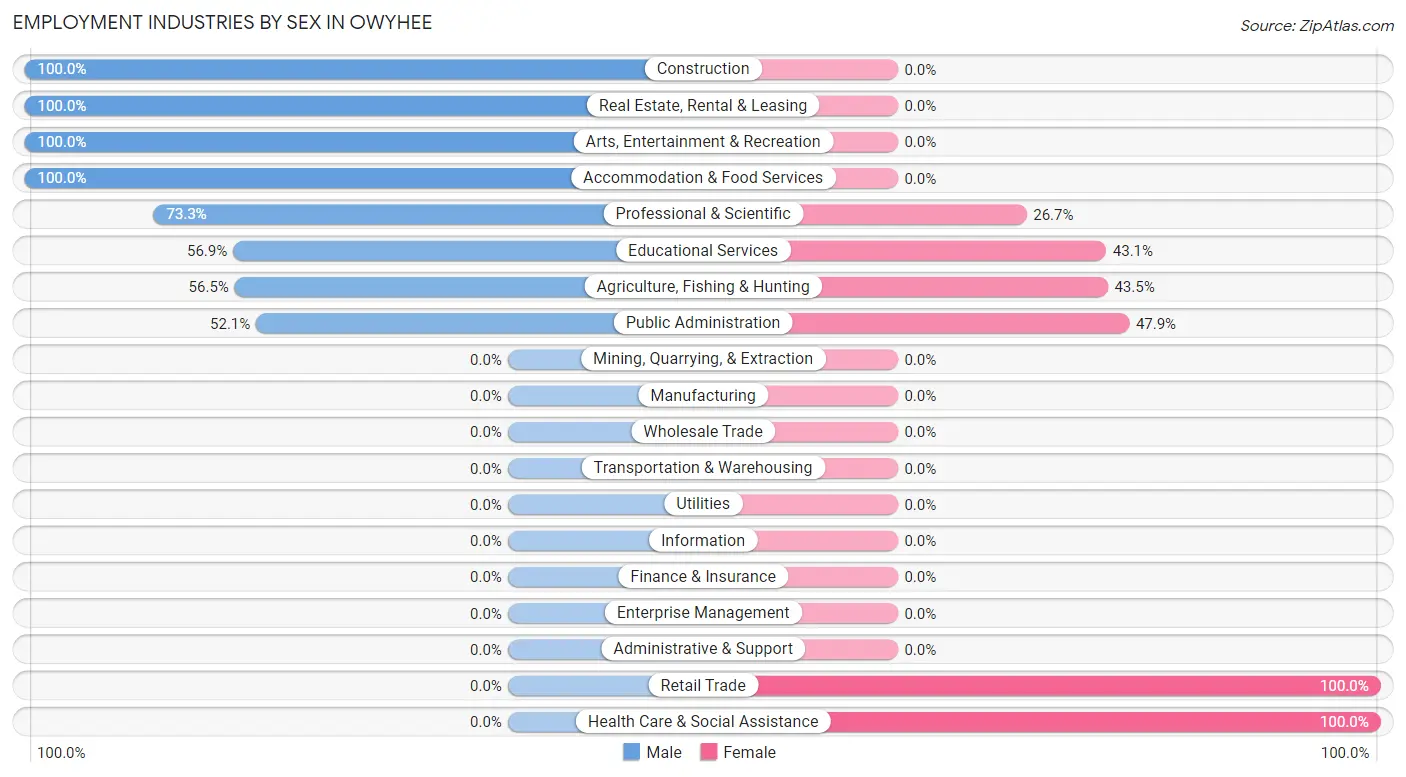
Employment Industries by Sex in Owyhee
The Owyhee industries that see more men than women are Construction (100.0%), Real Estate, Rental & Leasing (100.0%), and Arts, Entertainment & Recreation (100.0%), whereas the industries that tend to have a higher number of women are Retail Trade (100.0%), Health Care & Social Assistance (100.0%), and Public Administration (47.9%).
| Industry | Male | Female |
| Agriculture, Fishing & Hunting | 13 (56.5%) | 10 (43.5%) |
| Mining, Quarrying, & Extraction | 0 (0.0%) | 0 (0.0%) |
| Construction | 32 (100.0%) | 0 (0.0%) |
| Manufacturing | 0 (0.0%) | 0 (0.0%) |
| Wholesale Trade | 0 (0.0%) | 0 (0.0%) |
| Retail Trade | 0 (0.0%) | 5 (100.0%) |
| Transportation & Warehousing | 0 (0.0%) | 0 (0.0%) |
| Utilities | 0 (0.0%) | 0 (0.0%) |
| Information | 0 (0.0%) | 0 (0.0%) |
| Finance & Insurance | 0 (0.0%) | 0 (0.0%) |
| Real Estate, Rental & Leasing | 5 (100.0%) | 0 (0.0%) |
| Professional & Scientific | 11 (73.3%) | 4 (26.7%) |
| Enterprise Management | 0 (0.0%) | 0 (0.0%) |
| Administrative & Support | 0 (0.0%) | 0 (0.0%) |
| Educational Services | 58 (56.9%) | 44 (43.1%) |
| Health Care & Social Assistance | 0 (0.0%) | 77 (100.0%) |
| Arts, Entertainment & Recreation | 14 (100.0%) | 0 (0.0%) |
| Accommodation & Food Services | 7 (100.0%) | 0 (0.0%) |
| Public Administration | 50 (52.1%) | 46 (47.9%) |
| Total | 195 (49.6%) | 198 (50.4%) |
Education in Owyhee
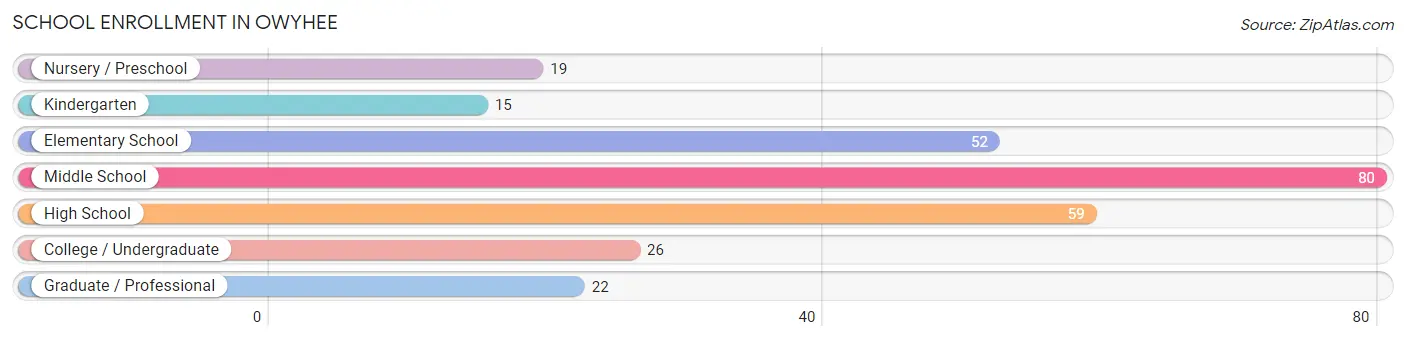
School Enrollment in Owyhee
The most common levels of schooling among the 273 students in Owyhee are middle school (80 | 29.3%), high school (59 | 21.6%), and elementary school (52 | 19.1%).
| School Level | # Students | % Students |
| Nursery / Preschool | 19 | 7.0% |
| Kindergarten | 15 | 5.5% |
| Elementary School | 52 | 19.1% |
| Middle School | 80 | 29.3% |
| High School | 59 | 21.6% |
| College / Undergraduate | 26 | 9.5% |
| Graduate / Professional | 22 | 8.1% |
| Total | 273 | 100.0% |
School Enrollment by Age by Funding Source in Owyhee
Out of a total of 273 students who are enrolled in schools in Owyhee, 9 (3.3%) attend a private institution, while the remaining 264 (96.7%) are enrolled in public schools. The age group of 35 years and over has the highest likelihood of being enrolled in private schools, with 9 (47.4% in the age bracket) enrolled. Conversely, the age group of 3 to 4 year olds has the lowest likelihood of being enrolled in a private school, with 19 (100.0% in the age bracket) attending a public institution.
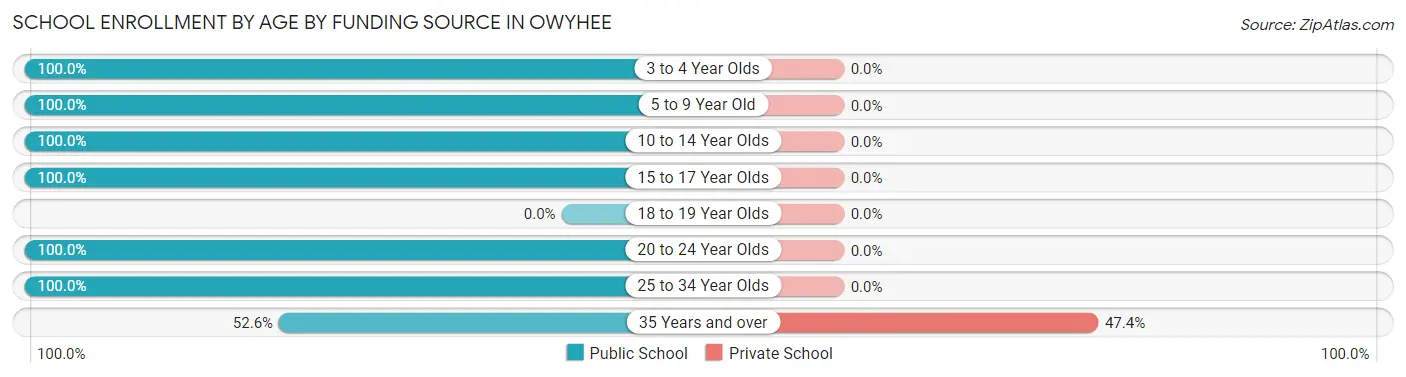
| Age Bracket | Public School | Private School |
| 3 to 4 Year Olds | 19 (100.0%) | 0 (0.0%) |
| 5 to 9 Year Old | 51 (100.0%) | 0 (0.0%) |
| 10 to 14 Year Olds | 96 (100.0%) | 0 (0.0%) |
| 15 to 17 Year Olds | 59 (100.0%) | 0 (0.0%) |
| 18 to 19 Year Olds | 0 (0.0%) | 0 (0.0%) |
| 20 to 24 Year Olds | 7 (100.0%) | 0 (0.0%) |
| 25 to 34 Year Olds | 22 (100.0%) | 0 (0.0%) |
| 35 Years and over | 10 (52.6%) | 9 (47.4%) |
| Total | 264 (96.7%) | 9 (3.3%) |
Educational Attainment by Field of Study in Owyhee
Engineering (22 | 33.3%), science & technology (17 | 25.8%), arts & humanities (12 | 18.2%), business (5 | 7.6%), and education (5 | 7.6%) are the most common fields of study among 66 individuals in Owyhee who have obtained a bachelor's degree or higher.
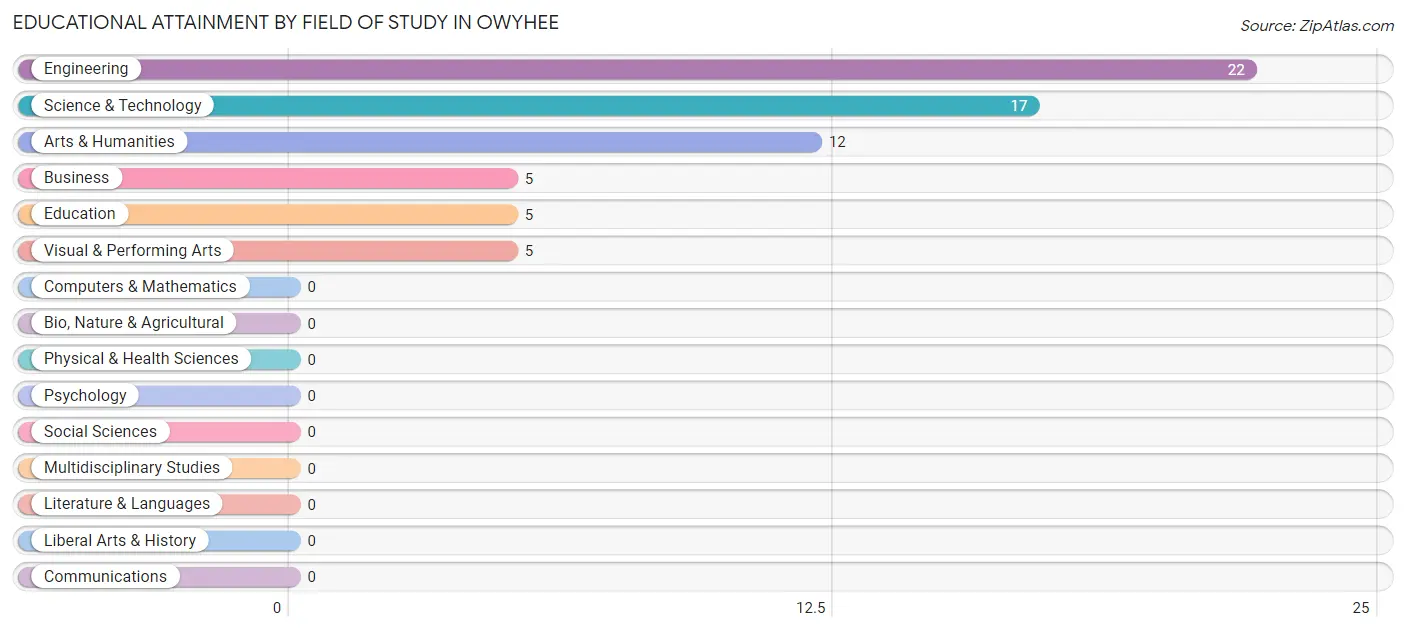
| Field of Study | # Graduates | % Graduates |
| Computers & Mathematics | 0 | 0.0% |
| Bio, Nature & Agricultural | 0 | 0.0% |
| Physical & Health Sciences | 0 | 0.0% |
| Psychology | 0 | 0.0% |
| Social Sciences | 0 | 0.0% |
| Engineering | 22 | 33.3% |
| Multidisciplinary Studies | 0 | 0.0% |
| Science & Technology | 17 | 25.8% |
| Business | 5 | 7.6% |
| Education | 5 | 7.6% |
| Literature & Languages | 0 | 0.0% |
| Liberal Arts & History | 0 | 0.0% |
| Visual & Performing Arts | 5 | 7.6% |
| Communications | 0 | 0.0% |
| Arts & Humanities | 12 | 18.2% |
| Total | 66 | 100.0% |
Transportation & Commute in Owyhee
Vehicle Availability by Sex in Owyhee
The most prevalent vehicle ownership categories in Owyhee are males with 2 vehicles (70, accounting for 41.2%) and females with 2 vehicles (76, making up 36.3%).
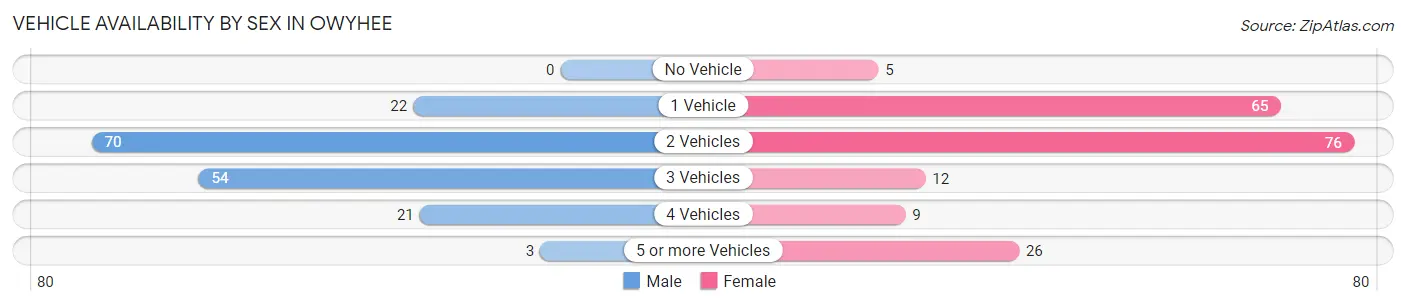
| Vehicles Available | Male | Female |
| No Vehicle | 0 (0.0%) | 5 (2.6%) |
| 1 Vehicle | 22 (12.9%) | 65 (33.7%) |
| 2 Vehicles | 70 (41.2%) | 76 (39.4%) |
| 3 Vehicles | 54 (31.8%) | 12 (6.2%) |
| 4 Vehicles | 21 (12.3%) | 9 (4.7%) |
| 5 or more Vehicles | 3 (1.8%) | 26 (13.5%) |
| Total | 170 (100.0%) | 193 (100.0%) |
Commute Time in Owyhee
The most frequently occuring commute durations in Owyhee are 5 to 9 minutes (144 commuters, 40.6%), 10 to 14 minutes (93 commuters, 26.2%), and 20 to 24 minutes (52 commuters, 14.6%).
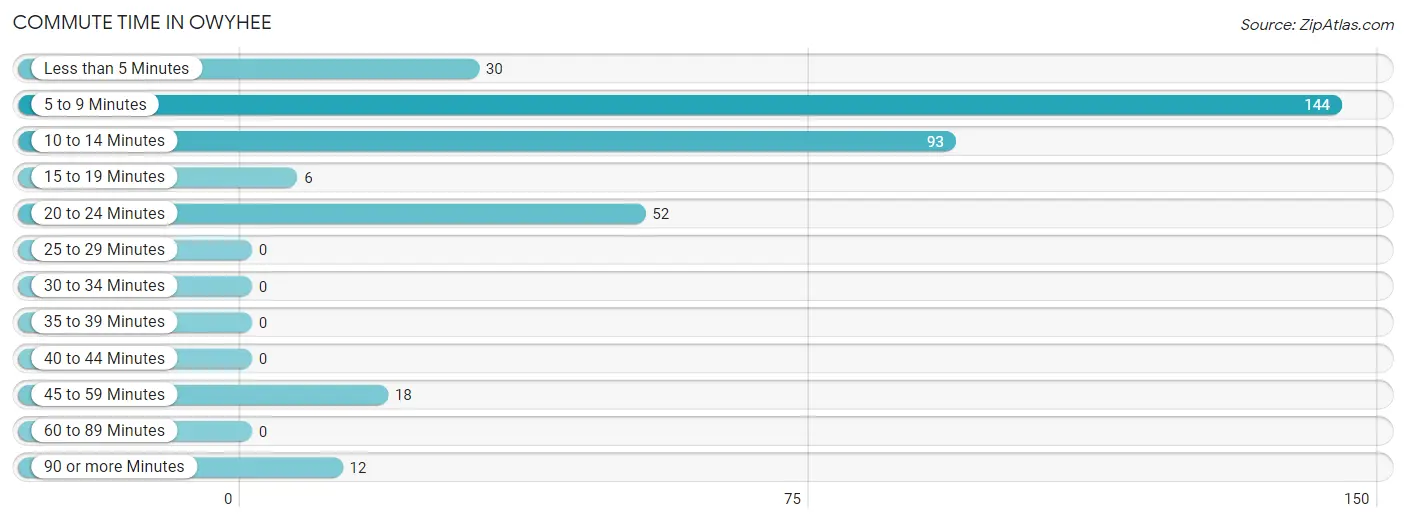
| Commute Time | # Commuters | % Commuters |
| Less than 5 Minutes | 30 | 8.5% |
| 5 to 9 Minutes | 144 | 40.6% |
| 10 to 14 Minutes | 93 | 26.2% |
| 15 to 19 Minutes | 6 | 1.7% |
| 20 to 24 Minutes | 52 | 14.6% |
| 25 to 29 Minutes | 0 | 0.0% |
| 30 to 34 Minutes | 0 | 0.0% |
| 35 to 39 Minutes | 0 | 0.0% |
| 40 to 44 Minutes | 0 | 0.0% |
| 45 to 59 Minutes | 18 | 5.1% |
| 60 to 89 Minutes | 0 | 0.0% |
| 90 or more Minutes | 12 | 3.4% |
Commute Time by Sex in Owyhee
The most common commute times in Owyhee are 10 to 14 minutes (45 commuters, 26.5%) for males and 5 to 9 minutes (104 commuters, 56.2%) for females.
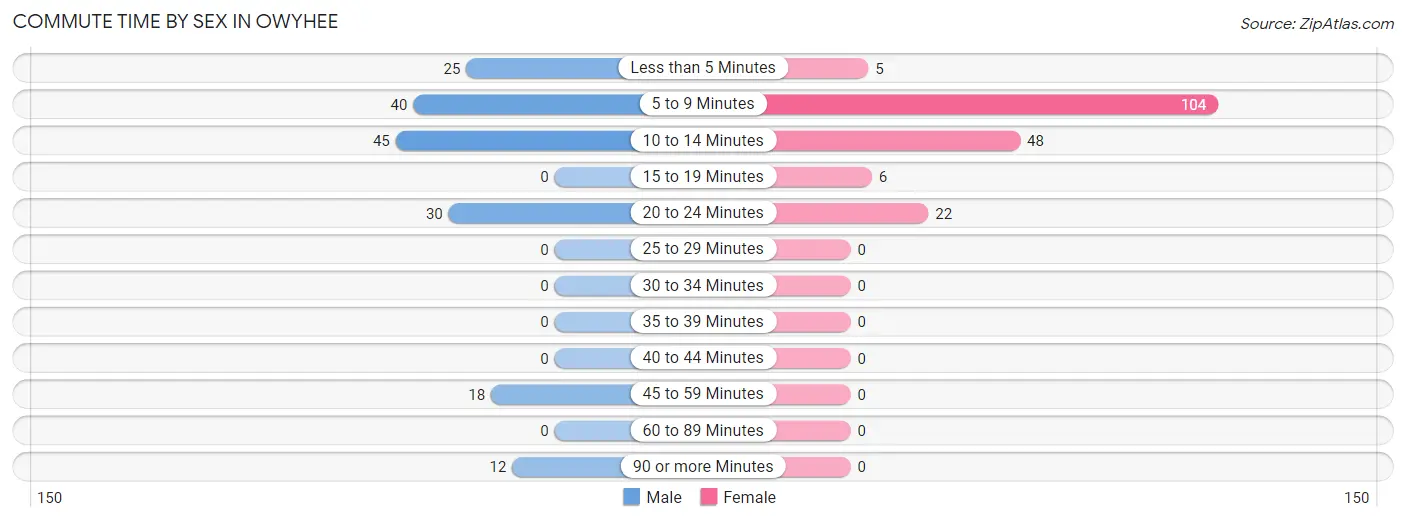
| Commute Time | Male | Female |
| Less than 5 Minutes | 25 (14.7%) | 5 (2.7%) |
| 5 to 9 Minutes | 40 (23.5%) | 104 (56.2%) |
| 10 to 14 Minutes | 45 (26.5%) | 48 (26.0%) |
| 15 to 19 Minutes | 0 (0.0%) | 6 (3.2%) |
| 20 to 24 Minutes | 30 (17.6%) | 22 (11.9%) |
| 25 to 29 Minutes | 0 (0.0%) | 0 (0.0%) |
| 30 to 34 Minutes | 0 (0.0%) | 0 (0.0%) |
| 35 to 39 Minutes | 0 (0.0%) | 0 (0.0%) |
| 40 to 44 Minutes | 0 (0.0%) | 0 (0.0%) |
| 45 to 59 Minutes | 18 (10.6%) | 0 (0.0%) |
| 60 to 89 Minutes | 0 (0.0%) | 0 (0.0%) |
| 90 or more Minutes | 12 (7.1%) | 0 (0.0%) |
Time of Departure to Work by Sex in Owyhee
The most frequent times of departure to work in Owyhee are 12:00 AM to 4:59 AM (35, 20.6%) for males and 7:30 AM to 7:59 AM (55, 29.7%) for females.
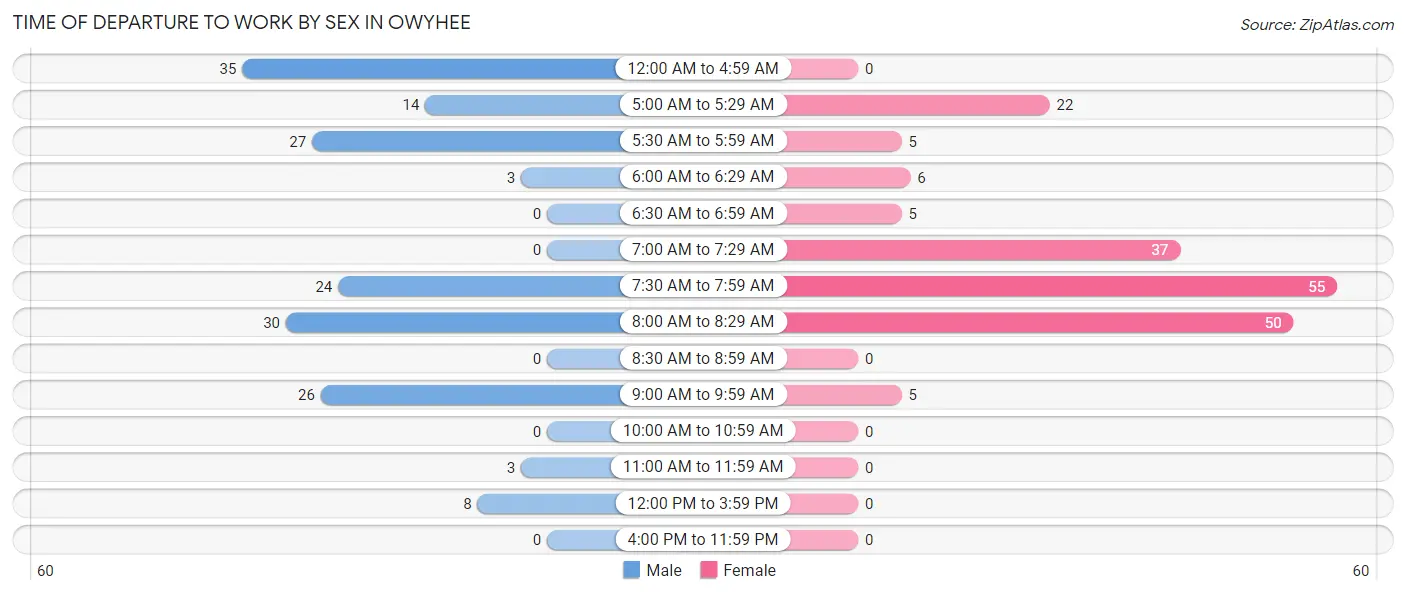
| Time of Departure | Male | Female |
| 12:00 AM to 4:59 AM | 35 (20.6%) | 0 (0.0%) |
| 5:00 AM to 5:29 AM | 14 (8.2%) | 22 (11.9%) |
| 5:30 AM to 5:59 AM | 27 (15.9%) | 5 (2.7%) |
| 6:00 AM to 6:29 AM | 3 (1.8%) | 6 (3.2%) |
| 6:30 AM to 6:59 AM | 0 (0.0%) | 5 (2.7%) |
| 7:00 AM to 7:29 AM | 0 (0.0%) | 37 (20.0%) |
| 7:30 AM to 7:59 AM | 24 (14.1%) | 55 (29.7%) |
| 8:00 AM to 8:29 AM | 30 (17.6%) | 50 (27.0%) |
| 8:30 AM to 8:59 AM | 0 (0.0%) | 0 (0.0%) |
| 9:00 AM to 9:59 AM | 26 (15.3%) | 5 (2.7%) |
| 10:00 AM to 10:59 AM | 0 (0.0%) | 0 (0.0%) |
| 11:00 AM to 11:59 AM | 3 (1.8%) | 0 (0.0%) |
| 12:00 PM to 3:59 PM | 8 (4.7%) | 0 (0.0%) |
| 4:00 PM to 11:59 PM | 0 (0.0%) | 0 (0.0%) |
| Total | 170 (100.0%) | 185 (100.0%) |
Housing Occupancy in Owyhee
Occupancy by Ownership in Owyhee
Of the total 298 dwellings in Owyhee, owner-occupied units account for 150 (50.3%), while renter-occupied units make up 148 (49.7%).
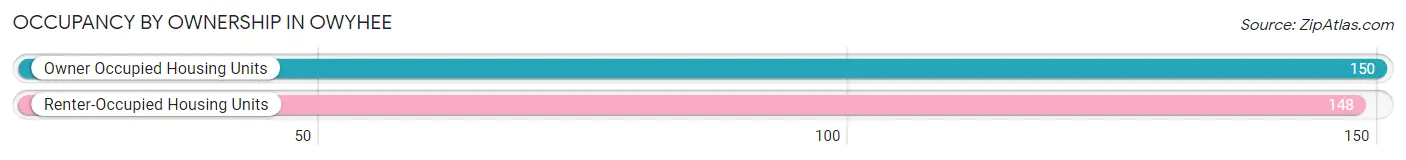
| Occupancy | # Housing Units | % Housing Units |
| Owner Occupied Housing Units | 150 | 50.3% |
| Renter-Occupied Housing Units | 148 | 49.7% |
| Total Occupied Housing Units | 298 | 100.0% |
Occupancy by Household Size in Owyhee
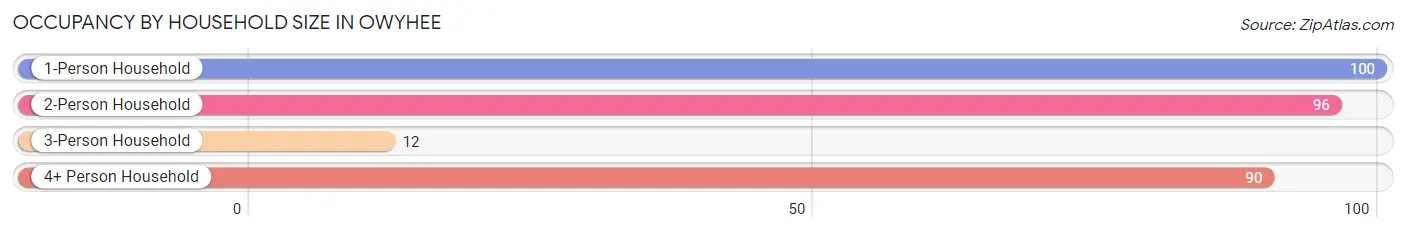
| Household Size | # Housing Units | % Housing Units |
| 1-Person Household | 100 | 33.6% |
| 2-Person Household | 96 | 32.2% |
| 3-Person Household | 12 | 4.0% |
| 4+ Person Household | 90 | 30.2% |
| Total Housing Units | 298 | 100.0% |
Occupancy by Ownership by Household Size in Owyhee
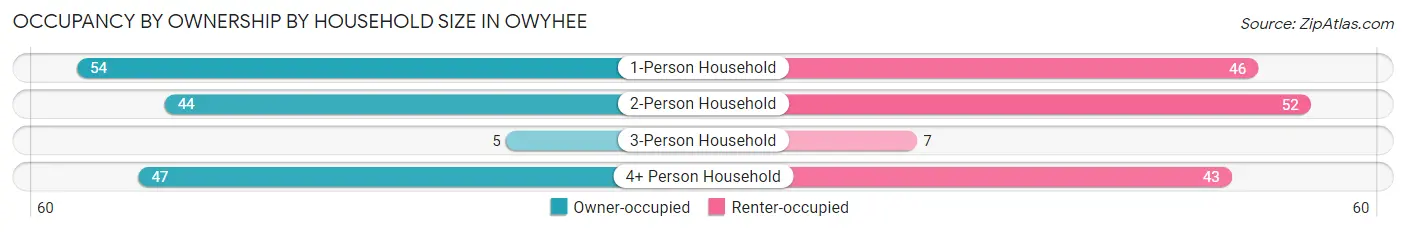
| Household Size | Owner-occupied | Renter-occupied |
| 1-Person Household | 54 (54.0%) | 46 (46.0%) |
| 2-Person Household | 44 (45.8%) | 52 (54.2%) |
| 3-Person Household | 5 (41.7%) | 7 (58.3%) |
| 4+ Person Household | 47 (52.2%) | 43 (47.8%) |
| Total Housing Units | 150 (50.3%) | 148 (49.7%) |
Occupancy by Educational Attainment in Owyhee
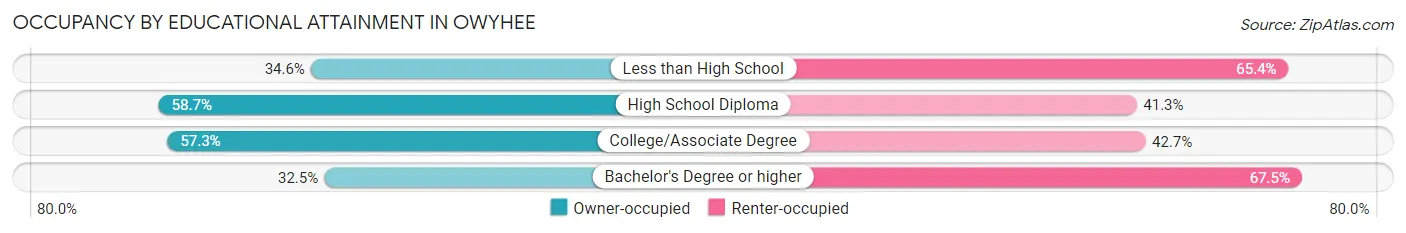
| Household Size | Owner-occupied | Renter-occupied |
| Less than High School | 18 (34.6%) | 34 (65.4%) |
| High School Diploma | 37 (58.7%) | 26 (41.3%) |
| College/Associate Degree | 82 (57.3%) | 61 (42.7%) |
| Bachelor's Degree or higher | 13 (32.5%) | 27 (67.5%) |
Occupancy by Age of Householder in Owyhee
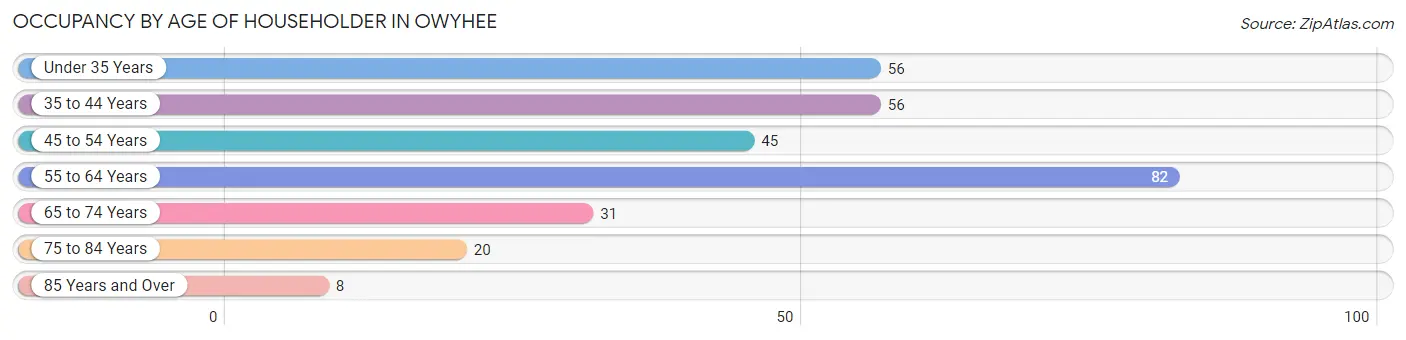
| Age Bracket | # Households | % Households |
| Under 35 Years | 56 | 18.8% |
| 35 to 44 Years | 56 | 18.8% |
| 45 to 54 Years | 45 | 15.1% |
| 55 to 64 Years | 82 | 27.5% |
| 65 to 74 Years | 31 | 10.4% |
| 75 to 84 Years | 20 | 6.7% |
| 85 Years and Over | 8 | 2.7% |
| Total | 298 | 100.0% |
Housing Finances in Owyhee
Median Income by Occupancy in Owyhee
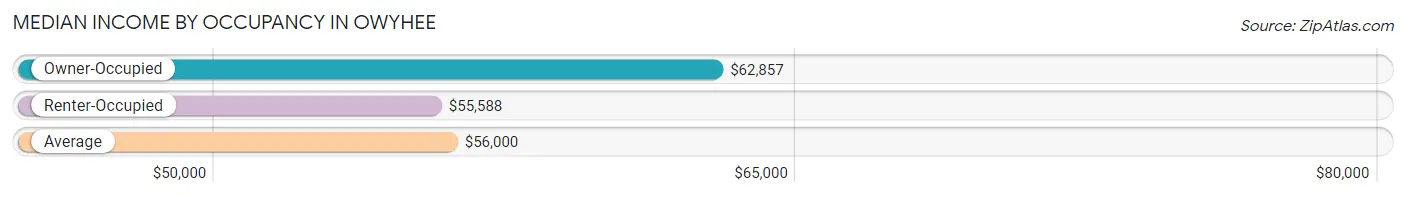
| Occupancy Type | # Households | Median Income |
| Owner-Occupied | 150 (50.3%) | $62,857 |
| Renter-Occupied | 148 (49.7%) | $55,588 |
| Average | 298 (100.0%) | $56,000 |
Occupancy by Householder Income Bracket in Owyhee
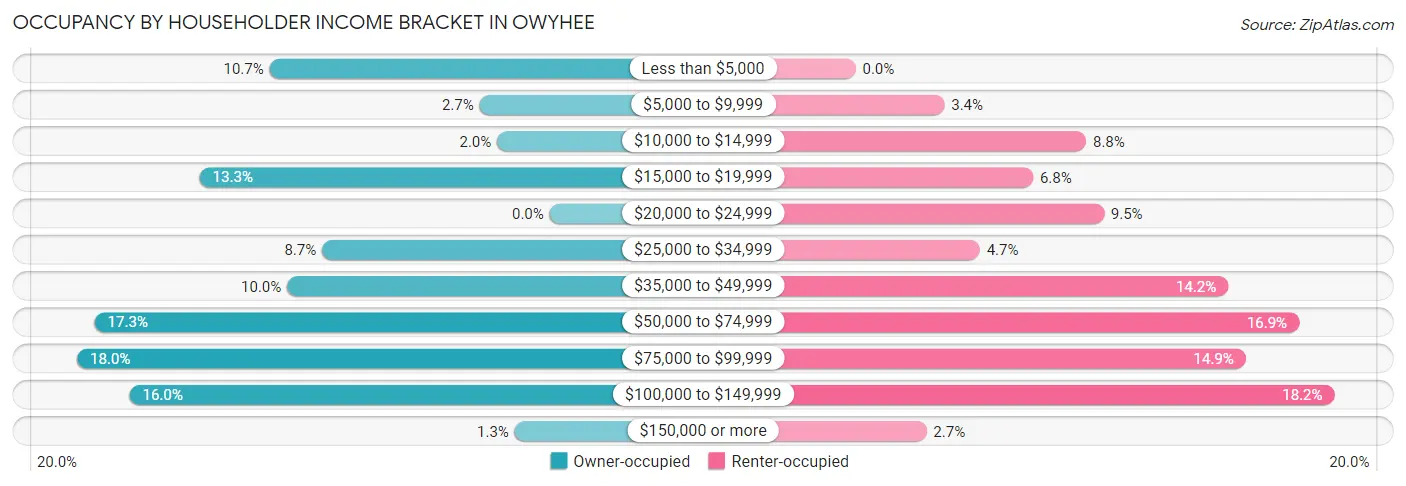
| Income Bracket | Owner-occupied | Renter-occupied |
| Less than $5,000 | 16 (10.7%) | 0 (0.0%) |
| $5,000 to $9,999 | 4 (2.7%) | 5 (3.4%) |
| $10,000 to $14,999 | 3 (2.0%) | 13 (8.8%) |
| $15,000 to $19,999 | 20 (13.3%) | 10 (6.8%) |
| $20,000 to $24,999 | 0 (0.0%) | 14 (9.5%) |
| $25,000 to $34,999 | 13 (8.7%) | 7 (4.7%) |
| $35,000 to $49,999 | 15 (10.0%) | 21 (14.2%) |
| $50,000 to $74,999 | 26 (17.3%) | 25 (16.9%) |
| $75,000 to $99,999 | 27 (18.0%) | 22 (14.9%) |
| $100,000 to $149,999 | 24 (16.0%) | 27 (18.2%) |
| $150,000 or more | 2 (1.3%) | 4 (2.7%) |
| Total | 150 (100.0%) | 148 (100.0%) |
Monthly Housing Cost Tiers in Owyhee
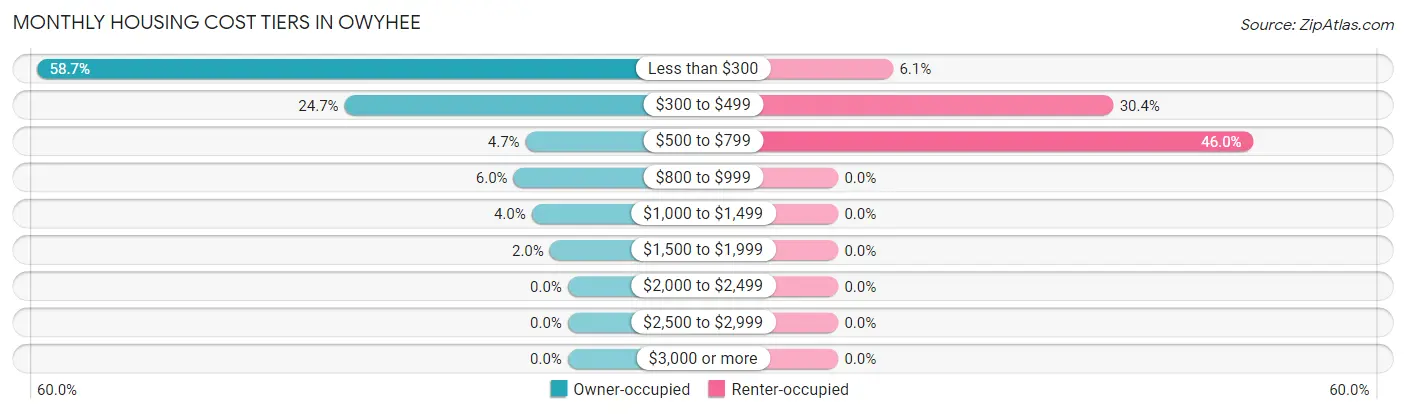
| Monthly Cost | Owner-occupied | Renter-occupied |
| Less than $300 | 88 (58.7%) | 9 (6.1%) |
| $300 to $499 | 37 (24.7%) | 45 (30.4%) |
| $500 to $799 | 7 (4.7%) | 68 (46.0%) |
| $800 to $999 | 9 (6.0%) | 0 (0.0%) |
| $1,000 to $1,499 | 6 (4.0%) | 0 (0.0%) |
| $1,500 to $1,999 | 3 (2.0%) | 0 (0.0%) |
| $2,000 to $2,499 | 0 (0.0%) | 0 (0.0%) |
| $2,500 to $2,999 | 0 (0.0%) | 0 (0.0%) |
| $3,000 or more | 0 (0.0%) | 0 (0.0%) |
| Total | 150 (100.0%) | 148 (100.0%) |
Physical Housing Characteristics in Owyhee
Housing Structures in Owyhee
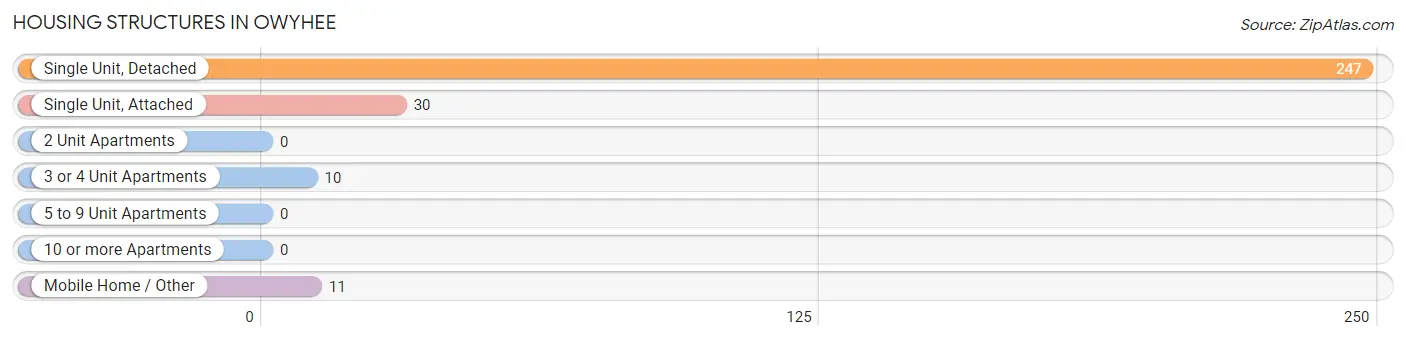
| Structure Type | # Housing Units | % Housing Units |
| Single Unit, Detached | 247 | 82.9% |
| Single Unit, Attached | 30 | 10.1% |
| 2 Unit Apartments | 0 | 0.0% |
| 3 or 4 Unit Apartments | 10 | 3.4% |
| 5 to 9 Unit Apartments | 0 | 0.0% |
| 10 or more Apartments | 0 | 0.0% |
| Mobile Home / Other | 11 | 3.7% |
| Total | 298 | 100.0% |
Housing Structures by Occupancy in Owyhee
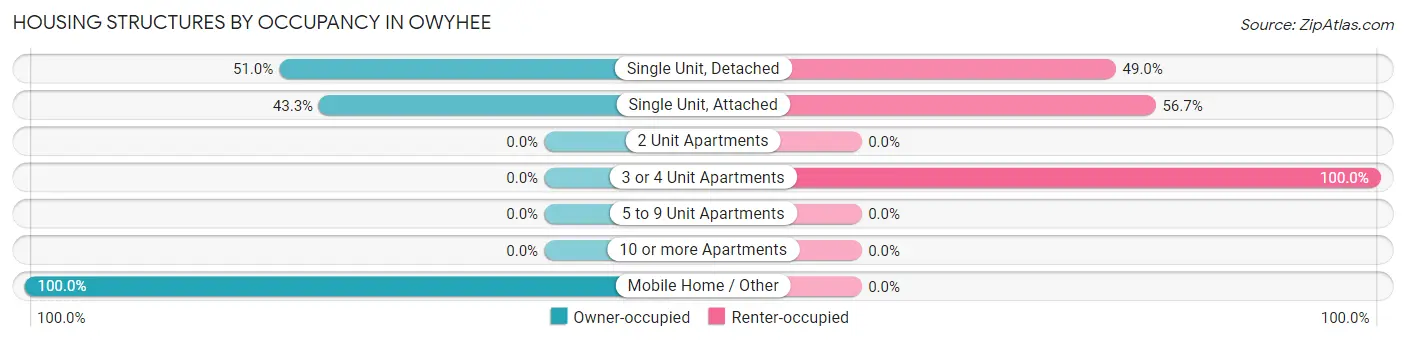
| Structure Type | Owner-occupied | Renter-occupied |
| Single Unit, Detached | 126 (51.0%) | 121 (49.0%) |
| Single Unit, Attached | 13 (43.3%) | 17 (56.7%) |
| 2 Unit Apartments | 0 (0.0%) | 0 (0.0%) |
| 3 or 4 Unit Apartments | 0 (0.0%) | 10 (100.0%) |
| 5 to 9 Unit Apartments | 0 (0.0%) | 0 (0.0%) |
| 10 or more Apartments | 0 (0.0%) | 0 (0.0%) |
| Mobile Home / Other | 11 (100.0%) | 0 (0.0%) |
| Total | 150 (50.3%) | 148 (49.7%) |
Housing Structures by Number of Rooms in Owyhee
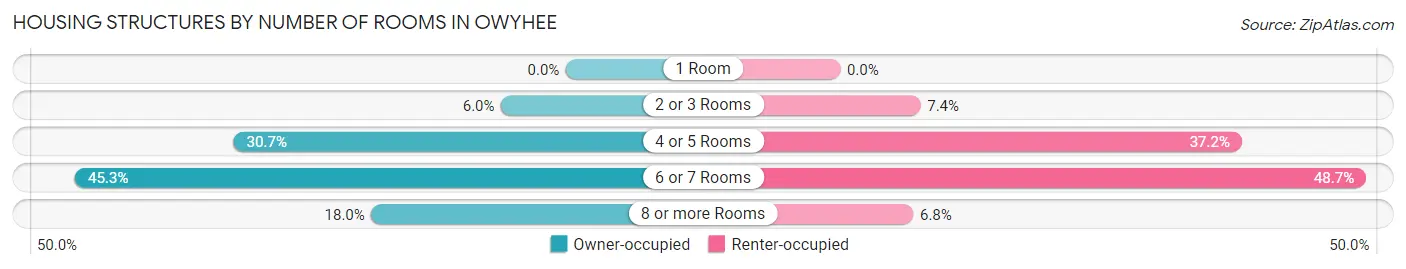
| Number of Rooms | Owner-occupied | Renter-occupied |
| 1 Room | 0 (0.0%) | 0 (0.0%) |
| 2 or 3 Rooms | 9 (6.0%) | 11 (7.4%) |
| 4 or 5 Rooms | 46 (30.7%) | 55 (37.2%) |
| 6 or 7 Rooms | 68 (45.3%) | 72 (48.6%) |
| 8 or more Rooms | 27 (18.0%) | 10 (6.8%) |
| Total | 150 (100.0%) | 148 (100.0%) |
Housing Structure by Heating Type in Owyhee
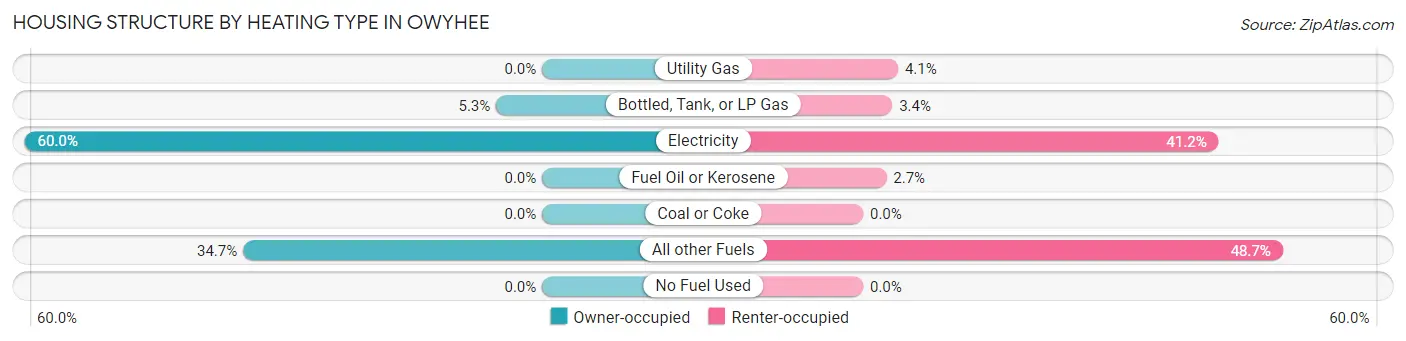
| Heating Type | Owner-occupied | Renter-occupied |
| Utility Gas | 0 (0.0%) | 6 (4.1%) |
| Bottled, Tank, or LP Gas | 8 (5.3%) | 5 (3.4%) |
| Electricity | 90 (60.0%) | 61 (41.2%) |
| Fuel Oil or Kerosene | 0 (0.0%) | 4 (2.7%) |
| Coal or Coke | 0 (0.0%) | 0 (0.0%) |
| All other Fuels | 52 (34.7%) | 72 (48.6%) |
| No Fuel Used | 0 (0.0%) | 0 (0.0%) |
| Total | 150 (100.0%) | 148 (100.0%) |
Household Vehicle Usage in Owyhee
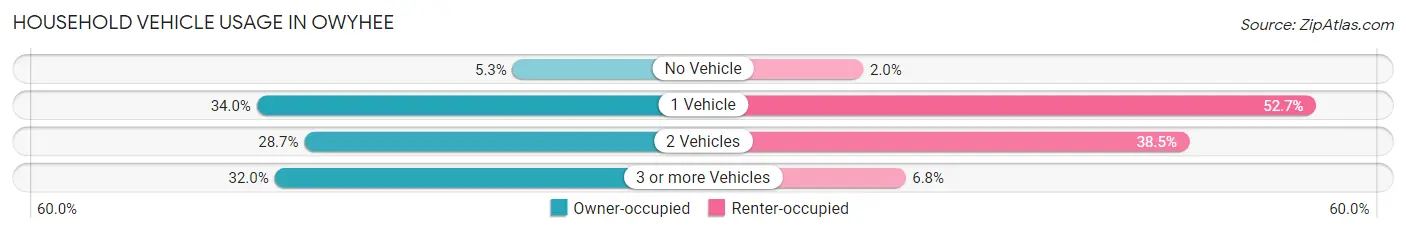
| Vehicles per Household | Owner-occupied | Renter-occupied |
| No Vehicle | 8 (5.3%) | 3 (2.0%) |
| 1 Vehicle | 51 (34.0%) | 78 (52.7%) |
| 2 Vehicles | 43 (28.7%) | 57 (38.5%) |
| 3 or more Vehicles | 48 (32.0%) | 10 (6.8%) |
| Total | 150 (100.0%) | 148 (100.0%) |
Real Estate & Mortgages in Owyhee
Real Estate and Mortgage Overview in Owyhee
| Characteristic | Without Mortgage | With Mortgage |
| Housing Units | 118 | 32 |
| Median Property Value | $55,900 | $235,700 |
| Median Household Income | $63,929 | $0 |
| Monthly Housing Costs | $213 | $0 |
| Real Estate Taxes | - | - |
Property Value by Mortgage Status in Owyhee
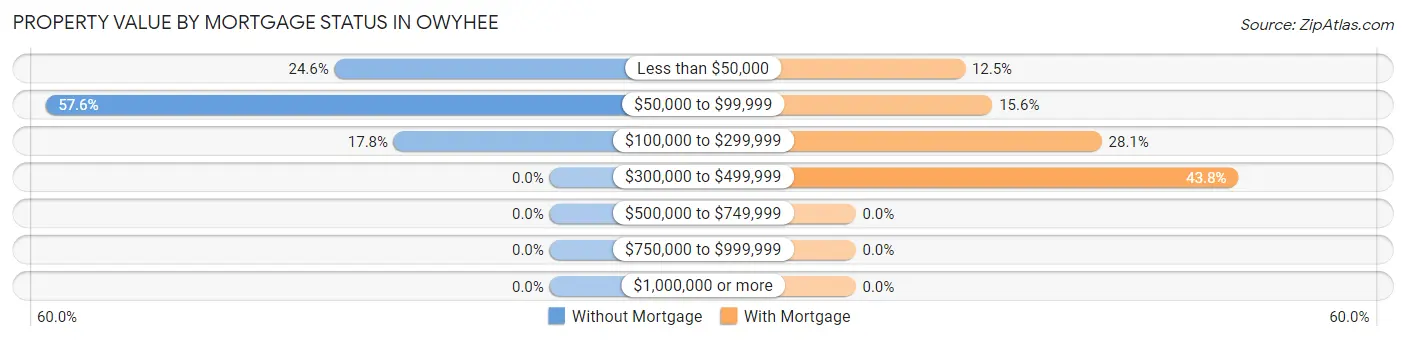
| Property Value | Without Mortgage | With Mortgage |
| Less than $50,000 | 29 (24.6%) | 4 (12.5%) |
| $50,000 to $99,999 | 68 (57.6%) | 5 (15.6%) |
| $100,000 to $299,999 | 21 (17.8%) | 9 (28.1%) |
| $300,000 to $499,999 | 0 (0.0%) | 14 (43.8%) |
| $500,000 to $749,999 | 0 (0.0%) | 0 (0.0%) |
| $750,000 to $999,999 | 0 (0.0%) | 0 (0.0%) |
| $1,000,000 or more | 0 (0.0%) | 0 (0.0%) |
| Total | 118 (100.0%) | 32 (100.0%) |
Household Income by Mortgage Status in Owyhee
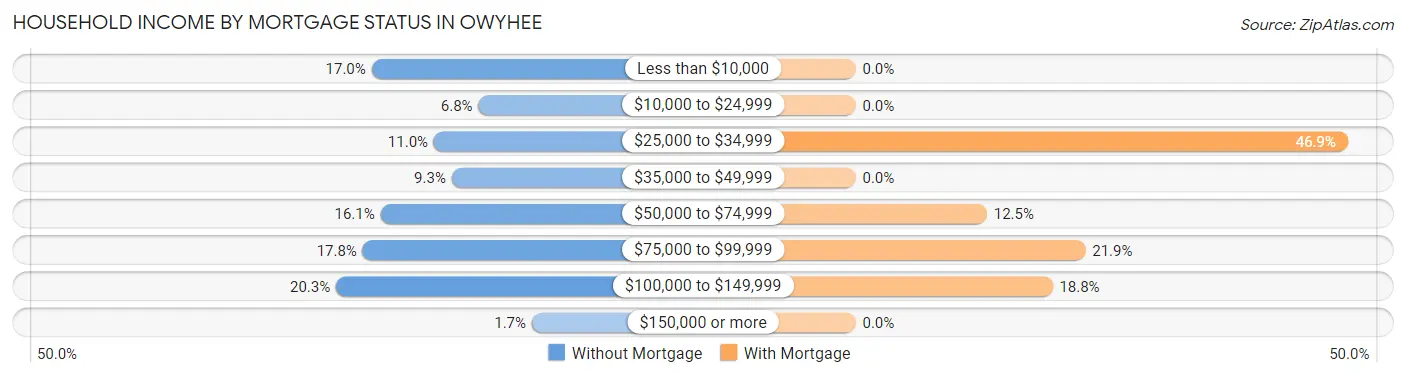
| Household Income | Without Mortgage | With Mortgage |
| Less than $10,000 | 20 (17.0%) | 0 (0.0%) |
| $10,000 to $24,999 | 8 (6.8%) | 0 (0.0%) |
| $25,000 to $34,999 | 13 (11.0%) | 15 (46.9%) |
| $35,000 to $49,999 | 11 (9.3%) | 0 (0.0%) |
| $50,000 to $74,999 | 19 (16.1%) | 4 (12.5%) |
| $75,000 to $99,999 | 21 (17.8%) | 7 (21.9%) |
| $100,000 to $149,999 | 24 (20.3%) | 6 (18.8%) |
| $150,000 or more | 2 (1.7%) | 0 (0.0%) |
| Total | 118 (100.0%) | 32 (100.0%) |
Property Value to Household Income Ratio in Owyhee
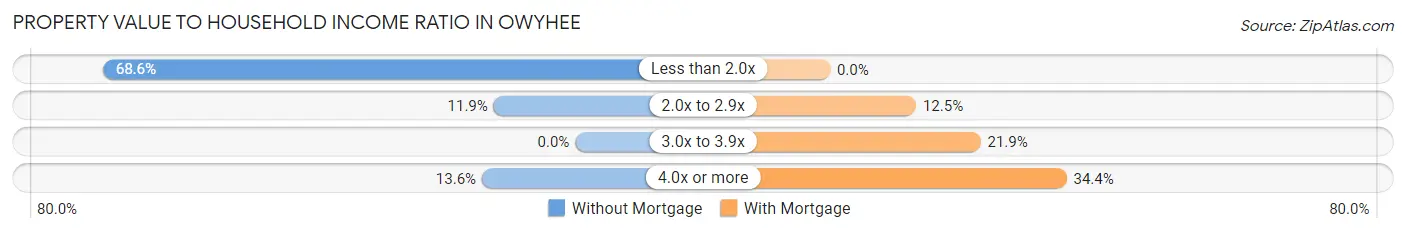
| Value-to-Income Ratio | Without Mortgage | With Mortgage |
| Less than 2.0x | 81 (68.6%) | 0 (0.0%) |
| 2.0x to 2.9x | 14 (11.9%) | 4 (12.5%) |
| 3.0x to 3.9x | 0 (0.0%) | 7 (21.9%) |
| 4.0x or more | 16 (13.6%) | 11 (34.4%) |
| Total | 118 (100.0%) | 32 (100.0%) |
Real Estate Taxes by Mortgage Status in Owyhee
| Property Taxes | Without Mortgage | With Mortgage |
| Less than $800 | 0 (0.0%) | 0 (0.0%) |
| $800 to $1,499 | 0 (0.0%) | 0 (0.0%) |
| $800 to $1,499 | 0 (0.0%) | 0 (0.0%) |
| Total | 118 (100.0%) | 32 (100.0%) |
Health & Disability in Owyhee
Health Insurance Coverage by Age in Owyhee
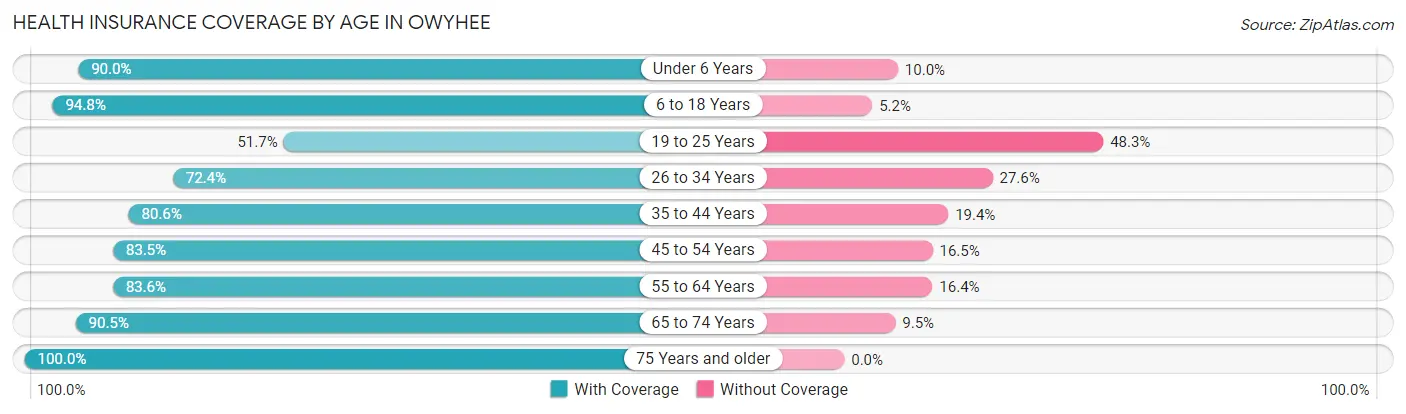
| Age Bracket | With Coverage | Without Coverage |
| Under 6 Years | 99 (90.0%) | 11 (10.0%) |
| 6 to 18 Years | 182 (94.8%) | 10 (5.2%) |
| 19 to 25 Years | 30 (51.7%) | 28 (48.3%) |
| 26 to 34 Years | 89 (72.4%) | 34 (27.6%) |
| 35 to 44 Years | 183 (80.6%) | 44 (19.4%) |
| 45 to 54 Years | 66 (83.5%) | 13 (16.5%) |
| 55 to 64 Years | 117 (83.6%) | 23 (16.4%) |
| 65 to 74 Years | 38 (90.5%) | 4 (9.5%) |
| 75 Years and older | 32 (100.0%) | 0 (0.0%) |
| Total | 836 (83.4%) | 167 (16.7%) |
Health Insurance Coverage by Citizenship Status in Owyhee
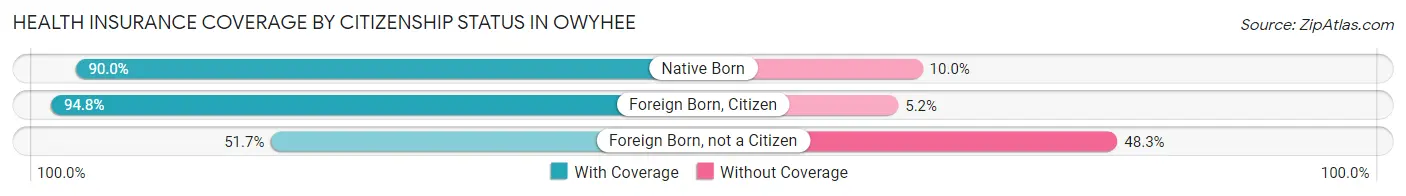
| Citizenship Status | With Coverage | Without Coverage |
| Native Born | 99 (90.0%) | 11 (10.0%) |
| Foreign Born, Citizen | 182 (94.8%) | 10 (5.2%) |
| Foreign Born, not a Citizen | 30 (51.7%) | 28 (48.3%) |
Health Insurance Coverage by Household Income in Owyhee
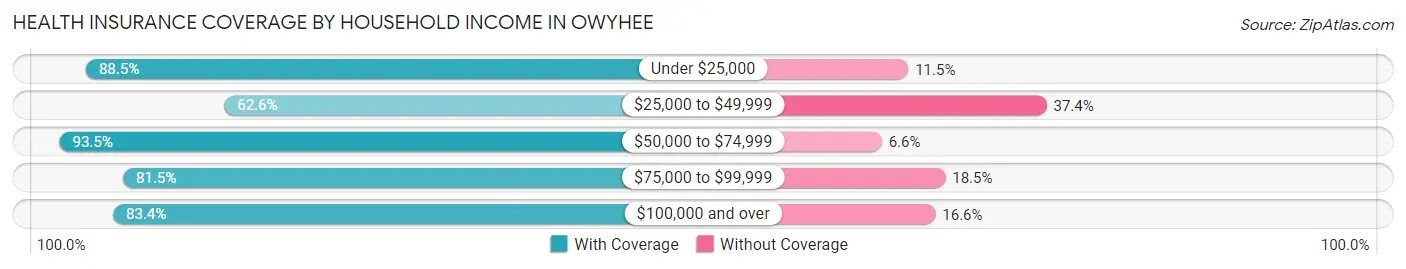
| Household Income | With Coverage | Without Coverage |
| Under $25,000 | 223 (88.5%) | 29 (11.5%) |
| $25,000 to $49,999 | 102 (62.6%) | 61 (37.4%) |
| $50,000 to $74,999 | 214 (93.4%) | 15 (6.6%) |
| $75,000 to $99,999 | 106 (81.5%) | 24 (18.5%) |
| $100,000 and over | 191 (83.4%) | 38 (16.6%) |
Public vs Private Health Insurance Coverage by Age in Owyhee
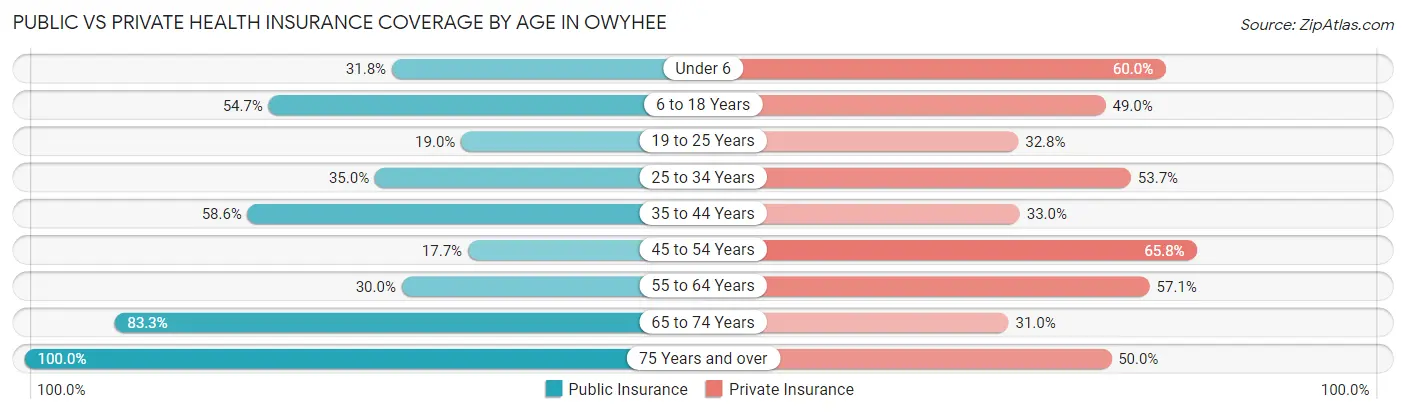
| Age Bracket | Public Insurance | Private Insurance |
| Under 6 | 35 (31.8%) | 66 (60.0%) |
| 6 to 18 Years | 105 (54.7%) | 94 (49.0%) |
| 19 to 25 Years | 11 (19.0%) | 19 (32.8%) |
| 25 to 34 Years | 43 (35.0%) | 66 (53.7%) |
| 35 to 44 Years | 133 (58.6%) | 75 (33.0%) |
| 45 to 54 Years | 14 (17.7%) | 52 (65.8%) |
| 55 to 64 Years | 42 (30.0%) | 80 (57.1%) |
| 65 to 74 Years | 35 (83.3%) | 13 (30.9%) |
| 75 Years and over | 32 (100.0%) | 16 (50.0%) |
| Total | 450 (44.9%) | 481 (48.0%) |
Disability Status by Sex by Age in Owyhee
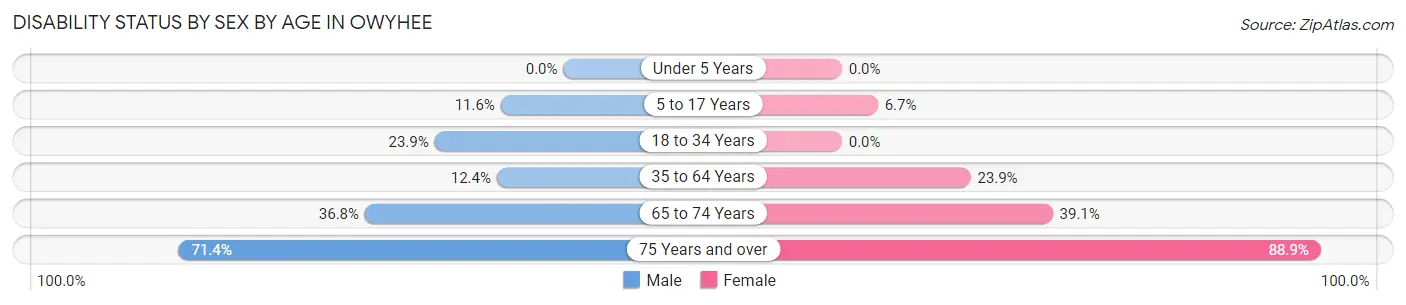
| Age Bracket | Male | Female |
| Under 5 Years | 0 (0.0%) | 0 (0.0%) |
| 5 to 17 Years | 10 (11.6%) | 8 (6.7%) |
| 18 to 34 Years | 22 (23.9%) | 0 (0.0%) |
| 35 to 64 Years | 22 (12.4%) | 64 (23.9%) |
| 65 to 74 Years | 7 (36.8%) | 9 (39.1%) |
| 75 Years and over | 10 (71.4%) | 16 (88.9%) |
Disability Class by Sex by Age in Owyhee
Disability Class: Hearing Difficulty
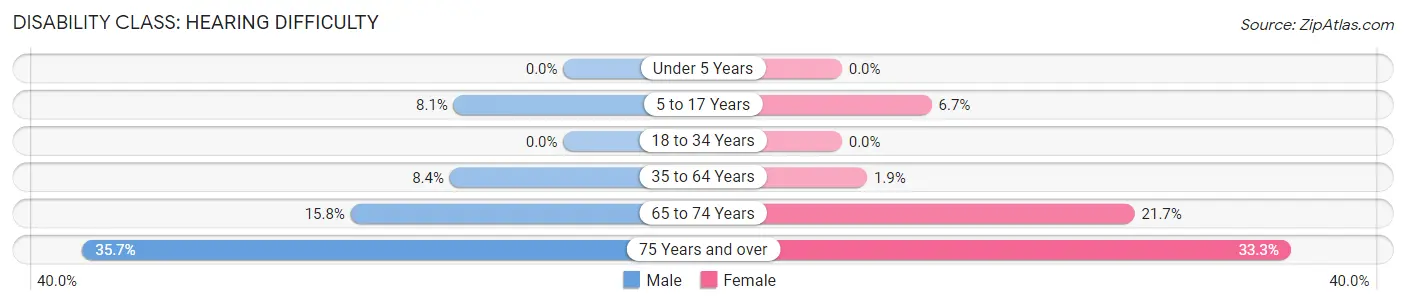
| Age Bracket | Male | Female |
| Under 5 Years | 0 (0.0%) | 0 (0.0%) |
| 5 to 17 Years | 7 (8.1%) | 8 (6.7%) |
| 18 to 34 Years | 0 (0.0%) | 0 (0.0%) |
| 35 to 64 Years | 15 (8.4%) | 5 (1.9%) |
| 65 to 74 Years | 3 (15.8%) | 5 (21.7%) |
| 75 Years and over | 5 (35.7%) | 6 (33.3%) |
Disability Class: Vision Difficulty
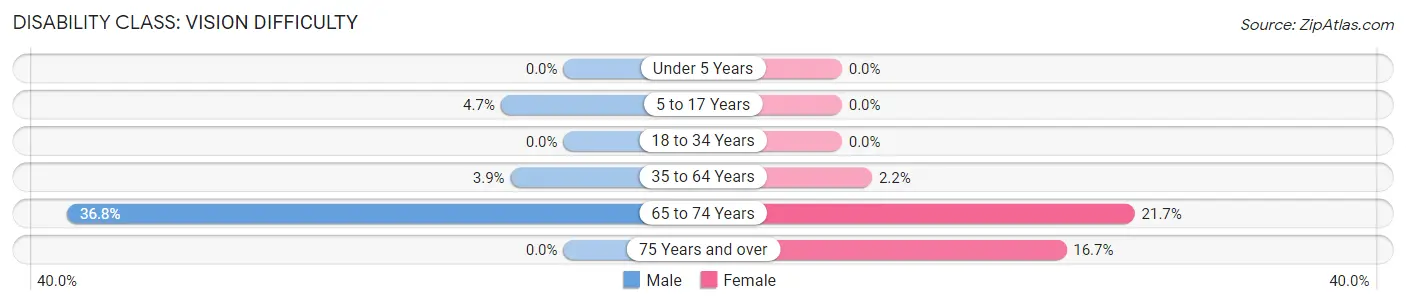
| Age Bracket | Male | Female |
| Under 5 Years | 0 (0.0%) | 0 (0.0%) |
| 5 to 17 Years | 4 (4.6%) | 0 (0.0%) |
| 18 to 34 Years | 0 (0.0%) | 0 (0.0%) |
| 35 to 64 Years | 7 (3.9%) | 6 (2.2%) |
| 65 to 74 Years | 7 (36.8%) | 5 (21.7%) |
| 75 Years and over | 0 (0.0%) | 3 (16.7%) |
Disability Class: Cognitive Difficulty
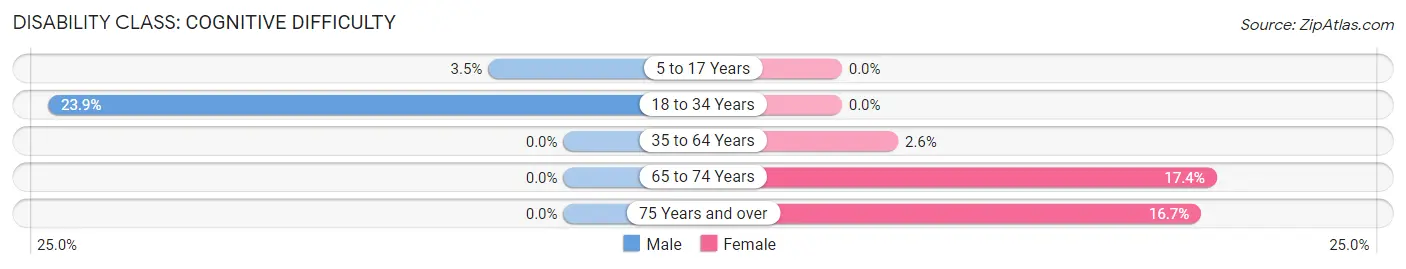
| Age Bracket | Male | Female |
| 5 to 17 Years | 3 (3.5%) | 0 (0.0%) |
| 18 to 34 Years | 22 (23.9%) | 0 (0.0%) |
| 35 to 64 Years | 0 (0.0%) | 7 (2.6%) |
| 65 to 74 Years | 0 (0.0%) | 4 (17.4%) |
| 75 Years and over | 0 (0.0%) | 3 (16.7%) |
Disability Class: Ambulatory Difficulty
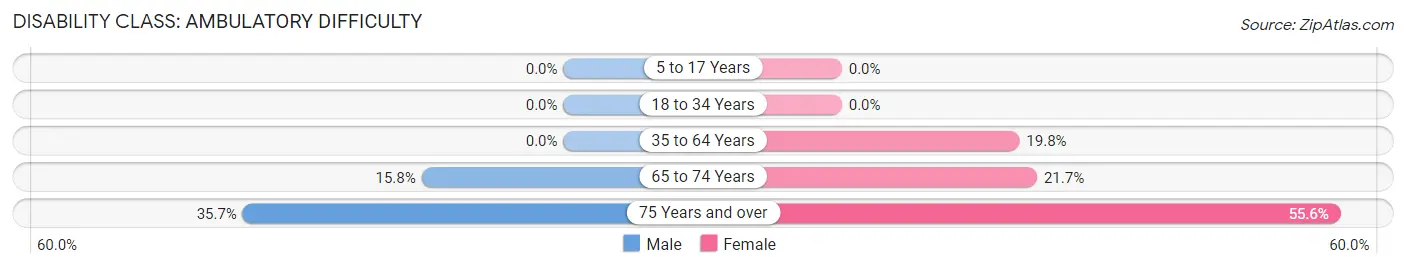
| Age Bracket | Male | Female |
| 5 to 17 Years | 0 (0.0%) | 0 (0.0%) |
| 18 to 34 Years | 0 (0.0%) | 0 (0.0%) |
| 35 to 64 Years | 0 (0.0%) | 53 (19.8%) |
| 65 to 74 Years | 3 (15.8%) | 5 (21.7%) |
| 75 Years and over | 5 (35.7%) | 10 (55.6%) |
Disability Class: Self-Care Difficulty
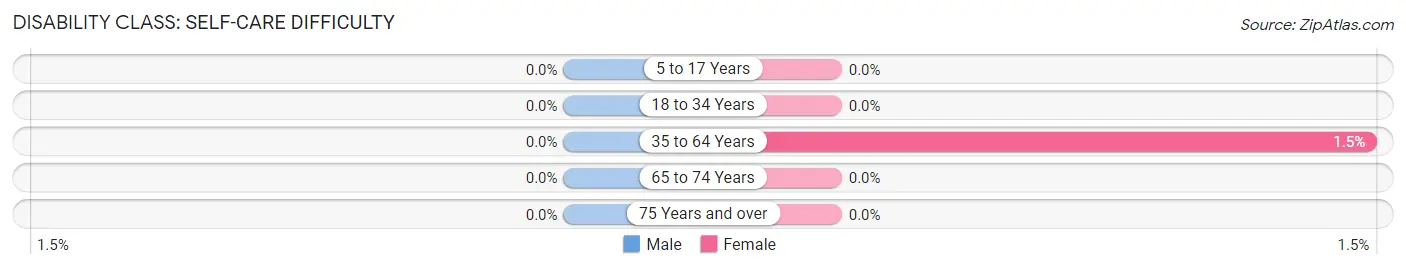
| Age Bracket | Male | Female |
| 5 to 17 Years | 0 (0.0%) | 0 (0.0%) |
| 18 to 34 Years | 0 (0.0%) | 0 (0.0%) |
| 35 to 64 Years | 0 (0.0%) | 4 (1.5%) |
| 65 to 74 Years | 0 (0.0%) | 0 (0.0%) |
| 75 Years and over | 0 (0.0%) | 0 (0.0%) |
Technology Access in Owyhee
Computing Device Access in Owyhee
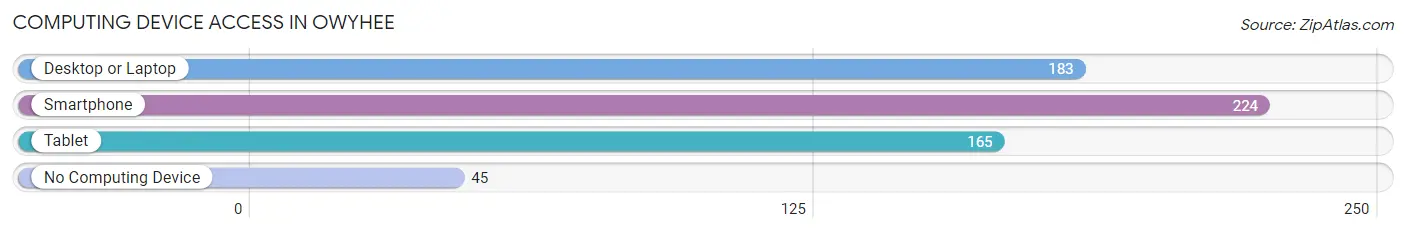
| Device Type | # Households | % Households |
| Desktop or Laptop | 183 | 61.4% |
| Smartphone | 224 | 75.2% |
| Tablet | 165 | 55.4% |
| No Computing Device | 45 | 15.1% |
| Total | 298 | 100.0% |
Internet Access in Owyhee
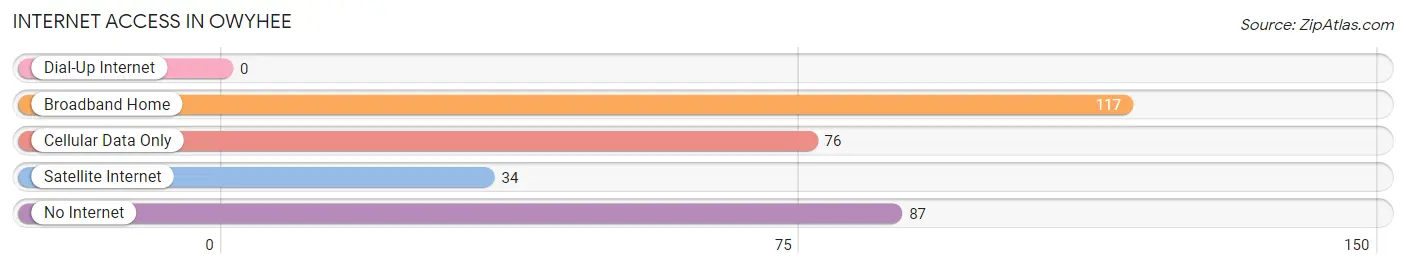
| Internet Type | # Households | % Households |
| Dial-Up Internet | 0 | 0.0% |
| Broadband Home | 117 | 39.3% |
| Cellular Data Only | 76 | 25.5% |
| Satellite Internet | 34 | 11.4% |
| No Internet | 87 | 29.2% |
| Total | 298 | 100.0% |
Owyhee Summary
Owyhee is a small unincorporated community located in Elko County, Nevada. It is situated in the Owyhee Desert, approximately 30 miles south of the city of Elko. The town was founded in 1864 and is named after the nearby Owyhee River. The population of Owyhee was estimated to be around 200 in 2020.
History
Owyhee was founded in 1864 by a group of prospectors who were searching for gold in the area. The town was named after the nearby Owyhee River, which was named after three Hawaiian fur trappers who were lost in the area in 1819. The town quickly grew as more prospectors arrived in search of gold and silver. By the late 1800s, Owyhee had become a bustling mining town with a population of over 1,000.
The town was home to several saloons, hotels, stores, and other businesses. In 1868, the Owyhee County Courthouse was built, and the town was officially incorporated in 1871. The town continued to grow and prosper until the early 1900s, when the mining industry began to decline. By the 1950s, the population had dropped to just over 200.
Geography
Owyhee is located in the Owyhee Desert, approximately 30 miles south of the city of Elko. The town is situated at an elevation of 4,890 feet and is surrounded by mountains and desert. The nearby Owyhee River provides a source of water for the town. The climate in Owyhee is semi-arid, with hot summers and cold winters.
Economy
The economy of Owyhee is largely based on agriculture and ranching. The town is home to several farms and ranches, which produce hay, alfalfa, and other crops. Livestock is also raised in the area, including cattle, sheep, and horses.
The town is also home to several small businesses, including a gas station, a grocery store, and a few restaurants. Tourism is also an important part of the local economy, as the town is a popular destination for hunters, hikers, and other outdoor enthusiasts.
Demographics
As of 2020, the population of Owyhee was estimated to be around 200. The town is predominantly white, with a small Hispanic population. The median household income in Owyhee is $37,500, and the median home value is $125,000.
Conclusion
Owyhee is a small unincorporated community located in Elko County, Nevada. It was founded in 1864 and is named after the nearby Owyhee River. The town is home to around 200 people and is largely supported by agriculture and ranching. Tourism is also an important part of the local economy, as the town is a popular destination for hunters, hikers, and other outdoor enthusiasts.
Common Questions
What is Per Capita Income in Owyhee?
Per Capita income in Owyhee is $22,464.
What is the Median Family Income in Owyhee?
Median Family Income in Owyhee is $65,625.
What is the Median Household income in Owyhee?
Median Household Income in Owyhee is $56,000.
What is Income or Wage Gap in Owyhee?
Income or Wage Gap in Owyhee is 26.4%.
Women in Owyhee earn 73.6 cents for every dollar earned by a man.
What is Inequality or Gini Index in Owyhee?
Inequality or Gini Index in Owyhee is 0.40.
What is the Total Population of Owyhee?
Total Population of Owyhee is 1,012.
What is the Total Male Population of Owyhee?
Total Male Population of Owyhee is 412.
What is the Total Female Population of Owyhee?
Total Female Population of Owyhee is 600.
What is the Ratio of Males per 100 Females in Owyhee?
There are 68.67 Males per 100 Females in Owyhee.
What is the Ratio of Females per 100 Males in Owyhee?
There are 145.63 Females per 100 Males in Owyhee.
What is the Median Population Age in Owyhee?
Median Population Age in Owyhee is 37.3 Years.
What is the Average Family Size in Owyhee
Average Family Size in Owyhee is 4.6 People.
What is the Average Household Size in Owyhee
Average Household Size in Owyhee is 3.4 People.
How Large is the Labor Force in Owyhee?
There are 416 People in the Labor Forcein in Owyhee.
What is the Percentage of People in the Labor Force in Owyhee?
55.6% of People are in the Labor Force in Owyhee.
What is the Unemployment Rate in Owyhee?
Unemployment Rate in Owyhee is 5.5%.