Cleburne, TX Map & Demographics
Cleburne Map
Cleburne Overview
$28,134
PER CAPITA INCOME
$70,199
AVG FAMILY INCOME
$60,929
AVG HOUSEHOLD INCOME
30.7%
WAGE / INCOME GAP [ % ]
69.3¢/ $1
WAGE / INCOME GAP [ $ ]
$10,496
FAMILY INCOME DEFICIT
0.42
INEQUALITY / GINI INDEX
31,849
TOTAL POPULATION
16,530
MALE POPULATION
15,319
FEMALE POPULATION
107.91
MALES / 100 FEMALES
92.67
FEMALES / 100 MALES
35.2
MEDIAN AGE
3.3
AVG FAMILY SIZE
2.8
AVG HOUSEHOLD SIZE
14,665
LABOR FORCE [ PEOPLE ]
60.4%
PERCENT IN LABOR FORCE
2.7%
UNEMPLOYMENT RATE
Income in Cleburne
Income Overview in Cleburne
Per Capita Income in Cleburne is $28,134, while median incomes of families and households are $70,199 and $60,929 respectively.
| Characteristic | Number | Measure |
| Per Capita Income | 31,849 | $28,134 |
| Median Family Income | 7,937 | $70,199 |
| Mean Family Income | 7,937 | $86,562 |
| Median Household Income | 11,258 | $60,929 |
| Mean Household Income | 11,258 | $77,092 |
| Income Deficit | 7,937 | $10,496 |
| Wage / Income Gap (%) | 31,849 | 30.71% |
| Wage / Income Gap ($) | 31,849 | 69.29¢ per $1 |
| Gini / Inequality Index | 31,849 | 0.42 |
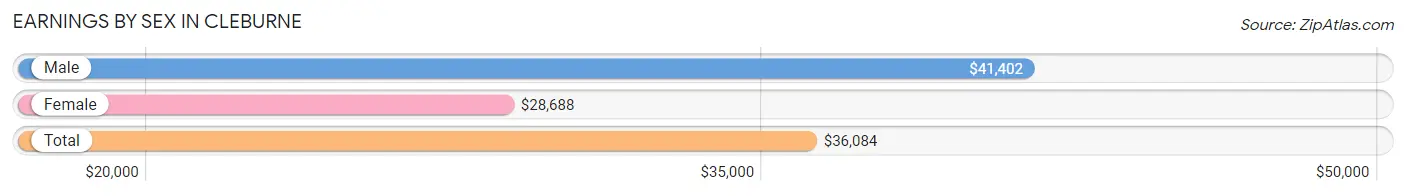
Earnings by Sex in Cleburne
Average Earnings in Cleburne are $36,084, $41,402 for men and $28,688 for women, a difference of 30.7%.
| Sex | Number | Average Earnings |
| Male | 8,755 (56.5%) | $41,402 |
| Female | 6,752 (43.5%) | $28,688 |
| Total | 15,507 (100.0%) | $36,084 |
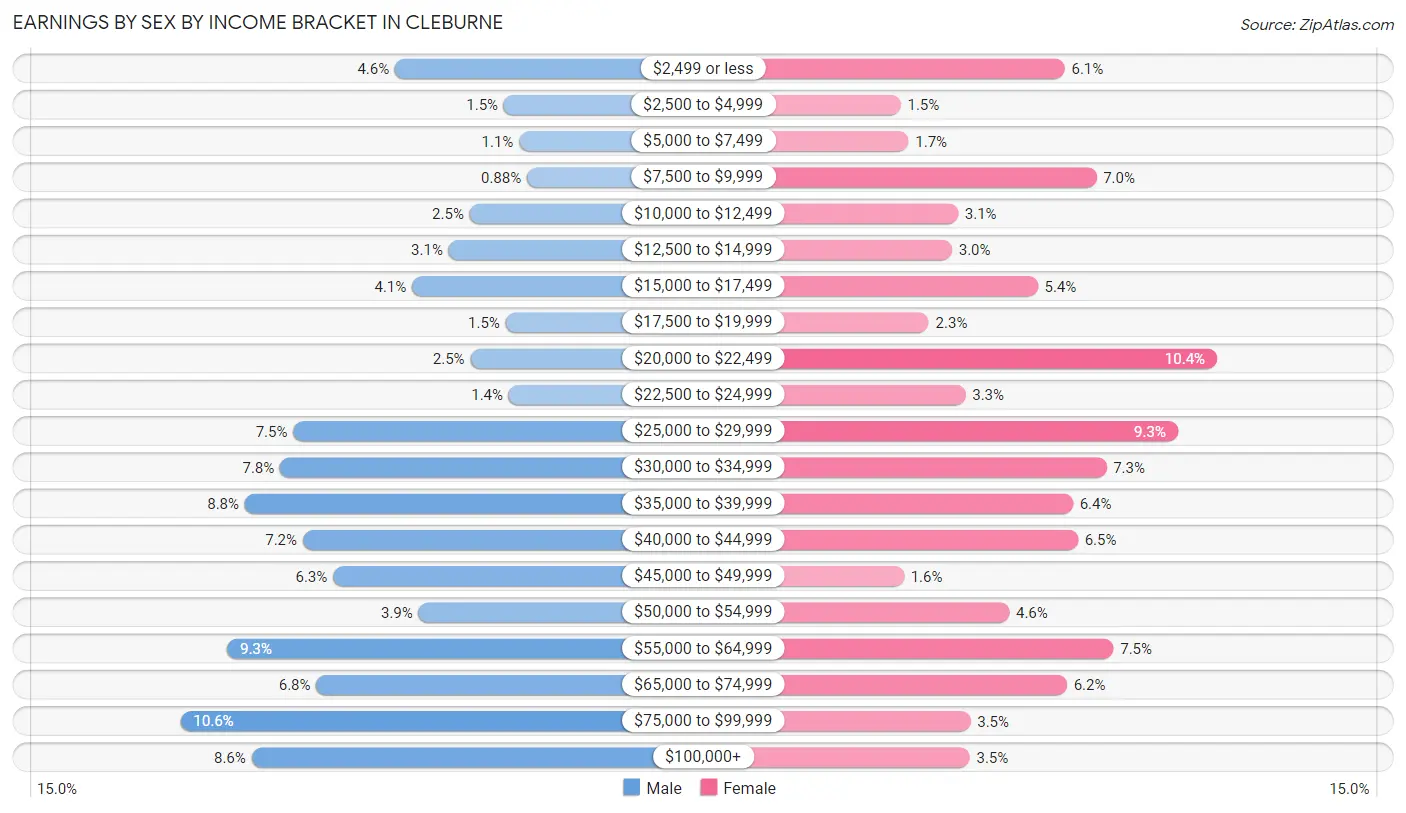
Earnings by Sex by Income Bracket in Cleburne
The most common earnings brackets in Cleburne are $75,000 to $99,999 for men (930 | 10.6%) and $20,000 to $22,499 for women (702 | 10.4%).
| Income | Male | Female |
| $2,499 or less | 402 (4.6%) | 413 (6.1%) |
| $2,500 to $4,999 | 134 (1.5%) | 102 (1.5%) |
| $5,000 to $7,499 | 96 (1.1%) | 117 (1.7%) |
| $7,500 to $9,999 | 77 (0.9%) | 473 (7.0%) |
| $10,000 to $12,499 | 218 (2.5%) | 211 (3.1%) |
| $12,500 to $14,999 | 270 (3.1%) | 199 (2.9%) |
| $15,000 to $17,499 | 360 (4.1%) | 362 (5.4%) |
| $17,500 to $19,999 | 130 (1.5%) | 155 (2.3%) |
| $20,000 to $22,499 | 216 (2.5%) | 702 (10.4%) |
| $22,500 to $24,999 | 122 (1.4%) | 225 (3.3%) |
| $25,000 to $29,999 | 652 (7.4%) | 628 (9.3%) |
| $30,000 to $34,999 | 685 (7.8%) | 492 (7.3%) |
| $35,000 to $39,999 | 771 (8.8%) | 429 (6.4%) |
| $40,000 to $44,999 | 629 (7.2%) | 438 (6.5%) |
| $45,000 to $49,999 | 554 (6.3%) | 108 (1.6%) |
| $50,000 to $54,999 | 344 (3.9%) | 308 (4.6%) |
| $55,000 to $64,999 | 815 (9.3%) | 506 (7.5%) |
| $65,000 to $74,999 | 595 (6.8%) | 417 (6.2%) |
| $75,000 to $99,999 | 930 (10.6%) | 234 (3.5%) |
| $100,000+ | 755 (8.6%) | 233 (3.5%) |
| Total | 8,755 (100.0%) | 6,752 (100.0%) |
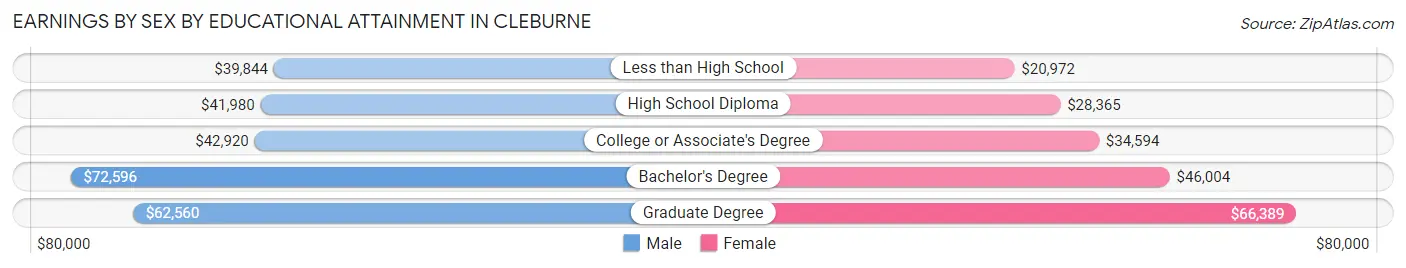
Earnings by Sex by Educational Attainment in Cleburne
Average earnings in Cleburne are $44,968 for men and $32,802 for women, a difference of 27.1%. Men with an educational attainment of bachelor's degree enjoy the highest average annual earnings of $72,596, while those with less than high school education earn the least with $39,844. Women with an educational attainment of graduate degree earn the most with the average annual earnings of $66,389, while those with less than high school education have the smallest earnings of $20,972.
| Educational Attainment | Male Income | Female Income |
| Less than High School | $39,844 | $20,972 |
| High School Diploma | $41,980 | $28,365 |
| College or Associate's Degree | $42,920 | $34,594 |
| Bachelor's Degree | $72,596 | $46,004 |
| Graduate Degree | $62,560 | $66,389 |
| Total | $44,968 | $32,802 |
Family Income in Cleburne
Family Income Brackets in Cleburne
According to the Cleburne family income data, there are 1,794 families falling into the $50,000 to $74,999 income range, which is the most common income bracket and makes up 22.6% of all families. Conversely, the less than $10,000 income bracket is the least frequent group with only 127 families (1.6%) belonging to this category.
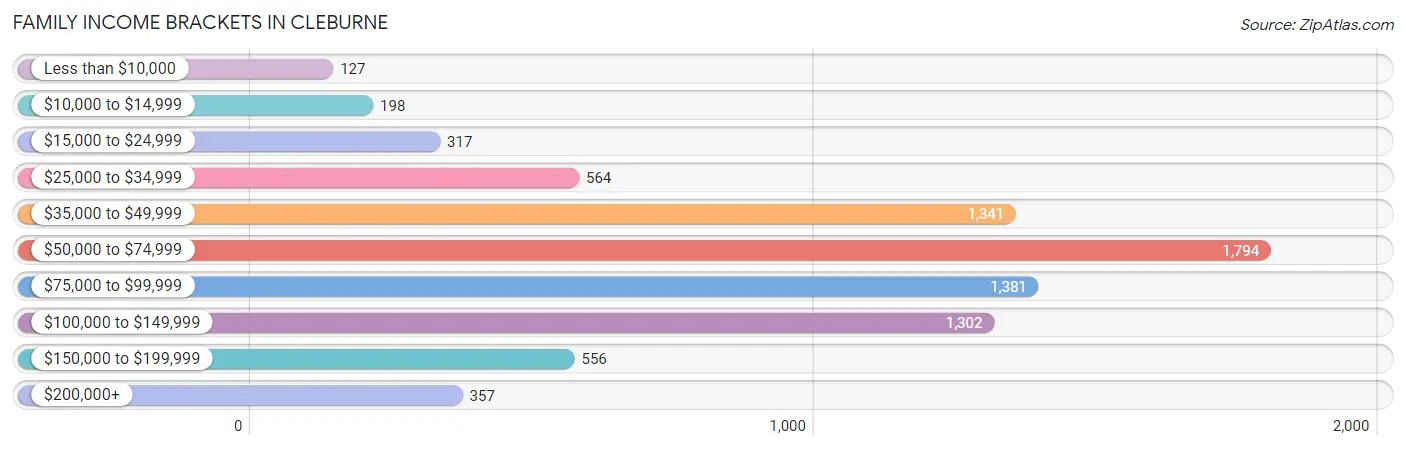
| Income Bracket | # Families | % Families |
| Less than $10,000 | 127 | 1.6% |
| $10,000 to $14,999 | 198 | 2.5% |
| $15,000 to $24,999 | 317 | 4.0% |
| $25,000 to $34,999 | 564 | 7.1% |
| $35,000 to $49,999 | 1,341 | 16.9% |
| $50,000 to $74,999 | 1,794 | 22.6% |
| $75,000 to $99,999 | 1,381 | 17.4% |
| $100,000 to $149,999 | 1,302 | 16.4% |
| $150,000 to $199,999 | 556 | 7.0% |
| $200,000+ | 357 | 4.5% |
Family Income by Famaliy Size in Cleburne
3-person families (1,792 | 22.6%) account for the highest median family income in Cleburne with $79,363 per family, while 2-person families (3,311 | 41.7%) have the highest median income of $32,988 per family member.
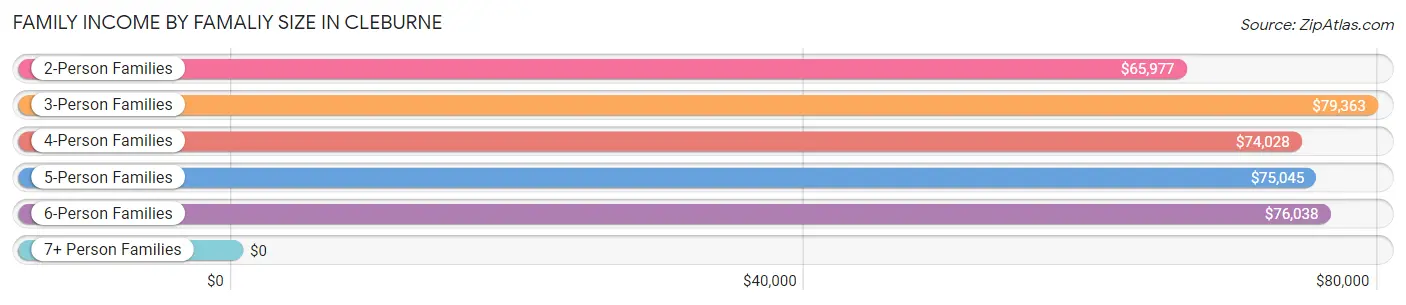
| Income Bracket | # Families | Median Income |
| 2-Person Families | 3,311 (41.7%) | $65,977 |
| 3-Person Families | 1,792 (22.6%) | $79,363 |
| 4-Person Families | 1,430 (18.0%) | $74,028 |
| 5-Person Families | 751 (9.5%) | $75,045 |
| 6-Person Families | 411 (5.2%) | $76,038 |
| 7+ Person Families | 242 (3.0%) | $0 |
| Total | 7,937 (100.0%) | $70,199 |
Family Income by Number of Earners in Cleburne
The median family income in Cleburne is $70,199, with families comprising 3+ earners (833) having the highest median family income of $100,150, while families with no earners (1,119) have the lowest median family income of $32,422, accounting for 10.5% and 14.1% of families, respectively.
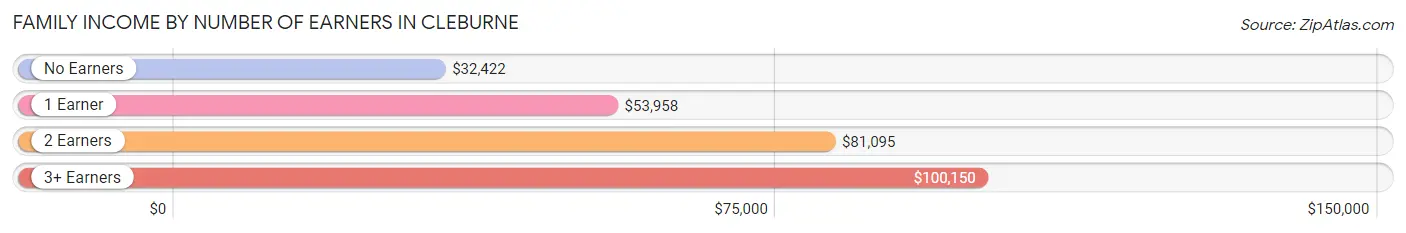
| Number of Earners | # Families | Median Income |
| No Earners | 1,119 (14.1%) | $32,422 |
| 1 Earner | 2,268 (28.6%) | $53,958 |
| 2 Earners | 3,717 (46.8%) | $81,095 |
| 3+ Earners | 833 (10.5%) | $100,150 |
| Total | 7,937 (100.0%) | $70,199 |
Household Income in Cleburne
Household Income Brackets in Cleburne
With 2,162 households falling in the category, the $50,000 to $74,999 income range is the most frequent in Cleburne, accounting for 19.2% of all households. In contrast, only 450 households (4.0%) fall into the less than $10,000 income bracket, making it the least populous group.
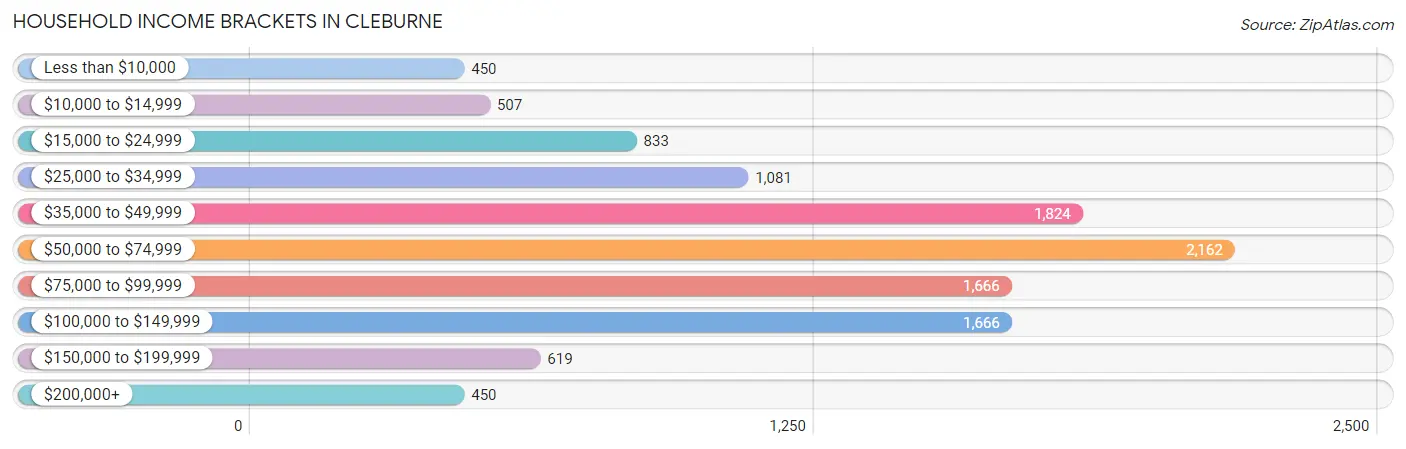
| Income Bracket | # Households | % Households |
| Less than $10,000 | 450 | 4.0% |
| $10,000 to $14,999 | 507 | 4.5% |
| $15,000 to $24,999 | 833 | 7.4% |
| $25,000 to $34,999 | 1,081 | 9.6% |
| $35,000 to $49,999 | 1,824 | 16.2% |
| $50,000 to $74,999 | 2,162 | 19.2% |
| $75,000 to $99,999 | 1,666 | 14.8% |
| $100,000 to $149,999 | 1,666 | 14.8% |
| $150,000 to $199,999 | 619 | 5.5% |
| $200,000+ | 450 | 4.0% |
Household Income by Householder Age in Cleburne
The median household income in Cleburne is $60,929, with the highest median household income of $73,212 found in the 45 to 64 years age bracket for the primary householder. A total of 3,685 households (32.7%) fall into this category. Meanwhile, the 15 to 24 years age bracket for the primary householder has the lowest median household income of $44,258, with 627 households (5.6%) in this group.
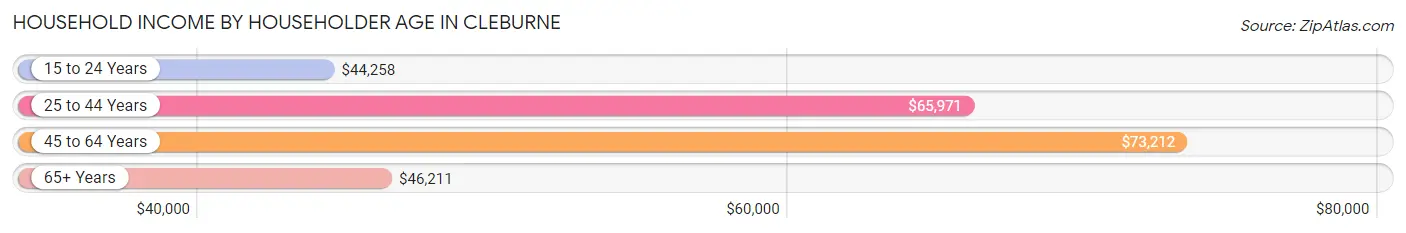
| Income Bracket | # Households | Median Income |
| 15 to 24 Years | 627 (5.6%) | $44,258 |
| 25 to 44 Years | 4,122 (36.6%) | $65,971 |
| 45 to 64 Years | 3,685 (32.7%) | $73,212 |
| 65+ Years | 2,824 (25.1%) | $46,211 |
| Total | 11,258 (100.0%) | $60,929 |
Poverty in Cleburne
Income Below Poverty by Sex and Age in Cleburne
With 13.8% poverty level for males and 13.5% for females among the residents of Cleburne, 12 to 14 year old males and 15 year old females are the most vulnerable to poverty, with 281 males (26.7%) and 72 females (39.3%) in their respective age groups living below the poverty level.
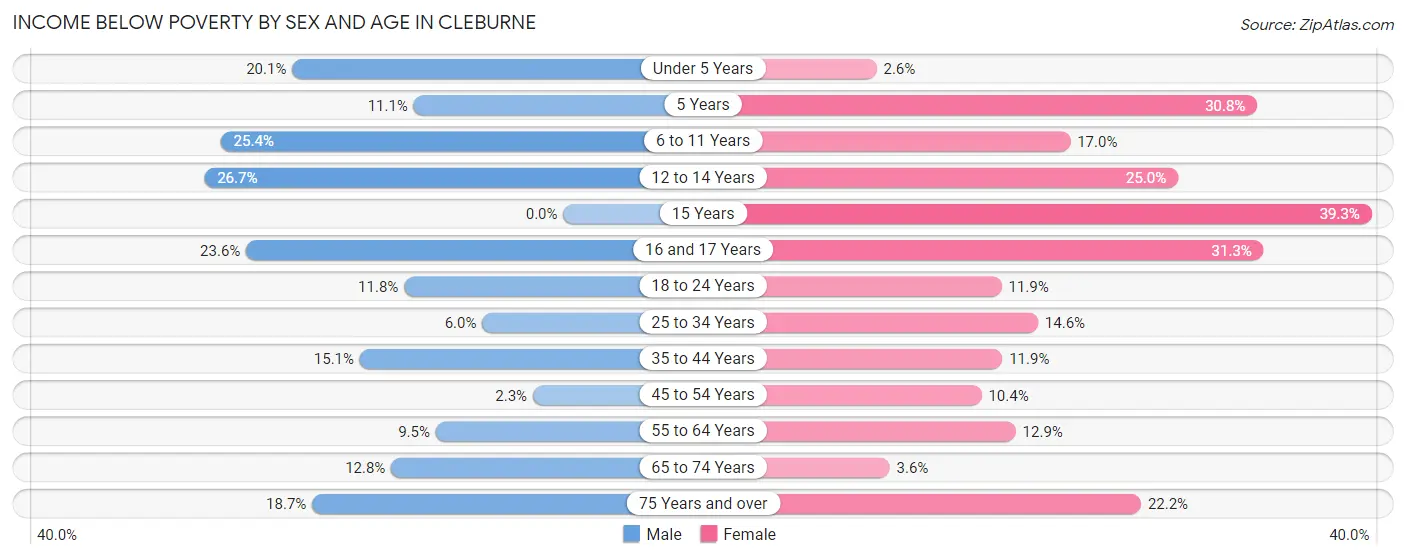
| Age Bracket | Male | Female |
| Under 5 Years | 282 (20.1%) | 34 (2.6%) |
| 5 Years | 12 (11.1%) | 70 (30.8%) |
| 6 to 11 Years | 333 (25.4%) | 181 (17.0%) |
| 12 to 14 Years | 281 (26.7%) | 149 (25.0%) |
| 15 Years | 0 (0.0%) | 72 (39.3%) |
| 16 and 17 Years | 130 (23.5%) | 119 (31.3%) |
| 18 to 24 Years | 205 (11.8%) | 137 (11.9%) |
| 25 to 34 Years | 132 (6.0%) | 297 (14.6%) |
| 35 to 44 Years | 320 (15.1%) | 234 (11.9%) |
| 45 to 54 Years | 35 (2.3%) | 170 (10.4%) |
| 55 to 64 Years | 170 (9.5%) | 234 (12.9%) |
| 65 to 74 Years | 131 (12.8%) | 49 (3.5%) |
| 75 Years and over | 160 (18.6%) | 277 (22.2%) |
| Total | 2,191 (13.8%) | 2,023 (13.5%) |
Income Above Poverty by Sex and Age in Cleburne
According to the poverty statistics in Cleburne, males aged 15 years and females aged under 5 years are the age groups that are most secure financially, with 100.0% of males and 97.4% of females in these age groups living above the poverty line.
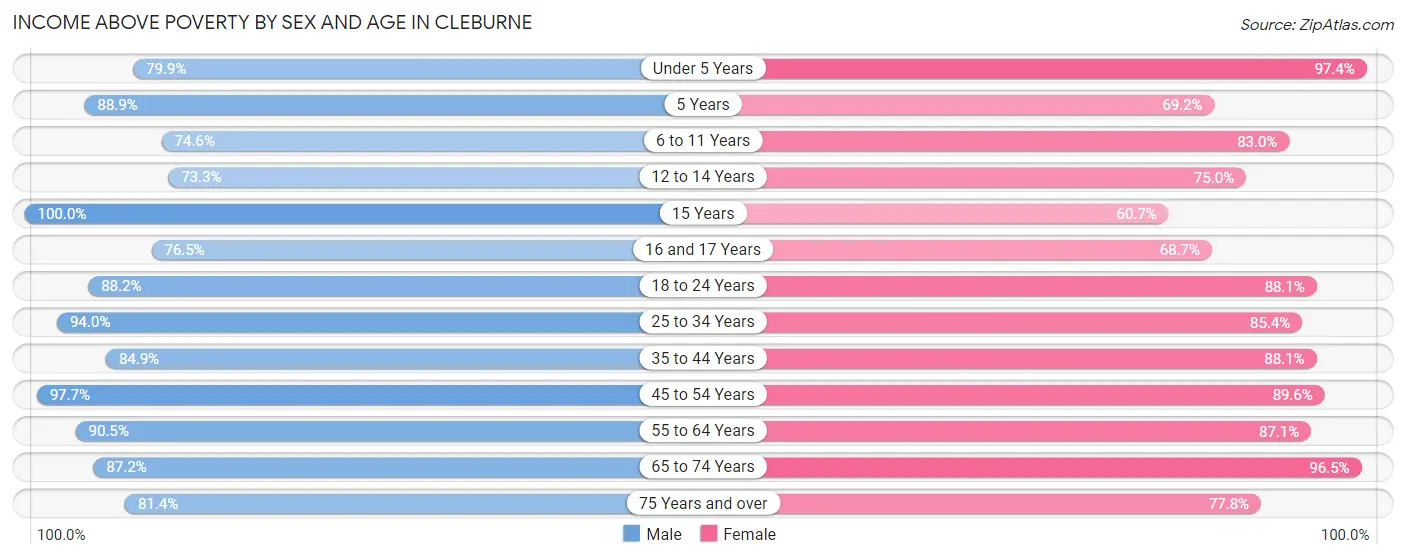
| Age Bracket | Male | Female |
| Under 5 Years | 1,119 (79.9%) | 1,286 (97.4%) |
| 5 Years | 96 (88.9%) | 157 (69.2%) |
| 6 to 11 Years | 976 (74.6%) | 886 (83.0%) |
| 12 to 14 Years | 773 (73.3%) | 448 (75.0%) |
| 15 Years | 209 (100.0%) | 111 (60.7%) |
| 16 and 17 Years | 422 (76.4%) | 261 (68.7%) |
| 18 to 24 Years | 1,529 (88.2%) | 1,018 (88.1%) |
| 25 to 34 Years | 2,059 (94.0%) | 1,743 (85.4%) |
| 35 to 44 Years | 1,798 (84.9%) | 1,731 (88.1%) |
| 45 to 54 Years | 1,517 (97.7%) | 1,470 (89.6%) |
| 55 to 64 Years | 1,626 (90.5%) | 1,578 (87.1%) |
| 65 to 74 Years | 894 (87.2%) | 1,330 (96.5%) |
| 75 Years and over | 698 (81.4%) | 970 (77.8%) |
| Total | 13,716 (86.2%) | 12,989 (86.5%) |
Income Below Poverty Among Married-Couple Families in Cleburne
The poverty statistics for married-couple families in Cleburne show that 6.1% or 355 of the total 5,775 families live below the poverty line. Families with 5 or more children have the highest poverty rate of 77.8%, comprising of 49 families. On the other hand, families with 1 or 2 children have the lowest poverty rate of 2.8%, which includes 53 families.
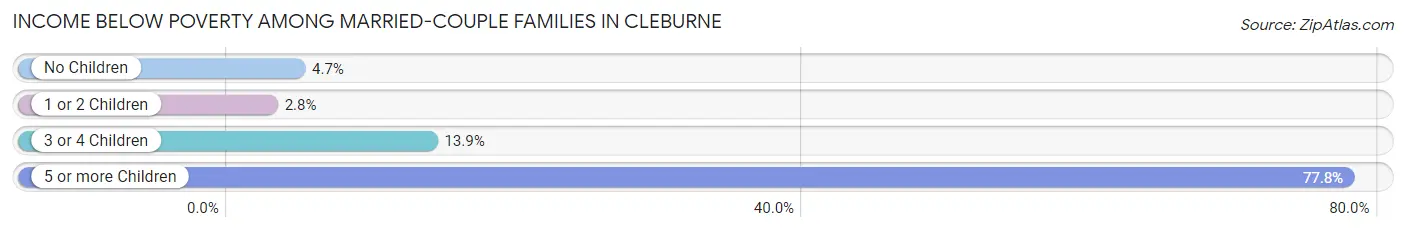
| Children | Above Poverty | Below Poverty |
| No Children | 2,835 (95.3%) | 139 (4.7%) |
| 1 or 2 Children | 1,864 (97.2%) | 53 (2.8%) |
| 3 or 4 Children | 707 (86.1%) | 114 (13.9%) |
| 5 or more Children | 14 (22.2%) | 49 (77.8%) |
| Total | 5,420 (93.9%) | 355 (6.1%) |
Income Below Poverty Among Single-Parent Households in Cleburne
According to the poverty data in Cleburne, 14.2% or 118 single-father households and 20.9% or 278 single-mother households are living below the poverty line. Among single-father households, those with 3 or 4 children have the highest poverty rate, with 32 households (100.0%) experiencing poverty. Likewise, among single-mother households, those with 5 or more children have the highest poverty rate, with 34 households (100.0%) falling below the poverty line.
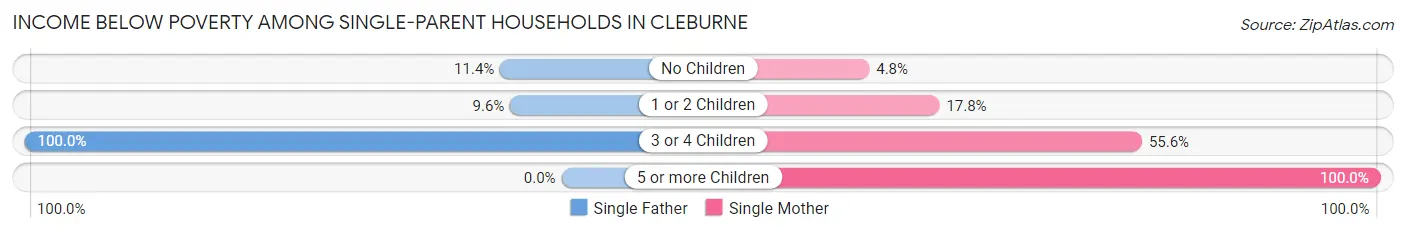
| Children | Single Father | Single Mother |
| No Children | 58 (11.4%) | 25 (4.8%) |
| 1 or 2 Children | 28 (9.6%) | 99 (17.8%) |
| 3 or 4 Children | 32 (100.0%) | 120 (55.6%) |
| 5 or more Children | 0 (0.0%) | 34 (100.0%) |
| Total | 118 (14.2%) | 278 (20.9%) |
Income Below Poverty Among Married-Couple vs Single-Parent Households in Cleburne
The poverty data for Cleburne shows that 355 of the married-couple family households (6.1%) and 396 of the single-parent households (18.3%) are living below the poverty level. Within the married-couple family households, those with 5 or more children have the highest poverty rate, with 49 households (77.8%) falling below the poverty line. Among the single-parent households, those with 5 or more children have the highest poverty rate, with 34 household (100.0%) living below poverty.
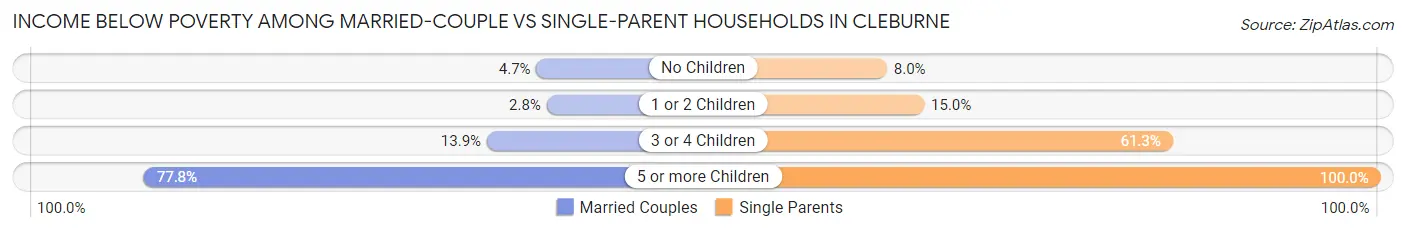
| Children | Married-Couple Families | Single-Parent Households |
| No Children | 139 (4.7%) | 83 (8.0%) |
| 1 or 2 Children | 53 (2.8%) | 127 (15.0%) |
| 3 or 4 Children | 114 (13.9%) | 152 (61.3%) |
| 5 or more Children | 49 (77.8%) | 34 (100.0%) |
| Total | 355 (6.1%) | 396 (18.3%) |
Race in Cleburne
The most populous races in Cleburne are White / Caucasian (24,232 | 76.1%), Hispanic or Latino (9,696 | 30.4%), and Two or more Races (3,657 | 11.5%).
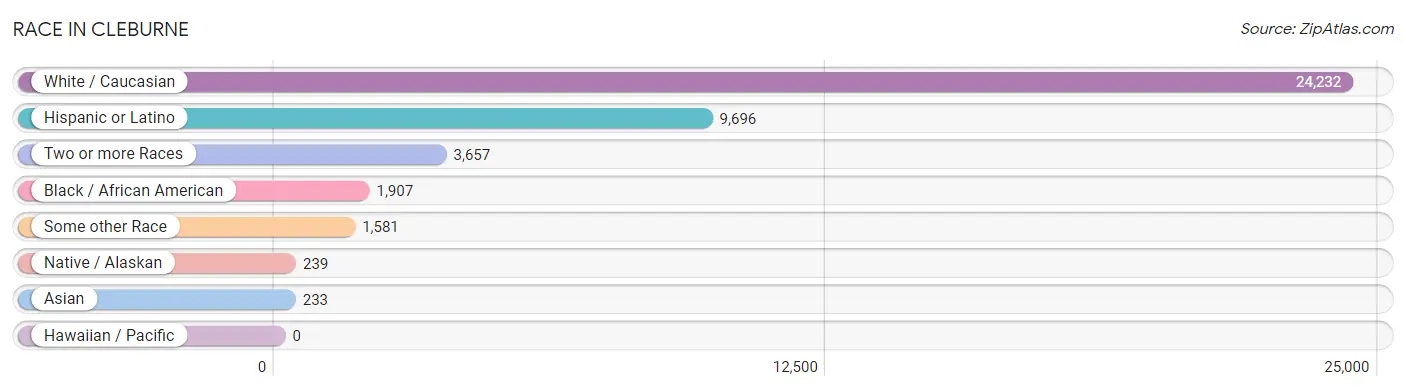
| Race | # Population | % Population |
| Asian | 233 | 0.7% |
| Black / African American | 1,907 | 6.0% |
| Hawaiian / Pacific | 0 | 0.0% |
| Hispanic or Latino | 9,696 | 30.4% |
| Native / Alaskan | 239 | 0.7% |
| White / Caucasian | 24,232 | 76.1% |
| Two or more Races | 3,657 | 11.5% |
| Some other Race | 1,581 | 5.0% |
| Total | 31,849 | 100.0% |
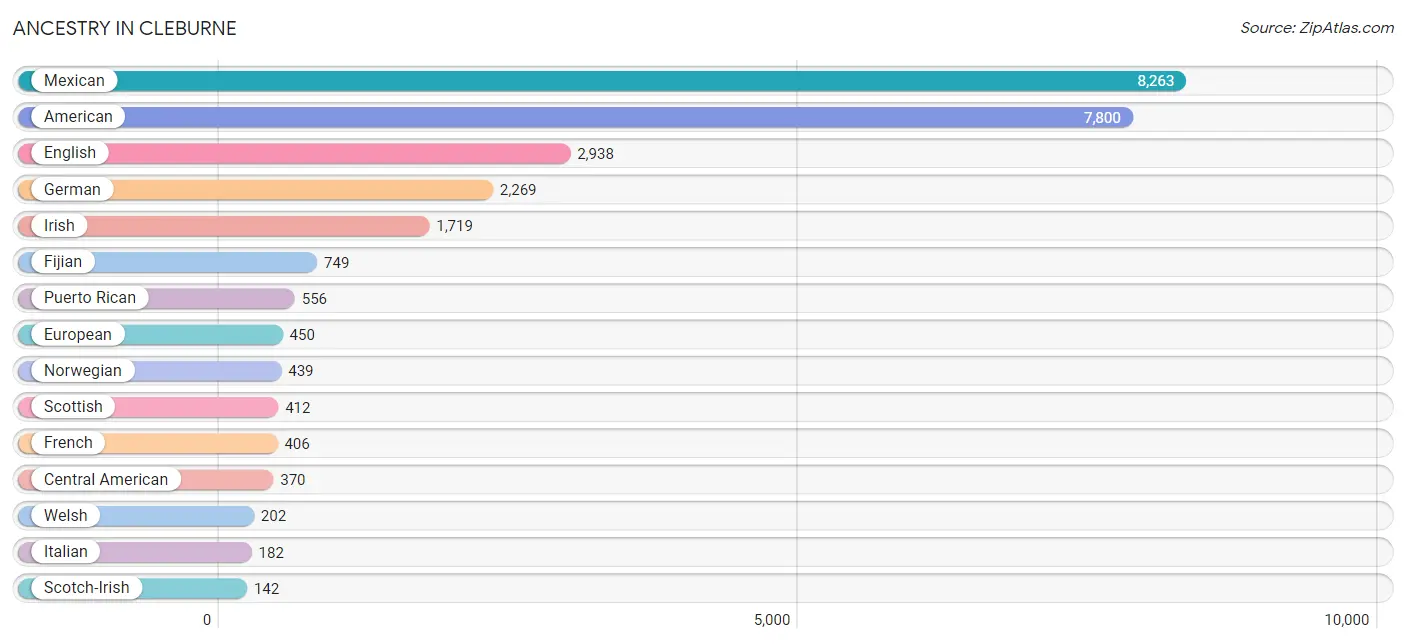
Ancestry in Cleburne
The most populous ancestries reported in Cleburne are Mexican (8,263 | 25.9%), American (7,800 | 24.5%), English (2,938 | 9.2%), German (2,269 | 7.1%), and Irish (1,719 | 5.4%), together accounting for 72.2% of all Cleburne residents.
| Ancestry | # Population | % Population |
| African | 83 | 0.3% |
| Alaskan Athabascan | 23 | 0.1% |
| American | 7,800 | 24.5% |
| Apache | 29 | 0.1% |
| Arab | 2 | 0.0% |
| Austrian | 15 | 0.1% |
| Belgian | 19 | 0.1% |
| Belizean | 32 | 0.1% |
| Bhutanese | 39 | 0.1% |
| Blackfeet | 6 | 0.0% |
| British | 33 | 0.1% |
| Burmese | 62 | 0.2% |
| Central American | 370 | 1.2% |
| Central American Indian | 25 | 0.1% |
| Cherokee | 80 | 0.3% |
| Chilean | 11 | 0.0% |
| Choctaw | 51 | 0.2% |
| Colombian | 51 | 0.2% |
| Comanche | 36 | 0.1% |
| Costa Rican | 101 | 0.3% |
| Creek | 3 | 0.0% |
| Czech | 23 | 0.1% |
| Dominican | 12 | 0.0% |
| Dutch | 38 | 0.1% |
| Dutch West Indian | 31 | 0.1% |
| Eastern European | 10 | 0.0% |
| English | 2,938 | 9.2% |
| European | 450 | 1.4% |
| Fijian | 749 | 2.4% |
| French | 406 | 1.3% |
| French Canadian | 74 | 0.2% |
| German | 2,269 | 7.1% |
| Greek | 21 | 0.1% |
| Guatemalan | 81 | 0.3% |
| Honduran | 133 | 0.4% |
| Hungarian | 6 | 0.0% |
| Indian (Asian) | 34 | 0.1% |
| Iranian | 9 | 0.0% |
| Irish | 1,719 | 5.4% |
| Italian | 182 | 0.6% |
| Japanese | 46 | 0.1% |
| Korean | 132 | 0.4% |
| Latvian | 7 | 0.0% |
| Lithuanian | 11 | 0.0% |
| Menominee | 10 | 0.0% |
| Mexican | 8,263 | 25.9% |
| Mexican American Indian | 73 | 0.2% |
| Mongolian | 7 | 0.0% |
| Native Hawaiian | 124 | 0.4% |
| Navajo | 45 | 0.1% |
| Northern European | 23 | 0.1% |
| Norwegian | 439 | 1.4% |
| Pakistani | 7 | 0.0% |
| Panamanian | 31 | 0.1% |
| Polish | 43 | 0.1% |
| Puerto Rican | 556 | 1.8% |
| Russian | 93 | 0.3% |
| Salvadoran | 24 | 0.1% |
| Scotch-Irish | 142 | 0.4% |
| Scottish | 412 | 1.3% |
| Sioux | 36 | 0.1% |
| Slavic | 10 | 0.0% |
| South American | 80 | 0.3% |
| Spaniard | 95 | 0.3% |
| Spanish | 11 | 0.0% |
| Sri Lankan | 122 | 0.4% |
| Subsaharan African | 83 | 0.3% |
| Swedish | 28 | 0.1% |
| Thai | 18 | 0.1% |
| U.S. Virgin Islander | 8 | 0.0% |
| Ukrainian | 7 | 0.0% |
| Venezuelan | 18 | 0.1% |
| Welsh | 202 | 0.6% |
| West Indian | 21 | 0.1% | View All 74 Rows |
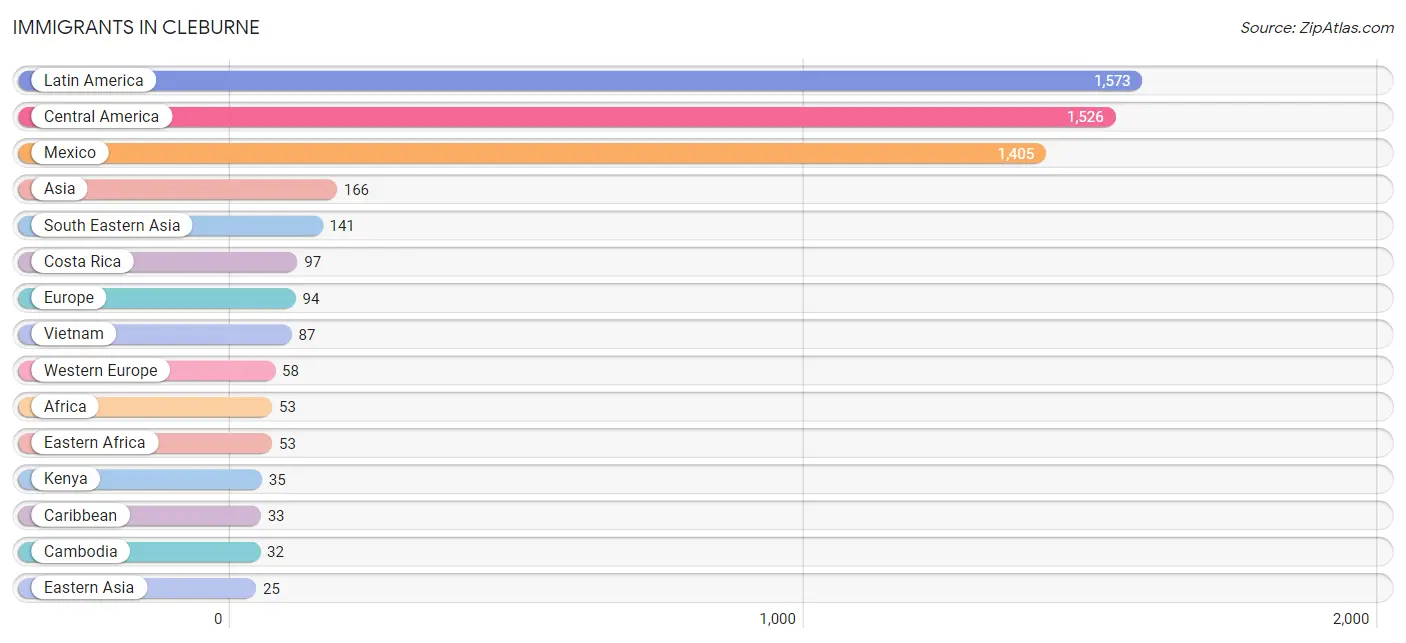
Immigrants in Cleburne
The most numerous immigrant groups reported in Cleburne came from Latin America (1,573 | 4.9%), Central America (1,526 | 4.8%), Mexico (1,405 | 4.4%), Asia (166 | 0.5%), and South Eastern Asia (141 | 0.4%), together accounting for 15.1% of all Cleburne residents.
| Immigration Origin | # Population | % Population |
| Africa | 53 | 0.2% |
| Asia | 166 | 0.5% |
| Cambodia | 32 | 0.1% |
| Caribbean | 33 | 0.1% |
| Central America | 1,526 | 4.8% |
| Chile | 11 | 0.0% |
| Costa Rica | 97 | 0.3% |
| Dominica | 21 | 0.1% |
| Dominican Republic | 12 | 0.0% |
| Eastern Africa | 53 | 0.2% |
| Eastern Asia | 25 | 0.1% |
| Eastern Europe | 21 | 0.1% |
| El Salvador | 24 | 0.1% |
| England | 9 | 0.0% |
| Europe | 94 | 0.3% |
| France | 12 | 0.0% |
| Germany | 23 | 0.1% |
| Ireland | 6 | 0.0% |
| Kenya | 35 | 0.1% |
| Korea | 25 | 0.1% |
| Latin America | 1,573 | 4.9% |
| Malaysia | 7 | 0.0% |
| Mexico | 1,405 | 4.4% |
| Netherlands | 23 | 0.1% |
| Northern Europe | 15 | 0.1% |
| Philippines | 8 | 0.0% |
| Russia | 14 | 0.0% |
| South America | 14 | 0.0% |
| South Eastern Asia | 141 | 0.4% |
| Thailand | 7 | 0.0% |
| Ukraine | 7 | 0.0% |
| Venezuela | 3 | 0.0% |
| Vietnam | 87 | 0.3% |
| Western Europe | 58 | 0.2% | View All 34 Rows |
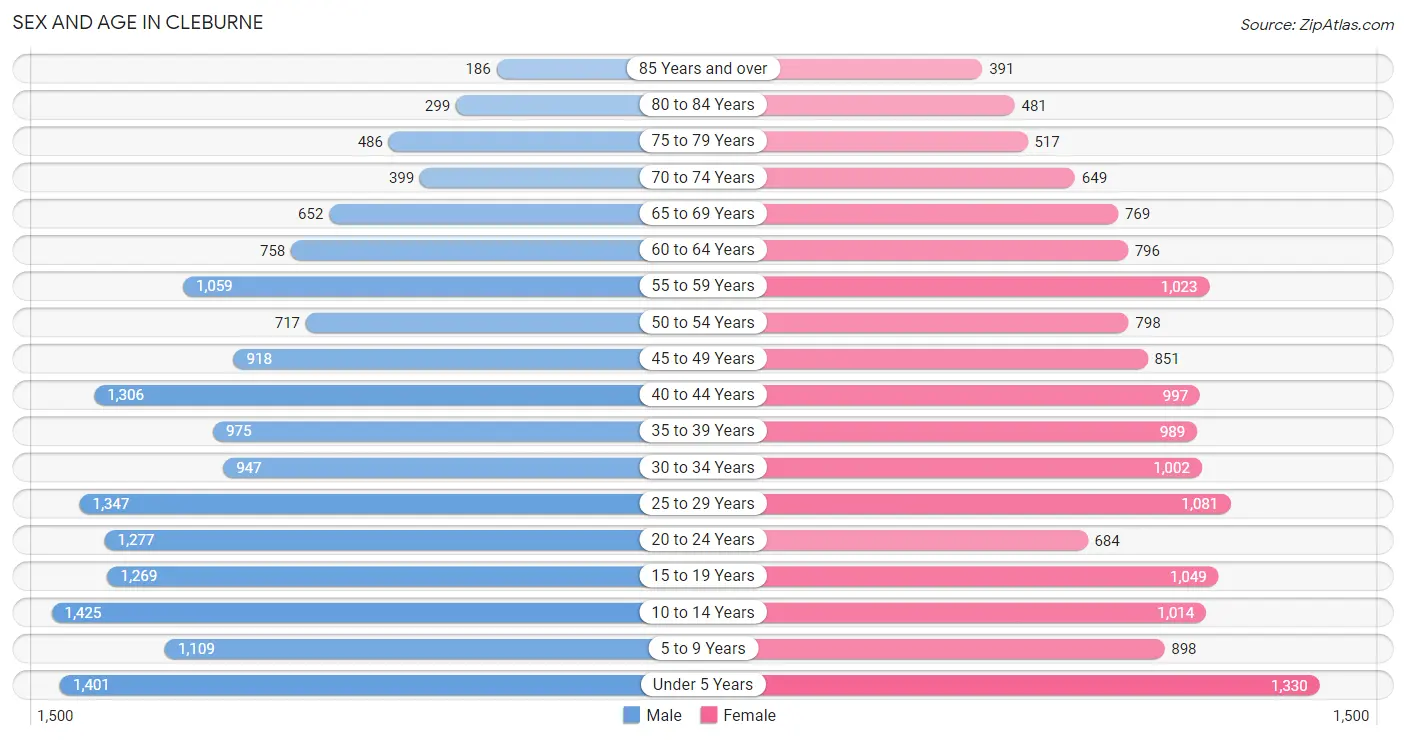
Sex and Age in Cleburne
Sex and Age in Cleburne
The most populous age groups in Cleburne are 10 to 14 Years (1,425 | 8.6%) for men and Under 5 Years (1,330 | 8.7%) for women.
| Age Bracket | Male | Female |
| Under 5 Years | 1,401 (8.5%) | 1,330 (8.7%) |
| 5 to 9 Years | 1,109 (6.7%) | 898 (5.9%) |
| 10 to 14 Years | 1,425 (8.6%) | 1,014 (6.6%) |
| 15 to 19 Years | 1,269 (7.7%) | 1,049 (6.9%) |
| 20 to 24 Years | 1,277 (7.7%) | 684 (4.5%) |
| 25 to 29 Years | 1,347 (8.2%) | 1,081 (7.1%) |
| 30 to 34 Years | 947 (5.7%) | 1,002 (6.5%) |
| 35 to 39 Years | 975 (5.9%) | 989 (6.5%) |
| 40 to 44 Years | 1,306 (7.9%) | 997 (6.5%) |
| 45 to 49 Years | 918 (5.6%) | 851 (5.6%) |
| 50 to 54 Years | 717 (4.3%) | 798 (5.2%) |
| 55 to 59 Years | 1,059 (6.4%) | 1,023 (6.7%) |
| 60 to 64 Years | 758 (4.6%) | 796 (5.2%) |
| 65 to 69 Years | 652 (3.9%) | 769 (5.0%) |
| 70 to 74 Years | 399 (2.4%) | 649 (4.2%) |
| 75 to 79 Years | 486 (2.9%) | 517 (3.4%) |
| 80 to 84 Years | 299 (1.8%) | 481 (3.1%) |
| 85 Years and over | 186 (1.1%) | 391 (2.5%) |
| Total | 16,530 (100.0%) | 15,319 (100.0%) |
Families and Households in Cleburne
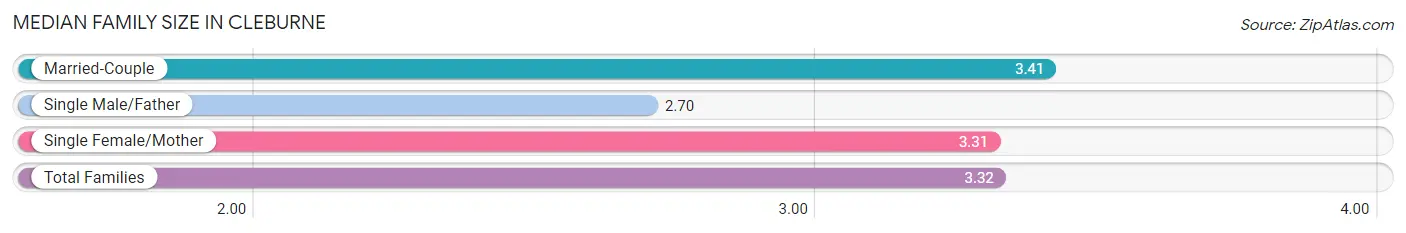
Median Family Size in Cleburne
The median family size in Cleburne is 3.32 persons per family, with married-couple families (5,775 | 72.8%) accounting for the largest median family size of 3.41 persons per family. On the other hand, single male/father families (833 | 10.5%) represent the smallest median family size with 2.70 persons per family.
| Family Type | # Families | Family Size |
| Married-Couple | 5,775 (72.8%) | 3.41 |
| Single Male/Father | 833 (10.5%) | 2.70 |
| Single Female/Mother | 1,329 (16.7%) | 3.31 |
| Total Families | 7,937 (100.0%) | 3.32 |
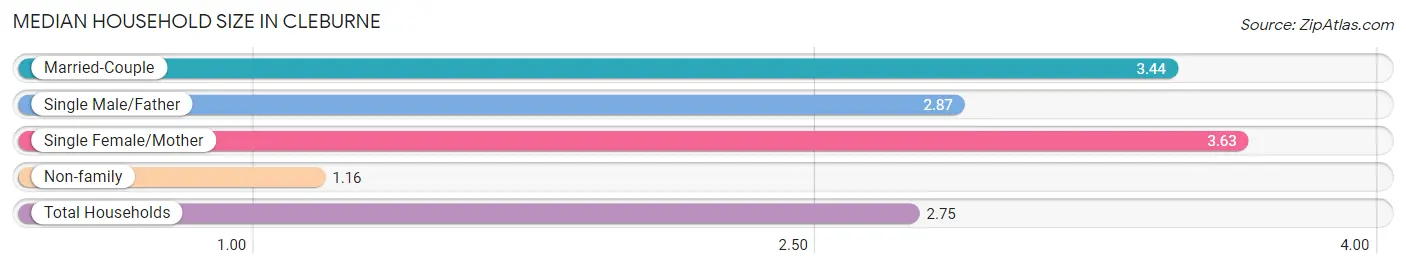
Median Household Size in Cleburne
The median household size in Cleburne is 2.75 persons per household, with single female/mother households (1,329 | 11.8%) accounting for the largest median household size of 3.63 persons per household. non-family households (3,321 | 29.5%) represent the smallest median household size with 1.16 persons per household.
| Household Type | # Households | Household Size |
| Married-Couple | 5,775 (51.3%) | 3.44 |
| Single Male/Father | 833 (7.4%) | 2.87 |
| Single Female/Mother | 1,329 (11.8%) | 3.63 |
| Non-family | 3,321 (29.5%) | 1.16 |
| Total Households | 11,258 (100.0%) | 2.75 |
Household Size by Marriage Status in Cleburne
Out of a total of 11,258 households in Cleburne, 7,937 (70.5%) are family households, while 3,321 (29.5%) are nonfamily households. The most numerous type of family households are 2-person households, comprising 3,000, and the most common type of nonfamily households are 1-person households, comprising 2,874.
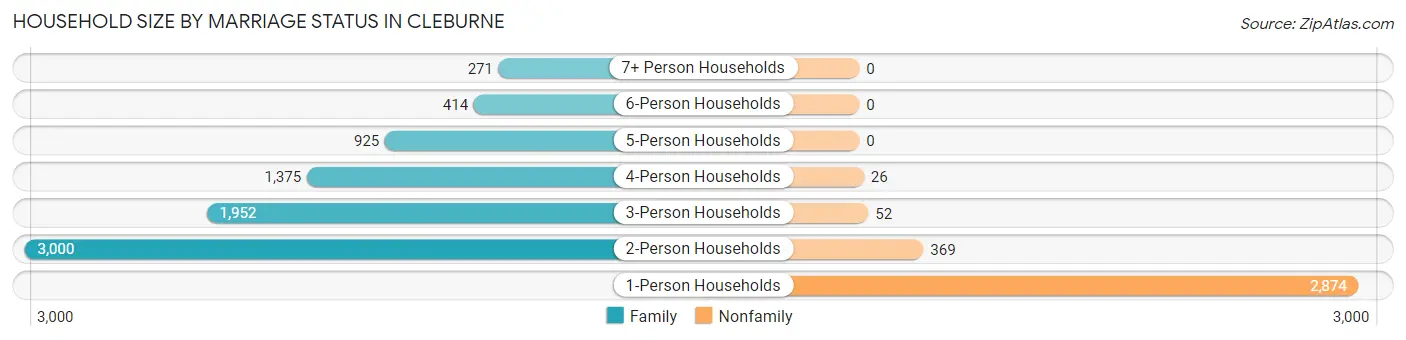
| Household Size | Family Households | Nonfamily Households |
| 1-Person Households | - | 2,874 (25.5%) |
| 2-Person Households | 3,000 (26.7%) | 369 (3.3%) |
| 3-Person Households | 1,952 (17.3%) | 52 (0.5%) |
| 4-Person Households | 1,375 (12.2%) | 26 (0.2%) |
| 5-Person Households | 925 (8.2%) | 0 (0.0%) |
| 6-Person Households | 414 (3.7%) | 0 (0.0%) |
| 7+ Person Households | 271 (2.4%) | 0 (0.0%) |
| Total | 7,937 (70.5%) | 3,321 (29.5%) |
Female Fertility in Cleburne
Fertility by Age in Cleburne
Average fertility rate in Cleburne is 128.0 births per 1,000 women. Women in the age bracket of 15 to 19 years have the highest fertility rate with 171.0 births per 1,000 women. Women in the age bracket of 20 to 34 years acount for 45.7% of all women with births.
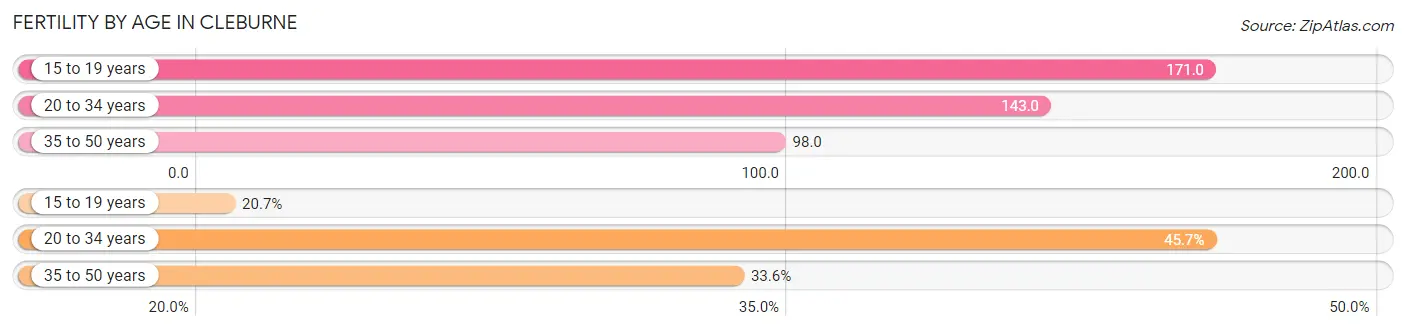
| Age Bracket | Women with Births | Births / 1,000 Women |
| 15 to 19 years | 179 (20.7%) | 171.0 |
| 20 to 34 years | 395 (45.7%) | 143.0 |
| 35 to 50 years | 291 (33.6%) | 98.0 |
| Total | 865 (100.0%) | 128.0 |
Fertility by Age by Marriage Status in Cleburne
83.4% of women with births (865) in Cleburne are married. The highest percentage of unmarried women with births falls into 15 to 19 years age bracket with 20.1% of them unmarried at the time of birth, while the lowest percentage of unmarried women with births belong to 35 to 50 years age bracket with 10.0% of them unmarried.
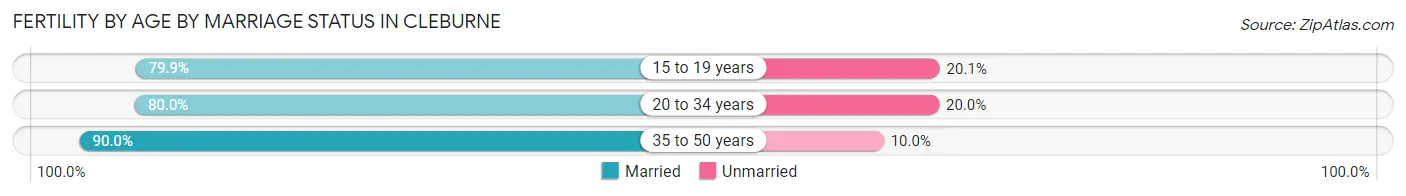
| Age Bracket | Married | Unmarried |
| 15 to 19 years | 143 (79.9%) | 36 (20.1%) |
| 20 to 34 years | 316 (80.0%) | 79 (20.0%) |
| 35 to 50 years | 262 (90.0%) | 29 (10.0%) |
| Total | 721 (83.4%) | 144 (16.7%) |
Fertility by Education in Cleburne
Average fertility rate in Cleburne is 128.0 births per 1,000 women. Women with the education attainment of graduate degree have the highest fertility rate of 232.0 births per 1,000 women, while women with the education attainment of college or associate's degree have the lowest fertility at 74.0 births per 1,000 women. Women with the education attainment of high school diploma represent 35.4% of all women with births.
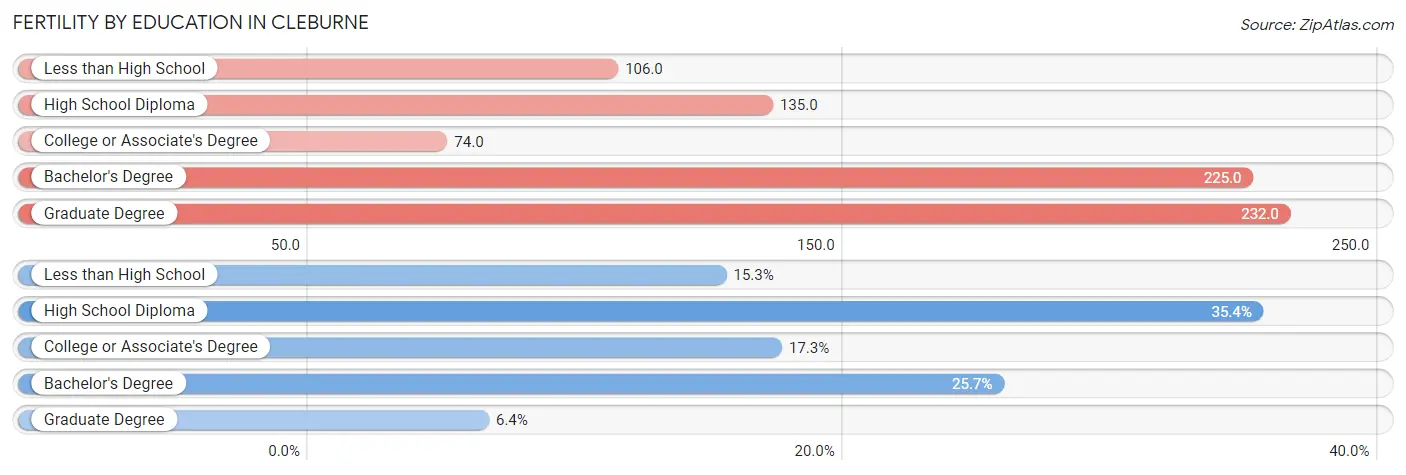
| Educational Attainment | Women with Births | Births / 1,000 Women |
| Less than High School | 132 (15.3%) | 106.0 |
| High School Diploma | 306 (35.4%) | 135.0 |
| College or Associate's Degree | 150 (17.3%) | 74.0 |
| Bachelor's Degree | 222 (25.7%) | 225.0 |
| Graduate Degree | 55 (6.4%) | 232.0 |
| Total | 865 (100.0%) | 128.0 |
Fertility by Education by Marriage Status in Cleburne
16.7% of women with births in Cleburne are unmarried. Women with the educational attainment of bachelor's degree are most likely to be married with 90.5% of them married at childbirth, while women with the educational attainment of graduate degree are least likely to be married with 52.7% of them unmarried at childbirth.
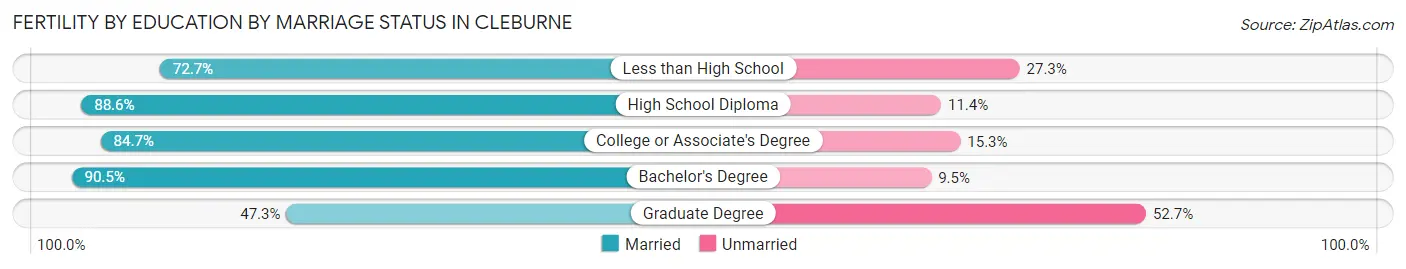
| Educational Attainment | Married | Unmarried |
| Less than High School | 96 (72.7%) | 36 (27.3%) |
| High School Diploma | 271 (88.6%) | 35 (11.4%) |
| College or Associate's Degree | 127 (84.7%) | 23 (15.3%) |
| Bachelor's Degree | 201 (90.5%) | 21 (9.5%) |
| Graduate Degree | 26 (47.3%) | 29 (52.7%) |
| Total | 721 (83.4%) | 144 (16.7%) |
Employment Characteristics in Cleburne
Employment by Class of Employer in Cleburne
Among the 14,043 employed individuals in Cleburne, private company employees (10,461 | 74.5%), not-for-profit organizations (994 | 7.1%), and self-employed (not incorporated) (979 | 7.0%) make up the most common classes of employment.
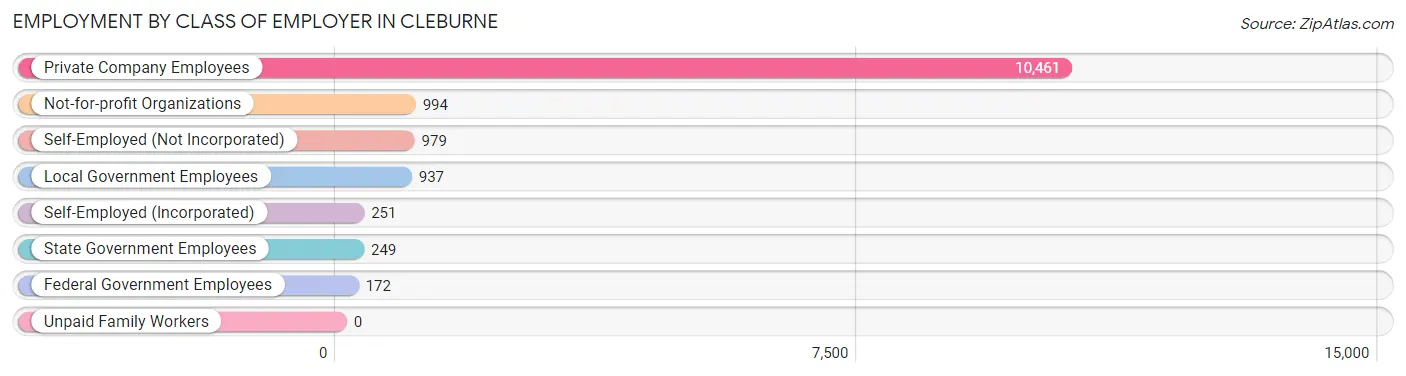
| Employer Class | # Employees | % Employees |
| Private Company Employees | 10,461 | 74.5% |
| Self-Employed (Incorporated) | 251 | 1.8% |
| Self-Employed (Not Incorporated) | 979 | 7.0% |
| Not-for-profit Organizations | 994 | 7.1% |
| Local Government Employees | 937 | 6.7% |
| State Government Employees | 249 | 1.8% |
| Federal Government Employees | 172 | 1.2% |
| Unpaid Family Workers | 0 | 0.0% |
| Total | 14,043 | 100.0% |
Employment Status by Age in Cleburne
According to the labor force statistics for Cleburne, out of the total population over 16 years of age (24,280), 60.4% or 14,665 individuals are in the labor force, with 2.7% or 396 of them unemployed. The age group with the highest labor force participation rate is 30 to 34 years, with 82.1% or 1,600 individuals in the labor force. Within the labor force, the 25 to 29 years age range has the highest percentage of unemployed individuals, with 4.8% or 90 of them being unemployed.
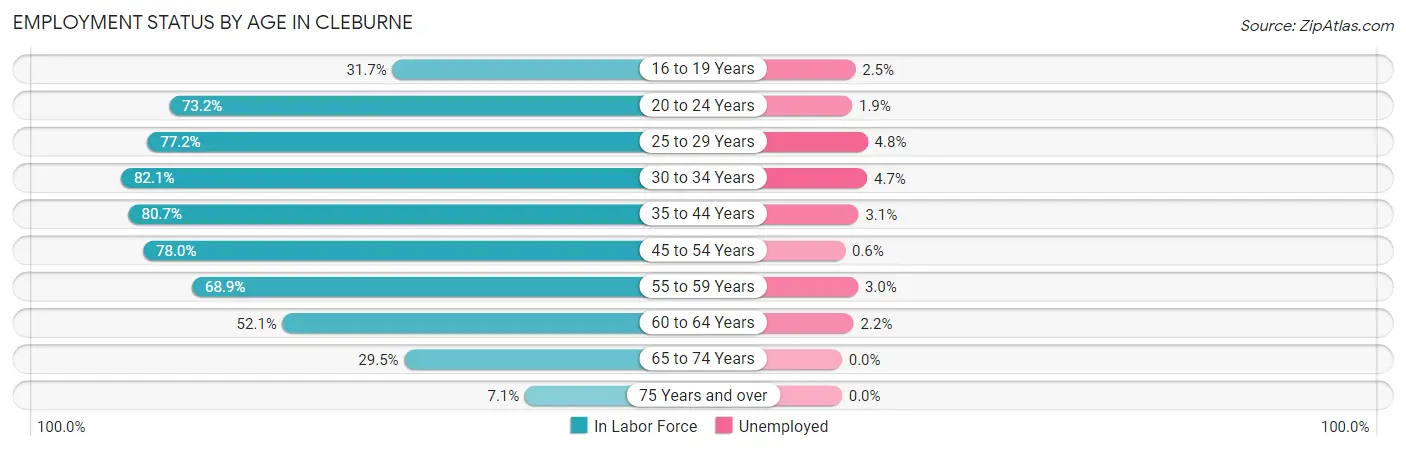
| Age Bracket | In Labor Force | Unemployed |
| 16 to 19 Years | 611 (31.7%) | 15 (2.5%) |
| 20 to 24 Years | 1,435 (73.2%) | 27 (1.9%) |
| 25 to 29 Years | 1,874 (77.2%) | 90 (4.8%) |
| 30 to 34 Years | 1,600 (82.1%) | 75 (4.7%) |
| 35 to 44 Years | 3,443 (80.7%) | 107 (3.1%) |
| 45 to 54 Years | 2,562 (78.0%) | 15 (0.6%) |
| 55 to 59 Years | 1,434 (68.9%) | 43 (3.0%) |
| 60 to 64 Years | 810 (52.1%) | 18 (2.2%) |
| 65 to 74 Years | 728 (29.5%) | 0 (0.0%) |
| 75 Years and over | 168 (7.1%) | 0 (0.0%) |
| Total | 14,665 (60.4%) | 396 (2.7%) |
Employment Status by Educational Attainment in Cleburne
According to labor force statistics for Cleburne, 75.3% of individuals (11,720) out of the total population between 25 and 64 years of age (15,564) are in the labor force, with 3.0% or 352 of them being unemployed. The group with the highest labor force participation rate are those with the educational attainment of bachelor's degree or higher, with 89.1% or 2,275 individuals in the labor force. Within the labor force, individuals with less than high school education have the highest percentage of unemployment, with 4.6% or 75 of them being unemployed.
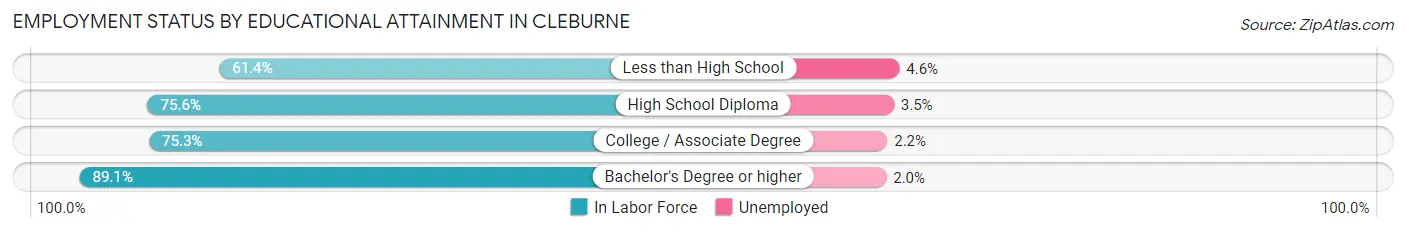
| Educational Attainment | In Labor Force | Unemployed |
| Less than High School | 1,627 (61.4%) | 122 (4.6%) |
| High School Diploma | 4,402 (75.6%) | 204 (3.5%) |
| College / Associate Degree | 3,417 (75.3%) | 100 (2.2%) |
| Bachelor's Degree or higher | 2,275 (89.1%) | 51 (2.0%) |
| Total | 11,720 (75.3%) | 467 (3.0%) |
Employment Occupations by Sex in Cleburne
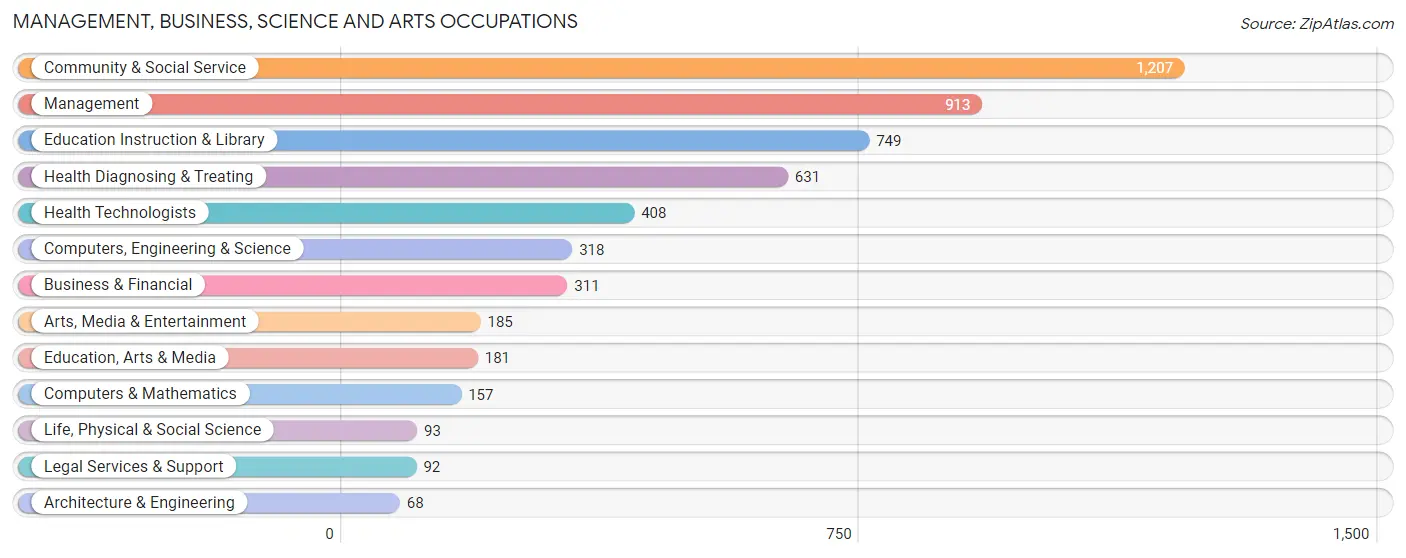
Management, Business, Science and Arts Occupations
The most common Management, Business, Science and Arts occupations in Cleburne are Community & Social Service (1,207 | 8.5%), Management (913 | 6.4%), Education Instruction & Library (749 | 5.2%), Health Diagnosing & Treating (631 | 4.4%), and Health Technologists (408 | 2.9%).
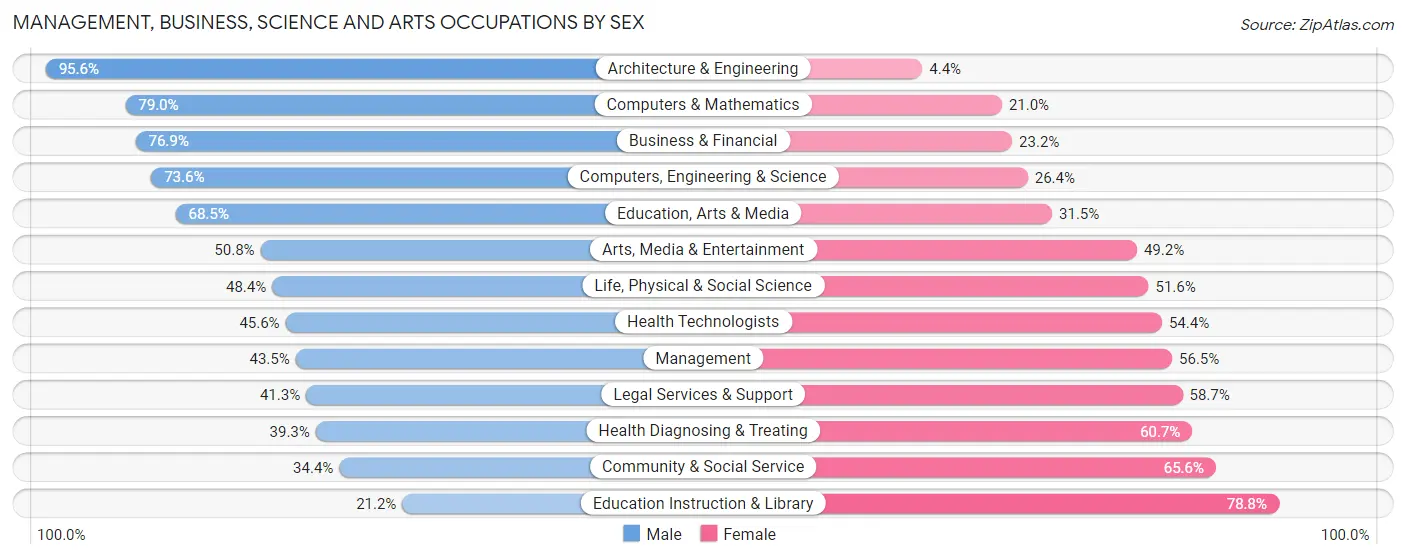
Management, Business, Science and Arts Occupations by Sex
Within the Management, Business, Science and Arts occupations in Cleburne, the most male-oriented occupations are Architecture & Engineering (95.6%), Computers & Mathematics (79.0%), and Business & Financial (76.8%), while the most female-oriented occupations are Education Instruction & Library (78.8%), Community & Social Service (65.6%), and Health Diagnosing & Treating (60.7%).
| Occupation | Male | Female |
| Management | 397 (43.5%) | 516 (56.5%) |
| Business & Financial | 239 (76.8%) | 72 (23.2%) |
| Computers, Engineering & Science | 234 (73.6%) | 84 (26.4%) |
| Computers & Mathematics | 124 (79.0%) | 33 (21.0%) |
| Architecture & Engineering | 65 (95.6%) | 3 (4.4%) |
| Life, Physical & Social Science | 45 (48.4%) | 48 (51.6%) |
| Community & Social Service | 415 (34.4%) | 792 (65.6%) |
| Education, Arts & Media | 124 (68.5%) | 57 (31.5%) |
| Legal Services & Support | 38 (41.3%) | 54 (58.7%) |
| Education Instruction & Library | 159 (21.2%) | 590 (78.8%) |
| Arts, Media & Entertainment | 94 (50.8%) | 91 (49.2%) |
| Health Diagnosing & Treating | 248 (39.3%) | 383 (60.7%) |
| Health Technologists | 186 (45.6%) | 222 (54.4%) |
| Total (Category) | 1,533 (45.4%) | 1,847 (54.6%) |
| Total (Overall) | 8,096 (56.8%) | 6,162 (43.2%) |
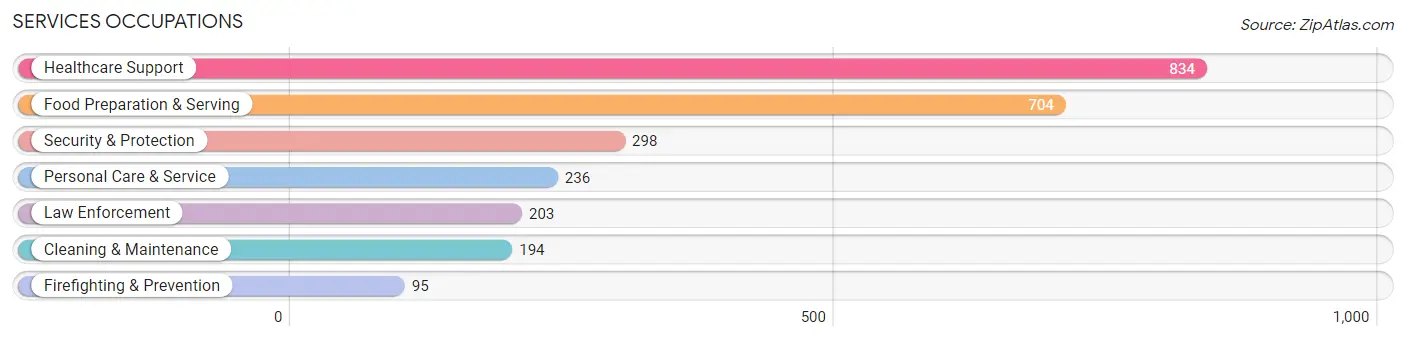
Services Occupations
The most common Services occupations in Cleburne are Healthcare Support (834 | 5.9%), Food Preparation & Serving (704 | 4.9%), Security & Protection (298 | 2.1%), Personal Care & Service (236 | 1.7%), and Law Enforcement (203 | 1.4%).
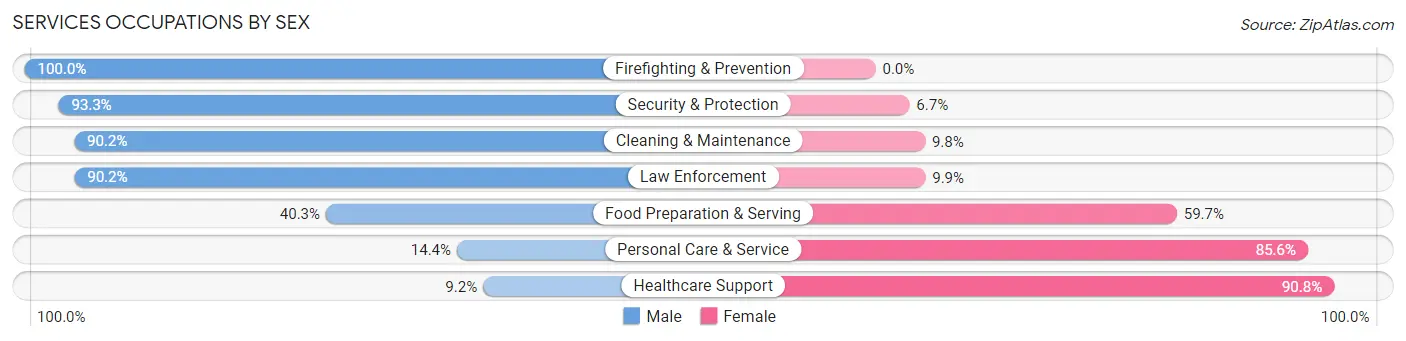
Services Occupations by Sex
Within the Services occupations in Cleburne, the most male-oriented occupations are Firefighting & Prevention (100.0%), Security & Protection (93.3%), and Cleaning & Maintenance (90.2%), while the most female-oriented occupations are Healthcare Support (90.8%), Personal Care & Service (85.6%), and Food Preparation & Serving (59.7%).
| Occupation | Male | Female |
| Healthcare Support | 77 (9.2%) | 757 (90.8%) |
| Security & Protection | 278 (93.3%) | 20 (6.7%) |
| Firefighting & Prevention | 95 (100.0%) | 0 (0.0%) |
| Law Enforcement | 183 (90.1%) | 20 (9.9%) |
| Food Preparation & Serving | 284 (40.3%) | 420 (59.7%) |
| Cleaning & Maintenance | 175 (90.2%) | 19 (9.8%) |
| Personal Care & Service | 34 (14.4%) | 202 (85.6%) |
| Total (Category) | 848 (37.4%) | 1,418 (62.6%) |
| Total (Overall) | 8,096 (56.8%) | 6,162 (43.2%) |
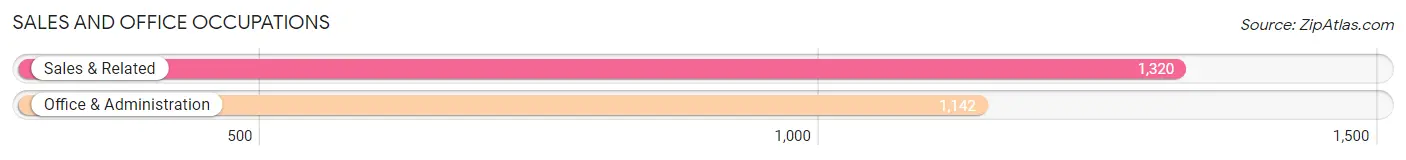
Sales and Office Occupations
The most common Sales and Office occupations in Cleburne are Sales & Related (1,320 | 9.3%), and Office & Administration (1,142 | 8.0%).
Sales and Office Occupations by Sex
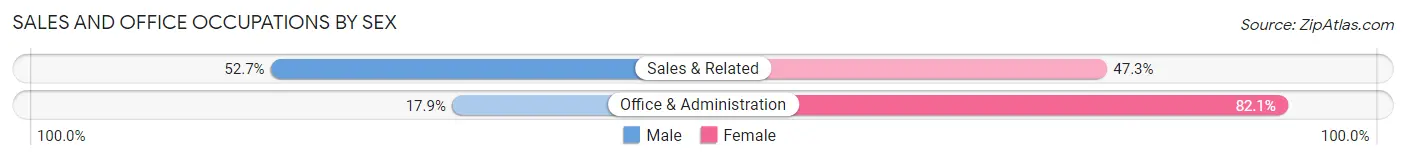
| Occupation | Male | Female |
| Sales & Related | 696 (52.7%) | 624 (47.3%) |
| Office & Administration | 204 (17.9%) | 938 (82.1%) |
| Total (Category) | 900 (36.6%) | 1,562 (63.4%) |
| Total (Overall) | 8,096 (56.8%) | 6,162 (43.2%) |
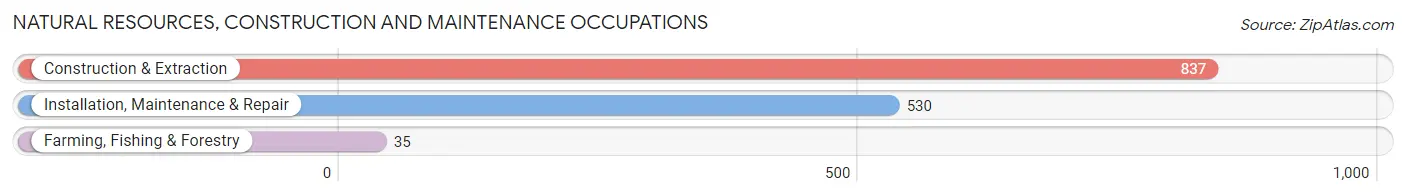
Natural Resources, Construction and Maintenance Occupations
The most common Natural Resources, Construction and Maintenance occupations in Cleburne are Construction & Extraction (837 | 5.9%), Installation, Maintenance & Repair (530 | 3.7%), and Farming, Fishing & Forestry (35 | 0.3%).
Natural Resources, Construction and Maintenance Occupations by Sex
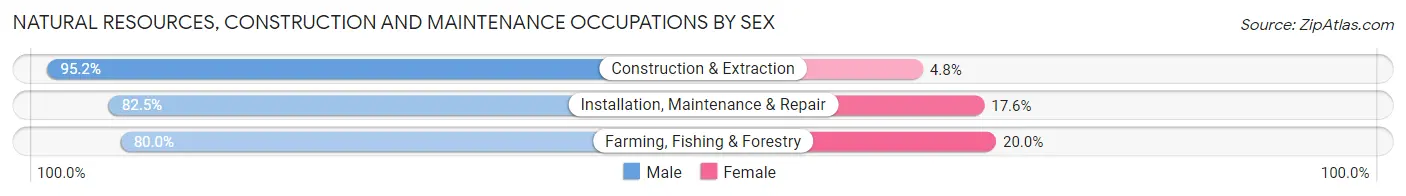
| Occupation | Male | Female |
| Farming, Fishing & Forestry | 28 (80.0%) | 7 (20.0%) |
| Construction & Extraction | 797 (95.2%) | 40 (4.8%) |
| Installation, Maintenance & Repair | 437 (82.5%) | 93 (17.5%) |
| Total (Category) | 1,262 (90.0%) | 140 (10.0%) |
| Total (Overall) | 8,096 (56.8%) | 6,162 (43.2%) |
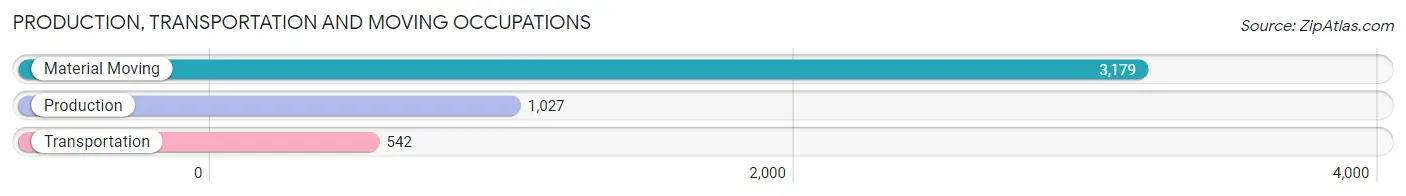
Production, Transportation and Moving Occupations
The most common Production, Transportation and Moving occupations in Cleburne are Material Moving (3,179 | 22.3%), Production (1,027 | 7.2%), and Transportation (542 | 3.8%).
Production, Transportation and Moving Occupations by Sex
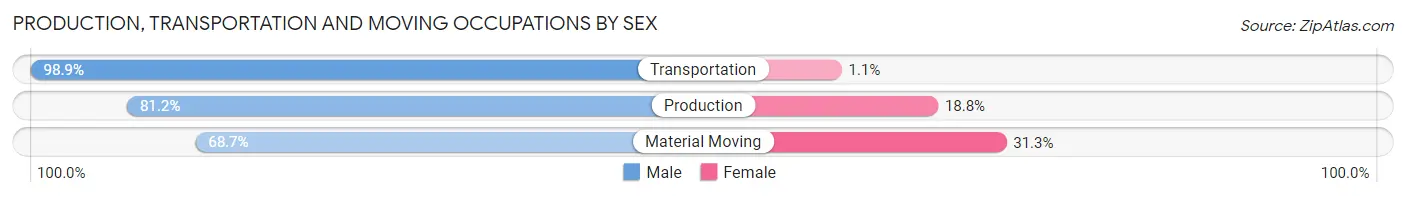
| Occupation | Male | Female |
| Production | 834 (81.2%) | 193 (18.8%) |
| Transportation | 536 (98.9%) | 6 (1.1%) |
| Material Moving | 2,183 (68.7%) | 996 (31.3%) |
| Total (Category) | 3,553 (74.8%) | 1,195 (25.2%) |
| Total (Overall) | 8,096 (56.8%) | 6,162 (43.2%) |
Employment Industries by Sex in Cleburne
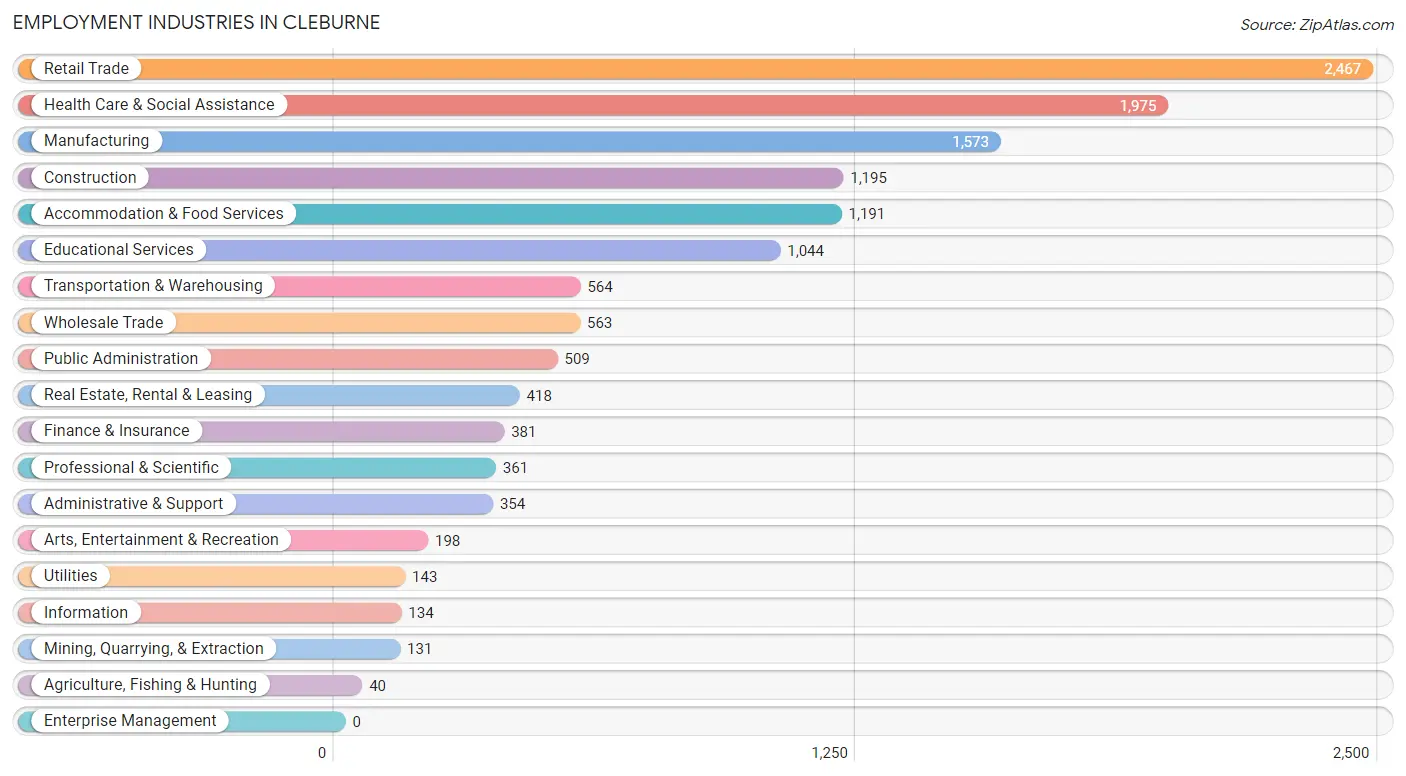
Employment Industries in Cleburne
The major employment industries in Cleburne include Retail Trade (2,467 | 17.3%), Health Care & Social Assistance (1,975 | 13.9%), Manufacturing (1,573 | 11.0%), Construction (1,195 | 8.4%), and Accommodation & Food Services (1,191 | 8.4%).
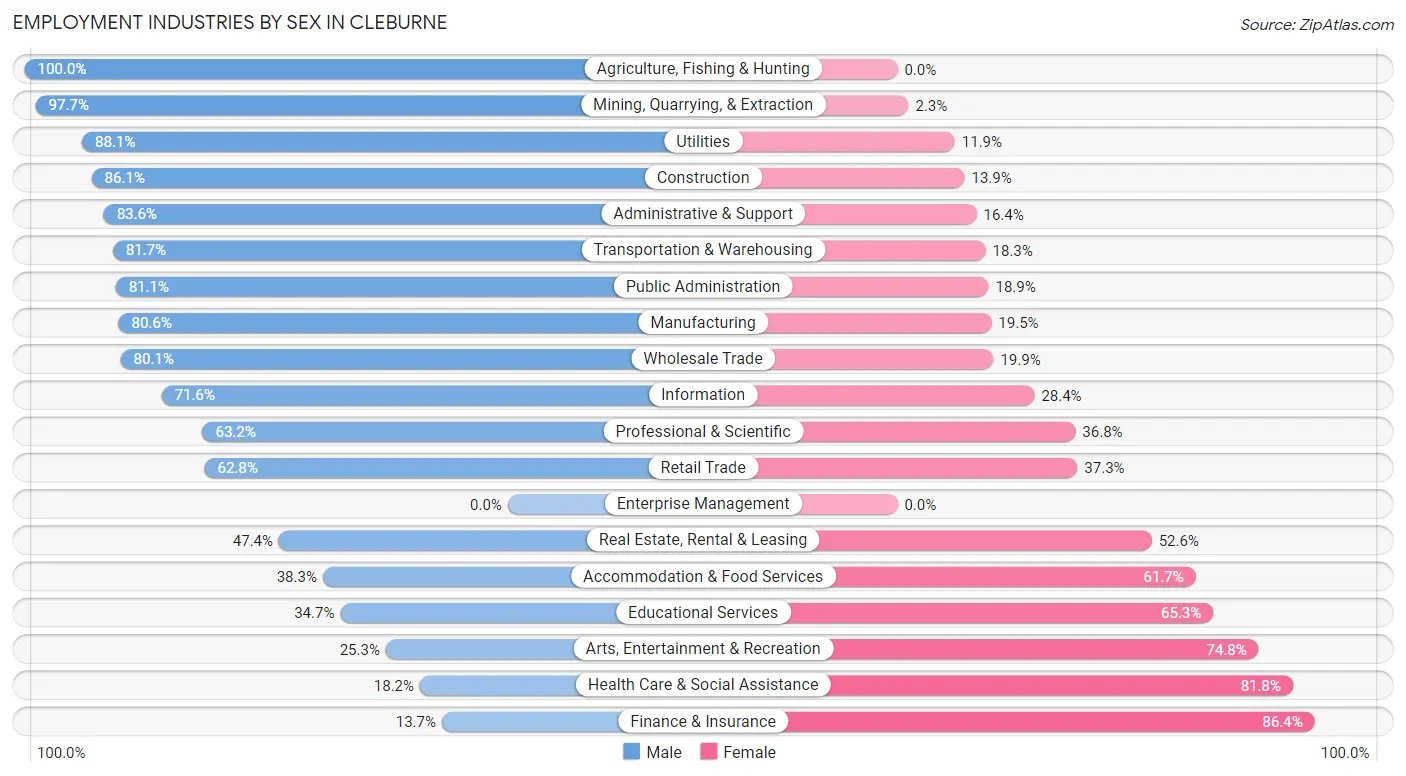
Employment Industries by Sex in Cleburne
The Cleburne industries that see more men than women are Agriculture, Fishing & Hunting (100.0%), Mining, Quarrying, & Extraction (97.7%), and Utilities (88.1%), whereas the industries that tend to have a higher number of women are Finance & Insurance (86.4%), Health Care & Social Assistance (81.8%), and Arts, Entertainment & Recreation (74.8%).
| Industry | Male | Female |
| Agriculture, Fishing & Hunting | 40 (100.0%) | 0 (0.0%) |
| Mining, Quarrying, & Extraction | 128 (97.7%) | 3 (2.3%) |
| Construction | 1,029 (86.1%) | 166 (13.9%) |
| Manufacturing | 1,267 (80.5%) | 306 (19.5%) |
| Wholesale Trade | 451 (80.1%) | 112 (19.9%) |
| Retail Trade | 1,548 (62.7%) | 919 (37.2%) |
| Transportation & Warehousing | 461 (81.7%) | 103 (18.3%) |
| Utilities | 126 (88.1%) | 17 (11.9%) |
| Information | 96 (71.6%) | 38 (28.4%) |
| Finance & Insurance | 52 (13.7%) | 329 (86.4%) |
| Real Estate, Rental & Leasing | 198 (47.4%) | 220 (52.6%) |
| Professional & Scientific | 228 (63.2%) | 133 (36.8%) |
| Enterprise Management | 0 (0.0%) | 0 (0.0%) |
| Administrative & Support | 296 (83.6%) | 58 (16.4%) |
| Educational Services | 362 (34.7%) | 682 (65.3%) |
| Health Care & Social Assistance | 359 (18.2%) | 1,616 (81.8%) |
| Arts, Entertainment & Recreation | 50 (25.3%) | 148 (74.8%) |
| Accommodation & Food Services | 456 (38.3%) | 735 (61.7%) |
| Public Administration | 413 (81.1%) | 96 (18.9%) |
| Total | 8,096 (56.8%) | 6,162 (43.2%) |
Education in Cleburne
School Enrollment in Cleburne
The most common levels of schooling among the 5,648 students in Cleburne are elementary school (1,568 | 27.8%), middle school (1,411 | 25.0%), and high school (1,281 | 22.7%).
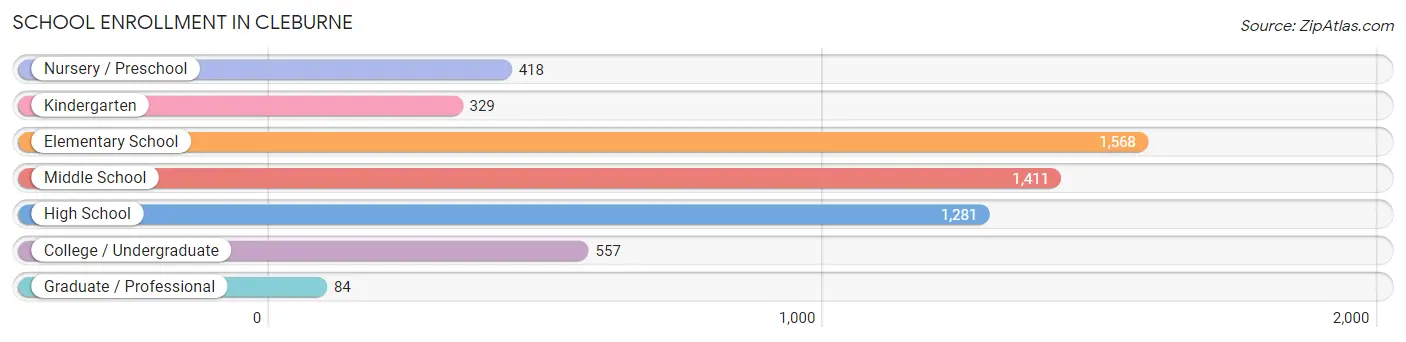
| School Level | # Students | % Students |
| Nursery / Preschool | 418 | 7.4% |
| Kindergarten | 329 | 5.8% |
| Elementary School | 1,568 | 27.8% |
| Middle School | 1,411 | 25.0% |
| High School | 1,281 | 22.7% |
| College / Undergraduate | 557 | 9.9% |
| Graduate / Professional | 84 | 1.5% |
| Total | 5,648 | 100.0% |
School Enrollment by Age by Funding Source in Cleburne
Out of a total of 5,648 students who are enrolled in schools in Cleburne, 898 (15.9%) attend a private institution, while the remaining 4,750 (84.1%) are enrolled in public schools. The age group of 3 to 4 year olds has the highest likelihood of being enrolled in private schools, with 247 (84.9% in the age bracket) enrolled. Conversely, the age group of 10 to 14 year olds has the lowest likelihood of being enrolled in a private school, with 1,774 (94.8% in the age bracket) attending a public institution.
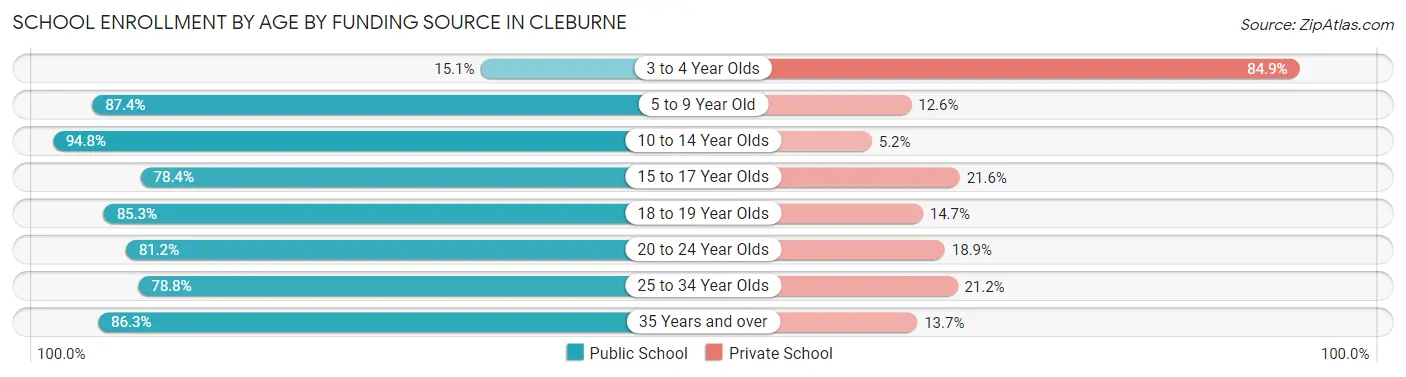
| Age Bracket | Public School | Private School |
| 3 to 4 Year Olds | 44 (15.1%) | 247 (84.9%) |
| 5 to 9 Year Old | 1,505 (87.4%) | 217 (12.6%) |
| 10 to 14 Year Olds | 1,774 (94.8%) | 98 (5.2%) |
| 15 to 17 Year Olds | 700 (78.4%) | 193 (21.6%) |
| 18 to 19 Year Olds | 295 (85.3%) | 51 (14.7%) |
| 20 to 24 Year Olds | 211 (81.1%) | 49 (18.9%) |
| 25 to 34 Year Olds | 93 (78.8%) | 25 (21.2%) |
| 35 Years and over | 126 (86.3%) | 20 (13.7%) |
| Total | 4,750 (84.1%) | 898 (15.9%) |
Educational Attainment by Field of Study in Cleburne
Education (870 | 24.6%), business (600 | 17.0%), science & technology (425 | 12.0%), bio, nature & agricultural (231 | 6.5%), and engineering (212 | 6.0%) are the most common fields of study among 3,537 individuals in Cleburne who have obtained a bachelor's degree or higher.
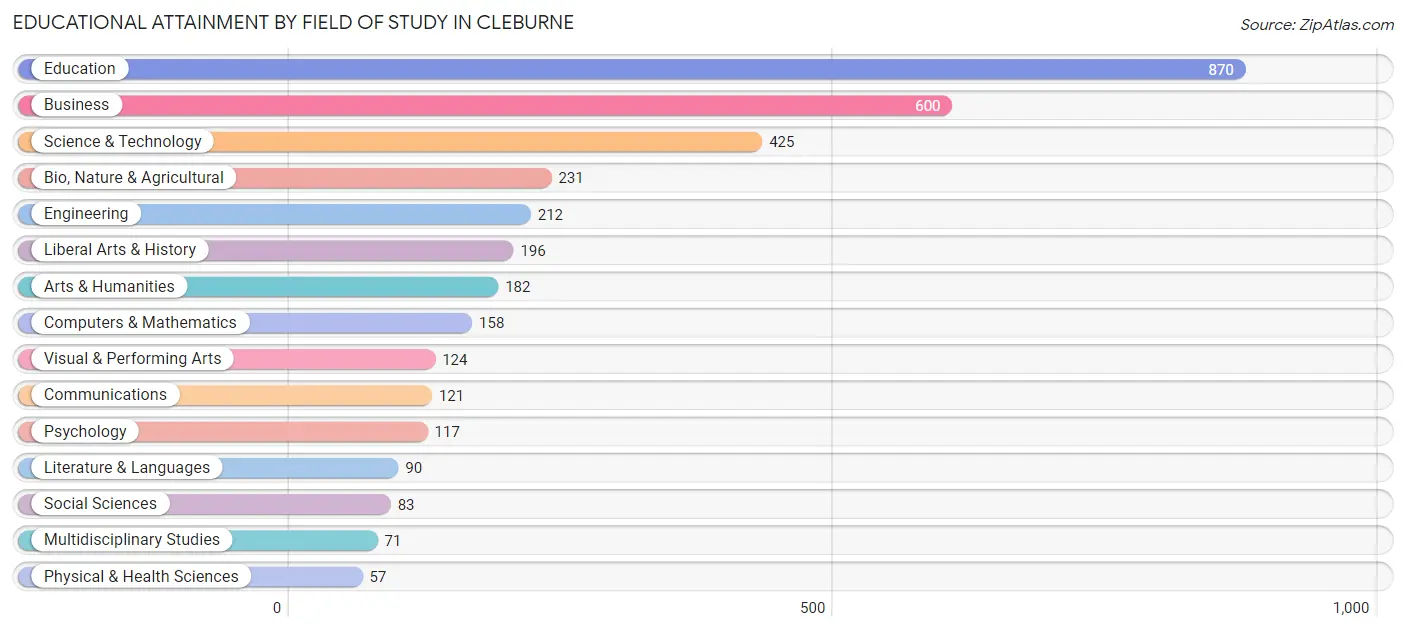
| Field of Study | # Graduates | % Graduates |
| Computers & Mathematics | 158 | 4.5% |
| Bio, Nature & Agricultural | 231 | 6.5% |
| Physical & Health Sciences | 57 | 1.6% |
| Psychology | 117 | 3.3% |
| Social Sciences | 83 | 2.4% |
| Engineering | 212 | 6.0% |
| Multidisciplinary Studies | 71 | 2.0% |
| Science & Technology | 425 | 12.0% |
| Business | 600 | 17.0% |
| Education | 870 | 24.6% |
| Literature & Languages | 90 | 2.5% |
| Liberal Arts & History | 196 | 5.5% |
| Visual & Performing Arts | 124 | 3.5% |
| Communications | 121 | 3.4% |
| Arts & Humanities | 182 | 5.1% |
| Total | 3,537 | 100.0% |
Transportation & Commute in Cleburne
Vehicle Availability by Sex in Cleburne
The most prevalent vehicle ownership categories in Cleburne are males with 2 vehicles (3,962, accounting for 50.0%) and females with 2 vehicles (3,279, making up 64.8%).
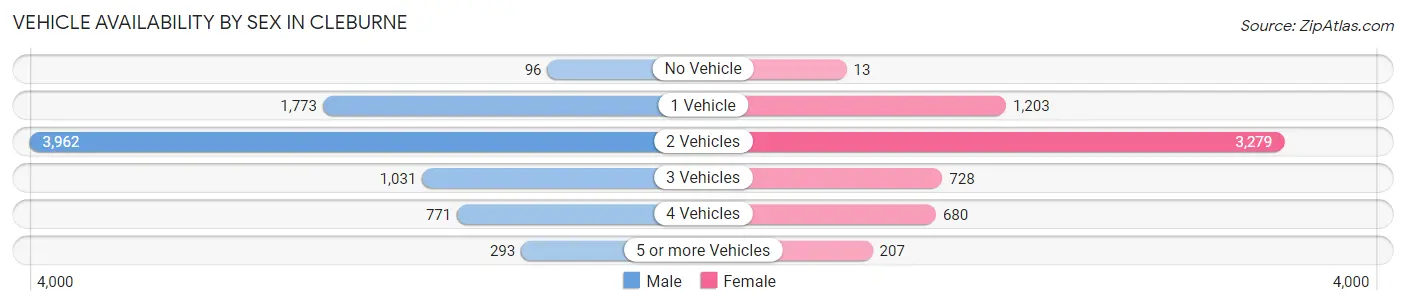
| Vehicles Available | Male | Female |
| No Vehicle | 96 (1.2%) | 13 (0.2%) |
| 1 Vehicle | 1,773 (22.4%) | 1,203 (19.7%) |
| 2 Vehicles | 3,962 (50.0%) | 3,279 (53.7%) |
| 3 Vehicles | 1,031 (13.0%) | 728 (11.9%) |
| 4 Vehicles | 771 (9.7%) | 680 (11.1%) |
| 5 or more Vehicles | 293 (3.7%) | 207 (3.4%) |
| Total | 7,926 (100.0%) | 6,110 (100.0%) |
Commute Time in Cleburne
The most frequently occuring commute durations in Cleburne are 20 to 24 minutes (2,652 commuters, 19.4%), 30 to 34 minutes (2,280 commuters, 16.7%), and 5 to 9 minutes (1,659 commuters, 12.1%).
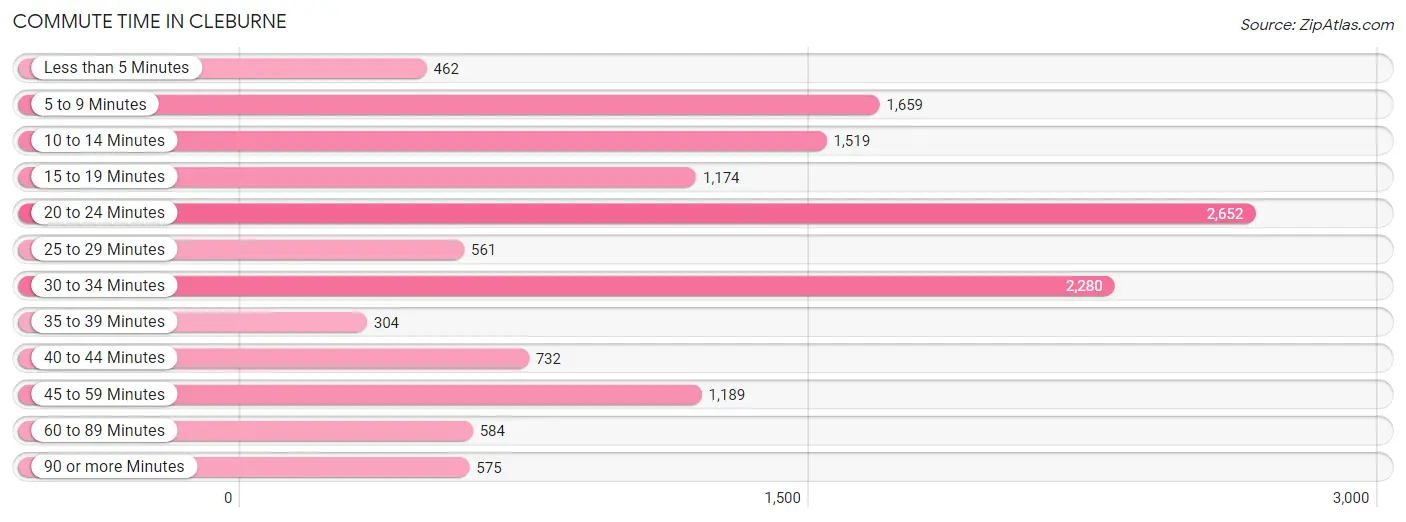
| Commute Time | # Commuters | % Commuters |
| Less than 5 Minutes | 462 | 3.4% |
| 5 to 9 Minutes | 1,659 | 12.1% |
| 10 to 14 Minutes | 1,519 | 11.1% |
| 15 to 19 Minutes | 1,174 | 8.6% |
| 20 to 24 Minutes | 2,652 | 19.4% |
| 25 to 29 Minutes | 561 | 4.1% |
| 30 to 34 Minutes | 2,280 | 16.7% |
| 35 to 39 Minutes | 304 | 2.2% |
| 40 to 44 Minutes | 732 | 5.3% |
| 45 to 59 Minutes | 1,189 | 8.7% |
| 60 to 89 Minutes | 584 | 4.3% |
| 90 or more Minutes | 575 | 4.2% |
Commute Time by Sex in Cleburne
The most common commute times in Cleburne are 20 to 24 minutes (1,473 commuters, 19.0%) for males and 20 to 24 minutes (1,179 commuters, 19.9%) for females.
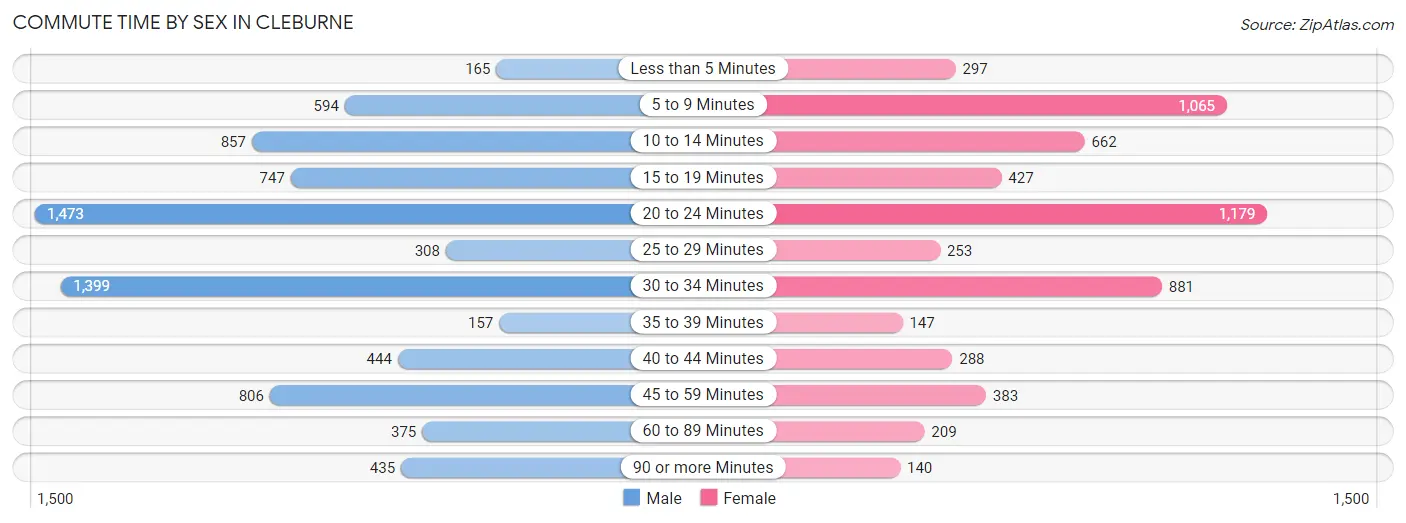
| Commute Time | Male | Female |
| Less than 5 Minutes | 165 (2.1%) | 297 (5.0%) |
| 5 to 9 Minutes | 594 (7.6%) | 1,065 (18.0%) |
| 10 to 14 Minutes | 857 (11.0%) | 662 (11.2%) |
| 15 to 19 Minutes | 747 (9.6%) | 427 (7.2%) |
| 20 to 24 Minutes | 1,473 (19.0%) | 1,179 (19.9%) |
| 25 to 29 Minutes | 308 (4.0%) | 253 (4.3%) |
| 30 to 34 Minutes | 1,399 (18.0%) | 881 (14.8%) |
| 35 to 39 Minutes | 157 (2.0%) | 147 (2.5%) |
| 40 to 44 Minutes | 444 (5.7%) | 288 (4.9%) |
| 45 to 59 Minutes | 806 (10.4%) | 383 (6.5%) |
| 60 to 89 Minutes | 375 (4.8%) | 209 (3.5%) |
| 90 or more Minutes | 435 (5.6%) | 140 (2.4%) |
Time of Departure to Work by Sex in Cleburne
The most frequent times of departure to work in Cleburne are 7:00 AM to 7:29 AM (1,789, 23.1%) for males and 7:30 AM to 7:59 AM (1,762, 29.7%) for females.
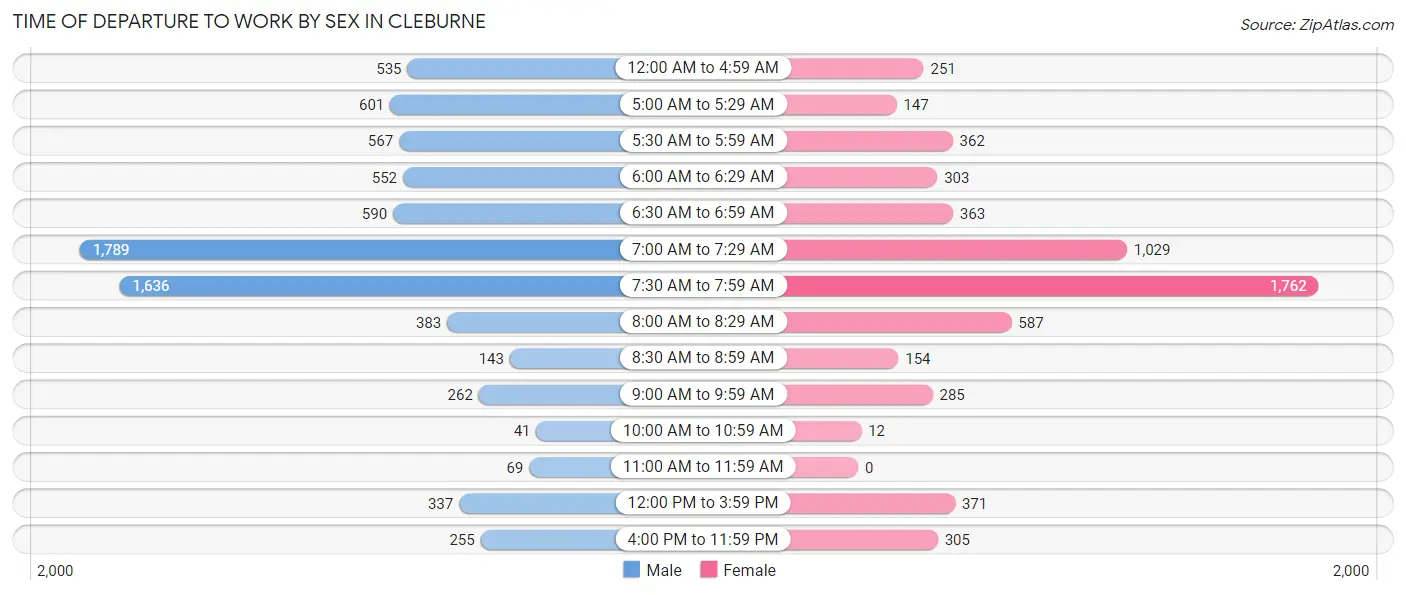
| Time of Departure | Male | Female |
| 12:00 AM to 4:59 AM | 535 (6.9%) | 251 (4.2%) |
| 5:00 AM to 5:29 AM | 601 (7.7%) | 147 (2.5%) |
| 5:30 AM to 5:59 AM | 567 (7.3%) | 362 (6.1%) |
| 6:00 AM to 6:29 AM | 552 (7.1%) | 303 (5.1%) |
| 6:30 AM to 6:59 AM | 590 (7.6%) | 363 (6.1%) |
| 7:00 AM to 7:29 AM | 1,789 (23.1%) | 1,029 (17.3%) |
| 7:30 AM to 7:59 AM | 1,636 (21.1%) | 1,762 (29.7%) |
| 8:00 AM to 8:29 AM | 383 (4.9%) | 587 (9.9%) |
| 8:30 AM to 8:59 AM | 143 (1.8%) | 154 (2.6%) |
| 9:00 AM to 9:59 AM | 262 (3.4%) | 285 (4.8%) |
| 10:00 AM to 10:59 AM | 41 (0.5%) | 12 (0.2%) |
| 11:00 AM to 11:59 AM | 69 (0.9%) | 0 (0.0%) |
| 12:00 PM to 3:59 PM | 337 (4.3%) | 371 (6.3%) |
| 4:00 PM to 11:59 PM | 255 (3.3%) | 305 (5.1%) |
| Total | 7,760 (100.0%) | 5,931 (100.0%) |
Housing Occupancy in Cleburne
Occupancy by Ownership in Cleburne
Of the total 11,258 dwellings in Cleburne, owner-occupied units account for 6,715 (59.7%), while renter-occupied units make up 4,543 (40.4%).
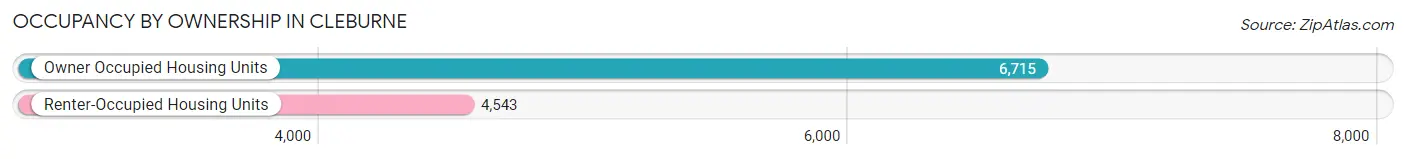
| Occupancy | # Housing Units | % Housing Units |
| Owner Occupied Housing Units | 6,715 | 59.7% |
| Renter-Occupied Housing Units | 4,543 | 40.4% |
| Total Occupied Housing Units | 11,258 | 100.0% |
Occupancy by Household Size in Cleburne
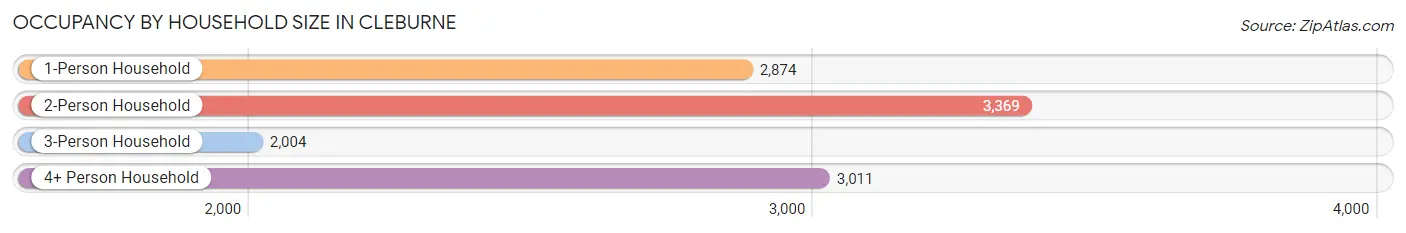
| Household Size | # Housing Units | % Housing Units |
| 1-Person Household | 2,874 | 25.5% |
| 2-Person Household | 3,369 | 29.9% |
| 3-Person Household | 2,004 | 17.8% |
| 4+ Person Household | 3,011 | 26.8% |
| Total Housing Units | 11,258 | 100.0% |
Occupancy by Ownership by Household Size in Cleburne
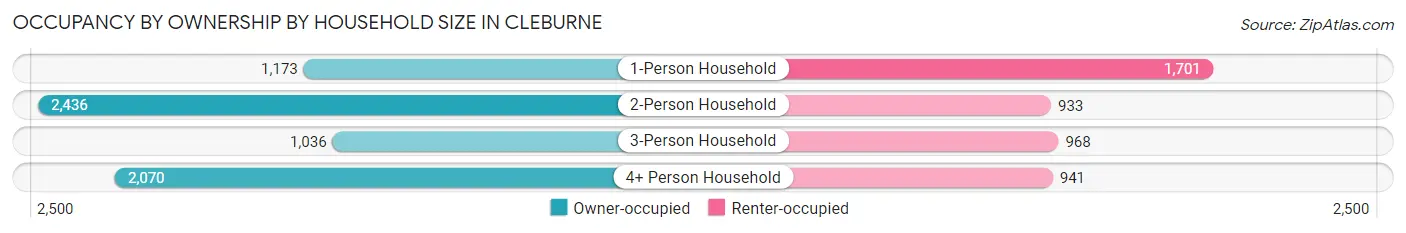
| Household Size | Owner-occupied | Renter-occupied |
| 1-Person Household | 1,173 (40.8%) | 1,701 (59.2%) |
| 2-Person Household | 2,436 (72.3%) | 933 (27.7%) |
| 3-Person Household | 1,036 (51.7%) | 968 (48.3%) |
| 4+ Person Household | 2,070 (68.8%) | 941 (31.2%) |
| Total Housing Units | 6,715 (59.7%) | 4,543 (40.4%) |
Occupancy by Educational Attainment in Cleburne
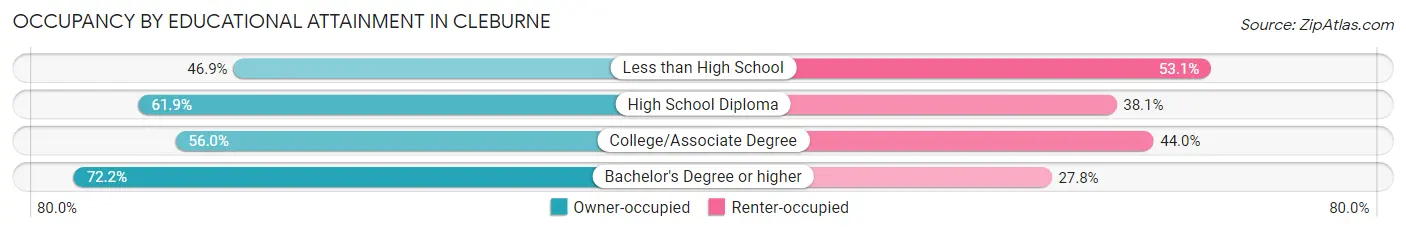
| Household Size | Owner-occupied | Renter-occupied |
| Less than High School | 720 (46.9%) | 816 (53.1%) |
| High School Diploma | 2,385 (61.9%) | 1,467 (38.1%) |
| College/Associate Degree | 2,179 (56.0%) | 1,709 (44.0%) |
| Bachelor's Degree or higher | 1,431 (72.2%) | 551 (27.8%) |
Occupancy by Age of Householder in Cleburne
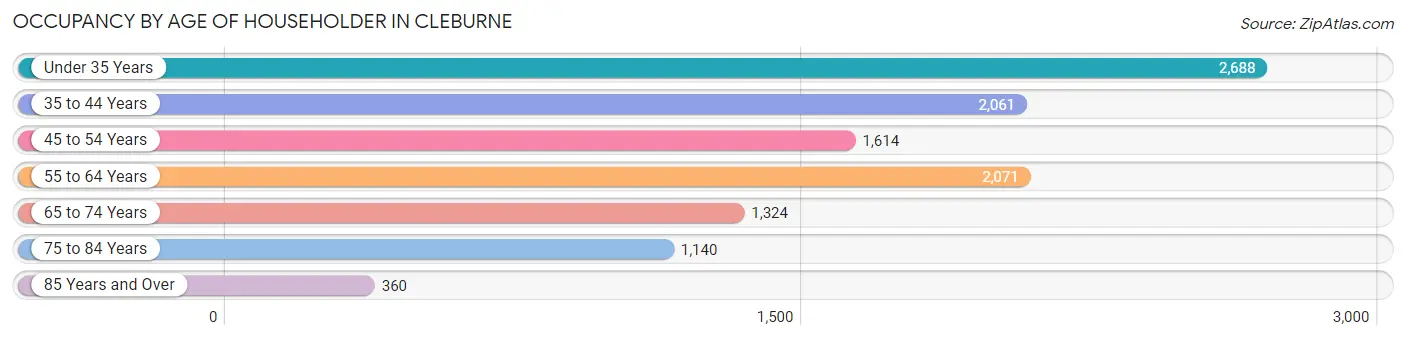
| Age Bracket | # Households | % Households |
| Under 35 Years | 2,688 | 23.9% |
| 35 to 44 Years | 2,061 | 18.3% |
| 45 to 54 Years | 1,614 | 14.3% |
| 55 to 64 Years | 2,071 | 18.4% |
| 65 to 74 Years | 1,324 | 11.8% |
| 75 to 84 Years | 1,140 | 10.1% |
| 85 Years and Over | 360 | 3.2% |
| Total | 11,258 | 100.0% |
Housing Finances in Cleburne
Median Income by Occupancy in Cleburne
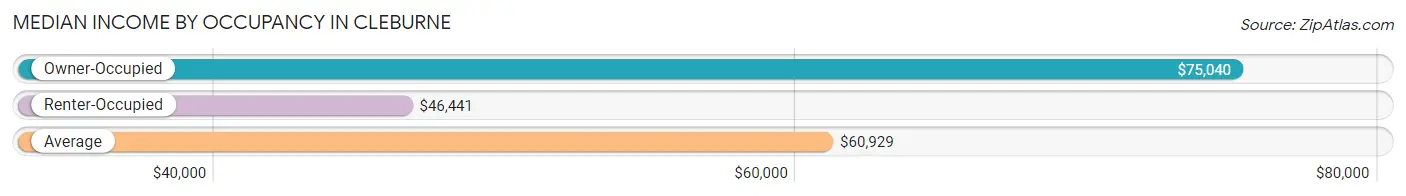
| Occupancy Type | # Households | Median Income |
| Owner-Occupied | 6,715 (59.7%) | $75,040 |
| Renter-Occupied | 4,543 (40.4%) | $46,441 |
| Average | 11,258 (100.0%) | $60,929 |
Occupancy by Householder Income Bracket in Cleburne
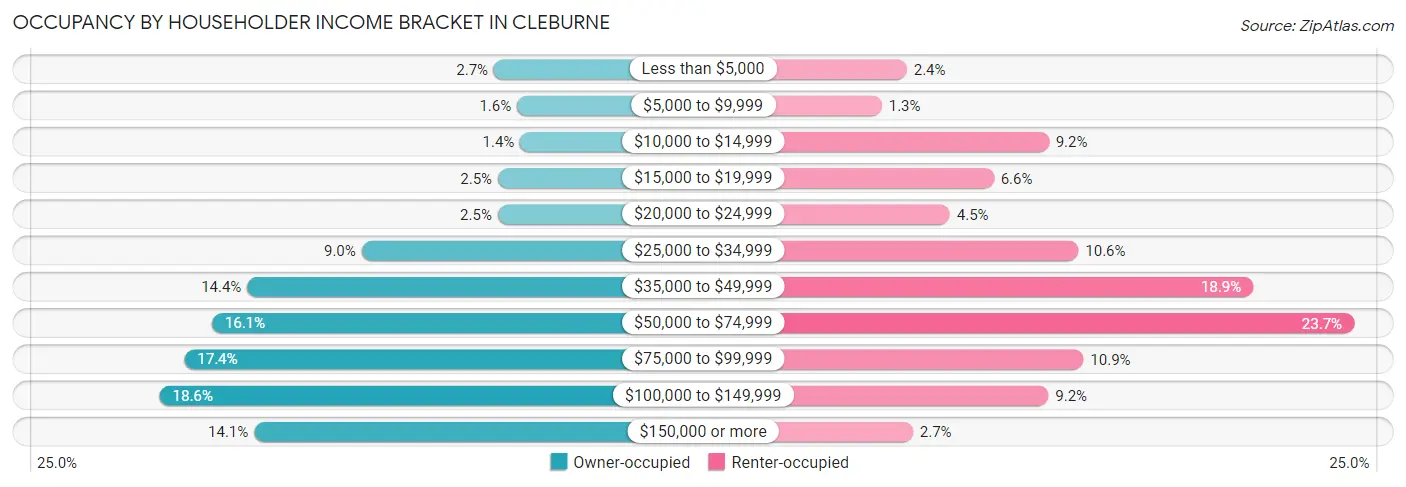
| Income Bracket | Owner-occupied | Renter-occupied |
| Less than $5,000 | 178 (2.6%) | 111 (2.4%) |
| $5,000 to $9,999 | 104 (1.5%) | 57 (1.3%) |
| $10,000 to $14,999 | 94 (1.4%) | 418 (9.2%) |
| $15,000 to $19,999 | 165 (2.5%) | 299 (6.6%) |
| $20,000 to $24,999 | 166 (2.5%) | 204 (4.5%) |
| $25,000 to $34,999 | 601 (8.9%) | 482 (10.6%) |
| $35,000 to $49,999 | 967 (14.4%) | 860 (18.9%) |
| $50,000 to $74,999 | 1,080 (16.1%) | 1,078 (23.7%) |
| $75,000 to $99,999 | 1,168 (17.4%) | 493 (10.8%) |
| $100,000 to $149,999 | 1,247 (18.6%) | 417 (9.2%) |
| $150,000 or more | 945 (14.1%) | 124 (2.7%) |
| Total | 6,715 (100.0%) | 4,543 (100.0%) |
Monthly Housing Cost Tiers in Cleburne
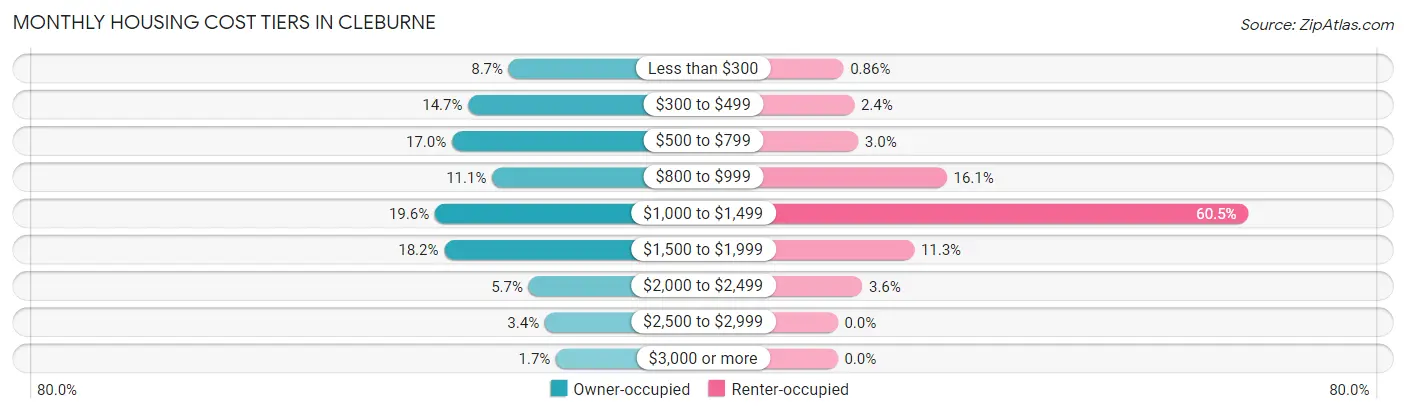
| Monthly Cost | Owner-occupied | Renter-occupied |
| Less than $300 | 582 (8.7%) | 39 (0.9%) |
| $300 to $499 | 984 (14.6%) | 111 (2.4%) |
| $500 to $799 | 1,144 (17.0%) | 137 (3.0%) |
| $800 to $999 | 747 (11.1%) | 730 (16.1%) |
| $1,000 to $1,499 | 1,313 (19.6%) | 2,750 (60.5%) |
| $1,500 to $1,999 | 1,221 (18.2%) | 512 (11.3%) |
| $2,000 to $2,499 | 385 (5.7%) | 165 (3.6%) |
| $2,500 to $2,999 | 225 (3.4%) | 0 (0.0%) |
| $3,000 or more | 114 (1.7%) | 0 (0.0%) |
| Total | 6,715 (100.0%) | 4,543 (100.0%) |
Physical Housing Characteristics in Cleburne
Housing Structures in Cleburne
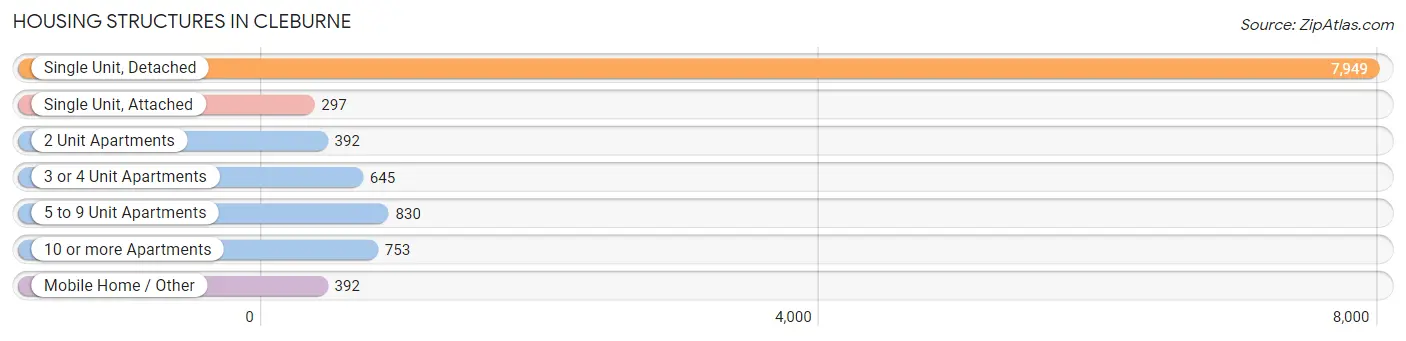
| Structure Type | # Housing Units | % Housing Units |
| Single Unit, Detached | 7,949 | 70.6% |
| Single Unit, Attached | 297 | 2.6% |
| 2 Unit Apartments | 392 | 3.5% |
| 3 or 4 Unit Apartments | 645 | 5.7% |
| 5 to 9 Unit Apartments | 830 | 7.4% |
| 10 or more Apartments | 753 | 6.7% |
| Mobile Home / Other | 392 | 3.5% |
| Total | 11,258 | 100.0% |
Housing Structures by Occupancy in Cleburne
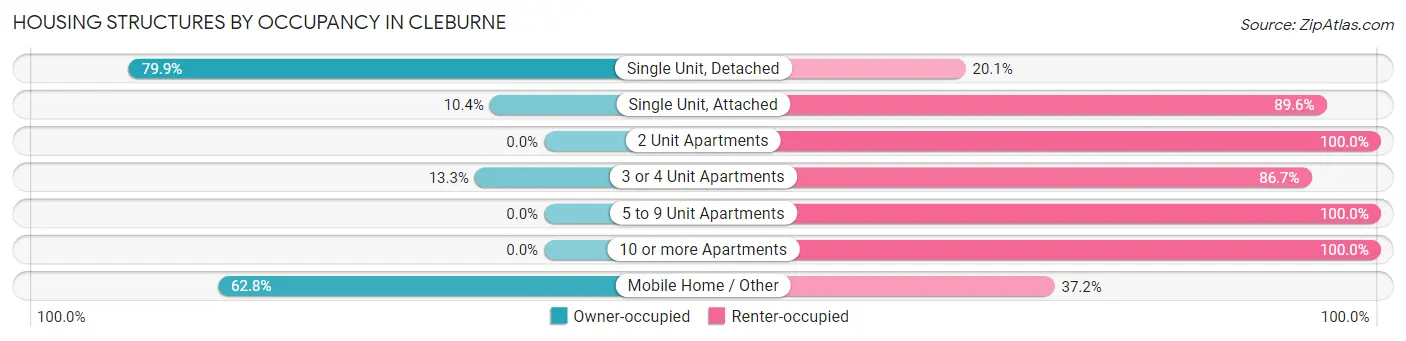
| Structure Type | Owner-occupied | Renter-occupied |
| Single Unit, Detached | 6,352 (79.9%) | 1,597 (20.1%) |
| Single Unit, Attached | 31 (10.4%) | 266 (89.6%) |
| 2 Unit Apartments | 0 (0.0%) | 392 (100.0%) |
| 3 or 4 Unit Apartments | 86 (13.3%) | 559 (86.7%) |
| 5 to 9 Unit Apartments | 0 (0.0%) | 830 (100.0%) |
| 10 or more Apartments | 0 (0.0%) | 753 (100.0%) |
| Mobile Home / Other | 246 (62.8%) | 146 (37.2%) |
| Total | 6,715 (59.7%) | 4,543 (40.4%) |
Housing Structures by Number of Rooms in Cleburne
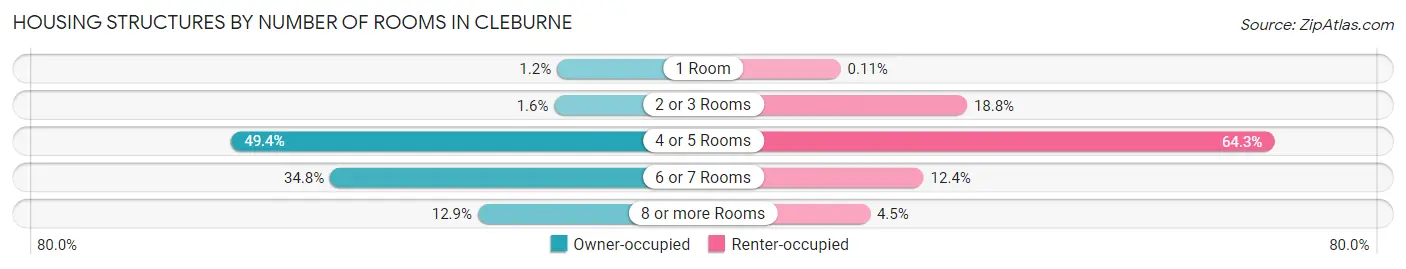
| Number of Rooms | Owner-occupied | Renter-occupied |
| 1 Room | 82 (1.2%) | 5 (0.1%) |
| 2 or 3 Rooms | 109 (1.6%) | 854 (18.8%) |
| 4 or 5 Rooms | 3,318 (49.4%) | 2,919 (64.2%) |
| 6 or 7 Rooms | 2,337 (34.8%) | 563 (12.4%) |
| 8 or more Rooms | 869 (12.9%) | 202 (4.4%) |
| Total | 6,715 (100.0%) | 4,543 (100.0%) |
Housing Structure by Heating Type in Cleburne
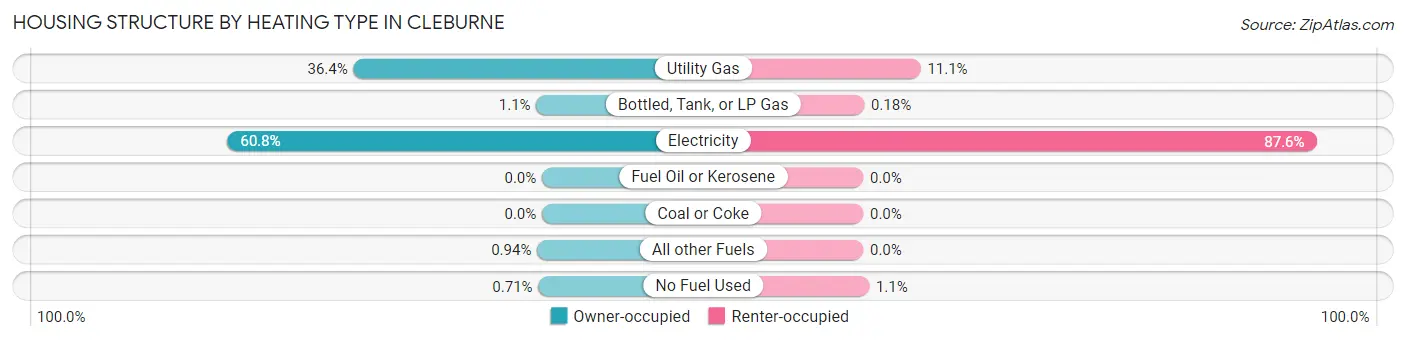
| Heating Type | Owner-occupied | Renter-occupied |
| Utility Gas | 2,446 (36.4%) | 504 (11.1%) |
| Bottled, Tank, or LP Gas | 74 (1.1%) | 8 (0.2%) |
| Electricity | 4,084 (60.8%) | 3,979 (87.6%) |
| Fuel Oil or Kerosene | 0 (0.0%) | 0 (0.0%) |
| Coal or Coke | 0 (0.0%) | 0 (0.0%) |
| All other Fuels | 63 (0.9%) | 0 (0.0%) |
| No Fuel Used | 48 (0.7%) | 52 (1.1%) |
| Total | 6,715 (100.0%) | 4,543 (100.0%) |
Household Vehicle Usage in Cleburne
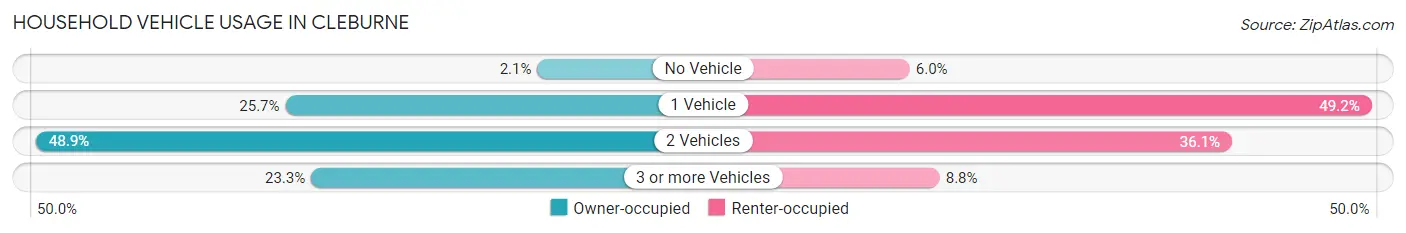
| Vehicles per Household | Owner-occupied | Renter-occupied |
| No Vehicle | 144 (2.1%) | 271 (6.0%) |
| 1 Vehicle | 1,723 (25.7%) | 2,233 (49.1%) |
| 2 Vehicles | 3,286 (48.9%) | 1,641 (36.1%) |
| 3 or more Vehicles | 1,562 (23.3%) | 398 (8.8%) |
| Total | 6,715 (100.0%) | 4,543 (100.0%) |
Real Estate & Mortgages in Cleburne
Real Estate and Mortgage Overview in Cleburne
| Characteristic | Without Mortgage | With Mortgage |
| Housing Units | 2,957 | 3,758 |
| Median Property Value | $154,800 | $190,900 |
| Median Household Income | $60,298 | $615 |
| Monthly Housing Costs | $490 | $105 |
| Real Estate Taxes | $1,597 | $29 |
Property Value by Mortgage Status in Cleburne
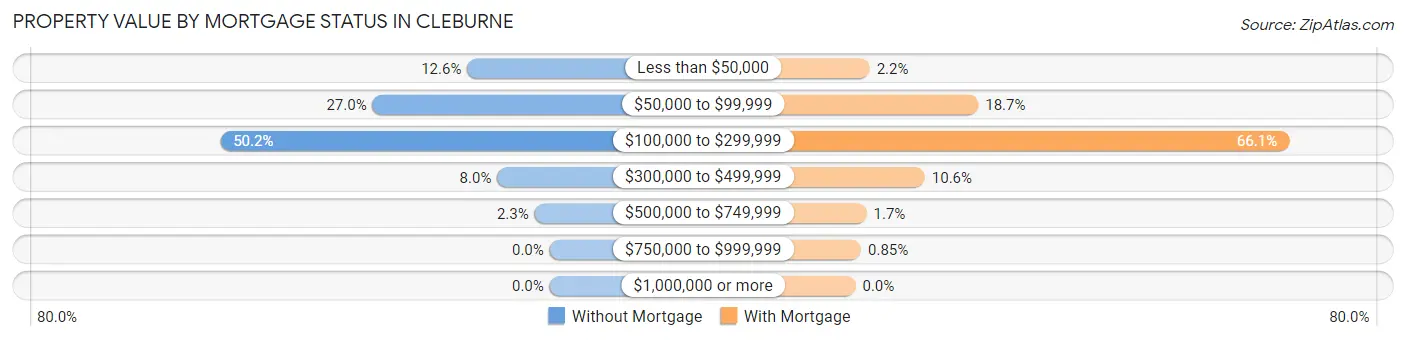
| Property Value | Without Mortgage | With Mortgage |
| Less than $50,000 | 371 (12.6%) | 81 (2.2%) |
| $50,000 to $99,999 | 798 (27.0%) | 703 (18.7%) |
| $100,000 to $299,999 | 1,484 (50.2%) | 2,482 (66.0%) |
| $300,000 to $499,999 | 236 (8.0%) | 397 (10.6%) |
| $500,000 to $749,999 | 68 (2.3%) | 63 (1.7%) |
| $750,000 to $999,999 | 0 (0.0%) | 32 (0.9%) |
| $1,000,000 or more | 0 (0.0%) | 0 (0.0%) |
| Total | 2,957 (100.0%) | 3,758 (100.0%) |
Household Income by Mortgage Status in Cleburne
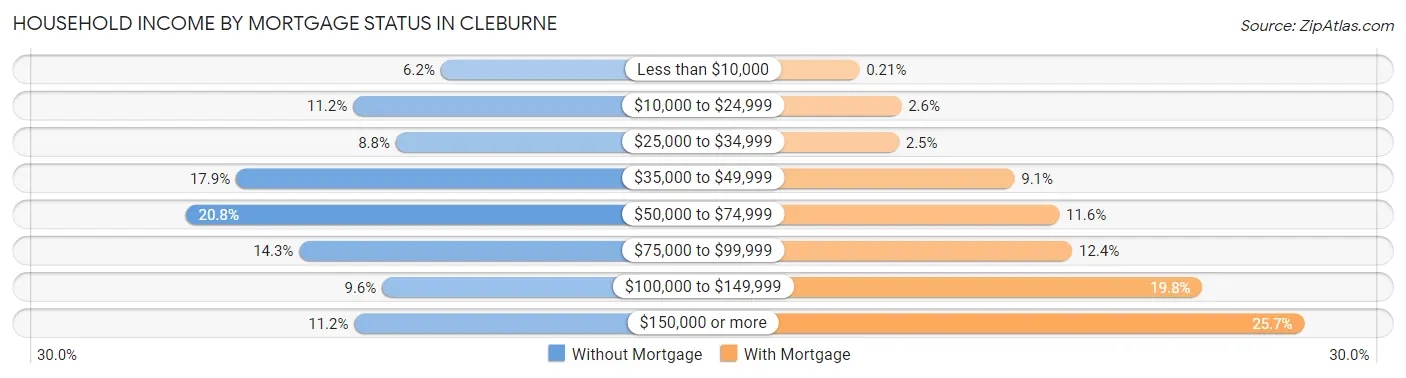
| Household Income | Without Mortgage | With Mortgage |
| Less than $10,000 | 184 (6.2%) | 8 (0.2%) |
| $10,000 to $24,999 | 332 (11.2%) | 98 (2.6%) |
| $25,000 to $34,999 | 260 (8.8%) | 93 (2.5%) |
| $35,000 to $49,999 | 530 (17.9%) | 341 (9.1%) |
| $50,000 to $74,999 | 615 (20.8%) | 437 (11.6%) |
| $75,000 to $99,999 | 423 (14.3%) | 465 (12.4%) |
| $100,000 to $149,999 | 283 (9.6%) | 745 (19.8%) |
| $150,000 or more | 330 (11.2%) | 964 (25.7%) |
| Total | 2,957 (100.0%) | 3,758 (100.0%) |
Property Value to Household Income Ratio in Cleburne
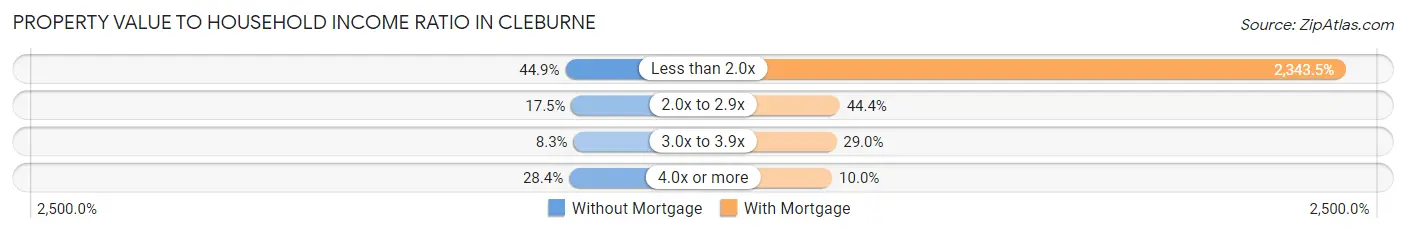
| Value-to-Income Ratio | Without Mortgage | With Mortgage |
| Less than 2.0x | 1,329 (44.9%) | 88,068 (2,343.5%) |
| 2.0x to 2.9x | 518 (17.5%) | 1,669 (44.4%) |
| 3.0x to 3.9x | 244 (8.3%) | 1,088 (28.9%) |
| 4.0x or more | 840 (28.4%) | 377 (10.0%) |
| Total | 2,957 (100.0%) | 3,758 (100.0%) |
Real Estate Taxes by Mortgage Status in Cleburne
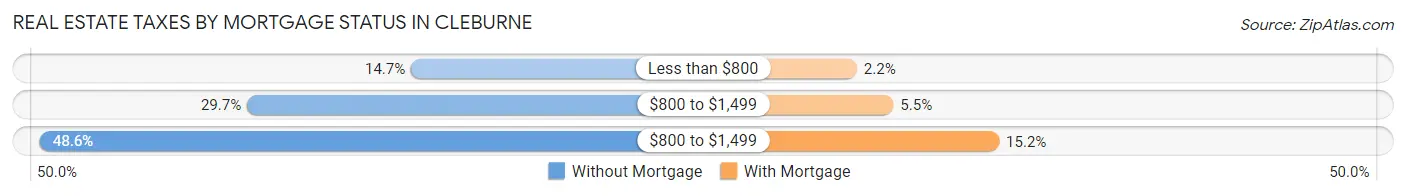
| Property Taxes | Without Mortgage | With Mortgage |
| Less than $800 | 435 (14.7%) | 82 (2.2%) |
| $800 to $1,499 | 878 (29.7%) | 207 (5.5%) |
| $800 to $1,499 | 1,437 (48.6%) | 570 (15.2%) |
| Total | 2,957 (100.0%) | 3,758 (100.0%) |
Health & Disability in Cleburne
Health Insurance Coverage by Age in Cleburne
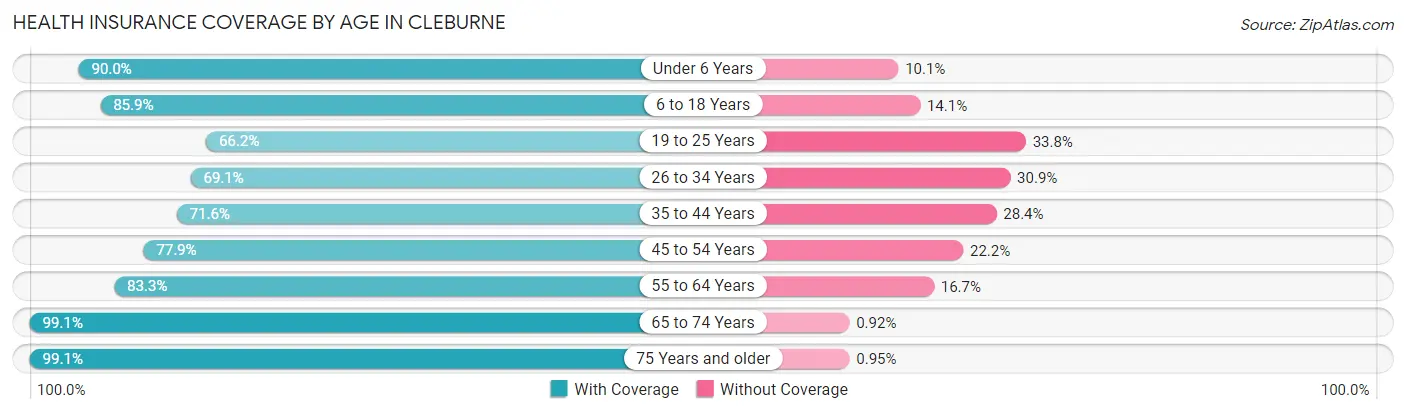
| Age Bracket | With Coverage | Without Coverage |
| Under 6 Years | 2,758 (89.9%) | 308 (10.1%) |
| 6 to 18 Years | 5,003 (85.9%) | 822 (14.1%) |
| 19 to 25 Years | 1,995 (66.2%) | 1,020 (33.8%) |
| 26 to 34 Years | 2,566 (69.1%) | 1,149 (30.9%) |
| 35 to 44 Years | 2,913 (71.6%) | 1,153 (28.4%) |
| 45 to 54 Years | 2,485 (77.8%) | 707 (22.2%) |
| 55 to 64 Years | 3,006 (83.3%) | 602 (16.7%) |
| 65 to 74 Years | 2,382 (99.1%) | 22 (0.9%) |
| 75 Years and older | 2,085 (99.1%) | 20 (0.9%) |
| Total | 25,193 (81.3%) | 5,803 (18.7%) |
Health Insurance Coverage by Citizenship Status in Cleburne
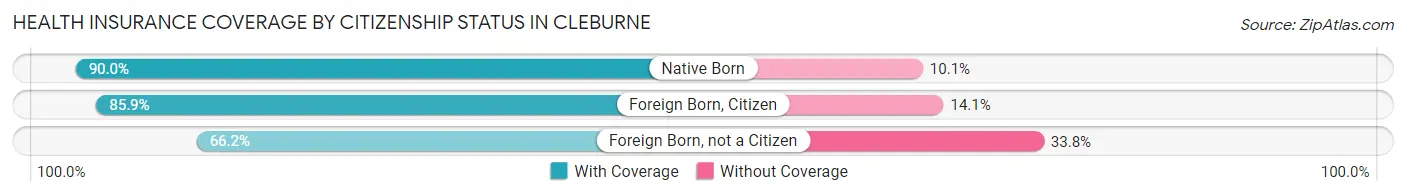
| Citizenship Status | With Coverage | Without Coverage |
| Native Born | 2,758 (89.9%) | 308 (10.1%) |
| Foreign Born, Citizen | 5,003 (85.9%) | 822 (14.1%) |
| Foreign Born, not a Citizen | 1,995 (66.2%) | 1,020 (33.8%) |
Health Insurance Coverage by Household Income in Cleburne
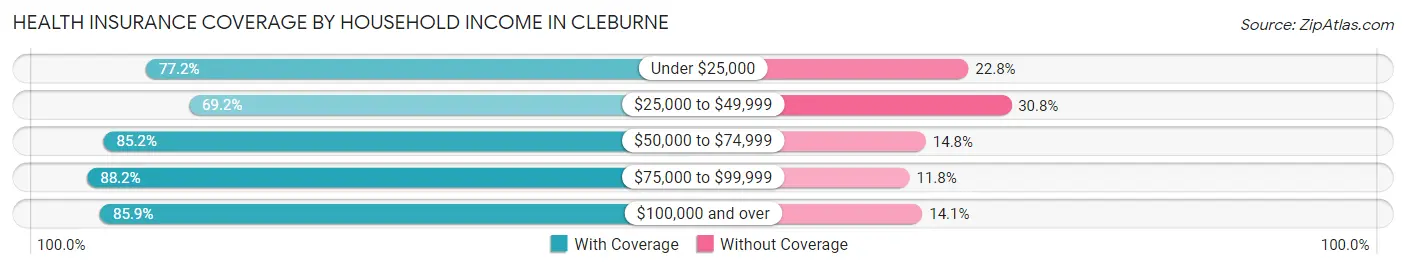
| Household Income | With Coverage | Without Coverage |
| Under $25,000 | 2,610 (77.2%) | 770 (22.8%) |
| $25,000 to $49,999 | 4,966 (69.2%) | 2,210 (30.8%) |
| $50,000 to $74,999 | 5,170 (85.2%) | 899 (14.8%) |
| $75,000 to $99,999 | 4,848 (88.2%) | 646 (11.8%) |
| $100,000 and over | 7,553 (85.9%) | 1,244 (14.1%) |
Public vs Private Health Insurance Coverage by Age in Cleburne
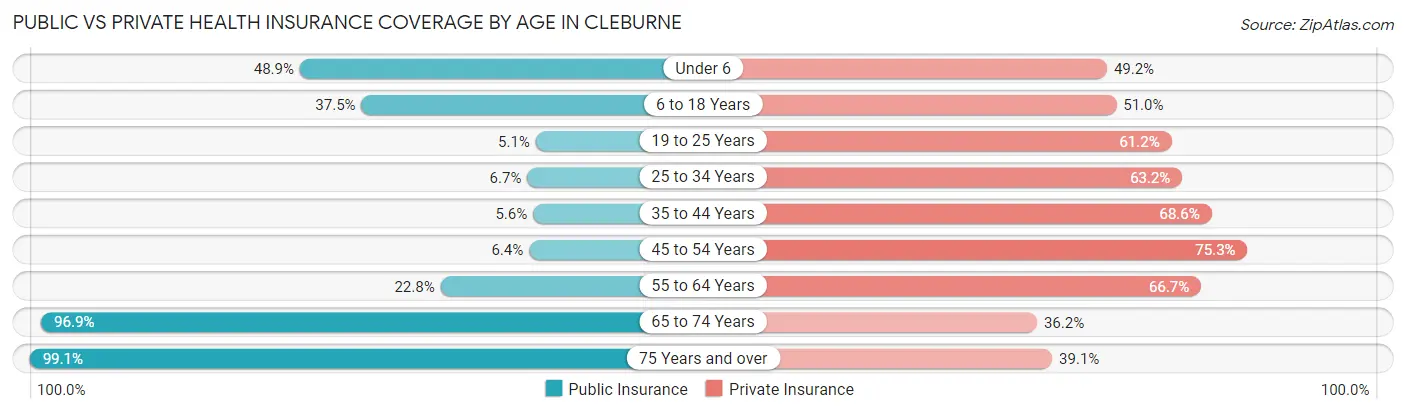
| Age Bracket | Public Insurance | Private Insurance |
| Under 6 | 1,500 (48.9%) | 1,509 (49.2%) |
| 6 to 18 Years | 2,183 (37.5%) | 2,968 (50.9%) |
| 19 to 25 Years | 155 (5.1%) | 1,845 (61.2%) |
| 25 to 34 Years | 249 (6.7%) | 2,347 (63.2%) |
| 35 to 44 Years | 229 (5.6%) | 2,790 (68.6%) |
| 45 to 54 Years | 203 (6.4%) | 2,403 (75.3%) |
| 55 to 64 Years | 823 (22.8%) | 2,406 (66.7%) |
| 65 to 74 Years | 2,330 (96.9%) | 871 (36.2%) |
| 75 Years and over | 2,085 (99.1%) | 822 (39.1%) |
| Total | 9,757 (31.5%) | 17,961 (58.0%) |
Disability Status by Sex by Age in Cleburne
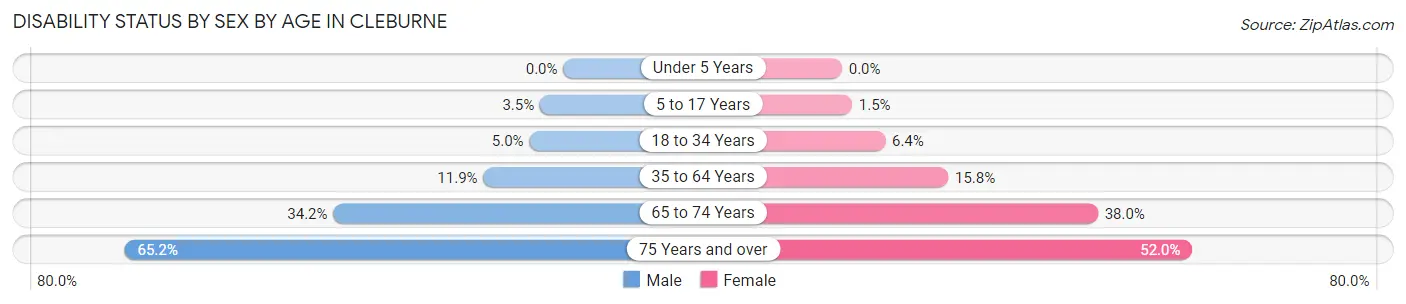
| Age Bracket | Male | Female |
| Under 5 Years | 0 (0.0%) | 0 (0.0%) |
| 5 to 17 Years | 114 (3.5%) | 37 (1.5%) |
| 18 to 34 Years | 198 (5.0%) | 205 (6.4%) |
| 35 to 64 Years | 647 (11.9%) | 855 (15.8%) |
| 65 to 74 Years | 350 (34.2%) | 524 (38.0%) |
| 75 Years and over | 559 (65.1%) | 649 (52.0%) |
Disability Class by Sex by Age in Cleburne
Disability Class: Hearing Difficulty
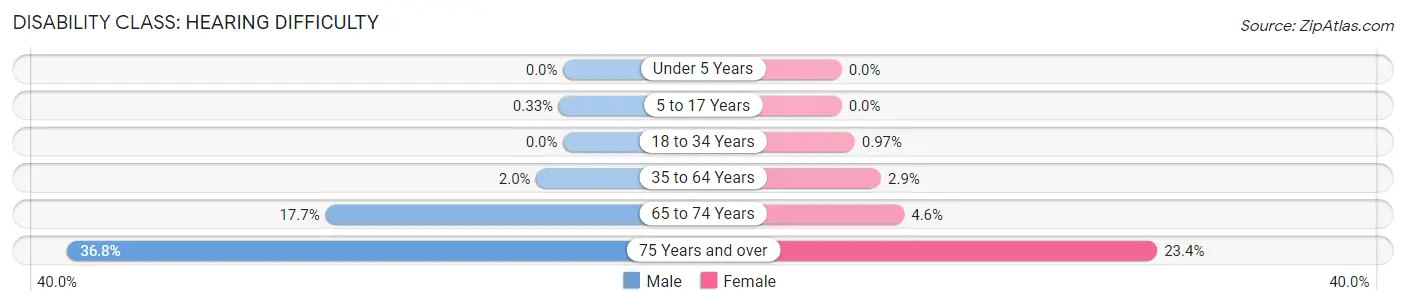
| Age Bracket | Male | Female |
| Under 5 Years | 0 (0.0%) | 0 (0.0%) |
| 5 to 17 Years | 11 (0.3%) | 0 (0.0%) |
| 18 to 34 Years | 0 (0.0%) | 31 (1.0%) |
| 35 to 64 Years | 109 (2.0%) | 158 (2.9%) |
| 65 to 74 Years | 181 (17.7%) | 64 (4.6%) |
| 75 Years and over | 316 (36.8%) | 292 (23.4%) |
Disability Class: Vision Difficulty
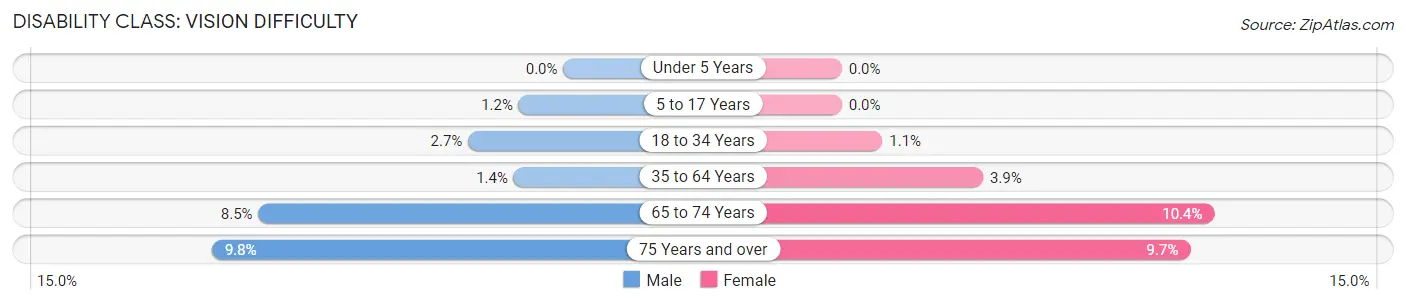
| Age Bracket | Male | Female |
| Under 5 Years | 0 (0.0%) | 0 (0.0%) |
| 5 to 17 Years | 41 (1.2%) | 0 (0.0%) |
| 18 to 34 Years | 104 (2.6%) | 36 (1.1%) |
| 35 to 64 Years | 75 (1.4%) | 213 (3.9%) |
| 65 to 74 Years | 87 (8.5%) | 143 (10.4%) |
| 75 Years and over | 84 (9.8%) | 121 (9.7%) |
Disability Class: Cognitive Difficulty
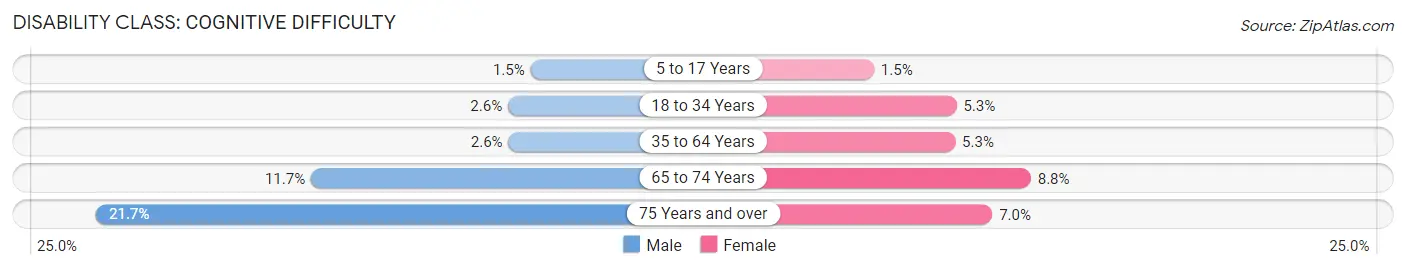
| Age Bracket | Male | Female |
| 5 to 17 Years | 50 (1.5%) | 37 (1.5%) |
| 18 to 34 Years | 101 (2.6%) | 170 (5.3%) |
| 35 to 64 Years | 139 (2.5%) | 285 (5.3%) |
| 65 to 74 Years | 120 (11.7%) | 121 (8.8%) |
| 75 Years and over | 186 (21.7%) | 87 (7.0%) |
Disability Class: Ambulatory Difficulty
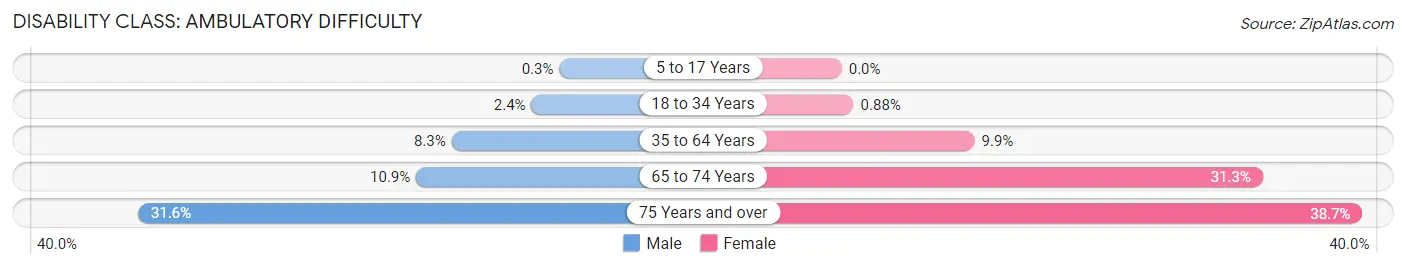
| Age Bracket | Male | Female |
| 5 to 17 Years | 10 (0.3%) | 0 (0.0%) |
| 18 to 34 Years | 93 (2.4%) | 28 (0.9%) |
| 35 to 64 Years | 452 (8.3%) | 534 (9.9%) |
| 65 to 74 Years | 112 (10.9%) | 431 (31.2%) |
| 75 Years and over | 271 (31.6%) | 482 (38.7%) |
Disability Class: Self-Care Difficulty
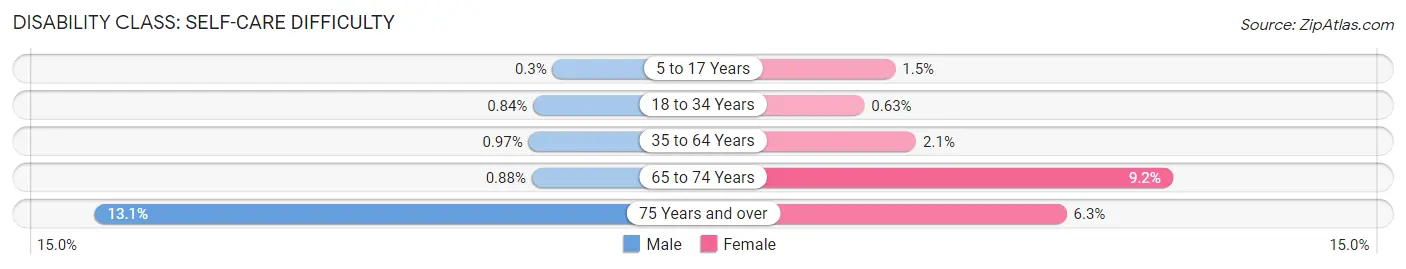
| Age Bracket | Male | Female |
| 5 to 17 Years | 10 (0.3%) | 37 (1.5%) |
| 18 to 34 Years | 33 (0.8%) | 20 (0.6%) |
| 35 to 64 Years | 53 (1.0%) | 112 (2.1%) |
| 65 to 74 Years | 9 (0.9%) | 127 (9.2%) |
| 75 Years and over | 112 (13.1%) | 78 (6.3%) |
Technology Access in Cleburne
Computing Device Access in Cleburne
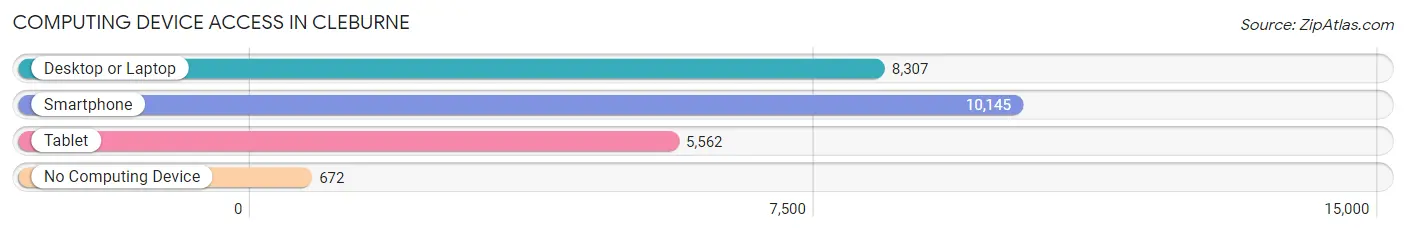
| Device Type | # Households | % Households |
| Desktop or Laptop | 8,307 | 73.8% |
| Smartphone | 10,145 | 90.1% |
| Tablet | 5,562 | 49.4% |
| No Computing Device | 672 | 6.0% |
| Total | 11,258 | 100.0% |
Internet Access in Cleburne
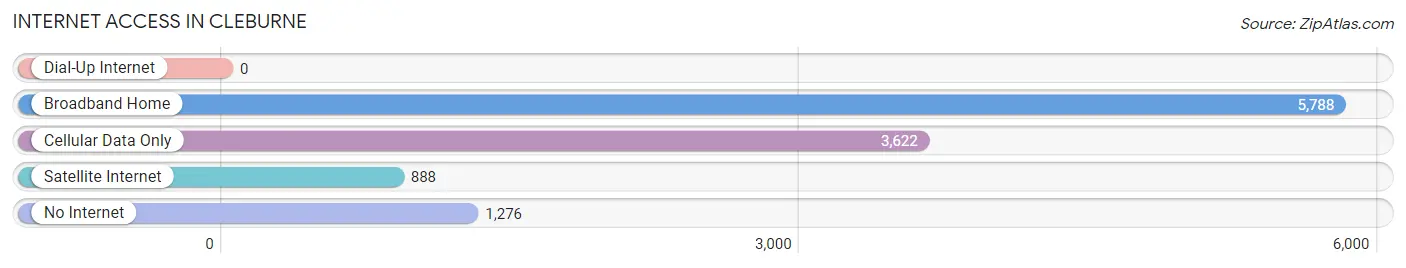
| Internet Type | # Households | % Households |
| Dial-Up Internet | 0 | 0.0% |
| Broadband Home | 5,788 | 51.4% |
| Cellular Data Only | 3,622 | 32.2% |
| Satellite Internet | 888 | 7.9% |
| No Internet | 1,276 | 11.3% |
| Total | 11,258 | 100.0% |
Cleburne Summary
Cleburne, Texas is a city located in Johnson County, Texas, United States. It is the county seat of Johnson County and is part of the Dallas-Fort Worth-Arlington metropolitan area. The population of Cleburne was 29,377 at the 2010 census, up from 25,844 at the 2000 census.
History
The area that is now Cleburne was first settled in 1849 by a group of settlers from Tennessee. The town was named after Confederate General Patrick Cleburne, who was born in Ireland and served in the Confederate Army during the Civil War. The town was officially incorporated in 1867 and was the first town in Johnson County to be incorporated.
In the late 19th century, Cleburne was a major stop on the St. Louis-San Francisco Railway, which ran through the city. The railroad brought many new businesses and industries to the area, and the population of the city grew rapidly.
In the early 20th century, Cleburne was a major center for the oil and gas industry. The city was home to several oil refineries and other related businesses. The city also became a major center for the production of cotton and other agricultural products.
Geography
Cleburne is located in Johnson County, Texas, at the intersection of U.S. Highway 67 and State Highway 174. The city is situated on the eastern edge of the Edwards Plateau, and is surrounded by rolling hills and wooded areas. The city is located approximately 40 miles south of Fort Worth and 60 miles southwest of Dallas.
The climate in Cleburne is generally mild, with hot summers and cool winters. The average annual temperature is 68 degrees Fahrenheit, and the average annual precipitation is 33 inches.
Economy
The economy of Cleburne is largely based on the oil and gas industry, as well as agriculture and manufacturing. The city is home to several oil refineries, as well as several other businesses related to the oil and gas industry. The city is also home to several manufacturing companies, including a large paper mill and a large steel mill.
Agriculture is also an important part of the economy of Cleburne. The city is home to several large farms, and the surrounding area is home to many smaller farms. The city is also home to several large ranches, and the surrounding area is home to many smaller ranches.
Demographics
As of the 2010 census, the population of Cleburne was 29,377. The racial makeup of the city was 75.3% White, 15.2% African American, 0.7% Native American, 0.7% Asian, 0.1% Pacific Islander, 5.7% from other races, and 2.4% from two or more races. Hispanic or Latino of any race were 13.3% of the population.
The median income for a household in Cleburne was $41,945, and the median income for a family was $50,945. The per capita income for the city was $20,945. About 14.3% of families and 17.7% of the population were below the poverty line, including 25.2% of those under age 18 and 11.2% of those age 65 or over.
Common Questions
What is Per Capita Income in Cleburne?
Per Capita income in Cleburne is $28,134.
What is the Median Family Income in Cleburne?
Median Family Income in Cleburne is $70,199.
What is the Median Household income in Cleburne?
Median Household Income in Cleburne is $60,929.
What is Income or Wage Gap in Cleburne?
Income or Wage Gap in Cleburne is 30.7%.
Women in Cleburne earn 69.3 cents for every dollar earned by a man.
What is Family Income Deficit in Cleburne?
Family Income Deficit in Cleburne is $10,496.
Families that are below poverty line in Cleburne earn $10,496 less on average than the poverty threshold level.
What is Inequality or Gini Index in Cleburne?
Inequality or Gini Index in Cleburne is 0.42.
What is the Total Population of Cleburne?
Total Population of Cleburne is 31,849.
What is the Total Male Population of Cleburne?
Total Male Population of Cleburne is 16,530.
What is the Total Female Population of Cleburne?
Total Female Population of Cleburne is 15,319.
What is the Ratio of Males per 100 Females in Cleburne?
There are 107.91 Males per 100 Females in Cleburne.
What is the Ratio of Females per 100 Males in Cleburne?
There are 92.67 Females per 100 Males in Cleburne.
What is the Median Population Age in Cleburne?
Median Population Age in Cleburne is 35.2 Years.
What is the Average Family Size in Cleburne
Average Family Size in Cleburne is 3.3 People.
What is the Average Household Size in Cleburne
Average Household Size in Cleburne is 2.8 People.
How Large is the Labor Force in Cleburne?
There are 14,665 People in the Labor Forcein in Cleburne.
What is the Percentage of People in the Labor Force in Cleburne?
60.4% of People are in the Labor Force in Cleburne.
What is the Unemployment Rate in Cleburne?
Unemployment Rate in Cleburne is 2.7%.