Kula, HI Map & Demographics
Kula Map
Kula Overview
$51,104
PER CAPITA INCOME
$109,325
AVG FAMILY INCOME
$93,452
AVG HOUSEHOLD INCOME
23.4%
WAGE / INCOME GAP [ % ]
76.6¢/ $1
WAGE / INCOME GAP [ $ ]
$6,773
FAMILY INCOME DEFICIT
0.47
INEQUALITY / GINI INDEX
6,578
TOTAL POPULATION
3,156
MALE POPULATION
3,422
FEMALE POPULATION
92.23
MALES / 100 FEMALES
108.43
FEMALES / 100 MALES
49.7
MEDIAN AGE
3.0
AVG FAMILY SIZE
2.6
AVG HOUSEHOLD SIZE
2,957
LABOR FORCE [ PEOPLE ]
56.5%
PERCENT IN LABOR FORCE
4.0%
UNEMPLOYMENT RATE
Kula Zip Codes
Kula Area Codes
Income in Kula
Income Overview in Kula
Per Capita Income in Kula is $51,104, while median incomes of families and households are $109,325 and $93,452 respectively.
| Characteristic | Number | Measure |
| Per Capita Income | 6,578 | $51,104 |
| Median Family Income | 1,751 | $109,325 |
| Mean Family Income | 1,751 | $148,954 |
| Median Household Income | 2,480 | $93,452 |
| Mean Household Income | 2,480 | $135,073 |
| Income Deficit | 1,751 | $6,773 |
| Wage / Income Gap (%) | 6,578 | 23.38% |
| Wage / Income Gap ($) | 6,578 | 76.62¢ per $1 |
| Gini / Inequality Index | 6,578 | 0.47 |
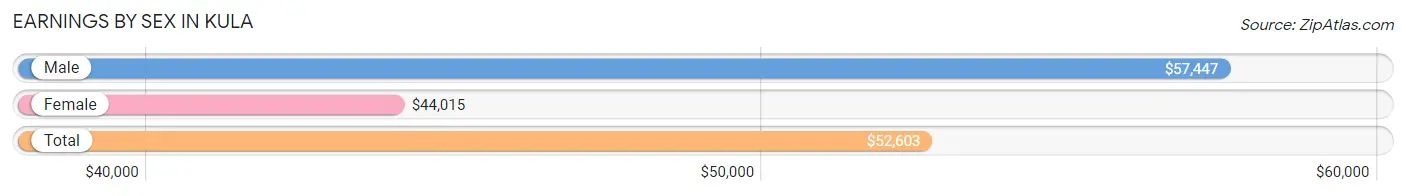
Earnings by Sex in Kula
Average Earnings in Kula are $52,603, $57,447 for men and $44,015 for women, a difference of 23.4%.
| Sex | Number | Average Earnings |
| Male | 1,446 (45.0%) | $57,447 |
| Female | 1,768 (55.0%) | $44,015 |
| Total | 3,214 (100.0%) | $52,603 |
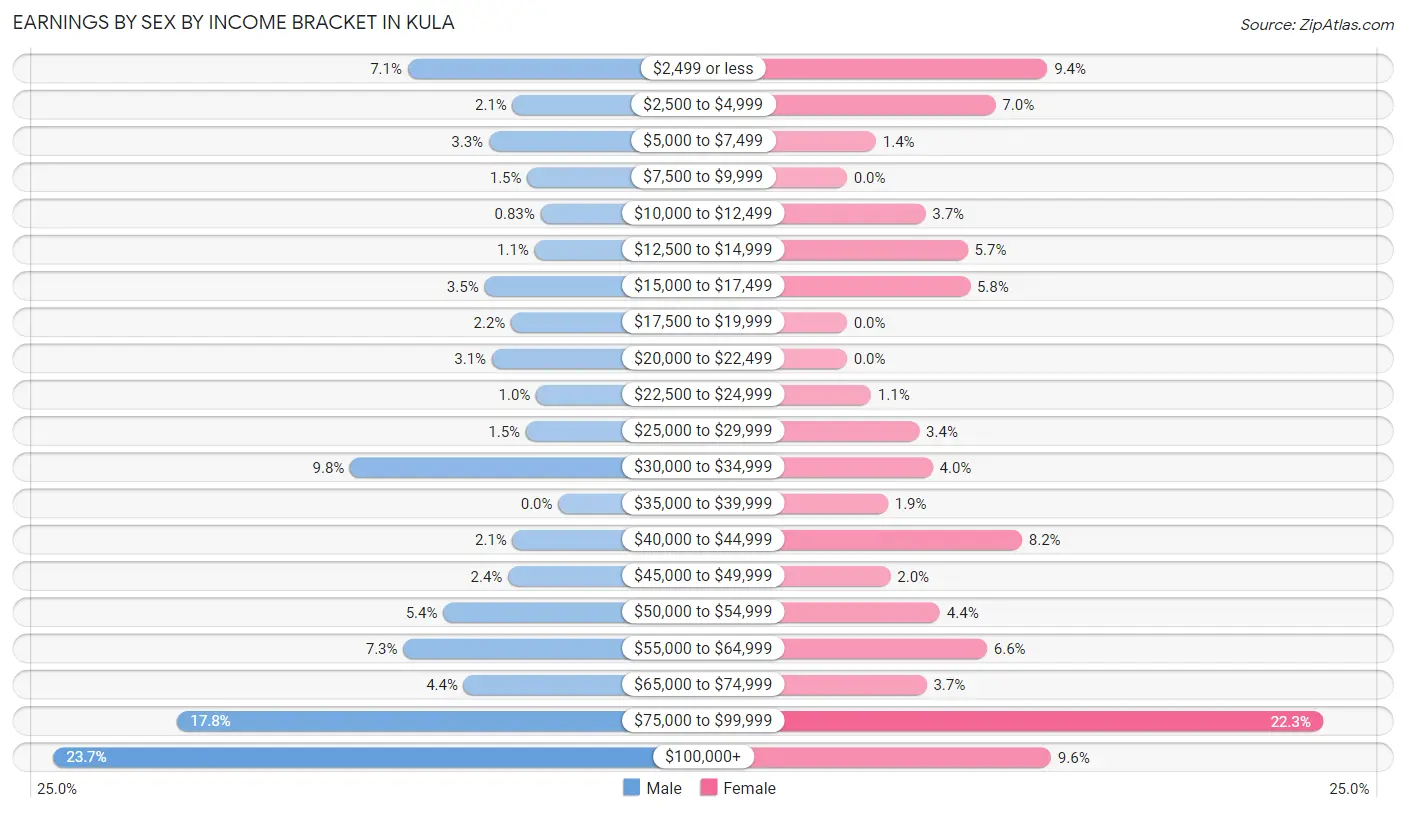
Earnings by Sex by Income Bracket in Kula
The most common earnings brackets in Kula are $100,000+ for men (342 | 23.6%) and $75,000 to $99,999 for women (394 | 22.3%).
| Income | Male | Female |
| $2,499 or less | 102 (7.0%) | 166 (9.4%) |
| $2,500 to $4,999 | 31 (2.1%) | 123 (7.0%) |
| $5,000 to $7,499 | 47 (3.3%) | 24 (1.4%) |
| $7,500 to $9,999 | 21 (1.5%) | 0 (0.0%) |
| $10,000 to $12,499 | 12 (0.8%) | 65 (3.7%) |
| $12,500 to $14,999 | 16 (1.1%) | 100 (5.7%) |
| $15,000 to $17,499 | 50 (3.5%) | 102 (5.8%) |
| $17,500 to $19,999 | 32 (2.2%) | 0 (0.0%) |
| $20,000 to $22,499 | 45 (3.1%) | 0 (0.0%) |
| $22,500 to $24,999 | 15 (1.0%) | 20 (1.1%) |
| $25,000 to $29,999 | 22 (1.5%) | 60 (3.4%) |
| $30,000 to $34,999 | 141 (9.8%) | 71 (4.0%) |
| $35,000 to $39,999 | 0 (0.0%) | 34 (1.9%) |
| $40,000 to $44,999 | 31 (2.1%) | 145 (8.2%) |
| $45,000 to $49,999 | 34 (2.4%) | 36 (2.0%) |
| $50,000 to $54,999 | 78 (5.4%) | 77 (4.4%) |
| $55,000 to $64,999 | 105 (7.3%) | 116 (6.6%) |
| $65,000 to $74,999 | 64 (4.4%) | 66 (3.7%) |
| $75,000 to $99,999 | 258 (17.8%) | 394 (22.3%) |
| $100,000+ | 342 (23.6%) | 169 (9.6%) |
| Total | 1,446 (100.0%) | 1,768 (100.0%) |
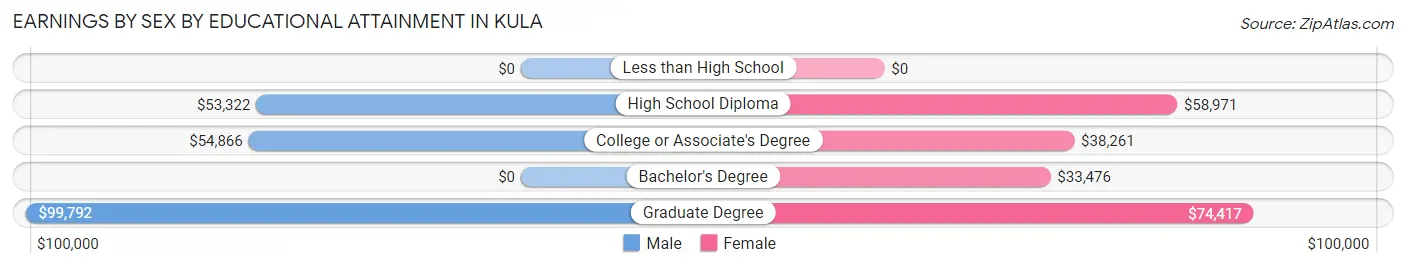
Earnings by Sex by Educational Attainment in Kula
Average earnings in Kula are $63,276 for men and $45,300 for women, a difference of 28.4%. Men with an educational attainment of graduate degree enjoy the highest average annual earnings of $99,792, while those with high school diploma education earn the least with $53,322. Women with an educational attainment of graduate degree earn the most with the average annual earnings of $74,417, while those with bachelor's degree education have the smallest earnings of $33,476.
| Educational Attainment | Male Income | Female Income |
| Less than High School | - | - |
| High School Diploma | $53,322 | $58,971 |
| College or Associate's Degree | $54,866 | $38,261 |
| Bachelor's Degree | - | - |
| Graduate Degree | $99,792 | $74,417 |
| Total | $63,276 | $45,300 |
Family Income in Kula
Family Income Brackets in Kula
According to the Kula family income data, there are 445 families falling into the $200,000+ income range, which is the most common income bracket and makes up 25.4% of all families. Conversely, the less than $10,000 income bracket is the least frequent group with only 23 families (1.3%) belonging to this category.
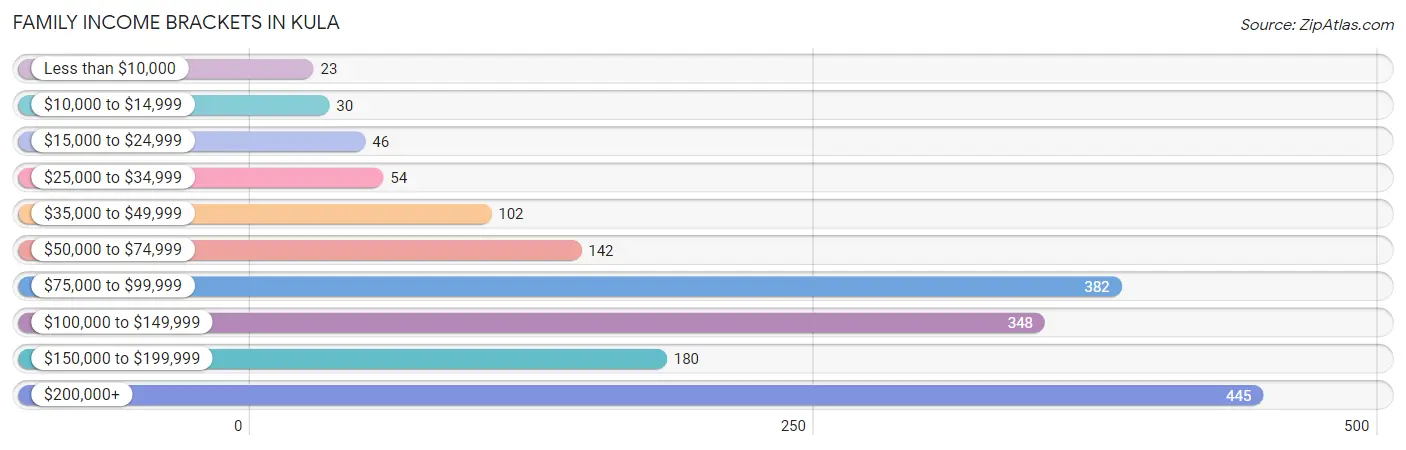
| Income Bracket | # Families | % Families |
| Less than $10,000 | 23 | 1.3% |
| $10,000 to $14,999 | 30 | 1.7% |
| $15,000 to $24,999 | 46 | 2.6% |
| $25,000 to $34,999 | 54 | 3.1% |
| $35,000 to $49,999 | 102 | 5.8% |
| $50,000 to $74,999 | 142 | 8.1% |
| $75,000 to $99,999 | 382 | 21.8% |
| $100,000 to $149,999 | 348 | 19.9% |
| $150,000 to $199,999 | 180 | 10.3% |
| $200,000+ | 445 | 25.4% |
Family Income by Famaliy Size in Kula
4-person families (170 | 9.7%) account for the highest median family income in Kula with $250,001 per family, while 4-person families (170 | 9.7%) have the highest median income of $62,500 per family member.
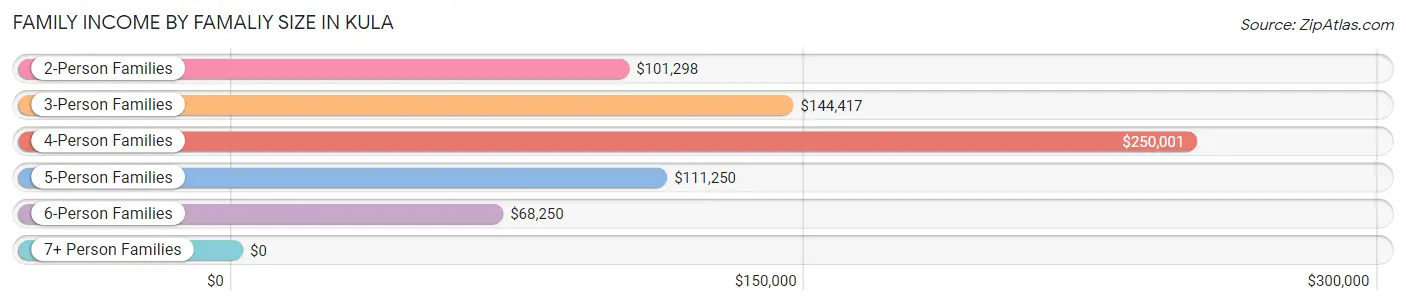
| Income Bracket | # Families | Median Income |
| 2-Person Families | 913 (52.1%) | $101,298 |
| 3-Person Families | 397 (22.7%) | $144,417 |
| 4-Person Families | 170 (9.7%) | $250,001 |
| 5-Person Families | 146 (8.3%) | $111,250 |
| 6-Person Families | 103 (5.9%) | $68,250 |
| 7+ Person Families | 22 (1.3%) | $0 |
| Total | 1,751 (100.0%) | $109,325 |
Family Income by Number of Earners in Kula
The median family income in Kula is $109,325, with families comprising 3+ earners (124) having the highest median family income of $220,909, while families with no earners (369) have the lowest median family income of $84,009, accounting for 7.1% and 21.1% of families, respectively.
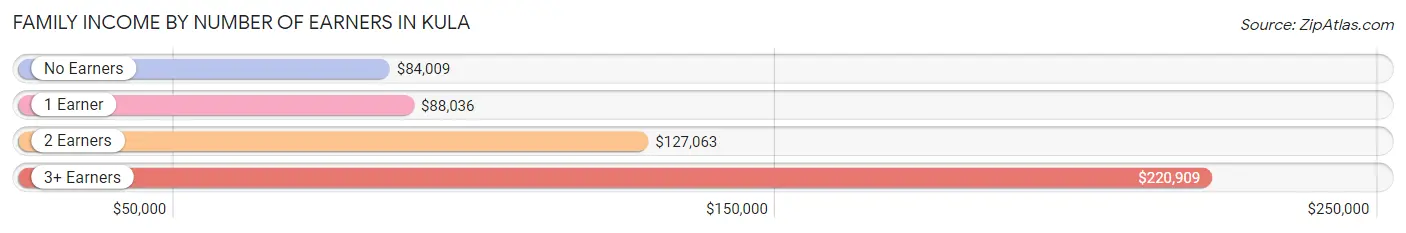
| Number of Earners | # Families | Median Income |
| No Earners | 369 (21.1%) | $84,009 |
| 1 Earner | 562 (32.1%) | $88,036 |
| 2 Earners | 696 (39.8%) | $127,063 |
| 3+ Earners | 124 (7.1%) | $220,909 |
| Total | 1,751 (100.0%) | $109,325 |
Household Income in Kula
Household Income Brackets in Kula
With 603 households falling in the category, the $200,000+ income range is the most frequent in Kula, accounting for 24.3% of all households. In contrast, only 87 households (3.5%) fall into the $10,000 to $14,999 income bracket, making it the least populous group.
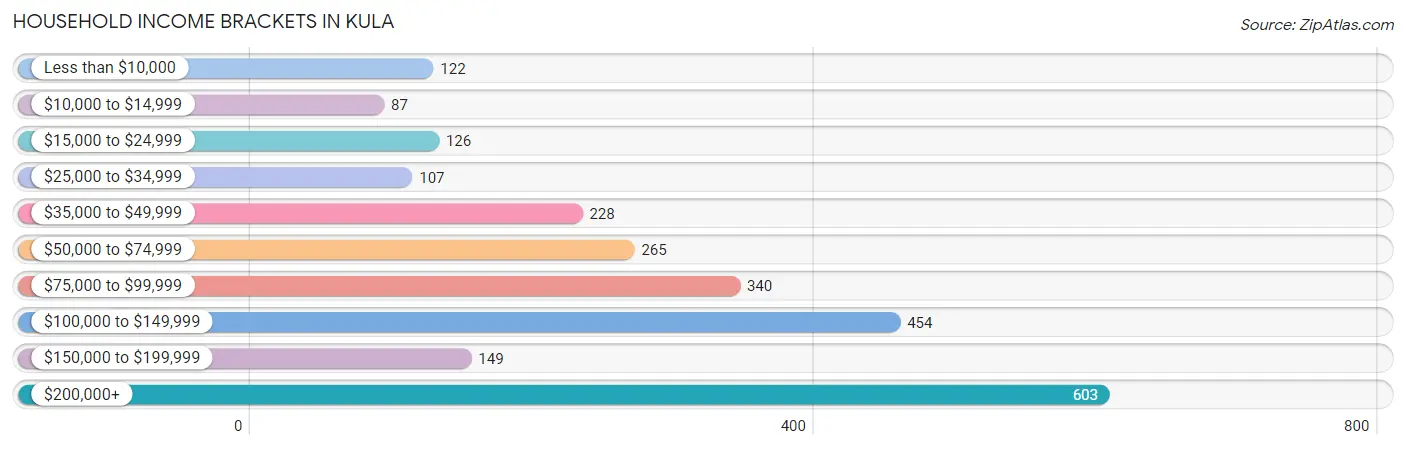
| Income Bracket | # Households | % Households |
| Less than $10,000 | 122 | 4.9% |
| $10,000 to $14,999 | 87 | 3.5% |
| $15,000 to $24,999 | 126 | 5.1% |
| $25,000 to $34,999 | 107 | 4.3% |
| $35,000 to $49,999 | 228 | 9.2% |
| $50,000 to $74,999 | 265 | 10.7% |
| $75,000 to $99,999 | 340 | 13.7% |
| $100,000 to $149,999 | 454 | 18.3% |
| $150,000 to $199,999 | 149 | 6.0% |
| $200,000+ | 603 | 24.3% |
Household Income by Householder Age in Kula
The median household income in Kula is $93,452, with the highest median household income of $108,125 found in the 45 to 64 years age bracket for the primary householder. A total of 918 households (37.0%) fall into this category.
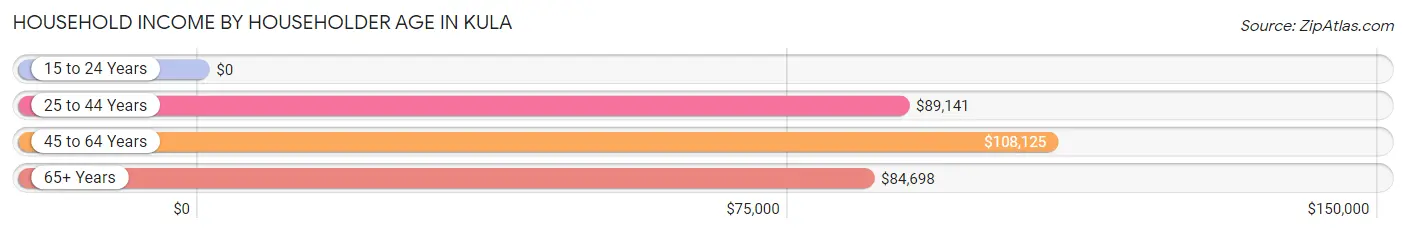
| Income Bracket | # Households | Median Income |
| 15 to 24 Years | 0 (0.0%) | $0 |
| 25 to 44 Years | 605 (24.4%) | $89,141 |
| 45 to 64 Years | 918 (37.0%) | $108,125 |
| 65+ Years | 957 (38.6%) | $84,698 |
| Total | 2,480 (100.0%) | $93,452 |
Poverty in Kula
Income Below Poverty by Sex and Age in Kula
With 10.0% poverty level for males and 12.4% for females among the residents of Kula, 25 to 34 year old males and 55 to 64 year old females are the most vulnerable to poverty, with 59 males (30.4%) and 131 females (19.5%) in their respective age groups living below the poverty level.
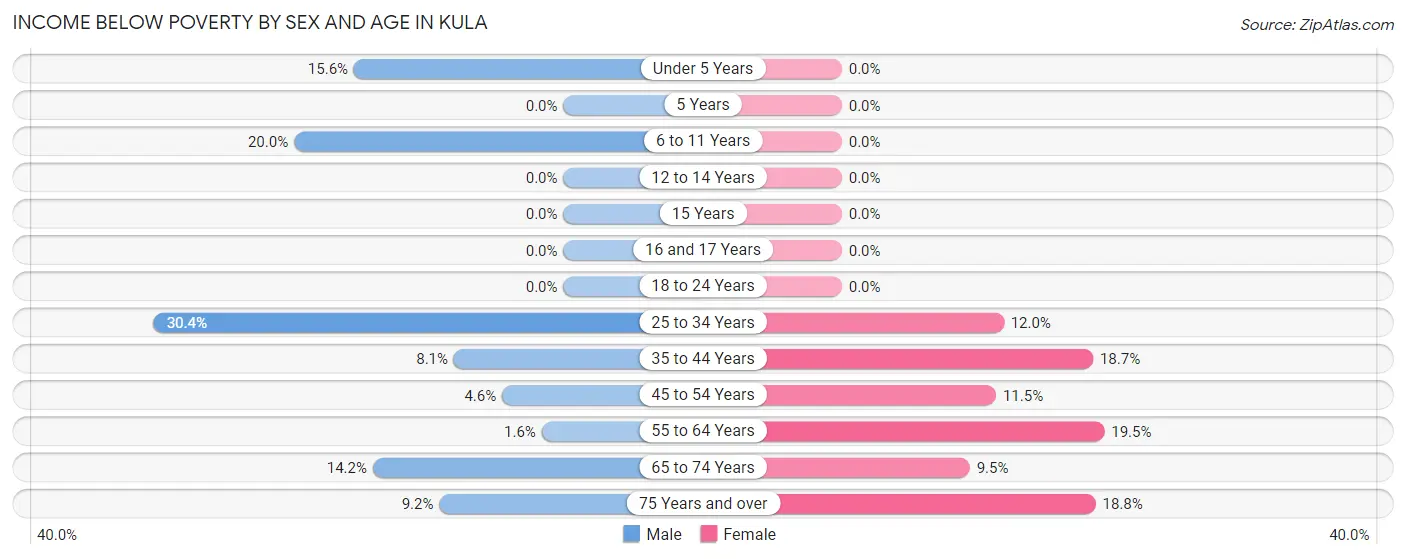
| Age Bracket | Male | Female |
| Under 5 Years | 37 (15.5%) | 0 (0.0%) |
| 5 Years | 0 (0.0%) | 0 (0.0%) |
| 6 to 11 Years | 60 (20.0%) | 0 (0.0%) |
| 12 to 14 Years | 0 (0.0%) | 0 (0.0%) |
| 15 Years | 0 (0.0%) | 0 (0.0%) |
| 16 and 17 Years | 0 (0.0%) | 0 (0.0%) |
| 18 to 24 Years | 0 (0.0%) | 0 (0.0%) |
| 25 to 34 Years | 59 (30.4%) | 41 (12.0%) |
| 35 to 44 Years | 30 (8.1%) | 91 (18.6%) |
| 45 to 54 Years | 21 (4.5%) | 41 (11.5%) |
| 55 to 64 Years | 8 (1.6%) | 131 (19.5%) |
| 65 to 74 Years | 72 (14.1%) | 55 (9.5%) |
| 75 Years and over | 22 (9.2%) | 65 (18.8%) |
| Total | 309 (10.0%) | 424 (12.4%) |
Income Above Poverty by Sex and Age in Kula
According to the poverty statistics in Kula, males aged 5 years and females aged under 5 years are the age groups that are most secure financially, with 100.0% of males and 100.0% of females in these age groups living above the poverty line.
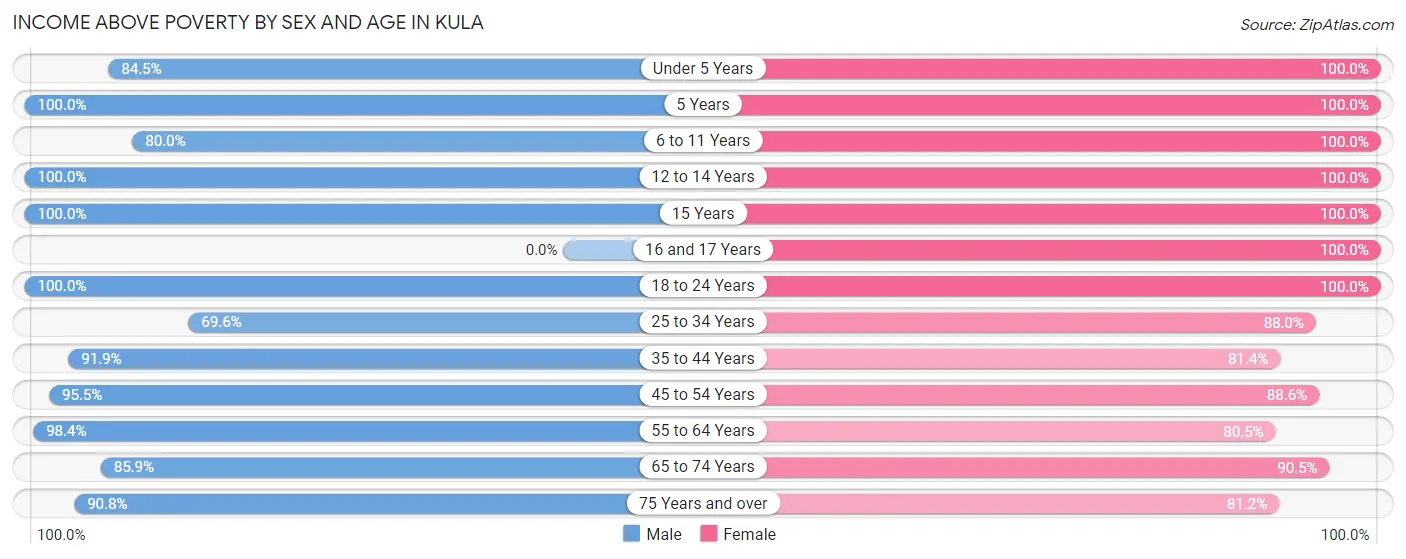
| Age Bracket | Male | Female |
| Under 5 Years | 201 (84.5%) | 34 (100.0%) |
| 5 Years | 22 (100.0%) | 68 (100.0%) |
| 6 to 11 Years | 240 (80.0%) | 310 (100.0%) |
| 12 to 14 Years | 95 (100.0%) | 103 (100.0%) |
| 15 Years | 70 (100.0%) | 55 (100.0%) |
| 16 and 17 Years | 0 (0.0%) | 11 (100.0%) |
| 18 to 24 Years | 112 (100.0%) | 58 (100.0%) |
| 25 to 34 Years | 135 (69.6%) | 300 (88.0%) |
| 35 to 44 Years | 339 (91.9%) | 397 (81.4%) |
| 45 to 54 Years | 441 (95.5%) | 317 (88.5%) |
| 55 to 64 Years | 489 (98.4%) | 541 (80.5%) |
| 65 to 74 Years | 437 (85.9%) | 524 (90.5%) |
| 75 Years and over | 217 (90.8%) | 280 (81.2%) |
| Total | 2,798 (90.0%) | 2,998 (87.6%) |
Income Below Poverty Among Married-Couple Families in Kula
The poverty statistics for married-couple families in Kula show that 3.1% or 46 of the total 1,463 families live below the poverty line. Families with no children have the highest poverty rate of 5.1%, comprising of 46 families. On the other hand, families with 1 or 2 children have the lowest poverty rate of 0.0%, which includes 0 families.
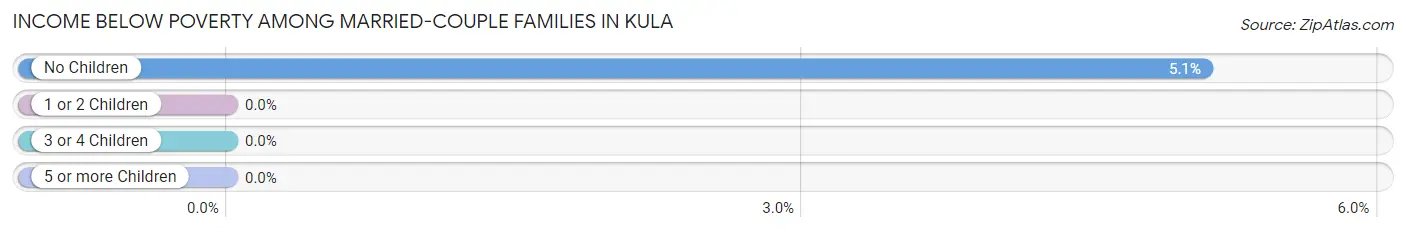
| Children | Above Poverty | Below Poverty |
| No Children | 858 (94.9%) | 46 (5.1%) |
| 1 or 2 Children | 431 (100.0%) | 0 (0.0%) |
| 3 or 4 Children | 128 (100.0%) | 0 (0.0%) |
| 5 or more Children | 0 (0.0%) | 0 (0.0%) |
| Total | 1,417 (96.9%) | 46 (3.1%) |
Income Below Poverty Among Single-Parent Households in Kula
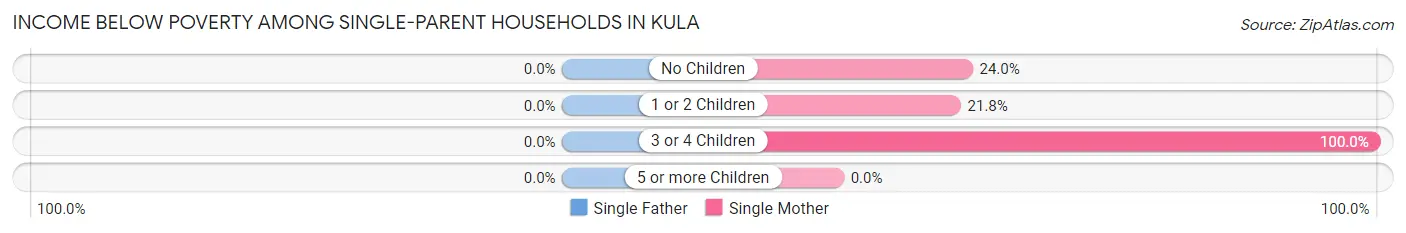
| Children | Single Father | Single Mother |
| No Children | 0 (0.0%) | 30 (24.0%) |
| 1 or 2 Children | 0 (0.0%) | 22 (21.8%) |
| 3 or 4 Children | 0 (0.0%) | 41 (100.0%) |
| 5 or more Children | 0 (0.0%) | 0 (0.0%) |
| Total | 0 (0.0%) | 93 (34.8%) |
Income Below Poverty Among Married-Couple vs Single-Parent Households in Kula
The poverty data for Kula shows that 46 of the married-couple family households (3.1%) and 93 of the single-parent households (32.3%) are living below the poverty level. Within the married-couple family households, those with no children have the highest poverty rate, with 46 households (5.1%) falling below the poverty line. Among the single-parent households, those with 3 or 4 children have the highest poverty rate, with 41 household (100.0%) living below poverty.
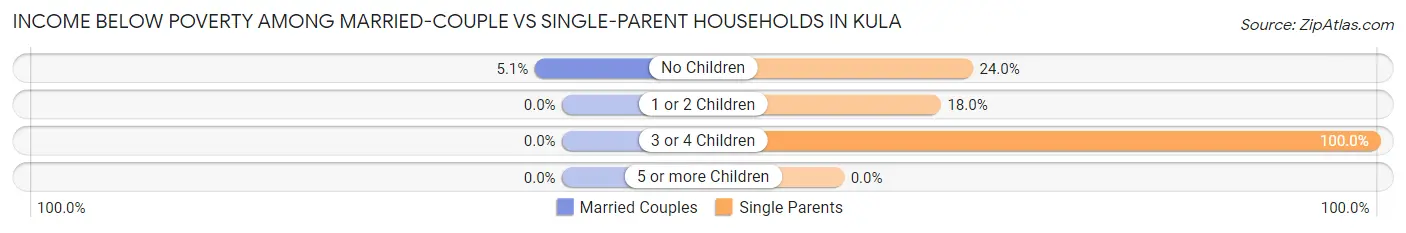
| Children | Married-Couple Families | Single-Parent Households |
| No Children | 46 (5.1%) | 30 (24.0%) |
| 1 or 2 Children | 0 (0.0%) | 22 (18.0%) |
| 3 or 4 Children | 0 (0.0%) | 41 (100.0%) |
| 5 or more Children | 0 (0.0%) | 0 (0.0%) |
| Total | 46 (3.1%) | 93 (32.3%) |
Race in Kula
The most populous races in Kula are White / Caucasian (3,634 | 55.2%), Asian (1,306 | 19.9%), and Two or more Races (922 | 14.0%).
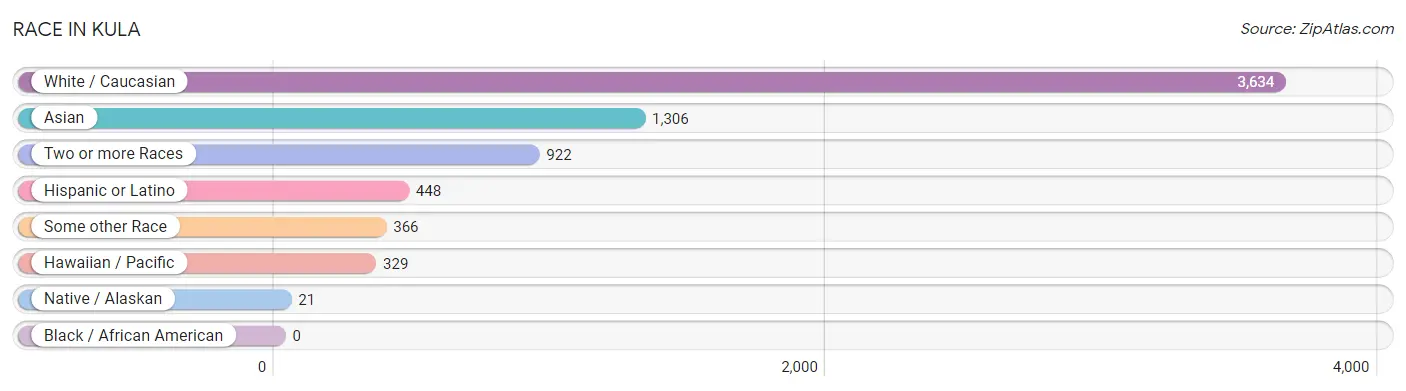
| Race | # Population | % Population |
| Asian | 1,306 | 19.9% |
| Black / African American | 0 | 0.0% |
| Hawaiian / Pacific | 329 | 5.0% |
| Hispanic or Latino | 448 | 6.8% |
| Native / Alaskan | 21 | 0.3% |
| White / Caucasian | 3,634 | 55.2% |
| Two or more Races | 922 | 14.0% |
| Some other Race | 366 | 5.6% |
| Total | 6,578 | 100.0% |
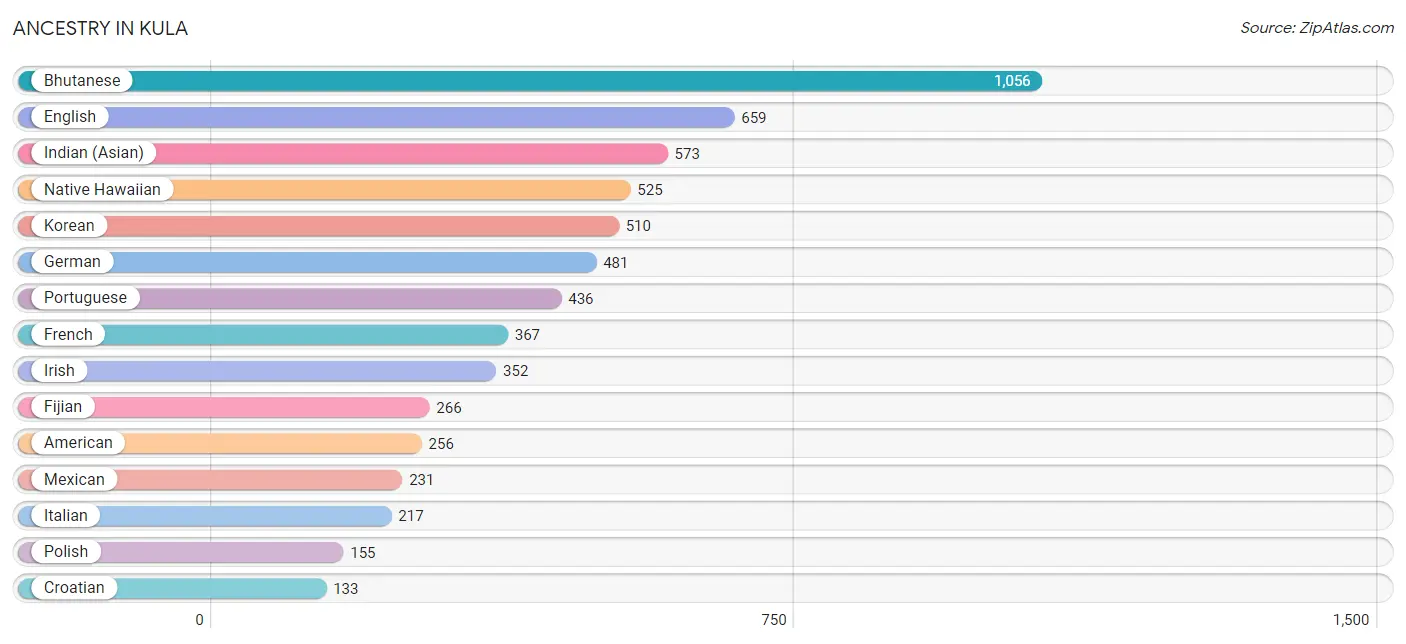
Ancestry in Kula
The most populous ancestries reported in Kula are Bhutanese (1,056 | 16.1%), English (659 | 10.0%), Indian (Asian) (573 | 8.7%), Native Hawaiian (525 | 8.0%), and Korean (510 | 7.7%), together accounting for 50.5% of all Kula residents.
| Ancestry | # Population | % Population |
| American | 256 | 3.9% |
| Austrian | 22 | 0.3% |
| Bangladeshi | 15 | 0.2% |
| Belgian | 11 | 0.2% |
| Bhutanese | 1,056 | 16.1% |
| British | 14 | 0.2% |
| Burmese | 112 | 1.7% |
| Cherokee | 15 | 0.2% |
| Chickasaw | 28 | 0.4% |
| Colombian | 18 | 0.3% |
| Croatian | 133 | 2.0% |
| Dutch | 58 | 0.9% |
| English | 659 | 10.0% |
| European | 96 | 1.5% |
| Fijian | 266 | 4.0% |
| Finnish | 7 | 0.1% |
| French | 367 | 5.6% |
| German | 481 | 7.3% |
| Greek | 22 | 0.3% |
| Hungarian | 14 | 0.2% |
| Indian (Asian) | 573 | 8.7% |
| Irish | 352 | 5.3% |
| Italian | 217 | 3.3% |
| Korean | 510 | 7.7% |
| Mexican | 231 | 3.5% |
| Native Hawaiian | 525 | 8.0% |
| Norwegian | 108 | 1.6% |
| Peruvian | 25 | 0.4% |
| Polish | 155 | 2.4% |
| Portuguese | 436 | 6.6% |
| Puerto Rican | 91 | 1.4% |
| Russian | 30 | 0.5% |
| Scandinavian | 15 | 0.2% |
| Scotch-Irish | 22 | 0.3% |
| Scottish | 67 | 1.0% |
| Serbian | 70 | 1.1% |
| South American | 43 | 0.6% |
| Spaniard | 54 | 0.8% |
| Spanish | 18 | 0.3% |
| Sri Lankan | 69 | 1.1% |
| Swedish | 101 | 1.5% |
| Swiss | 31 | 0.5% |
| Ukrainian | 15 | 0.2% |
| Welsh | 30 | 0.5% | View All 44 Rows |
Immigrants in Kula
The most numerous immigrant groups reported in Kula came from Asia (270 | 4.1%), Oceania (236 | 3.6%), South Eastern Asia (175 | 2.7%), Europe (169 | 2.6%), and Micronesia (153 | 2.3%), together accounting for 15.2% of all Kula residents.
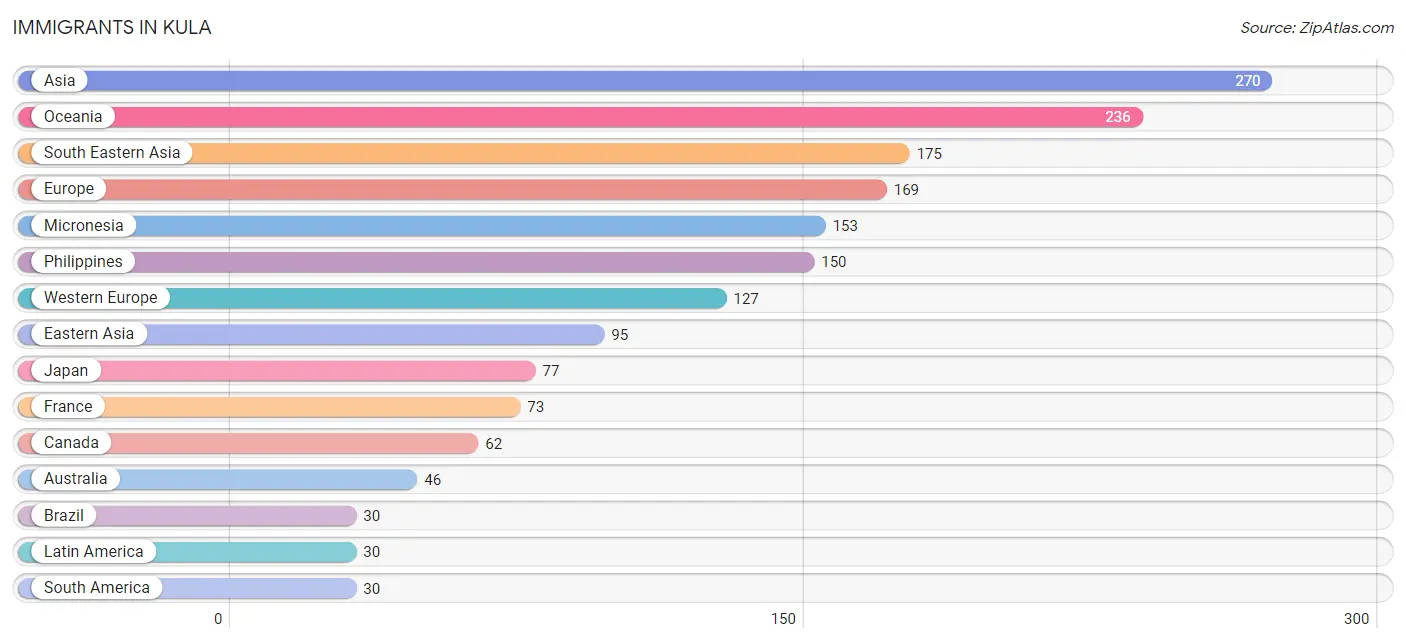
| Immigration Origin | # Population | % Population |
| Asia | 270 | 4.1% |
| Australia | 46 | 0.7% |
| Austria | 7 | 0.1% |
| Brazil | 30 | 0.5% |
| Canada | 62 | 0.9% |
| China | 5 | 0.1% |
| Eastern Asia | 95 | 1.4% |
| Europe | 169 | 2.6% |
| France | 73 | 1.1% |
| Germany | 29 | 0.4% |
| Hong Kong | 5 | 0.1% |
| Italy | 22 | 0.3% |
| Japan | 77 | 1.2% |
| Korea | 13 | 0.2% |
| Laos | 15 | 0.2% |
| Latin America | 30 | 0.5% |
| Malaysia | 10 | 0.2% |
| Micronesia | 153 | 2.3% |
| Northern Europe | 20 | 0.3% |
| Oceania | 236 | 3.6% |
| Philippines | 150 | 2.3% |
| South America | 30 | 0.5% |
| South Eastern Asia | 175 | 2.7% |
| Southern Europe | 22 | 0.3% |
| Switzerland | 18 | 0.3% |
| Western Europe | 127 | 1.9% | View All 26 Rows |
Sex and Age in Kula
Sex and Age in Kula
The most populous age groups in Kula are 65 to 69 Years (273 | 8.6%) for men and 65 to 69 Years (393 | 11.5%) for women.
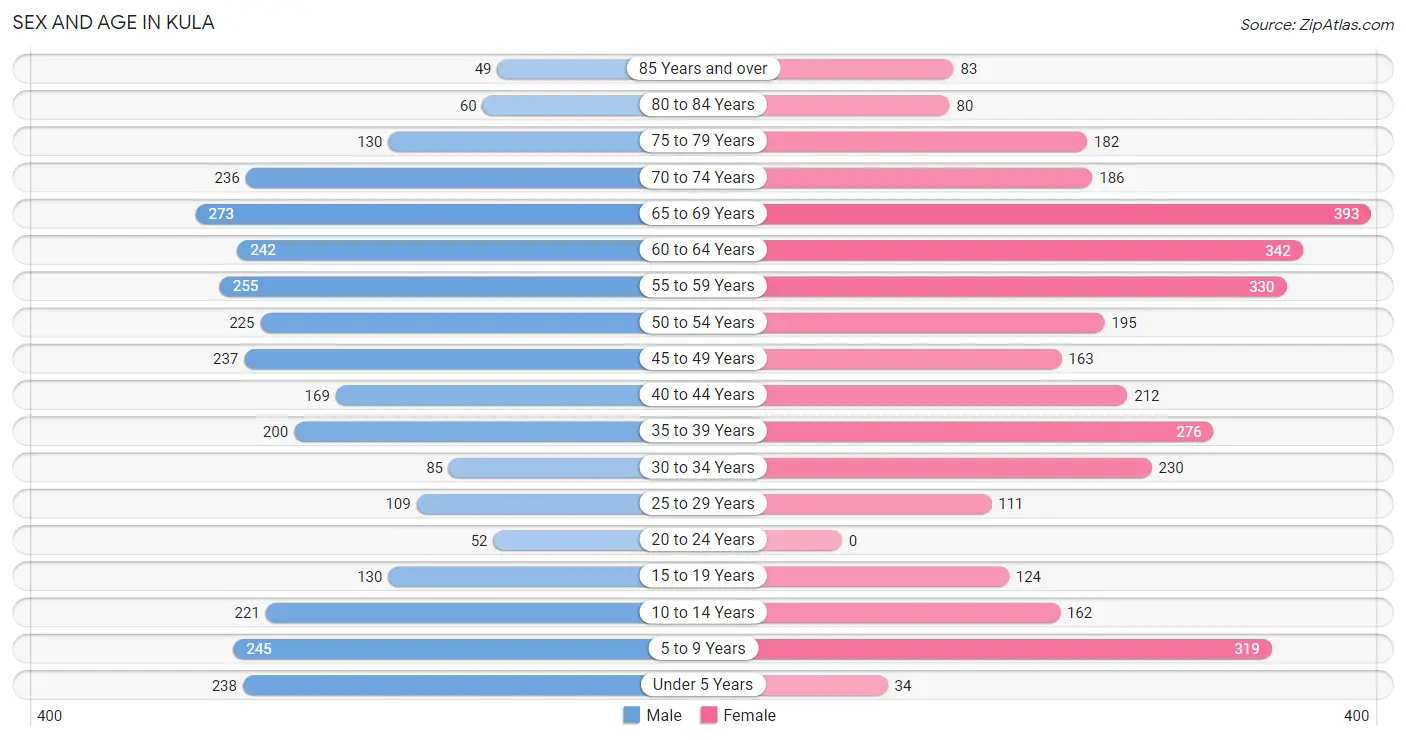
| Age Bracket | Male | Female |
| Under 5 Years | 238 (7.5%) | 34 (1.0%) |
| 5 to 9 Years | 245 (7.8%) | 319 (9.3%) |
| 10 to 14 Years | 221 (7.0%) | 162 (4.7%) |
| 15 to 19 Years | 130 (4.1%) | 124 (3.6%) |
| 20 to 24 Years | 52 (1.7%) | 0 (0.0%) |
| 25 to 29 Years | 109 (3.5%) | 111 (3.2%) |
| 30 to 34 Years | 85 (2.7%) | 230 (6.7%) |
| 35 to 39 Years | 200 (6.3%) | 276 (8.1%) |
| 40 to 44 Years | 169 (5.3%) | 212 (6.2%) |
| 45 to 49 Years | 237 (7.5%) | 163 (4.8%) |
| 50 to 54 Years | 225 (7.1%) | 195 (5.7%) |
| 55 to 59 Years | 255 (8.1%) | 330 (9.6%) |
| 60 to 64 Years | 242 (7.7%) | 342 (10.0%) |
| 65 to 69 Years | 273 (8.6%) | 393 (11.5%) |
| 70 to 74 Years | 236 (7.5%) | 186 (5.4%) |
| 75 to 79 Years | 130 (4.1%) | 182 (5.3%) |
| 80 to 84 Years | 60 (1.9%) | 80 (2.3%) |
| 85 Years and over | 49 (1.5%) | 83 (2.4%) |
| Total | 3,156 (100.0%) | 3,422 (100.0%) |
Families and Households in Kula
Median Family Size in Kula
The median family size in Kula is 3.00 persons per family, with married-couple families (1,463 | 83.6%) accounting for the largest median family size of 3.08 persons per family. On the other hand, single female/mother families (267 | 15.2%) represent the smallest median family size with 2.58 persons per family.
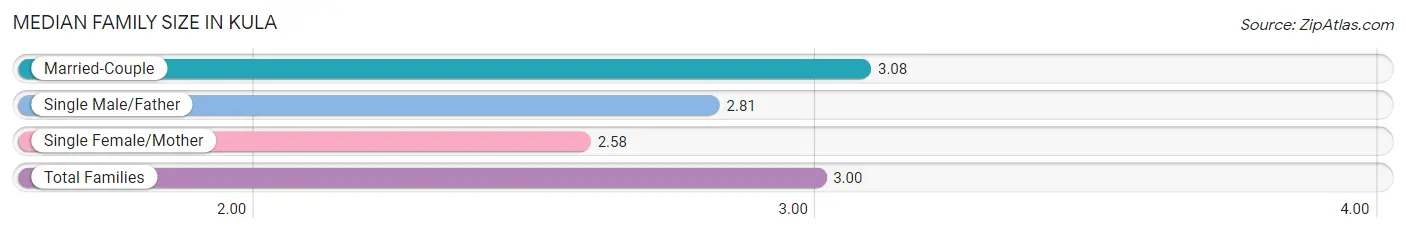
| Family Type | # Families | Family Size |
| Married-Couple | 1,463 (83.6%) | 3.08 |
| Single Male/Father | 21 (1.2%) | 2.81 |
| Single Female/Mother | 267 (15.2%) | 2.58 |
| Total Families | 1,751 (100.0%) | 3.00 |
Median Household Size in Kula
The median household size in Kula is 2.64 persons per household, with single female/mother households (267 | 10.8%) accounting for the largest median household size of 3.3 persons per household. non-family households (729 | 29.4%) represent the smallest median household size with 1.37 persons per household.
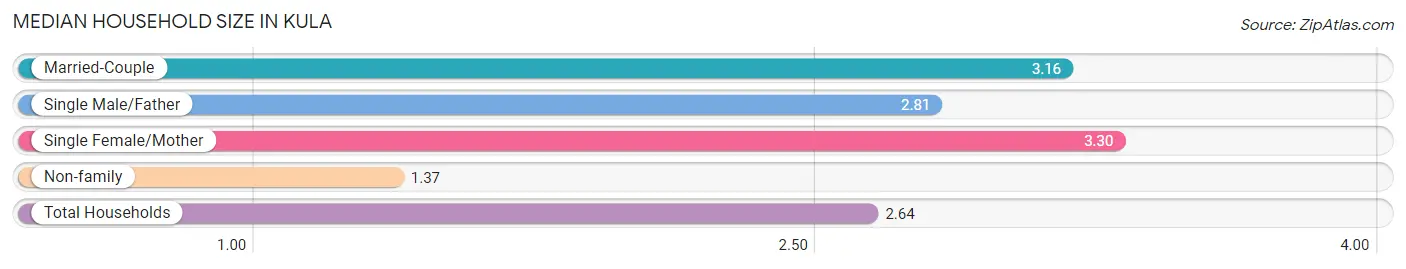
| Household Type | # Households | Household Size |
| Married-Couple | 1,463 (59.0%) | 3.16 |
| Single Male/Father | 21 (0.9%) | 2.81 |
| Single Female/Mother | 267 (10.8%) | 3.30 |
| Non-family | 729 (29.4%) | 1.37 |
| Total Households | 2,480 (100.0%) | 2.64 |
Household Size by Marriage Status in Kula
Out of a total of 2,480 households in Kula, 1,751 (70.6%) are family households, while 729 (29.4%) are nonfamily households. The most numerous type of family households are 2-person households, comprising 820, and the most common type of nonfamily households are 1-person households, comprising 581.
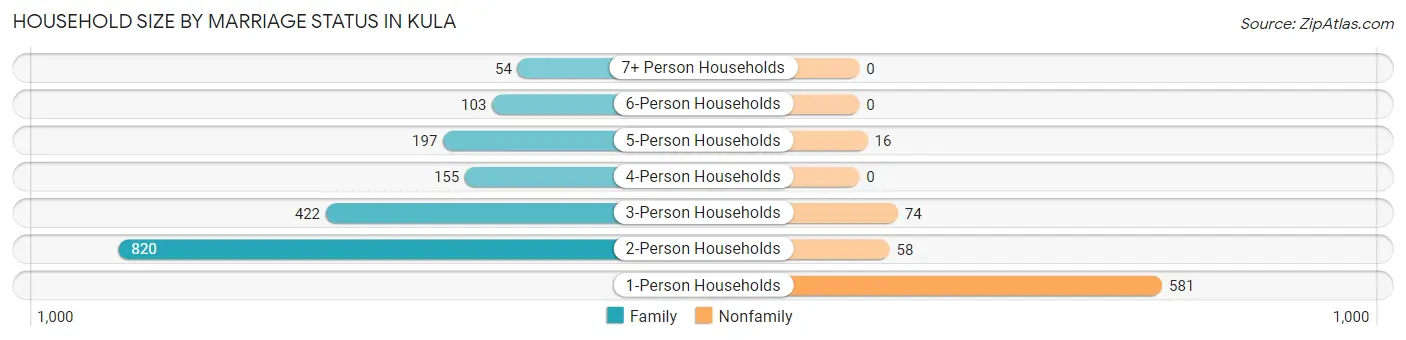
| Household Size | Family Households | Nonfamily Households |
| 1-Person Households | - | 581 (23.4%) |
| 2-Person Households | 820 (33.1%) | 58 (2.3%) |
| 3-Person Households | 422 (17.0%) | 74 (3.0%) |
| 4-Person Households | 155 (6.2%) | 0 (0.0%) |
| 5-Person Households | 197 (7.9%) | 16 (0.6%) |
| 6-Person Households | 103 (4.2%) | 0 (0.0%) |
| 7+ Person Households | 54 (2.2%) | 0 (0.0%) |
| Total | 1,751 (70.6%) | 729 (29.4%) |
Female Fertility in Kula
Fertility by Age in Kula
Average fertility rate in Kula is 75.0 births per 1,000 women. Women in the age bracket of 20 to 34 years have the highest fertility rate with 238.0 births per 1,000 women. Women in the age bracket of 20 to 34 years acount for 92.0% of all women with births.
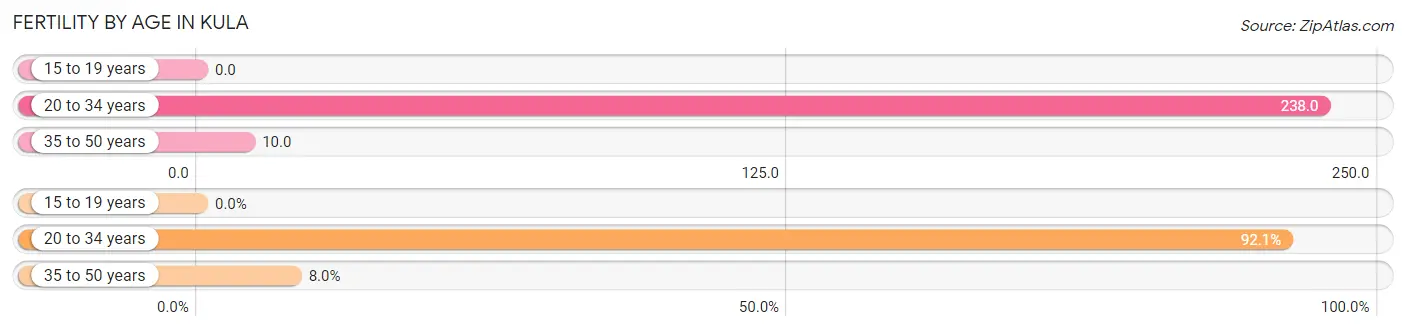
| Age Bracket | Women with Births | Births / 1,000 Women |
| 15 to 19 years | 0 (0.0%) | 0.0 |
| 20 to 34 years | 81 (92.0%) | 238.0 |
| 35 to 50 years | 7 (8.0%) | 10.0 |
| Total | 88 (100.0%) | 75.0 |
Fertility by Age by Marriage Status in Kula
53.4% of women with births (88) in Kula are married. The highest percentage of unmarried women with births falls into 20 to 34 years age bracket with 50.6% of them unmarried at the time of birth, while the lowest percentage of unmarried women with births belong to 35 to 50 years age bracket with 0.0% of them unmarried.
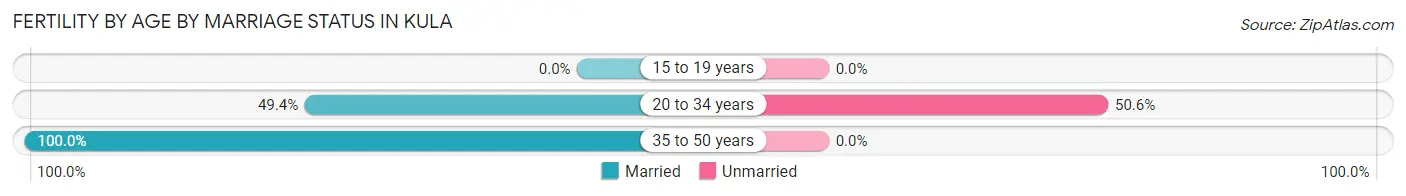
| Age Bracket | Married | Unmarried |
| 15 to 19 years | 0 (0.0%) | 0 (0.0%) |
| 20 to 34 years | 40 (49.4%) | 41 (50.6%) |
| 35 to 50 years | 7 (100.0%) | 0 (0.0%) |
| Total | 47 (53.4%) | 41 (46.6%) |
Fertility by Education in Kula
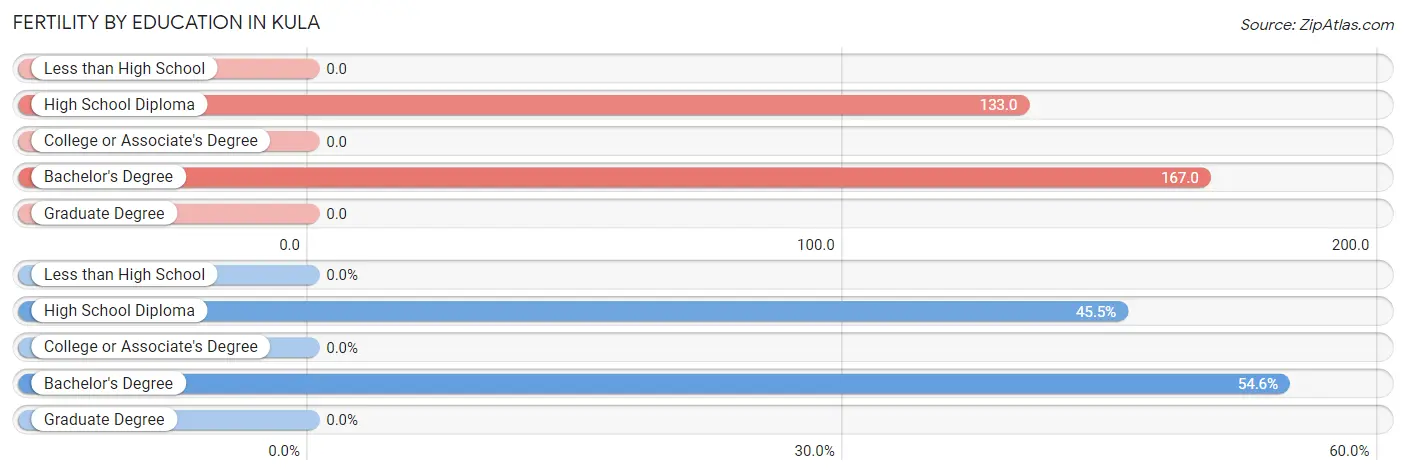
| Educational Attainment | Women with Births | Births / 1,000 Women |
| Less than High School | 0 (0.0%) | 0.0 |
| High School Diploma | 40 (45.5%) | 133.0 |
| College or Associate's Degree | 0 (0.0%) | 0.0 |
| Bachelor's Degree | 48 (54.5%) | 167.0 |
| Graduate Degree | 0 (0.0%) | 0.0 |
| Total | 88 (100.0%) | 75.0 |
Fertility by Education by Marriage Status in Kula
46.6% of women with births in Kula are unmarried. Women with the educational attainment of high school diploma are most likely to be married with 100.0% of them married at childbirth, while women with the educational attainment of bachelor's degree are least likely to be married with 85.4% of them unmarried at childbirth.
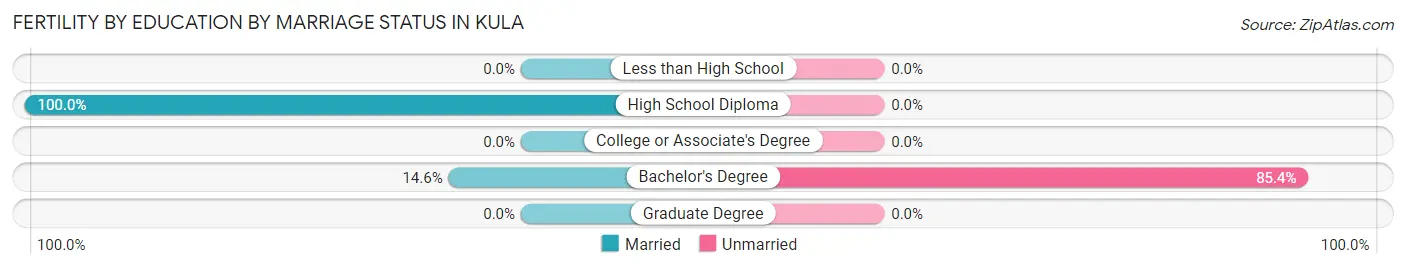
| Educational Attainment | Married | Unmarried |
| Less than High School | 0 (0.0%) | 0 (0.0%) |
| High School Diploma | 40 (100.0%) | 0 (0.0%) |
| College or Associate's Degree | 0 (0.0%) | 0 (0.0%) |
| Bachelor's Degree | 7 (14.6%) | 41 (85.4%) |
| Graduate Degree | 0 (0.0%) | 0 (0.0%) |
| Total | 47 (53.4%) | 41 (46.6%) |
Employment Characteristics in Kula
Employment by Class of Employer in Kula
Among the 2,746 employed individuals in Kula, private company employees (1,271 | 46.3%), self-employed (not incorporated) (399 | 14.5%), and self-employed (incorporated) (326 | 11.9%) make up the most common classes of employment.
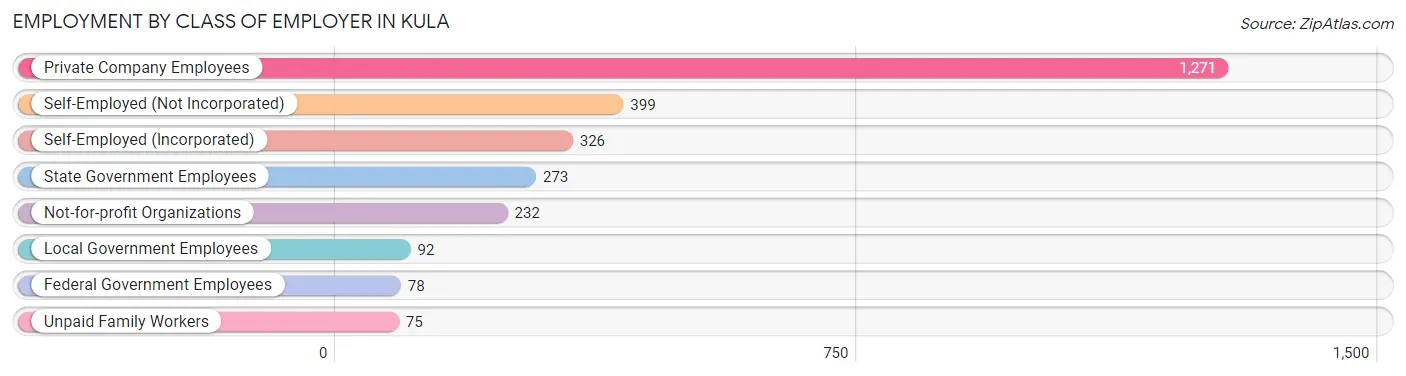
| Employer Class | # Employees | % Employees |
| Private Company Employees | 1,271 | 46.3% |
| Self-Employed (Incorporated) | 326 | 11.9% |
| Self-Employed (Not Incorporated) | 399 | 14.5% |
| Not-for-profit Organizations | 232 | 8.5% |
| Local Government Employees | 92 | 3.4% |
| State Government Employees | 273 | 9.9% |
| Federal Government Employees | 78 | 2.8% |
| Unpaid Family Workers | 75 | 2.7% |
| Total | 2,746 | 100.0% |
Employment Status by Age in Kula
According to the labor force statistics for Kula, out of the total population over 16 years of age (5,234), 56.5% or 2,957 individuals are in the labor force, with 4.0% or 118 of them unemployed. The age group with the highest labor force participation rate is 30 to 34 years, with 97.1% or 306 individuals in the labor force. Within the labor force, the 55 to 59 years age range has the highest percentage of unemployed individuals, with 10.6% or 38 of them being unemployed.
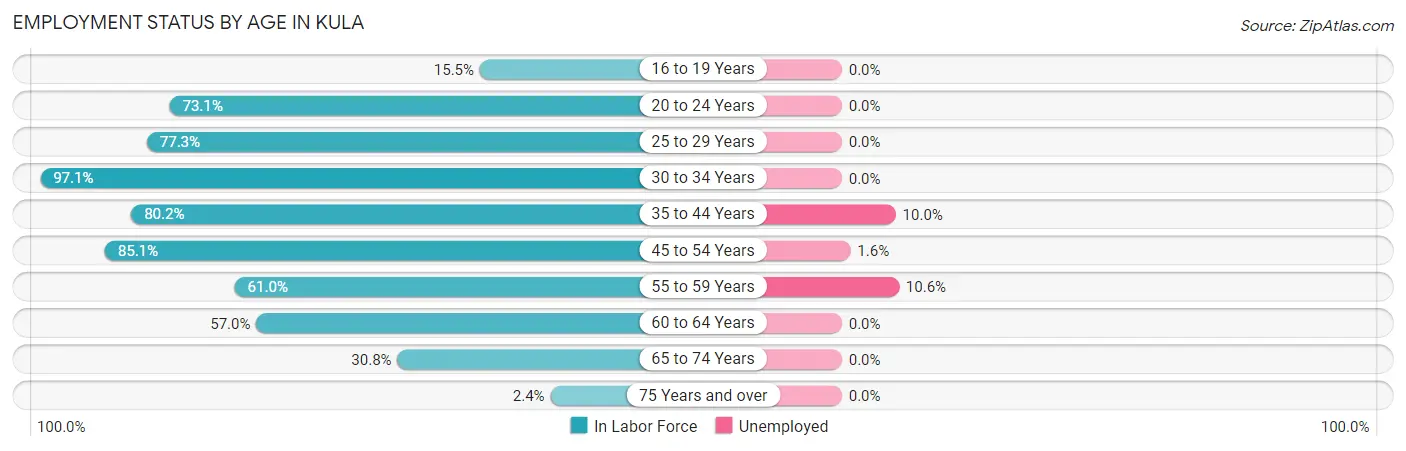
| Age Bracket | In Labor Force | Unemployed |
| 16 to 19 Years | 20 (15.5%) | 0 (0.0%) |
| 20 to 24 Years | 38 (73.1%) | 0 (0.0%) |
| 25 to 29 Years | 170 (77.3%) | 0 (0.0%) |
| 30 to 34 Years | 306 (97.1%) | 0 (0.0%) |
| 35 to 44 Years | 687 (80.2%) | 69 (10.0%) |
| 45 to 54 Years | 698 (85.1%) | 11 (1.6%) |
| 55 to 59 Years | 357 (61.0%) | 38 (10.6%) |
| 60 to 64 Years | 333 (57.0%) | 0 (0.0%) |
| 65 to 74 Years | 335 (30.8%) | 0 (0.0%) |
| 75 Years and over | 14 (2.4%) | 0 (0.0%) |
| Total | 2,957 (56.5%) | 118 (4.0%) |
Employment Status by Educational Attainment in Kula
According to labor force statistics for Kula, 75.5% of individuals (2,553) out of the total population between 25 and 64 years of age (3,381) are in the labor force, with 4.6% or 117 of them being unemployed. The group with the highest labor force participation rate are those with the educational attainment of bachelor's degree or higher, with 84.1% or 1,131 individuals in the labor force. Within the labor force, individuals with college / associate degree education have the highest percentage of unemployment, with 8.1% or 60 of them being unemployed.
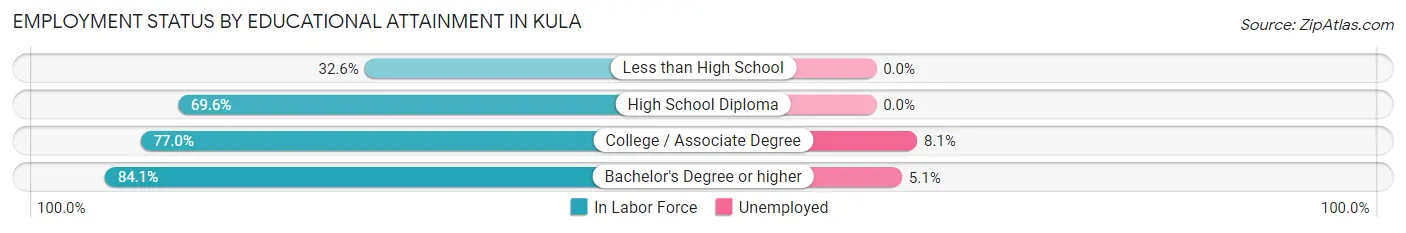
| Educational Attainment | In Labor Force | Unemployed |
| Less than High School | 61 (32.6%) | 0 (0.0%) |
| High School Diploma | 615 (69.6%) | 0 (0.0%) |
| College / Associate Degree | 744 (77.0%) | 78 (8.1%) |
| Bachelor's Degree or higher | 1,131 (84.1%) | 69 (5.1%) |
| Total | 2,553 (75.5%) | 156 (4.6%) |
Employment Occupations by Sex in Kula
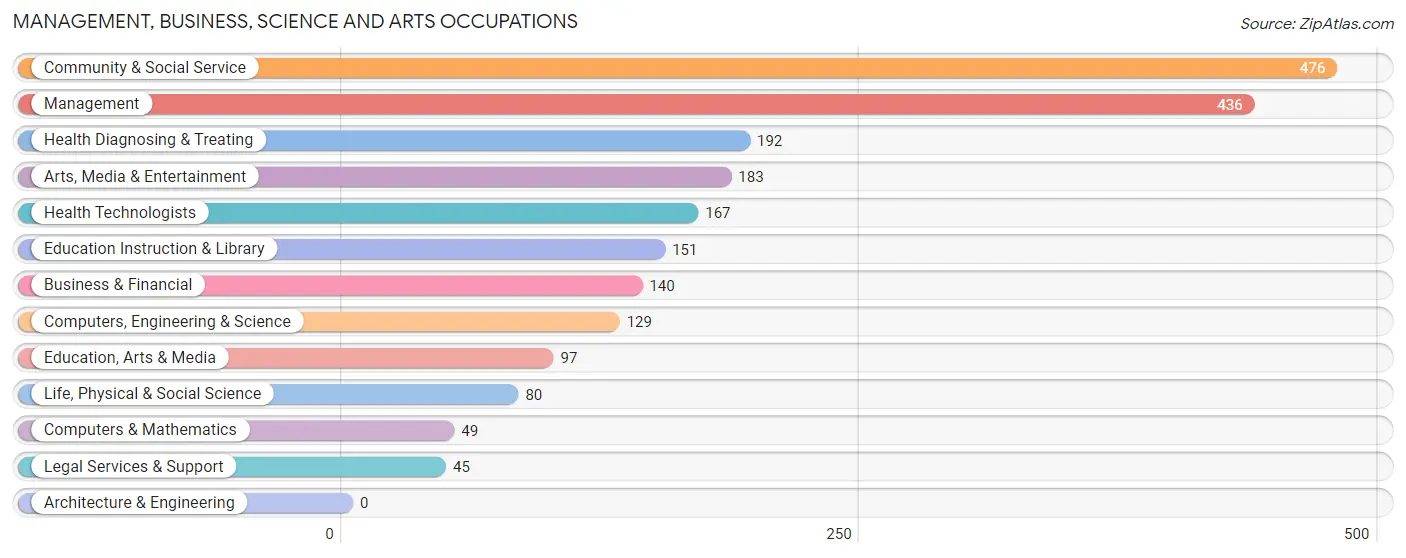
Management, Business, Science and Arts Occupations
The most common Management, Business, Science and Arts occupations in Kula are Community & Social Service (476 | 16.8%), Management (436 | 15.3%), Health Diagnosing & Treating (192 | 6.8%), Arts, Media & Entertainment (183 | 6.4%), and Health Technologists (167 | 5.9%).
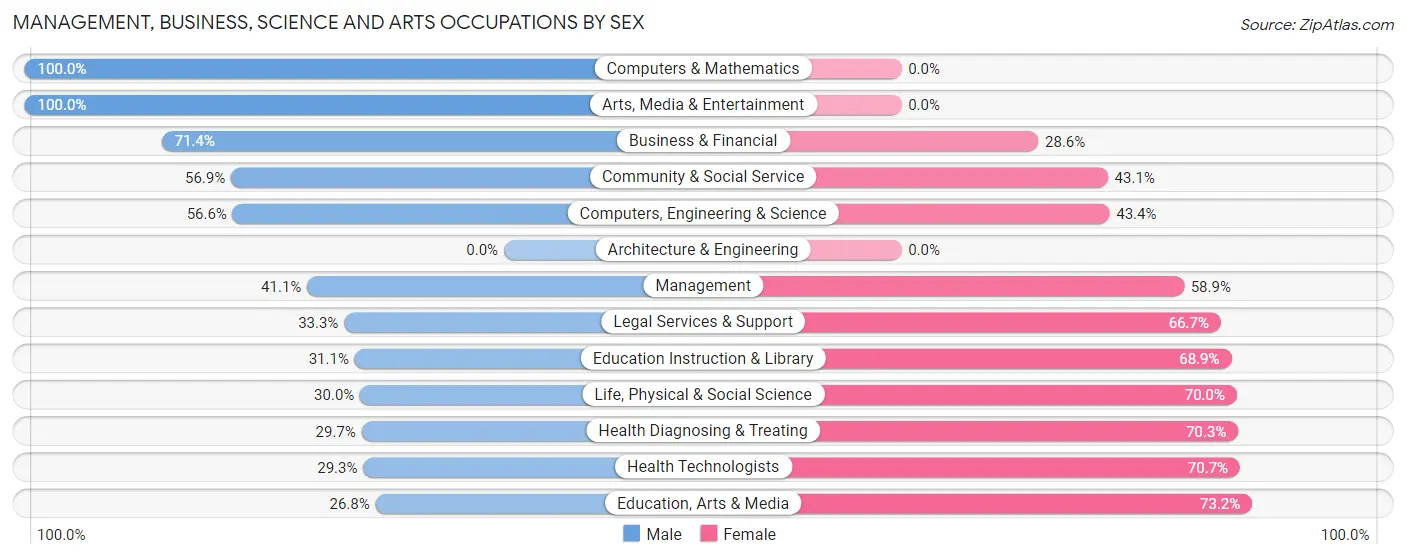
Management, Business, Science and Arts Occupations by Sex
Within the Management, Business, Science and Arts occupations in Kula, the most male-oriented occupations are Computers & Mathematics (100.0%), Arts, Media & Entertainment (100.0%), and Business & Financial (71.4%), while the most female-oriented occupations are Education, Arts & Media (73.2%), Health Technologists (70.7%), and Health Diagnosing & Treating (70.3%).
| Occupation | Male | Female |
| Management | 179 (41.1%) | 257 (58.9%) |
| Business & Financial | 100 (71.4%) | 40 (28.6%) |
| Computers, Engineering & Science | 73 (56.6%) | 56 (43.4%) |
| Computers & Mathematics | 49 (100.0%) | 0 (0.0%) |
| Architecture & Engineering | 0 (0.0%) | 0 (0.0%) |
| Life, Physical & Social Science | 24 (30.0%) | 56 (70.0%) |
| Community & Social Service | 271 (56.9%) | 205 (43.1%) |
| Education, Arts & Media | 26 (26.8%) | 71 (73.2%) |
| Legal Services & Support | 15 (33.3%) | 30 (66.7%) |
| Education Instruction & Library | 47 (31.1%) | 104 (68.9%) |
| Arts, Media & Entertainment | 183 (100.0%) | 0 (0.0%) |
| Health Diagnosing & Treating | 57 (29.7%) | 135 (70.3%) |
| Health Technologists | 49 (29.3%) | 118 (70.7%) |
| Total (Category) | 680 (49.5%) | 693 (50.5%) |
| Total (Overall) | 1,296 (45.6%) | 1,544 (54.4%) |
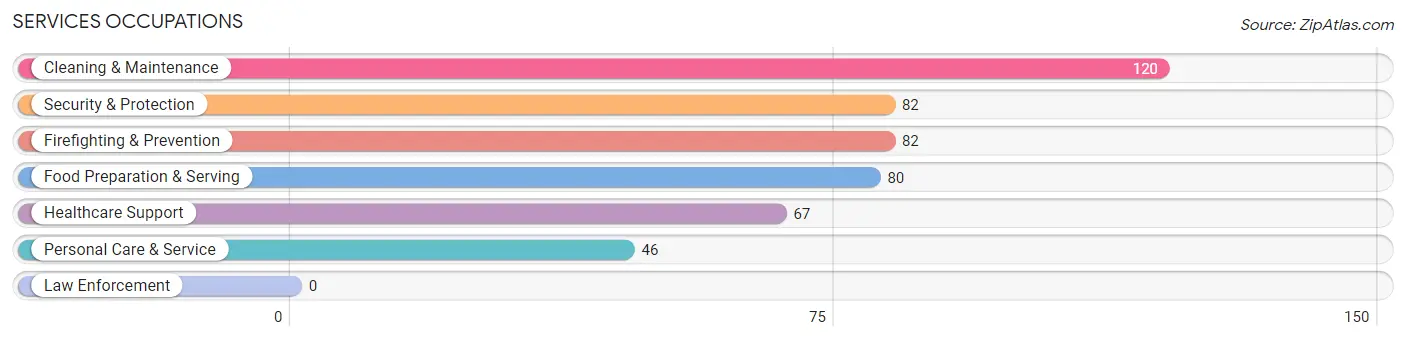
Services Occupations
The most common Services occupations in Kula are Cleaning & Maintenance (120 | 4.2%), Security & Protection (82 | 2.9%), Firefighting & Prevention (82 | 2.9%), Food Preparation & Serving (80 | 2.8%), and Healthcare Support (67 | 2.4%).
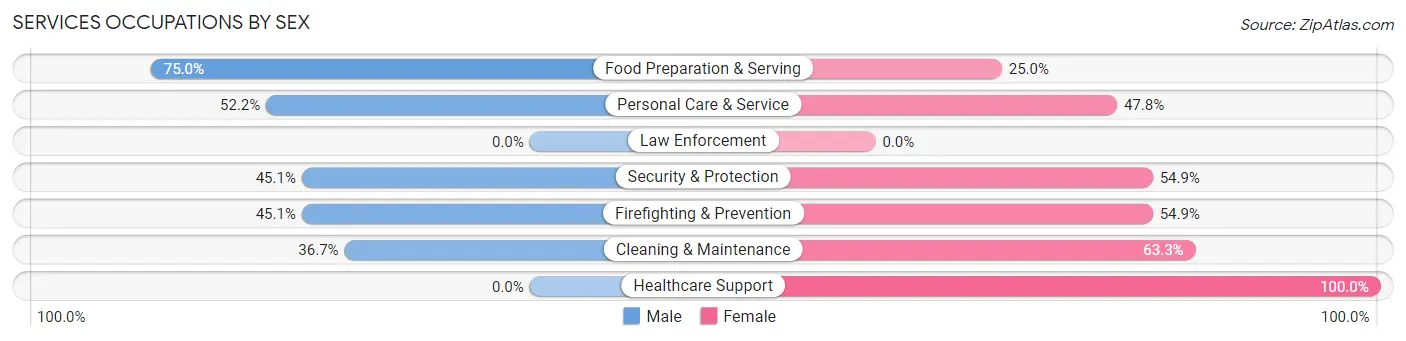
Services Occupations by Sex
Within the Services occupations in Kula, the most male-oriented occupations are Food Preparation & Serving (75.0%), Personal Care & Service (52.2%), and Security & Protection (45.1%), while the most female-oriented occupations are Healthcare Support (100.0%), Cleaning & Maintenance (63.3%), and Security & Protection (54.9%).
| Occupation | Male | Female |
| Healthcare Support | 0 (0.0%) | 67 (100.0%) |
| Security & Protection | 37 (45.1%) | 45 (54.9%) |
| Firefighting & Prevention | 37 (45.1%) | 45 (54.9%) |
| Law Enforcement | 0 (0.0%) | 0 (0.0%) |
| Food Preparation & Serving | 60 (75.0%) | 20 (25.0%) |
| Cleaning & Maintenance | 44 (36.7%) | 76 (63.3%) |
| Personal Care & Service | 24 (52.2%) | 22 (47.8%) |
| Total (Category) | 165 (41.8%) | 230 (58.2%) |
| Total (Overall) | 1,296 (45.6%) | 1,544 (54.4%) |
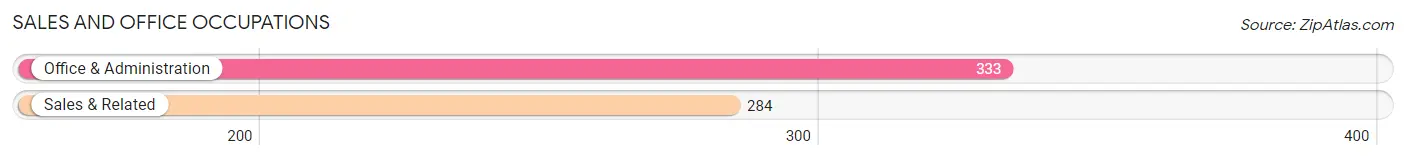
Sales and Office Occupations
The most common Sales and Office occupations in Kula are Office & Administration (333 | 11.7%), and Sales & Related (284 | 10.0%).
Sales and Office Occupations by Sex
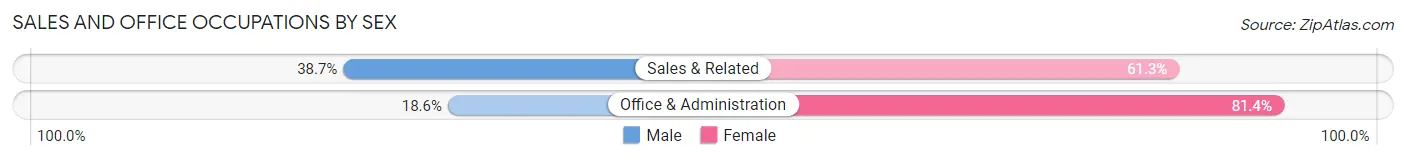
| Occupation | Male | Female |
| Sales & Related | 110 (38.7%) | 174 (61.3%) |
| Office & Administration | 62 (18.6%) | 271 (81.4%) |
| Total (Category) | 172 (27.9%) | 445 (72.1%) |
| Total (Overall) | 1,296 (45.6%) | 1,544 (54.4%) |
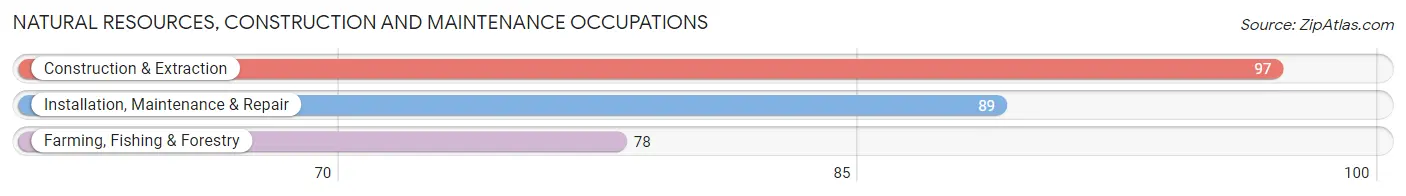
Natural Resources, Construction and Maintenance Occupations
The most common Natural Resources, Construction and Maintenance occupations in Kula are Construction & Extraction (97 | 3.4%), Installation, Maintenance & Repair (89 | 3.1%), and Farming, Fishing & Forestry (78 | 2.8%).
Natural Resources, Construction and Maintenance Occupations by Sex
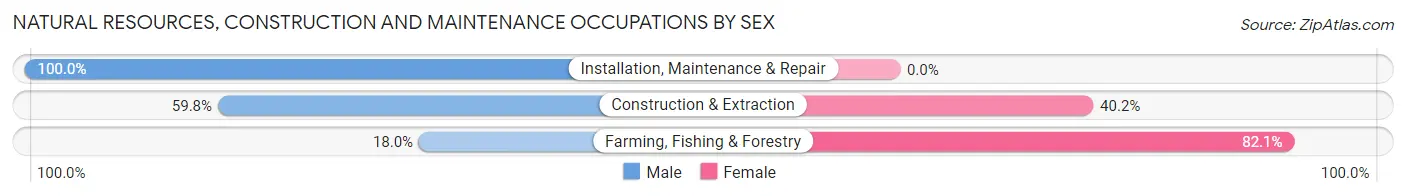
| Occupation | Male | Female |
| Farming, Fishing & Forestry | 14 (17.9%) | 64 (82.1%) |
| Construction & Extraction | 58 (59.8%) | 39 (40.2%) |
| Installation, Maintenance & Repair | 89 (100.0%) | 0 (0.0%) |
| Total (Category) | 161 (61.0%) | 103 (39.0%) |
| Total (Overall) | 1,296 (45.6%) | 1,544 (54.4%) |
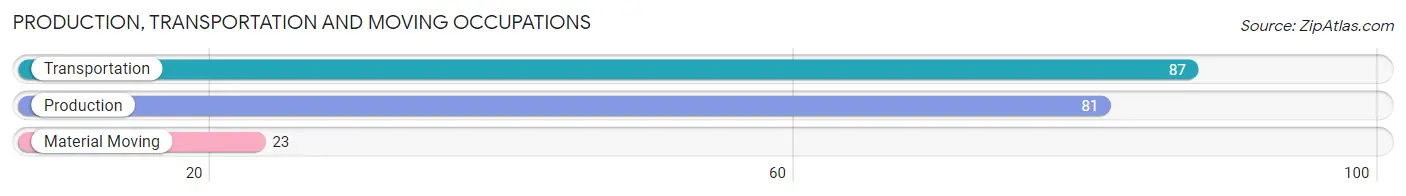
Production, Transportation and Moving Occupations
The most common Production, Transportation and Moving occupations in Kula are Transportation (87 | 3.1%), Production (81 | 2.9%), and Material Moving (23 | 0.8%).
Production, Transportation and Moving Occupations by Sex
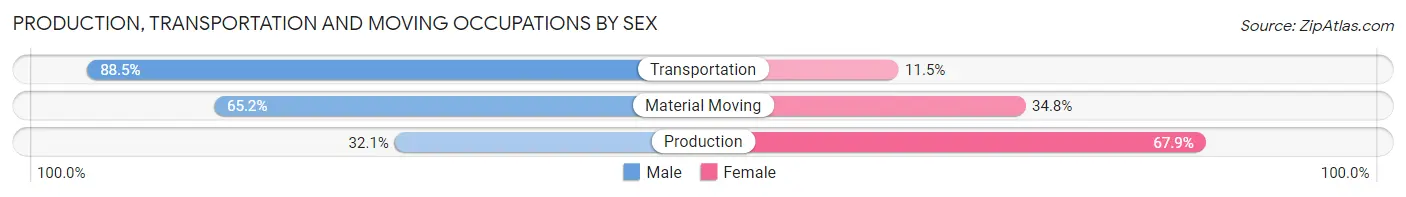
| Occupation | Male | Female |
| Production | 26 (32.1%) | 55 (67.9%) |
| Transportation | 77 (88.5%) | 10 (11.5%) |
| Material Moving | 15 (65.2%) | 8 (34.8%) |
| Total (Category) | 118 (61.8%) | 73 (38.2%) |
| Total (Overall) | 1,296 (45.6%) | 1,544 (54.4%) |
Employment Industries by Sex in Kula
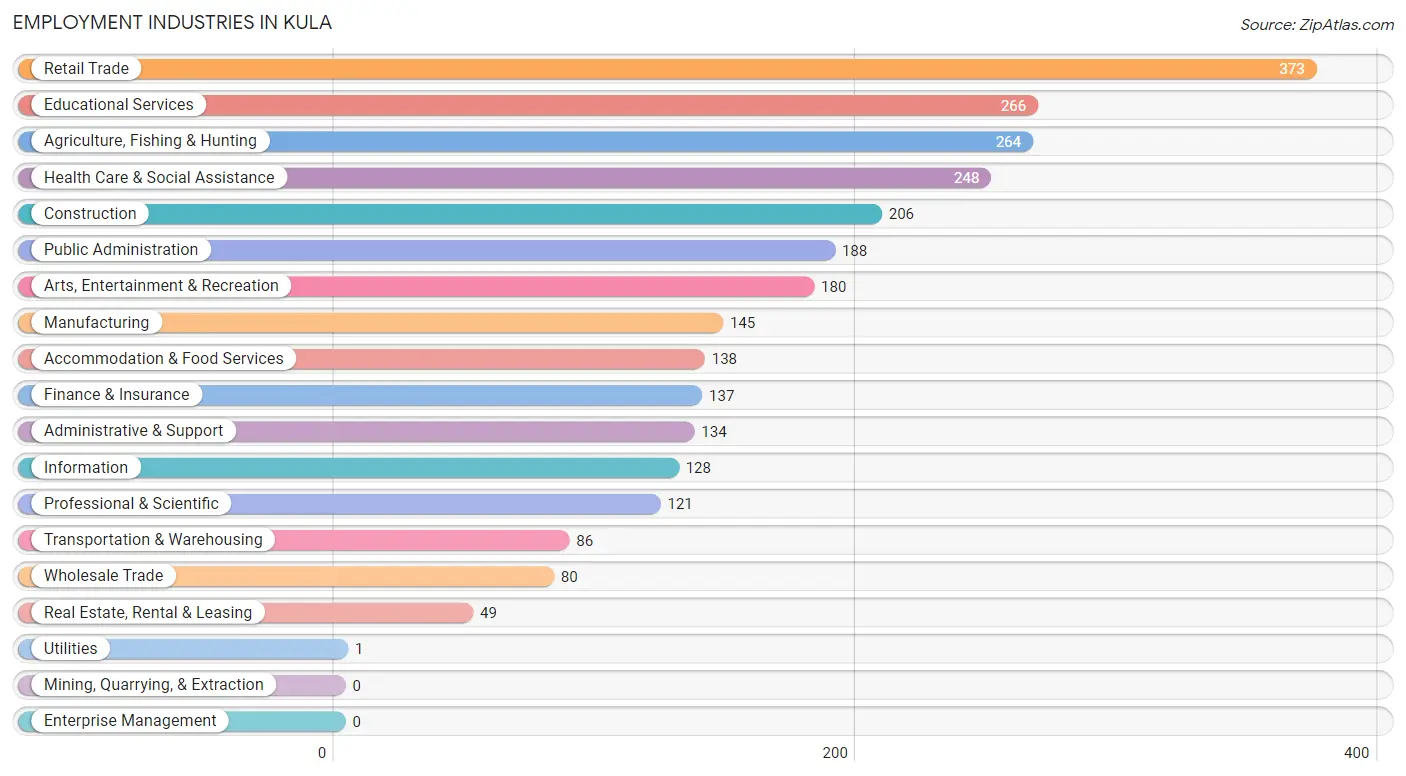
Employment Industries in Kula
The major employment industries in Kula include Retail Trade (373 | 13.1%), Educational Services (266 | 9.4%), Agriculture, Fishing & Hunting (264 | 9.3%), Health Care & Social Assistance (248 | 8.7%), and Construction (206 | 7.2%).
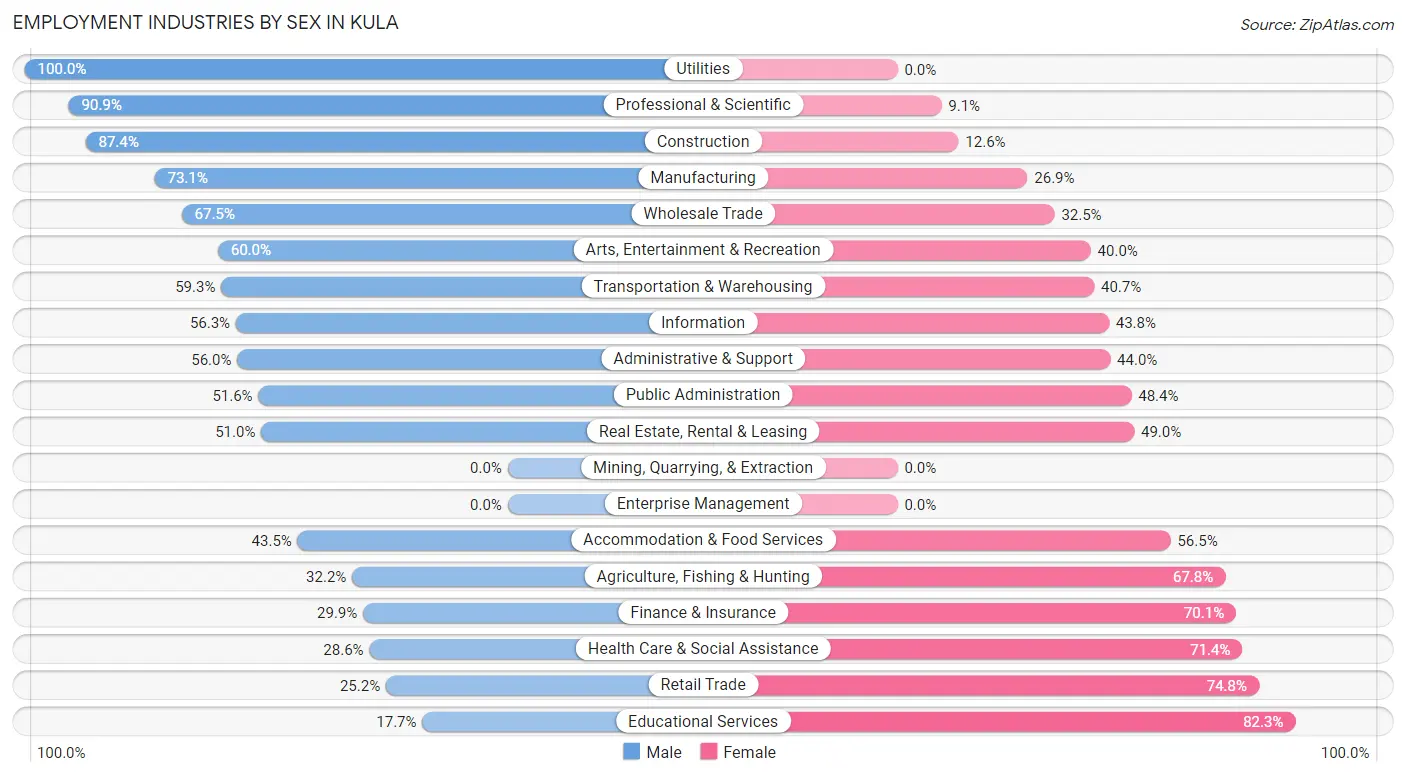
Employment Industries by Sex in Kula
The Kula industries that see more men than women are Utilities (100.0%), Professional & Scientific (90.9%), and Construction (87.4%), whereas the industries that tend to have a higher number of women are Educational Services (82.3%), Retail Trade (74.8%), and Health Care & Social Assistance (71.4%).
| Industry | Male | Female |
| Agriculture, Fishing & Hunting | 85 (32.2%) | 179 (67.8%) |
| Mining, Quarrying, & Extraction | 0 (0.0%) | 0 (0.0%) |
| Construction | 180 (87.4%) | 26 (12.6%) |
| Manufacturing | 106 (73.1%) | 39 (26.9%) |
| Wholesale Trade | 54 (67.5%) | 26 (32.5%) |
| Retail Trade | 94 (25.2%) | 279 (74.8%) |
| Transportation & Warehousing | 51 (59.3%) | 35 (40.7%) |
| Utilities | 1 (100.0%) | 0 (0.0%) |
| Information | 72 (56.2%) | 56 (43.8%) |
| Finance & Insurance | 41 (29.9%) | 96 (70.1%) |
| Real Estate, Rental & Leasing | 25 (51.0%) | 24 (49.0%) |
| Professional & Scientific | 110 (90.9%) | 11 (9.1%) |
| Enterprise Management | 0 (0.0%) | 0 (0.0%) |
| Administrative & Support | 75 (56.0%) | 59 (44.0%) |
| Educational Services | 47 (17.7%) | 219 (82.3%) |
| Health Care & Social Assistance | 71 (28.6%) | 177 (71.4%) |
| Arts, Entertainment & Recreation | 108 (60.0%) | 72 (40.0%) |
| Accommodation & Food Services | 60 (43.5%) | 78 (56.5%) |
| Public Administration | 97 (51.6%) | 91 (48.4%) |
| Total | 1,296 (45.6%) | 1,544 (54.4%) |
Education in Kula
School Enrollment in Kula
The most common levels of schooling among the 1,564 students in Kula are elementary school (435 | 27.8%), high school (344 | 22.0%), and middle school (319 | 20.4%).
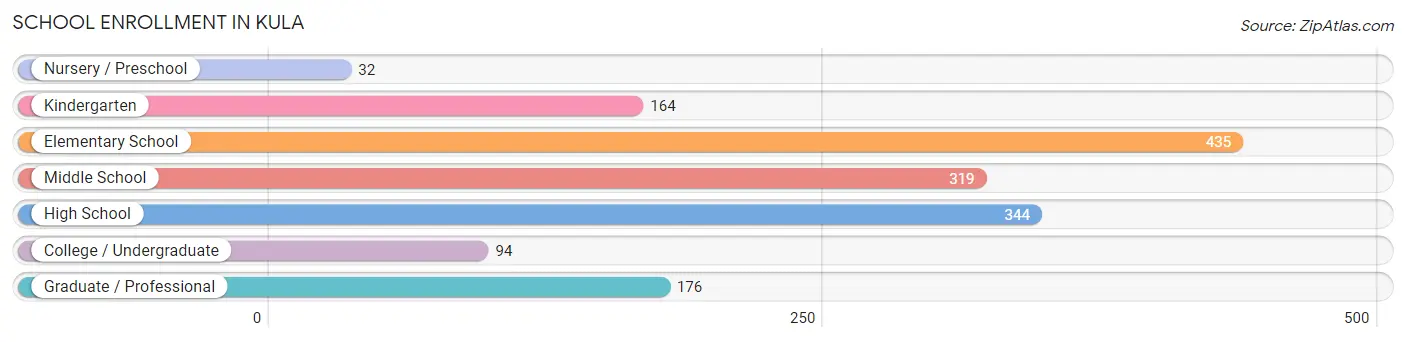
| School Level | # Students | % Students |
| Nursery / Preschool | 32 | 2.1% |
| Kindergarten | 164 | 10.5% |
| Elementary School | 435 | 27.8% |
| Middle School | 319 | 20.4% |
| High School | 344 | 22.0% |
| College / Undergraduate | 94 | 6.0% |
| Graduate / Professional | 176 | 11.3% |
| Total | 1,564 | 100.0% |
School Enrollment by Age by Funding Source in Kula
Out of a total of 1,564 students who are enrolled in schools in Kula, 352 (22.5%) attend a private institution, while the remaining 1,212 (77.5%) are enrolled in public schools. The age group of 3 to 4 year olds has the highest likelihood of being enrolled in private schools, with 32 (100.0% in the age bracket) enrolled. Conversely, the age group of 20 to 24 year olds has the lowest likelihood of being enrolled in a private school, with 14 (100.0% in the age bracket) attending a public institution.
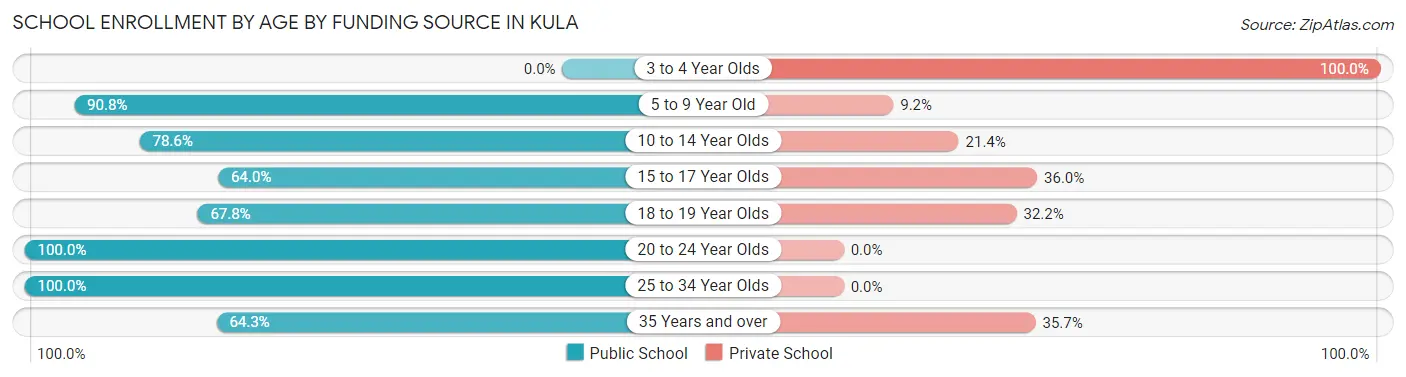
| Age Bracket | Public School | Private School |
| 3 to 4 Year Olds | 0 (0.0%) | 32 (100.0%) |
| 5 to 9 Year Old | 511 (90.8%) | 52 (9.2%) |
| 10 to 14 Year Olds | 301 (78.6%) | 82 (21.4%) |
| 15 to 17 Year Olds | 87 (64.0%) | 49 (36.0%) |
| 18 to 19 Year Olds | 80 (67.8%) | 38 (32.2%) |
| 20 to 24 Year Olds | 14 (100.0%) | 0 (0.0%) |
| 25 to 34 Year Olds | 41 (100.0%) | 0 (0.0%) |
| 35 Years and over | 178 (64.3%) | 99 (35.7%) |
| Total | 1,212 (77.5%) | 352 (22.5%) |
Educational Attainment by Field of Study in Kula
Business (348 | 16.3%), bio, nature & agricultural (245 | 11.5%), social sciences (213 | 10.0%), psychology (194 | 9.1%), and visual & performing arts (179 | 8.4%) are the most common fields of study among 2,135 individuals in Kula who have obtained a bachelor's degree or higher.
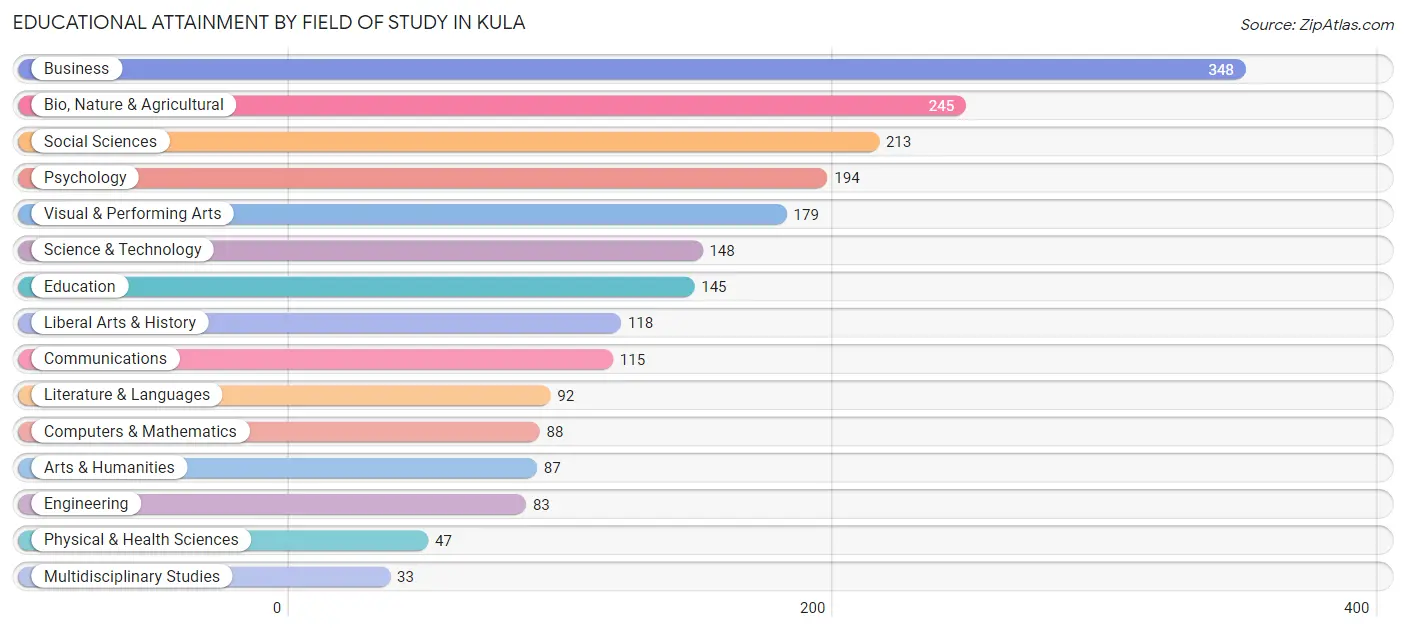
| Field of Study | # Graduates | % Graduates |
| Computers & Mathematics | 88 | 4.1% |
| Bio, Nature & Agricultural | 245 | 11.5% |
| Physical & Health Sciences | 47 | 2.2% |
| Psychology | 194 | 9.1% |
| Social Sciences | 213 | 10.0% |
| Engineering | 83 | 3.9% |
| Multidisciplinary Studies | 33 | 1.5% |
| Science & Technology | 148 | 6.9% |
| Business | 348 | 16.3% |
| Education | 145 | 6.8% |
| Literature & Languages | 92 | 4.3% |
| Liberal Arts & History | 118 | 5.5% |
| Visual & Performing Arts | 179 | 8.4% |
| Communications | 115 | 5.4% |
| Arts & Humanities | 87 | 4.1% |
| Total | 2,135 | 100.0% |
Transportation & Commute in Kula
Vehicle Availability by Sex in Kula
The most prevalent vehicle ownership categories in Kula are males with 2 vehicles (452, accounting for 36.2%) and females with 2 vehicles (592, making up 30.6%).
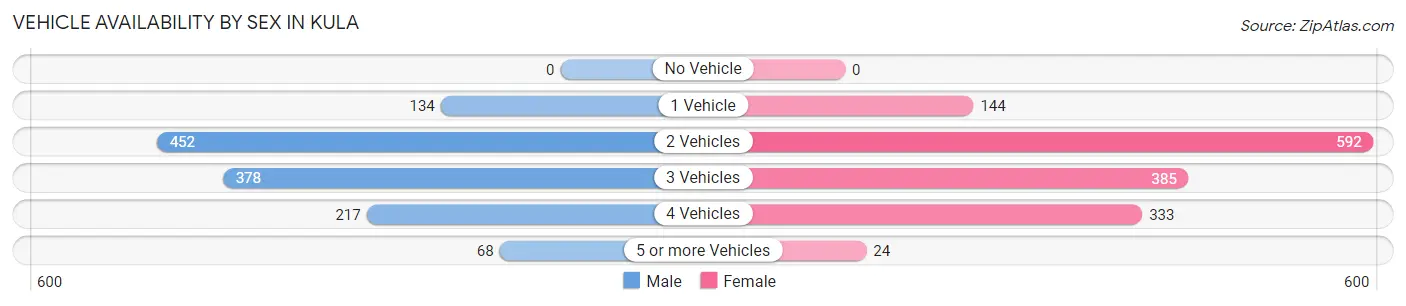
| Vehicles Available | Male | Female |
| No Vehicle | 0 (0.0%) | 0 (0.0%) |
| 1 Vehicle | 134 (10.7%) | 144 (9.7%) |
| 2 Vehicles | 452 (36.2%) | 592 (40.1%) |
| 3 Vehicles | 378 (30.3%) | 385 (26.1%) |
| 4 Vehicles | 217 (17.4%) | 333 (22.5%) |
| 5 or more Vehicles | 68 (5.4%) | 24 (1.6%) |
| Total | 1,249 (100.0%) | 1,478 (100.0%) |
Commute Time in Kula
The most frequently occuring commute durations in Kula are 15 to 19 minutes (333 commuters, 14.3%), 30 to 34 minutes (325 commuters, 14.0%), and 5 to 9 minutes (276 commuters, 11.9%).
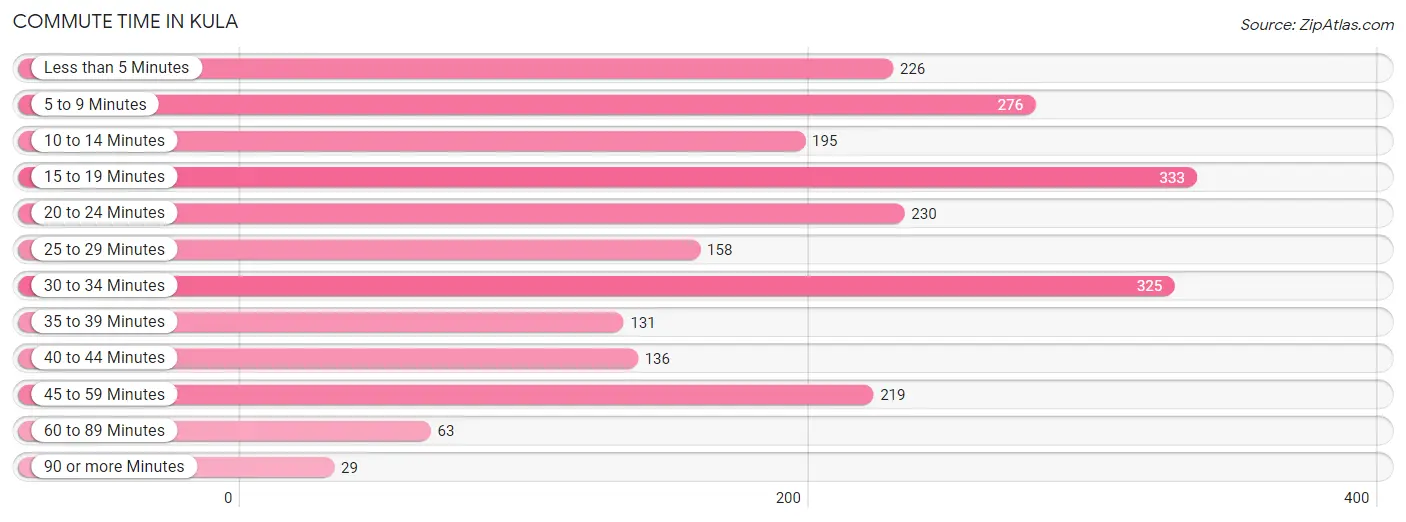
| Commute Time | # Commuters | % Commuters |
| Less than 5 Minutes | 226 | 9.7% |
| 5 to 9 Minutes | 276 | 11.9% |
| 10 to 14 Minutes | 195 | 8.4% |
| 15 to 19 Minutes | 333 | 14.3% |
| 20 to 24 Minutes | 230 | 9.9% |
| 25 to 29 Minutes | 158 | 6.8% |
| 30 to 34 Minutes | 325 | 14.0% |
| 35 to 39 Minutes | 131 | 5.6% |
| 40 to 44 Minutes | 136 | 5.9% |
| 45 to 59 Minutes | 219 | 9.4% |
| 60 to 89 Minutes | 63 | 2.7% |
| 90 or more Minutes | 29 | 1.3% |
Commute Time by Sex in Kula
The most common commute times in Kula are 30 to 34 minutes (200 commuters, 18.7%) for males and 5 to 9 minutes (235 commuters, 18.8%) for females.
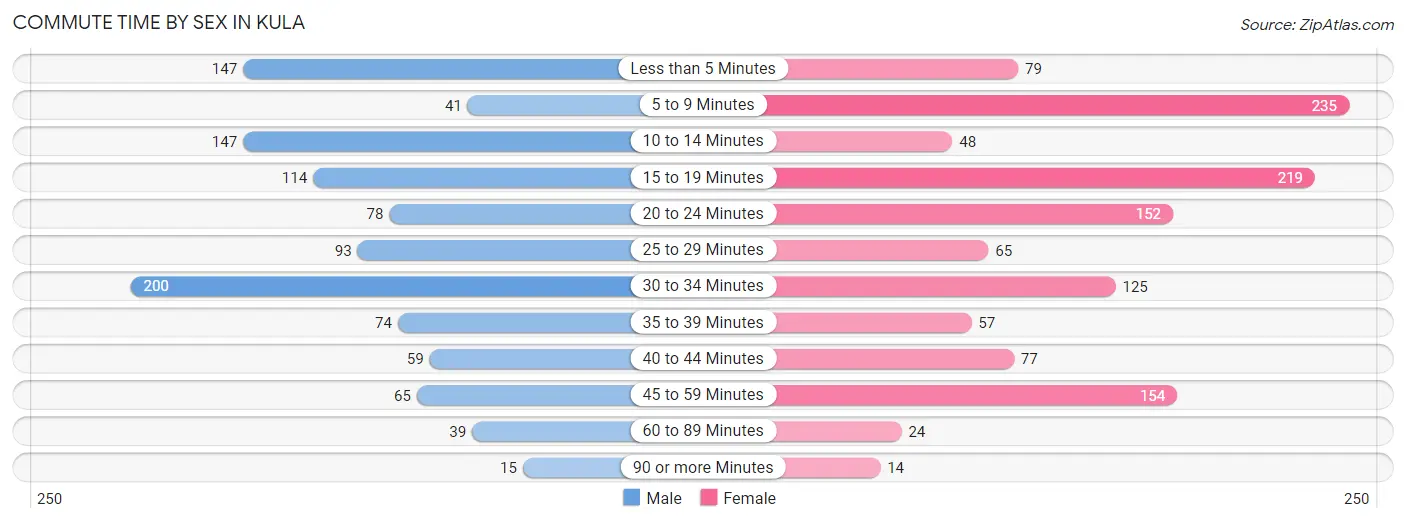
| Commute Time | Male | Female |
| Less than 5 Minutes | 147 (13.7%) | 79 (6.3%) |
| 5 to 9 Minutes | 41 (3.8%) | 235 (18.8%) |
| 10 to 14 Minutes | 147 (13.7%) | 48 (3.8%) |
| 15 to 19 Minutes | 114 (10.6%) | 219 (17.5%) |
| 20 to 24 Minutes | 78 (7.3%) | 152 (12.2%) |
| 25 to 29 Minutes | 93 (8.7%) | 65 (5.2%) |
| 30 to 34 Minutes | 200 (18.7%) | 125 (10.0%) |
| 35 to 39 Minutes | 74 (6.9%) | 57 (4.6%) |
| 40 to 44 Minutes | 59 (5.5%) | 77 (6.2%) |
| 45 to 59 Minutes | 65 (6.1%) | 154 (12.3%) |
| 60 to 89 Minutes | 39 (3.6%) | 24 (1.9%) |
| 90 or more Minutes | 15 (1.4%) | 14 (1.1%) |
Time of Departure to Work by Sex in Kula
The most frequent times of departure to work in Kula are 7:30 AM to 7:59 AM (207, 19.3%) for males and 7:00 AM to 7:29 AM (378, 30.3%) for females.
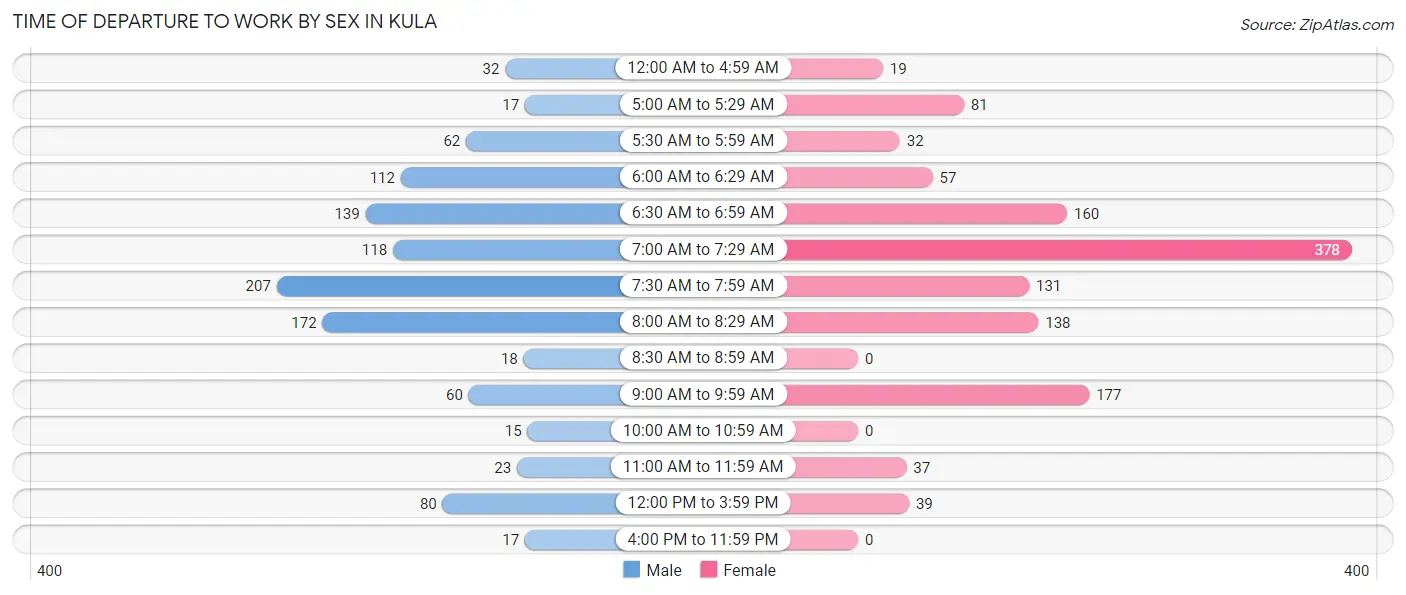
| Time of Departure | Male | Female |
| 12:00 AM to 4:59 AM | 32 (3.0%) | 19 (1.5%) |
| 5:00 AM to 5:29 AM | 17 (1.6%) | 81 (6.5%) |
| 5:30 AM to 5:59 AM | 62 (5.8%) | 32 (2.6%) |
| 6:00 AM to 6:29 AM | 112 (10.4%) | 57 (4.6%) |
| 6:30 AM to 6:59 AM | 139 (13.0%) | 160 (12.8%) |
| 7:00 AM to 7:29 AM | 118 (11.0%) | 378 (30.3%) |
| 7:30 AM to 7:59 AM | 207 (19.3%) | 131 (10.5%) |
| 8:00 AM to 8:29 AM | 172 (16.0%) | 138 (11.1%) |
| 8:30 AM to 8:59 AM | 18 (1.7%) | 0 (0.0%) |
| 9:00 AM to 9:59 AM | 60 (5.6%) | 177 (14.2%) |
| 10:00 AM to 10:59 AM | 15 (1.4%) | 0 (0.0%) |
| 11:00 AM to 11:59 AM | 23 (2.1%) | 37 (3.0%) |
| 12:00 PM to 3:59 PM | 80 (7.5%) | 39 (3.1%) |
| 4:00 PM to 11:59 PM | 17 (1.6%) | 0 (0.0%) |
| Total | 1,072 (100.0%) | 1,249 (100.0%) |
Housing Occupancy in Kula
Occupancy by Ownership in Kula
Of the total 2,480 dwellings in Kula, owner-occupied units account for 1,681 (67.8%), while renter-occupied units make up 799 (32.2%).
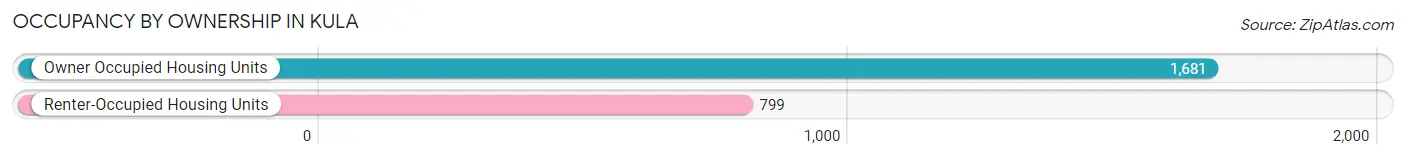
| Occupancy | # Housing Units | % Housing Units |
| Owner Occupied Housing Units | 1,681 | 67.8% |
| Renter-Occupied Housing Units | 799 | 32.2% |
| Total Occupied Housing Units | 2,480 | 100.0% |
Occupancy by Household Size in Kula
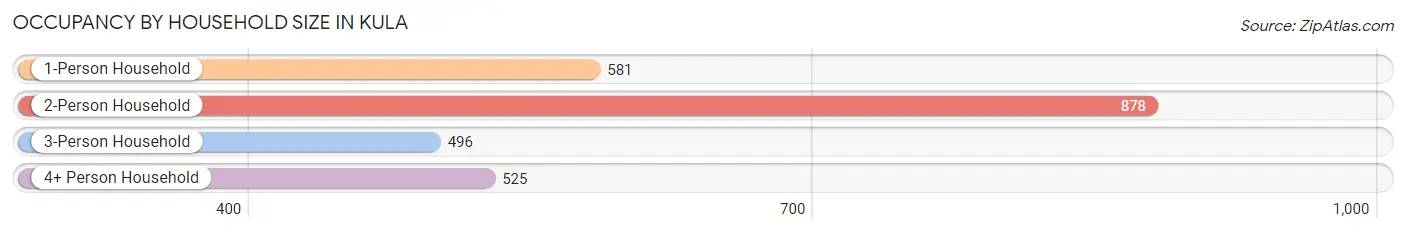
| Household Size | # Housing Units | % Housing Units |
| 1-Person Household | 581 | 23.4% |
| 2-Person Household | 878 | 35.4% |
| 3-Person Household | 496 | 20.0% |
| 4+ Person Household | 525 | 21.2% |
| Total Housing Units | 2,480 | 100.0% |
Occupancy by Ownership by Household Size in Kula
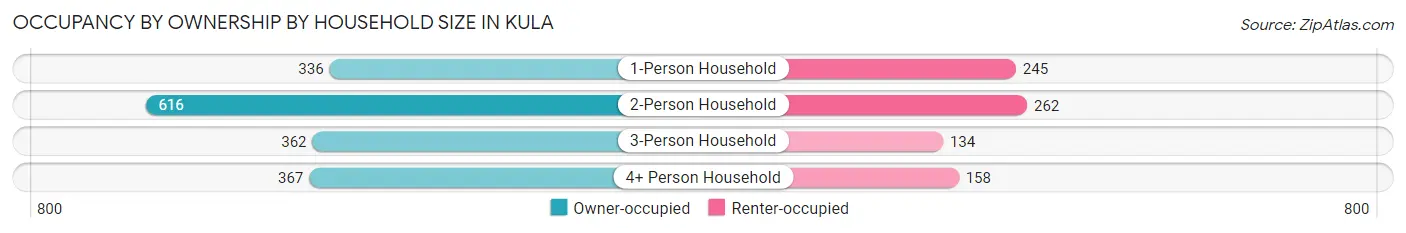
| Household Size | Owner-occupied | Renter-occupied |
| 1-Person Household | 336 (57.8%) | 245 (42.2%) |
| 2-Person Household | 616 (70.2%) | 262 (29.8%) |
| 3-Person Household | 362 (73.0%) | 134 (27.0%) |
| 4+ Person Household | 367 (69.9%) | 158 (30.1%) |
| Total Housing Units | 1,681 (67.8%) | 799 (32.2%) |
Occupancy by Educational Attainment in Kula
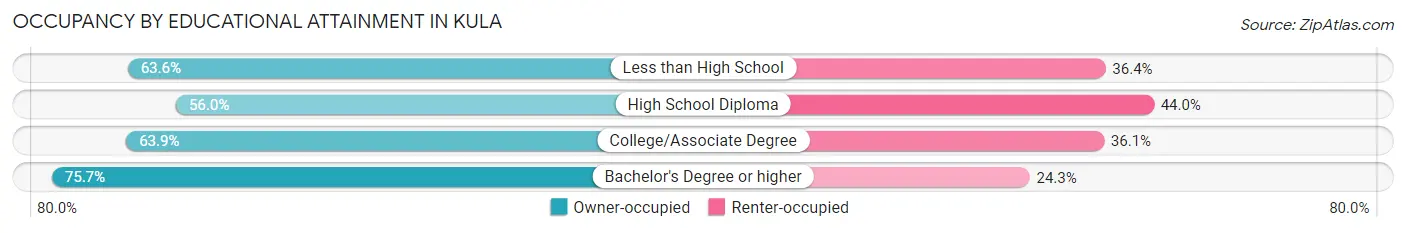
| Household Size | Owner-occupied | Renter-occupied |
| Less than High School | 14 (63.6%) | 8 (36.4%) |
| High School Diploma | 248 (56.0%) | 195 (44.0%) |
| College/Associate Degree | 573 (63.9%) | 324 (36.1%) |
| Bachelor's Degree or higher | 846 (75.7%) | 272 (24.3%) |
Occupancy by Age of Householder in Kula
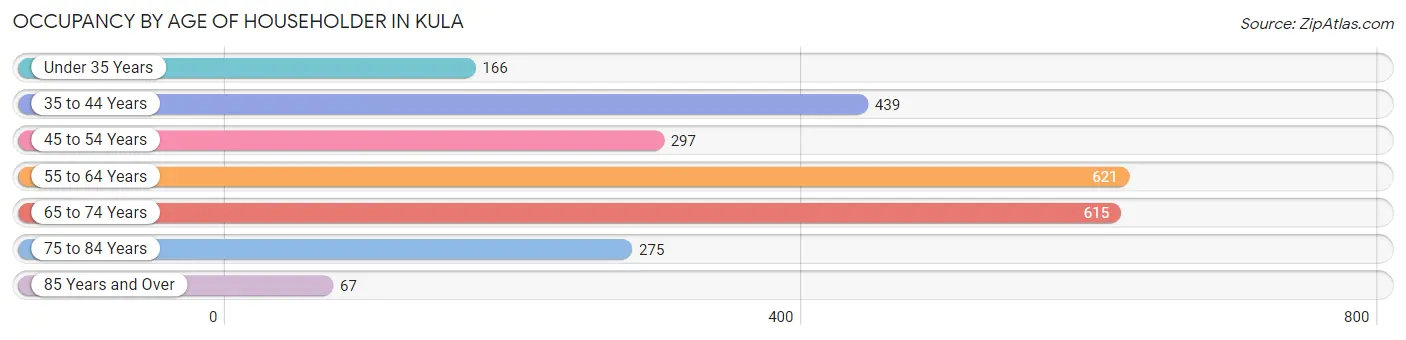
| Age Bracket | # Households | % Households |
| Under 35 Years | 166 | 6.7% |
| 35 to 44 Years | 439 | 17.7% |
| 45 to 54 Years | 297 | 12.0% |
| 55 to 64 Years | 621 | 25.0% |
| 65 to 74 Years | 615 | 24.8% |
| 75 to 84 Years | 275 | 11.1% |
| 85 Years and Over | 67 | 2.7% |
| Total | 2,480 | 100.0% |
Housing Finances in Kula
Median Income by Occupancy in Kula
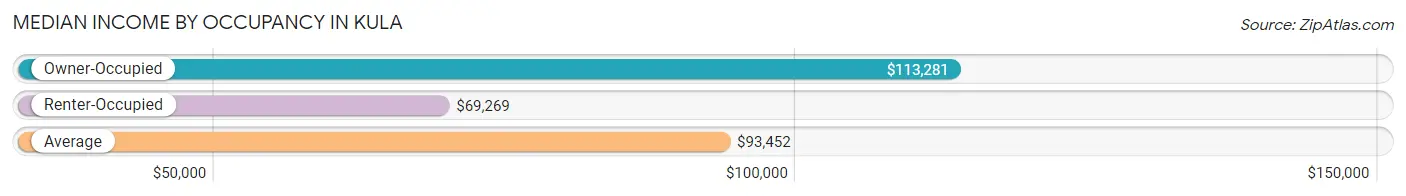
| Occupancy Type | # Households | Median Income |
| Owner-Occupied | 1,681 (67.8%) | $113,281 |
| Renter-Occupied | 799 (32.2%) | $69,269 |
| Average | 2,480 (100.0%) | $93,452 |
Occupancy by Householder Income Bracket in Kula
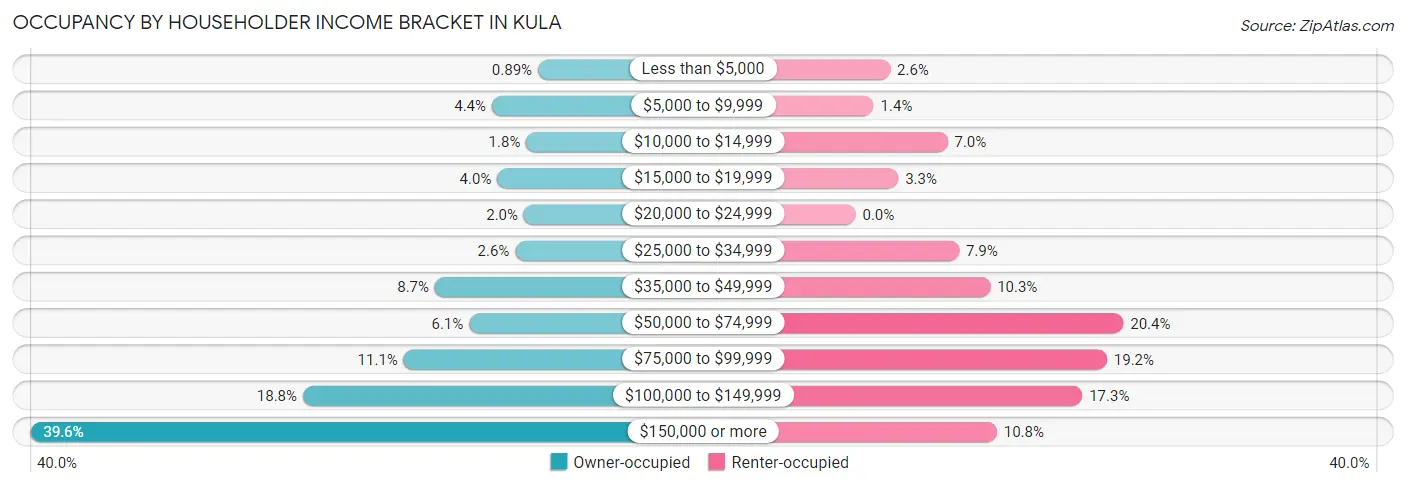
| Income Bracket | Owner-occupied | Renter-occupied |
| Less than $5,000 | 15 (0.9%) | 21 (2.6%) |
| $5,000 to $9,999 | 74 (4.4%) | 11 (1.4%) |
| $10,000 to $14,999 | 30 (1.8%) | 56 (7.0%) |
| $15,000 to $19,999 | 67 (4.0%) | 26 (3.3%) |
| $20,000 to $24,999 | 33 (2.0%) | 0 (0.0%) |
| $25,000 to $34,999 | 44 (2.6%) | 63 (7.9%) |
| $35,000 to $49,999 | 147 (8.7%) | 82 (10.3%) |
| $50,000 to $74,999 | 103 (6.1%) | 163 (20.4%) |
| $75,000 to $99,999 | 187 (11.1%) | 153 (19.2%) |
| $100,000 to $149,999 | 316 (18.8%) | 138 (17.3%) |
| $150,000 or more | 665 (39.6%) | 86 (10.8%) |
| Total | 1,681 (100.0%) | 799 (100.0%) |
Monthly Housing Cost Tiers in Kula
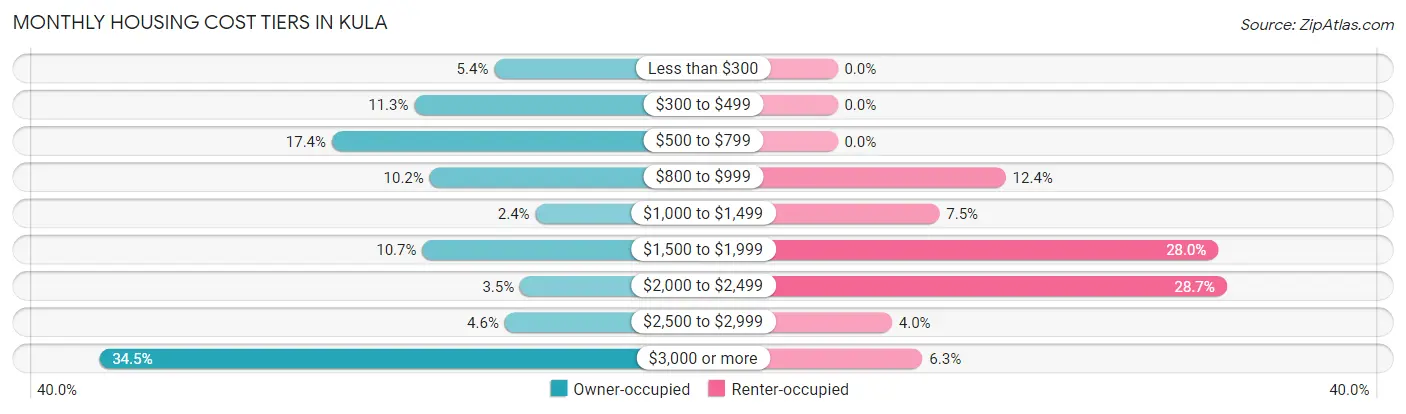
| Monthly Cost | Owner-occupied | Renter-occupied |
| Less than $300 | 91 (5.4%) | 0 (0.0%) |
| $300 to $499 | 190 (11.3%) | 0 (0.0%) |
| $500 to $799 | 292 (17.4%) | 0 (0.0%) |
| $800 to $999 | 171 (10.2%) | 99 (12.4%) |
| $1,000 to $1,499 | 40 (2.4%) | 60 (7.5%) |
| $1,500 to $1,999 | 180 (10.7%) | 224 (28.0%) |
| $2,000 to $2,499 | 59 (3.5%) | 229 (28.7%) |
| $2,500 to $2,999 | 78 (4.6%) | 32 (4.0%) |
| $3,000 or more | 580 (34.5%) | 50 (6.3%) |
| Total | 1,681 (100.0%) | 799 (100.0%) |
Physical Housing Characteristics in Kula
Housing Structures in Kula
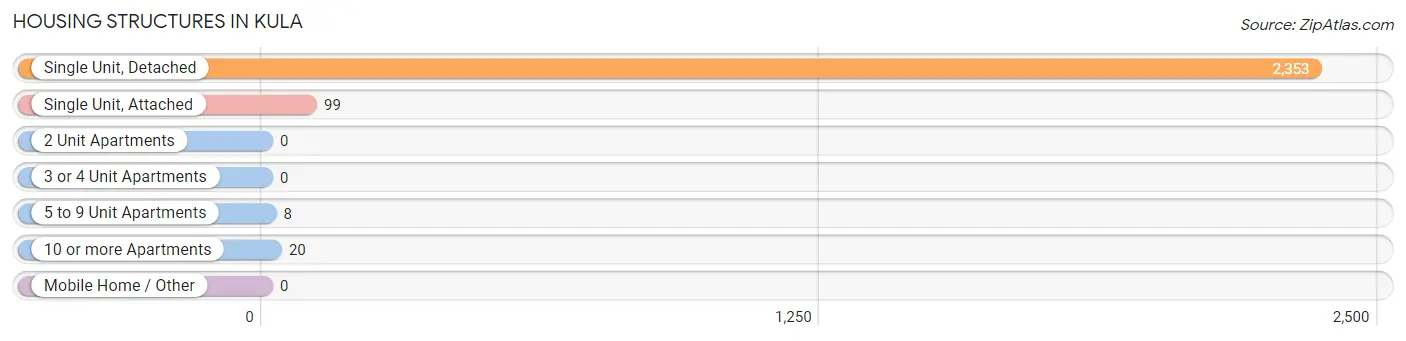
| Structure Type | # Housing Units | % Housing Units |
| Single Unit, Detached | 2,353 | 94.9% |
| Single Unit, Attached | 99 | 4.0% |
| 2 Unit Apartments | 0 | 0.0% |
| 3 or 4 Unit Apartments | 0 | 0.0% |
| 5 to 9 Unit Apartments | 8 | 0.3% |
| 10 or more Apartments | 20 | 0.8% |
| Mobile Home / Other | 0 | 0.0% |
| Total | 2,480 | 100.0% |
Housing Structures by Occupancy in Kula
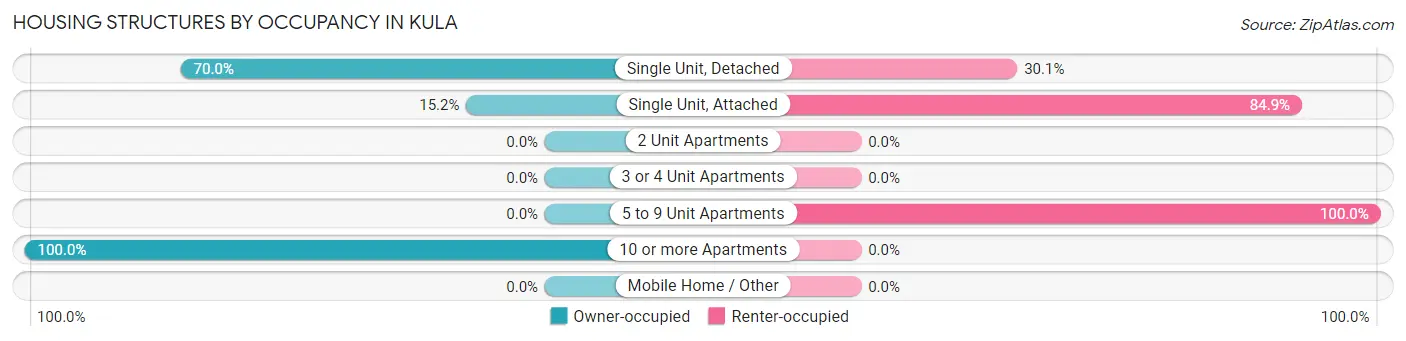
| Structure Type | Owner-occupied | Renter-occupied |
| Single Unit, Detached | 1,646 (70.0%) | 707 (30.0%) |
| Single Unit, Attached | 15 (15.1%) | 84 (84.9%) |
| 2 Unit Apartments | 0 (0.0%) | 0 (0.0%) |
| 3 or 4 Unit Apartments | 0 (0.0%) | 0 (0.0%) |
| 5 to 9 Unit Apartments | 0 (0.0%) | 8 (100.0%) |
| 10 or more Apartments | 20 (100.0%) | 0 (0.0%) |
| Mobile Home / Other | 0 (0.0%) | 0 (0.0%) |
| Total | 1,681 (67.8%) | 799 (32.2%) |
Housing Structures by Number of Rooms in Kula
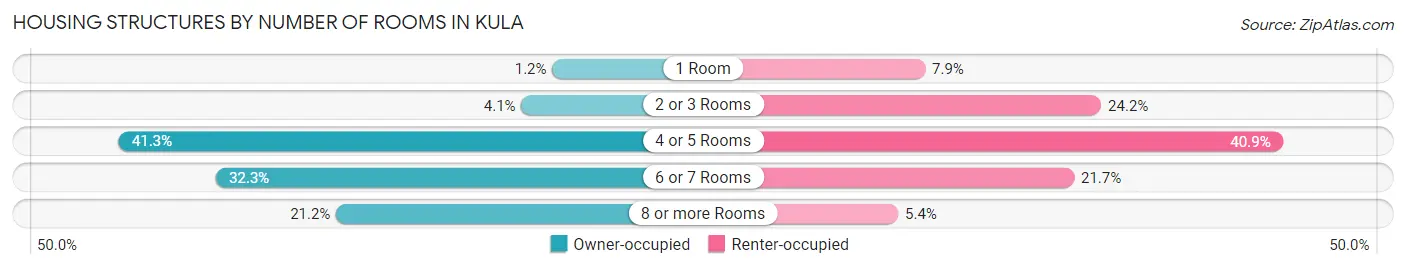
| Number of Rooms | Owner-occupied | Renter-occupied |
| 1 Room | 20 (1.2%) | 63 (7.9%) |
| 2 or 3 Rooms | 68 (4.1%) | 193 (24.2%) |
| 4 or 5 Rooms | 694 (41.3%) | 327 (40.9%) |
| 6 or 7 Rooms | 543 (32.3%) | 173 (21.6%) |
| 8 or more Rooms | 356 (21.2%) | 43 (5.4%) |
| Total | 1,681 (100.0%) | 799 (100.0%) |
Housing Structure by Heating Type in Kula
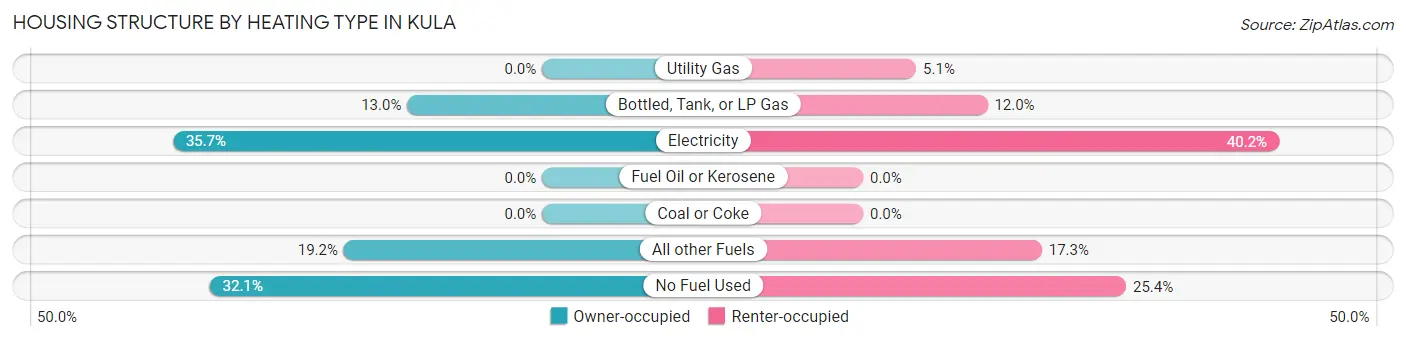
| Heating Type | Owner-occupied | Renter-occupied |
| Utility Gas | 0 (0.0%) | 41 (5.1%) |
| Bottled, Tank, or LP Gas | 219 (13.0%) | 96 (12.0%) |
| Electricity | 600 (35.7%) | 321 (40.2%) |
| Fuel Oil or Kerosene | 0 (0.0%) | 0 (0.0%) |
| Coal or Coke | 0 (0.0%) | 0 (0.0%) |
| All other Fuels | 322 (19.2%) | 138 (17.3%) |
| No Fuel Used | 540 (32.1%) | 203 (25.4%) |
| Total | 1,681 (100.0%) | 799 (100.0%) |
Household Vehicle Usage in Kula
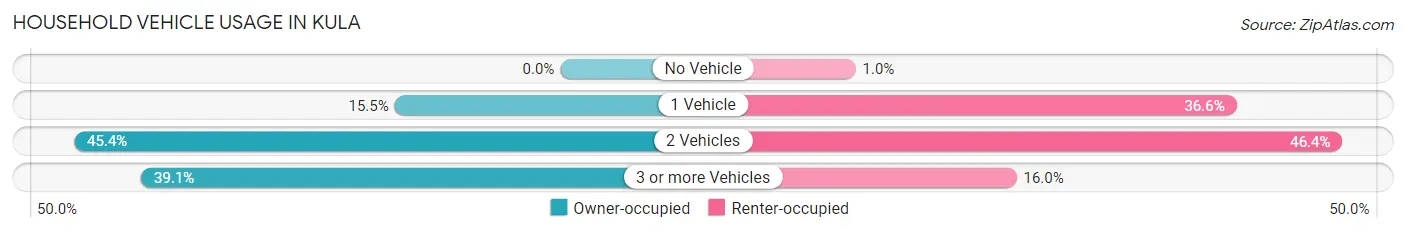
| Vehicles per Household | Owner-occupied | Renter-occupied |
| No Vehicle | 0 (0.0%) | 8 (1.0%) |
| 1 Vehicle | 260 (15.5%) | 292 (36.5%) |
| 2 Vehicles | 763 (45.4%) | 371 (46.4%) |
| 3 or more Vehicles | 658 (39.1%) | 128 (16.0%) |
| Total | 1,681 (100.0%) | 799 (100.0%) |
Real Estate & Mortgages in Kula
Real Estate and Mortgage Overview in Kula
| Characteristic | Without Mortgage | With Mortgage |
| Housing Units | 815 | 866 |
| Median Property Value | $1,188,900 | $1,101,100 |
| Median Household Income | $104,018 | $378 |
| Monthly Housing Costs | $631 | $580 |
| Real Estate Taxes | $2,252 | $17 |
Property Value by Mortgage Status in Kula
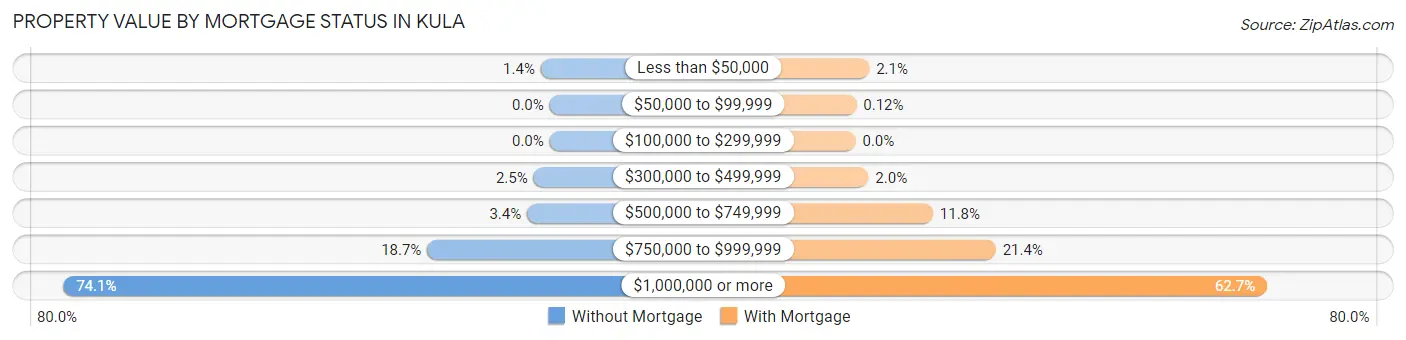
| Property Value | Without Mortgage | With Mortgage |
| Less than $50,000 | 11 (1.3%) | 18 (2.1%) |
| $50,000 to $99,999 | 0 (0.0%) | 1 (0.1%) |
| $100,000 to $299,999 | 0 (0.0%) | 0 (0.0%) |
| $300,000 to $499,999 | 20 (2.5%) | 17 (2.0%) |
| $500,000 to $749,999 | 28 (3.4%) | 102 (11.8%) |
| $750,000 to $999,999 | 152 (18.6%) | 185 (21.4%) |
| $1,000,000 or more | 604 (74.1%) | 543 (62.7%) |
| Total | 815 (100.0%) | 866 (100.0%) |
Household Income by Mortgage Status in Kula
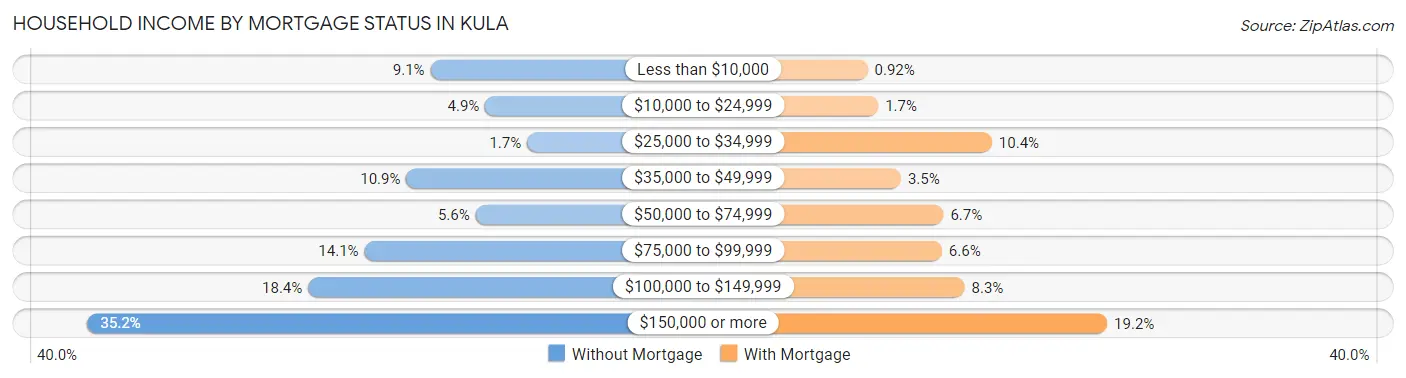
| Household Income | Without Mortgage | With Mortgage |
| Less than $10,000 | 74 (9.1%) | 8 (0.9%) |
| $10,000 to $24,999 | 40 (4.9%) | 15 (1.7%) |
| $25,000 to $34,999 | 14 (1.7%) | 90 (10.4%) |
| $35,000 to $49,999 | 89 (10.9%) | 30 (3.5%) |
| $50,000 to $74,999 | 46 (5.6%) | 58 (6.7%) |
| $75,000 to $99,999 | 115 (14.1%) | 57 (6.6%) |
| $100,000 to $149,999 | 150 (18.4%) | 72 (8.3%) |
| $150,000 or more | 287 (35.2%) | 166 (19.2%) |
| Total | 815 (100.0%) | 866 (100.0%) |
Property Value to Household Income Ratio in Kula
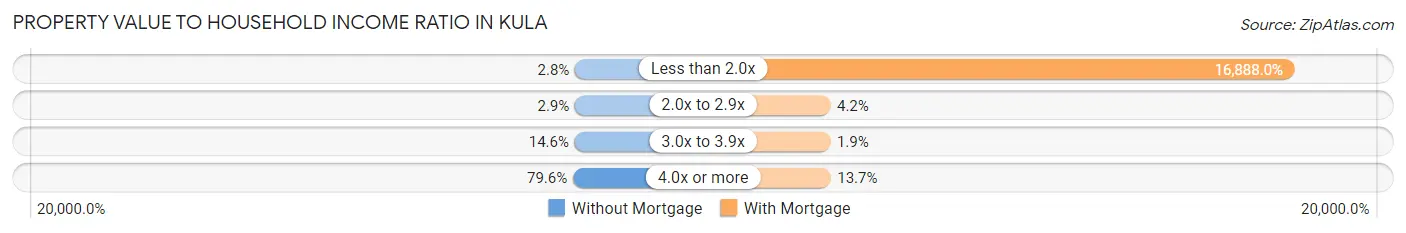
| Value-to-Income Ratio | Without Mortgage | With Mortgage |
| Less than 2.0x | 23 (2.8%) | 146,250 (16,888.0%) |
| 2.0x to 2.9x | 24 (2.9%) | 36 (4.2%) |
| 3.0x to 3.9x | 119 (14.6%) | 16 (1.8%) |
| 4.0x or more | 649 (79.6%) | 119 (13.7%) |
| Total | 815 (100.0%) | 866 (100.0%) |
Real Estate Taxes by Mortgage Status in Kula
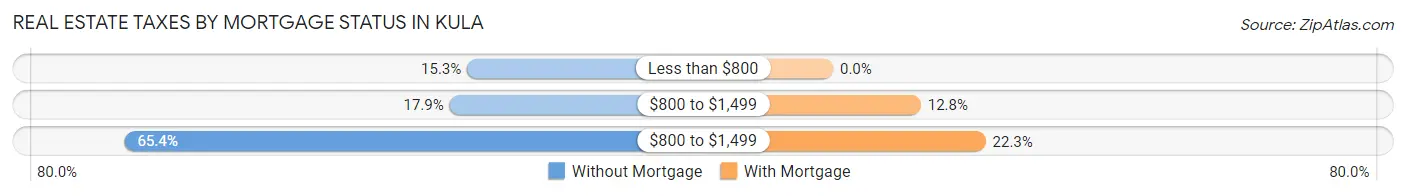
| Property Taxes | Without Mortgage | With Mortgage |
| Less than $800 | 125 (15.3%) | 0 (0.0%) |
| $800 to $1,499 | 146 (17.9%) | 111 (12.8%) |
| $800 to $1,499 | 533 (65.4%) | 193 (22.3%) |
| Total | 815 (100.0%) | 866 (100.0%) |
Health & Disability in Kula
Health Insurance Coverage by Age in Kula
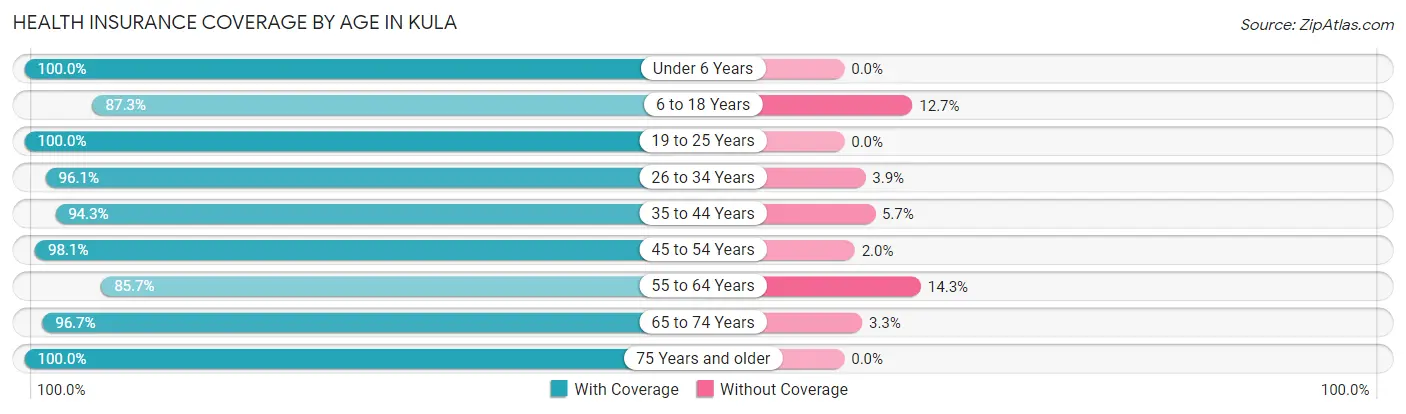
| Age Bracket | With Coverage | Without Coverage |
| Under 6 Years | 362 (100.0%) | 0 (0.0%) |
| 6 to 18 Years | 970 (87.3%) | 141 (12.7%) |
| 19 to 25 Years | 52 (100.0%) | 0 (0.0%) |
| 26 to 34 Years | 514 (96.1%) | 21 (3.9%) |
| 35 to 44 Years | 808 (94.3%) | 49 (5.7%) |
| 45 to 54 Years | 804 (98.1%) | 16 (1.9%) |
| 55 to 64 Years | 1,002 (85.7%) | 167 (14.3%) |
| 65 to 74 Years | 1,052 (96.7%) | 36 (3.3%) |
| 75 Years and older | 584 (100.0%) | 0 (0.0%) |
| Total | 6,148 (93.5%) | 430 (6.5%) |
Health Insurance Coverage by Citizenship Status in Kula
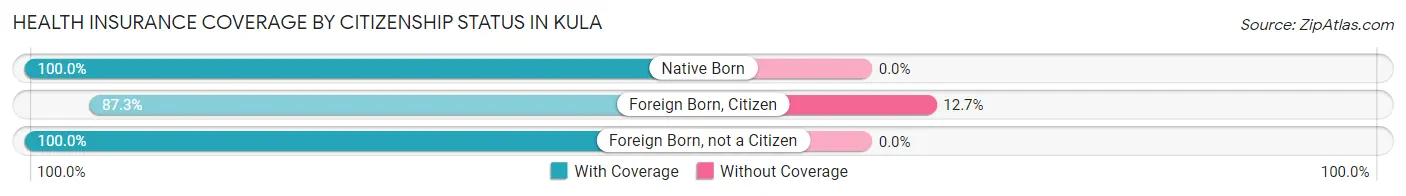
| Citizenship Status | With Coverage | Without Coverage |
| Native Born | 362 (100.0%) | 0 (0.0%) |
| Foreign Born, Citizen | 970 (87.3%) | 141 (12.7%) |
| Foreign Born, not a Citizen | 52 (100.0%) | 0 (0.0%) |
Health Insurance Coverage by Household Income in Kula
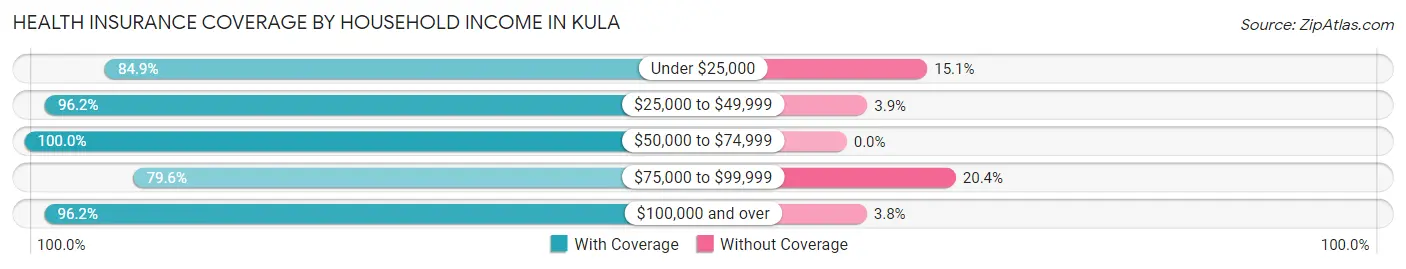
| Household Income | With Coverage | Without Coverage |
| Under $25,000 | 405 (84.9%) | 72 (15.1%) |
| $25,000 to $49,999 | 725 (96.2%) | 29 (3.8%) |
| $50,000 to $74,999 | 697 (100.0%) | 0 (0.0%) |
| $75,000 to $99,999 | 740 (79.6%) | 190 (20.4%) |
| $100,000 and over | 3,562 (96.2%) | 139 (3.8%) |
Public vs Private Health Insurance Coverage by Age in Kula
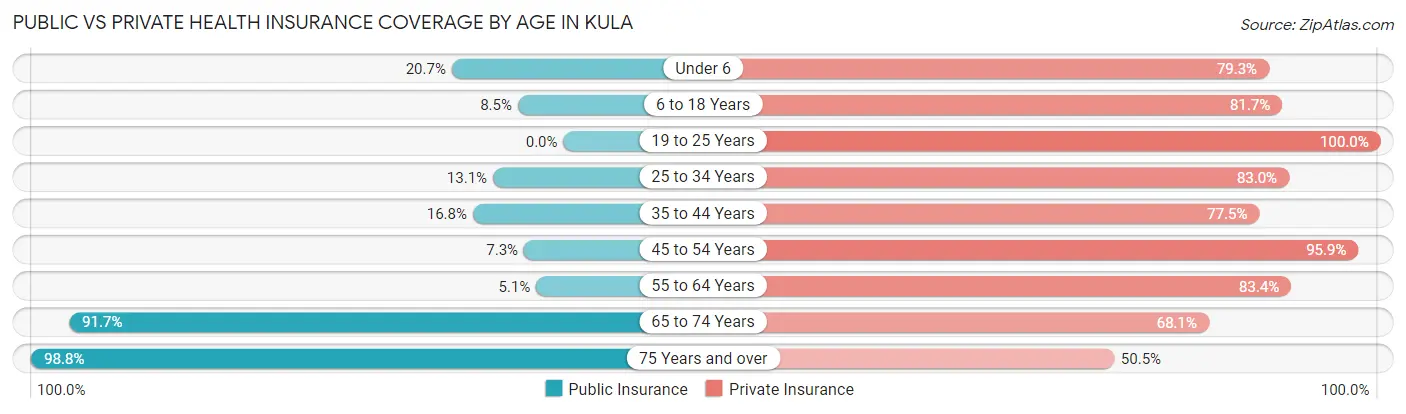
| Age Bracket | Public Insurance | Private Insurance |
| Under 6 | 75 (20.7%) | 287 (79.3%) |
| 6 to 18 Years | 94 (8.5%) | 908 (81.7%) |
| 19 to 25 Years | 0 (0.0%) | 52 (100.0%) |
| 25 to 34 Years | 70 (13.1%) | 444 (83.0%) |
| 35 to 44 Years | 144 (16.8%) | 664 (77.5%) |
| 45 to 54 Years | 60 (7.3%) | 786 (95.9%) |
| 55 to 64 Years | 59 (5.1%) | 975 (83.4%) |
| 65 to 74 Years | 998 (91.7%) | 741 (68.1%) |
| 75 Years and over | 577 (98.8%) | 295 (50.5%) |
| Total | 2,077 (31.6%) | 5,152 (78.3%) |
Disability Status by Sex by Age in Kula
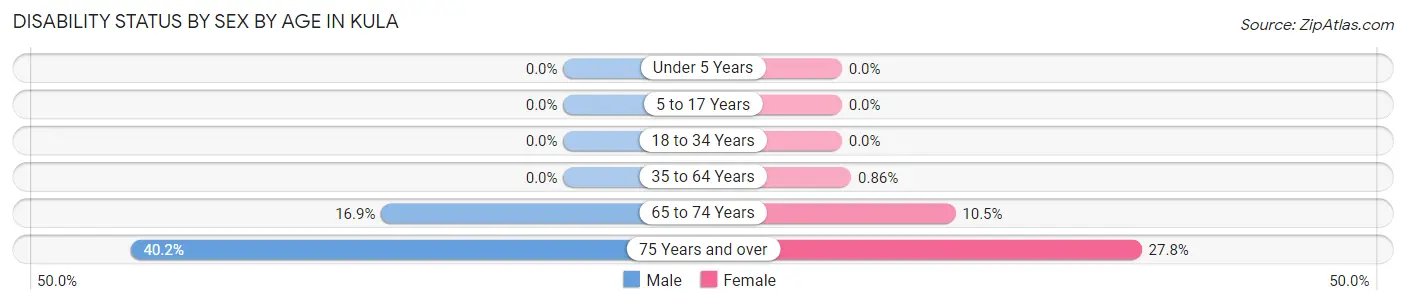
| Age Bracket | Male | Female |
| Under 5 Years | 0 (0.0%) | 0 (0.0%) |
| 5 to 17 Years | 0 (0.0%) | 0 (0.0%) |
| 18 to 34 Years | 0 (0.0%) | 0 (0.0%) |
| 35 to 64 Years | 0 (0.0%) | 13 (0.9%) |
| 65 to 74 Years | 86 (16.9%) | 61 (10.5%) |
| 75 Years and over | 96 (40.2%) | 96 (27.8%) |
Disability Class by Sex by Age in Kula
Disability Class: Hearing Difficulty
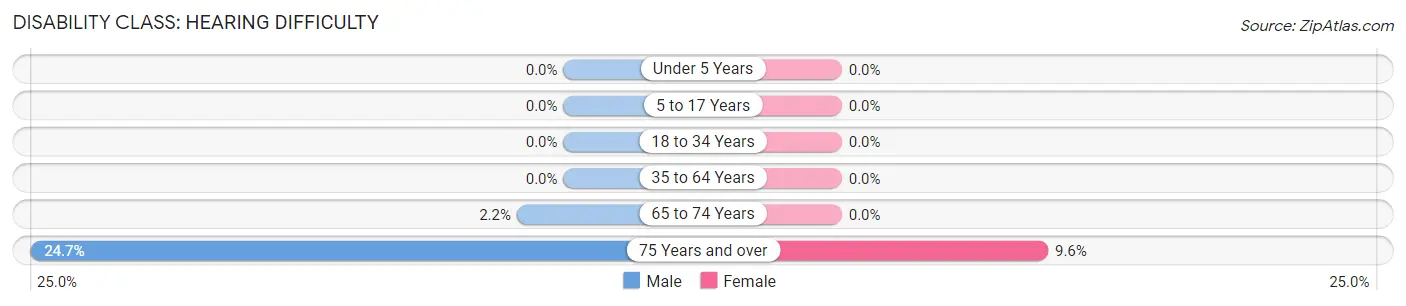
| Age Bracket | Male | Female |
| Under 5 Years | 0 (0.0%) | 0 (0.0%) |
| 5 to 17 Years | 0 (0.0%) | 0 (0.0%) |
| 18 to 34 Years | 0 (0.0%) | 0 (0.0%) |
| 35 to 64 Years | 0 (0.0%) | 0 (0.0%) |
| 65 to 74 Years | 11 (2.2%) | 0 (0.0%) |
| 75 Years and over | 59 (24.7%) | 33 (9.6%) |
Disability Class: Vision Difficulty
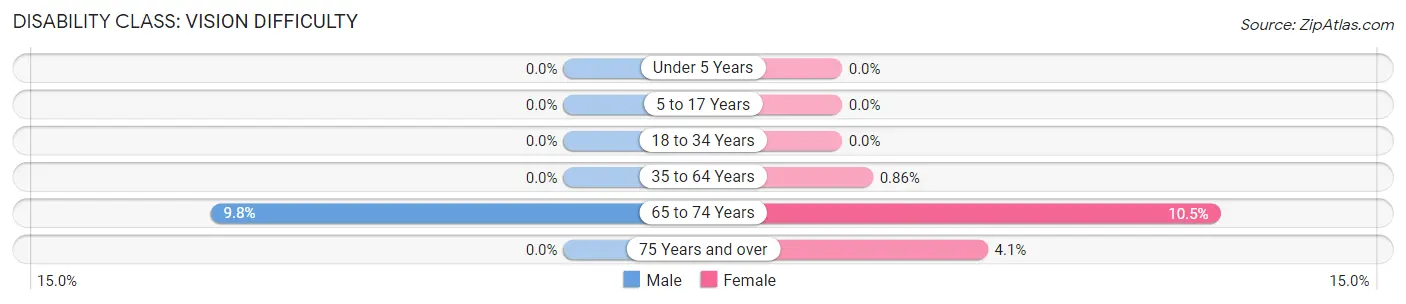
| Age Bracket | Male | Female |
| Under 5 Years | 0 (0.0%) | 0 (0.0%) |
| 5 to 17 Years | 0 (0.0%) | 0 (0.0%) |
| 18 to 34 Years | 0 (0.0%) | 0 (0.0%) |
| 35 to 64 Years | 0 (0.0%) | 13 (0.9%) |
| 65 to 74 Years | 50 (9.8%) | 61 (10.5%) |
| 75 Years and over | 0 (0.0%) | 14 (4.1%) |
Disability Class: Cognitive Difficulty
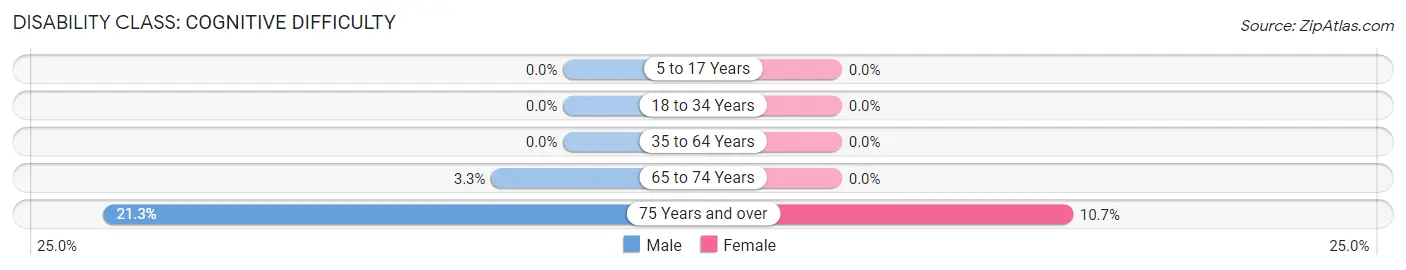
| Age Bracket | Male | Female |
| 5 to 17 Years | 0 (0.0%) | 0 (0.0%) |
| 18 to 34 Years | 0 (0.0%) | 0 (0.0%) |
| 35 to 64 Years | 0 (0.0%) | 0 (0.0%) |
| 65 to 74 Years | 17 (3.3%) | 0 (0.0%) |
| 75 Years and over | 51 (21.3%) | 37 (10.7%) |
Disability Class: Ambulatory Difficulty
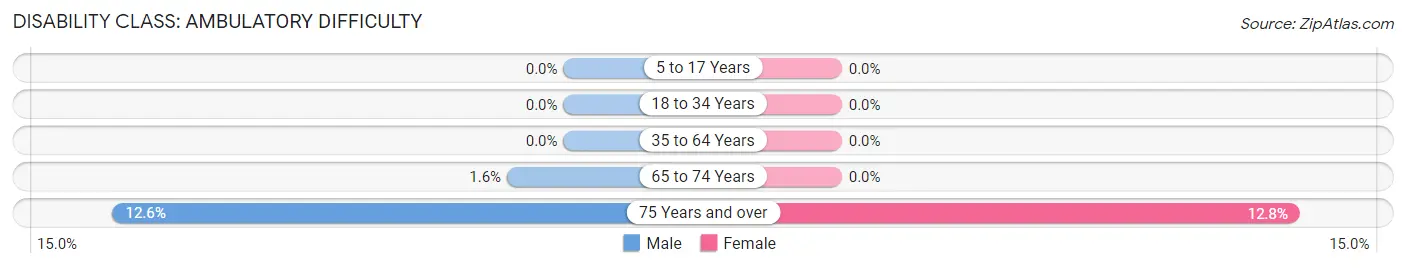
| Age Bracket | Male | Female |
| 5 to 17 Years | 0 (0.0%) | 0 (0.0%) |
| 18 to 34 Years | 0 (0.0%) | 0 (0.0%) |
| 35 to 64 Years | 0 (0.0%) | 0 (0.0%) |
| 65 to 74 Years | 8 (1.6%) | 0 (0.0%) |
| 75 Years and over | 30 (12.6%) | 44 (12.8%) |
Disability Class: Self-Care Difficulty
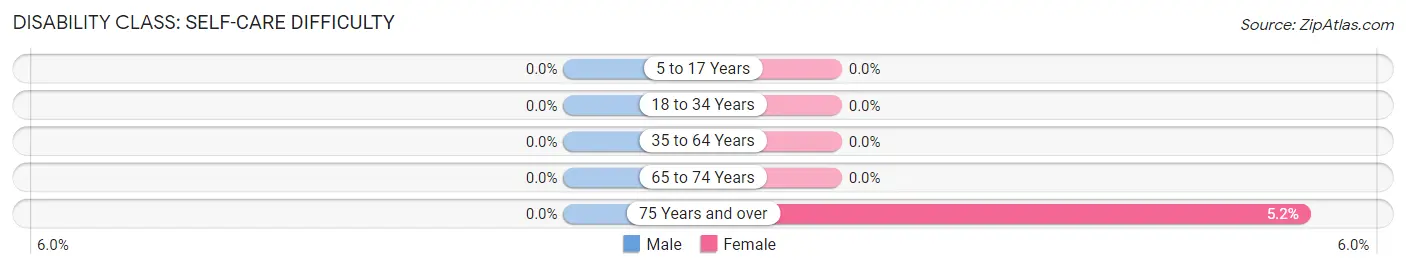
| Age Bracket | Male | Female |
| 5 to 17 Years | 0 (0.0%) | 0 (0.0%) |
| 18 to 34 Years | 0 (0.0%) | 0 (0.0%) |
| 35 to 64 Years | 0 (0.0%) | 0 (0.0%) |
| 65 to 74 Years | 0 (0.0%) | 0 (0.0%) |
| 75 Years and over | 0 (0.0%) | 18 (5.2%) |
Technology Access in Kula
Computing Device Access in Kula
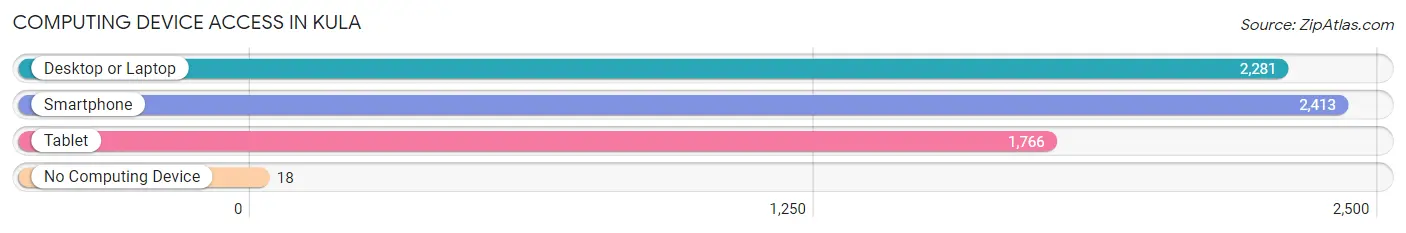
| Device Type | # Households | % Households |
| Desktop or Laptop | 2,281 | 92.0% |
| Smartphone | 2,413 | 97.3% |
| Tablet | 1,766 | 71.2% |
| No Computing Device | 18 | 0.7% |
| Total | 2,480 | 100.0% |
Internet Access in Kula
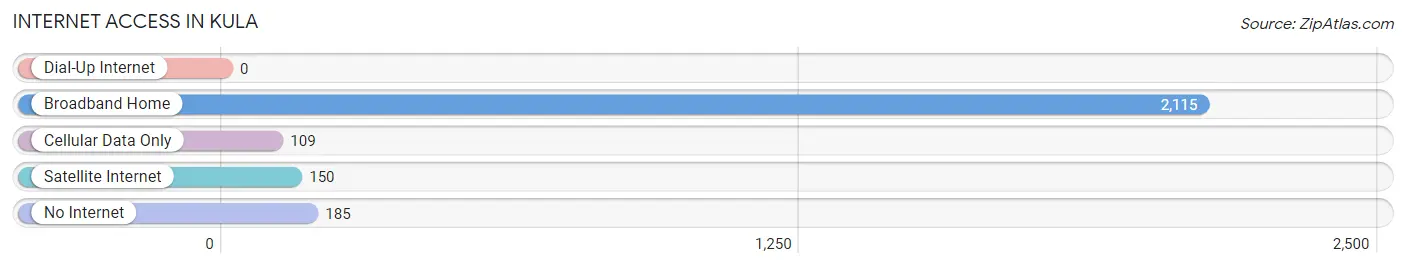
| Internet Type | # Households | % Households |
| Dial-Up Internet | 0 | 0.0% |
| Broadband Home | 2,115 | 85.3% |
| Cellular Data Only | 109 | 4.4% |
| Satellite Internet | 150 | 6.0% |
| No Internet | 185 | 7.5% |
| Total | 2,480 | 100.0% |
Kula Summary
Kula is a small unincorporated community located in the upcountry region of Maui, Hawaii. It is located in the Kula district of Maui County, and is situated at an elevation of 2,500 feet above sea level. Kula is known for its cooler temperatures, lush green landscape, and stunning views of the Pacific Ocean.
History
Kula was first settled by Native Hawaiians in the early 1800s. The area was used for farming and ranching, and the local population grew steadily over the years. In the late 1800s, Kula became a popular destination for wealthy visitors from the mainland United States. These visitors built large estates and homes in the area, and the population of Kula began to grow rapidly.
In the early 1900s, Kula was home to a thriving sugar cane industry. The area was also known for its pineapple plantations, and the local economy was largely based on these two industries. In the 1950s, the sugar cane industry began to decline, and the pineapple industry soon followed. This led to a period of economic decline in Kula, and the population began to decline as well.
In the late 1970s, Kula began to experience a resurgence in popularity. The area became a popular destination for tourists, and the local economy began to recover. Today, Kula is a popular destination for visitors from all over the world. The area is known for its stunning views, cooler temperatures, and lush green landscape.
Geography
Kula is located in the Kula district of Maui County, and is situated at an elevation of 2,500 feet above sea level. The area is known for its cooler temperatures, lush green landscape, and stunning views of the Pacific Ocean. Kula is surrounded by the West Maui Mountains to the west, and the Haleakala volcano to the east. The area is also home to several small streams and rivers, as well as numerous waterfalls.
Economy
Kula’s economy is largely based on tourism. The area is home to several resorts, hotels, and vacation rentals, and is a popular destination for visitors from all over the world. The area is also home to several small businesses, including restaurants, shops, and galleries. Agriculture is also an important part of the local economy, and the area is known for its production of coffee, macadamia nuts, and other crops.
Demographics
As of the 2010 census, the population of Kula was 2,941. The population is largely made up of Native Hawaiians, with a small percentage of other ethnicities. The median household income in Kula is $63,917, and the median home value is $541,000. The area is known for its low crime rate, and is considered to be a safe and peaceful place to live.
Common Questions
What is Per Capita Income in Kula?
Per Capita income in Kula is $51,104.
What is the Median Family Income in Kula?
Median Family Income in Kula is $109,325.
What is the Median Household income in Kula?
Median Household Income in Kula is $93,452.
What is Income or Wage Gap in Kula?
Income or Wage Gap in Kula is 23.4%.
Women in Kula earn 76.6 cents for every dollar earned by a man.
What is Family Income Deficit in Kula?
Family Income Deficit in Kula is $6,773.
Families that are below poverty line in Kula earn $6,773 less on average than the poverty threshold level.
What is Inequality or Gini Index in Kula?
Inequality or Gini Index in Kula is 0.47.
What is the Total Population of Kula?
Total Population of Kula is 6,578.
What is the Total Male Population of Kula?
Total Male Population of Kula is 3,156.
What is the Total Female Population of Kula?
Total Female Population of Kula is 3,422.
What is the Ratio of Males per 100 Females in Kula?
There are 92.23 Males per 100 Females in Kula.
What is the Ratio of Females per 100 Males in Kula?
There are 108.43 Females per 100 Males in Kula.
What is the Median Population Age in Kula?
Median Population Age in Kula is 49.7 Years.
What is the Average Family Size in Kula
Average Family Size in Kula is 3.0 People.
What is the Average Household Size in Kula
Average Household Size in Kula is 2.6 People.
How Large is the Labor Force in Kula?
There are 2,957 People in the Labor Forcein in Kula.
What is the Percentage of People in the Labor Force in Kula?
56.5% of People are in the Labor Force in Kula.
What is the Unemployment Rate in Kula?
Unemployment Rate in Kula is 4.0%.