Wailuku, HI Map & Demographics
Wailuku Map
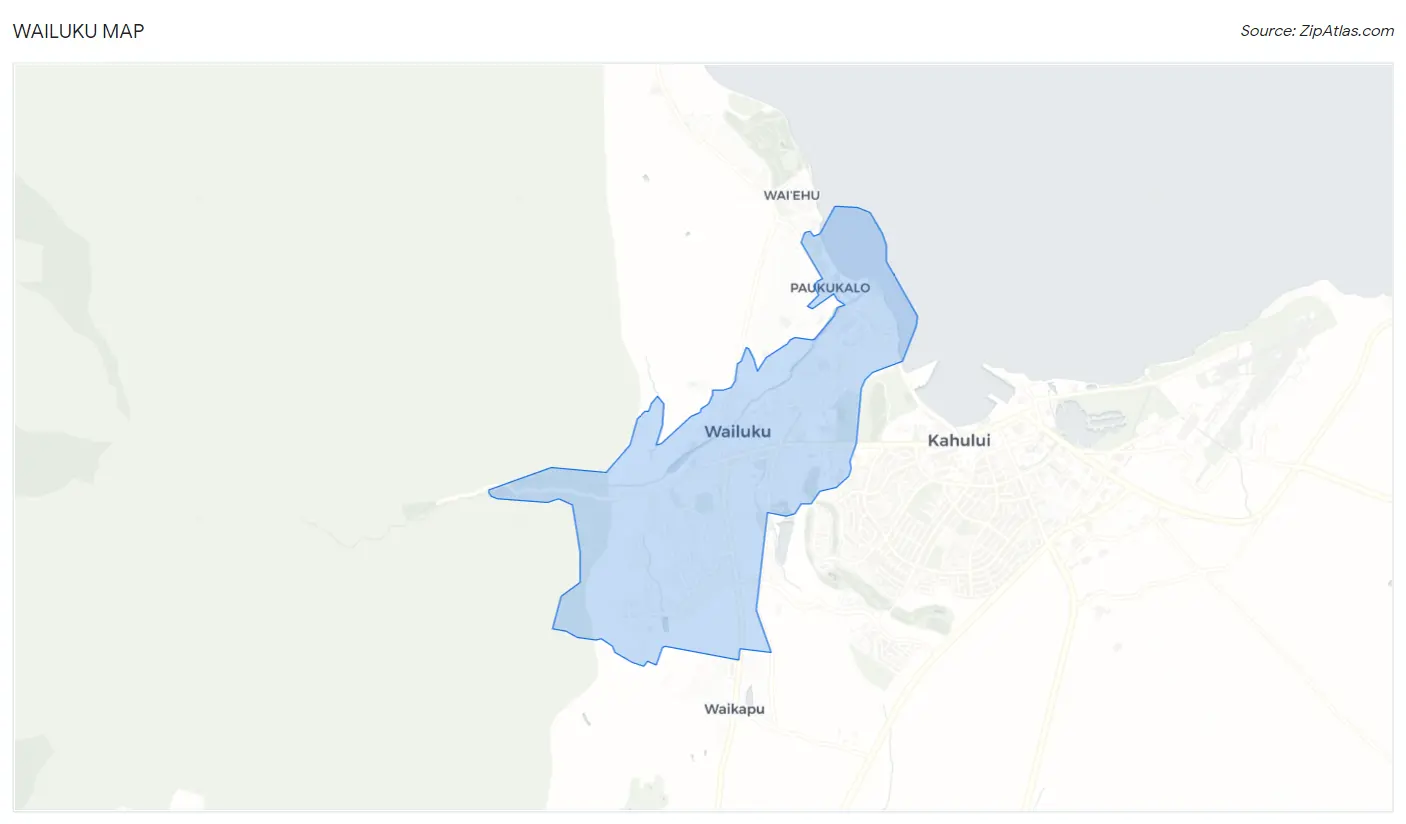
Wailuku Overview
$41,970
PER CAPITA INCOME
$110,571
AVG FAMILY INCOME
$93,908
AVG HOUSEHOLD INCOME
15.0%
WAGE / INCOME GAP [ % ]
85.0¢/ $1
WAGE / INCOME GAP [ $ ]
0.43
INEQUALITY / GINI INDEX
16,590
TOTAL POPULATION
8,489
MALE POPULATION
8,101
FEMALE POPULATION
104.79
MALES / 100 FEMALES
95.43
FEMALES / 100 MALES
40.3
MEDIAN AGE
3.5
AVG FAMILY SIZE
2.8
AVG HOUSEHOLD SIZE
8,330
LABOR FORCE [ PEOPLE ]
65.6%
PERCENT IN LABOR FORCE
3.5%
UNEMPLOYMENT RATE
Wailuku Zip Codes
Wailuku Area Codes
Income in Wailuku
Income Overview in Wailuku
Per Capita Income in Wailuku is $41,970, while median incomes of families and households are $110,571 and $93,908 respectively.
| Characteristic | Number | Measure |
| Per Capita Income | 16,590 | $41,970 |
| Median Family Income | 3,893 | $110,571 |
| Mean Family Income | 3,893 | $129,701 |
| Median Household Income | 5,934 | $93,908 |
| Mean Household Income | 5,934 | $114,749 |
| Income Deficit | 3,893 | $0 |
| Wage / Income Gap (%) | 16,590 | 15.00% |
| Wage / Income Gap ($) | 16,590 | 85.00¢ per $1 |
| Gini / Inequality Index | 16,590 | 0.43 |
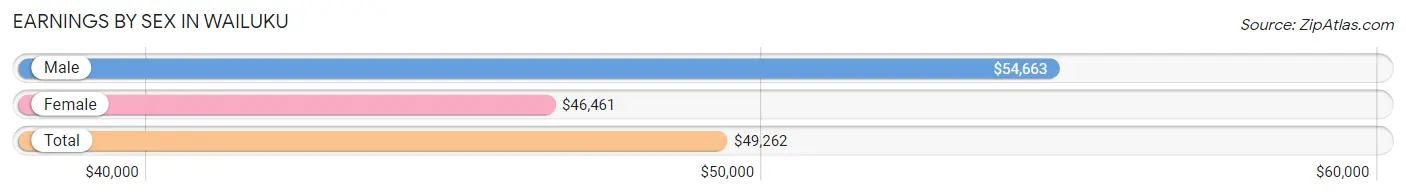
Earnings by Sex in Wailuku
Average Earnings in Wailuku are $49,262, $54,663 for men and $46,461 for women, a difference of 15.0%.
| Sex | Number | Average Earnings |
| Male | 4,552 (52.5%) | $54,663 |
| Female | 4,117 (47.5%) | $46,461 |
| Total | 8,669 (100.0%) | $49,262 |
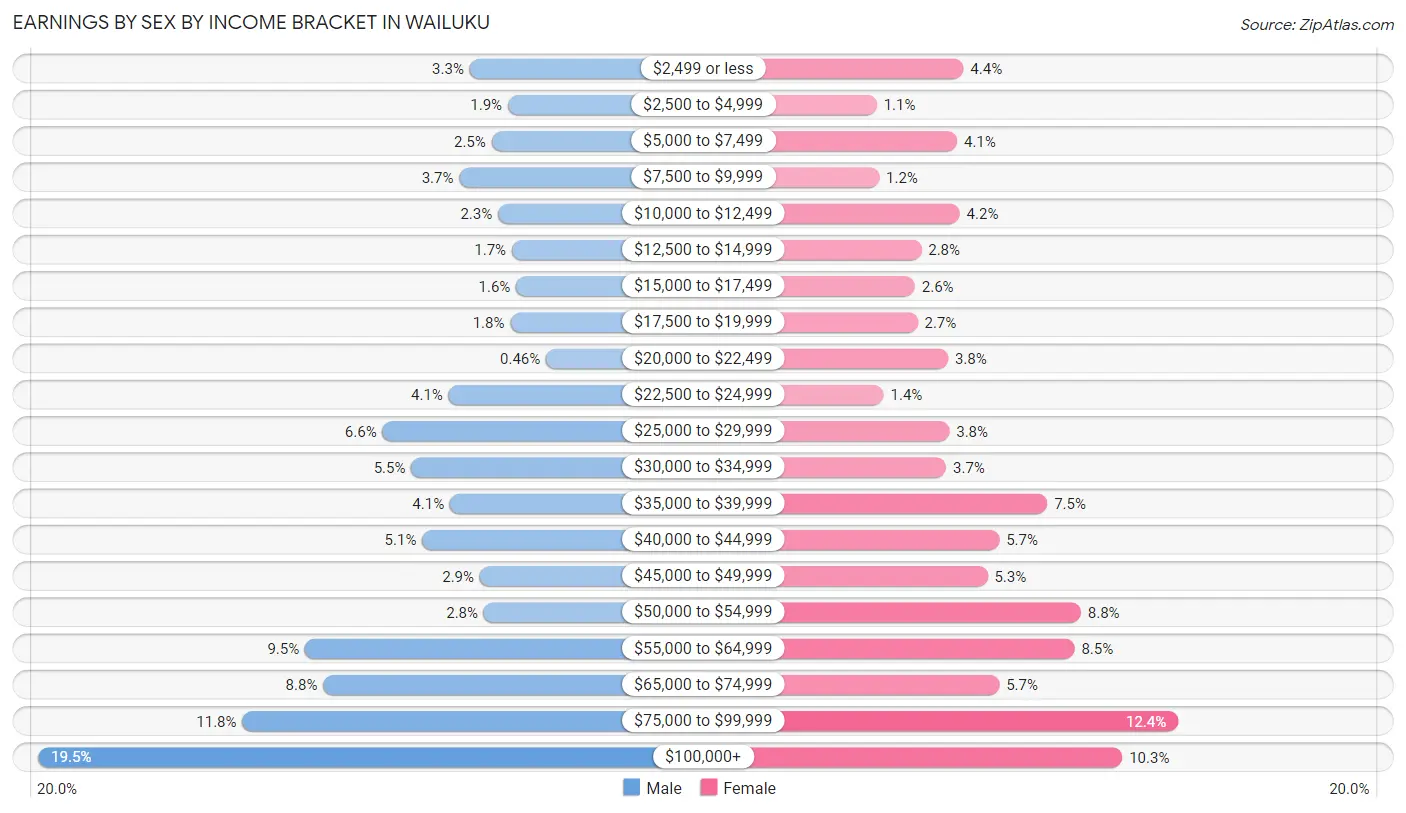
Earnings by Sex by Income Bracket in Wailuku
The most common earnings brackets in Wailuku are $100,000+ for men (887 | 19.5%) and $75,000 to $99,999 for women (511 | 12.4%).
| Income | Male | Female |
| $2,499 or less | 151 (3.3%) | 180 (4.4%) |
| $2,500 to $4,999 | 86 (1.9%) | 46 (1.1%) |
| $5,000 to $7,499 | 114 (2.5%) | 170 (4.1%) |
| $7,500 to $9,999 | 169 (3.7%) | 50 (1.2%) |
| $10,000 to $12,499 | 103 (2.3%) | 174 (4.2%) |
| $12,500 to $14,999 | 79 (1.7%) | 115 (2.8%) |
| $15,000 to $17,499 | 72 (1.6%) | 105 (2.5%) |
| $17,500 to $19,999 | 82 (1.8%) | 109 (2.6%) |
| $20,000 to $22,499 | 21 (0.5%) | 156 (3.8%) |
| $22,500 to $24,999 | 187 (4.1%) | 57 (1.4%) |
| $25,000 to $29,999 | 300 (6.6%) | 158 (3.8%) |
| $30,000 to $34,999 | 251 (5.5%) | 153 (3.7%) |
| $35,000 to $39,999 | 185 (4.1%) | 309 (7.5%) |
| $40,000 to $44,999 | 232 (5.1%) | 235 (5.7%) |
| $45,000 to $49,999 | 134 (2.9%) | 217 (5.3%) |
| $50,000 to $54,999 | 127 (2.8%) | 361 (8.8%) |
| $55,000 to $64,999 | 432 (9.5%) | 351 (8.5%) |
| $65,000 to $74,999 | 401 (8.8%) | 235 (5.7%) |
| $75,000 to $99,999 | 539 (11.8%) | 511 (12.4%) |
| $100,000+ | 887 (19.5%) | 425 (10.3%) |
| Total | 4,552 (100.0%) | 4,117 (100.0%) |
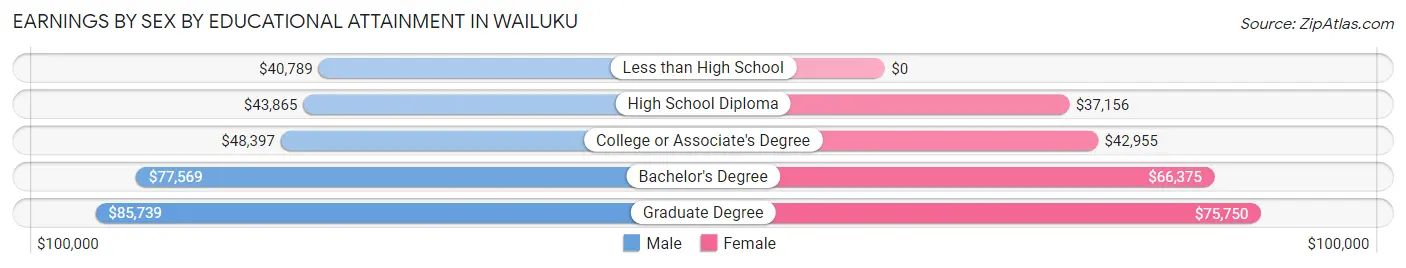
Earnings by Sex by Educational Attainment in Wailuku
Average earnings in Wailuku are $57,970 for men and $51,090 for women, a difference of 11.9%. Men with an educational attainment of graduate degree enjoy the highest average annual earnings of $85,739, while those with less than high school education earn the least with $40,789. Women with an educational attainment of graduate degree earn the most with the average annual earnings of $75,750, while those with high school diploma education have the smallest earnings of $37,156.
| Educational Attainment | Male Income | Female Income |
| Less than High School | $40,789 | $0 |
| High School Diploma | $43,865 | $37,156 |
| College or Associate's Degree | $48,397 | $42,955 |
| Bachelor's Degree | $77,569 | $66,375 |
| Graduate Degree | $85,739 | $75,750 |
| Total | $57,970 | $51,090 |
Family Income in Wailuku
Family Income Brackets in Wailuku
According to the Wailuku family income data, there are 1,156 families falling into the $100,000 to $149,999 income range, which is the most common income bracket and makes up 29.7% of all families. Conversely, the $10,000 to $14,999 income bracket is the least frequent group with only 27 families (0.7%) belonging to this category.
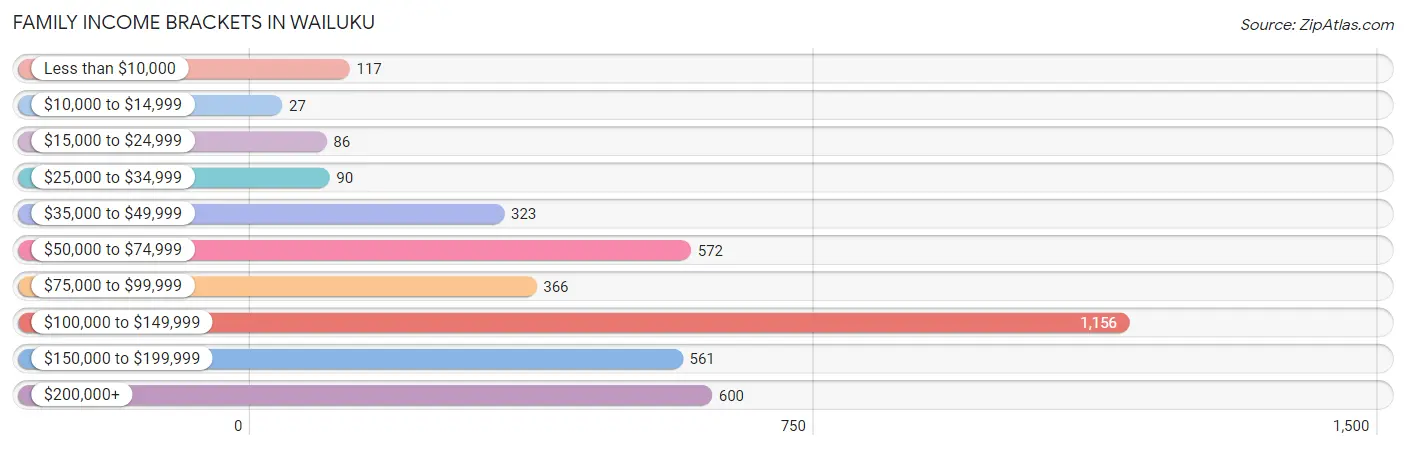
| Income Bracket | # Families | % Families |
| Less than $10,000 | 117 | 3.0% |
| $10,000 to $14,999 | 27 | 0.7% |
| $15,000 to $24,999 | 86 | 2.2% |
| $25,000 to $34,999 | 90 | 2.3% |
| $35,000 to $49,999 | 323 | 8.3% |
| $50,000 to $74,999 | 572 | 14.7% |
| $75,000 to $99,999 | 366 | 9.4% |
| $100,000 to $149,999 | 1,156 | 29.7% |
| $150,000 to $199,999 | 561 | 14.4% |
| $200,000+ | 600 | 15.4% |
Family Income by Famaliy Size in Wailuku
7+ person families (80 | 2.1%) account for the highest median family income in Wailuku with $165,208 per family, while 2-person families (1,433 | 36.8%) have the highest median income of $52,359 per family member.
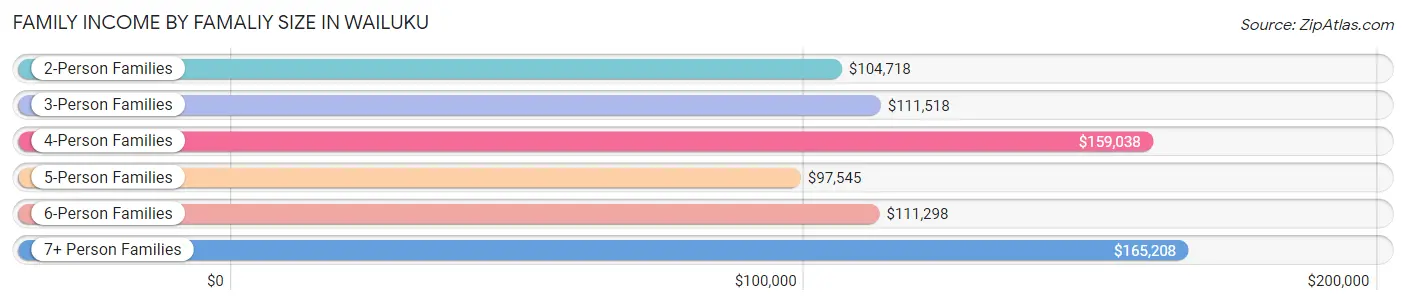
| Income Bracket | # Families | Median Income |
| 2-Person Families | 1,433 (36.8%) | $104,718 |
| 3-Person Families | 837 (21.5%) | $111,518 |
| 4-Person Families | 1,014 (26.1%) | $159,038 |
| 5-Person Families | 367 (9.4%) | $97,545 |
| 6-Person Families | 162 (4.2%) | $111,298 |
| 7+ Person Families | 80 (2.1%) | $165,208 |
| Total | 3,893 (100.0%) | $110,571 |
Family Income by Number of Earners in Wailuku
The median family income in Wailuku is $110,571, with families comprising 3+ earners (600) having the highest median family income of $141,765, while families with no earners (385) have the lowest median family income of $35,904, accounting for 15.4% and 9.9% of families, respectively.
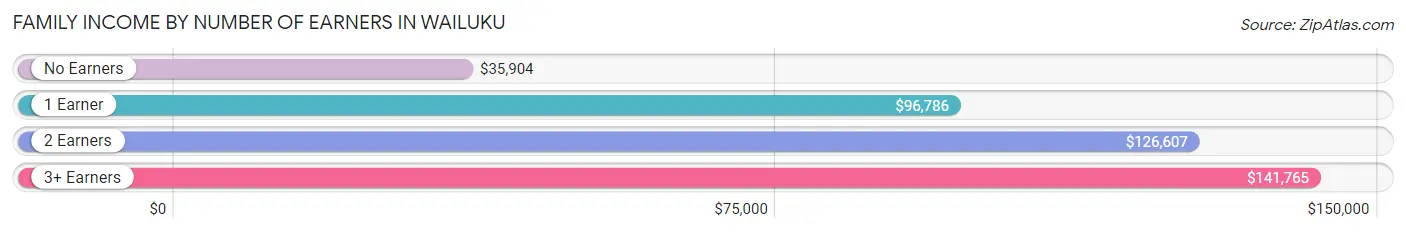
| Number of Earners | # Families | Median Income |
| No Earners | 385 (9.9%) | $35,904 |
| 1 Earner | 1,106 (28.4%) | $96,786 |
| 2 Earners | 1,802 (46.3%) | $126,607 |
| 3+ Earners | 600 (15.4%) | $141,765 |
| Total | 3,893 (100.0%) | $110,571 |
Household Income in Wailuku
Household Income Brackets in Wailuku
With 1,264 households falling in the category, the $100,000 to $149,999 income range is the most frequent in Wailuku, accounting for 21.3% of all households. In contrast, only 172 households (2.9%) fall into the $10,000 to $14,999 income bracket, making it the least populous group.
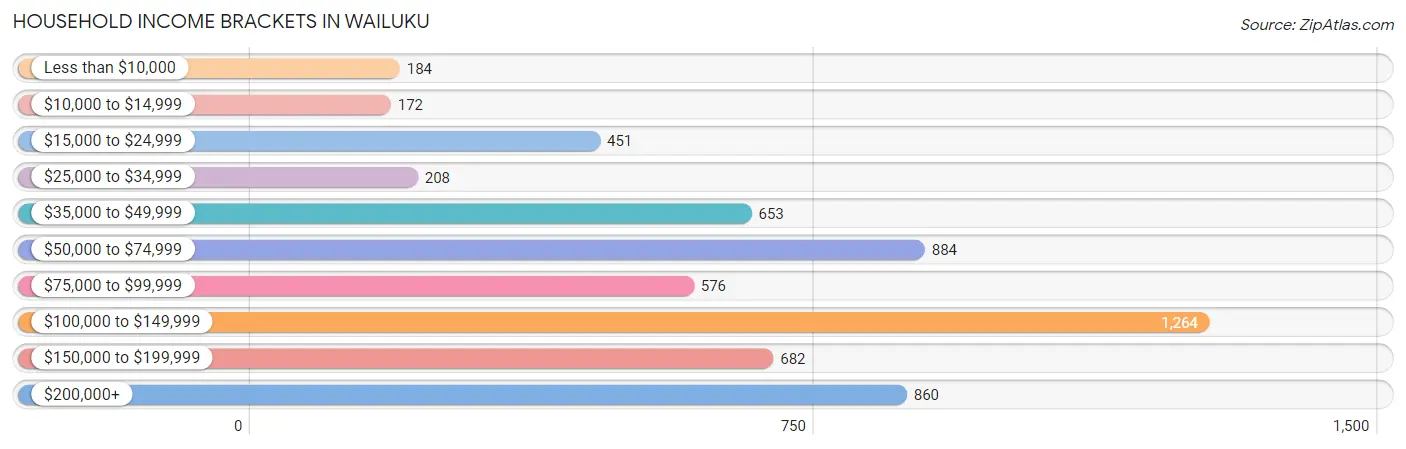
| Income Bracket | # Households | % Households |
| Less than $10,000 | 184 | 3.1% |
| $10,000 to $14,999 | 172 | 2.9% |
| $15,000 to $24,999 | 451 | 7.6% |
| $25,000 to $34,999 | 208 | 3.5% |
| $35,000 to $49,999 | 653 | 11.0% |
| $50,000 to $74,999 | 884 | 14.9% |
| $75,000 to $99,999 | 576 | 9.7% |
| $100,000 to $149,999 | 1,264 | 21.3% |
| $150,000 to $199,999 | 682 | 11.5% |
| $200,000+ | 860 | 14.5% |
Household Income by Householder Age in Wailuku
The median household income in Wailuku is $93,908, with the highest median household income of $110,481 found in the 25 to 44 years age bracket for the primary householder. A total of 1,272 households (21.4%) fall into this category. Meanwhile, the 65+ years age bracket for the primary householder has the lowest median household income of $55,547, with 1,684 households (28.4%) in this group.
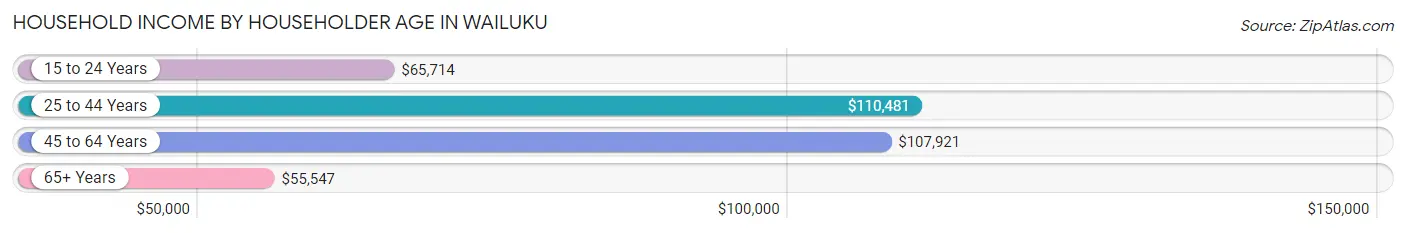
| Income Bracket | # Households | Median Income |
| 15 to 24 Years | 70 (1.2%) | $65,714 |
| 25 to 44 Years | 1,272 (21.4%) | $110,481 |
| 45 to 64 Years | 2,908 (49.0%) | $107,921 |
| 65+ Years | 1,684 (28.4%) | $55,547 |
| Total | 5,934 (100.0%) | $93,908 |
Poverty in Wailuku
Income Below Poverty by Sex and Age in Wailuku
With 5.3% poverty level for males and 6.1% for females among the residents of Wailuku, 12 to 14 year old males and 16 and 17 year old females are the most vulnerable to poverty, with 53 males (16.6%) and 35 females (14.1%) in their respective age groups living below the poverty level.
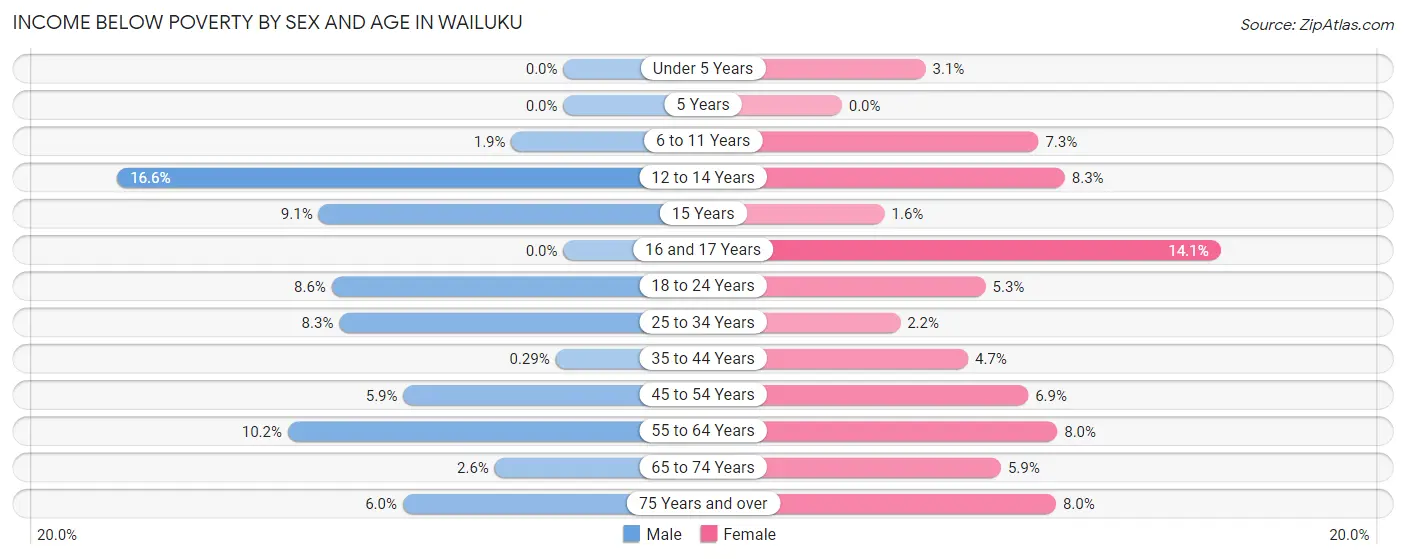
| Age Bracket | Male | Female |
| Under 5 Years | 0 (0.0%) | 17 (3.1%) |
| 5 Years | 0 (0.0%) | 0 (0.0%) |
| 6 to 11 Years | 17 (1.9%) | 46 (7.3%) |
| 12 to 14 Years | 53 (16.6%) | 28 (8.3%) |
| 15 Years | 8 (9.1%) | 1 (1.6%) |
| 16 and 17 Years | 0 (0.0%) | 35 (14.1%) |
| 18 to 24 Years | 45 (8.6%) | 30 (5.3%) |
| 25 to 34 Years | 87 (8.3%) | 14 (2.2%) |
| 35 to 44 Years | 3 (0.3%) | 48 (4.7%) |
| 45 to 54 Years | 63 (5.9%) | 74 (6.9%) |
| 55 to 64 Years | 121 (10.2%) | 105 (8.0%) |
| 65 to 74 Years | 25 (2.5%) | 42 (5.9%) |
| 75 Years and over | 27 (6.0%) | 50 (8.0%) |
| Total | 449 (5.3%) | 490 (6.1%) |
Income Above Poverty by Sex and Age in Wailuku
According to the poverty statistics in Wailuku, males aged under 5 years and females aged 5 years are the age groups that are most secure financially, with 100.0% of males and 100.0% of females in these age groups living above the poverty line.
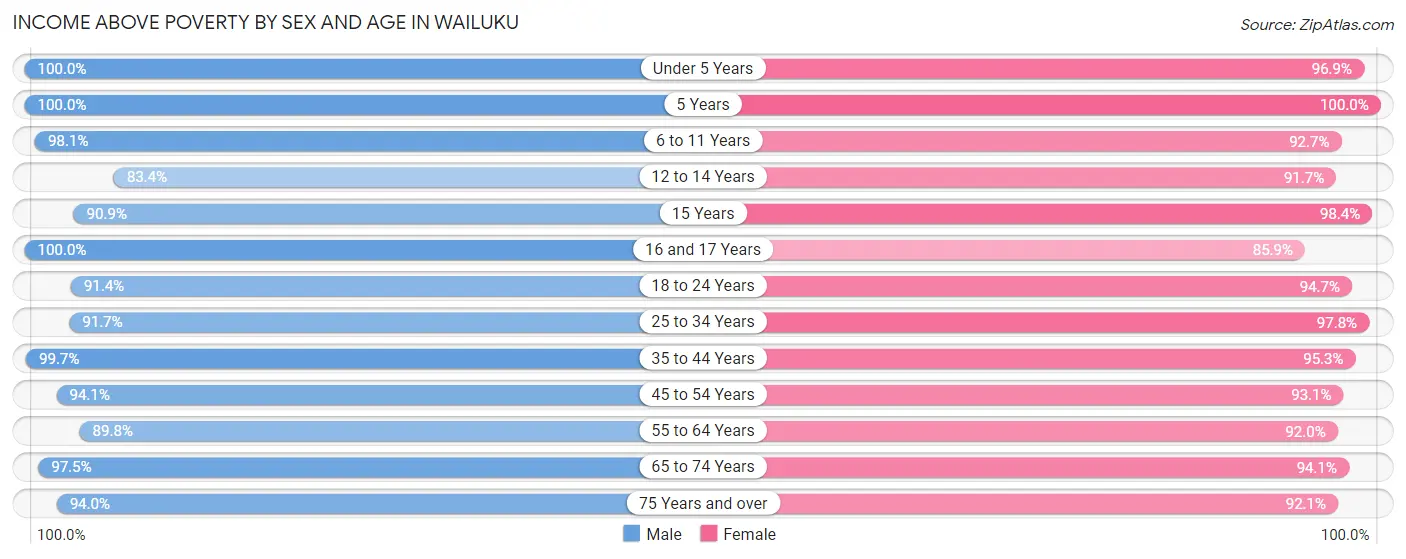
| Age Bracket | Male | Female |
| Under 5 Years | 629 (100.0%) | 530 (96.9%) |
| 5 Years | 109 (100.0%) | 269 (100.0%) |
| 6 to 11 Years | 862 (98.1%) | 584 (92.7%) |
| 12 to 14 Years | 267 (83.4%) | 310 (91.7%) |
| 15 Years | 80 (90.9%) | 62 (98.4%) |
| 16 and 17 Years | 136 (100.0%) | 214 (85.9%) |
| 18 to 24 Years | 478 (91.4%) | 532 (94.7%) |
| 25 to 34 Years | 959 (91.7%) | 632 (97.8%) |
| 35 to 44 Years | 1,021 (99.7%) | 976 (95.3%) |
| 45 to 54 Years | 997 (94.1%) | 995 (93.1%) |
| 55 to 64 Years | 1,062 (89.8%) | 1,208 (92.0%) |
| 65 to 74 Years | 956 (97.5%) | 669 (94.1%) |
| 75 Years and over | 426 (94.0%) | 579 (92.0%) |
| Total | 7,982 (94.7%) | 7,560 (93.9%) |
Income Below Poverty Among Married-Couple Families in Wailuku
The poverty statistics for married-couple families in Wailuku show that 3.3% or 100 of the total 3,043 families live below the poverty line. Families with 1 or 2 children have the highest poverty rate of 3.9%, comprising of 45 families. On the other hand, families with 5 or more children have the lowest poverty rate of 0.0%, which includes 0 families.
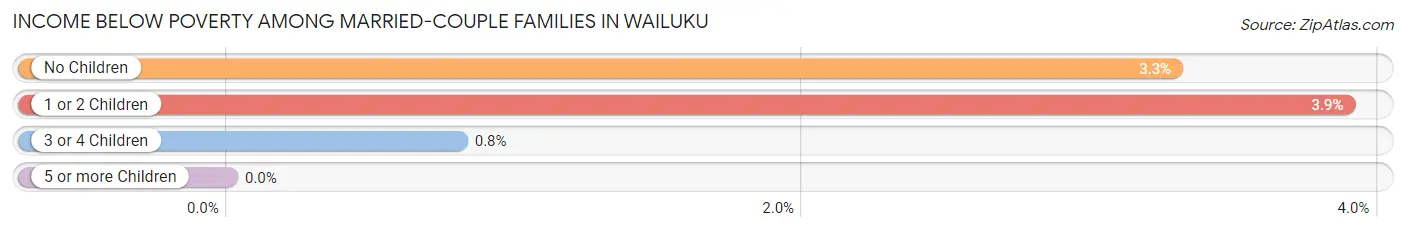
| Children | Above Poverty | Below Poverty |
| No Children | 1,559 (96.7%) | 53 (3.3%) |
| 1 or 2 Children | 1,113 (96.1%) | 45 (3.9%) |
| 3 or 4 Children | 247 (99.2%) | 2 (0.8%) |
| 5 or more Children | 24 (100.0%) | 0 (0.0%) |
| Total | 2,943 (96.7%) | 100 (3.3%) |
Income Below Poverty Among Single-Parent Households in Wailuku
According to the poverty data in Wailuku, 17.1% or 27 single-father households and 7.2% or 50 single-mother households are living below the poverty line. Among single-father households, those with 3 or 4 children have the highest poverty rate, with 26 households (86.7%) experiencing poverty. Likewise, among single-mother households, those with 1 or 2 children have the highest poverty rate, with 40 households (10.5%) falling below the poverty line.
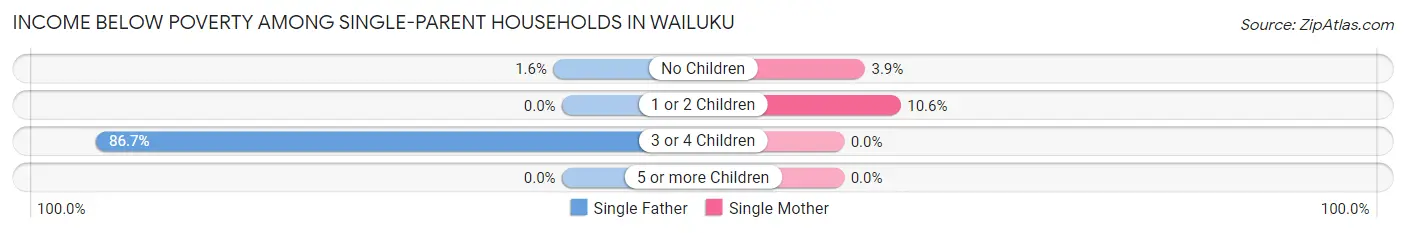
| Children | Single Father | Single Mother |
| No Children | 1 (1.6%) | 10 (3.9%) |
| 1 or 2 Children | 0 (0.0%) | 40 (10.5%) |
| 3 or 4 Children | 26 (86.7%) | 0 (0.0%) |
| 5 or more Children | 0 (0.0%) | 0 (0.0%) |
| Total | 27 (17.1%) | 50 (7.2%) |
Income Below Poverty Among Married-Couple vs Single-Parent Households in Wailuku
The poverty data for Wailuku shows that 100 of the married-couple family households (3.3%) and 77 of the single-parent households (9.1%) are living below the poverty level. Within the married-couple family households, those with 1 or 2 children have the highest poverty rate, with 45 households (3.9%) falling below the poverty line. Among the single-parent households, those with 3 or 4 children have the highest poverty rate, with 26 household (30.2%) living below poverty.
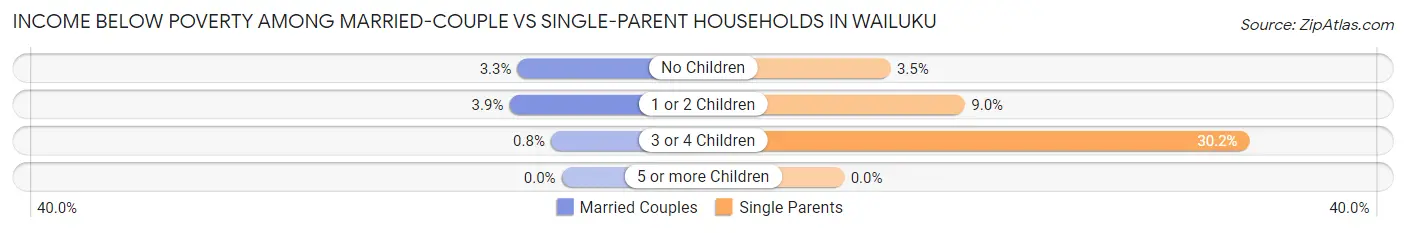
| Children | Married-Couple Families | Single-Parent Households |
| No Children | 53 (3.3%) | 11 (3.5%) |
| 1 or 2 Children | 45 (3.9%) | 40 (9.0%) |
| 3 or 4 Children | 2 (0.8%) | 26 (30.2%) |
| 5 or more Children | 0 (0.0%) | 0 (0.0%) |
| Total | 100 (3.3%) | 77 (9.1%) |
Race in Wailuku
The most populous races in Wailuku are Asian (5,573 | 33.6%), Two or more Races (5,332 | 32.1%), and White / Caucasian (3,384 | 20.4%).
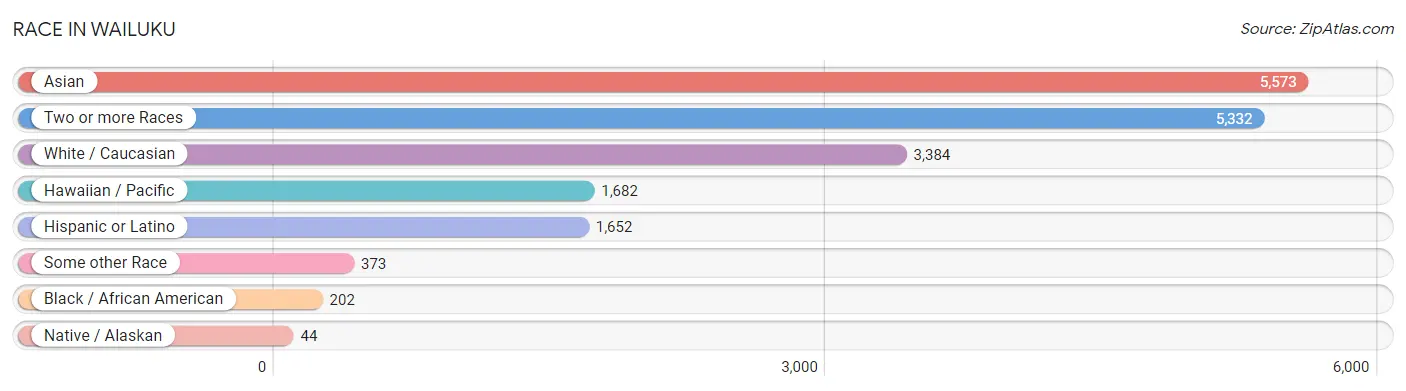
| Race | # Population | % Population |
| Asian | 5,573 | 33.6% |
| Black / African American | 202 | 1.2% |
| Hawaiian / Pacific | 1,682 | 10.1% |
| Hispanic or Latino | 1,652 | 10.0% |
| Native / Alaskan | 44 | 0.3% |
| White / Caucasian | 3,384 | 20.4% |
| Two or more Races | 5,332 | 32.1% |
| Some other Race | 373 | 2.2% |
| Total | 16,590 | 100.0% |
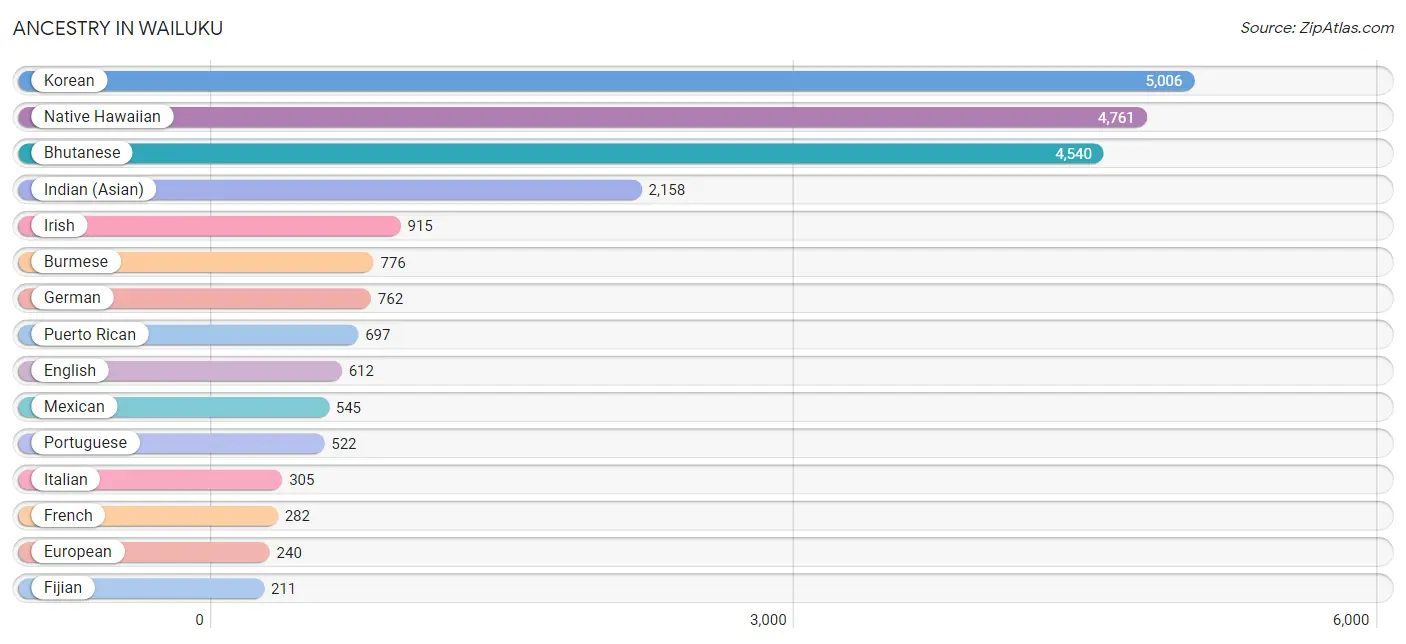
Ancestry in Wailuku
The most populous ancestries reported in Wailuku are Korean (5,006 | 30.2%), Native Hawaiian (4,761 | 28.7%), Bhutanese (4,540 | 27.4%), Indian (Asian) (2,158 | 13.0%), and Irish (915 | 5.5%), together accounting for 104.8% of all Wailuku residents.
| Ancestry | # Population | % Population |
| American | 34 | 0.2% |
| Arab | 11 | 0.1% |
| Argentinean | 15 | 0.1% |
| Australian | 30 | 0.2% |
| Austrian | 57 | 0.3% |
| Bhutanese | 4,540 | 27.4% |
| British | 59 | 0.4% |
| Burmese | 776 | 4.7% |
| Central American | 71 | 0.4% |
| Central American Indian | 40 | 0.2% |
| Cherokee | 115 | 0.7% |
| Chinese | 203 | 1.2% |
| Choctaw | 44 | 0.3% |
| Colombian | 93 | 0.6% |
| Czech | 51 | 0.3% |
| Czechoslovakian | 21 | 0.1% |
| Danish | 39 | 0.2% |
| Dominican | 50 | 0.3% |
| Dutch | 102 | 0.6% |
| Eastern European | 47 | 0.3% |
| English | 612 | 3.7% |
| European | 240 | 1.5% |
| Fijian | 211 | 1.3% |
| Finnish | 13 | 0.1% |
| French | 282 | 1.7% |
| French Canadian | 4 | 0.0% |
| German | 762 | 4.6% |
| Greek | 20 | 0.1% |
| Hungarian | 33 | 0.2% |
| Icelander | 7 | 0.0% |
| Indian (Asian) | 2,158 | 13.0% |
| Irish | 915 | 5.5% |
| Iroquois | 17 | 0.1% |
| Italian | 305 | 1.8% |
| Korean | 5,006 | 30.2% |
| Lithuanian | 27 | 0.2% |
| Mexican | 545 | 3.3% |
| Mexican American Indian | 41 | 0.3% |
| Native Hawaiian | 4,761 | 28.7% |
| Northern European | 20 | 0.1% |
| Norwegian | 41 | 0.3% |
| Ottawa | 4 | 0.0% |
| Pakistani | 121 | 0.7% |
| Polish | 210 | 1.3% |
| Portuguese | 522 | 3.2% |
| Puerto Rican | 697 | 4.2% |
| Romanian | 11 | 0.1% |
| Russian | 143 | 0.9% |
| Salvadoran | 71 | 0.4% |
| Samoan | 101 | 0.6% |
| Scotch-Irish | 63 | 0.4% |
| Scottish | 123 | 0.7% |
| South American | 138 | 0.8% |
| Spaniard | 23 | 0.1% |
| Spanish | 124 | 0.7% |
| Sri Lankan | 136 | 0.8% |
| Swedish | 132 | 0.8% |
| Swiss | 16 | 0.1% |
| Thai | 12 | 0.1% |
| Tongan | 179 | 1.1% |
| Trinidadian and Tobagonian | 10 | 0.1% |
| Venezuelan | 30 | 0.2% |
| Welsh | 22 | 0.1% | View All 63 Rows |
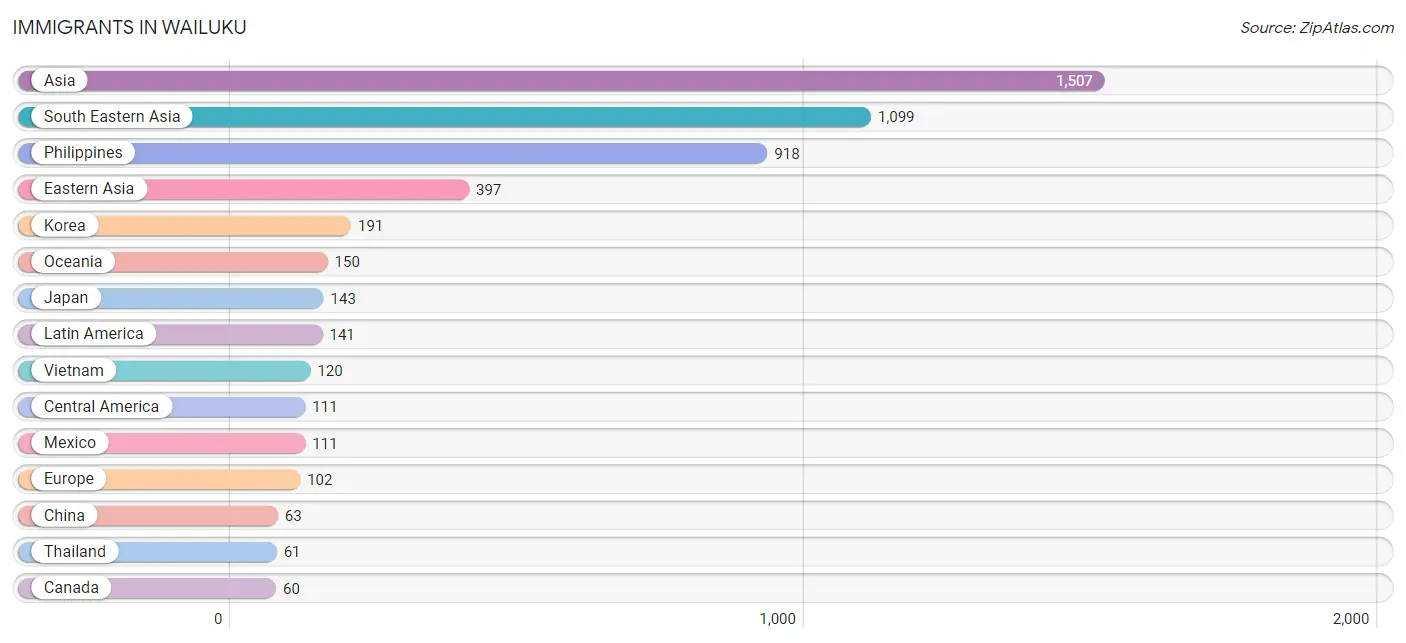
Immigrants in Wailuku
The most numerous immigrant groups reported in Wailuku came from Asia (1,507 | 9.1%), South Eastern Asia (1,099 | 6.6%), Philippines (918 | 5.5%), Eastern Asia (397 | 2.4%), and Korea (191 | 1.1%), together accounting for 24.8% of all Wailuku residents.
| Immigration Origin | # Population | % Population |
| Argentina | 5 | 0.0% |
| Asia | 1,507 | 9.1% |
| Australia | 15 | 0.1% |
| Brazil | 15 | 0.1% |
| Canada | 60 | 0.4% |
| Caribbean | 10 | 0.1% |
| Central America | 111 | 0.7% |
| China | 63 | 0.4% |
| Czechoslovakia | 25 | 0.2% |
| Denmark | 23 | 0.1% |
| Eastern Asia | 397 | 2.4% |
| Eastern Europe | 50 | 0.3% |
| England | 10 | 0.1% |
| Europe | 102 | 0.6% |
| Germany | 19 | 0.1% |
| Grenada | 10 | 0.1% |
| Japan | 143 | 0.9% |
| Jordan | 11 | 0.1% |
| Korea | 191 | 1.1% |
| Latin America | 141 | 0.9% |
| Mexico | 111 | 0.7% |
| Micronesia | 31 | 0.2% |
| Northern Europe | 33 | 0.2% |
| Oceania | 150 | 0.9% |
| Philippines | 918 | 5.5% |
| Poland | 25 | 0.2% |
| South America | 20 | 0.1% |
| South Eastern Asia | 1,099 | 6.6% |
| Taiwan | 11 | 0.1% |
| Thailand | 61 | 0.4% |
| Vietnam | 120 | 0.7% |
| Western Asia | 11 | 0.1% |
| Western Europe | 19 | 0.1% | View All 33 Rows |
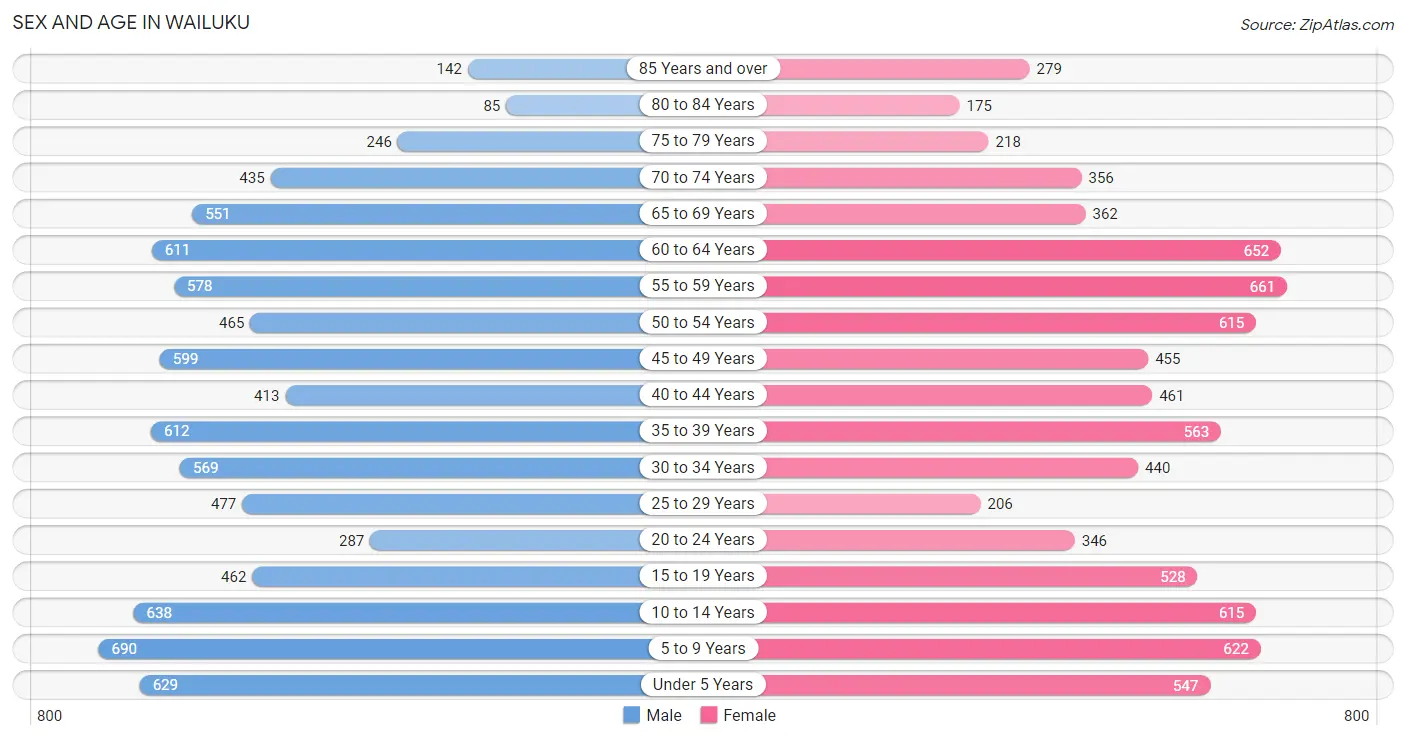
Sex and Age in Wailuku
Sex and Age in Wailuku
The most populous age groups in Wailuku are 5 to 9 Years (690 | 8.1%) for men and 55 to 59 Years (661 | 8.2%) for women.
| Age Bracket | Male | Female |
| Under 5 Years | 629 (7.4%) | 547 (6.8%) |
| 5 to 9 Years | 690 (8.1%) | 622 (7.7%) |
| 10 to 14 Years | 638 (7.5%) | 615 (7.6%) |
| 15 to 19 Years | 462 (5.4%) | 528 (6.5%) |
| 20 to 24 Years | 287 (3.4%) | 346 (4.3%) |
| 25 to 29 Years | 477 (5.6%) | 206 (2.5%) |
| 30 to 34 Years | 569 (6.7%) | 440 (5.4%) |
| 35 to 39 Years | 612 (7.2%) | 563 (7.0%) |
| 40 to 44 Years | 413 (4.9%) | 461 (5.7%) |
| 45 to 49 Years | 599 (7.1%) | 455 (5.6%) |
| 50 to 54 Years | 465 (5.5%) | 615 (7.6%) |
| 55 to 59 Years | 578 (6.8%) | 661 (8.2%) |
| 60 to 64 Years | 611 (7.2%) | 652 (8.1%) |
| 65 to 69 Years | 551 (6.5%) | 362 (4.5%) |
| 70 to 74 Years | 435 (5.1%) | 356 (4.4%) |
| 75 to 79 Years | 246 (2.9%) | 218 (2.7%) |
| 80 to 84 Years | 85 (1.0%) | 175 (2.2%) |
| 85 Years and over | 142 (1.7%) | 279 (3.4%) |
| Total | 8,489 (100.0%) | 8,101 (100.0%) |
Families and Households in Wailuku
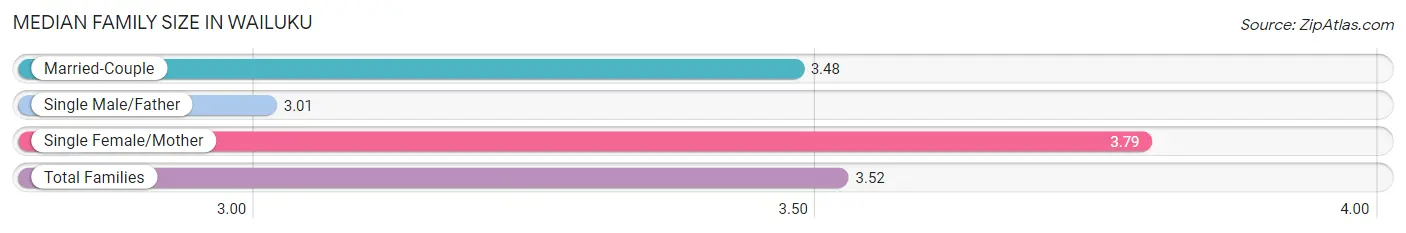
Median Family Size in Wailuku
The median family size in Wailuku is 3.52 persons per family, with single female/mother families (692 | 17.8%) accounting for the largest median family size of 3.79 persons per family. On the other hand, single male/father families (158 | 4.1%) represent the smallest median family size with 3.01 persons per family.
| Family Type | # Families | Family Size |
| Married-Couple | 3,043 (78.2%) | 3.48 |
| Single Male/Father | 158 (4.1%) | 3.01 |
| Single Female/Mother | 692 (17.8%) | 3.79 |
| Total Families | 3,893 (100.0%) | 3.52 |
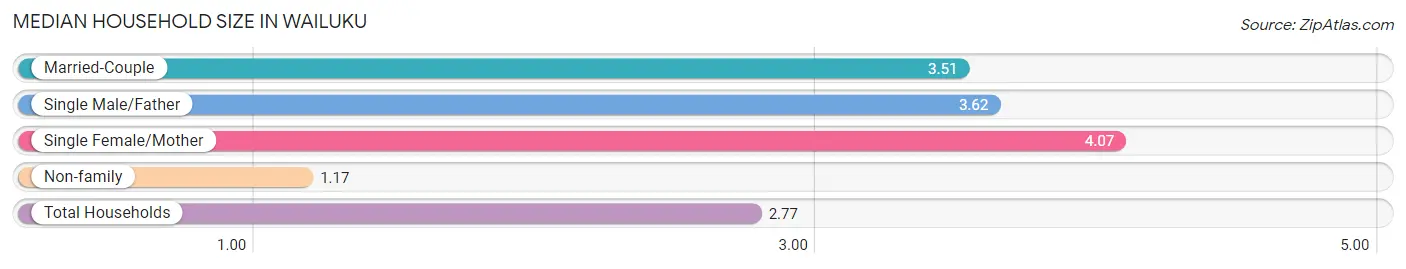
Median Household Size in Wailuku
The median household size in Wailuku is 2.77 persons per household, with single female/mother households (692 | 11.7%) accounting for the largest median household size of 4.07 persons per household. non-family households (2,041 | 34.4%) represent the smallest median household size with 1.17 persons per household.
| Household Type | # Households | Household Size |
| Married-Couple | 3,043 (51.3%) | 3.51 |
| Single Male/Father | 158 (2.7%) | 3.62 |
| Single Female/Mother | 692 (11.7%) | 4.07 |
| Non-family | 2,041 (34.4%) | 1.17 |
| Total Households | 5,934 (100.0%) | 2.77 |
Household Size by Marriage Status in Wailuku
Out of a total of 5,934 households in Wailuku, 3,893 (65.6%) are family households, while 2,041 (34.4%) are nonfamily households. The most numerous type of family households are 2-person households, comprising 1,382, and the most common type of nonfamily households are 1-person households, comprising 1,732.
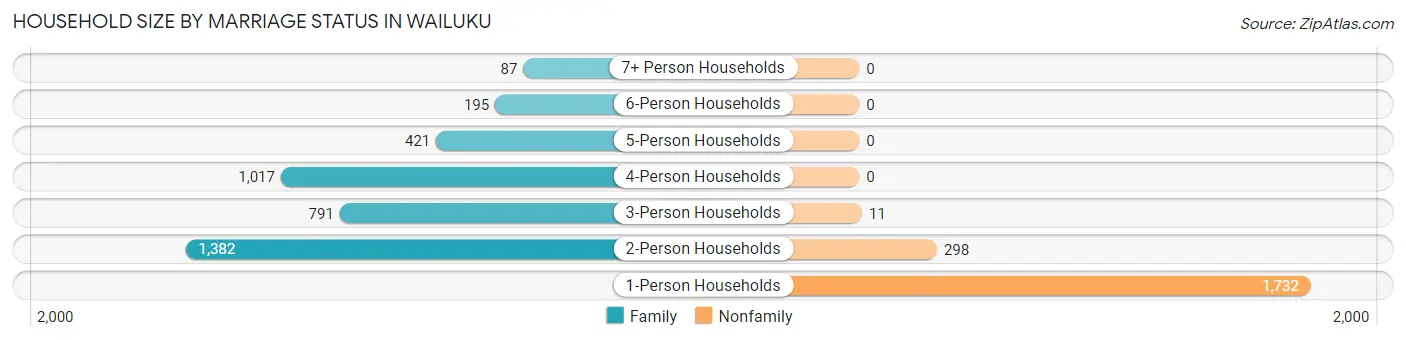
| Household Size | Family Households | Nonfamily Households |
| 1-Person Households | - | 1,732 (29.2%) |
| 2-Person Households | 1,382 (23.3%) | 298 (5.0%) |
| 3-Person Households | 791 (13.3%) | 11 (0.2%) |
| 4-Person Households | 1,017 (17.1%) | 0 (0.0%) |
| 5-Person Households | 421 (7.1%) | 0 (0.0%) |
| 6-Person Households | 195 (3.3%) | 0 (0.0%) |
| 7+ Person Households | 87 (1.5%) | 0 (0.0%) |
| Total | 3,893 (65.6%) | 2,041 (34.4%) |
Female Fertility in Wailuku
Fertility by Age in Wailuku
Average fertility rate in Wailuku is 75.0 births per 1,000 women. Women in the age bracket of 35 to 50 years have the highest fertility rate with 100.0 births per 1,000 women. Women in the age bracket of 35 to 50 years acount for 68.6% of all women with births.
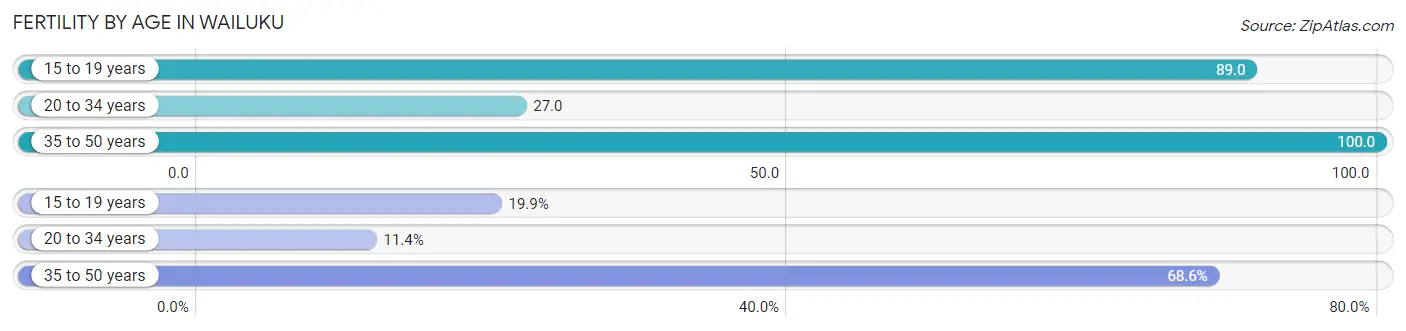
| Age Bracket | Women with Births | Births / 1,000 Women |
| 15 to 19 years | 47 (19.9%) | 89.0 |
| 20 to 34 years | 27 (11.4%) | 27.0 |
| 35 to 50 years | 162 (68.6%) | 100.0 |
| Total | 236 (100.0%) | 75.0 |
Fertility by Age by Marriage Status in Wailuku
51.7% of women with births (236) in Wailuku are married. The highest percentage of unmarried women with births falls into 15 to 19 years age bracket with 100.0% of them unmarried at the time of birth, while the lowest percentage of unmarried women with births belong to 35 to 50 years age bracket with 24.7% of them unmarried.
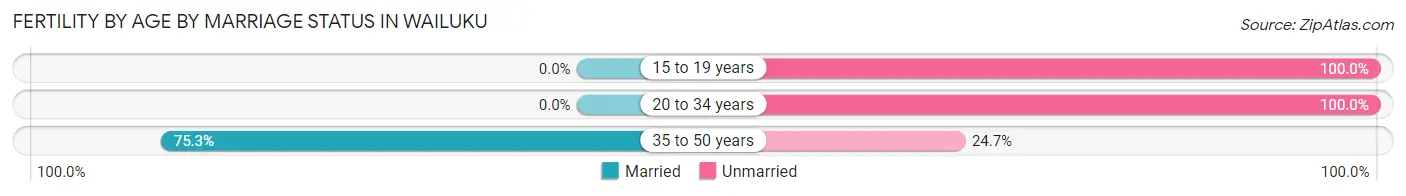
| Age Bracket | Married | Unmarried |
| 15 to 19 years | 0 (0.0%) | 47 (100.0%) |
| 20 to 34 years | 0 (0.0%) | 27 (100.0%) |
| 35 to 50 years | 122 (75.3%) | 40 (24.7%) |
| Total | 122 (51.7%) | 114 (48.3%) |
Fertility by Education in Wailuku
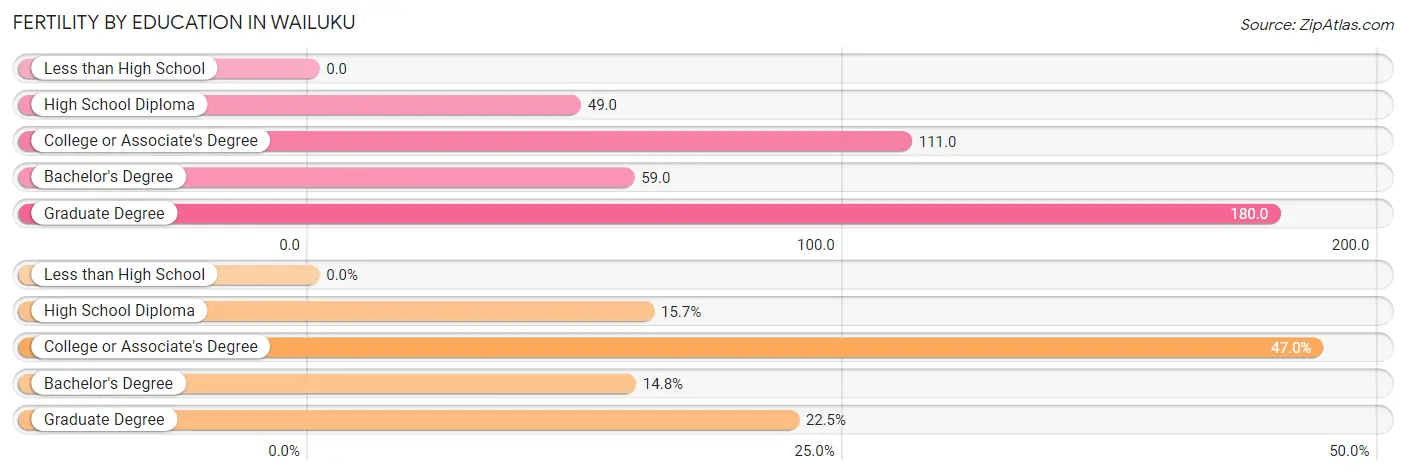
| Educational Attainment | Women with Births | Births / 1,000 Women |
| Less than High School | 0 (0.0%) | 0.0 |
| High School Diploma | 37 (15.7%) | 49.0 |
| College or Associate's Degree | 111 (47.0%) | 111.0 |
| Bachelor's Degree | 35 (14.8%) | 59.0 |
| Graduate Degree | 53 (22.5%) | 180.0 |
| Total | 236 (100.0%) | 75.0 |
Fertility by Education by Marriage Status in Wailuku
48.3% of women with births in Wailuku are unmarried. Women with the educational attainment of bachelor's degree are most likely to be married with 100.0% of them married at childbirth, while women with the educational attainment of college or associate's degree are least likely to be married with 81.1% of them unmarried at childbirth.
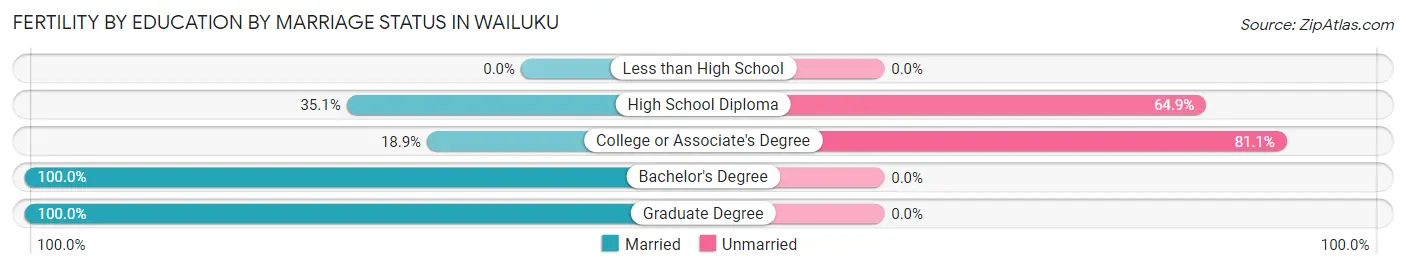
| Educational Attainment | Married | Unmarried |
| Less than High School | 0 (0.0%) | 0 (0.0%) |
| High School Diploma | 13 (35.1%) | 24 (64.9%) |
| College or Associate's Degree | 21 (18.9%) | 90 (81.1%) |
| Bachelor's Degree | 35 (100.0%) | 0 (0.0%) |
| Graduate Degree | 53 (100.0%) | 0 (0.0%) |
| Total | 122 (51.7%) | 114 (48.3%) |
Employment Characteristics in Wailuku
Employment by Class of Employer in Wailuku
Among the 7,945 employed individuals in Wailuku, private company employees (4,477 | 56.4%), self-employed (incorporated) (819 | 10.3%), and not-for-profit organizations (633 | 8.0%) make up the most common classes of employment.
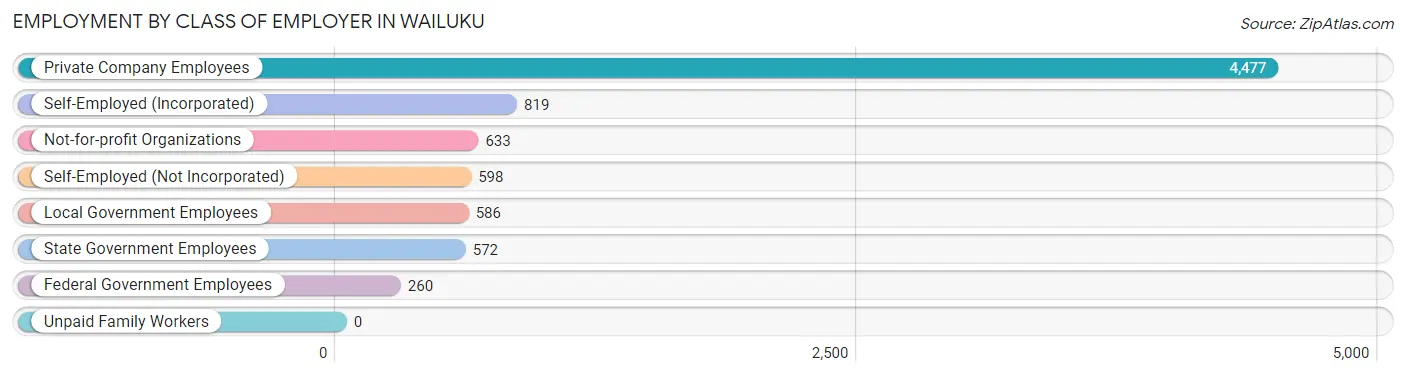
| Employer Class | # Employees | % Employees |
| Private Company Employees | 4,477 | 56.4% |
| Self-Employed (Incorporated) | 819 | 10.3% |
| Self-Employed (Not Incorporated) | 598 | 7.5% |
| Not-for-profit Organizations | 633 | 8.0% |
| Local Government Employees | 586 | 7.4% |
| State Government Employees | 572 | 7.2% |
| Federal Government Employees | 260 | 3.3% |
| Unpaid Family Workers | 0 | 0.0% |
| Total | 7,945 | 100.0% |
Employment Status by Age in Wailuku
According to the labor force statistics for Wailuku, out of the total population over 16 years of age (12,698), 65.6% or 8,330 individuals are in the labor force, with 3.5% or 292 of them unemployed. The age group with the highest labor force participation rate is 35 to 44 years, with 91.4% or 1,873 individuals in the labor force. Within the labor force, the 25 to 29 years age range has the highest percentage of unemployed individuals, with 19.2% or 99 of them being unemployed.
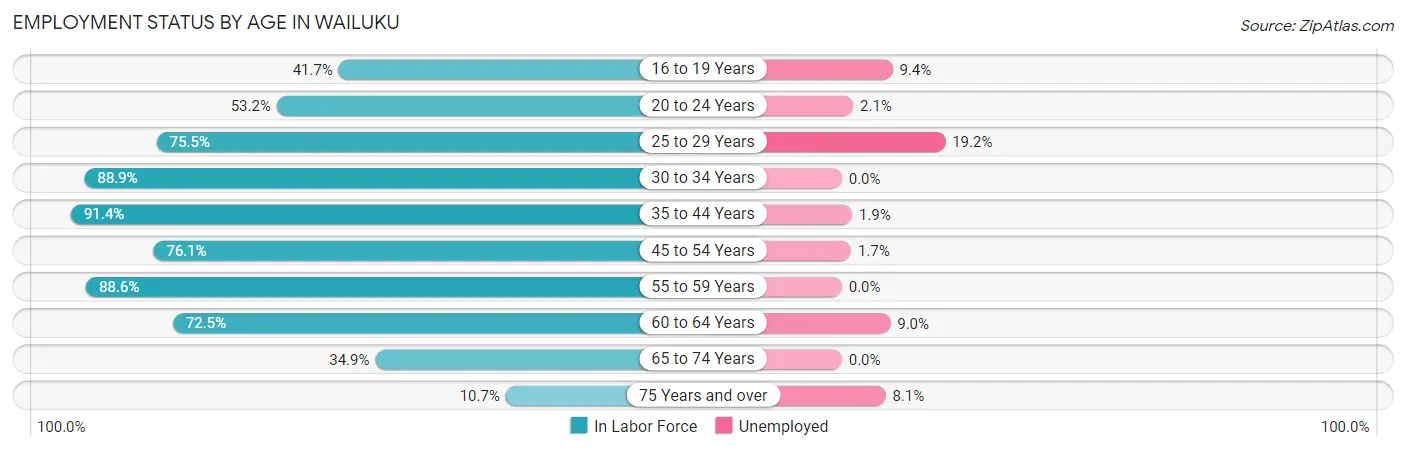
| Age Bracket | In Labor Force | Unemployed |
| 16 to 19 Years | 350 (41.7%) | 33 (9.4%) |
| 20 to 24 Years | 337 (53.2%) | 7 (2.1%) |
| 25 to 29 Years | 516 (75.5%) | 99 (19.2%) |
| 30 to 34 Years | 897 (88.9%) | 0 (0.0%) |
| 35 to 44 Years | 1,873 (91.4%) | 36 (1.9%) |
| 45 to 54 Years | 1,624 (76.1%) | 28 (1.7%) |
| 55 to 59 Years | 1,098 (88.6%) | 0 (0.0%) |
| 60 to 64 Years | 916 (72.5%) | 82 (9.0%) |
| 65 to 74 Years | 595 (34.9%) | 0 (0.0%) |
| 75 Years and over | 123 (10.7%) | 10 (8.1%) |
| Total | 8,330 (65.6%) | 292 (3.5%) |
Employment Status by Educational Attainment in Wailuku
According to labor force statistics for Wailuku, 82.7% of individuals (6,928) out of the total population between 25 and 64 years of age (8,377) are in the labor force, with 3.5% or 242 of them being unemployed. The group with the highest labor force participation rate are those with the educational attainment of bachelor's degree or higher, with 87.5% or 2,668 individuals in the labor force. Within the labor force, individuals with high school diploma education have the highest percentage of unemployment, with 7.9% or 151 of them being unemployed.
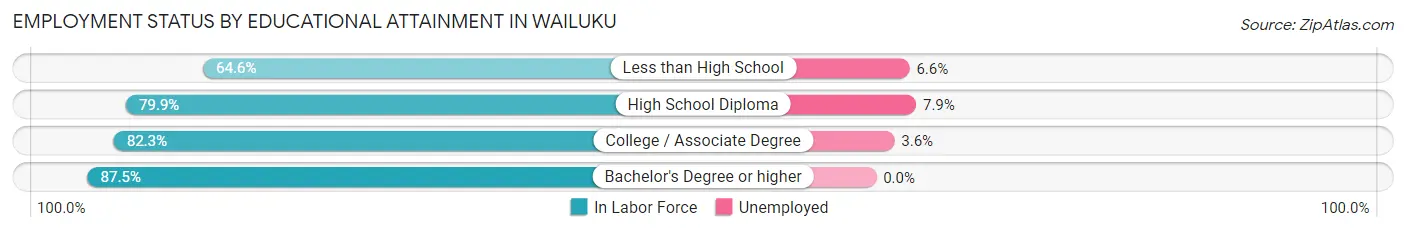
| Educational Attainment | In Labor Force | Unemployed |
| Less than High School | 257 (64.6%) | 26 (6.6%) |
| High School Diploma | 1,906 (79.9%) | 188 (7.9%) |
| College / Associate Degree | 2,095 (82.3%) | 92 (3.6%) |
| Bachelor's Degree or higher | 2,668 (87.5%) | 0 (0.0%) |
| Total | 6,928 (82.7%) | 293 (3.5%) |
Employment Occupations by Sex in Wailuku
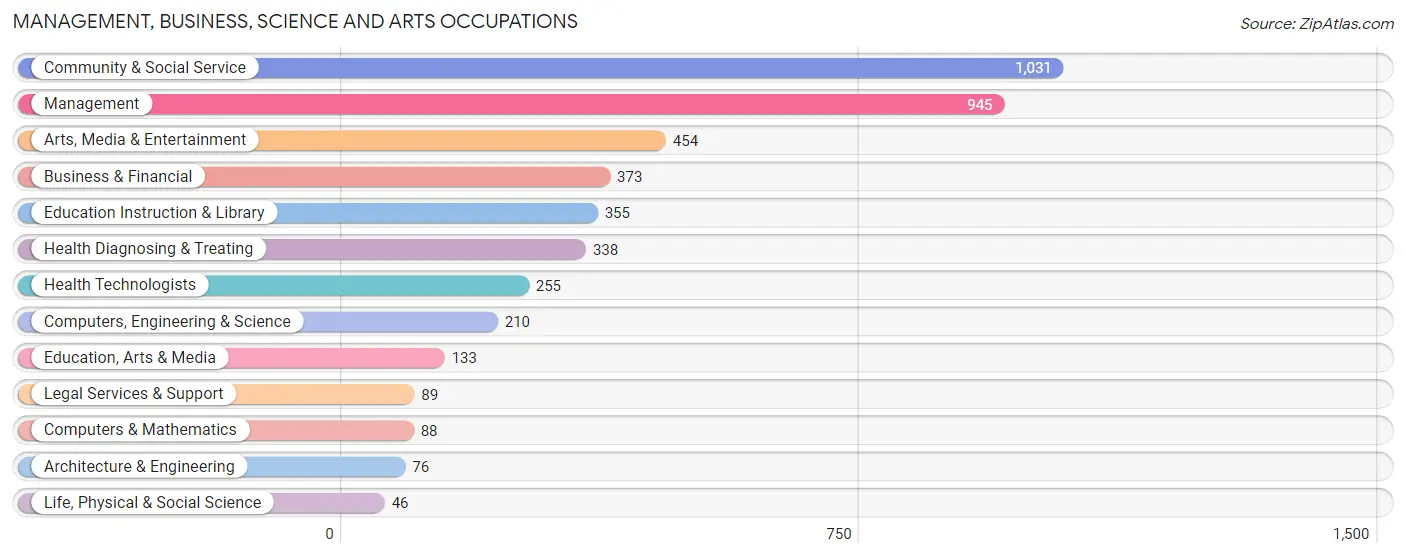
Management, Business, Science and Arts Occupations
The most common Management, Business, Science and Arts occupations in Wailuku are Community & Social Service (1,031 | 12.9%), Management (945 | 11.8%), Arts, Media & Entertainment (454 | 5.7%), Business & Financial (373 | 4.6%), and Education Instruction & Library (355 | 4.4%).
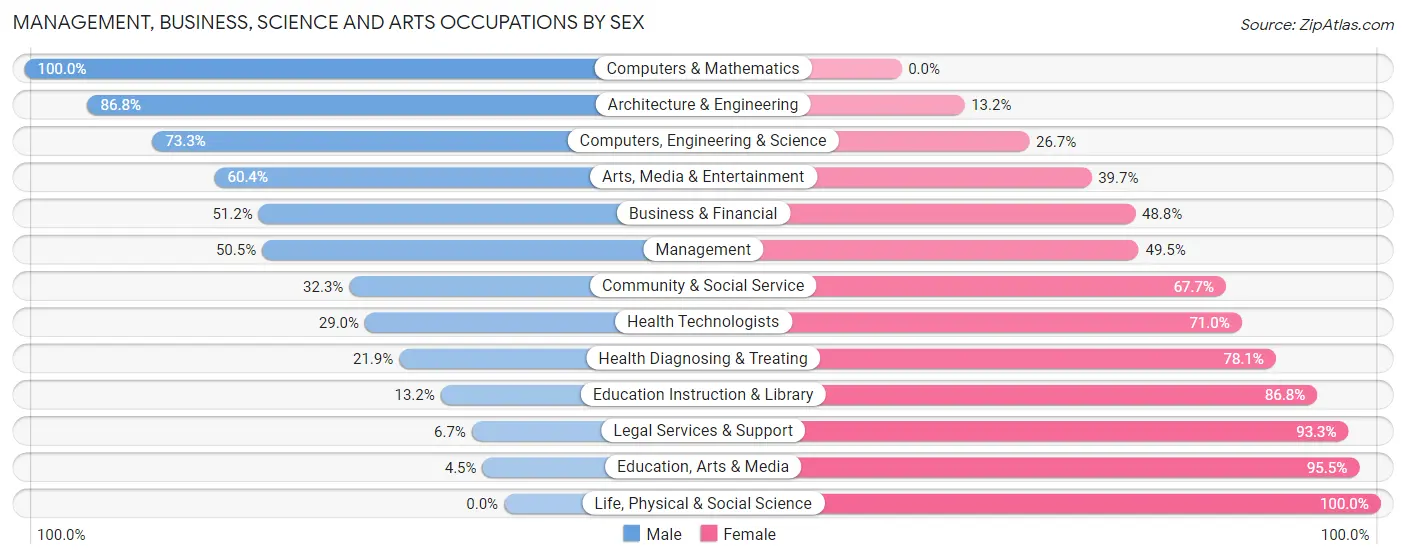
Management, Business, Science and Arts Occupations by Sex
Within the Management, Business, Science and Arts occupations in Wailuku, the most male-oriented occupations are Computers & Mathematics (100.0%), Architecture & Engineering (86.8%), and Computers, Engineering & Science (73.3%), while the most female-oriented occupations are Life, Physical & Social Science (100.0%), Education, Arts & Media (95.5%), and Legal Services & Support (93.3%).
| Occupation | Male | Female |
| Management | 477 (50.5%) | 468 (49.5%) |
| Business & Financial | 191 (51.2%) | 182 (48.8%) |
| Computers, Engineering & Science | 154 (73.3%) | 56 (26.7%) |
| Computers & Mathematics | 88 (100.0%) | 0 (0.0%) |
| Architecture & Engineering | 66 (86.8%) | 10 (13.2%) |
| Life, Physical & Social Science | 0 (0.0%) | 46 (100.0%) |
| Community & Social Service | 333 (32.3%) | 698 (67.7%) |
| Education, Arts & Media | 6 (4.5%) | 127 (95.5%) |
| Legal Services & Support | 6 (6.7%) | 83 (93.3%) |
| Education Instruction & Library | 47 (13.2%) | 308 (86.8%) |
| Arts, Media & Entertainment | 274 (60.4%) | 180 (39.7%) |
| Health Diagnosing & Treating | 74 (21.9%) | 264 (78.1%) |
| Health Technologists | 74 (29.0%) | 181 (71.0%) |
| Total (Category) | 1,229 (42.4%) | 1,668 (57.6%) |
| Total (Overall) | 4,180 (52.1%) | 3,841 (47.9%) |
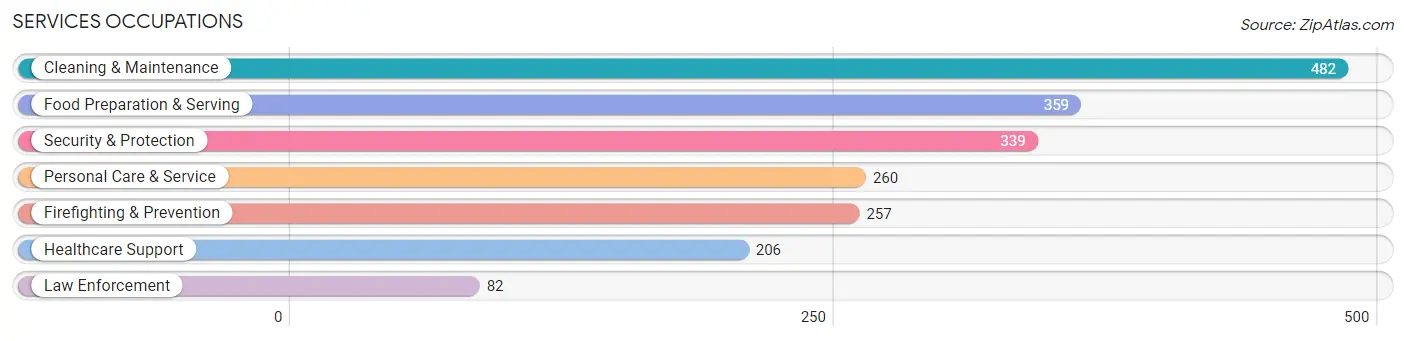
Services Occupations
The most common Services occupations in Wailuku are Cleaning & Maintenance (482 | 6.0%), Food Preparation & Serving (359 | 4.5%), Security & Protection (339 | 4.2%), Personal Care & Service (260 | 3.2%), and Firefighting & Prevention (257 | 3.2%).
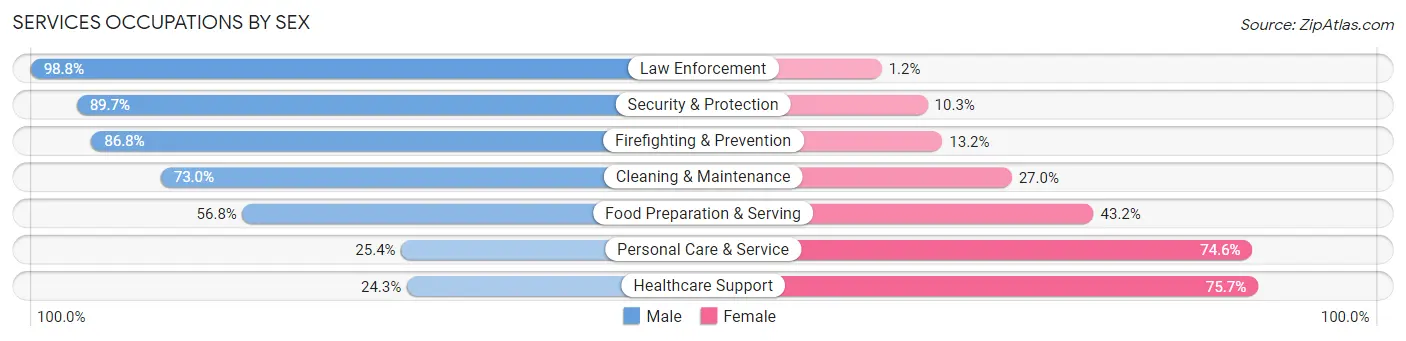
Services Occupations by Sex
Within the Services occupations in Wailuku, the most male-oriented occupations are Law Enforcement (98.8%), Security & Protection (89.7%), and Firefighting & Prevention (86.8%), while the most female-oriented occupations are Healthcare Support (75.7%), Personal Care & Service (74.6%), and Food Preparation & Serving (43.2%).
| Occupation | Male | Female |
| Healthcare Support | 50 (24.3%) | 156 (75.7%) |
| Security & Protection | 304 (89.7%) | 35 (10.3%) |
| Firefighting & Prevention | 223 (86.8%) | 34 (13.2%) |
| Law Enforcement | 81 (98.8%) | 1 (1.2%) |
| Food Preparation & Serving | 204 (56.8%) | 155 (43.2%) |
| Cleaning & Maintenance | 352 (73.0%) | 130 (27.0%) |
| Personal Care & Service | 66 (25.4%) | 194 (74.6%) |
| Total (Category) | 976 (59.3%) | 670 (40.7%) |
| Total (Overall) | 4,180 (52.1%) | 3,841 (47.9%) |
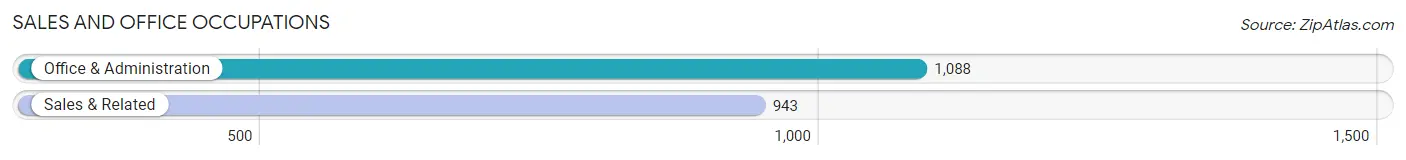
Sales and Office Occupations
The most common Sales and Office occupations in Wailuku are Office & Administration (1,088 | 13.6%), and Sales & Related (943 | 11.8%).
Sales and Office Occupations by Sex
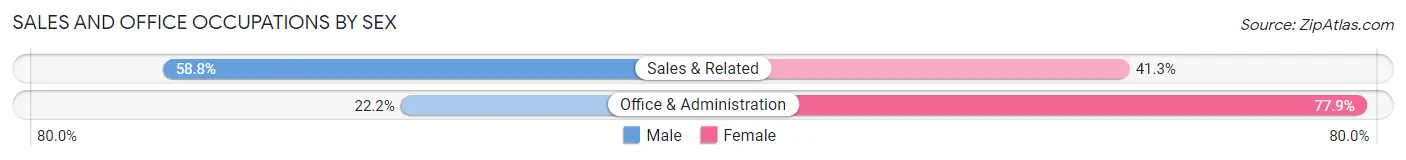
| Occupation | Male | Female |
| Sales & Related | 554 (58.8%) | 389 (41.2%) |
| Office & Administration | 241 (22.2%) | 847 (77.8%) |
| Total (Category) | 795 (39.1%) | 1,236 (60.9%) |
| Total (Overall) | 4,180 (52.1%) | 3,841 (47.9%) |
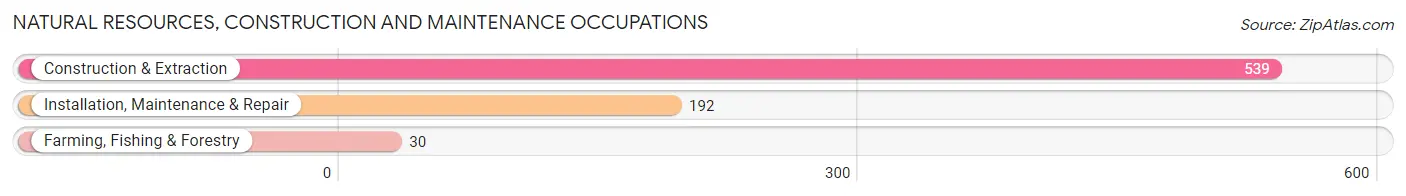
Natural Resources, Construction and Maintenance Occupations
The most common Natural Resources, Construction and Maintenance occupations in Wailuku are Construction & Extraction (539 | 6.7%), Installation, Maintenance & Repair (192 | 2.4%), and Farming, Fishing & Forestry (30 | 0.4%).
Natural Resources, Construction and Maintenance Occupations by Sex
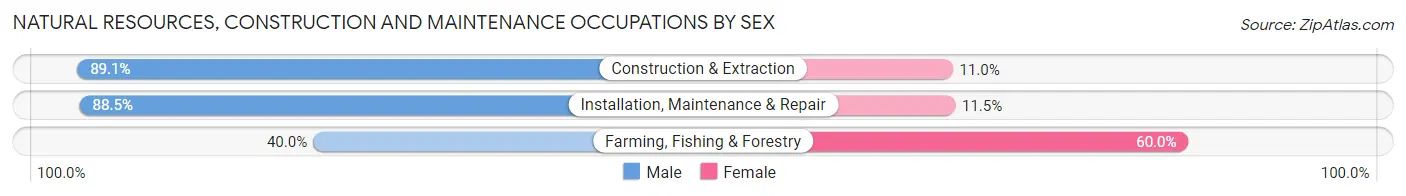
| Occupation | Male | Female |
| Farming, Fishing & Forestry | 12 (40.0%) | 18 (60.0%) |
| Construction & Extraction | 480 (89.0%) | 59 (11.0%) |
| Installation, Maintenance & Repair | 170 (88.5%) | 22 (11.5%) |
| Total (Category) | 662 (87.0%) | 99 (13.0%) |
| Total (Overall) | 4,180 (52.1%) | 3,841 (47.9%) |
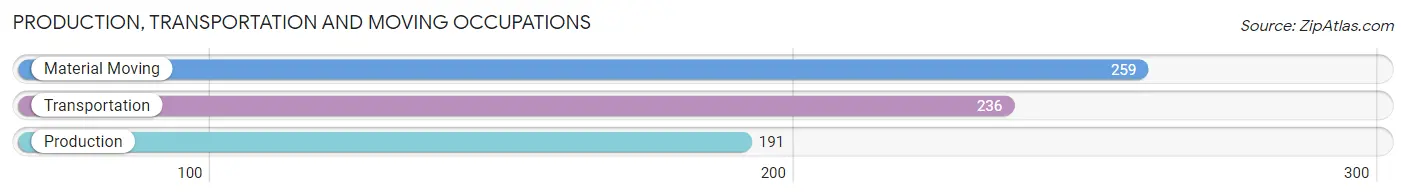
Production, Transportation and Moving Occupations
The most common Production, Transportation and Moving occupations in Wailuku are Material Moving (259 | 3.2%), Transportation (236 | 2.9%), and Production (191 | 2.4%).
Production, Transportation and Moving Occupations by Sex
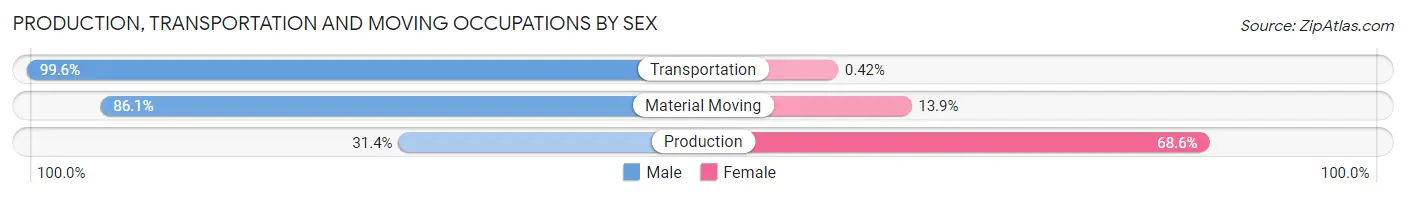
| Occupation | Male | Female |
| Production | 60 (31.4%) | 131 (68.6%) |
| Transportation | 235 (99.6%) | 1 (0.4%) |
| Material Moving | 223 (86.1%) | 36 (13.9%) |
| Total (Category) | 518 (75.5%) | 168 (24.5%) |
| Total (Overall) | 4,180 (52.1%) | 3,841 (47.9%) |
Employment Industries by Sex in Wailuku
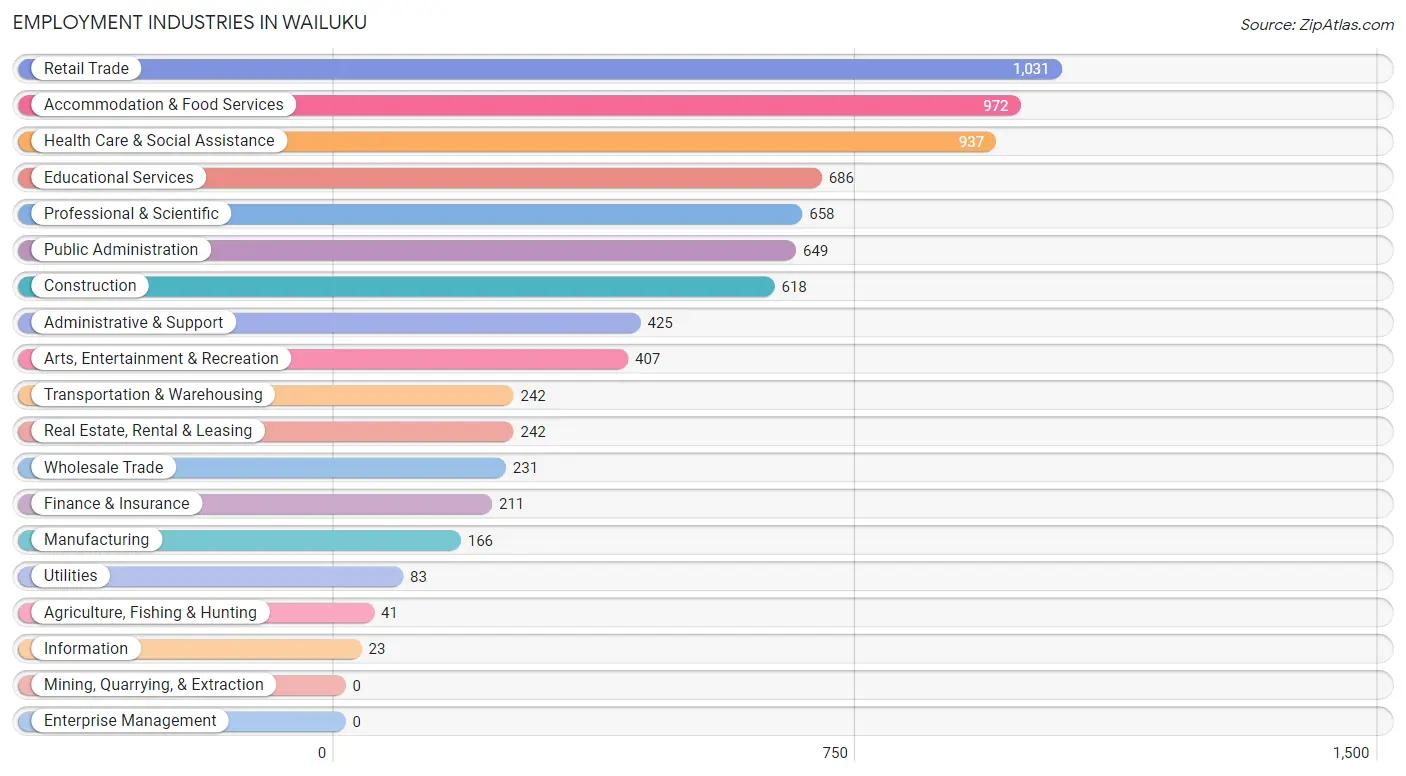
Employment Industries in Wailuku
The major employment industries in Wailuku include Retail Trade (1,031 | 12.9%), Accommodation & Food Services (972 | 12.1%), Health Care & Social Assistance (937 | 11.7%), Educational Services (686 | 8.6%), and Professional & Scientific (658 | 8.2%).
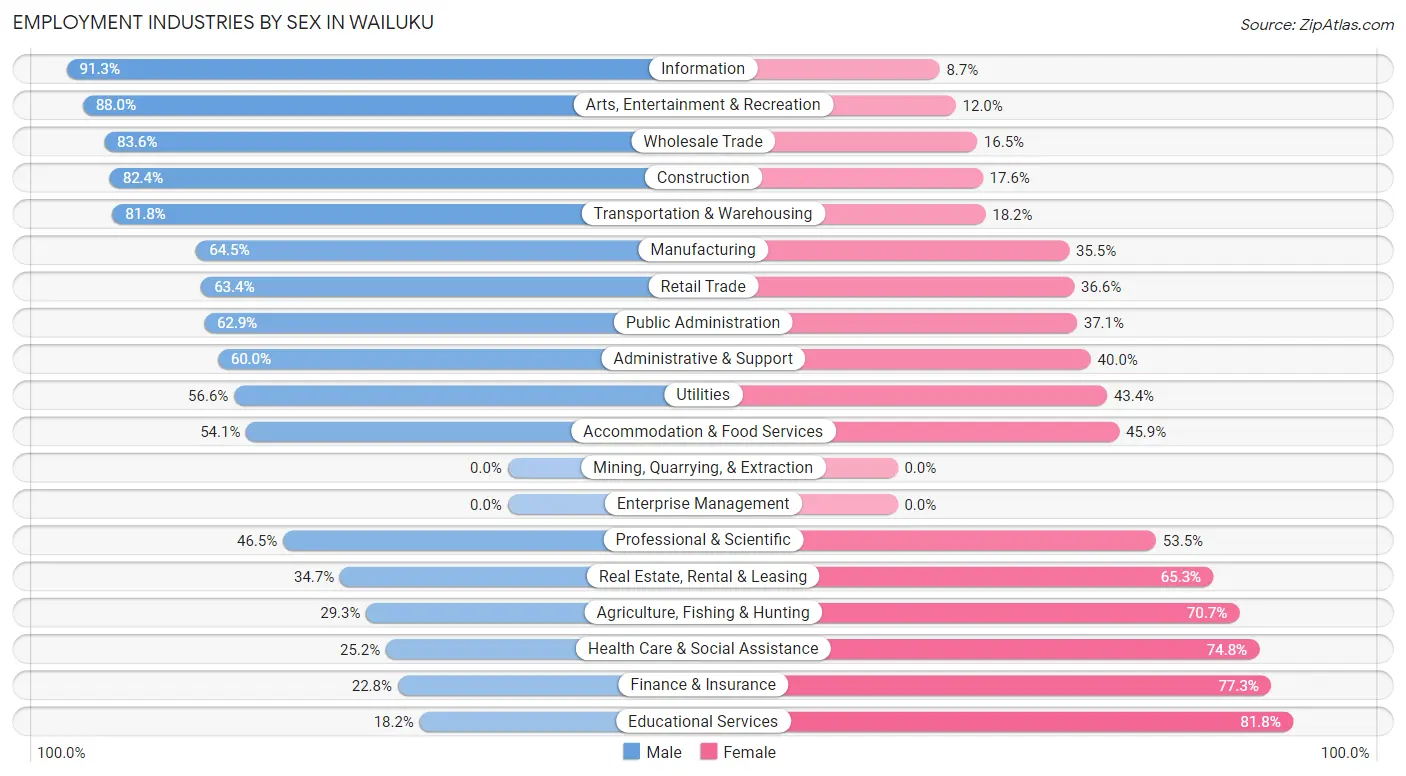
Employment Industries by Sex in Wailuku
The Wailuku industries that see more men than women are Information (91.3%), Arts, Entertainment & Recreation (88.0%), and Wholesale Trade (83.6%), whereas the industries that tend to have a higher number of women are Educational Services (81.8%), Finance & Insurance (77.2%), and Health Care & Social Assistance (74.8%).
| Industry | Male | Female |
| Agriculture, Fishing & Hunting | 12 (29.3%) | 29 (70.7%) |
| Mining, Quarrying, & Extraction | 0 (0.0%) | 0 (0.0%) |
| Construction | 509 (82.4%) | 109 (17.6%) |
| Manufacturing | 107 (64.5%) | 59 (35.5%) |
| Wholesale Trade | 193 (83.6%) | 38 (16.5%) |
| Retail Trade | 654 (63.4%) | 377 (36.6%) |
| Transportation & Warehousing | 198 (81.8%) | 44 (18.2%) |
| Utilities | 47 (56.6%) | 36 (43.4%) |
| Information | 21 (91.3%) | 2 (8.7%) |
| Finance & Insurance | 48 (22.8%) | 163 (77.2%) |
| Real Estate, Rental & Leasing | 84 (34.7%) | 158 (65.3%) |
| Professional & Scientific | 306 (46.5%) | 352 (53.5%) |
| Enterprise Management | 0 (0.0%) | 0 (0.0%) |
| Administrative & Support | 255 (60.0%) | 170 (40.0%) |
| Educational Services | 125 (18.2%) | 561 (81.8%) |
| Health Care & Social Assistance | 236 (25.2%) | 701 (74.8%) |
| Arts, Entertainment & Recreation | 358 (88.0%) | 49 (12.0%) |
| Accommodation & Food Services | 526 (54.1%) | 446 (45.9%) |
| Public Administration | 408 (62.9%) | 241 (37.1%) |
| Total | 4,180 (52.1%) | 3,841 (47.9%) |
Education in Wailuku
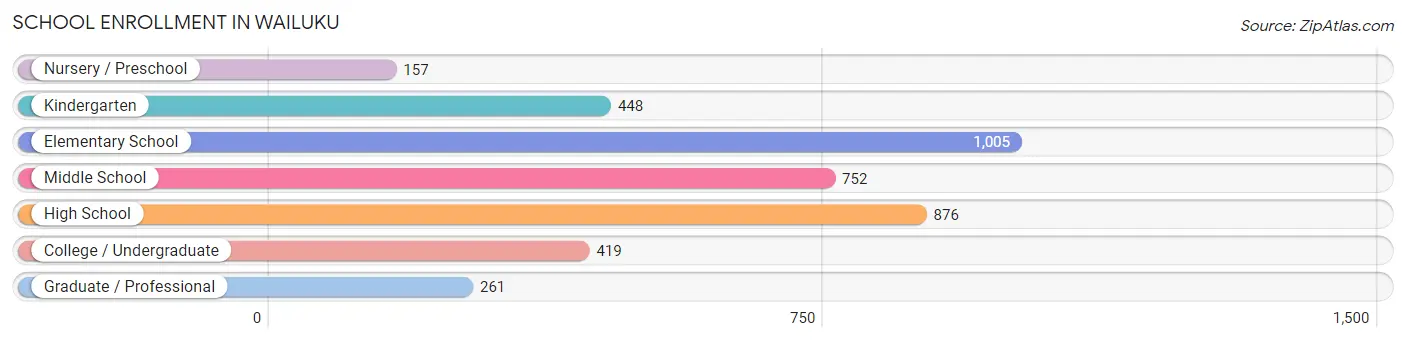
School Enrollment in Wailuku
The most common levels of schooling among the 3,918 students in Wailuku are elementary school (1,005 | 25.7%), high school (876 | 22.4%), and middle school (752 | 19.2%).
| School Level | # Students | % Students |
| Nursery / Preschool | 157 | 4.0% |
| Kindergarten | 448 | 11.4% |
| Elementary School | 1,005 | 25.7% |
| Middle School | 752 | 19.2% |
| High School | 876 | 22.4% |
| College / Undergraduate | 419 | 10.7% |
| Graduate / Professional | 261 | 6.7% |
| Total | 3,918 | 100.0% |
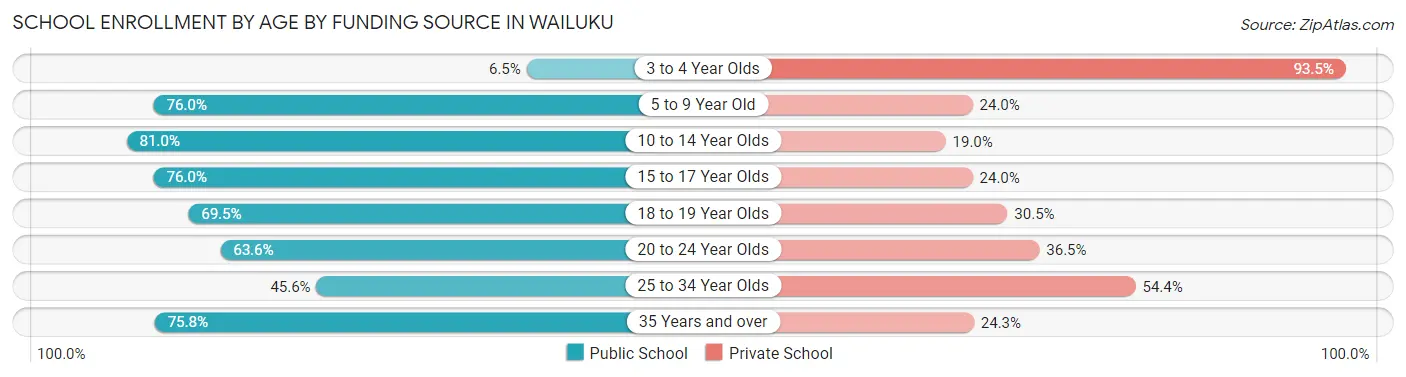
School Enrollment by Age by Funding Source in Wailuku
Out of a total of 3,918 students who are enrolled in schools in Wailuku, 1,011 (25.8%) attend a private institution, while the remaining 2,907 (74.2%) are enrolled in public schools. The age group of 3 to 4 year olds has the highest likelihood of being enrolled in private schools, with 72 (93.5% in the age bracket) enrolled. Conversely, the age group of 10 to 14 year olds has the lowest likelihood of being enrolled in a private school, with 1,015 (81.0% in the age bracket) attending a public institution.
| Age Bracket | Public School | Private School |
| 3 to 4 Year Olds | 5 (6.5%) | 72 (93.5%) |
| 5 to 9 Year Old | 946 (76.0%) | 299 (24.0%) |
| 10 to 14 Year Olds | 1,015 (81.0%) | 238 (19.0%) |
| 15 to 17 Year Olds | 408 (76.0%) | 129 (24.0%) |
| 18 to 19 Year Olds | 196 (69.5%) | 86 (30.5%) |
| 20 to 24 Year Olds | 68 (63.5%) | 39 (36.4%) |
| 25 to 34 Year Olds | 68 (45.6%) | 81 (54.4%) |
| 35 Years and over | 203 (75.7%) | 65 (24.2%) |
| Total | 2,907 (74.2%) | 1,011 (25.8%) |
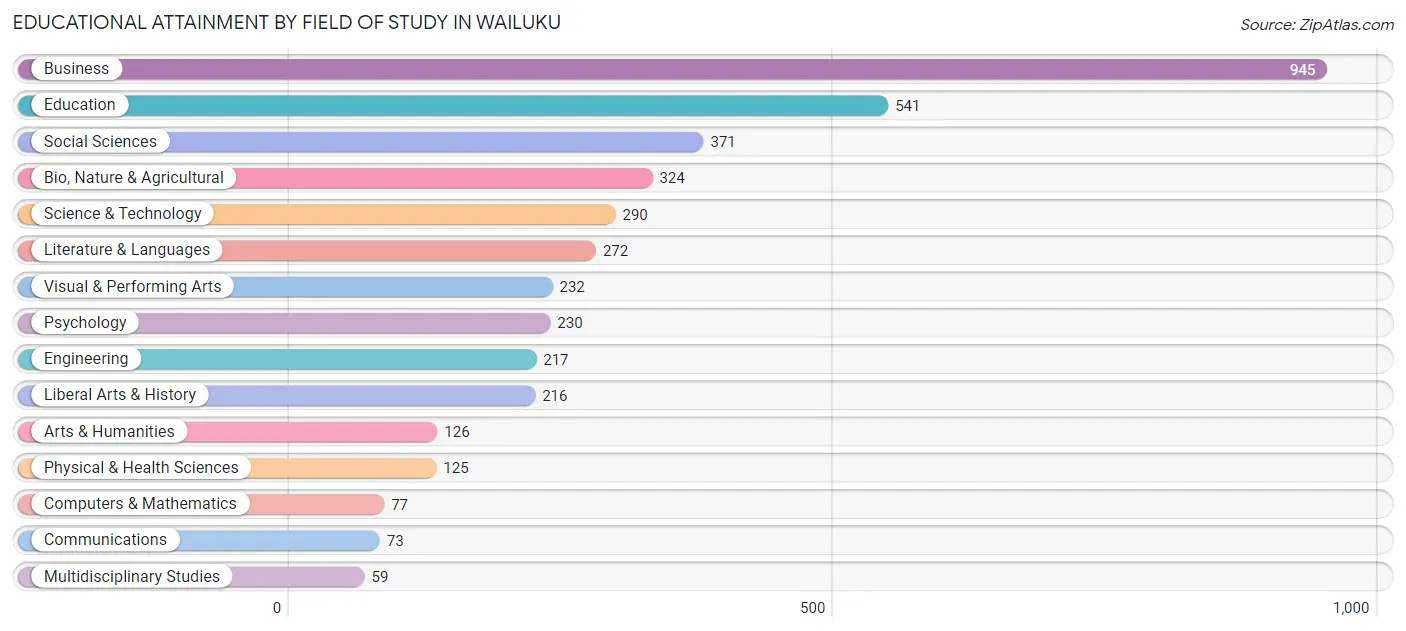
Educational Attainment by Field of Study in Wailuku
Business (945 | 23.1%), education (541 | 13.2%), social sciences (371 | 9.0%), bio, nature & agricultural (324 | 7.9%), and science & technology (290 | 7.1%) are the most common fields of study among 4,098 individuals in Wailuku who have obtained a bachelor's degree or higher.
| Field of Study | # Graduates | % Graduates |
| Computers & Mathematics | 77 | 1.9% |
| Bio, Nature & Agricultural | 324 | 7.9% |
| Physical & Health Sciences | 125 | 3.0% |
| Psychology | 230 | 5.6% |
| Social Sciences | 371 | 9.0% |
| Engineering | 217 | 5.3% |
| Multidisciplinary Studies | 59 | 1.4% |
| Science & Technology | 290 | 7.1% |
| Business | 945 | 23.1% |
| Education | 541 | 13.2% |
| Literature & Languages | 272 | 6.6% |
| Liberal Arts & History | 216 | 5.3% |
| Visual & Performing Arts | 232 | 5.7% |
| Communications | 73 | 1.8% |
| Arts & Humanities | 126 | 3.1% |
| Total | 4,098 | 100.0% |
Transportation & Commute in Wailuku
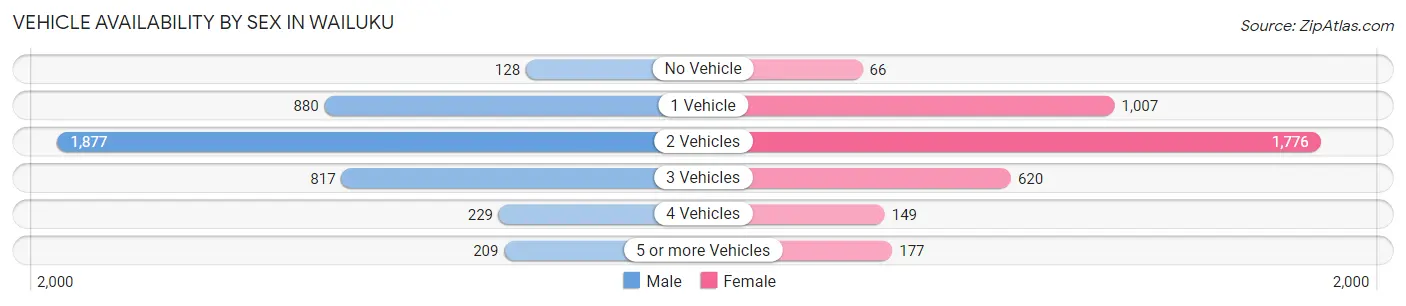
Vehicle Availability by Sex in Wailuku
The most prevalent vehicle ownership categories in Wailuku are males with 2 vehicles (1,877, accounting for 45.3%) and females with 2 vehicles (1,776, making up 49.5%).
| Vehicles Available | Male | Female |
| No Vehicle | 128 (3.1%) | 66 (1.7%) |
| 1 Vehicle | 880 (21.3%) | 1,007 (26.5%) |
| 2 Vehicles | 1,877 (45.3%) | 1,776 (46.8%) |
| 3 Vehicles | 817 (19.7%) | 620 (16.3%) |
| 4 Vehicles | 229 (5.5%) | 149 (3.9%) |
| 5 or more Vehicles | 209 (5.1%) | 177 (4.7%) |
| Total | 4,140 (100.0%) | 3,795 (100.0%) |
Commute Time in Wailuku
The most frequently occuring commute durations in Wailuku are 10 to 14 minutes (1,653 commuters, 22.3%), 15 to 19 minutes (1,612 commuters, 21.7%), and 5 to 9 minutes (1,054 commuters, 14.2%).
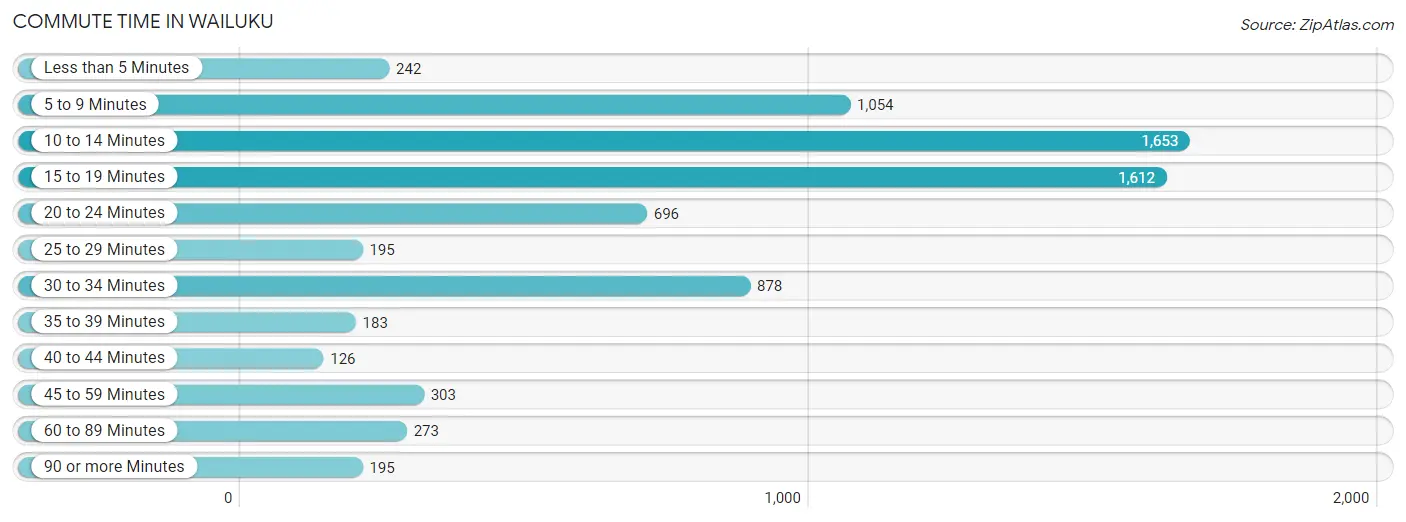
| Commute Time | # Commuters | % Commuters |
| Less than 5 Minutes | 242 | 3.3% |
| 5 to 9 Minutes | 1,054 | 14.2% |
| 10 to 14 Minutes | 1,653 | 22.3% |
| 15 to 19 Minutes | 1,612 | 21.7% |
| 20 to 24 Minutes | 696 | 9.4% |
| 25 to 29 Minutes | 195 | 2.6% |
| 30 to 34 Minutes | 878 | 11.8% |
| 35 to 39 Minutes | 183 | 2.5% |
| 40 to 44 Minutes | 126 | 1.7% |
| 45 to 59 Minutes | 303 | 4.1% |
| 60 to 89 Minutes | 273 | 3.7% |
| 90 or more Minutes | 195 | 2.6% |
Commute Time by Sex in Wailuku
The most common commute times in Wailuku are 15 to 19 minutes (865 commuters, 22.2%) for males and 10 to 14 minutes (963 commuters, 27.4%) for females.
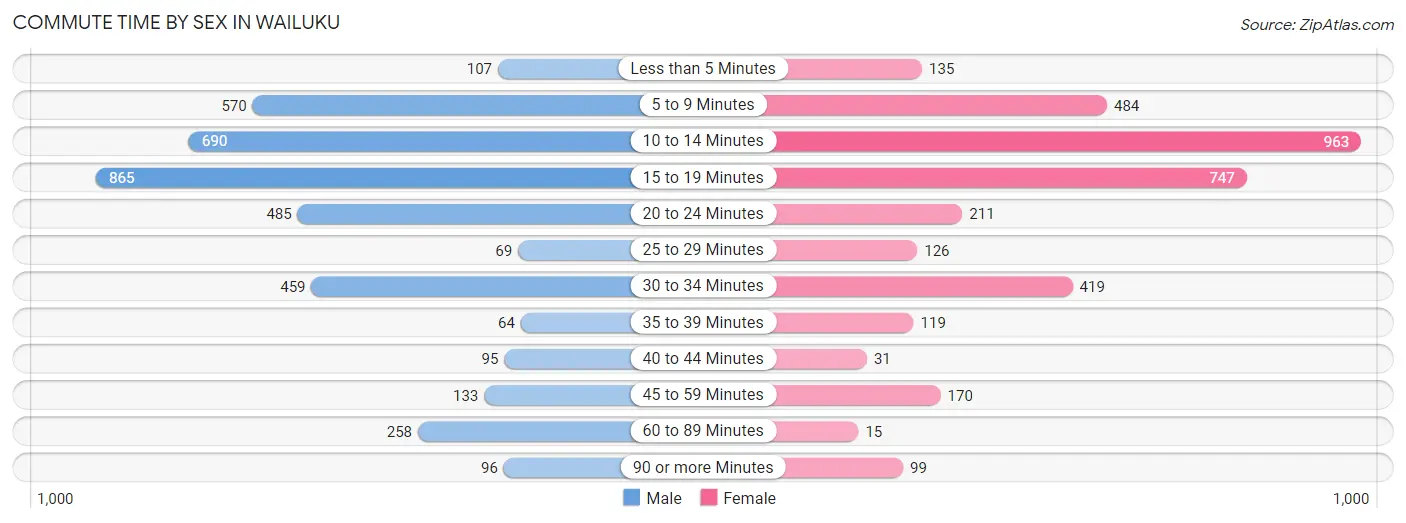
| Commute Time | Male | Female |
| Less than 5 Minutes | 107 (2.8%) | 135 (3.8%) |
| 5 to 9 Minutes | 570 (14.6%) | 484 (13.8%) |
| 10 to 14 Minutes | 690 (17.7%) | 963 (27.4%) |
| 15 to 19 Minutes | 865 (22.2%) | 747 (21.2%) |
| 20 to 24 Minutes | 485 (12.5%) | 211 (6.0%) |
| 25 to 29 Minutes | 69 (1.8%) | 126 (3.6%) |
| 30 to 34 Minutes | 459 (11.8%) | 419 (11.9%) |
| 35 to 39 Minutes | 64 (1.6%) | 119 (3.4%) |
| 40 to 44 Minutes | 95 (2.4%) | 31 (0.9%) |
| 45 to 59 Minutes | 133 (3.4%) | 170 (4.8%) |
| 60 to 89 Minutes | 258 (6.6%) | 15 (0.4%) |
| 90 or more Minutes | 96 (2.5%) | 99 (2.8%) |
Time of Departure to Work by Sex in Wailuku
The most frequent times of departure to work in Wailuku are 7:00 AM to 7:29 AM (731, 18.8%) for males and 7:00 AM to 7:29 AM (813, 23.1%) for females.
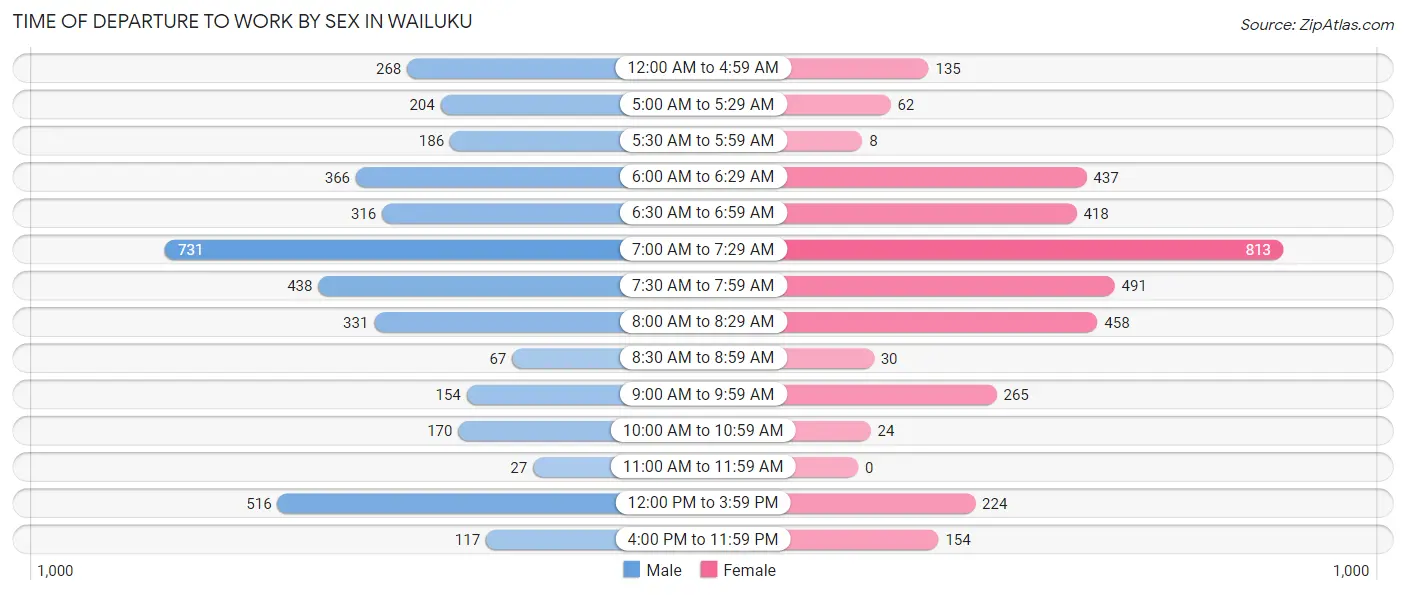
| Time of Departure | Male | Female |
| 12:00 AM to 4:59 AM | 268 (6.9%) | 135 (3.8%) |
| 5:00 AM to 5:29 AM | 204 (5.2%) | 62 (1.8%) |
| 5:30 AM to 5:59 AM | 186 (4.8%) | 8 (0.2%) |
| 6:00 AM to 6:29 AM | 366 (9.4%) | 437 (12.4%) |
| 6:30 AM to 6:59 AM | 316 (8.1%) | 418 (11.9%) |
| 7:00 AM to 7:29 AM | 731 (18.8%) | 813 (23.1%) |
| 7:30 AM to 7:59 AM | 438 (11.3%) | 491 (14.0%) |
| 8:00 AM to 8:29 AM | 331 (8.5%) | 458 (13.0%) |
| 8:30 AM to 8:59 AM | 67 (1.7%) | 30 (0.9%) |
| 9:00 AM to 9:59 AM | 154 (4.0%) | 265 (7.5%) |
| 10:00 AM to 10:59 AM | 170 (4.4%) | 24 (0.7%) |
| 11:00 AM to 11:59 AM | 27 (0.7%) | 0 (0.0%) |
| 12:00 PM to 3:59 PM | 516 (13.3%) | 224 (6.4%) |
| 4:00 PM to 11:59 PM | 117 (3.0%) | 154 (4.4%) |
| Total | 3,891 (100.0%) | 3,519 (100.0%) |
Housing Occupancy in Wailuku
Occupancy by Ownership in Wailuku
Of the total 5,934 dwellings in Wailuku, owner-occupied units account for 4,080 (68.8%), while renter-occupied units make up 1,854 (31.2%).
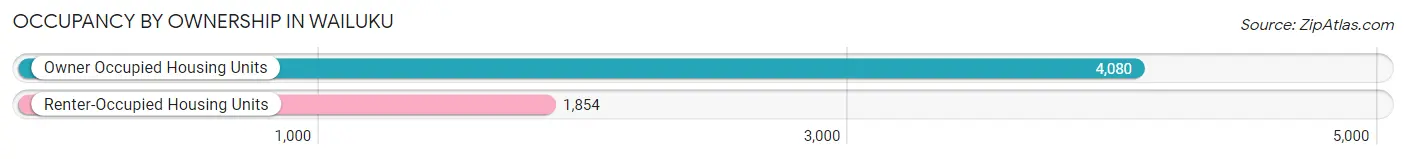
| Occupancy | # Housing Units | % Housing Units |
| Owner Occupied Housing Units | 4,080 | 68.8% |
| Renter-Occupied Housing Units | 1,854 | 31.2% |
| Total Occupied Housing Units | 5,934 | 100.0% |
Occupancy by Household Size in Wailuku
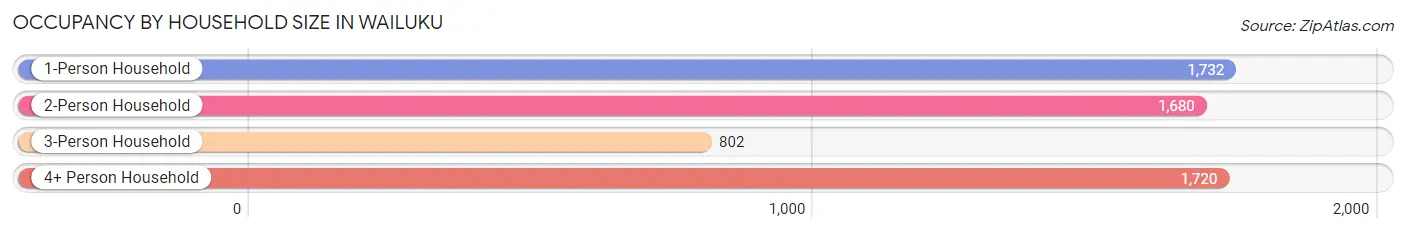
| Household Size | # Housing Units | % Housing Units |
| 1-Person Household | 1,732 | 29.2% |
| 2-Person Household | 1,680 | 28.3% |
| 3-Person Household | 802 | 13.5% |
| 4+ Person Household | 1,720 | 29.0% |
| Total Housing Units | 5,934 | 100.0% |
Occupancy by Ownership by Household Size in Wailuku
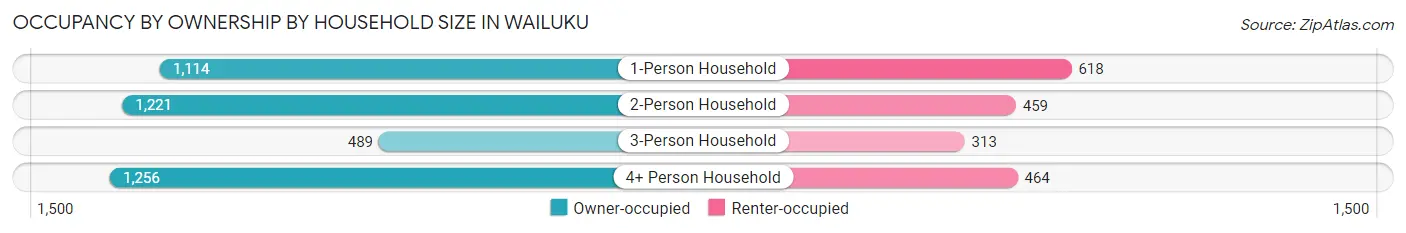
| Household Size | Owner-occupied | Renter-occupied |
| 1-Person Household | 1,114 (64.3%) | 618 (35.7%) |
| 2-Person Household | 1,221 (72.7%) | 459 (27.3%) |
| 3-Person Household | 489 (61.0%) | 313 (39.0%) |
| 4+ Person Household | 1,256 (73.0%) | 464 (27.0%) |
| Total Housing Units | 4,080 (68.8%) | 1,854 (31.2%) |
Occupancy by Educational Attainment in Wailuku
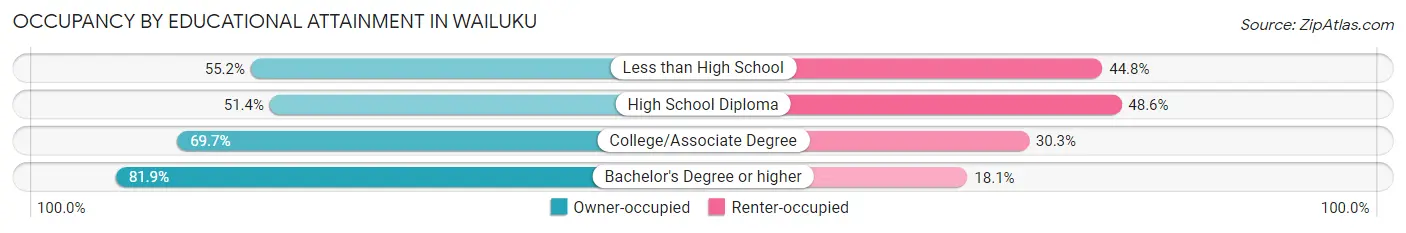
| Household Size | Owner-occupied | Renter-occupied |
| Less than High School | 187 (55.2%) | 152 (44.8%) |
| High School Diploma | 757 (51.4%) | 716 (48.6%) |
| College/Associate Degree | 1,375 (69.7%) | 597 (30.3%) |
| Bachelor's Degree or higher | 1,761 (81.9%) | 389 (18.1%) |
Occupancy by Age of Householder in Wailuku
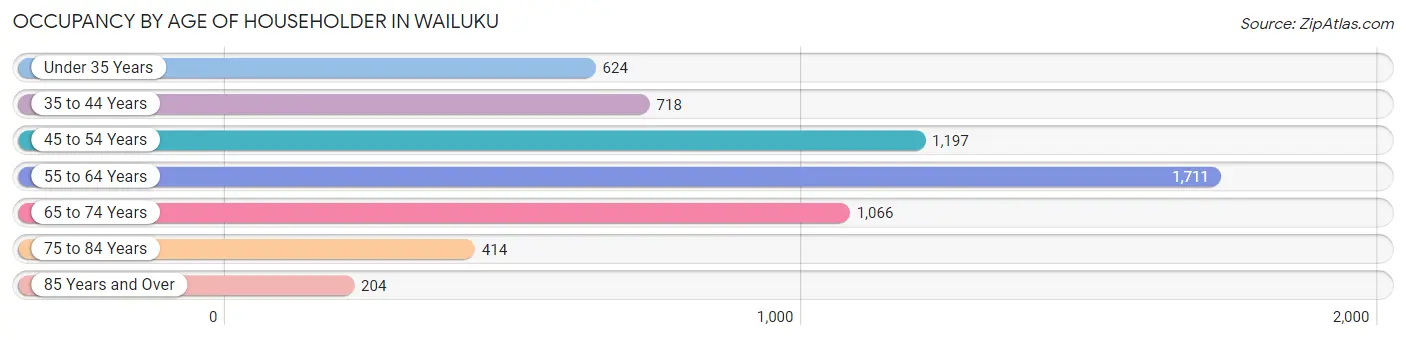
| Age Bracket | # Households | % Households |
| Under 35 Years | 624 | 10.5% |
| 35 to 44 Years | 718 | 12.1% |
| 45 to 54 Years | 1,197 | 20.2% |
| 55 to 64 Years | 1,711 | 28.8% |
| 65 to 74 Years | 1,066 | 18.0% |
| 75 to 84 Years | 414 | 7.0% |
| 85 Years and Over | 204 | 3.4% |
| Total | 5,934 | 100.0% |
Housing Finances in Wailuku
Median Income by Occupancy in Wailuku
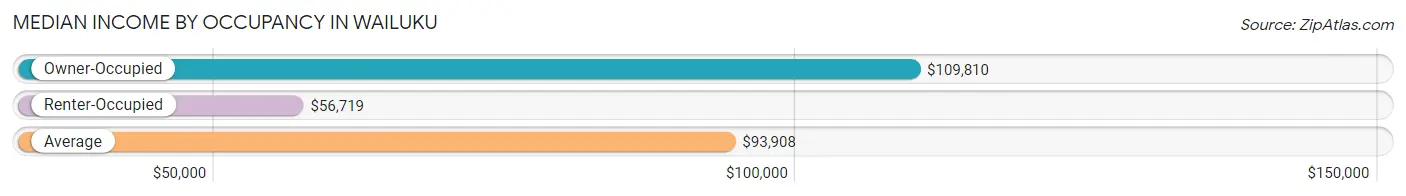
| Occupancy Type | # Households | Median Income |
| Owner-Occupied | 4,080 (68.8%) | $109,810 |
| Renter-Occupied | 1,854 (31.2%) | $56,719 |
| Average | 5,934 (100.0%) | $93,908 |
Occupancy by Householder Income Bracket in Wailuku
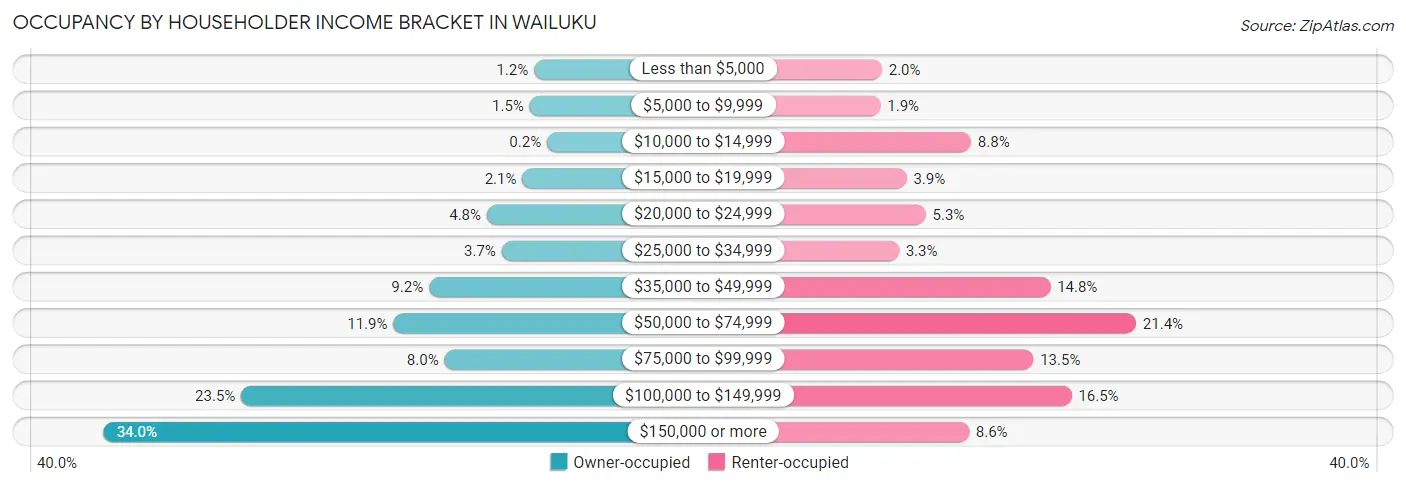
| Income Bracket | Owner-occupied | Renter-occupied |
| Less than $5,000 | 48 (1.2%) | 37 (2.0%) |
| $5,000 to $9,999 | 62 (1.5%) | 35 (1.9%) |
| $10,000 to $14,999 | 8 (0.2%) | 163 (8.8%) |
| $15,000 to $19,999 | 85 (2.1%) | 72 (3.9%) |
| $20,000 to $24,999 | 195 (4.8%) | 99 (5.3%) |
| $25,000 to $34,999 | 149 (3.6%) | 61 (3.3%) |
| $35,000 to $49,999 | 375 (9.2%) | 275 (14.8%) |
| $50,000 to $74,999 | 486 (11.9%) | 396 (21.4%) |
| $75,000 to $99,999 | 327 (8.0%) | 251 (13.5%) |
| $100,000 to $149,999 | 959 (23.5%) | 305 (16.5%) |
| $150,000 or more | 1,386 (34.0%) | 160 (8.6%) |
| Total | 4,080 (100.0%) | 1,854 (100.0%) |
Monthly Housing Cost Tiers in Wailuku
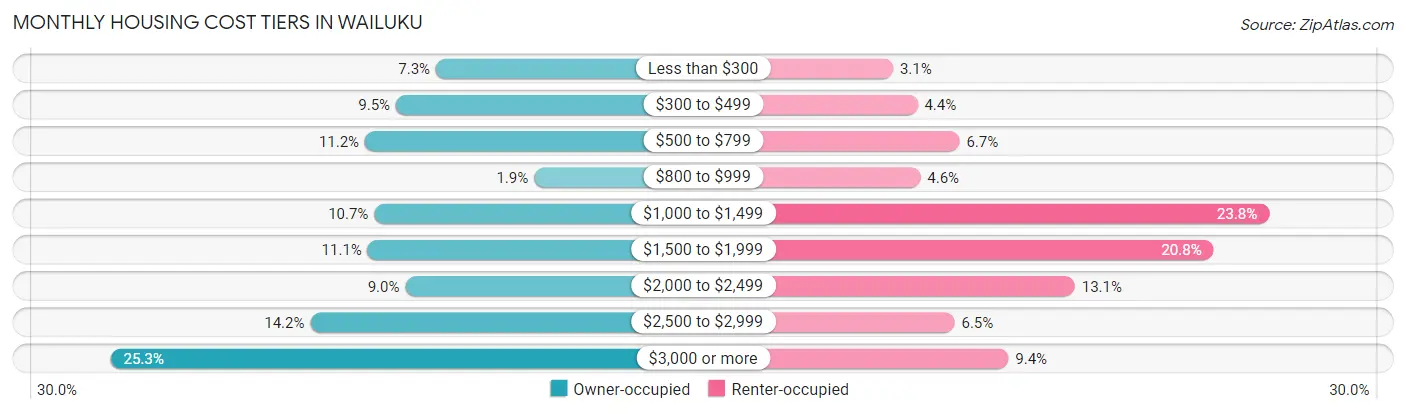
| Monthly Cost | Owner-occupied | Renter-occupied |
| Less than $300 | 297 (7.3%) | 57 (3.1%) |
| $300 to $499 | 387 (9.5%) | 82 (4.4%) |
| $500 to $799 | 457 (11.2%) | 125 (6.7%) |
| $800 to $999 | 76 (1.9%) | 85 (4.6%) |
| $1,000 to $1,499 | 436 (10.7%) | 442 (23.8%) |
| $1,500 to $1,999 | 451 (11.1%) | 385 (20.8%) |
| $2,000 to $2,499 | 366 (9.0%) | 243 (13.1%) |
| $2,500 to $2,999 | 580 (14.2%) | 120 (6.5%) |
| $3,000 or more | 1,030 (25.3%) | 175 (9.4%) |
| Total | 4,080 (100.0%) | 1,854 (100.0%) |
Physical Housing Characteristics in Wailuku
Housing Structures in Wailuku
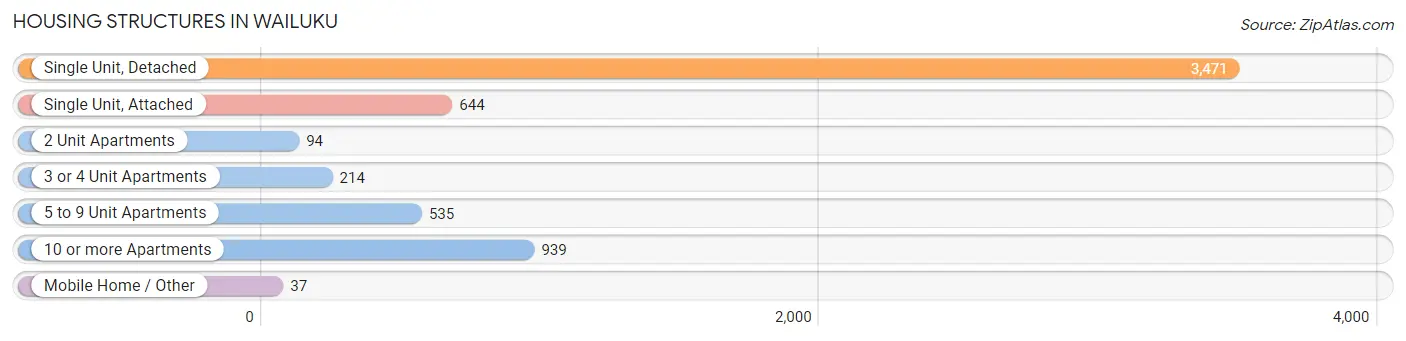
| Structure Type | # Housing Units | % Housing Units |
| Single Unit, Detached | 3,471 | 58.5% |
| Single Unit, Attached | 644 | 10.8% |
| 2 Unit Apartments | 94 | 1.6% |
| 3 or 4 Unit Apartments | 214 | 3.6% |
| 5 to 9 Unit Apartments | 535 | 9.0% |
| 10 or more Apartments | 939 | 15.8% |
| Mobile Home / Other | 37 | 0.6% |
| Total | 5,934 | 100.0% |
Housing Structures by Occupancy in Wailuku
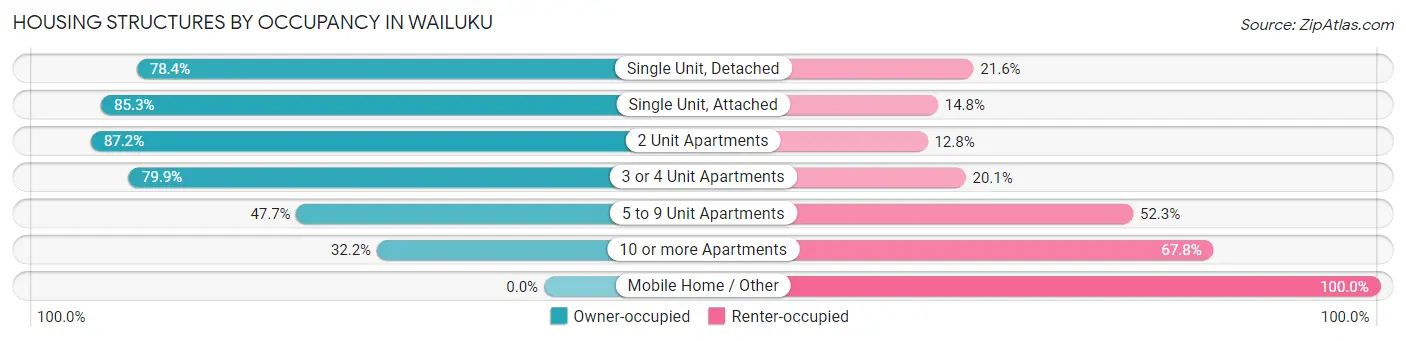
| Structure Type | Owner-occupied | Renter-occupied |
| Single Unit, Detached | 2,721 (78.4%) | 750 (21.6%) |
| Single Unit, Attached | 549 (85.3%) | 95 (14.7%) |
| 2 Unit Apartments | 82 (87.2%) | 12 (12.8%) |
| 3 or 4 Unit Apartments | 171 (79.9%) | 43 (20.1%) |
| 5 to 9 Unit Apartments | 255 (47.7%) | 280 (52.3%) |
| 10 or more Apartments | 302 (32.2%) | 637 (67.8%) |
| Mobile Home / Other | 0 (0.0%) | 37 (100.0%) |
| Total | 4,080 (68.8%) | 1,854 (31.2%) |
Housing Structures by Number of Rooms in Wailuku
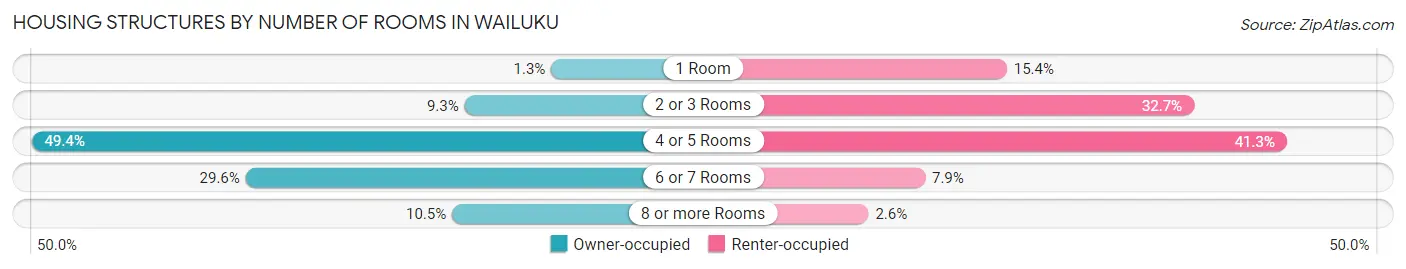
| Number of Rooms | Owner-occupied | Renter-occupied |
| 1 Room | 53 (1.3%) | 286 (15.4%) |
| 2 or 3 Rooms | 380 (9.3%) | 607 (32.7%) |
| 4 or 5 Rooms | 2,014 (49.4%) | 766 (41.3%) |
| 6 or 7 Rooms | 1,206 (29.6%) | 146 (7.9%) |
| 8 or more Rooms | 427 (10.5%) | 49 (2.6%) |
| Total | 4,080 (100.0%) | 1,854 (100.0%) |
Housing Structure by Heating Type in Wailuku
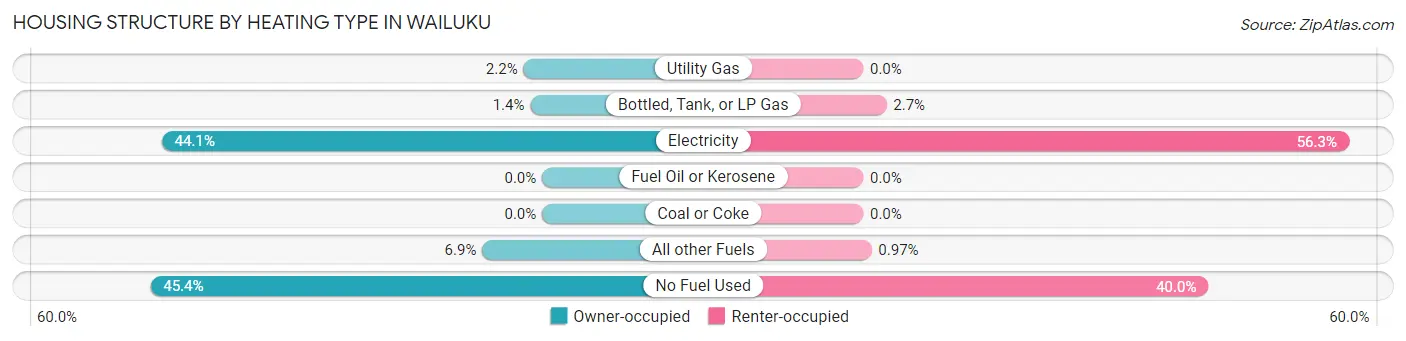
| Heating Type | Owner-occupied | Renter-occupied |
| Utility Gas | 88 (2.2%) | 0 (0.0%) |
| Bottled, Tank, or LP Gas | 56 (1.4%) | 50 (2.7%) |
| Electricity | 1,800 (44.1%) | 1,044 (56.3%) |
| Fuel Oil or Kerosene | 0 (0.0%) | 0 (0.0%) |
| Coal or Coke | 0 (0.0%) | 0 (0.0%) |
| All other Fuels | 283 (6.9%) | 18 (1.0%) |
| No Fuel Used | 1,853 (45.4%) | 742 (40.0%) |
| Total | 4,080 (100.0%) | 1,854 (100.0%) |
Household Vehicle Usage in Wailuku
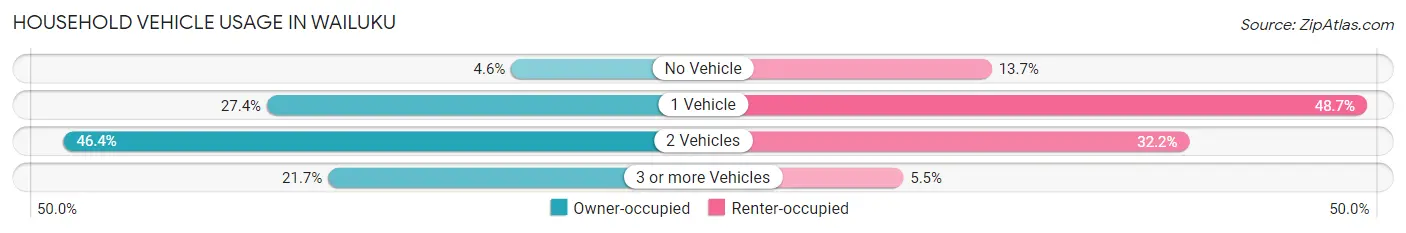
| Vehicles per Household | Owner-occupied | Renter-occupied |
| No Vehicle | 187 (4.6%) | 254 (13.7%) |
| 1 Vehicle | 1,117 (27.4%) | 903 (48.7%) |
| 2 Vehicles | 1,892 (46.4%) | 596 (32.2%) |
| 3 or more Vehicles | 884 (21.7%) | 101 (5.4%) |
| Total | 4,080 (100.0%) | 1,854 (100.0%) |
Real Estate & Mortgages in Wailuku
Real Estate and Mortgage Overview in Wailuku
| Characteristic | Without Mortgage | With Mortgage |
| Housing Units | 1,338 | 2,742 |
| Median Property Value | $657,700 | $740,700 |
| Median Household Income | $71,689 | $1,016 |
| Monthly Housing Costs | $498 | $1,030 |
| Real Estate Taxes | $1,024 | $230 |
Property Value by Mortgage Status in Wailuku
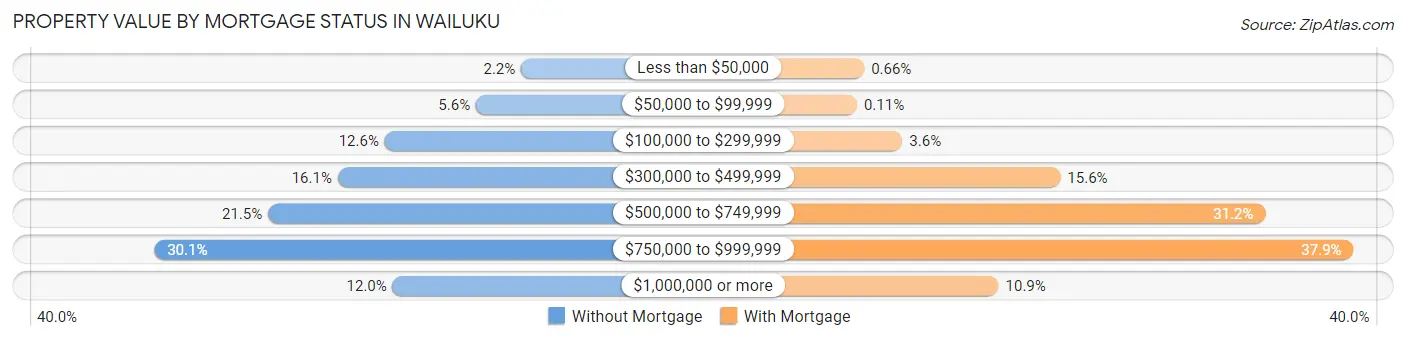
| Property Value | Without Mortgage | With Mortgage |
| Less than $50,000 | 29 (2.2%) | 18 (0.7%) |
| $50,000 to $99,999 | 75 (5.6%) | 3 (0.1%) |
| $100,000 to $299,999 | 168 (12.6%) | 98 (3.6%) |
| $300,000 to $499,999 | 216 (16.1%) | 428 (15.6%) |
| $500,000 to $749,999 | 287 (21.4%) | 856 (31.2%) |
| $750,000 to $999,999 | 403 (30.1%) | 1,040 (37.9%) |
| $1,000,000 or more | 160 (12.0%) | 299 (10.9%) |
| Total | 1,338 (100.0%) | 2,742 (100.0%) |
Household Income by Mortgage Status in Wailuku
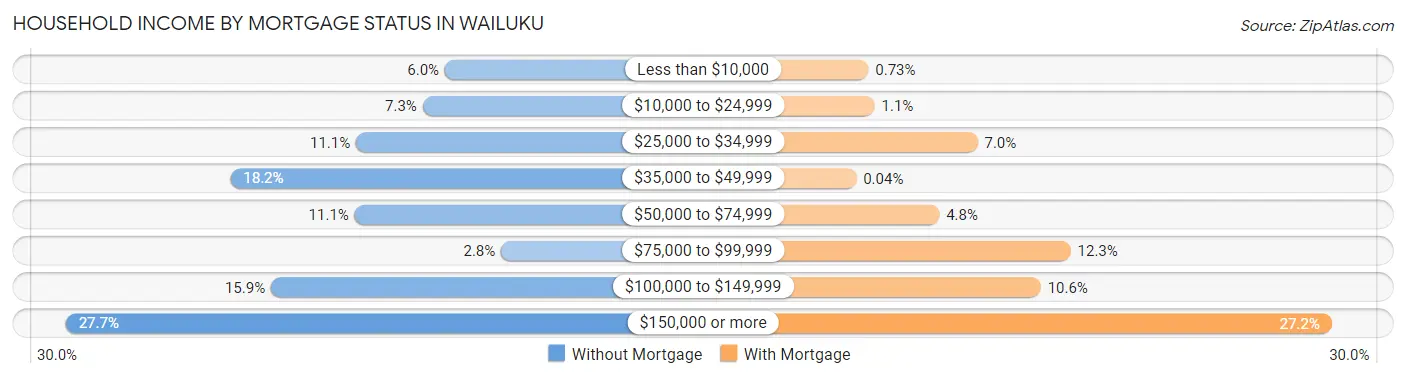
| Household Income | Without Mortgage | With Mortgage |
| Less than $10,000 | 80 (6.0%) | 20 (0.7%) |
| $10,000 to $24,999 | 97 (7.2%) | 30 (1.1%) |
| $25,000 to $34,999 | 148 (11.1%) | 191 (7.0%) |
| $35,000 to $49,999 | 244 (18.2%) | 1 (0.0%) |
| $50,000 to $74,999 | 149 (11.1%) | 131 (4.8%) |
| $75,000 to $99,999 | 37 (2.8%) | 337 (12.3%) |
| $100,000 to $149,999 | 213 (15.9%) | 290 (10.6%) |
| $150,000 or more | 370 (27.7%) | 746 (27.2%) |
| Total | 1,338 (100.0%) | 2,742 (100.0%) |
Property Value to Household Income Ratio in Wailuku
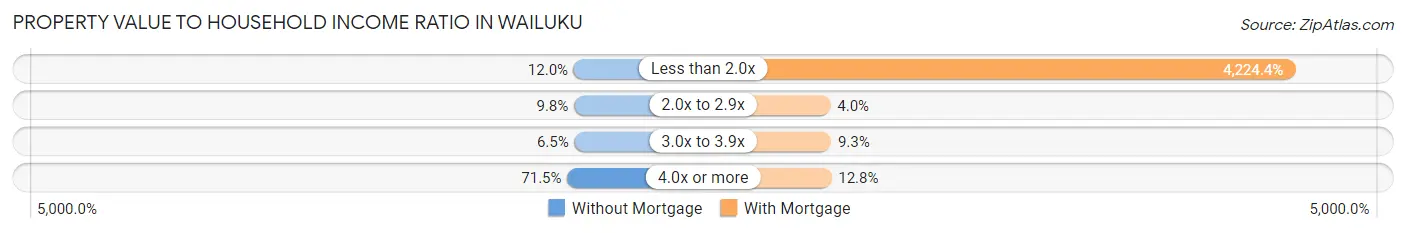
| Value-to-Income Ratio | Without Mortgage | With Mortgage |
| Less than 2.0x | 161 (12.0%) | 115,833 (4,224.4%) |
| 2.0x to 2.9x | 131 (9.8%) | 110 (4.0%) |
| 3.0x to 3.9x | 87 (6.5%) | 256 (9.3%) |
| 4.0x or more | 957 (71.5%) | 350 (12.8%) |
| Total | 1,338 (100.0%) | 2,742 (100.0%) |
Real Estate Taxes by Mortgage Status in Wailuku
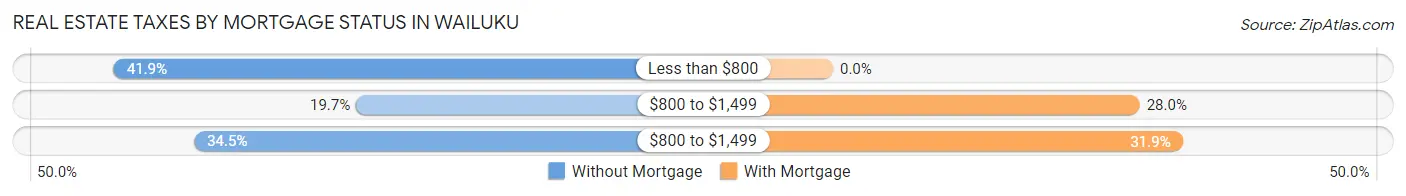
| Property Taxes | Without Mortgage | With Mortgage |
| Less than $800 | 560 (41.8%) | 0 (0.0%) |
| $800 to $1,499 | 264 (19.7%) | 768 (28.0%) |
| $800 to $1,499 | 462 (34.5%) | 875 (31.9%) |
| Total | 1,338 (100.0%) | 2,742 (100.0%) |
Health & Disability in Wailuku
Health Insurance Coverage by Age in Wailuku
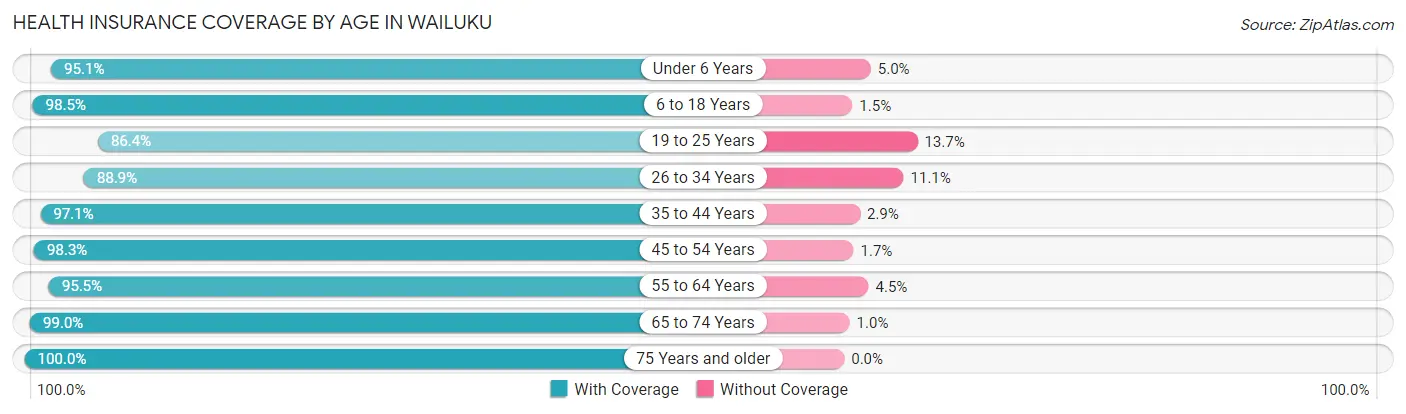
| Age Bracket | With Coverage | Without Coverage |
| Under 6 Years | 1,477 (95.1%) | 77 (5.0%) |
| 6 to 18 Years | 2,942 (98.5%) | 45 (1.5%) |
| 19 to 25 Years | 816 (86.4%) | 129 (13.7%) |
| 26 to 34 Years | 1,383 (88.9%) | 172 (11.1%) |
| 35 to 44 Years | 1,988 (97.1%) | 60 (2.9%) |
| 45 to 54 Years | 2,091 (98.3%) | 37 (1.7%) |
| 55 to 64 Years | 2,383 (95.5%) | 113 (4.5%) |
| 65 to 74 Years | 1,675 (99.0%) | 17 (1.0%) |
| 75 Years and older | 1,082 (100.0%) | 0 (0.0%) |
| Total | 15,837 (96.1%) | 650 (3.9%) |
Health Insurance Coverage by Citizenship Status in Wailuku
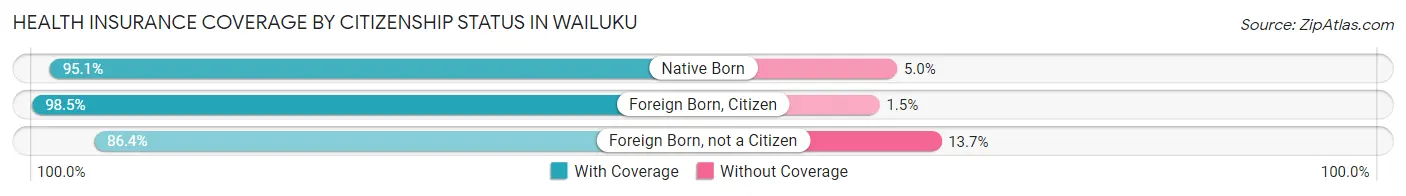
| Citizenship Status | With Coverage | Without Coverage |
| Native Born | 1,477 (95.1%) | 77 (5.0%) |
| Foreign Born, Citizen | 2,942 (98.5%) | 45 (1.5%) |
| Foreign Born, not a Citizen | 816 (86.4%) | 129 (13.7%) |
Health Insurance Coverage by Household Income in Wailuku
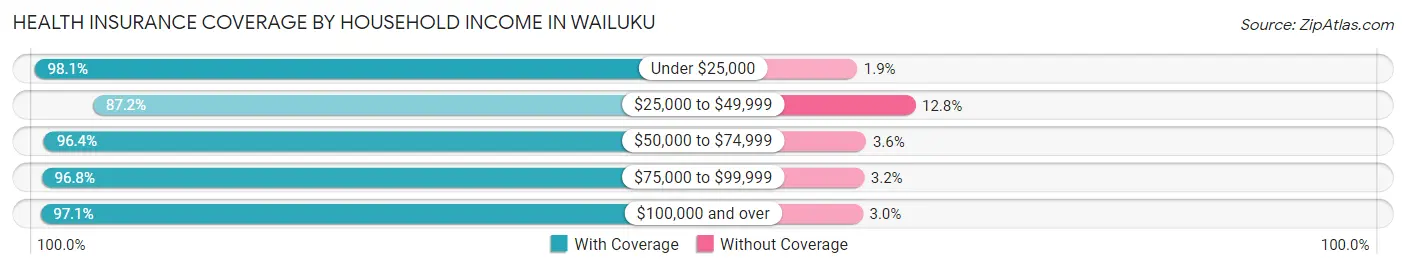
| Household Income | With Coverage | Without Coverage |
| Under $25,000 | 1,144 (98.1%) | 22 (1.9%) |
| $25,000 to $49,999 | 1,398 (87.2%) | 205 (12.8%) |
| $50,000 to $74,999 | 2,278 (96.4%) | 85 (3.6%) |
| $75,000 to $99,999 | 1,851 (96.8%) | 61 (3.2%) |
| $100,000 and over | 9,111 (97.1%) | 277 (2.9%) |
Public vs Private Health Insurance Coverage by Age in Wailuku
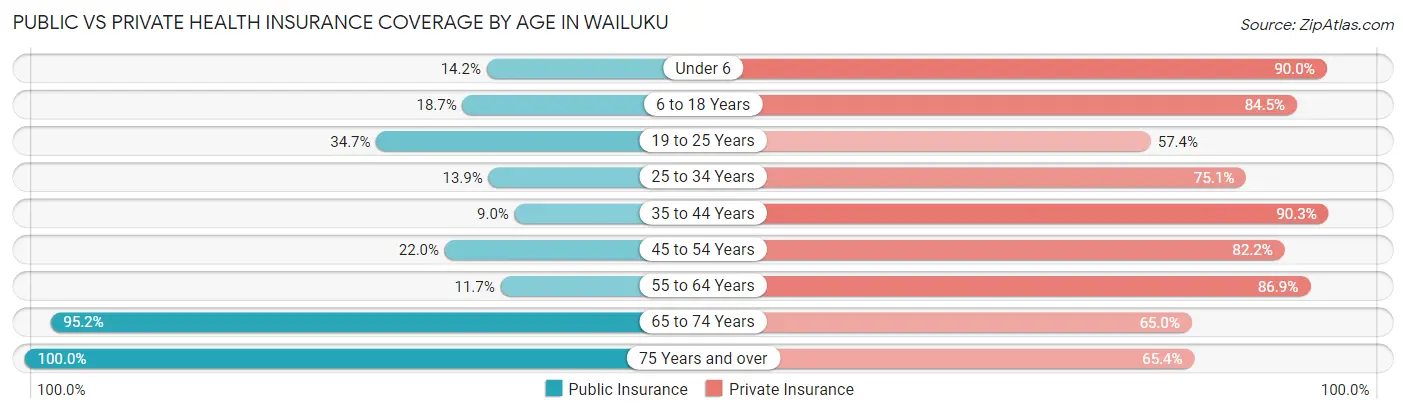
| Age Bracket | Public Insurance | Private Insurance |
| Under 6 | 221 (14.2%) | 1,398 (90.0%) |
| 6 to 18 Years | 559 (18.7%) | 2,523 (84.5%) |
| 19 to 25 Years | 328 (34.7%) | 542 (57.4%) |
| 25 to 34 Years | 216 (13.9%) | 1,167 (75.0%) |
| 35 to 44 Years | 185 (9.0%) | 1,850 (90.3%) |
| 45 to 54 Years | 468 (22.0%) | 1,749 (82.2%) |
| 55 to 64 Years | 291 (11.7%) | 2,169 (86.9%) |
| 65 to 74 Years | 1,611 (95.2%) | 1,099 (64.9%) |
| 75 Years and over | 1,082 (100.0%) | 708 (65.4%) |
| Total | 4,961 (30.1%) | 13,205 (80.1%) |
Disability Status by Sex by Age in Wailuku
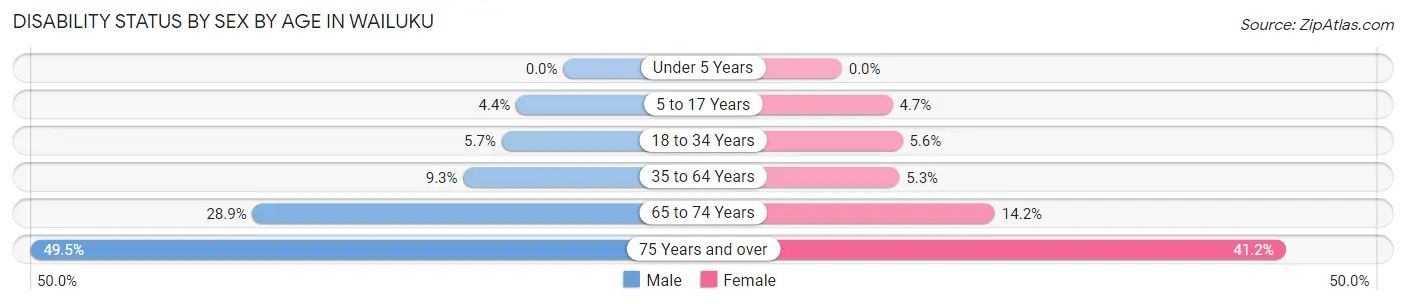
| Age Bracket | Male | Female |
| Under 5 Years | 0 (0.0%) | 0 (0.0%) |
| 5 to 17 Years | 68 (4.4%) | 73 (4.7%) |
| 18 to 34 Years | 89 (5.7%) | 68 (5.6%) |
| 35 to 64 Years | 303 (9.3%) | 182 (5.3%) |
| 65 to 74 Years | 283 (28.8%) | 101 (14.2%) |
| 75 Years and over | 224 (49.4%) | 259 (41.2%) |
Disability Class by Sex by Age in Wailuku
Disability Class: Hearing Difficulty
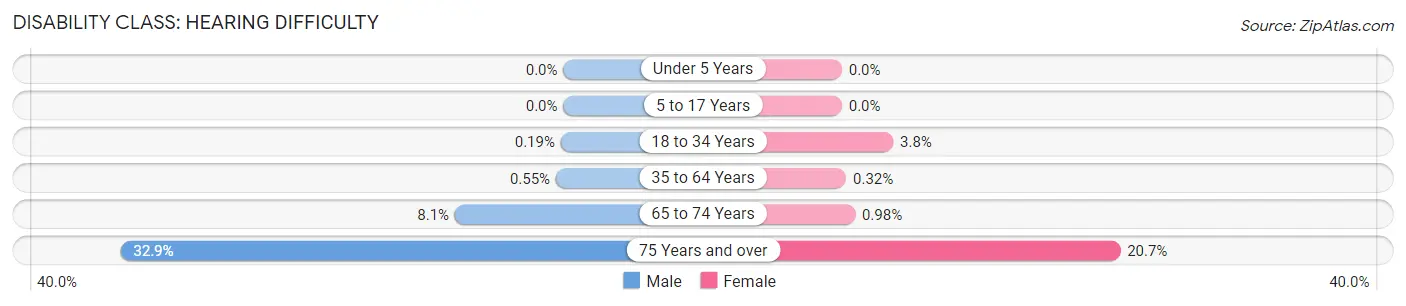
| Age Bracket | Male | Female |
| Under 5 Years | 0 (0.0%) | 0 (0.0%) |
| 5 to 17 Years | 0 (0.0%) | 0 (0.0%) |
| 18 to 34 Years | 3 (0.2%) | 46 (3.8%) |
| 35 to 64 Years | 18 (0.5%) | 11 (0.3%) |
| 65 to 74 Years | 79 (8.1%) | 7 (1.0%) |
| 75 Years and over | 149 (32.9%) | 130 (20.7%) |
Disability Class: Vision Difficulty
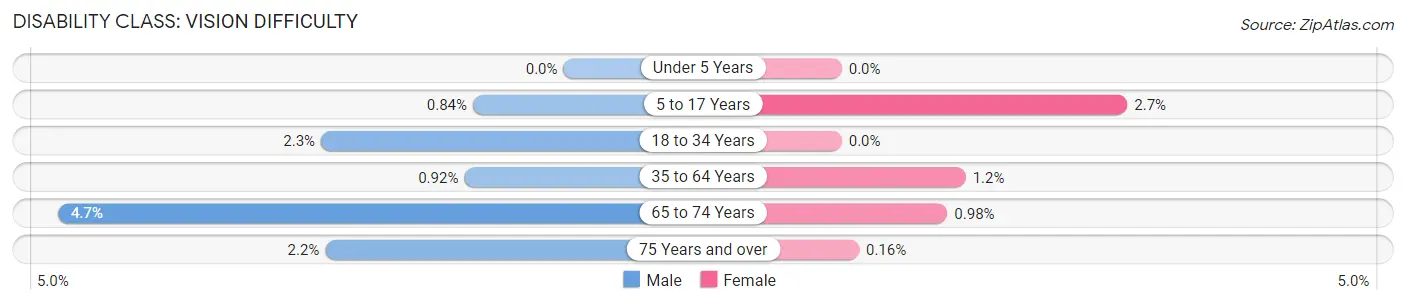
| Age Bracket | Male | Female |
| Under 5 Years | 0 (0.0%) | 0 (0.0%) |
| 5 to 17 Years | 13 (0.8%) | 41 (2.6%) |
| 18 to 34 Years | 35 (2.2%) | 0 (0.0%) |
| 35 to 64 Years | 30 (0.9%) | 39 (1.1%) |
| 65 to 74 Years | 46 (4.7%) | 7 (1.0%) |
| 75 Years and over | 10 (2.2%) | 1 (0.2%) |
Disability Class: Cognitive Difficulty
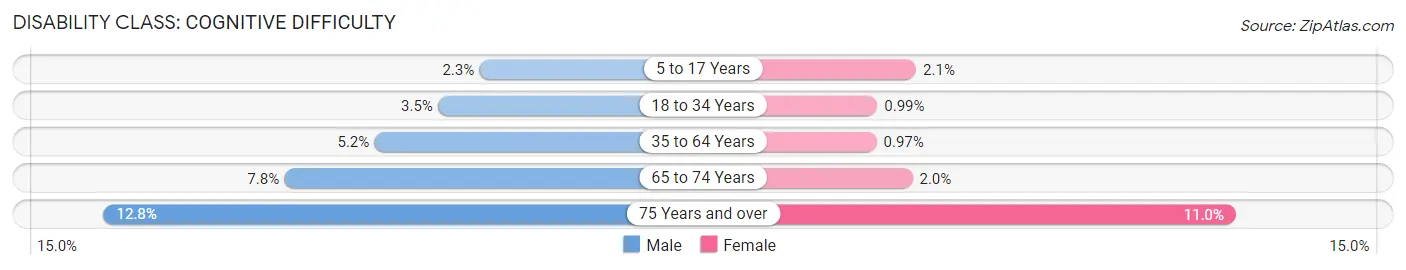
| Age Bracket | Male | Female |
| 5 to 17 Years | 36 (2.3%) | 32 (2.1%) |
| 18 to 34 Years | 54 (3.5%) | 12 (1.0%) |
| 35 to 64 Years | 171 (5.2%) | 33 (1.0%) |
| 65 to 74 Years | 76 (7.7%) | 14 (2.0%) |
| 75 Years and over | 58 (12.8%) | 69 (11.0%) |
Disability Class: Ambulatory Difficulty
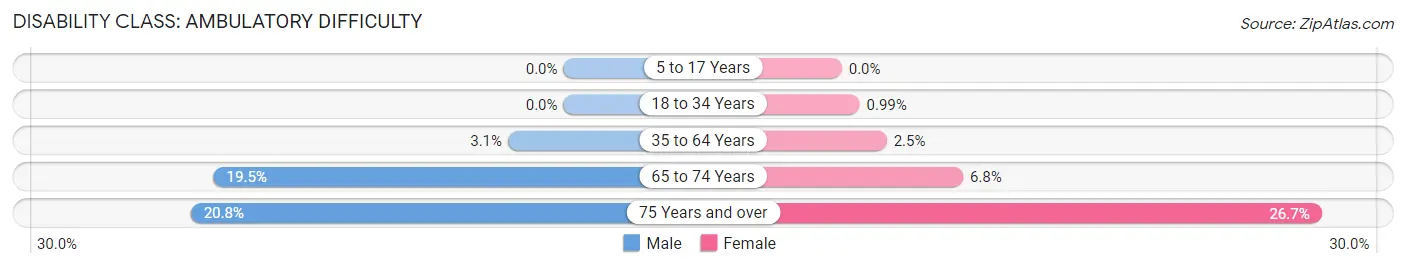
| Age Bracket | Male | Female |
| 5 to 17 Years | 0 (0.0%) | 0 (0.0%) |
| 18 to 34 Years | 0 (0.0%) | 12 (1.0%) |
| 35 to 64 Years | 101 (3.1%) | 85 (2.5%) |
| 65 to 74 Years | 191 (19.5%) | 48 (6.8%) |
| 75 Years and over | 94 (20.7%) | 168 (26.7%) |
Disability Class: Self-Care Difficulty
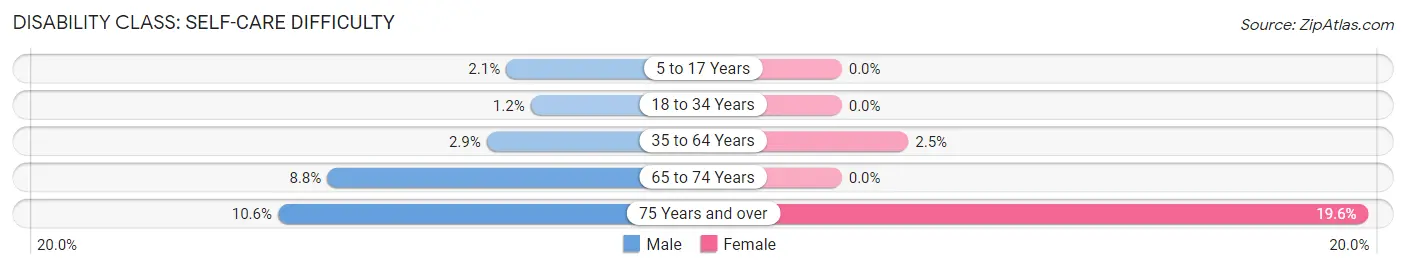
| Age Bracket | Male | Female |
| 5 to 17 Years | 33 (2.1%) | 0 (0.0%) |
| 18 to 34 Years | 19 (1.2%) | 0 (0.0%) |
| 35 to 64 Years | 93 (2.9%) | 84 (2.5%) |
| 65 to 74 Years | 86 (8.8%) | 0 (0.0%) |
| 75 Years and over | 48 (10.6%) | 123 (19.6%) |
Technology Access in Wailuku
Computing Device Access in Wailuku
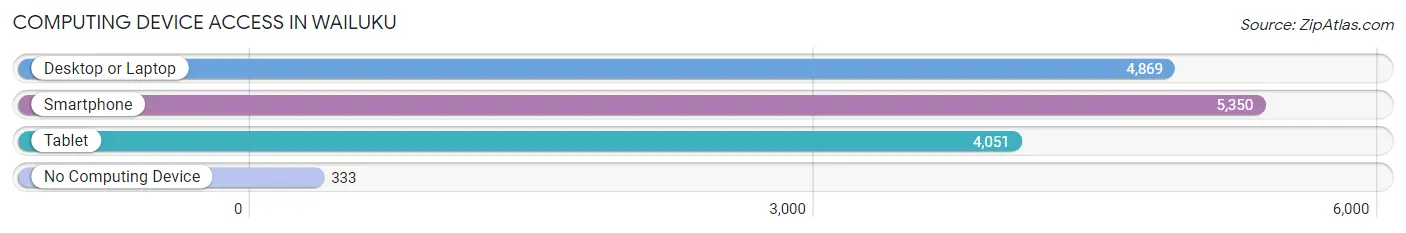
| Device Type | # Households | % Households |
| Desktop or Laptop | 4,869 | 82.1% |
| Smartphone | 5,350 | 90.2% |
| Tablet | 4,051 | 68.3% |
| No Computing Device | 333 | 5.6% |
| Total | 5,934 | 100.0% |
Internet Access in Wailuku
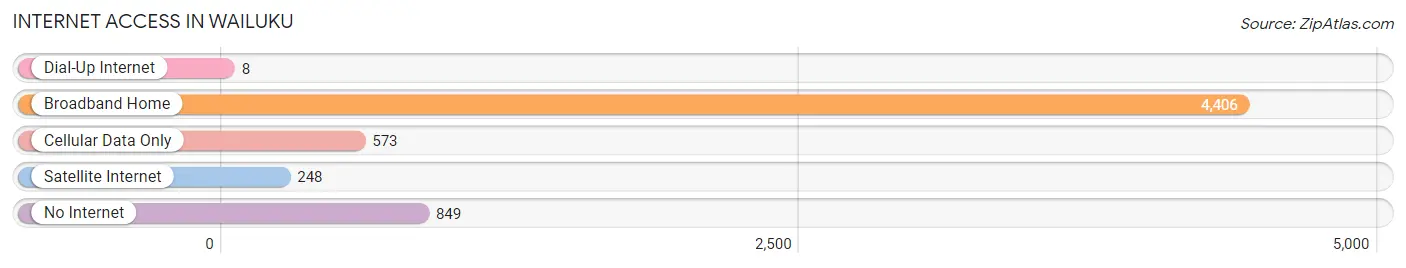
| Internet Type | # Households | % Households |
| Dial-Up Internet | 8 | 0.1% |
| Broadband Home | 4,406 | 74.3% |
| Cellular Data Only | 573 | 9.7% |
| Satellite Internet | 248 | 4.2% |
| No Internet | 849 | 14.3% |
| Total | 5,934 | 100.0% |
Wailuku Summary
Wailuku is a small town located on the island of Maui in the state of Hawaii. It is the county seat of Maui County and is located in the central part of the island. The population of Wailuku was 8,841 at the 2010 census.
History
The area of Wailuku was first settled by Polynesian voyagers in the late 1700s. The first recorded European contact was in 1790 when the British explorer Captain George Vancouver visited the area. In 1841, the area was annexed by the Kingdom of Hawaii and became part of the district of Wailuku.
In the late 1800s, Wailuku became a center of sugar production and was home to several large sugar plantations. The town was also a center of government and commerce, and was the site of the first courthouse and jail in Maui County.
In the early 1900s, Wailuku experienced a period of rapid growth and development. The town was home to several large businesses, including a brewery, a cannery, and a hotel. The town also became a popular tourist destination, and was home to several resorts and hotels.
Geography
Wailuku is located on the central part of the island of Maui, at an elevation of about 500 feet. The town is situated on the banks of the Wailuku River, which flows through the town and empties into the Pacific Ocean.
The town is surrounded by lush tropical vegetation, including palm trees, banana trees, and other tropical plants. The climate in Wailuku is warm and humid, with temperatures ranging from the mid-70s to the mid-80s throughout the year.
Economy
The economy of Wailuku is largely based on tourism and agriculture. The town is home to several resorts and hotels, as well as several restaurants and shops. The town is also home to several agricultural businesses, including sugar plantations, fruit orchards, and flower farms.
The town is also home to several government offices, including the Maui County Courthouse and the Maui County Police Department.
Demographics
As of the 2010 census, the population of Wailuku was 8,841. The racial makeup of the town was 57.3% White, 0.7% African American, 0.3% Native American, 24.2% Asian, 0.2% Pacific Islander, 11.2% from other races, and 6.3% from two or more races. Hispanic or Latino of any race were 20.2% of the population.
The median income for a household in Wailuku was $50,945, and the median income for a family was $60,945. The per capita income for the town was $25,945. About 11.2% of families and 14.2% of the population were below the poverty line, including 18.2% of those under age 18 and 8.2% of those age 65 or over.
Common Questions
What is Per Capita Income in Wailuku?
Per Capita income in Wailuku is $41,970.
What is the Median Family Income in Wailuku?
Median Family Income in Wailuku is $110,571.
What is the Median Household income in Wailuku?
Median Household Income in Wailuku is $93,908.
What is Income or Wage Gap in Wailuku?
Income or Wage Gap in Wailuku is 15.0%.
Women in Wailuku earn 85.0 cents for every dollar earned by a man.
What is Inequality or Gini Index in Wailuku?
Inequality or Gini Index in Wailuku is 0.43.
What is the Total Population of Wailuku?
Total Population of Wailuku is 16,590.
What is the Total Male Population of Wailuku?
Total Male Population of Wailuku is 8,489.
What is the Total Female Population of Wailuku?
Total Female Population of Wailuku is 8,101.
What is the Ratio of Males per 100 Females in Wailuku?
There are 104.79 Males per 100 Females in Wailuku.
What is the Ratio of Females per 100 Males in Wailuku?
There are 95.43 Females per 100 Males in Wailuku.
What is the Median Population Age in Wailuku?
Median Population Age in Wailuku is 40.3 Years.
What is the Average Family Size in Wailuku
Average Family Size in Wailuku is 3.5 People.
What is the Average Household Size in Wailuku
Average Household Size in Wailuku is 2.8 People.
How Large is the Labor Force in Wailuku?
There are 8,330 People in the Labor Forcein in Wailuku.
What is the Percentage of People in the Labor Force in Wailuku?
65.6% of People are in the Labor Force in Wailuku.
What is the Unemployment Rate in Wailuku?
Unemployment Rate in Wailuku is 3.5%.