Summit, NJ Map & Demographics
Summit Map
Summit Overview
$104,469
PER CAPITA INCOME
$242,235
AVG FAMILY INCOME
$176,702
AVG HOUSEHOLD INCOME
51.0%
WAGE / INCOME GAP [ % ]
49.0¢/ $1
WAGE / INCOME GAP [ $ ]
0.52
INEQUALITY / GINI INDEX
22,555
TOTAL POPULATION
10,768
MALE POPULATION
11,787
FEMALE POPULATION
91.35
MALES / 100 FEMALES
109.46
FEMALES / 100 MALES
40.5
MEDIAN AGE
3.3
AVG FAMILY SIZE
2.8
AVG HOUSEHOLD SIZE
12,201
LABOR FORCE [ PEOPLE ]
69.6%
PERCENT IN LABOR FORCE
5.7%
UNEMPLOYMENT RATE
Summit Zip Codes
Summit Area Codes
Income in Summit
Income Overview in Summit
Per Capita Income in Summit is $104,469, while median incomes of families and households are $242,235 and $176,702 respectively.
| Characteristic | Number | Measure |
| Per Capita Income | 22,555 | $104,469 |
| Median Family Income | 5,892 | $242,235 |
| Mean Family Income | 5,892 | $355,408 |
| Median Household Income | 7,944 | $176,702 |
| Mean Household Income | 7,944 | $291,509 |
| Income Deficit | 5,892 | $0 |
| Wage / Income Gap (%) | 22,555 | 50.98% |
| Wage / Income Gap ($) | 22,555 | 49.02¢ per $1 |
| Gini / Inequality Index | 22,555 | 0.52 |
Earnings by Sex in Summit
Average Earnings in Summit are $79,875, $115,142 for men and $56,448 for women, a difference of 51.0%.
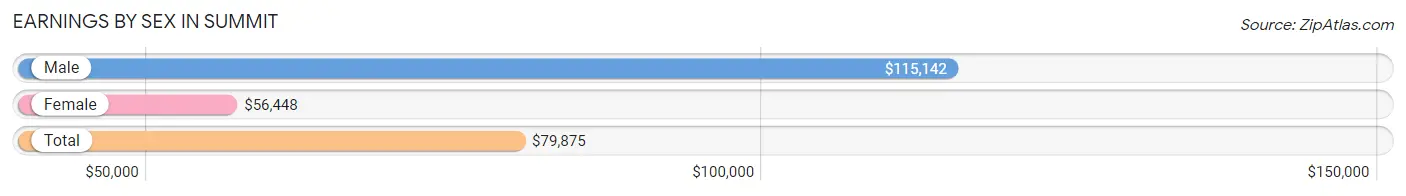
| Sex | Number | Average Earnings |
| Male | 6,652 (52.4%) | $115,142 |
| Female | 6,048 (47.6%) | $56,448 |
| Total | 12,700 (100.0%) | $79,875 |
Earnings by Sex by Income Bracket in Summit
The most common earnings brackets in Summit are $100,000+ for men (3,502 | 52.6%) and $100,000+ for women (1,950 | 32.2%).
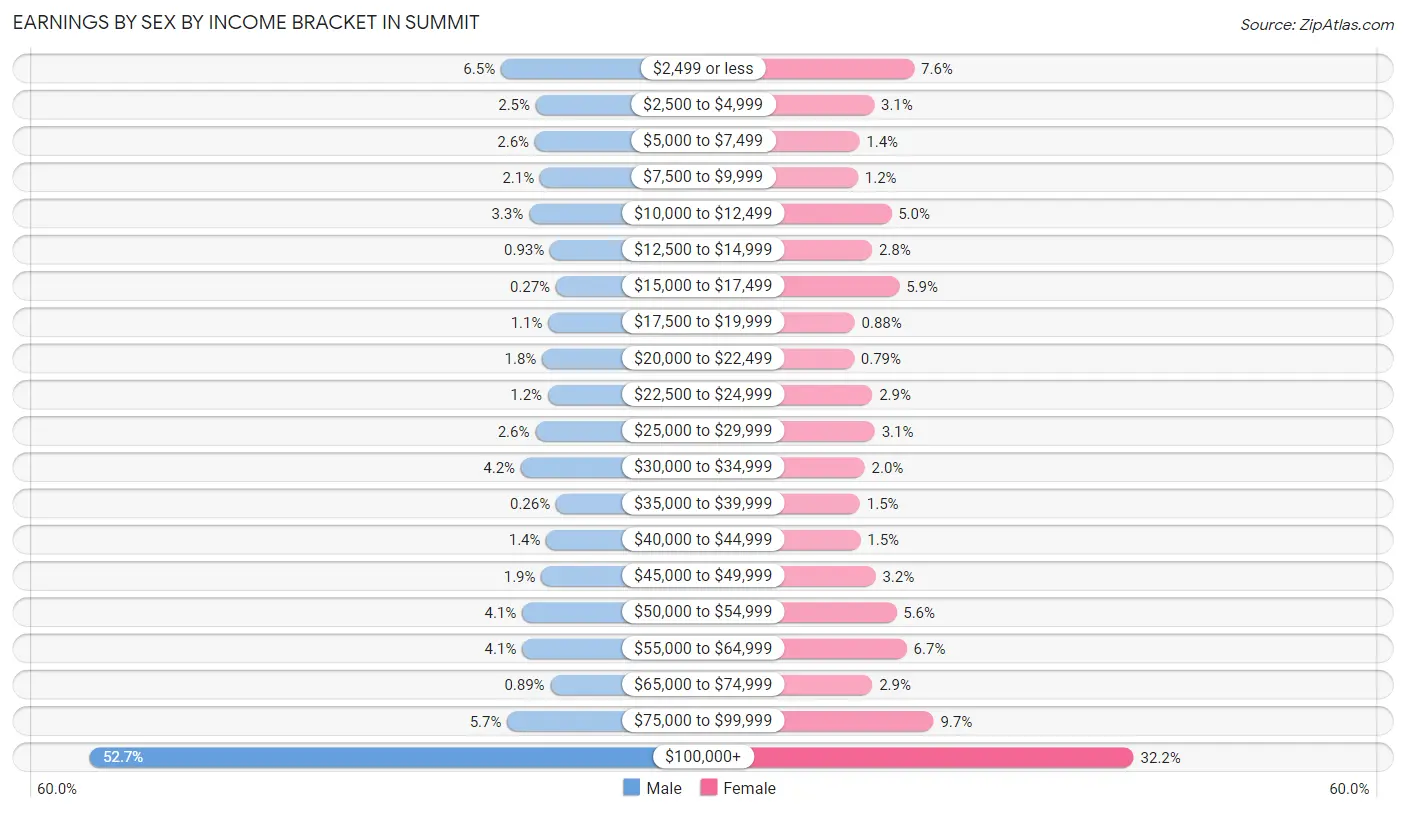
| Income | Male | Female |
| $2,499 or less | 429 (6.5%) | 458 (7.6%) |
| $2,500 to $4,999 | 168 (2.5%) | 185 (3.1%) |
| $5,000 to $7,499 | 175 (2.6%) | 85 (1.4%) |
| $7,500 to $9,999 | 137 (2.1%) | 75 (1.2%) |
| $10,000 to $12,499 | 219 (3.3%) | 302 (5.0%) |
| $12,500 to $14,999 | 62 (0.9%) | 171 (2.8%) |
| $15,000 to $17,499 | 18 (0.3%) | 356 (5.9%) |
| $17,500 to $19,999 | 75 (1.1%) | 53 (0.9%) |
| $20,000 to $22,499 | 121 (1.8%) | 48 (0.8%) |
| $22,500 to $24,999 | 78 (1.2%) | 173 (2.9%) |
| $25,000 to $29,999 | 172 (2.6%) | 190 (3.1%) |
| $30,000 to $34,999 | 280 (4.2%) | 121 (2.0%) |
| $35,000 to $39,999 | 17 (0.3%) | 89 (1.5%) |
| $40,000 to $44,999 | 90 (1.3%) | 92 (1.5%) |
| $45,000 to $49,999 | 127 (1.9%) | 195 (3.2%) |
| $50,000 to $54,999 | 271 (4.1%) | 336 (5.6%) |
| $55,000 to $64,999 | 270 (4.1%) | 407 (6.7%) |
| $65,000 to $74,999 | 59 (0.9%) | 173 (2.9%) |
| $75,000 to $99,999 | 382 (5.7%) | 589 (9.7%) |
| $100,000+ | 3,502 (52.6%) | 1,950 (32.2%) |
| Total | 6,652 (100.0%) | 6,048 (100.0%) |
Earnings by Sex by Educational Attainment in Summit
Average earnings in Summit are $149,291 for men and $73,620 for women, a difference of 50.7%. Men with an educational attainment of graduate degree enjoy the highest average annual earnings of $230,903, while those with less than high school education earn the least with $20,552. Women with an educational attainment of graduate degree earn the most with the average annual earnings of $110,382, while those with less than high school education have the smallest earnings of $12,929.
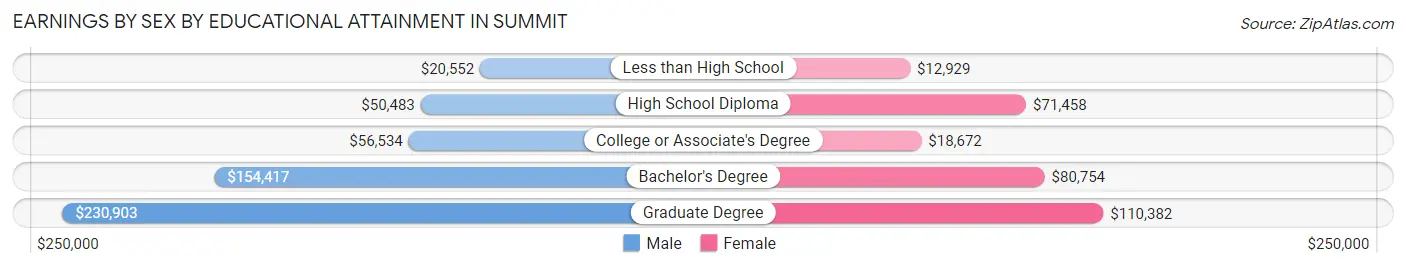
| Educational Attainment | Male Income | Female Income |
| Less than High School | $20,552 | $12,929 |
| High School Diploma | $50,483 | $71,458 |
| College or Associate's Degree | $56,534 | $18,672 |
| Bachelor's Degree | $154,417 | $80,754 |
| Graduate Degree | $230,903 | $110,382 |
| Total | $149,291 | $73,620 |
Family Income in Summit
Family Income Brackets in Summit
According to the Summit family income data, there are 3,512 families falling into the $200,000+ income range, which is the most common income bracket and makes up 59.6% of all families.
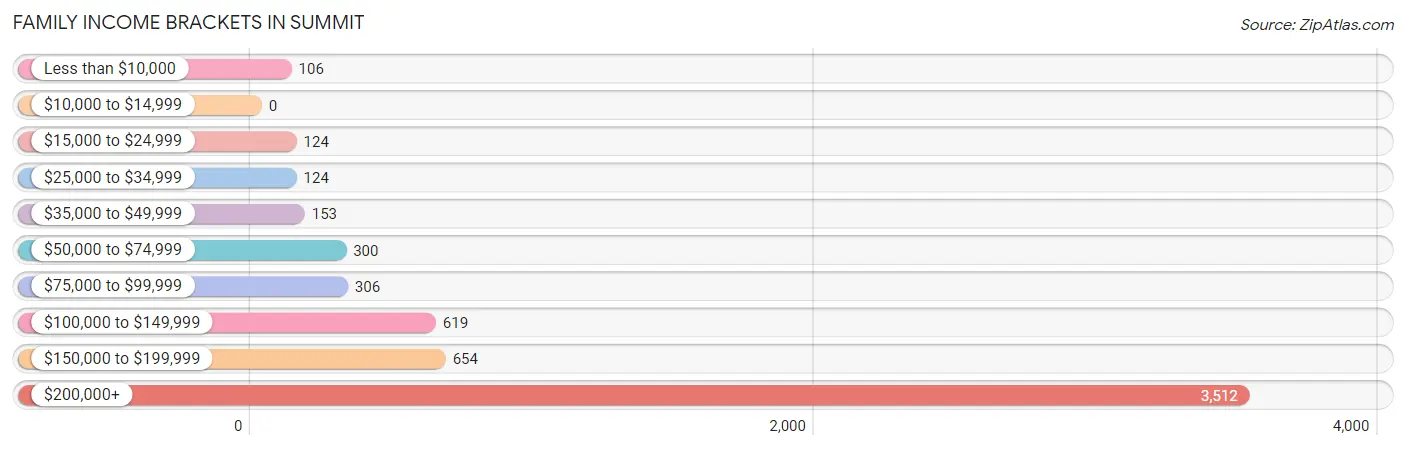
| Income Bracket | # Families | % Families |
| Less than $10,000 | 106 | 1.8% |
| $10,000 to $14,999 | 0 | 0.0% |
| $15,000 to $24,999 | 124 | 2.1% |
| $25,000 to $34,999 | 124 | 2.1% |
| $35,000 to $49,999 | 153 | 2.6% |
| $50,000 to $74,999 | 300 | 5.1% |
| $75,000 to $99,999 | 306 | 5.2% |
| $100,000 to $149,999 | 619 | 10.5% |
| $150,000 to $199,999 | 654 | 11.1% |
| $200,000+ | 3,512 | 59.6% |
Family Income by Famaliy Size in Summit
4-person families (1,472 | 25.0%) account for the highest median family income in Summit with $250,001 per family, while 2-person families (2,069 | 35.1%) have the highest median income of $101,322 per family member.
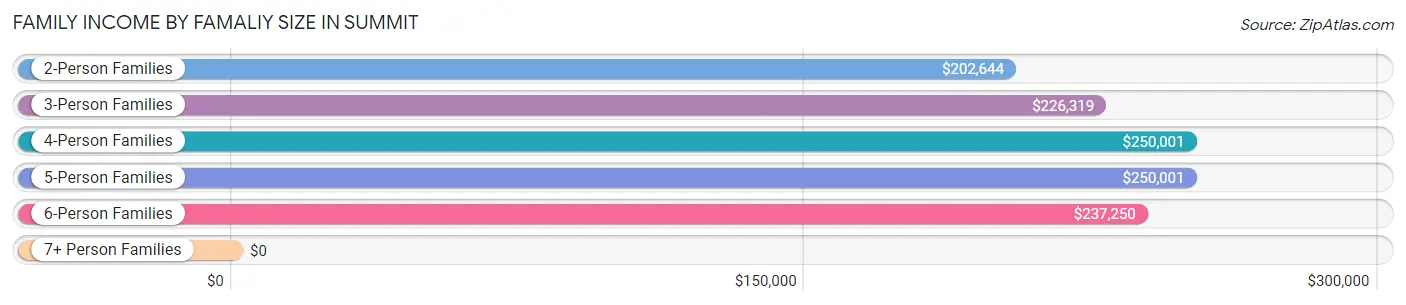
| Income Bracket | # Families | Median Income |
| 2-Person Families | 2,069 (35.1%) | $202,644 |
| 3-Person Families | 1,474 (25.0%) | $226,319 |
| 4-Person Families | 1,472 (25.0%) | $250,001 |
| 5-Person Families | 805 (13.7%) | $250,001 |
| 6-Person Families | 72 (1.2%) | $237,250 |
| 7+ Person Families | 0 (0.0%) | $0 |
| Total | 5,892 (100.0%) | $242,235 |
Family Income by Number of Earners in Summit
The median family income in Summit is $242,235, with families comprising 2 earners (2,903) having the highest median family income of $250,001, while families with no earners (461) have the lowest median family income of $117,083, accounting for 49.3% and 7.8% of families, respectively.
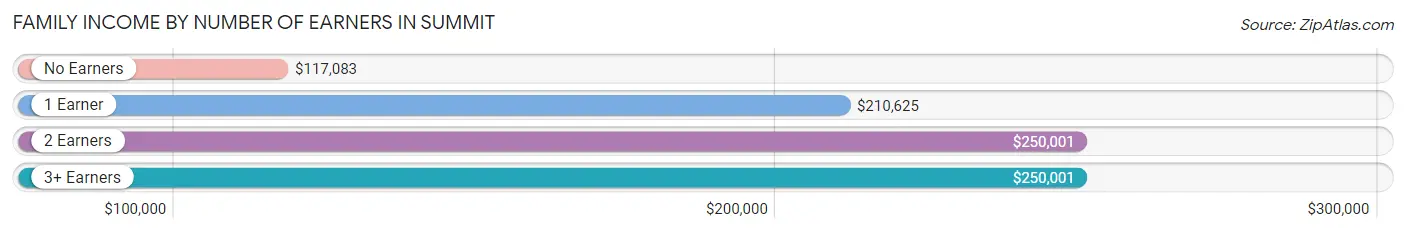
| Number of Earners | # Families | Median Income |
| No Earners | 461 (7.8%) | $117,083 |
| 1 Earner | 1,800 (30.5%) | $210,625 |
| 2 Earners | 2,903 (49.3%) | $250,001 |
| 3+ Earners | 728 (12.4%) | $250,001 |
| Total | 5,892 (100.0%) | $242,235 |
Household Income in Summit
Household Income Brackets in Summit
With 3,750 households falling in the category, the $200,000+ income range is the most frequent in Summit, accounting for 47.2% of all households. In contrast, only 32 households (0.4%) fall into the $10,000 to $14,999 income bracket, making it the least populous group.
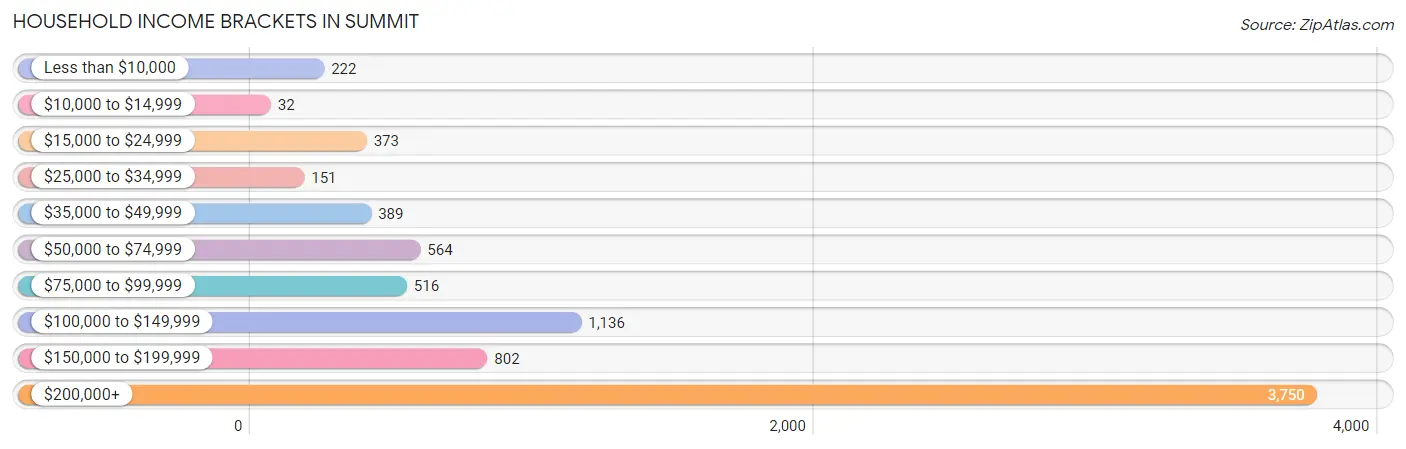
| Income Bracket | # Households | % Households |
| Less than $10,000 | 222 | 2.8% |
| $10,000 to $14,999 | 32 | 0.4% |
| $15,000 to $24,999 | 373 | 4.7% |
| $25,000 to $34,999 | 151 | 1.9% |
| $35,000 to $49,999 | 389 | 4.9% |
| $50,000 to $74,999 | 564 | 7.1% |
| $75,000 to $99,999 | 516 | 6.5% |
| $100,000 to $149,999 | 1,136 | 14.3% |
| $150,000 to $199,999 | 802 | 10.1% |
| $200,000+ | 3,750 | 47.2% |
Household Income by Householder Age in Summit
The median household income in Summit is $176,702, with the highest median household income of $225,401 found in the 45 to 64 years age bracket for the primary householder. A total of 3,937 households (49.6%) fall into this category. Meanwhile, the 15 to 24 years age bracket for the primary householder has the lowest median household income of $0, with 17 households (0.2%) in this group.
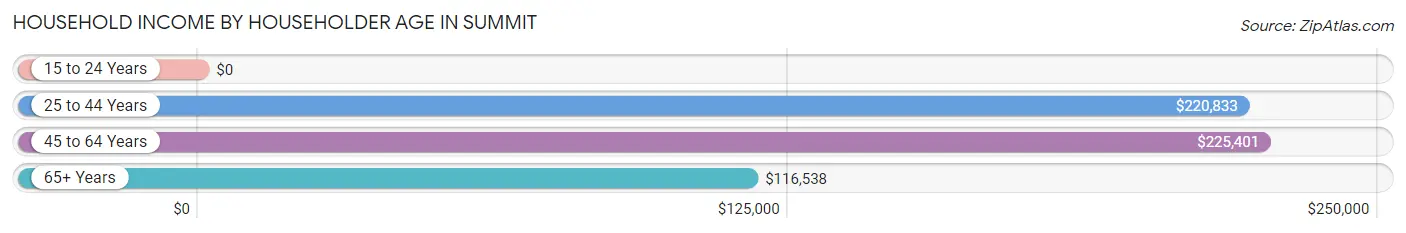
| Income Bracket | # Households | Median Income |
| 15 to 24 Years | 17 (0.2%) | $0 |
| 25 to 44 Years | 2,294 (28.9%) | $220,833 |
| 45 to 64 Years | 3,937 (49.6%) | $225,401 |
| 65+ Years | 1,696 (21.3%) | $116,538 |
| Total | 7,944 (100.0%) | $176,702 |
Poverty in Summit
Income Below Poverty by Sex and Age in Summit
With 4.5% poverty level for males and 5.5% for females among the residents of Summit, 35 to 44 year old males and 18 to 24 year old females are the most vulnerable to poverty, with 174 males (10.4%) and 152 females (15.6%) in their respective age groups living below the poverty level.
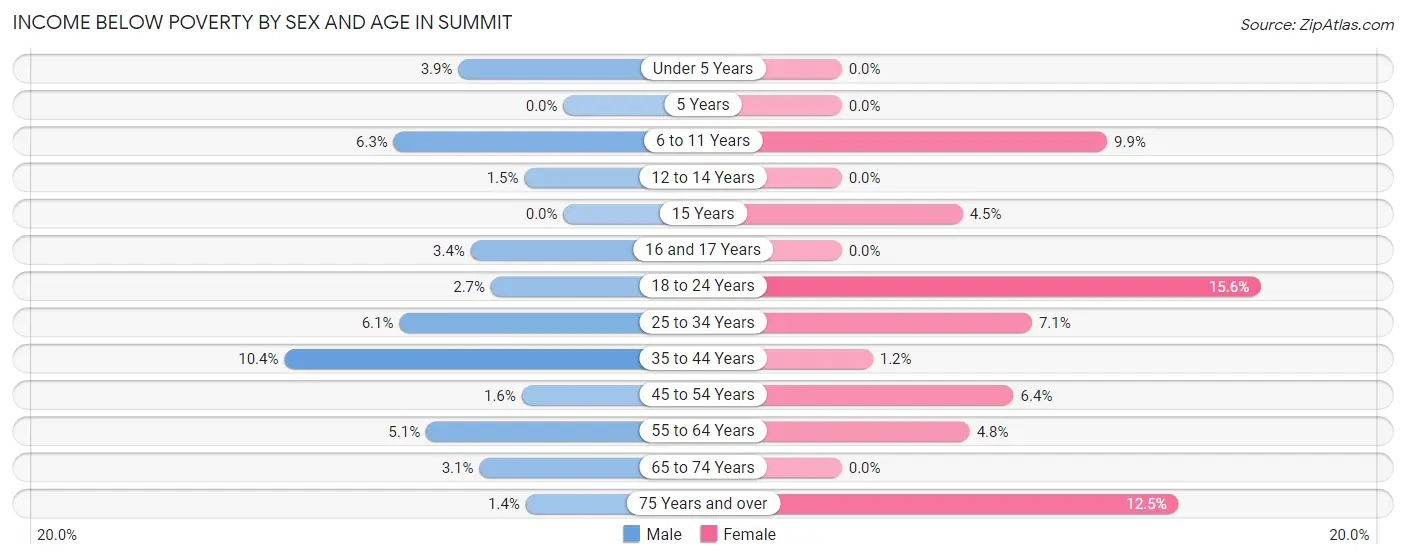
| Age Bracket | Male | Female |
| Under 5 Years | 22 (3.9%) | 0 (0.0%) |
| 5 Years | 0 (0.0%) | 0 (0.0%) |
| 6 to 11 Years | 49 (6.3%) | 87 (9.9%) |
| 12 to 14 Years | 11 (1.5%) | 0 (0.0%) |
| 15 Years | 0 (0.0%) | 12 (4.5%) |
| 16 and 17 Years | 12 (3.4%) | 0 (0.0%) |
| 18 to 24 Years | 22 (2.7%) | 152 (15.6%) |
| 25 to 34 Years | 56 (6.1%) | 54 (7.1%) |
| 35 to 44 Years | 174 (10.4%) | 20 (1.1%) |
| 45 to 54 Years | 28 (1.5%) | 122 (6.4%) |
| 55 to 64 Years | 78 (5.1%) | 79 (4.8%) |
| 65 to 74 Years | 22 (3.1%) | 0 (0.0%) |
| 75 Years and over | 6 (1.4%) | 117 (12.5%) |
| Total | 480 (4.5%) | 643 (5.5%) |
Income Above Poverty by Sex and Age in Summit
According to the poverty statistics in Summit, males aged 5 years and females aged under 5 years are the age groups that are most secure financially, with 100.0% of males and 100.0% of females in these age groups living above the poverty line.
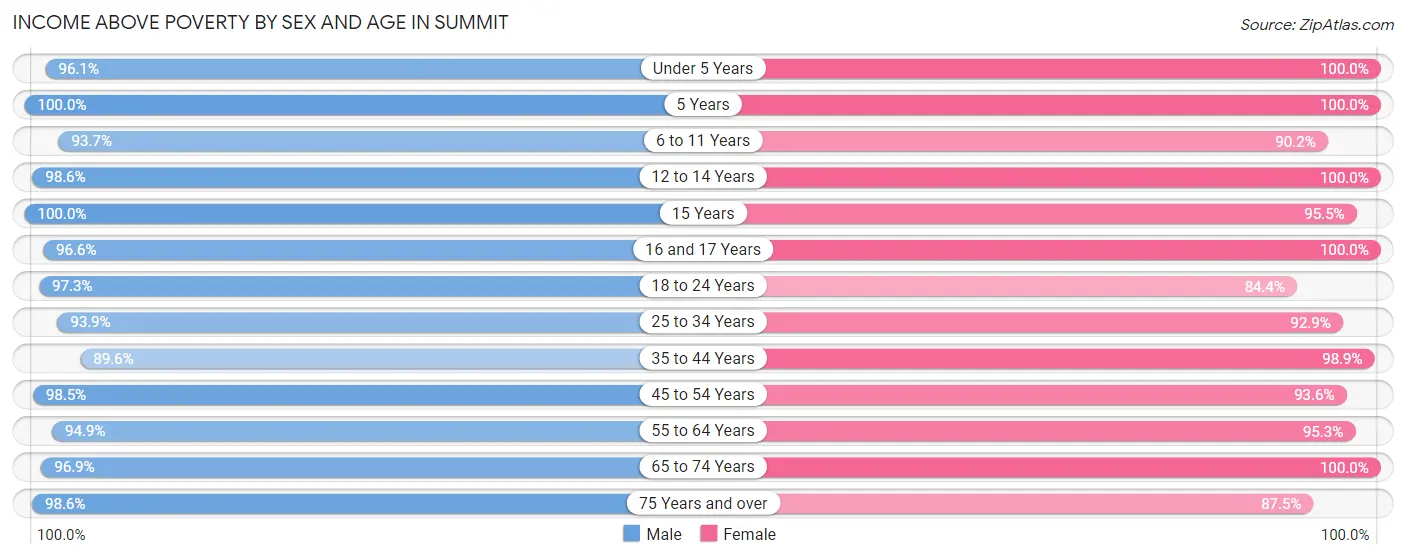
| Age Bracket | Male | Female |
| Under 5 Years | 542 (96.1%) | 740 (100.0%) |
| 5 Years | 171 (100.0%) | 123 (100.0%) |
| 6 to 11 Years | 729 (93.7%) | 796 (90.1%) |
| 12 to 14 Years | 749 (98.6%) | 517 (100.0%) |
| 15 Years | 202 (100.0%) | 255 (95.5%) |
| 16 and 17 Years | 337 (96.6%) | 427 (100.0%) |
| 18 to 24 Years | 796 (97.3%) | 825 (84.4%) |
| 25 to 34 Years | 863 (93.9%) | 711 (92.9%) |
| 35 to 44 Years | 1,506 (89.6%) | 1,713 (98.9%) |
| 45 to 54 Years | 1,774 (98.5%) | 1,789 (93.6%) |
| 55 to 64 Years | 1,451 (94.9%) | 1,585 (95.3%) |
| 65 to 74 Years | 684 (96.9%) | 796 (100.0%) |
| 75 Years and over | 424 (98.6%) | 819 (87.5%) |
| Total | 10,228 (95.5%) | 11,096 (94.5%) |
Income Below Poverty Among Married-Couple Families in Summit
The poverty statistics for married-couple families in Summit show that 1.2% or 57 of the total 4,699 families live below the poverty line. Families with 1 or 2 children have the highest poverty rate of 2.1%, comprising of 47 families. On the other hand, families with 3 or 4 children have the lowest poverty rate of 0.0%, which includes 0 families.
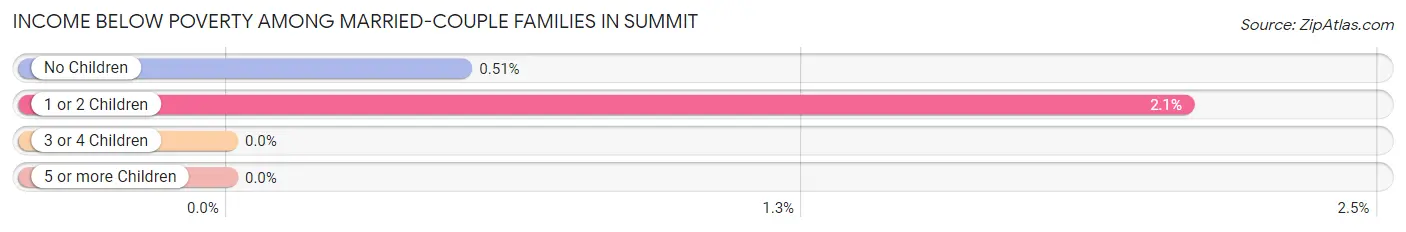
| Children | Above Poverty | Below Poverty |
| No Children | 1,933 (99.5%) | 10 (0.5%) |
| 1 or 2 Children | 2,216 (97.9%) | 47 (2.1%) |
| 3 or 4 Children | 493 (100.0%) | 0 (0.0%) |
| 5 or more Children | 0 (0.0%) | 0 (0.0%) |
| Total | 4,642 (98.8%) | 57 (1.2%) |
Income Below Poverty Among Single-Parent Households in Summit
According to the poverty data in Summit, 2.1% or 6 single-father households and 12.3% or 111 single-mother households are living below the poverty line. Among single-father households, those with no children have the highest poverty rate, with 6 households (4.0%) experiencing poverty. Likewise, among single-mother households, those with 1 or 2 children have the highest poverty rate, with 61 households (16.7%) falling below the poverty line.
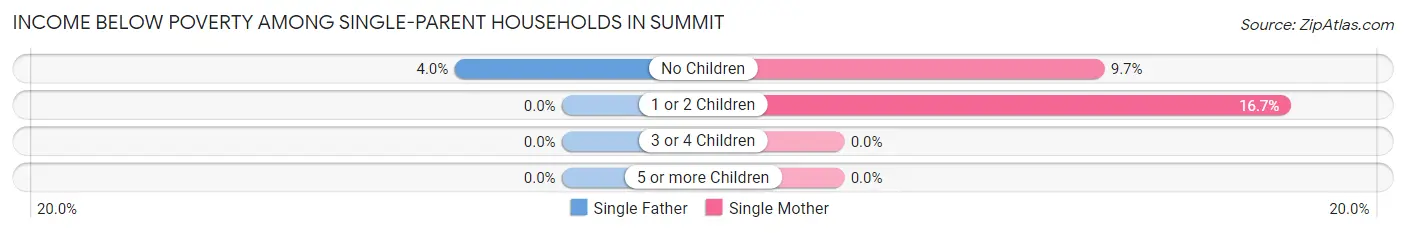
| Children | Single Father | Single Mother |
| No Children | 6 (4.0%) | 50 (9.7%) |
| 1 or 2 Children | 0 (0.0%) | 61 (16.7%) |
| 3 or 4 Children | 0 (0.0%) | 0 (0.0%) |
| 5 or more Children | 0 (0.0%) | 0 (0.0%) |
| Total | 6 (2.1%) | 111 (12.3%) |
Income Below Poverty Among Married-Couple vs Single-Parent Households in Summit
The poverty data for Summit shows that 57 of the married-couple family households (1.2%) and 117 of the single-parent households (9.8%) are living below the poverty level. Within the married-couple family households, those with 1 or 2 children have the highest poverty rate, with 47 households (2.1%) falling below the poverty line. Among the single-parent households, those with 1 or 2 children have the highest poverty rate, with 61 household (12.0%) living below poverty.
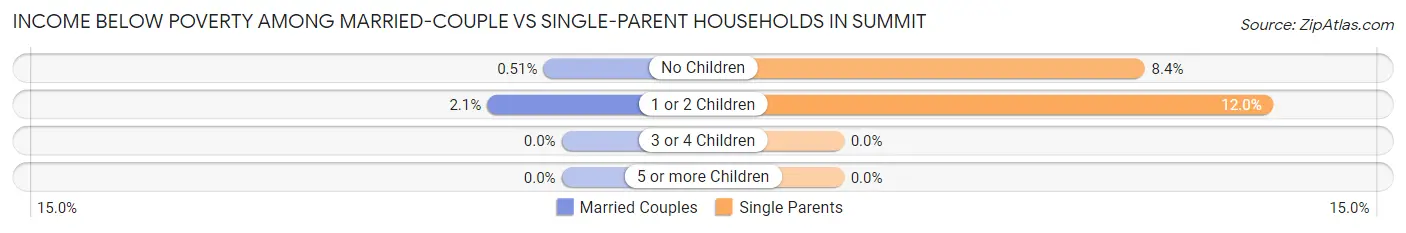
| Children | Married-Couple Families | Single-Parent Households |
| No Children | 10 (0.5%) | 56 (8.4%) |
| 1 or 2 Children | 47 (2.1%) | 61 (12.0%) |
| 3 or 4 Children | 0 (0.0%) | 0 (0.0%) |
| 5 or more Children | 0 (0.0%) | 0 (0.0%) |
| Total | 57 (1.2%) | 117 (9.8%) |
Race in Summit
The most populous races in Summit are White / Caucasian (15,415 | 68.3%), Hispanic or Latino (2,682 | 11.9%), and Asian (2,088 | 9.3%).
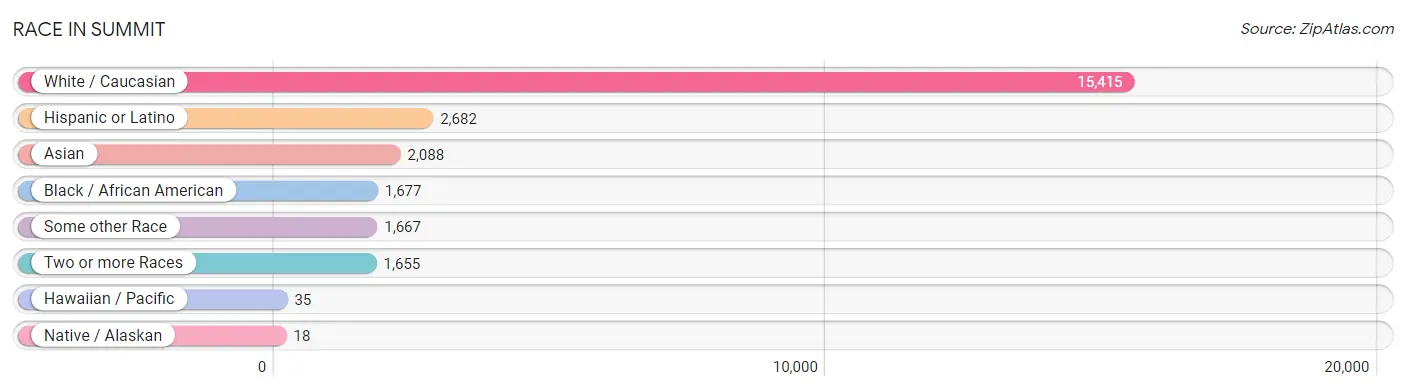
| Race | # Population | % Population |
| Asian | 2,088 | 9.3% |
| Black / African American | 1,677 | 7.4% |
| Hawaiian / Pacific | 35 | 0.2% |
| Hispanic or Latino | 2,682 | 11.9% |
| Native / Alaskan | 18 | 0.1% |
| White / Caucasian | 15,415 | 68.3% |
| Two or more Races | 1,655 | 7.3% |
| Some other Race | 1,667 | 7.4% |
| Total | 22,555 | 100.0% |
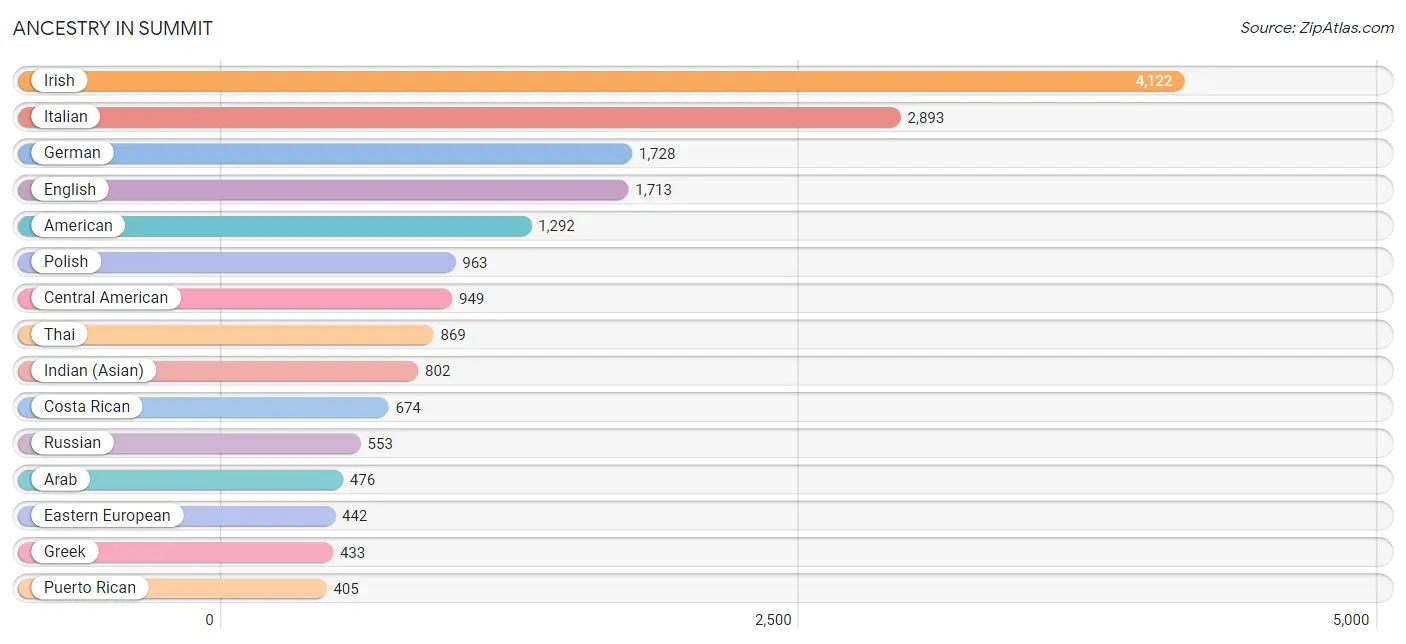
Ancestry in Summit
The most populous ancestries reported in Summit are Irish (4,122 | 18.3%), Italian (2,893 | 12.8%), German (1,728 | 7.7%), English (1,713 | 7.6%), and American (1,292 | 5.7%), together accounting for 52.1% of all Summit residents.
| Ancestry | # Population | % Population |
| African | 19 | 0.1% |
| Albanian | 36 | 0.2% |
| American | 1,292 | 5.7% |
| Arab | 476 | 2.1% |
| Argentinean | 42 | 0.2% |
| Armenian | 99 | 0.4% |
| Australian | 60 | 0.3% |
| Austrian | 85 | 0.4% |
| Brazilian | 34 | 0.2% |
| British | 58 | 0.3% |
| Bulgarian | 60 | 0.3% |
| Burmese | 314 | 1.4% |
| Canadian | 43 | 0.2% |
| Cape Verdean | 13 | 0.1% |
| Central American | 949 | 4.2% |
| Cherokee | 36 | 0.2% |
| Colombian | 90 | 0.4% |
| Costa Rican | 674 | 3.0% |
| Croatian | 62 | 0.3% |
| Cuban | 228 | 1.0% |
| Czech | 78 | 0.4% |
| Czechoslovakian | 53 | 0.2% |
| Danish | 157 | 0.7% |
| Delaware | 3 | 0.0% |
| Dominican | 47 | 0.2% |
| Dutch | 270 | 1.2% |
| Eastern European | 442 | 2.0% |
| Egyptian | 314 | 1.4% |
| English | 1,713 | 7.6% |
| Estonian | 30 | 0.1% |
| European | 346 | 1.5% |
| Filipino | 5 | 0.0% |
| Finnish | 12 | 0.1% |
| French | 362 | 1.6% |
| French Canadian | 40 | 0.2% |
| German | 1,728 | 7.7% |
| Greek | 433 | 1.9% |
| Guamanian / Chamorro | 17 | 0.1% |
| Guatemalan | 77 | 0.3% |
| Haitian | 47 | 0.2% |
| Honduran | 105 | 0.5% |
| Hungarian | 118 | 0.5% |
| Indian (Asian) | 802 | 3.6% |
| Iranian | 37 | 0.2% |
| Irish | 4,122 | 18.3% |
| Israeli | 9 | 0.0% |
| Italian | 2,893 | 12.8% |
| Jamaican | 91 | 0.4% |
| Jordanian | 186 | 0.8% |
| Korean | 175 | 0.8% |
| Latvian | 24 | 0.1% |
| Lebanese | 89 | 0.4% |
| Lithuanian | 98 | 0.4% |
| Luxembourger | 4 | 0.0% |
| Mexican | 373 | 1.7% |
| Northern European | 95 | 0.4% |
| Norwegian | 124 | 0.5% |
| Panamanian | 42 | 0.2% |
| Peruvian | 214 | 0.9% |
| Polish | 963 | 4.3% |
| Portuguese | 129 | 0.6% |
| Puerto Rican | 405 | 1.8% |
| Romanian | 25 | 0.1% |
| Russian | 553 | 2.5% |
| Salvadoran | 51 | 0.2% |
| Samoan | 18 | 0.1% |
| Scandinavian | 60 | 0.3% |
| Scotch-Irish | 51 | 0.2% |
| Scottish | 235 | 1.0% |
| Senegalese | 20 | 0.1% |
| Serbian | 92 | 0.4% |
| Slovak | 139 | 0.6% |
| South American | 364 | 1.6% |
| Spaniard | 78 | 0.4% |
| Spanish | 133 | 0.6% |
| Sri Lankan | 30 | 0.1% |
| Subsaharan African | 69 | 0.3% |
| Swedish | 310 | 1.4% |
| Swiss | 17 | 0.1% |
| Syrian | 41 | 0.2% |
| Thai | 869 | 3.8% |
| Tongan | 18 | 0.1% |
| Trinidadian and Tobagonian | 14 | 0.1% |
| Turkish | 125 | 0.5% |
| Ukrainian | 162 | 0.7% |
| Welsh | 137 | 0.6% |
| Yugoslavian | 19 | 0.1% | View All 87 Rows |
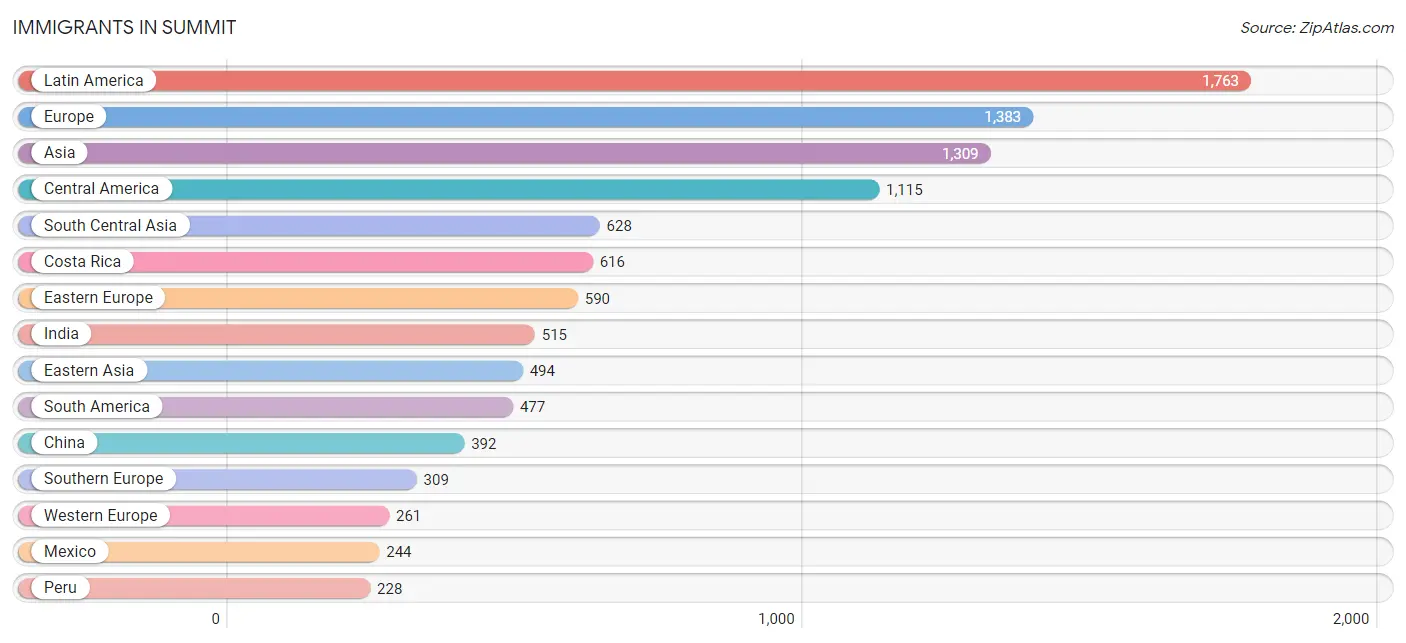
Immigrants in Summit
The most numerous immigrant groups reported in Summit came from Latin America (1,763 | 7.8%), Europe (1,383 | 6.1%), Asia (1,309 | 5.8%), Central America (1,115 | 4.9%), and South Central Asia (628 | 2.8%), together accounting for 27.5% of all Summit residents.
| Immigration Origin | # Population | % Population |
| Africa | 195 | 0.9% |
| Albania | 45 | 0.2% |
| Argentina | 30 | 0.1% |
| Asia | 1,309 | 5.8% |
| Australia | 15 | 0.1% |
| Austria | 13 | 0.1% |
| Belarus | 9 | 0.0% |
| Bosnia and Herzegovina | 18 | 0.1% |
| Brazil | 128 | 0.6% |
| Bulgaria | 38 | 0.2% |
| Canada | 75 | 0.3% |
| Caribbean | 171 | 0.8% |
| Central America | 1,115 | 4.9% |
| China | 392 | 1.7% |
| Colombia | 91 | 0.4% |
| Costa Rica | 616 | 2.7% |
| Croatia | 4 | 0.0% |
| Cuba | 45 | 0.2% |
| Dominican Republic | 26 | 0.1% |
| Eastern Asia | 494 | 2.2% |
| Eastern Europe | 590 | 2.6% |
| Egypt | 169 | 0.7% |
| El Salvador | 33 | 0.2% |
| England | 41 | 0.2% |
| Europe | 1,383 | 6.1% |
| France | 79 | 0.4% |
| Germany | 121 | 0.5% |
| Greece | 95 | 0.4% |
| Guatemala | 90 | 0.4% |
| Haiti | 25 | 0.1% |
| Honduras | 105 | 0.5% |
| Hong Kong | 28 | 0.1% |
| Hungary | 8 | 0.0% |
| India | 515 | 2.3% |
| Indonesia | 7 | 0.0% |
| Iran | 13 | 0.1% |
| Ireland | 66 | 0.3% |
| Italy | 98 | 0.4% |
| Jamaica | 75 | 0.3% |
| Kazakhstan | 36 | 0.2% |
| Korea | 102 | 0.4% |
| Latin America | 1,763 | 7.8% |
| Mexico | 244 | 1.1% |
| Netherlands | 48 | 0.2% |
| Northern Africa | 169 | 0.7% |
| Northern Europe | 223 | 1.0% |
| Oceania | 32 | 0.1% |
| Panama | 27 | 0.1% |
| Peru | 228 | 1.0% |
| Philippines | 83 | 0.4% |
| Poland | 115 | 0.5% |
| Portugal | 58 | 0.3% |
| Romania | 16 | 0.1% |
| Russia | 125 | 0.5% |
| Senegal | 9 | 0.0% |
| Singapore | 23 | 0.1% |
| South America | 477 | 2.1% |
| South Central Asia | 628 | 2.8% |
| South Eastern Asia | 113 | 0.5% |
| Southern Europe | 309 | 1.4% |
| Spain | 58 | 0.3% |
| Sri Lanka | 64 | 0.3% |
| Sweden | 14 | 0.1% |
| Syria | 9 | 0.0% |
| Taiwan | 71 | 0.3% |
| Turkey | 65 | 0.3% |
| Ukraine | 113 | 0.5% |
| Western Africa | 26 | 0.1% |
| Western Asia | 74 | 0.3% |
| Western Europe | 261 | 1.2% | View All 70 Rows |
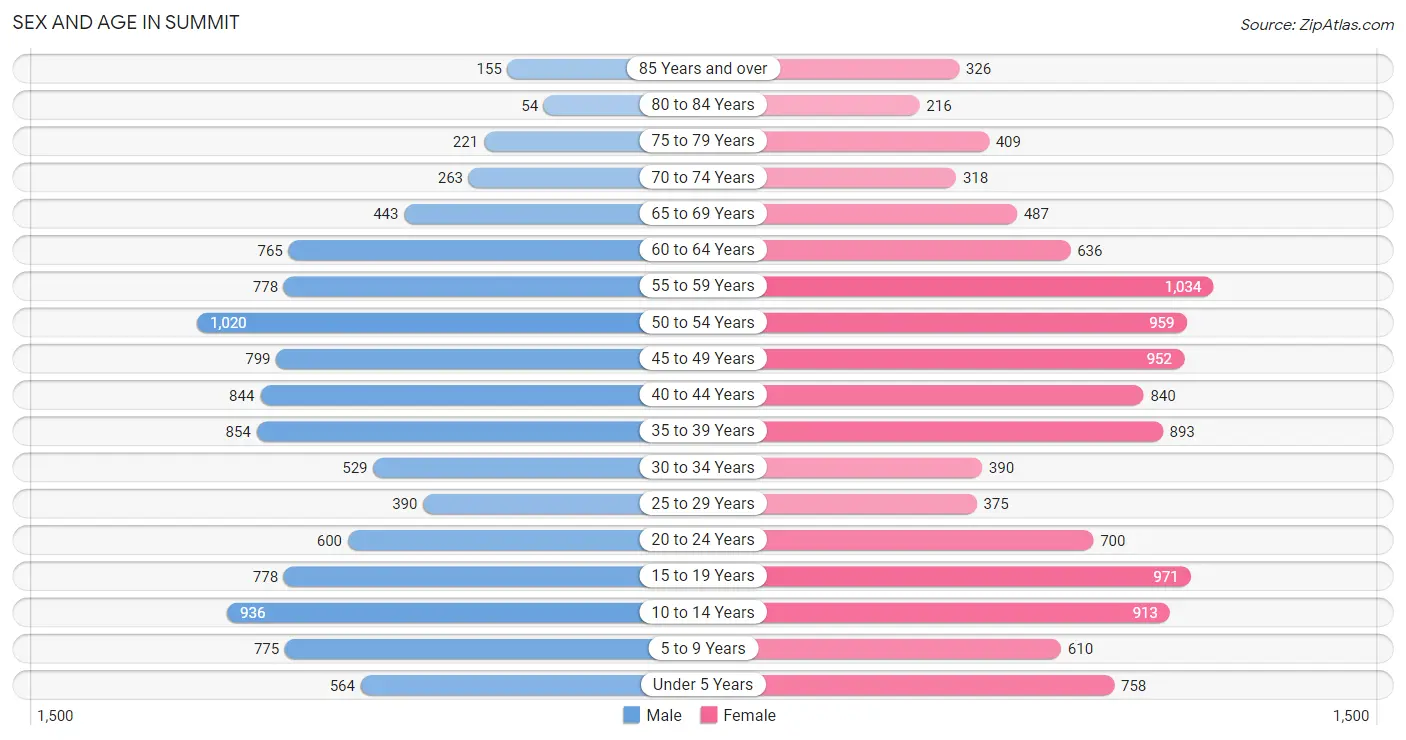
Sex and Age in Summit
Sex and Age in Summit
The most populous age groups in Summit are 50 to 54 Years (1,020 | 9.5%) for men and 55 to 59 Years (1,034 | 8.8%) for women.
| Age Bracket | Male | Female |
| Under 5 Years | 564 (5.2%) | 758 (6.4%) |
| 5 to 9 Years | 775 (7.2%) | 610 (5.2%) |
| 10 to 14 Years | 936 (8.7%) | 913 (7.7%) |
| 15 to 19 Years | 778 (7.2%) | 971 (8.2%) |
| 20 to 24 Years | 600 (5.6%) | 700 (5.9%) |
| 25 to 29 Years | 390 (3.6%) | 375 (3.2%) |
| 30 to 34 Years | 529 (4.9%) | 390 (3.3%) |
| 35 to 39 Years | 854 (7.9%) | 893 (7.6%) |
| 40 to 44 Years | 844 (7.8%) | 840 (7.1%) |
| 45 to 49 Years | 799 (7.4%) | 952 (8.1%) |
| 50 to 54 Years | 1,020 (9.5%) | 959 (8.1%) |
| 55 to 59 Years | 778 (7.2%) | 1,034 (8.8%) |
| 60 to 64 Years | 765 (7.1%) | 636 (5.4%) |
| 65 to 69 Years | 443 (4.1%) | 487 (4.1%) |
| 70 to 74 Years | 263 (2.4%) | 318 (2.7%) |
| 75 to 79 Years | 221 (2.1%) | 409 (3.5%) |
| 80 to 84 Years | 54 (0.5%) | 216 (1.8%) |
| 85 Years and over | 155 (1.4%) | 326 (2.8%) |
| Total | 10,768 (100.0%) | 11,787 (100.0%) |
Families and Households in Summit
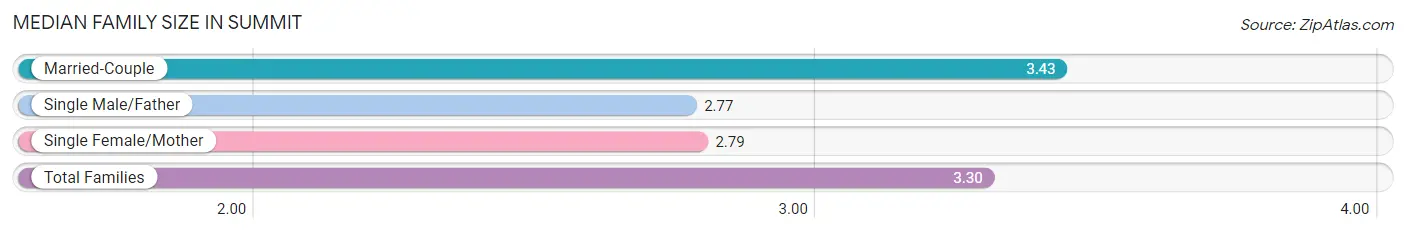
Median Family Size in Summit
The median family size in Summit is 3.30 persons per family, with married-couple families (4,699 | 79.7%) accounting for the largest median family size of 3.43 persons per family. On the other hand, single male/father families (292 | 5.0%) represent the smallest median family size with 2.77 persons per family.
| Family Type | # Families | Family Size |
| Married-Couple | 4,699 (79.7%) | 3.43 |
| Single Male/Father | 292 (5.0%) | 2.77 |
| Single Female/Mother | 901 (15.3%) | 2.79 |
| Total Families | 5,892 (100.0%) | 3.30 |
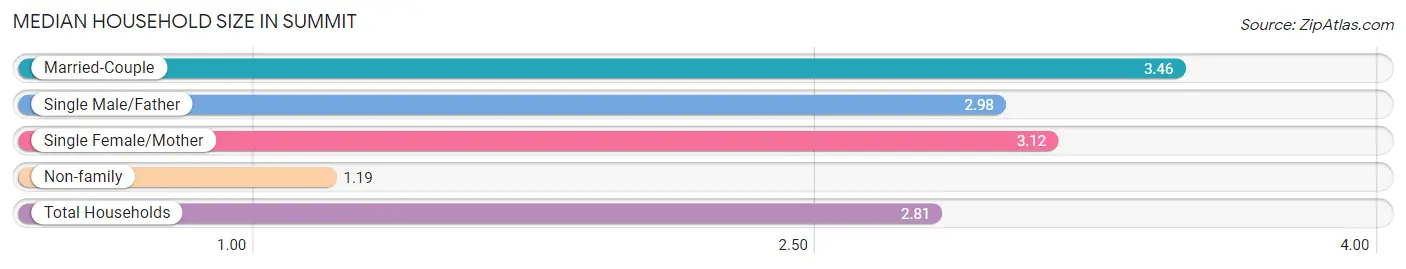
Median Household Size in Summit
The median household size in Summit is 2.81 persons per household, with married-couple households (4,699 | 59.2%) accounting for the largest median household size of 3.46 persons per household. non-family households (2,052 | 25.8%) represent the smallest median household size with 1.19 persons per household.
| Household Type | # Households | Household Size |
| Married-Couple | 4,699 (59.2%) | 3.46 |
| Single Male/Father | 292 (3.7%) | 2.98 |
| Single Female/Mother | 901 (11.3%) | 3.12 |
| Non-family | 2,052 (25.8%) | 1.19 |
| Total Households | 7,944 (100.0%) | 2.81 |
Household Size by Marriage Status in Summit
Out of a total of 7,944 households in Summit, 5,892 (74.2%) are family households, while 2,052 (25.8%) are nonfamily households. The most numerous type of family households are 2-person households, comprising 1,923, and the most common type of nonfamily households are 1-person households, comprising 1,612.
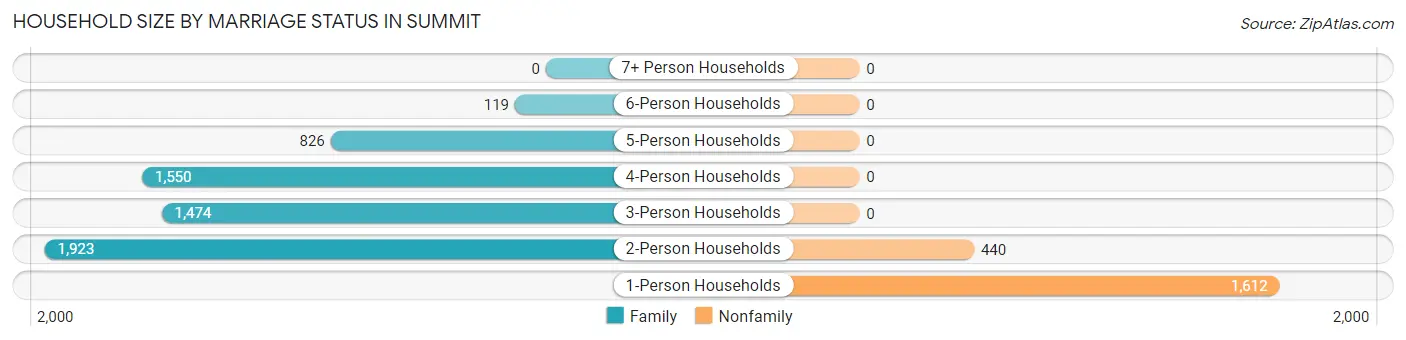
| Household Size | Family Households | Nonfamily Households |
| 1-Person Households | - | 1,612 (20.3%) |
| 2-Person Households | 1,923 (24.2%) | 440 (5.5%) |
| 3-Person Households | 1,474 (18.5%) | 0 (0.0%) |
| 4-Person Households | 1,550 (19.5%) | 0 (0.0%) |
| 5-Person Households | 826 (10.4%) | 0 (0.0%) |
| 6-Person Households | 119 (1.5%) | 0 (0.0%) |
| 7+ Person Households | 0 (0.0%) | 0 (0.0%) |
| Total | 5,892 (74.2%) | 2,052 (25.8%) |
Female Fertility in Summit
Fertility by Age in Summit
Average fertility rate in Summit is 42.0 births per 1,000 women. Women in the age bracket of 20 to 34 years have the highest fertility rate with 53.0 births per 1,000 women. Women in the age bracket of 35 to 50 years acount for 65.5% of all women with births.
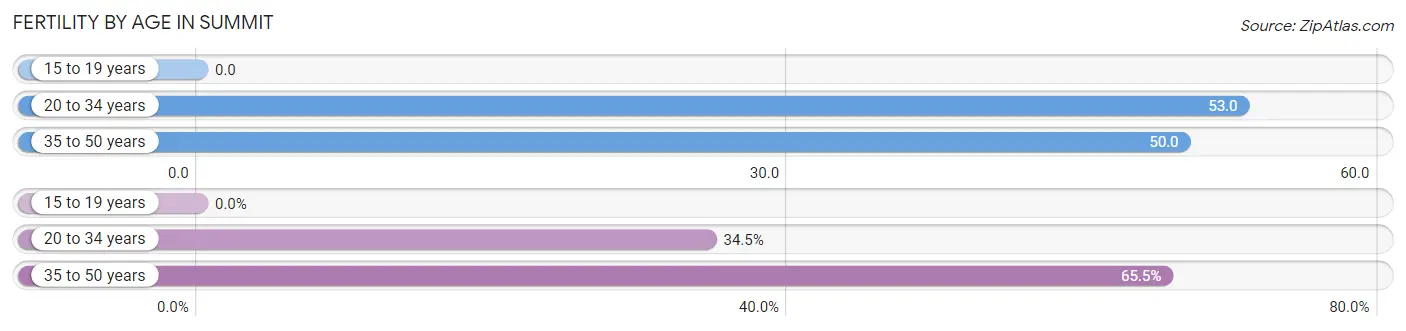
| Age Bracket | Women with Births | Births / 1,000 Women |
| 15 to 19 years | 0 (0.0%) | 0.0 |
| 20 to 34 years | 78 (34.5%) | 53.0 |
| 35 to 50 years | 148 (65.5%) | 50.0 |
| Total | 226 (100.0%) | 42.0 |
Fertility by Age by Marriage Status in Summit
85.4% of women with births (226) in Summit are married. The highest percentage of unmarried women with births falls into 20 to 34 years age bracket with 17.9% of them unmarried at the time of birth, while the lowest percentage of unmarried women with births belong to 35 to 50 years age bracket with 12.8% of them unmarried.
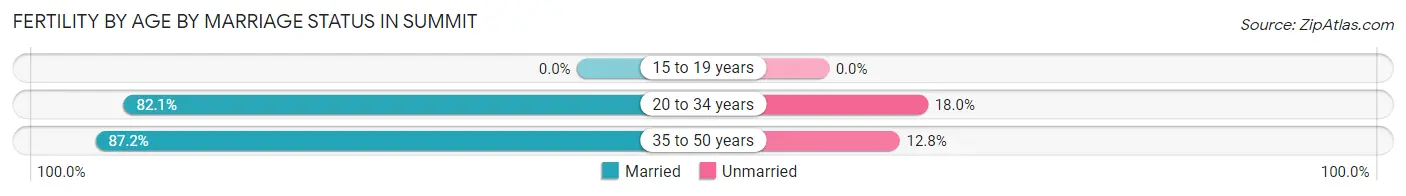
| Age Bracket | Married | Unmarried |
| 15 to 19 years | 0 (0.0%) | 0 (0.0%) |
| 20 to 34 years | 64 (82.1%) | 14 (17.9%) |
| 35 to 50 years | 129 (87.2%) | 19 (12.8%) |
| Total | 193 (85.4%) | 33 (14.6%) |
Fertility by Education in Summit
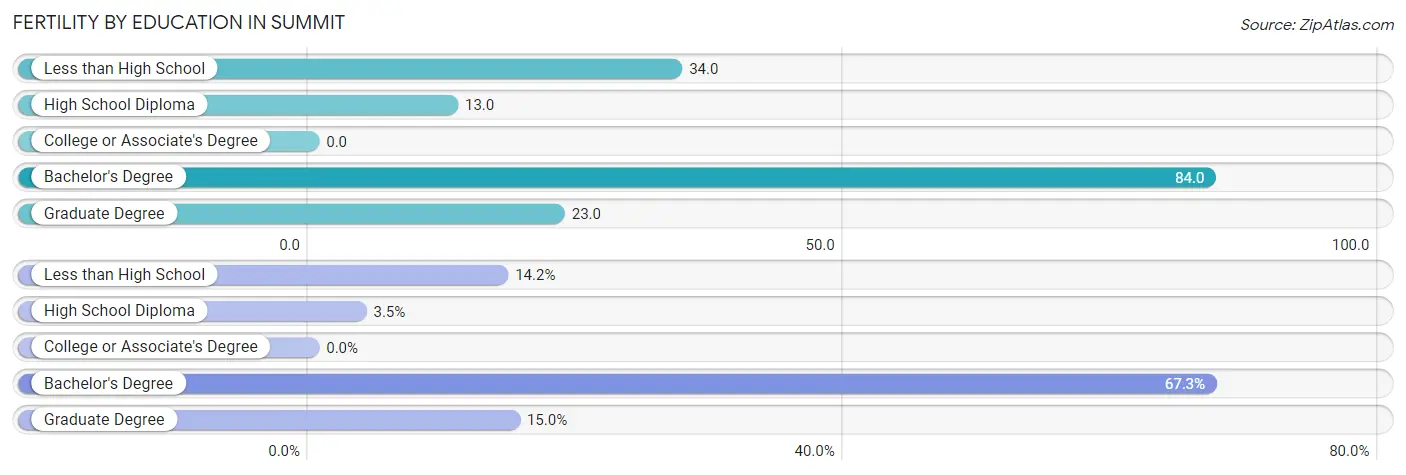
| Educational Attainment | Women with Births | Births / 1,000 Women |
| Less than High School | 32 (14.2%) | 34.0 |
| High School Diploma | 8 (3.5%) | 13.0 |
| College or Associate's Degree | 0 (0.0%) | 0.0 |
| Bachelor's Degree | 152 (67.3%) | 84.0 |
| Graduate Degree | 34 (15.0%) | 23.0 |
| Total | 226 (100.0%) | 42.0 |
Fertility by Education by Marriage Status in Summit
14.6% of women with births in Summit are unmarried. Women with the educational attainment of high school diploma are most likely to be married with 100.0% of them married at childbirth, while women with the educational attainment of less than high school are least likely to be married with 100.0% of them unmarried at childbirth.
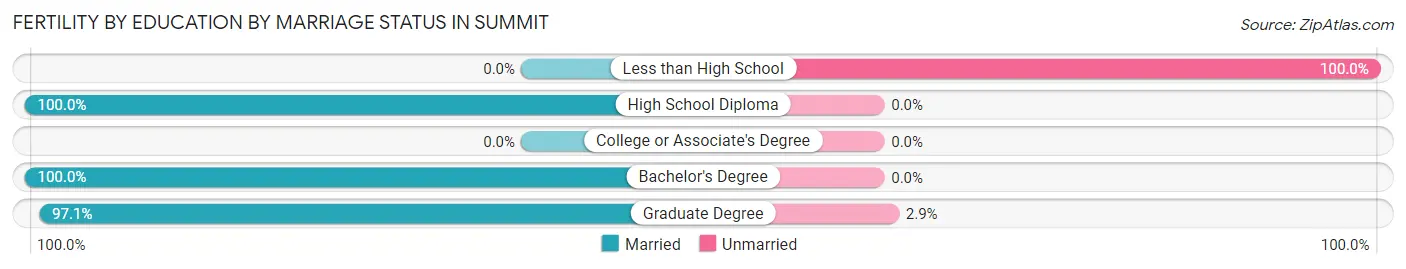
| Educational Attainment | Married | Unmarried |
| Less than High School | 0 (0.0%) | 32 (100.0%) |
| High School Diploma | 8 (100.0%) | 0 (0.0%) |
| College or Associate's Degree | 0 (0.0%) | 0 (0.0%) |
| Bachelor's Degree | 152 (100.0%) | 0 (0.0%) |
| Graduate Degree | 33 (97.1%) | 1 (2.9%) |
| Total | 193 (85.4%) | 33 (14.6%) |
Employment Characteristics in Summit
Employment by Class of Employer in Summit
Among the 11,039 employed individuals in Summit, private company employees (8,125 | 73.6%), self-employed (not incorporated) (791 | 7.2%), and not-for-profit organizations (661 | 6.0%) make up the most common classes of employment.
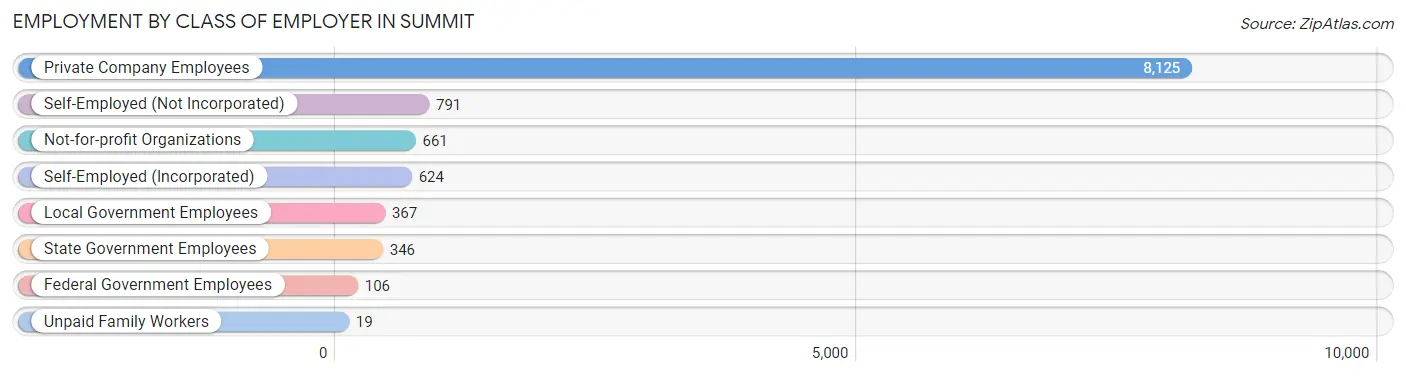
| Employer Class | # Employees | % Employees |
| Private Company Employees | 8,125 | 73.6% |
| Self-Employed (Incorporated) | 624 | 5.7% |
| Self-Employed (Not Incorporated) | 791 | 7.2% |
| Not-for-profit Organizations | 661 | 6.0% |
| Local Government Employees | 367 | 3.3% |
| State Government Employees | 346 | 3.1% |
| Federal Government Employees | 106 | 1.0% |
| Unpaid Family Workers | 19 | 0.2% |
| Total | 11,039 | 100.0% |
Employment Status by Age in Summit
According to the labor force statistics for Summit, out of the total population over 16 years of age (17,530), 69.6% or 12,201 individuals are in the labor force, with 5.7% or 695 of them unemployed. The age group with the highest labor force participation rate is 25 to 29 years, with 90.2% or 690 individuals in the labor force. Within the labor force, the 75 years and over age range has the highest percentage of unemployed individuals, with 15.1% or 14 of them being unemployed.
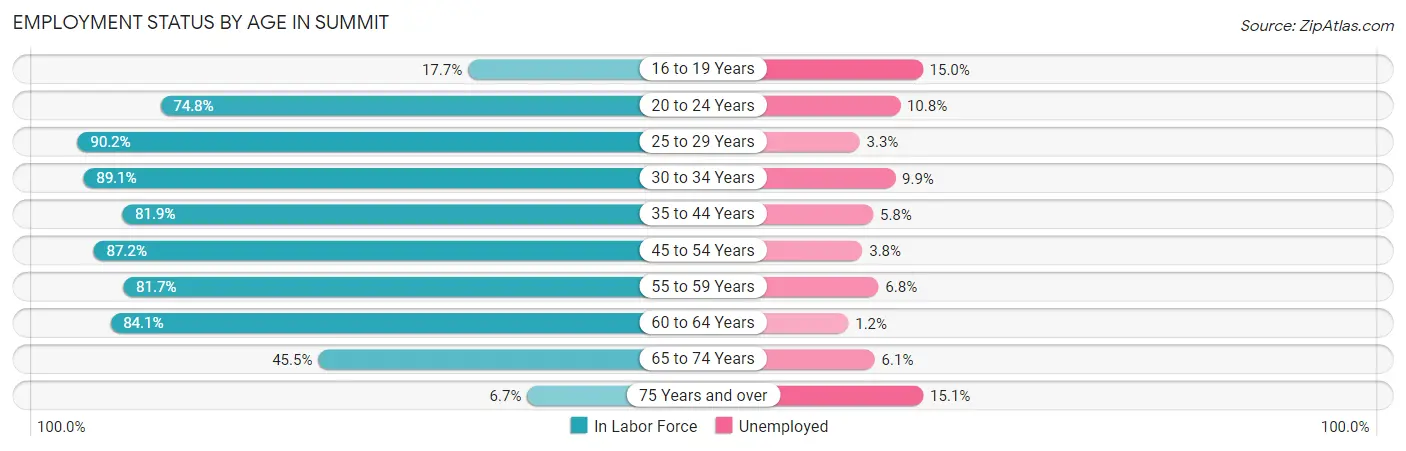
| Age Bracket | In Labor Force | Unemployed |
| 16 to 19 Years | 227 (17.7%) | 34 (15.0%) |
| 20 to 24 Years | 972 (74.8%) | 105 (10.8%) |
| 25 to 29 Years | 690 (90.2%) | 23 (3.3%) |
| 30 to 34 Years | 819 (89.1%) | 81 (9.9%) |
| 35 to 44 Years | 2,810 (81.9%) | 163 (5.8%) |
| 45 to 54 Years | 3,253 (87.2%) | 124 (3.8%) |
| 55 to 59 Years | 1,480 (81.7%) | 101 (6.8%) |
| 60 to 64 Years | 1,178 (84.1%) | 14 (1.2%) |
| 65 to 74 Years | 688 (45.5%) | 42 (6.1%) |
| 75 Years and over | 93 (6.7%) | 14 (15.1%) |
| Total | 12,201 (69.6%) | 695 (5.7%) |
Employment Status by Educational Attainment in Summit
According to labor force statistics for Summit, 84.8% of individuals (10,225) out of the total population between 25 and 64 years of age (12,058) are in the labor force, with 4.9% or 501 of them being unemployed. The group with the highest labor force participation rate are those with the educational attainment of high school diploma, with 90.8% or 1,270 individuals in the labor force. Within the labor force, individuals with college / associate degree education have the highest percentage of unemployment, with 9.8% or 84 of them being unemployed.
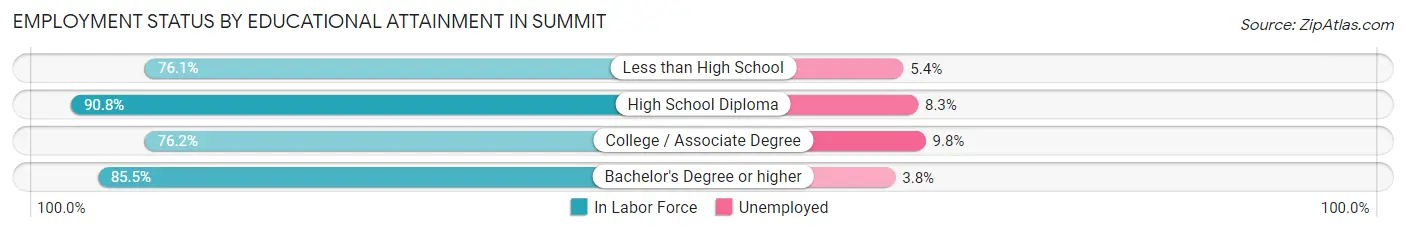
| Educational Attainment | In Labor Force | Unemployed |
| Less than High School | 392 (76.1%) | 28 (5.4%) |
| High School Diploma | 1,270 (90.8%) | 116 (8.3%) |
| College / Associate Degree | 853 (76.2%) | 110 (9.8%) |
| Bachelor's Degree or higher | 7,716 (85.5%) | 343 (3.8%) |
| Total | 10,225 (84.8%) | 591 (4.9%) |
Employment Occupations by Sex in Summit
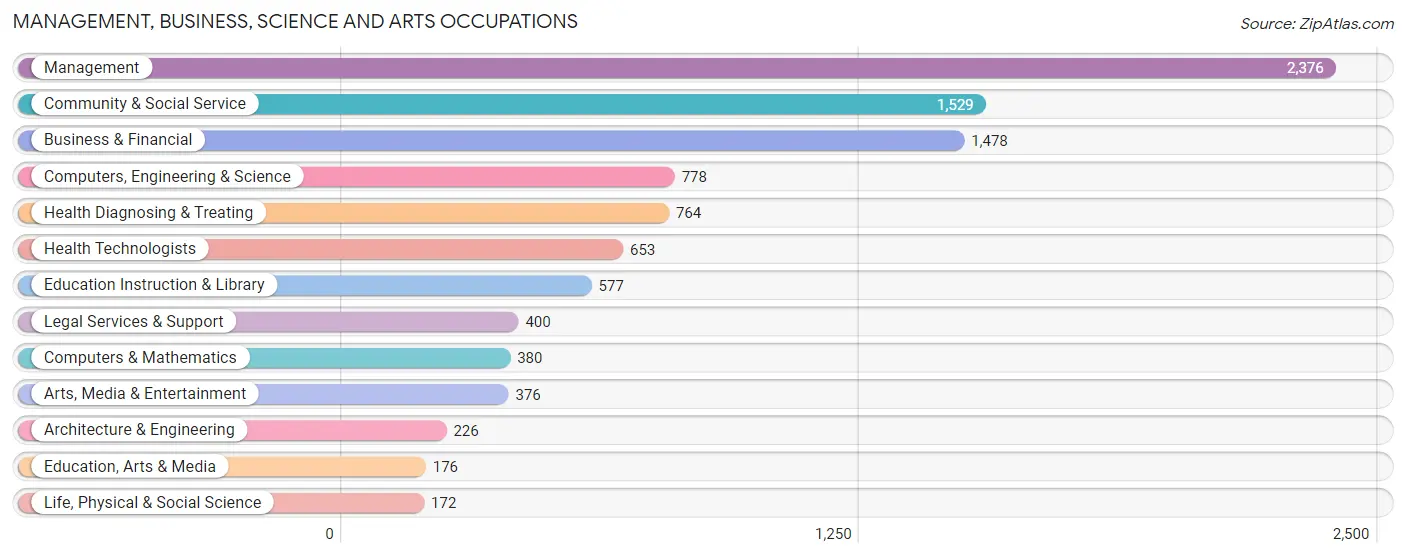
Management, Business, Science and Arts Occupations
The most common Management, Business, Science and Arts occupations in Summit are Management (2,376 | 20.7%), Community & Social Service (1,529 | 13.3%), Business & Financial (1,478 | 12.9%), Computers, Engineering & Science (778 | 6.8%), and Health Diagnosing & Treating (764 | 6.7%).
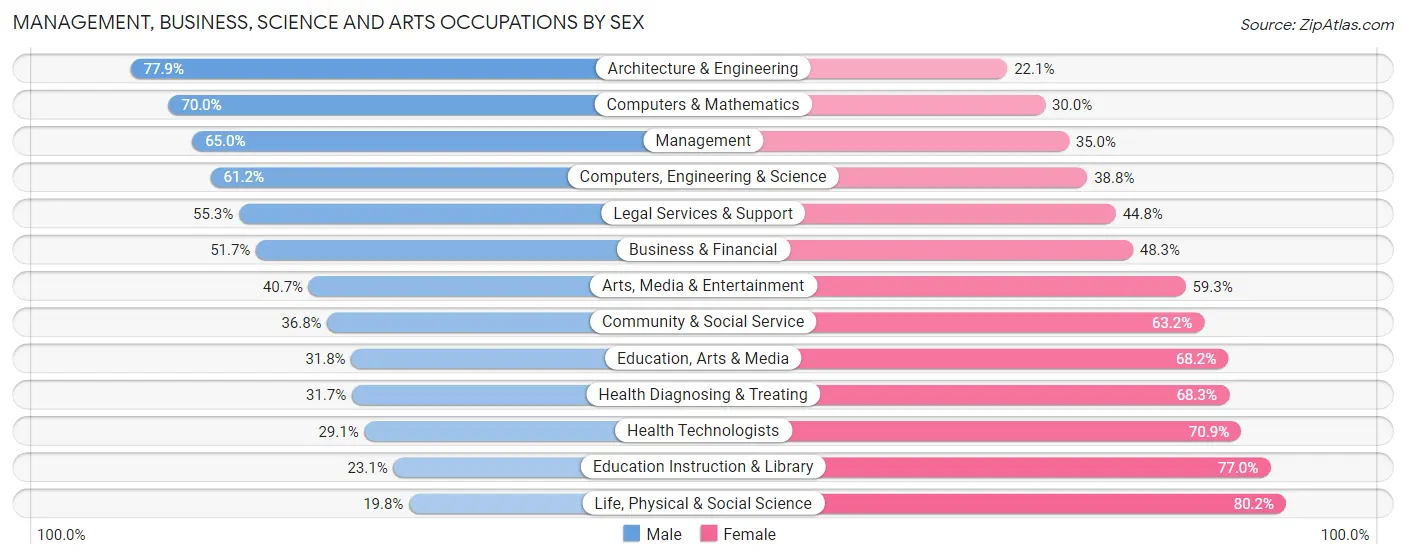
Management, Business, Science and Arts Occupations by Sex
Within the Management, Business, Science and Arts occupations in Summit, the most male-oriented occupations are Architecture & Engineering (77.9%), Computers & Mathematics (70.0%), and Management (65.0%), while the most female-oriented occupations are Life, Physical & Social Science (80.2%), Education Instruction & Library (76.9%), and Health Technologists (70.9%).
| Occupation | Male | Female |
| Management | 1,545 (65.0%) | 831 (35.0%) |
| Business & Financial | 764 (51.7%) | 714 (48.3%) |
| Computers, Engineering & Science | 476 (61.2%) | 302 (38.8%) |
| Computers & Mathematics | 266 (70.0%) | 114 (30.0%) |
| Architecture & Engineering | 176 (77.9%) | 50 (22.1%) |
| Life, Physical & Social Science | 34 (19.8%) | 138 (80.2%) |
| Community & Social Service | 563 (36.8%) | 966 (63.2%) |
| Education, Arts & Media | 56 (31.8%) | 120 (68.2%) |
| Legal Services & Support | 221 (55.2%) | 179 (44.8%) |
| Education Instruction & Library | 133 (23.1%) | 444 (76.9%) |
| Arts, Media & Entertainment | 153 (40.7%) | 223 (59.3%) |
| Health Diagnosing & Treating | 242 (31.7%) | 522 (68.3%) |
| Health Technologists | 190 (29.1%) | 463 (70.9%) |
| Total (Category) | 3,590 (51.8%) | 3,335 (48.2%) |
| Total (Overall) | 6,048 (52.6%) | 5,449 (47.4%) |
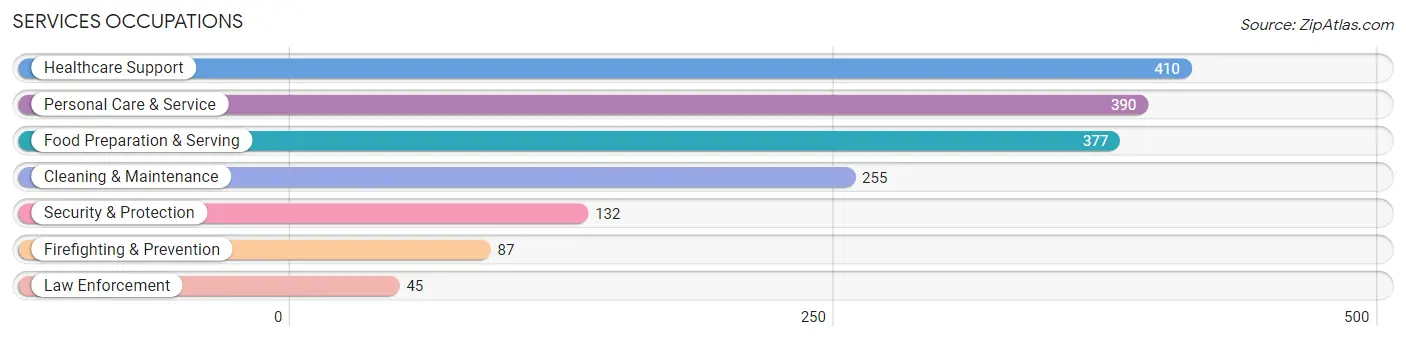
Services Occupations
The most common Services occupations in Summit are Healthcare Support (410 | 3.6%), Personal Care & Service (390 | 3.4%), Food Preparation & Serving (377 | 3.3%), Cleaning & Maintenance (255 | 2.2%), and Security & Protection (132 | 1.1%).
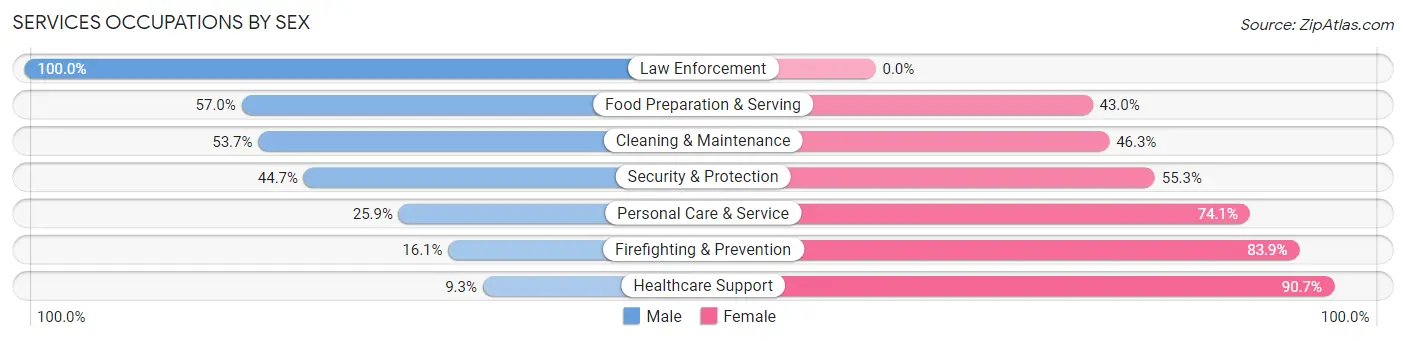
Services Occupations by Sex
Within the Services occupations in Summit, the most male-oriented occupations are Law Enforcement (100.0%), Food Preparation & Serving (57.0%), and Cleaning & Maintenance (53.7%), while the most female-oriented occupations are Healthcare Support (90.7%), Firefighting & Prevention (83.9%), and Personal Care & Service (74.1%).
| Occupation | Male | Female |
| Healthcare Support | 38 (9.3%) | 372 (90.7%) |
| Security & Protection | 59 (44.7%) | 73 (55.3%) |
| Firefighting & Prevention | 14 (16.1%) | 73 (83.9%) |
| Law Enforcement | 45 (100.0%) | 0 (0.0%) |
| Food Preparation & Serving | 215 (57.0%) | 162 (43.0%) |
| Cleaning & Maintenance | 137 (53.7%) | 118 (46.3%) |
| Personal Care & Service | 101 (25.9%) | 289 (74.1%) |
| Total (Category) | 550 (35.2%) | 1,014 (64.8%) |
| Total (Overall) | 6,048 (52.6%) | 5,449 (47.4%) |
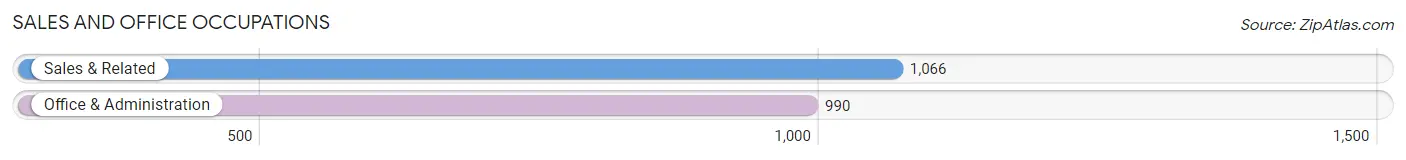
Sales and Office Occupations
The most common Sales and Office occupations in Summit are Sales & Related (1,066 | 9.3%), and Office & Administration (990 | 8.6%).
Sales and Office Occupations by Sex
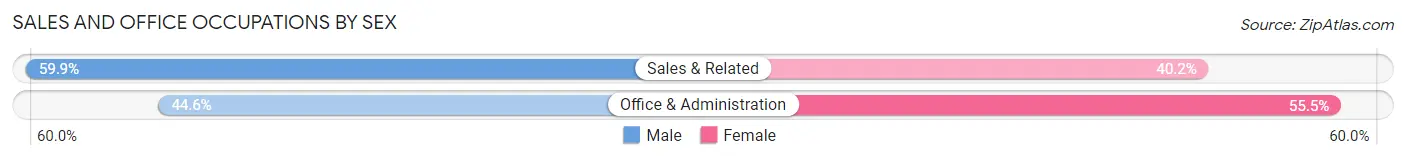
| Occupation | Male | Female |
| Sales & Related | 638 (59.9%) | 428 (40.2%) |
| Office & Administration | 441 (44.6%) | 549 (55.4%) |
| Total (Category) | 1,079 (52.5%) | 977 (47.5%) |
| Total (Overall) | 6,048 (52.6%) | 5,449 (47.4%) |
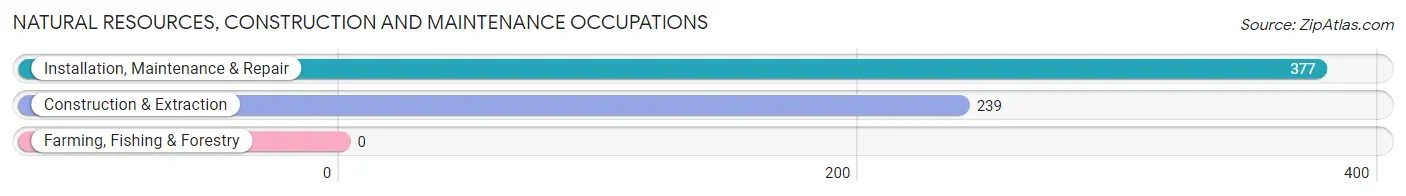
Natural Resources, Construction and Maintenance Occupations
The most common Natural Resources, Construction and Maintenance occupations in Summit are Installation, Maintenance & Repair (377 | 3.3%), and Construction & Extraction (239 | 2.1%).
Natural Resources, Construction and Maintenance Occupations by Sex
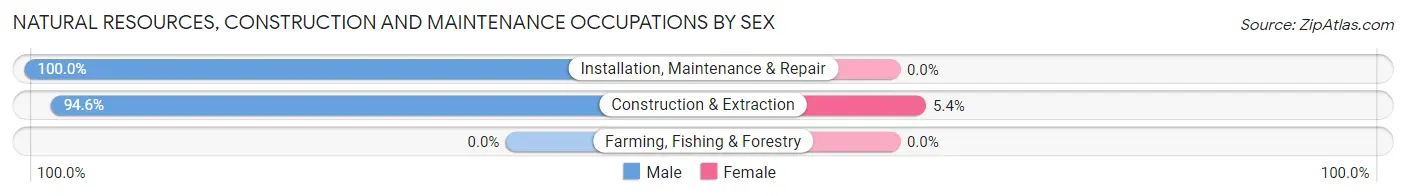
| Occupation | Male | Female |
| Farming, Fishing & Forestry | 0 (0.0%) | 0 (0.0%) |
| Construction & Extraction | 226 (94.6%) | 13 (5.4%) |
| Installation, Maintenance & Repair | 377 (100.0%) | 0 (0.0%) |
| Total (Category) | 603 (97.9%) | 13 (2.1%) |
| Total (Overall) | 6,048 (52.6%) | 5,449 (47.4%) |
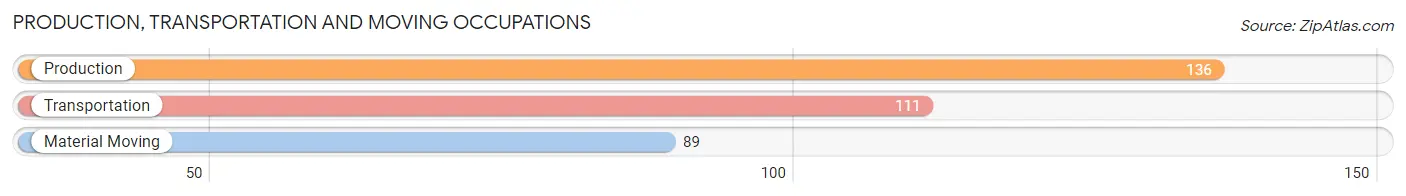
Production, Transportation and Moving Occupations
The most common Production, Transportation and Moving occupations in Summit are Production (136 | 1.2%), Transportation (111 | 1.0%), and Material Moving (89 | 0.8%).
Production, Transportation and Moving Occupations by Sex
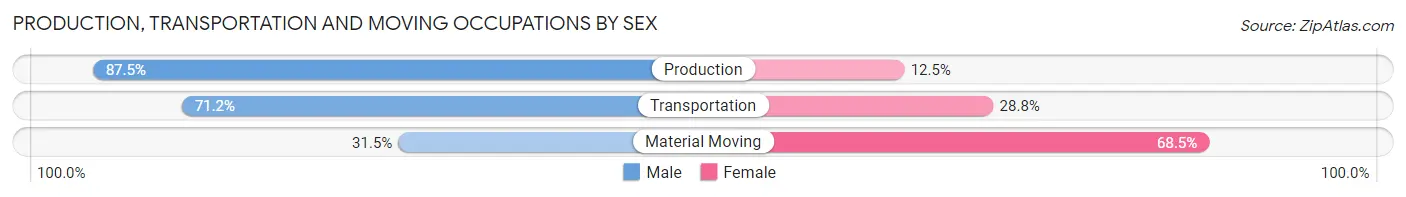
| Occupation | Male | Female |
| Production | 119 (87.5%) | 17 (12.5%) |
| Transportation | 79 (71.2%) | 32 (28.8%) |
| Material Moving | 28 (31.5%) | 61 (68.5%) |
| Total (Category) | 226 (67.3%) | 110 (32.7%) |
| Total (Overall) | 6,048 (52.6%) | 5,449 (47.4%) |
Employment Industries by Sex in Summit
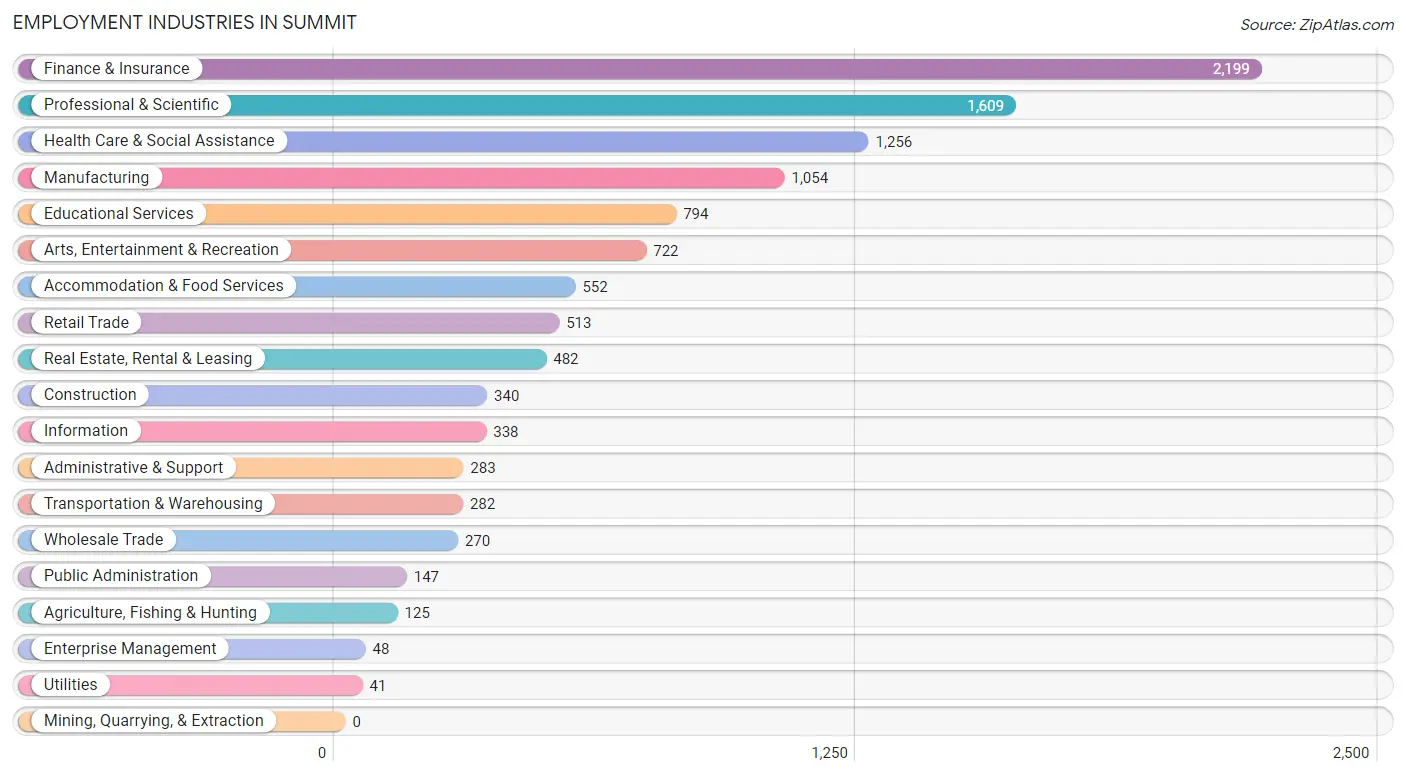
Employment Industries in Summit
The major employment industries in Summit include Finance & Insurance (2,199 | 19.1%), Professional & Scientific (1,609 | 14.0%), Health Care & Social Assistance (1,256 | 10.9%), Manufacturing (1,054 | 9.2%), and Educational Services (794 | 6.9%).
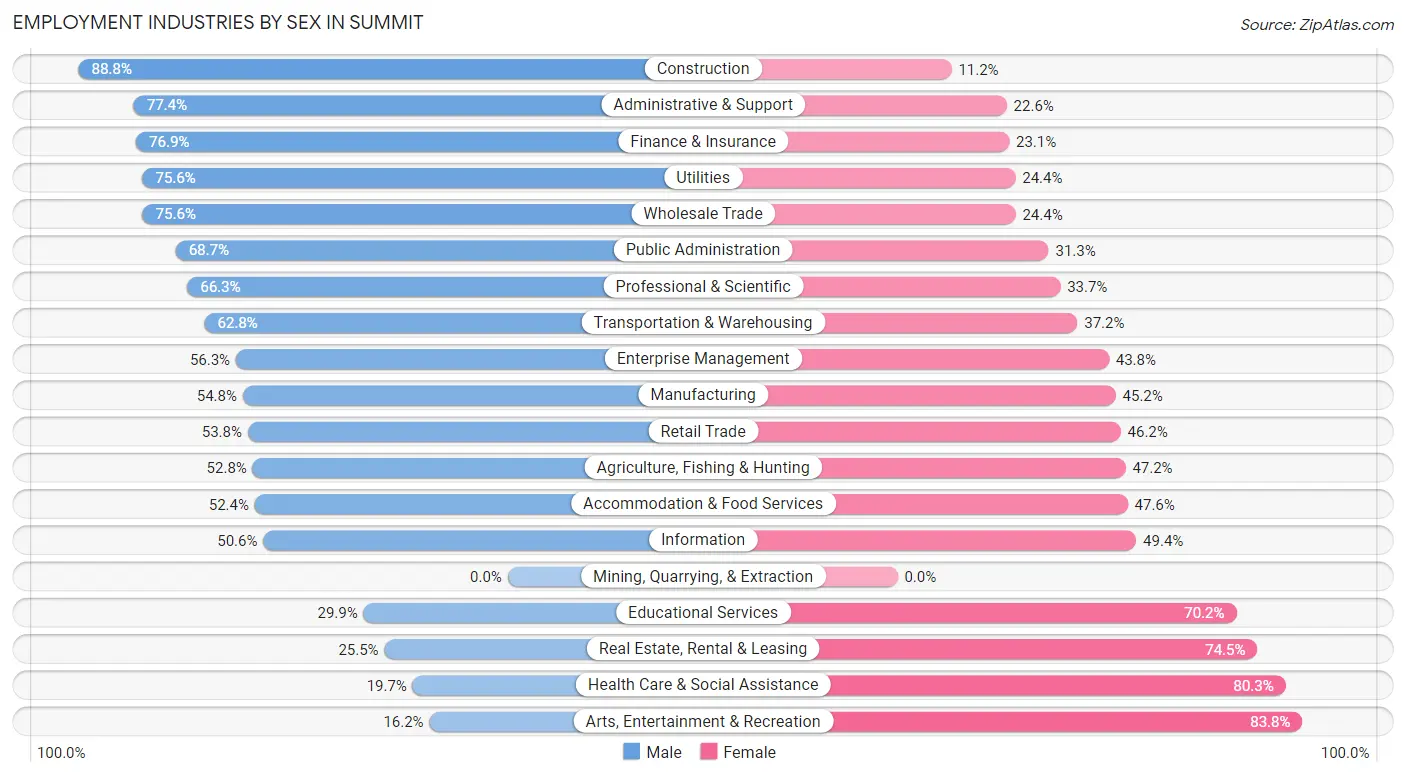
Employment Industries by Sex in Summit
The Summit industries that see more men than women are Construction (88.8%), Administrative & Support (77.4%), and Finance & Insurance (76.9%), whereas the industries that tend to have a higher number of women are Arts, Entertainment & Recreation (83.8%), Health Care & Social Assistance (80.3%), and Real Estate, Rental & Leasing (74.5%).
| Industry | Male | Female |
| Agriculture, Fishing & Hunting | 66 (52.8%) | 59 (47.2%) |
| Mining, Quarrying, & Extraction | 0 (0.0%) | 0 (0.0%) |
| Construction | 302 (88.8%) | 38 (11.2%) |
| Manufacturing | 578 (54.8%) | 476 (45.2%) |
| Wholesale Trade | 204 (75.6%) | 66 (24.4%) |
| Retail Trade | 276 (53.8%) | 237 (46.2%) |
| Transportation & Warehousing | 177 (62.8%) | 105 (37.2%) |
| Utilities | 31 (75.6%) | 10 (24.4%) |
| Information | 171 (50.6%) | 167 (49.4%) |
| Finance & Insurance | 1,691 (76.9%) | 508 (23.1%) |
| Real Estate, Rental & Leasing | 123 (25.5%) | 359 (74.5%) |
| Professional & Scientific | 1,067 (66.3%) | 542 (33.7%) |
| Enterprise Management | 27 (56.2%) | 21 (43.8%) |
| Administrative & Support | 219 (77.4%) | 64 (22.6%) |
| Educational Services | 237 (29.8%) | 557 (70.2%) |
| Health Care & Social Assistance | 247 (19.7%) | 1,009 (80.3%) |
| Arts, Entertainment & Recreation | 117 (16.2%) | 605 (83.8%) |
| Accommodation & Food Services | 289 (52.4%) | 263 (47.6%) |
| Public Administration | 101 (68.7%) | 46 (31.3%) |
| Total | 6,048 (52.6%) | 5,449 (47.4%) |
Education in Summit
School Enrollment in Summit
The most common levels of schooling among the 6,176 students in Summit are high school (1,744 | 28.2%), middle school (1,441 | 23.3%), and elementary school (1,143 | 18.5%).
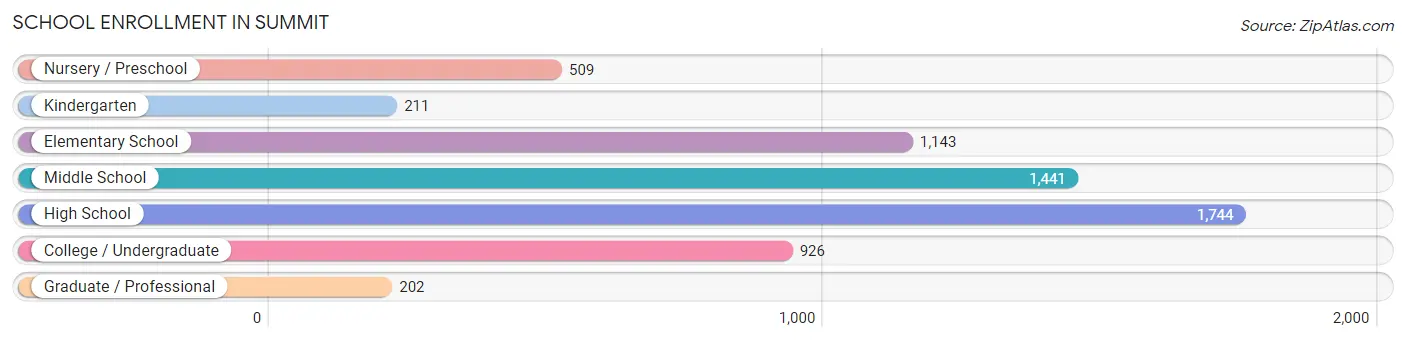
| School Level | # Students | % Students |
| Nursery / Preschool | 509 | 8.2% |
| Kindergarten | 211 | 3.4% |
| Elementary School | 1,143 | 18.5% |
| Middle School | 1,441 | 23.3% |
| High School | 1,744 | 28.2% |
| College / Undergraduate | 926 | 15.0% |
| Graduate / Professional | 202 | 3.3% |
| Total | 6,176 | 100.0% |
School Enrollment by Age by Funding Source in Summit
Out of a total of 6,176 students who are enrolled in schools in Summit, 1,606 (26.0%) attend a private institution, while the remaining 4,570 (74.0%) are enrolled in public schools. The age group of 3 to 4 year olds has the highest likelihood of being enrolled in private schools, with 317 (74.8% in the age bracket) enrolled. Conversely, the age group of 10 to 14 year olds has the lowest likelihood of being enrolled in a private school, with 1,597 (86.5% in the age bracket) attending a public institution.
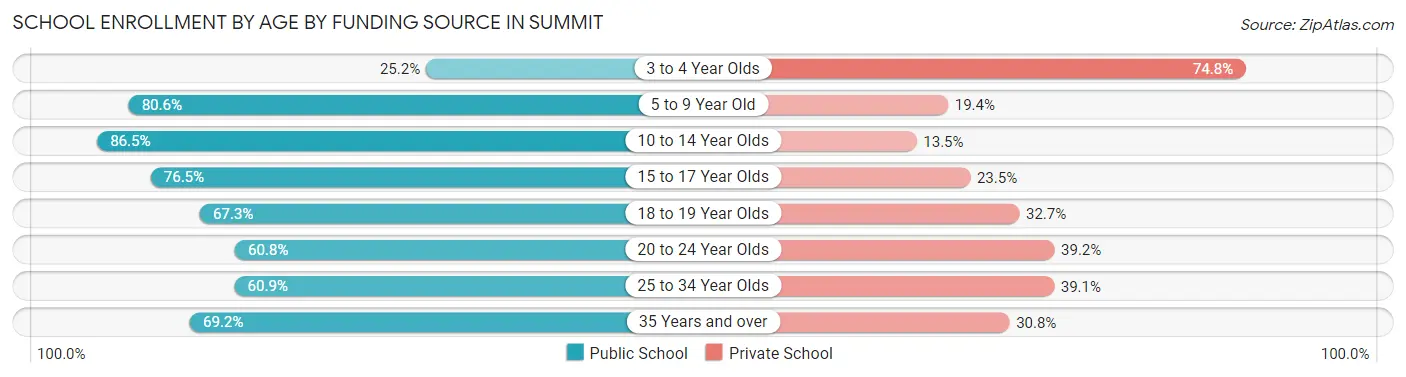
| Age Bracket | Public School | Private School |
| 3 to 4 Year Olds | 107 (25.2%) | 317 (74.8%) |
| 5 to 9 Year Old | 1,043 (80.6%) | 251 (19.4%) |
| 10 to 14 Year Olds | 1,597 (86.5%) | 250 (13.5%) |
| 15 to 17 Year Olds | 952 (76.5%) | 293 (23.5%) |
| 18 to 19 Year Olds | 303 (67.3%) | 147 (32.7%) |
| 20 to 24 Year Olds | 442 (60.8%) | 285 (39.2%) |
| 25 to 34 Year Olds | 42 (60.9%) | 27 (39.1%) |
| 35 Years and over | 83 (69.2%) | 37 (30.8%) |
| Total | 4,570 (74.0%) | 1,606 (26.0%) |
Educational Attainment by Field of Study in Summit
Business (2,834 | 25.0%), social sciences (1,738 | 15.3%), engineering (1,200 | 10.6%), science & technology (705 | 6.2%), and education (662 | 5.8%) are the most common fields of study among 11,336 individuals in Summit who have obtained a bachelor's degree or higher.
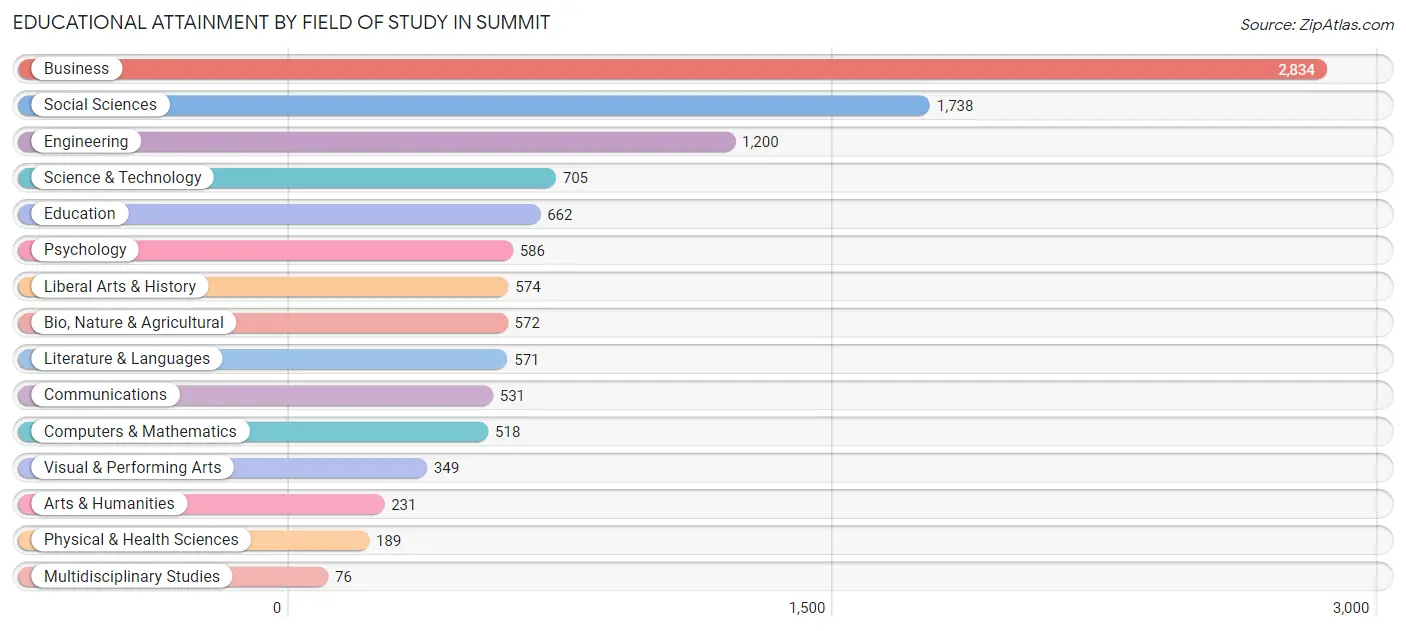
| Field of Study | # Graduates | % Graduates |
| Computers & Mathematics | 518 | 4.6% |
| Bio, Nature & Agricultural | 572 | 5.1% |
| Physical & Health Sciences | 189 | 1.7% |
| Psychology | 586 | 5.2% |
| Social Sciences | 1,738 | 15.3% |
| Engineering | 1,200 | 10.6% |
| Multidisciplinary Studies | 76 | 0.7% |
| Science & Technology | 705 | 6.2% |
| Business | 2,834 | 25.0% |
| Education | 662 | 5.8% |
| Literature & Languages | 571 | 5.0% |
| Liberal Arts & History | 574 | 5.1% |
| Visual & Performing Arts | 349 | 3.1% |
| Communications | 531 | 4.7% |
| Arts & Humanities | 231 | 2.0% |
| Total | 11,336 | 100.0% |
Transportation & Commute in Summit
Vehicle Availability by Sex in Summit
The most prevalent vehicle ownership categories in Summit are males with 2 vehicles (2,862, accounting for 47.8%) and females with 2 vehicles (2,062, making up 56.9%).
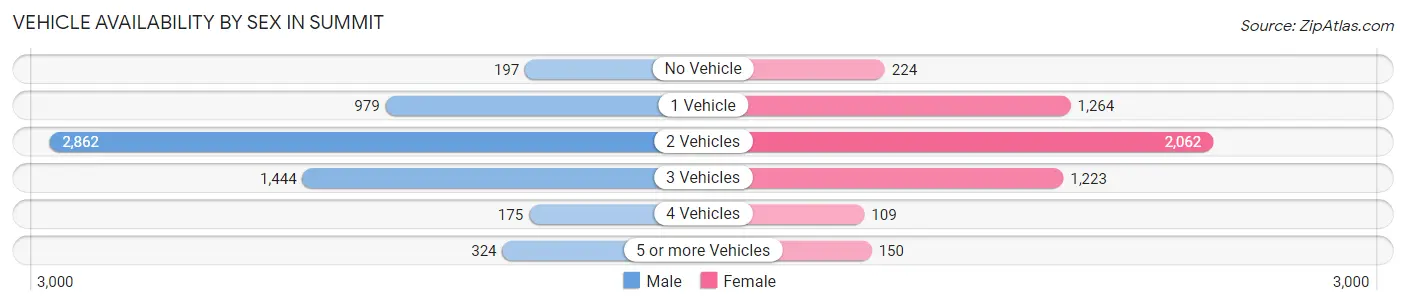
| Vehicles Available | Male | Female |
| No Vehicle | 197 (3.3%) | 224 (4.4%) |
| 1 Vehicle | 979 (16.4%) | 1,264 (25.1%) |
| 2 Vehicles | 2,862 (47.8%) | 2,062 (41.0%) |
| 3 Vehicles | 1,444 (24.1%) | 1,223 (24.3%) |
| 4 Vehicles | 175 (2.9%) | 109 (2.2%) |
| 5 or more Vehicles | 324 (5.4%) | 150 (3.0%) |
| Total | 5,981 (100.0%) | 5,032 (100.0%) |
Commute Time in Summit
The most frequently occuring commute durations in Summit are 60 to 89 minutes (1,662 commuters, 18.3%), 10 to 14 minutes (1,178 commuters, 13.0%), and 15 to 19 minutes (1,085 commuters, 12.0%).
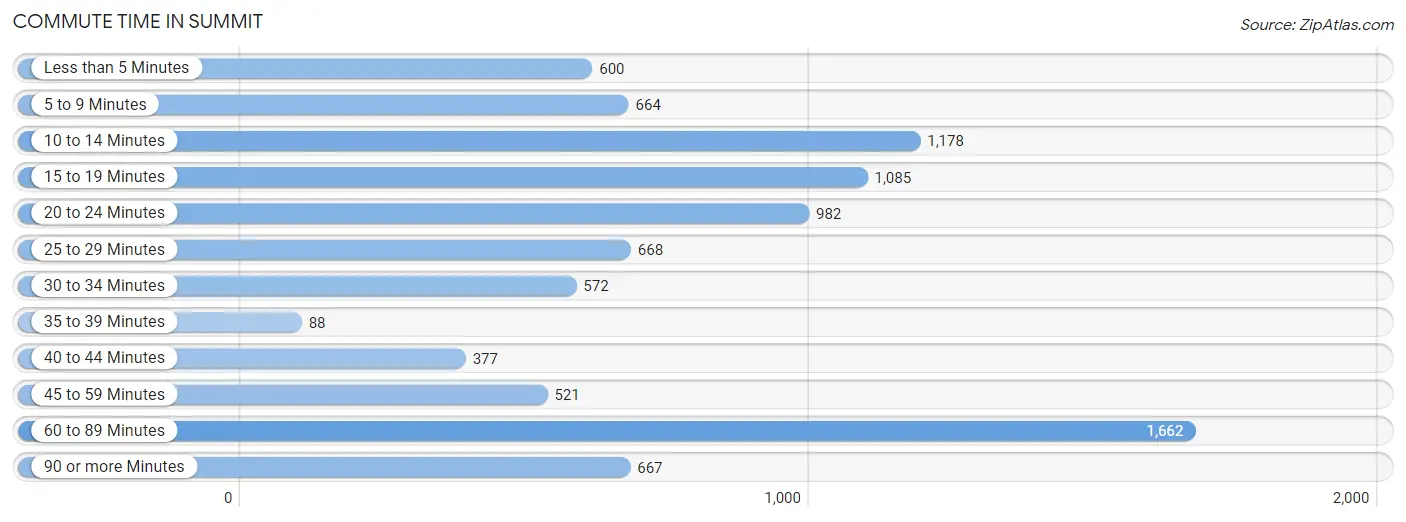
| Commute Time | # Commuters | % Commuters |
| Less than 5 Minutes | 600 | 6.6% |
| 5 to 9 Minutes | 664 | 7.3% |
| 10 to 14 Minutes | 1,178 | 13.0% |
| 15 to 19 Minutes | 1,085 | 12.0% |
| 20 to 24 Minutes | 982 | 10.8% |
| 25 to 29 Minutes | 668 | 7.4% |
| 30 to 34 Minutes | 572 | 6.3% |
| 35 to 39 Minutes | 88 | 1.0% |
| 40 to 44 Minutes | 377 | 4.2% |
| 45 to 59 Minutes | 521 | 5.8% |
| 60 to 89 Minutes | 1,662 | 18.3% |
| 90 or more Minutes | 667 | 7.4% |
Commute Time by Sex in Summit
The most common commute times in Summit are 60 to 89 minutes (1,172 commuters, 23.9%) for males and 15 to 19 minutes (709 commuters, 17.0%) for females.
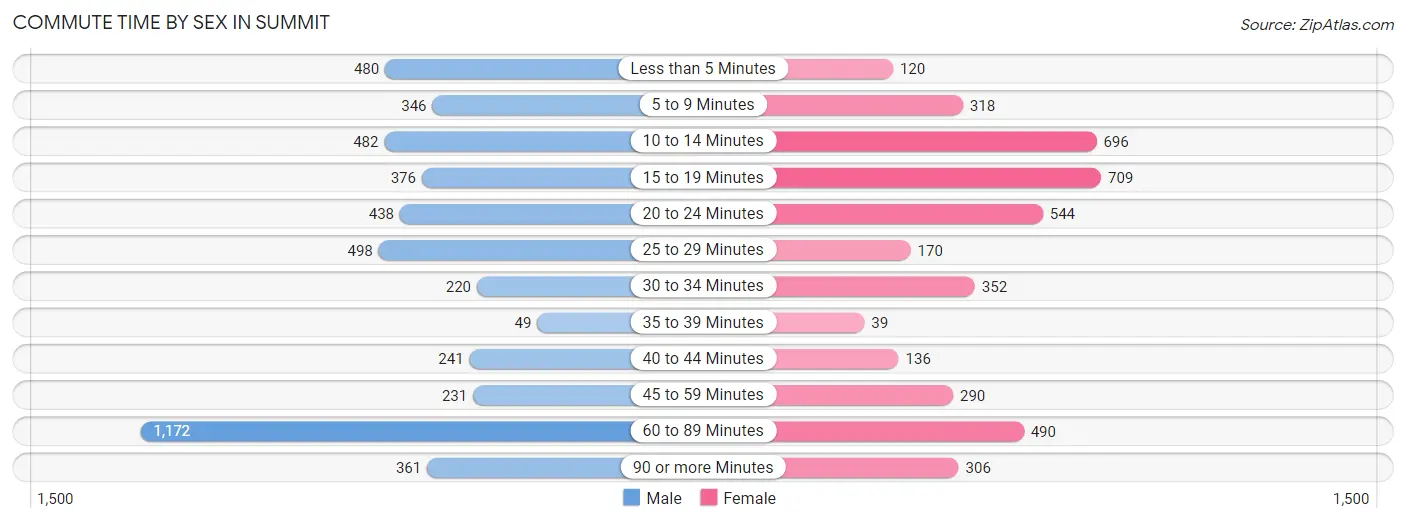
| Commute Time | Male | Female |
| Less than 5 Minutes | 480 (9.8%) | 120 (2.9%) |
| 5 to 9 Minutes | 346 (7.1%) | 318 (7.6%) |
| 10 to 14 Minutes | 482 (9.9%) | 696 (16.7%) |
| 15 to 19 Minutes | 376 (7.7%) | 709 (17.0%) |
| 20 to 24 Minutes | 438 (8.9%) | 544 (13.1%) |
| 25 to 29 Minutes | 498 (10.2%) | 170 (4.1%) |
| 30 to 34 Minutes | 220 (4.5%) | 352 (8.4%) |
| 35 to 39 Minutes | 49 (1.0%) | 39 (0.9%) |
| 40 to 44 Minutes | 241 (4.9%) | 136 (3.3%) |
| 45 to 59 Minutes | 231 (4.7%) | 290 (7.0%) |
| 60 to 89 Minutes | 1,172 (23.9%) | 490 (11.7%) |
| 90 or more Minutes | 361 (7.4%) | 306 (7.3%) |
Time of Departure to Work by Sex in Summit
The most frequent times of departure to work in Summit are 8:00 AM to 8:29 AM (873, 17.8%) for males and 8:00 AM to 8:29 AM (888, 21.3%) for females.
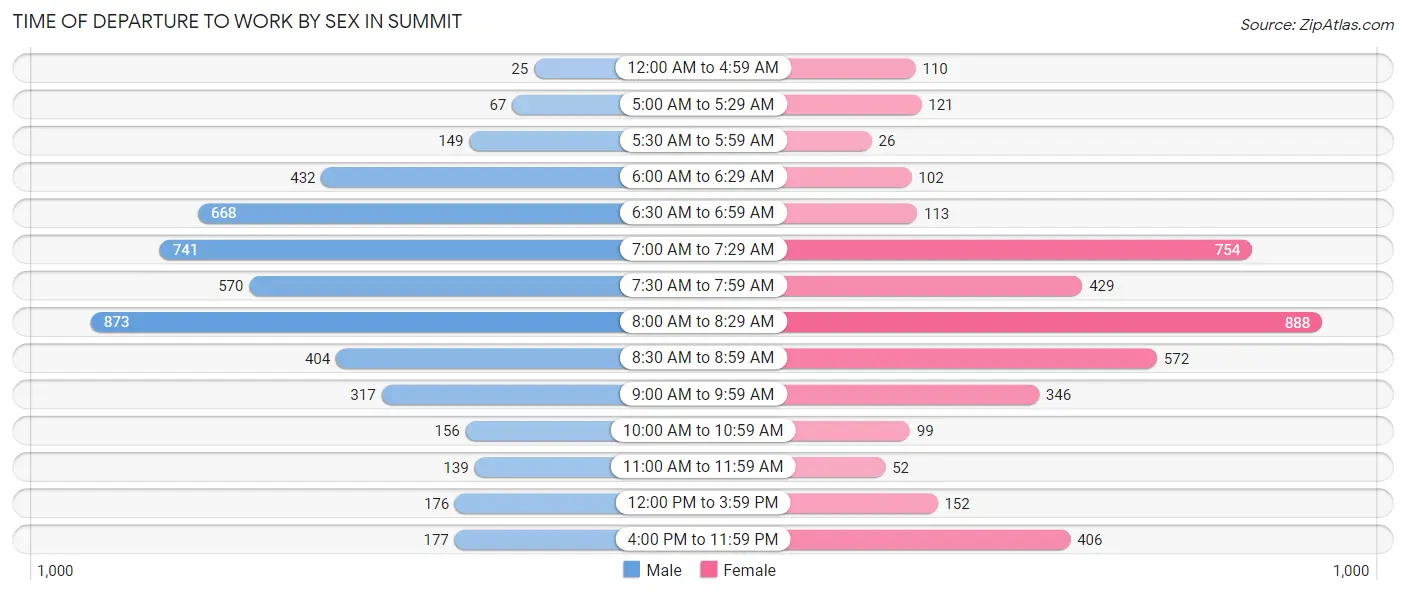
| Time of Departure | Male | Female |
| 12:00 AM to 4:59 AM | 25 (0.5%) | 110 (2.6%) |
| 5:00 AM to 5:29 AM | 67 (1.4%) | 121 (2.9%) |
| 5:30 AM to 5:59 AM | 149 (3.0%) | 26 (0.6%) |
| 6:00 AM to 6:29 AM | 432 (8.8%) | 102 (2.5%) |
| 6:30 AM to 6:59 AM | 668 (13.7%) | 113 (2.7%) |
| 7:00 AM to 7:29 AM | 741 (15.1%) | 754 (18.1%) |
| 7:30 AM to 7:59 AM | 570 (11.7%) | 429 (10.3%) |
| 8:00 AM to 8:29 AM | 873 (17.8%) | 888 (21.3%) |
| 8:30 AM to 8:59 AM | 404 (8.3%) | 572 (13.7%) |
| 9:00 AM to 9:59 AM | 317 (6.5%) | 346 (8.3%) |
| 10:00 AM to 10:59 AM | 156 (3.2%) | 99 (2.4%) |
| 11:00 AM to 11:59 AM | 139 (2.8%) | 52 (1.3%) |
| 12:00 PM to 3:59 PM | 176 (3.6%) | 152 (3.6%) |
| 4:00 PM to 11:59 PM | 177 (3.6%) | 406 (9.7%) |
| Total | 4,894 (100.0%) | 4,170 (100.0%) |
Housing Occupancy in Summit
Occupancy by Ownership in Summit
Of the total 7,944 dwellings in Summit, owner-occupied units account for 5,620 (70.8%), while renter-occupied units make up 2,324 (29.2%).
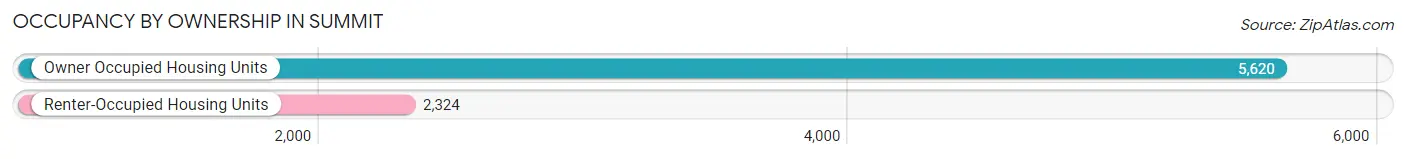
| Occupancy | # Housing Units | % Housing Units |
| Owner Occupied Housing Units | 5,620 | 70.8% |
| Renter-Occupied Housing Units | 2,324 | 29.2% |
| Total Occupied Housing Units | 7,944 | 100.0% |
Occupancy by Household Size in Summit
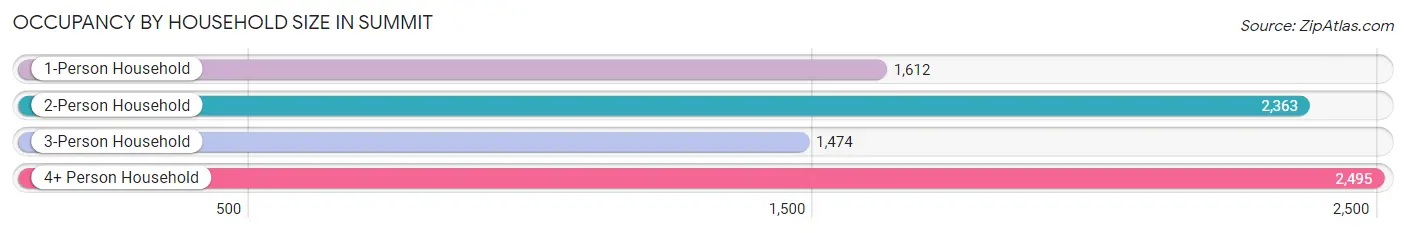
| Household Size | # Housing Units | % Housing Units |
| 1-Person Household | 1,612 | 20.3% |
| 2-Person Household | 2,363 | 29.7% |
| 3-Person Household | 1,474 | 18.5% |
| 4+ Person Household | 2,495 | 31.4% |
| Total Housing Units | 7,944 | 100.0% |
Occupancy by Ownership by Household Size in Summit
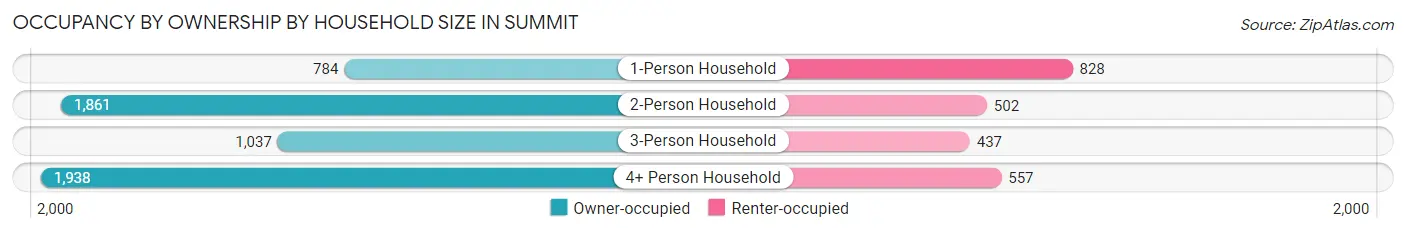
| Household Size | Owner-occupied | Renter-occupied |
| 1-Person Household | 784 (48.6%) | 828 (51.4%) |
| 2-Person Household | 1,861 (78.8%) | 502 (21.2%) |
| 3-Person Household | 1,037 (70.4%) | 437 (29.6%) |
| 4+ Person Household | 1,938 (77.7%) | 557 (22.3%) |
| Total Housing Units | 5,620 (70.8%) | 2,324 (29.2%) |
Occupancy by Educational Attainment in Summit
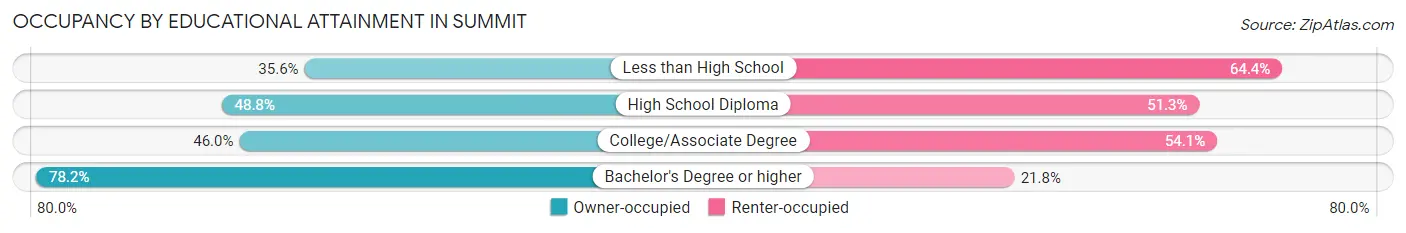
| Household Size | Owner-occupied | Renter-occupied |
| Less than High School | 57 (35.6%) | 103 (64.4%) |
| High School Diploma | 391 (48.7%) | 411 (51.2%) |
| College/Associate Degree | 408 (46.0%) | 480 (54.0%) |
| Bachelor's Degree or higher | 4,764 (78.2%) | 1,330 (21.8%) |
Occupancy by Age of Householder in Summit
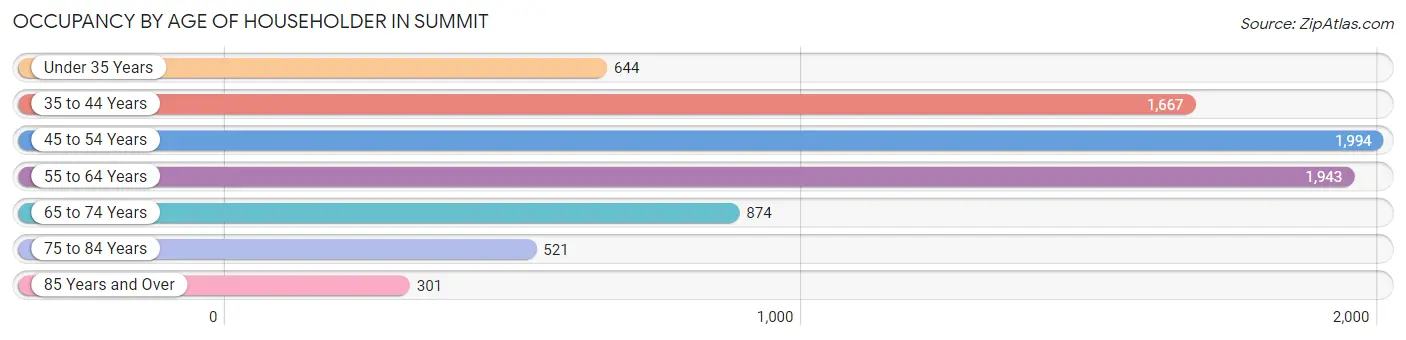
| Age Bracket | # Households | % Households |
| Under 35 Years | 644 | 8.1% |
| 35 to 44 Years | 1,667 | 21.0% |
| 45 to 54 Years | 1,994 | 25.1% |
| 55 to 64 Years | 1,943 | 24.5% |
| 65 to 74 Years | 874 | 11.0% |
| 75 to 84 Years | 521 | 6.6% |
| 85 Years and Over | 301 | 3.8% |
| Total | 7,944 | 100.0% |
Housing Finances in Summit
Median Income by Occupancy in Summit
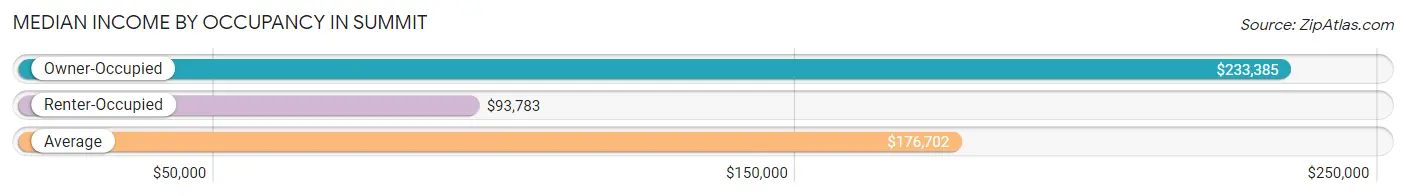
| Occupancy Type | # Households | Median Income |
| Owner-Occupied | 5,620 (70.8%) | $233,385 |
| Renter-Occupied | 2,324 (29.2%) | $93,783 |
| Average | 7,944 (100.0%) | $176,702 |
Occupancy by Householder Income Bracket in Summit
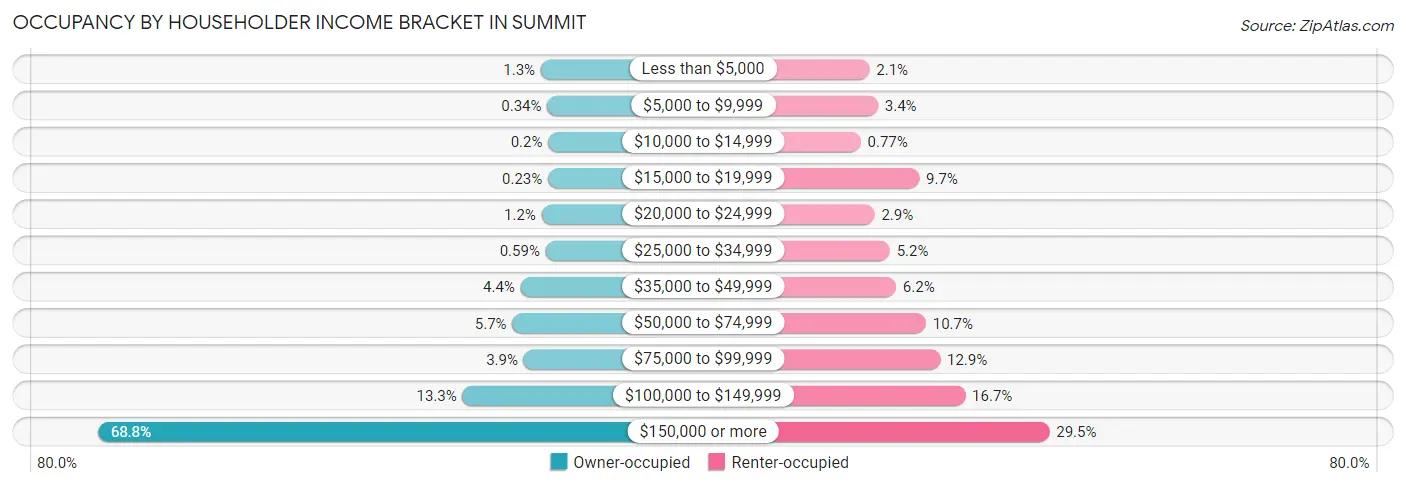
| Income Bracket | Owner-occupied | Renter-occupied |
| Less than $5,000 | 74 (1.3%) | 49 (2.1%) |
| $5,000 to $9,999 | 19 (0.3%) | 79 (3.4%) |
| $10,000 to $14,999 | 11 (0.2%) | 18 (0.8%) |
| $15,000 to $19,999 | 13 (0.2%) | 225 (9.7%) |
| $20,000 to $24,999 | 68 (1.2%) | 67 (2.9%) |
| $25,000 to $34,999 | 33 (0.6%) | 121 (5.2%) |
| $35,000 to $49,999 | 248 (4.4%) | 143 (6.1%) |
| $50,000 to $74,999 | 318 (5.7%) | 249 (10.7%) |
| $75,000 to $99,999 | 221 (3.9%) | 299 (12.9%) |
| $100,000 to $149,999 | 746 (13.3%) | 388 (16.7%) |
| $150,000 or more | 3,869 (68.8%) | 686 (29.5%) |
| Total | 5,620 (100.0%) | 2,324 (100.0%) |
Monthly Housing Cost Tiers in Summit
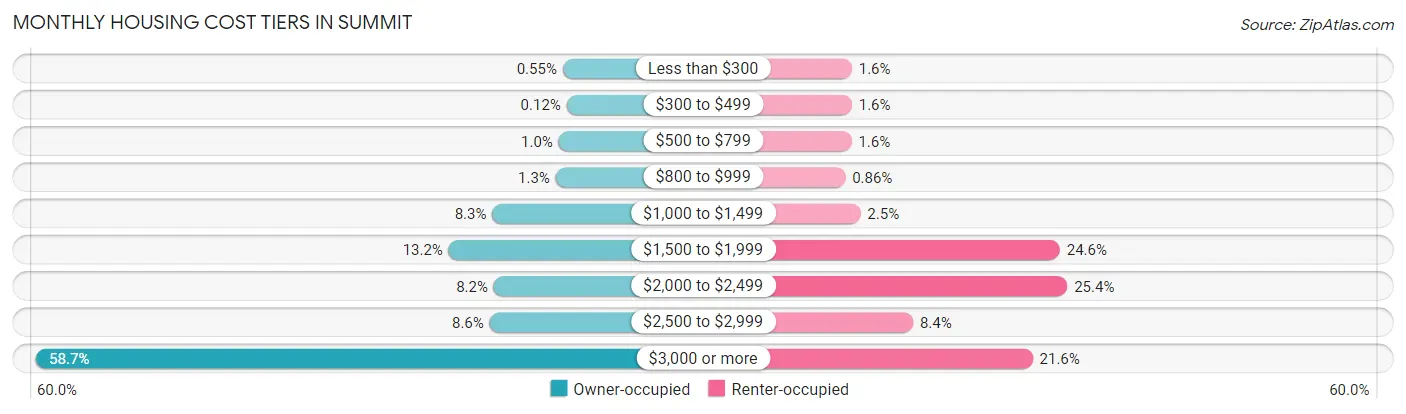
| Monthly Cost | Owner-occupied | Renter-occupied |
| Less than $300 | 31 (0.5%) | 37 (1.6%) |
| $300 to $499 | 7 (0.1%) | 37 (1.6%) |
| $500 to $799 | 56 (1.0%) | 36 (1.5%) |
| $800 to $999 | 75 (1.3%) | 20 (0.9%) |
| $1,000 to $1,499 | 468 (8.3%) | 59 (2.5%) |
| $1,500 to $1,999 | 739 (13.2%) | 571 (24.6%) |
| $2,000 to $2,499 | 459 (8.2%) | 590 (25.4%) |
| $2,500 to $2,999 | 485 (8.6%) | 194 (8.4%) |
| $3,000 or more | 3,300 (58.7%) | 501 (21.6%) |
| Total | 5,620 (100.0%) | 2,324 (100.0%) |
Physical Housing Characteristics in Summit
Housing Structures in Summit
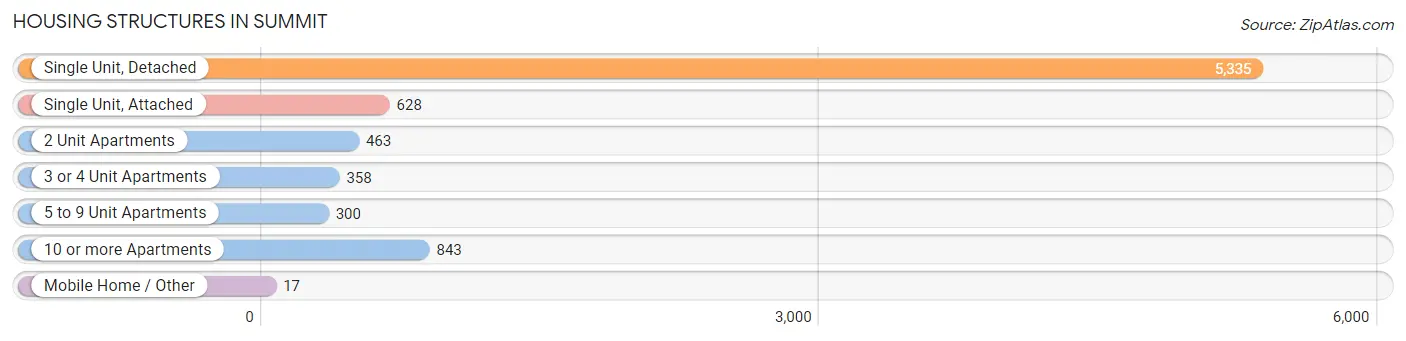
| Structure Type | # Housing Units | % Housing Units |
| Single Unit, Detached | 5,335 | 67.2% |
| Single Unit, Attached | 628 | 7.9% |
| 2 Unit Apartments | 463 | 5.8% |
| 3 or 4 Unit Apartments | 358 | 4.5% |
| 5 to 9 Unit Apartments | 300 | 3.8% |
| 10 or more Apartments | 843 | 10.6% |
| Mobile Home / Other | 17 | 0.2% |
| Total | 7,944 | 100.0% |
Housing Structures by Occupancy in Summit
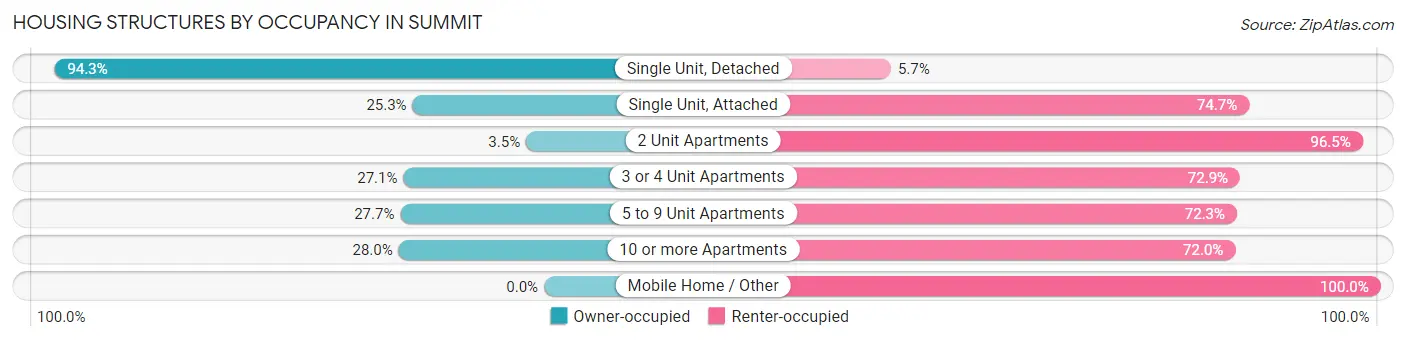
| Structure Type | Owner-occupied | Renter-occupied |
| Single Unit, Detached | 5,029 (94.3%) | 306 (5.7%) |
| Single Unit, Attached | 159 (25.3%) | 469 (74.7%) |
| 2 Unit Apartments | 16 (3.5%) | 447 (96.5%) |
| 3 or 4 Unit Apartments | 97 (27.1%) | 261 (72.9%) |
| 5 to 9 Unit Apartments | 83 (27.7%) | 217 (72.3%) |
| 10 or more Apartments | 236 (28.0%) | 607 (72.0%) |
| Mobile Home / Other | 0 (0.0%) | 17 (100.0%) |
| Total | 5,620 (70.8%) | 2,324 (29.2%) |
Housing Structures by Number of Rooms in Summit
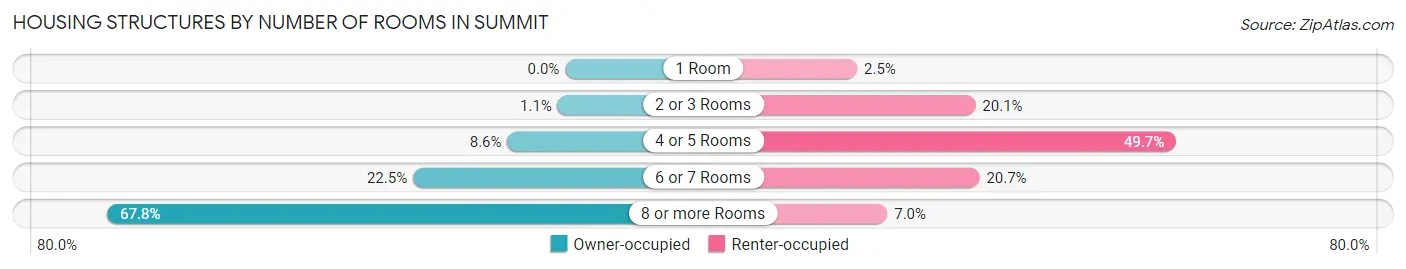
| Number of Rooms | Owner-occupied | Renter-occupied |
| 1 Room | 0 (0.0%) | 59 (2.5%) |
| 2 or 3 Rooms | 63 (1.1%) | 466 (20.1%) |
| 4 or 5 Rooms | 481 (8.6%) | 1,156 (49.7%) |
| 6 or 7 Rooms | 1,266 (22.5%) | 480 (20.6%) |
| 8 or more Rooms | 3,810 (67.8%) | 163 (7.0%) |
| Total | 5,620 (100.0%) | 2,324 (100.0%) |
Housing Structure by Heating Type in Summit
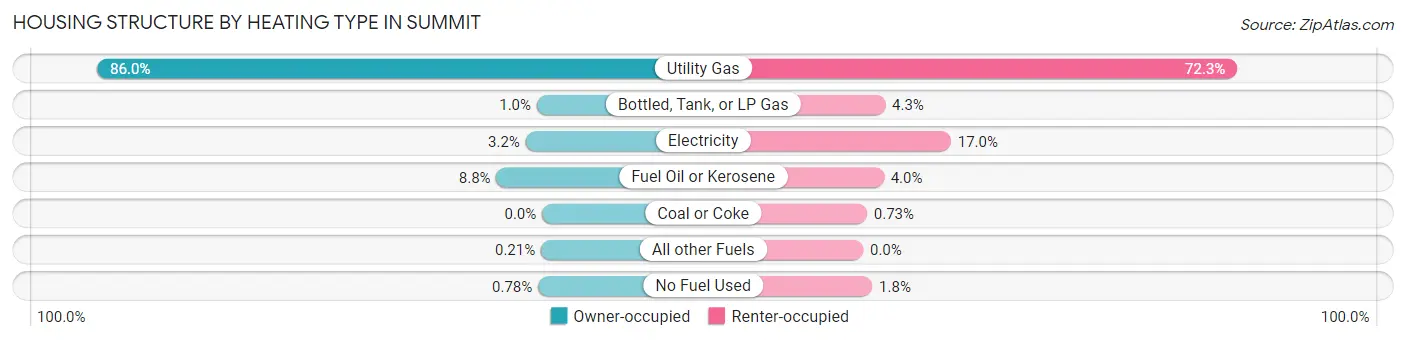
| Heating Type | Owner-occupied | Renter-occupied |
| Utility Gas | 4,833 (86.0%) | 1,680 (72.3%) |
| Bottled, Tank, or LP Gas | 57 (1.0%) | 99 (4.3%) |
| Electricity | 178 (3.2%) | 394 (17.0%) |
| Fuel Oil or Kerosene | 496 (8.8%) | 93 (4.0%) |
| Coal or Coke | 0 (0.0%) | 17 (0.7%) |
| All other Fuels | 12 (0.2%) | 0 (0.0%) |
| No Fuel Used | 44 (0.8%) | 41 (1.8%) |
| Total | 5,620 (100.0%) | 2,324 (100.0%) |
Household Vehicle Usage in Summit
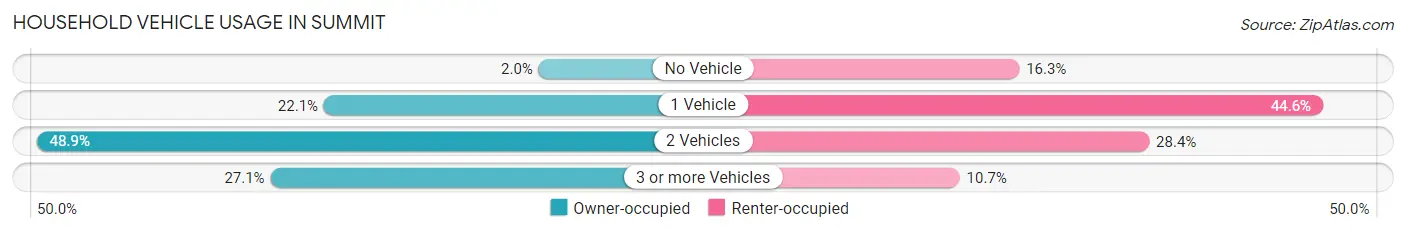
| Vehicles per Household | Owner-occupied | Renter-occupied |
| No Vehicle | 113 (2.0%) | 378 (16.3%) |
| 1 Vehicle | 1,240 (22.1%) | 1,037 (44.6%) |
| 2 Vehicles | 2,747 (48.9%) | 660 (28.4%) |
| 3 or more Vehicles | 1,520 (27.1%) | 249 (10.7%) |
| Total | 5,620 (100.0%) | 2,324 (100.0%) |
Real Estate & Mortgages in Summit
Real Estate and Mortgage Overview in Summit
| Characteristic | Without Mortgage | With Mortgage |
| Housing Units | 1,650 | 3,970 |
| Median Property Value | $889,200 | $917,900 |
| Median Household Income | $163,700 | $2,977 |
| Monthly Housing Costs | $1,501 | $2,972 |
| Real Estate Taxes | $10,001 | $26 |
Property Value by Mortgage Status in Summit
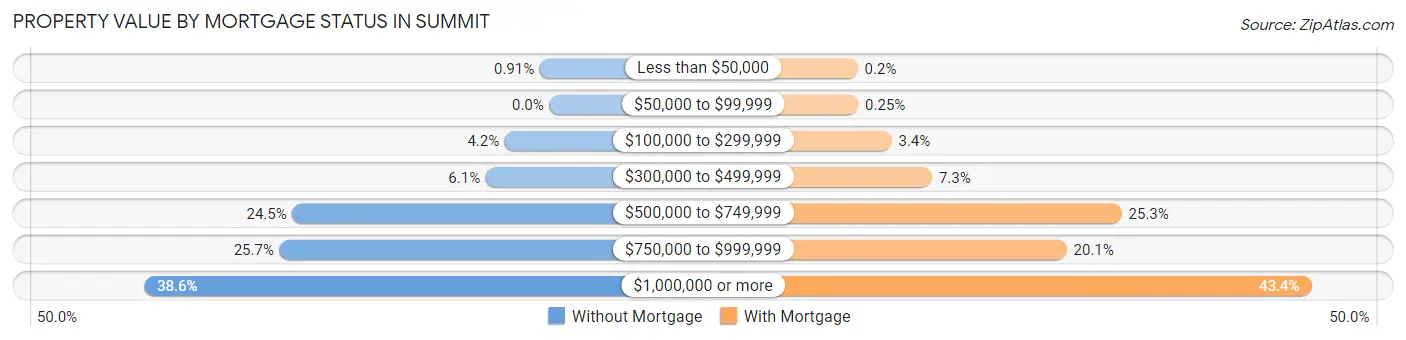
| Property Value | Without Mortgage | With Mortgage |
| Less than $50,000 | 15 (0.9%) | 8 (0.2%) |
| $50,000 to $99,999 | 0 (0.0%) | 10 (0.3%) |
| $100,000 to $299,999 | 70 (4.2%) | 136 (3.4%) |
| $300,000 to $499,999 | 100 (6.1%) | 289 (7.3%) |
| $500,000 to $749,999 | 404 (24.5%) | 1,006 (25.3%) |
| $750,000 to $999,999 | 424 (25.7%) | 798 (20.1%) |
| $1,000,000 or more | 637 (38.6%) | 1,723 (43.4%) |
| Total | 1,650 (100.0%) | 3,970 (100.0%) |
Household Income by Mortgage Status in Summit
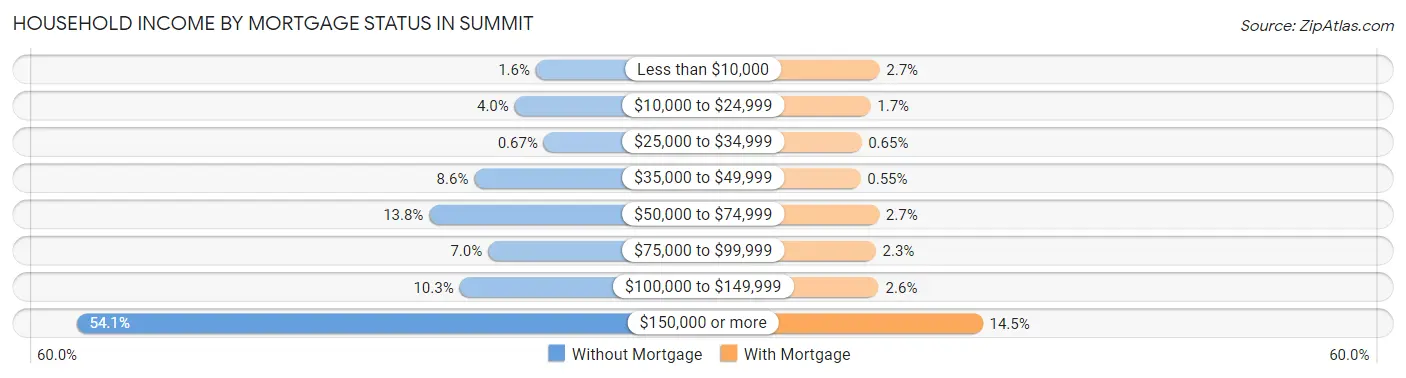
| Household Income | Without Mortgage | With Mortgage |
| Less than $10,000 | 26 (1.6%) | 108 (2.7%) |
| $10,000 to $24,999 | 66 (4.0%) | 67 (1.7%) |
| $25,000 to $34,999 | 11 (0.7%) | 26 (0.6%) |
| $35,000 to $49,999 | 142 (8.6%) | 22 (0.5%) |
| $50,000 to $74,999 | 227 (13.8%) | 106 (2.7%) |
| $75,000 to $99,999 | 116 (7.0%) | 91 (2.3%) |
| $100,000 to $149,999 | 170 (10.3%) | 105 (2.6%) |
| $150,000 or more | 892 (54.1%) | 576 (14.5%) |
| Total | 1,650 (100.0%) | 3,970 (100.0%) |
Property Value to Household Income Ratio in Summit
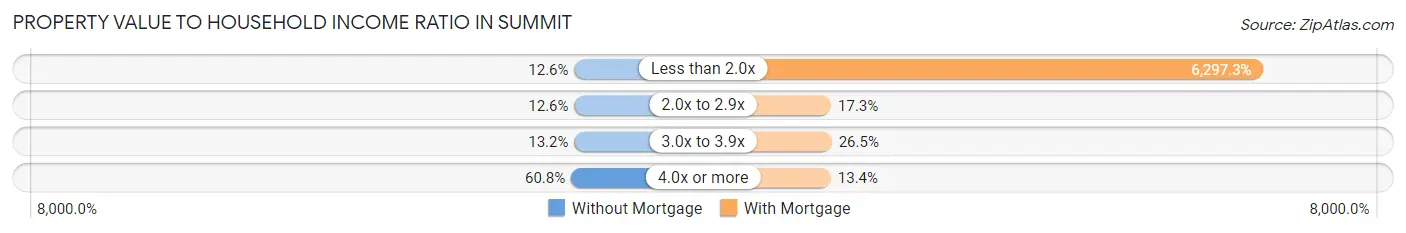
| Value-to-Income Ratio | Without Mortgage | With Mortgage |
| Less than 2.0x | 207 (12.6%) | 250,001 (6,297.2%) |
| 2.0x to 2.9x | 207 (12.6%) | 685 (17.2%) |
| 3.0x to 3.9x | 218 (13.2%) | 1,052 (26.5%) |
| 4.0x or more | 1,003 (60.8%) | 532 (13.4%) |
| Total | 1,650 (100.0%) | 3,970 (100.0%) |
Real Estate Taxes by Mortgage Status in Summit
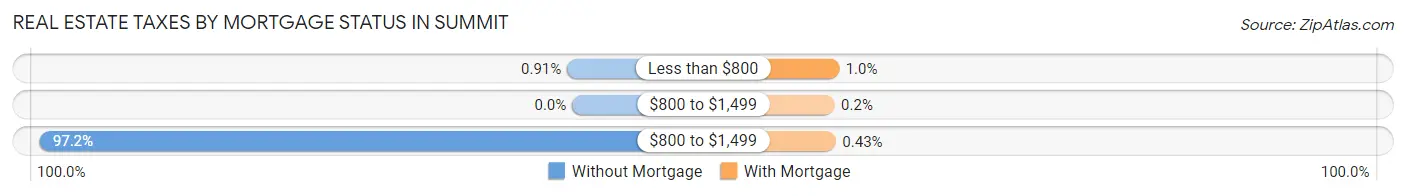
| Property Taxes | Without Mortgage | With Mortgage |
| Less than $800 | 15 (0.9%) | 41 (1.0%) |
| $800 to $1,499 | 0 (0.0%) | 8 (0.2%) |
| $800 to $1,499 | 1,604 (97.2%) | 17 (0.4%) |
| Total | 1,650 (100.0%) | 3,970 (100.0%) |
Health & Disability in Summit
Health Insurance Coverage by Age in Summit
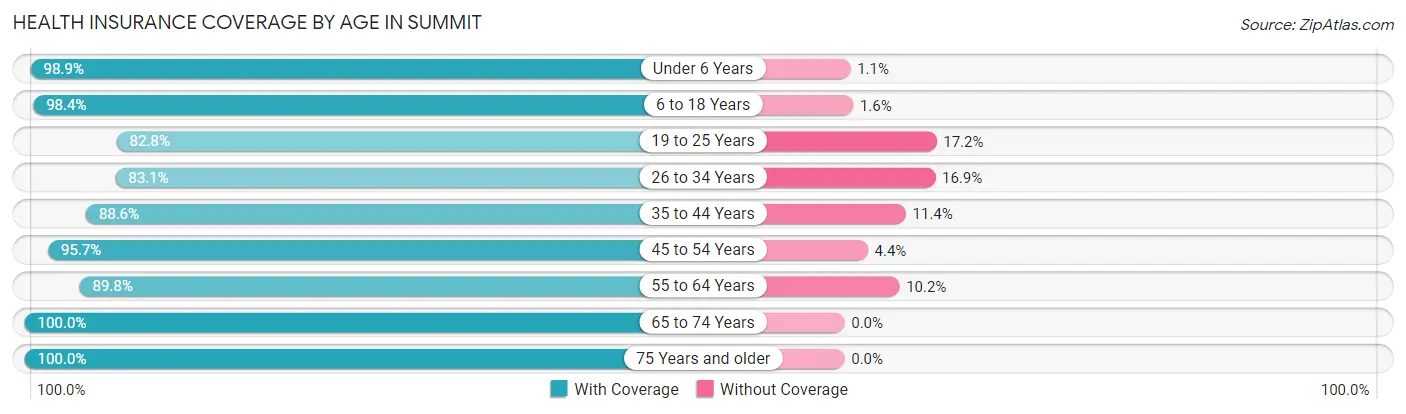
| Age Bracket | With Coverage | Without Coverage |
| Under 6 Years | 1,598 (98.9%) | 18 (1.1%) |
| 6 to 18 Years | 4,470 (98.4%) | 73 (1.6%) |
| 19 to 25 Years | 1,347 (82.8%) | 279 (17.2%) |
| 26 to 34 Years | 1,242 (83.1%) | 253 (16.9%) |
| 35 to 44 Years | 3,023 (88.6%) | 390 (11.4%) |
| 45 to 54 Years | 3,538 (95.7%) | 161 (4.3%) |
| 55 to 64 Years | 2,866 (89.8%) | 327 (10.2%) |
| 65 to 74 Years | 1,502 (100.0%) | 0 (0.0%) |
| 75 Years and older | 1,366 (100.0%) | 0 (0.0%) |
| Total | 20,952 (93.3%) | 1,501 (6.7%) |
Health Insurance Coverage by Citizenship Status in Summit
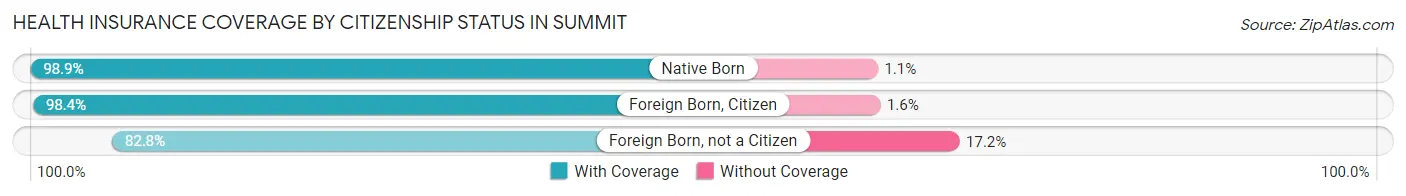
| Citizenship Status | With Coverage | Without Coverage |
| Native Born | 1,598 (98.9%) | 18 (1.1%) |
| Foreign Born, Citizen | 4,470 (98.4%) | 73 (1.6%) |
| Foreign Born, not a Citizen | 1,347 (82.8%) | 279 (17.2%) |
Health Insurance Coverage by Household Income in Summit
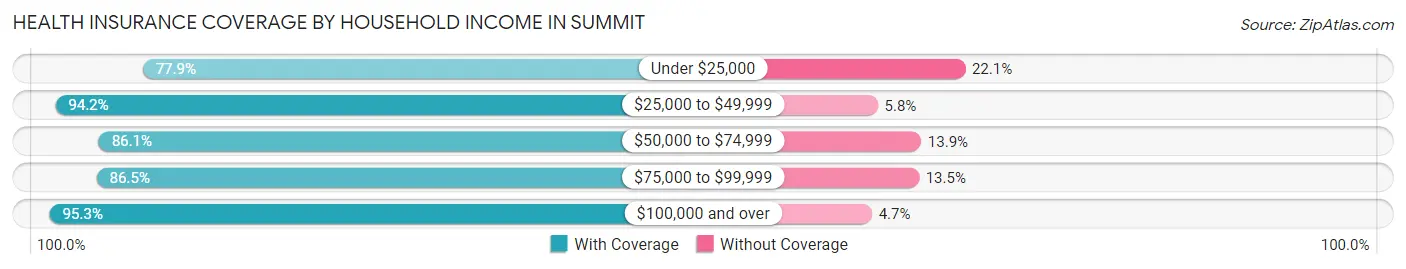
| Household Income | With Coverage | Without Coverage |
| Under $25,000 | 886 (77.9%) | 252 (22.1%) |
| $25,000 to $49,999 | 1,029 (94.2%) | 63 (5.8%) |
| $50,000 to $74,999 | 936 (86.1%) | 151 (13.9%) |
| $75,000 to $99,999 | 1,155 (86.5%) | 180 (13.5%) |
| $100,000 and over | 16,868 (95.3%) | 826 (4.7%) |
Public vs Private Health Insurance Coverage by Age in Summit
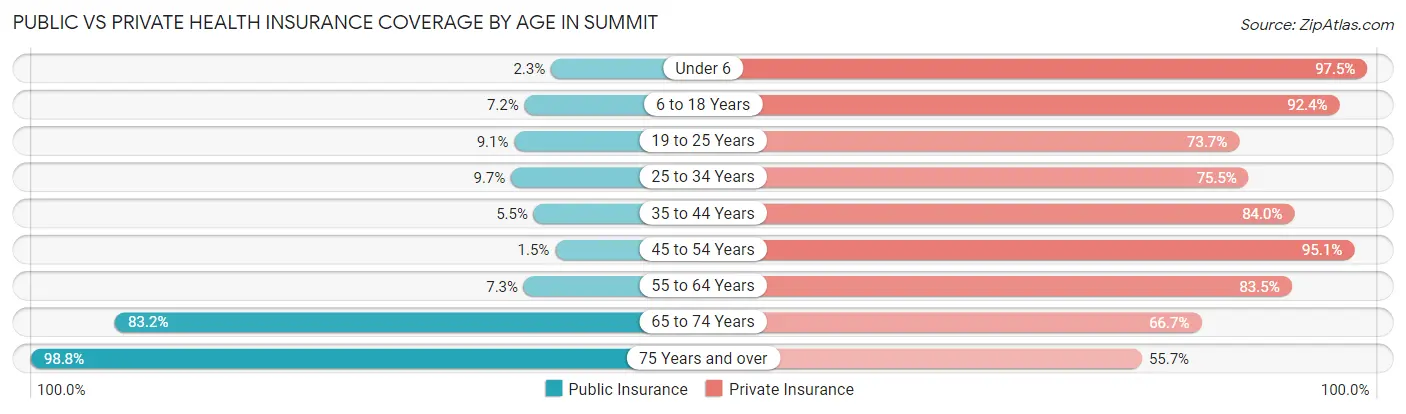
| Age Bracket | Public Insurance | Private Insurance |
| Under 6 | 37 (2.3%) | 1,576 (97.5%) |
| 6 to 18 Years | 327 (7.2%) | 4,196 (92.4%) |
| 19 to 25 Years | 148 (9.1%) | 1,199 (73.7%) |
| 25 to 34 Years | 145 (9.7%) | 1,129 (75.5%) |
| 35 to 44 Years | 187 (5.5%) | 2,866 (84.0%) |
| 45 to 54 Years | 56 (1.5%) | 3,517 (95.1%) |
| 55 to 64 Years | 234 (7.3%) | 2,665 (83.5%) |
| 65 to 74 Years | 1,250 (83.2%) | 1,002 (66.7%) |
| 75 Years and over | 1,350 (98.8%) | 761 (55.7%) |
| Total | 3,734 (16.6%) | 18,911 (84.2%) |
Disability Status by Sex by Age in Summit
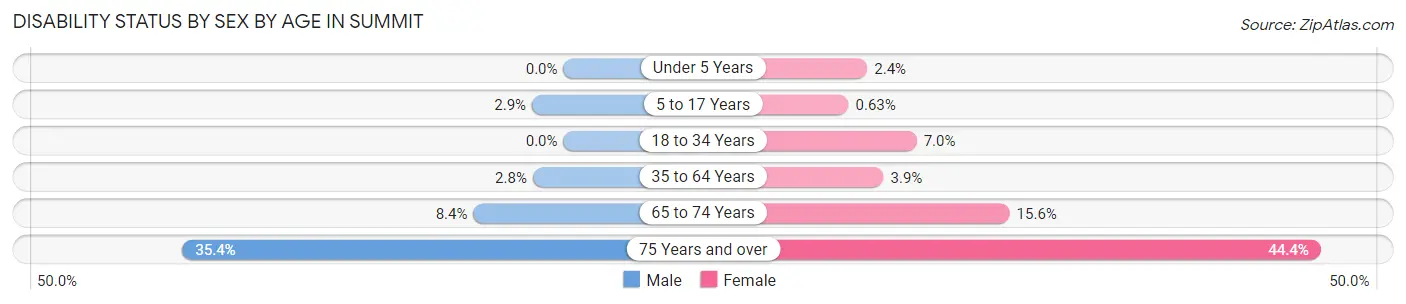
| Age Bracket | Male | Female |
| Under 5 Years | 0 (0.0%) | 18 (2.4%) |
| 5 to 17 Years | 66 (2.9%) | 14 (0.6%) |
| 18 to 34 Years | 0 (0.0%) | 121 (7.0%) |
| 35 to 64 Years | 142 (2.8%) | 206 (3.9%) |
| 65 to 74 Years | 59 (8.4%) | 124 (15.6%) |
| 75 Years and over | 152 (35.3%) | 416 (44.4%) |
Disability Class by Sex by Age in Summit
Disability Class: Hearing Difficulty
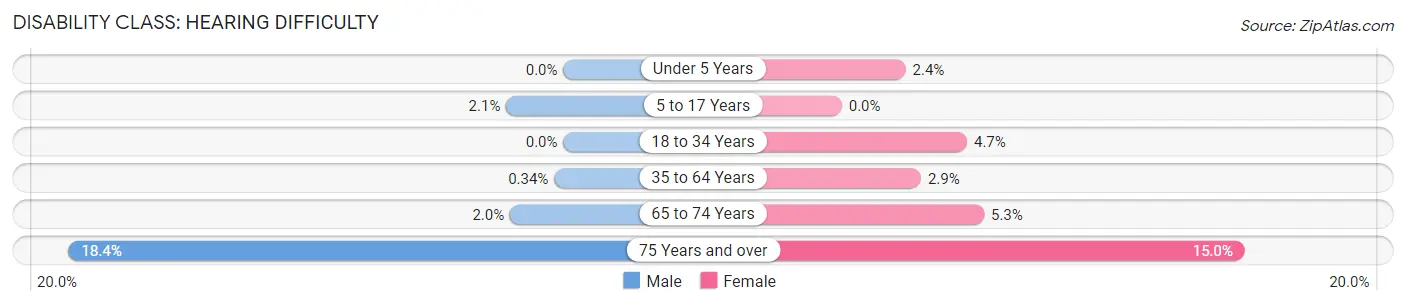
| Age Bracket | Male | Female |
| Under 5 Years | 0 (0.0%) | 18 (2.4%) |
| 5 to 17 Years | 48 (2.1%) | 0 (0.0%) |
| 18 to 34 Years | 0 (0.0%) | 81 (4.6%) |
| 35 to 64 Years | 17 (0.3%) | 156 (2.9%) |
| 65 to 74 Years | 14 (2.0%) | 42 (5.3%) |
| 75 Years and over | 79 (18.4%) | 140 (15.0%) |
Disability Class: Vision Difficulty
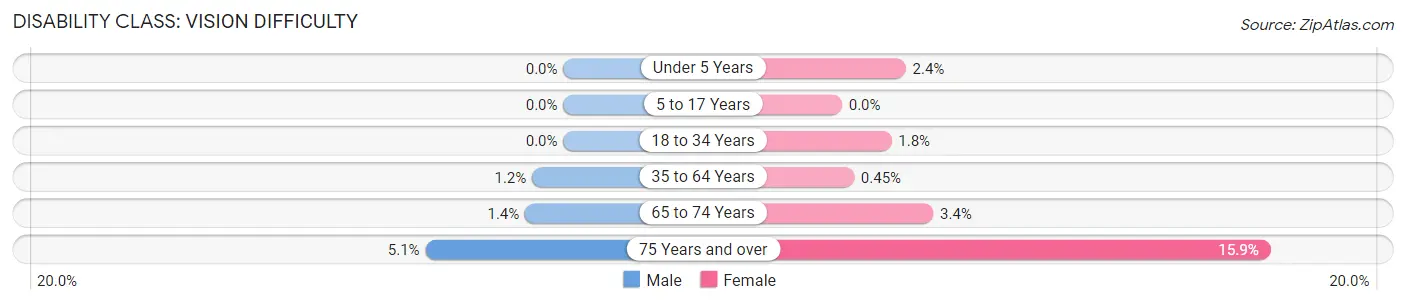
| Age Bracket | Male | Female |
| Under 5 Years | 0 (0.0%) | 18 (2.4%) |
| 5 to 17 Years | 0 (0.0%) | 0 (0.0%) |
| 18 to 34 Years | 0 (0.0%) | 32 (1.8%) |
| 35 to 64 Years | 58 (1.2%) | 24 (0.4%) |
| 65 to 74 Years | 10 (1.4%) | 27 (3.4%) |
| 75 Years and over | 22 (5.1%) | 149 (15.9%) |
Disability Class: Cognitive Difficulty
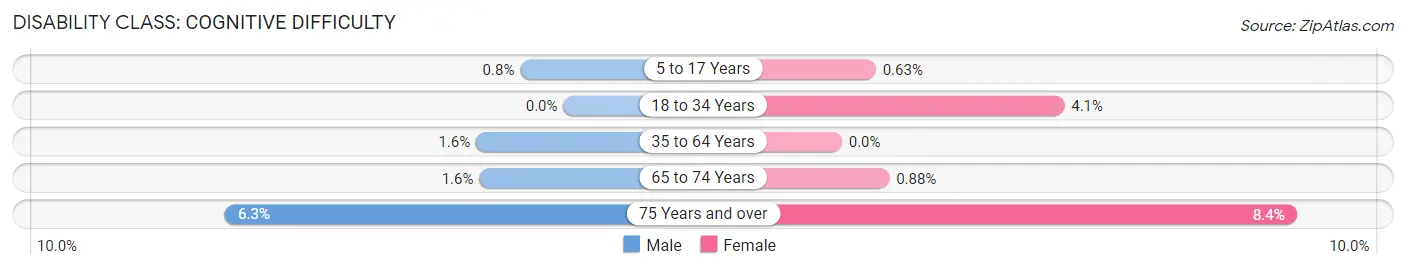
| Age Bracket | Male | Female |
| 5 to 17 Years | 18 (0.8%) | 14 (0.6%) |
| 18 to 34 Years | 0 (0.0%) | 72 (4.1%) |
| 35 to 64 Years | 81 (1.6%) | 0 (0.0%) |
| 65 to 74 Years | 11 (1.6%) | 7 (0.9%) |
| 75 Years and over | 27 (6.3%) | 79 (8.4%) |
Disability Class: Ambulatory Difficulty
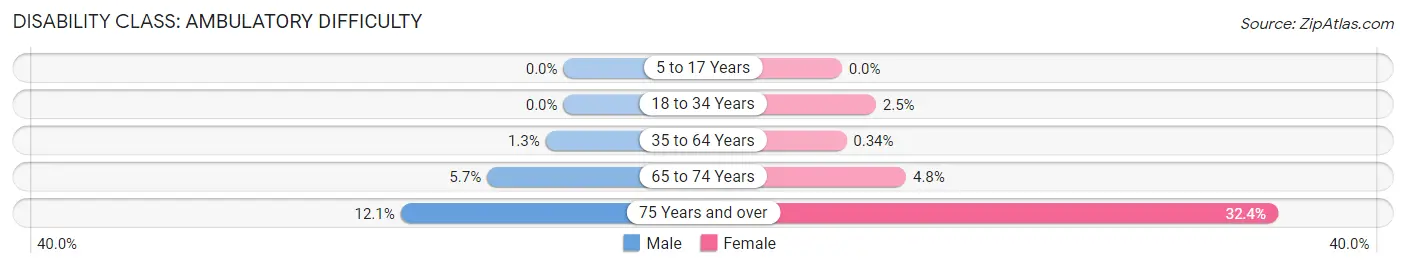
| Age Bracket | Male | Female |
| 5 to 17 Years | 0 (0.0%) | 0 (0.0%) |
| 18 to 34 Years | 0 (0.0%) | 44 (2.5%) |
| 35 to 64 Years | 66 (1.3%) | 18 (0.3%) |
| 65 to 74 Years | 40 (5.7%) | 38 (4.8%) |
| 75 Years and over | 52 (12.1%) | 303 (32.4%) |
Disability Class: Self-Care Difficulty
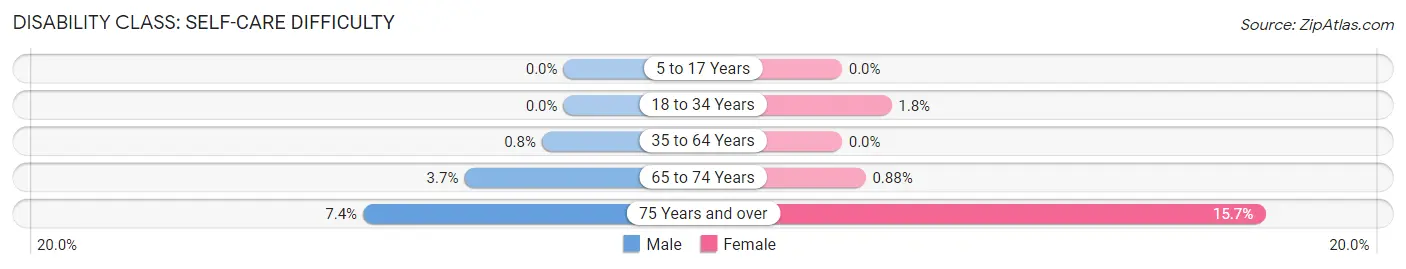
| Age Bracket | Male | Female |
| 5 to 17 Years | 0 (0.0%) | 0 (0.0%) |
| 18 to 34 Years | 0 (0.0%) | 32 (1.8%) |
| 35 to 64 Years | 40 (0.8%) | 0 (0.0%) |
| 65 to 74 Years | 26 (3.7%) | 7 (0.9%) |
| 75 Years and over | 32 (7.4%) | 147 (15.7%) |
Technology Access in Summit
Computing Device Access in Summit
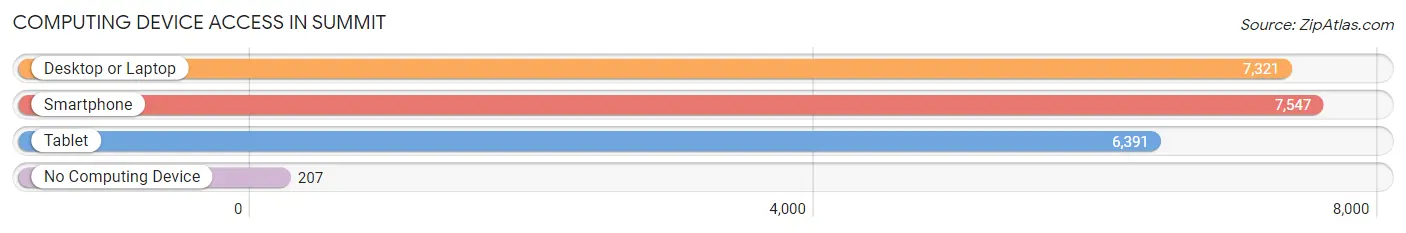
| Device Type | # Households | % Households |
| Desktop or Laptop | 7,321 | 92.2% |
| Smartphone | 7,547 | 95.0% |
| Tablet | 6,391 | 80.4% |
| No Computing Device | 207 | 2.6% |
| Total | 7,944 | 100.0% |
Internet Access in Summit
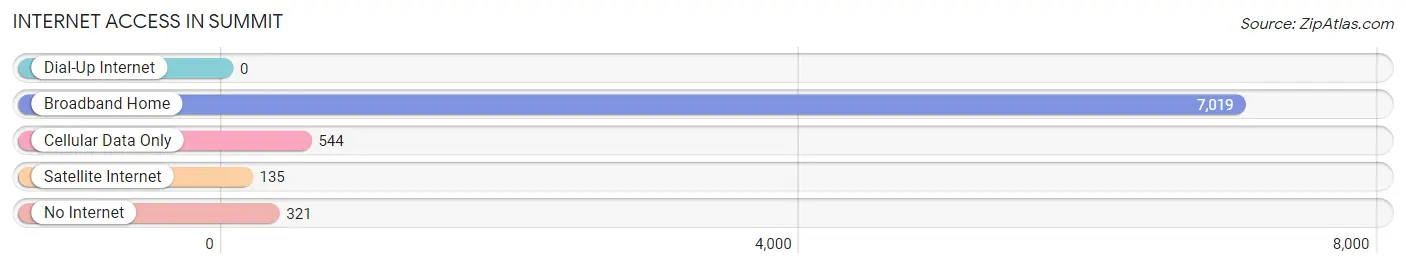
| Internet Type | # Households | % Households |
| Dial-Up Internet | 0 | 0.0% |
| Broadband Home | 7,019 | 88.4% |
| Cellular Data Only | 544 | 6.9% |
| Satellite Internet | 135 | 1.7% |
| No Internet | 321 | 4.0% |
| Total | 7,944 | 100.0% |
Summit Summary
Summit is a city located in Union County, New Jersey, United States. As of the 2010 United States Census, the city's population was 21,457, reflecting an increase of 326 (+1.5%) from the 21,131 counted in the 2000 Census, which had in turn increased by 1,374 (+7.0%) from the 19,757 counted in the 1990 Census.
History
Summit was incorporated as a city by an act of the New Jersey Legislature on March 23, 1899, from portions of New Providence Township (now Berkeley Heights) and Springfield Township. During the late nineteenth century, Summit served as a "bedroom community" for its more industrialized neighbors.
In the 18th century, the area that is now Summit was part of Springfield Township, which was formed in 1794. Summit and New Providence separated from Springfield and were incorporated as separate municipalities in 1869.
Geography
Summit is located at 40°42′37″N 74°24′44″W (40.710202, -74.412093). According to the United States Census Bureau, the city had a total area of 6.739 square miles (17.459 km2), including 6.735 square miles (17.448 km2) of land and 0.004 square miles (0.011 km2) of water (0.06%).
Summit borders the Union County municipalities of Berkeley Heights, Chatham, New Providence, and Springfield.
Economy
Summit is a suburban city with a diverse economy. The city is home to a variety of businesses, including financial services, retail, and professional services. The city is also home to several corporate headquarters, including Celgene Corporation, a biopharmaceutical company, and Merck & Co., a pharmaceutical company.
Demographics
As of the 2010 United States Census, there were 21,457 people, 8,619 households, and 5,719.9 families residing in the city. The population density was 3,185.2 per square mile (1,227.3/km2). There were 9,084 housing units at an average density of 1,346.2 per square mile (520.2/km2). The racial makeup of the city was 81.6% White, 4.2% African American, 0.1% Native American, 10.7% Asian, 0.1% Pacific Islander, 1.6% from other races, and 2.0% from two or more races. Hispanic or Latino of any race were 6.2% of the population.
There were 8,619 households, out of which 32.2% had children under the age of 18 living with them, 54.3% were married couples living together, 8.7% had a female householder with no husband present, and 33.7% were non-families. 28.7% of all households were made up of individuals, and 12.2% had someone living alone who was 65 years of age or older. The average household size was 2.47 and the average family size was 3.11.
In the city, the population was spread out, with 24.2% under the age of 18, 5.6% from 18 to 24, 25.2% from 25 to 44, 28.2% from 45 to 64, and 16.8% who were 65 years of age or older. The median age was 41.2 years. For every 100 females, there were 89.3 males. For every 100 females ages 18 and older there were 85.7 males.
The median income for a household in the city was $101,872, and the median income for a family was $126,985. Males had a median income of $77,308 versus $52,643 for females. The per capita income for the city was $53,902. About 2.6% of families and 4.5% of the population were below the poverty line, including 4.3% of those under age 18 and 5.5% of those age 65 or over.
Common Questions
What is Per Capita Income in Summit?
Per Capita income in Summit is $104,469.
What is the Median Family Income in Summit?
Median Family Income in Summit is $242,235.
What is the Median Household income in Summit?
Median Household Income in Summit is $176,702.
What is Income or Wage Gap in Summit?
Income or Wage Gap in Summit is 51.0%.
Women in Summit earn 49.0 cents for every dollar earned by a man.
What is Inequality or Gini Index in Summit?
Inequality or Gini Index in Summit is 0.52.
What is the Total Population of Summit?
Total Population of Summit is 22,555.
What is the Total Male Population of Summit?
Total Male Population of Summit is 10,768.
What is the Total Female Population of Summit?
Total Female Population of Summit is 11,787.
What is the Ratio of Males per 100 Females in Summit?
There are 91.35 Males per 100 Females in Summit.
What is the Ratio of Females per 100 Males in Summit?
There are 109.46 Females per 100 Males in Summit.
What is the Median Population Age in Summit?
Median Population Age in Summit is 40.5 Years.
What is the Average Family Size in Summit
Average Family Size in Summit is 3.3 People.
What is the Average Household Size in Summit
Average Household Size in Summit is 2.8 People.
How Large is the Labor Force in Summit?
There are 12,201 People in the Labor Forcein in Summit.
What is the Percentage of People in the Labor Force in Summit?
69.6% of People are in the Labor Force in Summit.
What is the Unemployment Rate in Summit?
Unemployment Rate in Summit is 5.7%.