Dundee, FL Map & Demographics
Dundee Map
Dundee Overview
$17,659
PER CAPITA INCOME
$52,912
AVG FAMILY INCOME
$44,936
AVG HOUSEHOLD INCOME
1.8%
WAGE / INCOME GAP [ % ]
98.2¢/ $1
WAGE / INCOME GAP [ $ ]
$9,740
FAMILY INCOME DEFICIT
0.40
INEQUALITY / GINI INDEX
5,373
TOTAL POPULATION
2,877
MALE POPULATION
2,496
FEMALE POPULATION
115.26
MALES / 100 FEMALES
86.76
FEMALES / 100 MALES
32.6
MEDIAN AGE
3.7
AVG FAMILY SIZE
3.3
AVG HOUSEHOLD SIZE
2,200
LABOR FORCE [ PEOPLE ]
54.0%
PERCENT IN LABOR FORCE
0.2%
UNEMPLOYMENT RATE
Dundee Zip Codes
Dundee Area Codes
Income in Dundee
Income Overview in Dundee
Per Capita Income in Dundee is $17,659, while median incomes of families and households are $52,912 and $44,936 respectively.
| Characteristic | Number | Measure |
| Per Capita Income | 5,373 | $17,659 |
| Median Family Income | 1,322 | $52,912 |
| Mean Family Income | 1,322 | $54,394 |
| Median Household Income | 1,629 | $44,936 |
| Mean Household Income | 1,629 | $51,929 |
| Income Deficit | 1,322 | $9,740 |
| Wage / Income Gap (%) | 5,373 | 1.83% |
| Wage / Income Gap ($) | 5,373 | 98.17¢ per $1 |
| Gini / Inequality Index | 5,373 | 0.40 |
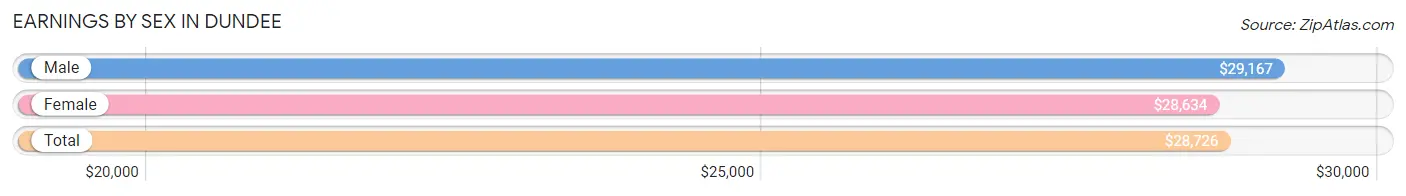
Earnings by Sex in Dundee
Average Earnings in Dundee are $28,726, $29,167 for men and $28,634 for women, a difference of 1.8%.
| Sex | Number | Average Earnings |
| Male | 1,358 (59.4%) | $29,167 |
| Female | 929 (40.6%) | $28,634 |
| Total | 2,287 (100.0%) | $28,726 |
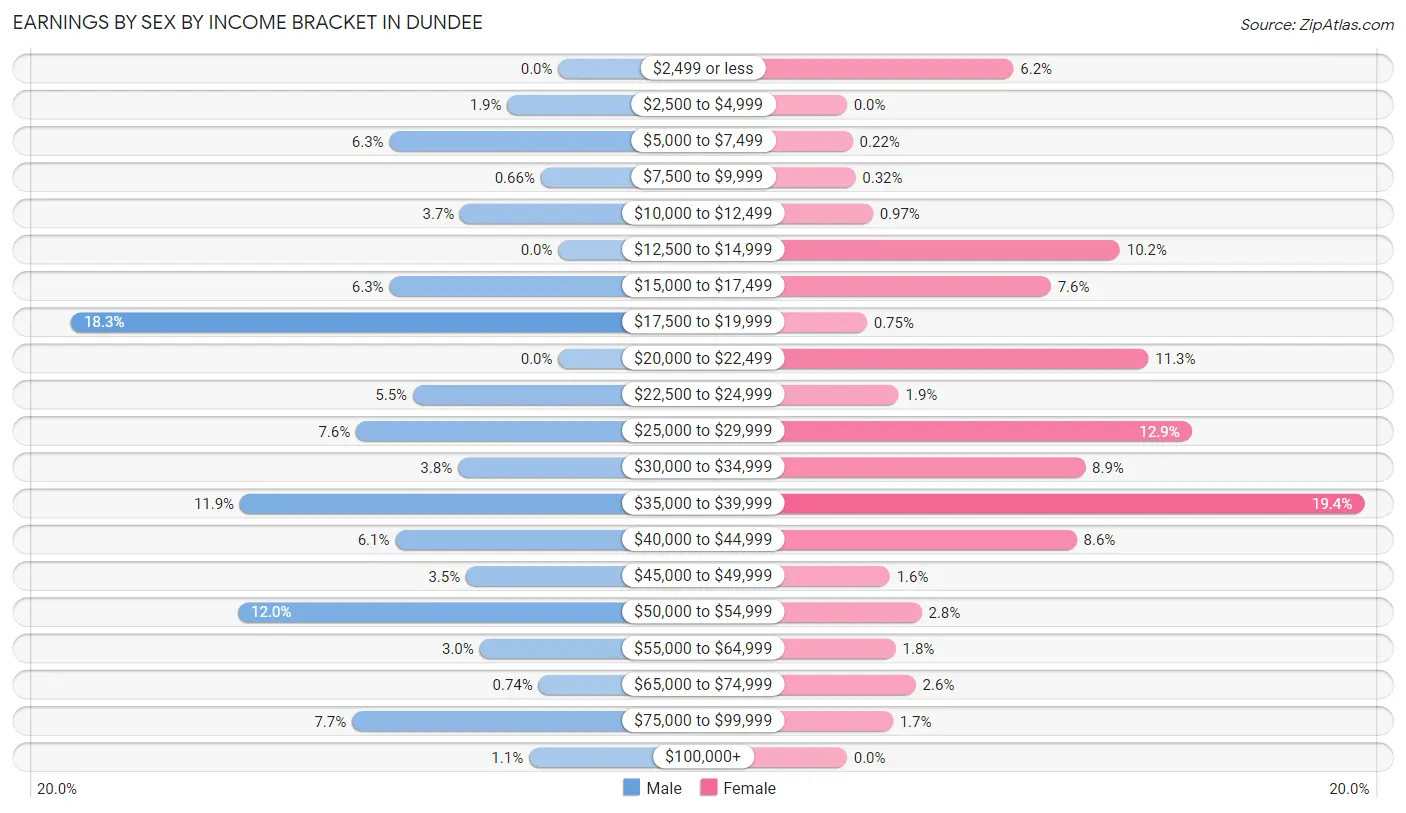
Earnings by Sex by Income Bracket in Dundee
The most common earnings brackets in Dundee are $17,500 to $19,999 for men (248 | 18.3%) and $35,000 to $39,999 for women (180 | 19.4%).
| Income | Male | Female |
| $2,499 or less | 0 (0.0%) | 58 (6.2%) |
| $2,500 to $4,999 | 26 (1.9%) | 0 (0.0%) |
| $5,000 to $7,499 | 86 (6.3%) | 2 (0.2%) |
| $7,500 to $9,999 | 9 (0.7%) | 3 (0.3%) |
| $10,000 to $12,499 | 50 (3.7%) | 9 (1.0%) |
| $12,500 to $14,999 | 0 (0.0%) | 95 (10.2%) |
| $15,000 to $17,499 | 86 (6.3%) | 71 (7.6%) |
| $17,500 to $19,999 | 248 (18.3%) | 7 (0.7%) |
| $20,000 to $22,499 | 0 (0.0%) | 105 (11.3%) |
| $22,500 to $24,999 | 74 (5.4%) | 18 (1.9%) |
| $25,000 to $29,999 | 103 (7.6%) | 120 (12.9%) |
| $30,000 to $34,999 | 51 (3.8%) | 83 (8.9%) |
| $35,000 to $39,999 | 162 (11.9%) | 180 (19.4%) |
| $40,000 to $44,999 | 83 (6.1%) | 80 (8.6%) |
| $45,000 to $49,999 | 47 (3.5%) | 15 (1.6%) |
| $50,000 to $54,999 | 163 (12.0%) | 26 (2.8%) |
| $55,000 to $64,999 | 40 (2.9%) | 17 (1.8%) |
| $65,000 to $74,999 | 10 (0.7%) | 24 (2.6%) |
| $75,000 to $99,999 | 105 (7.7%) | 16 (1.7%) |
| $100,000+ | 15 (1.1%) | 0 (0.0%) |
| Total | 1,358 (100.0%) | 929 (100.0%) |
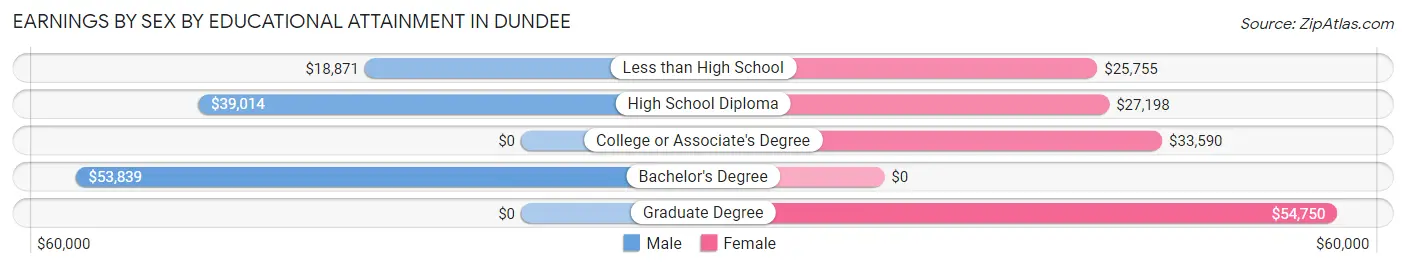
Earnings by Sex by Educational Attainment in Dundee
Average earnings in Dundee are $34,535 for men and $30,288 for women, a difference of 12.3%. Men with an educational attainment of bachelor's degree enjoy the highest average annual earnings of $53,839, while those with less than high school education earn the least with $18,871. Women with an educational attainment of graduate degree earn the most with the average annual earnings of $54,750, while those with less than high school education have the smallest earnings of $25,755.
| Educational Attainment | Male Income | Female Income |
| Less than High School | $18,871 | $25,755 |
| High School Diploma | $39,014 | $27,198 |
| College or Associate's Degree | - | - |
| Bachelor's Degree | $53,839 | $0 |
| Graduate Degree | - | - |
| Total | $34,535 | $30,288 |
Family Income in Dundee
Family Income Brackets in Dundee
According to the Dundee family income data, there are 527 families falling into the $50,000 to $74,999 income range, which is the most common income bracket and makes up 39.9% of all families.
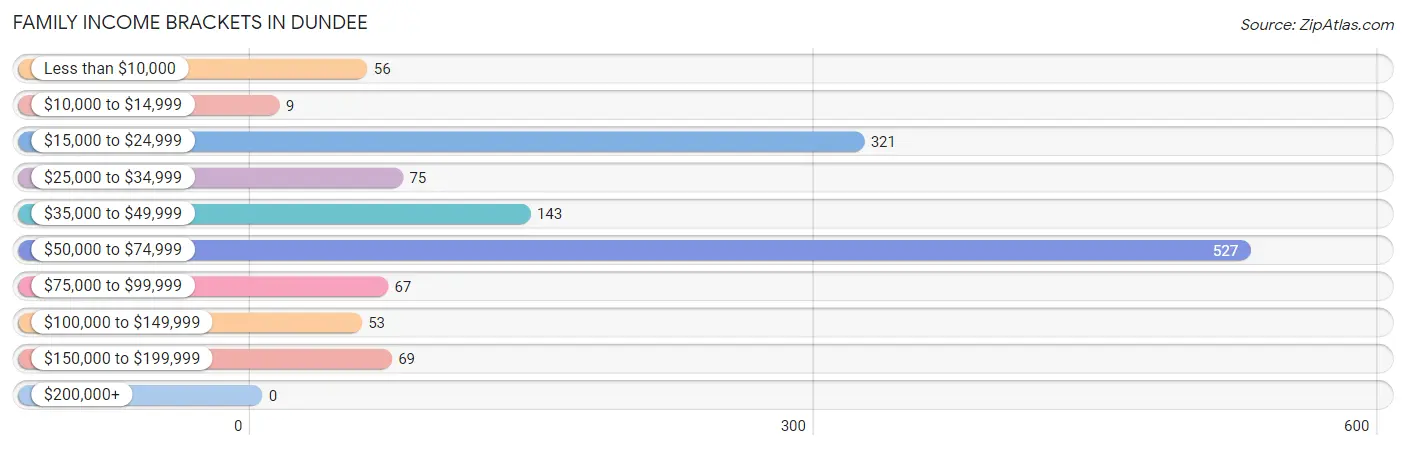
| Income Bracket | # Families | % Families |
| Less than $10,000 | 56 | 4.2% |
| $10,000 to $14,999 | 9 | 0.7% |
| $15,000 to $24,999 | 321 | 24.3% |
| $25,000 to $34,999 | 75 | 5.7% |
| $35,000 to $49,999 | 143 | 10.8% |
| $50,000 to $74,999 | 527 | 39.9% |
| $75,000 to $99,999 | 67 | 5.1% |
| $100,000 to $149,999 | 53 | 4.0% |
| $150,000 to $199,999 | 69 | 5.2% |
| $200,000+ | 0 | 0.0% |
Family Income by Famaliy Size in Dundee
5-person families (85 | 6.4%) account for the highest median family income in Dundee with $58,472 per family, while 2-person families (521 | 39.4%) have the highest median income of $22,287 per family member.
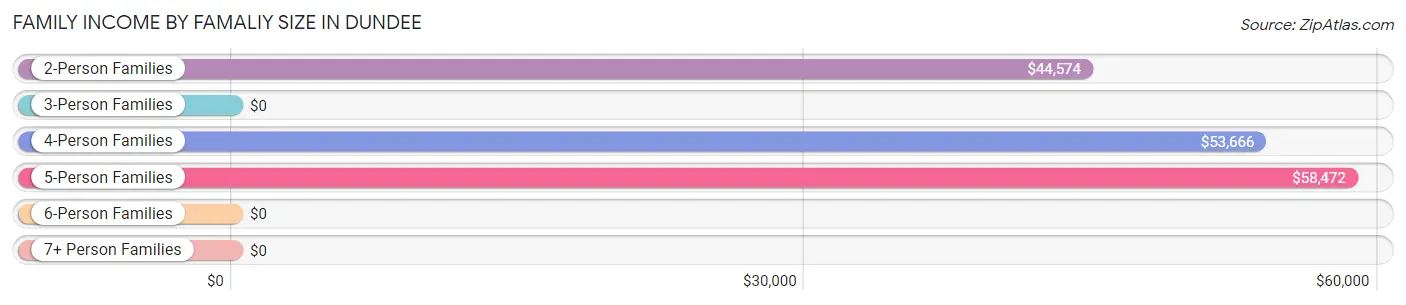
| Income Bracket | # Families | Median Income |
| 2-Person Families | 521 (39.4%) | $44,574 |
| 3-Person Families | 169 (12.8%) | $0 |
| 4-Person Families | 467 (35.3%) | $53,666 |
| 5-Person Families | 85 (6.4%) | $58,472 |
| 6-Person Families | 0 (0.0%) | $0 |
| 7+ Person Families | 80 (6.0%) | $0 |
| Total | 1,322 (100.0%) | $52,912 |
Family Income by Number of Earners in Dundee
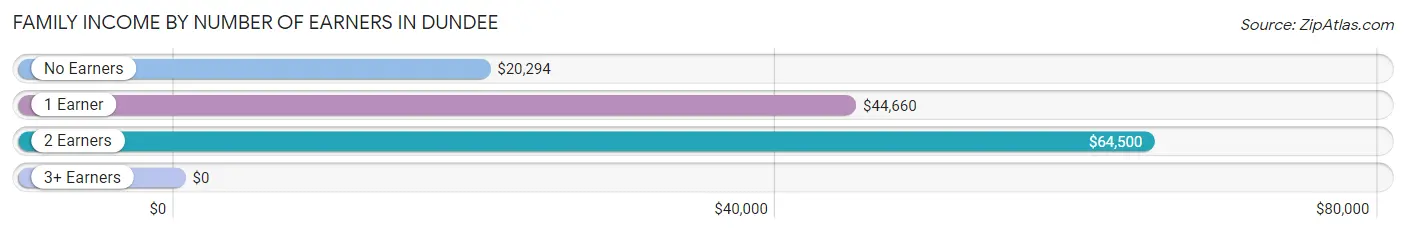
| Number of Earners | # Families | Median Income |
| No Earners | 278 (21.0%) | $20,294 |
| 1 Earner | 522 (39.5%) | $44,660 |
| 2 Earners | 432 (32.7%) | $64,500 |
| 3+ Earners | 90 (6.8%) | $0 |
| Total | 1,322 (100.0%) | $52,912 |
Household Income in Dundee
Household Income Brackets in Dundee
With 492 households falling in the category, the $50,000 to $74,999 income range is the most frequent in Dundee, accounting for 30.2% of all households.
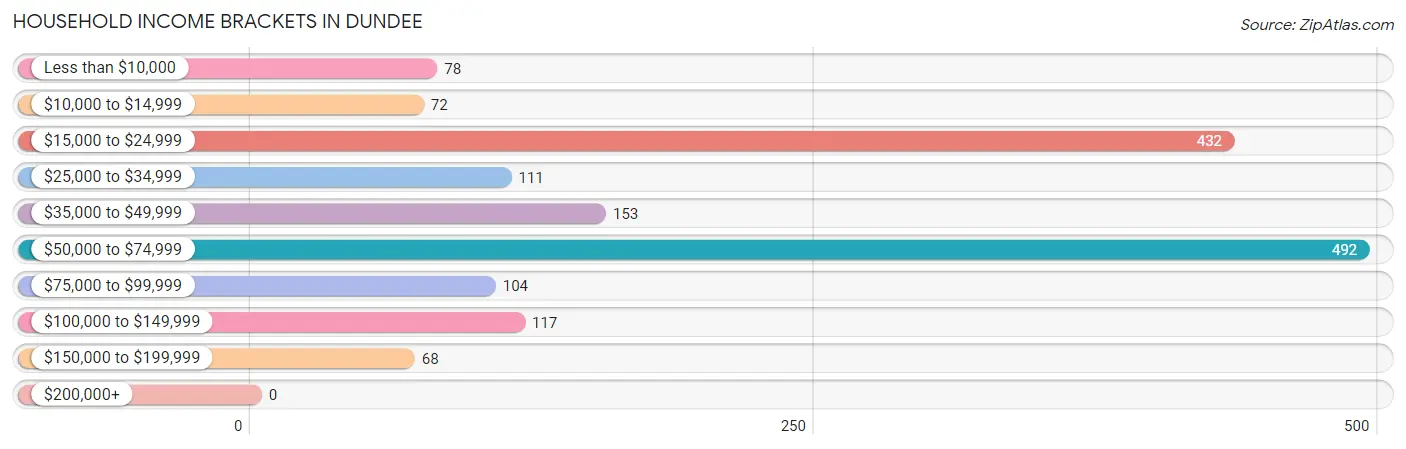
| Income Bracket | # Households | % Households |
| Less than $10,000 | 78 | 4.8% |
| $10,000 to $14,999 | 72 | 4.4% |
| $15,000 to $24,999 | 432 | 26.5% |
| $25,000 to $34,999 | 111 | 6.8% |
| $35,000 to $49,999 | 153 | 9.4% |
| $50,000 to $74,999 | 492 | 30.2% |
| $75,000 to $99,999 | 104 | 6.4% |
| $100,000 to $149,999 | 117 | 7.2% |
| $150,000 to $199,999 | 68 | 4.2% |
| $200,000+ | 0 | 0.0% |
Household Income by Householder Age in Dundee
The median household income in Dundee is $44,936, with the highest median household income of $55,114 found in the 45 to 64 years age bracket for the primary householder. A total of 554 households (34.0%) fall into this category. Meanwhile, the 15 to 24 years age bracket for the primary householder has the lowest median household income of $0, with 26 households (1.6%) in this group.
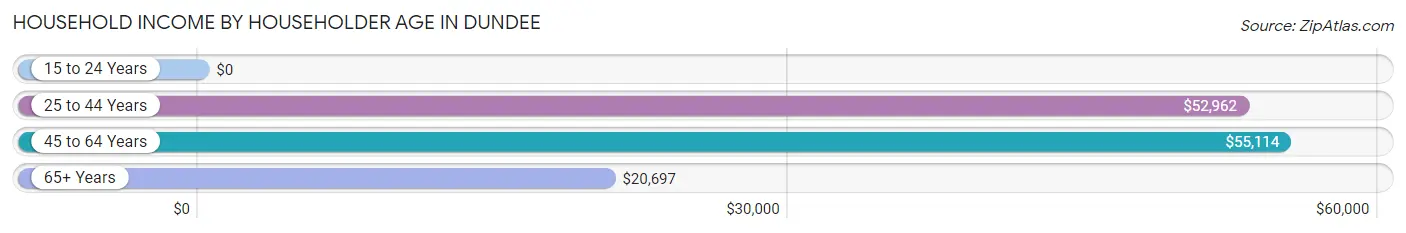
| Income Bracket | # Households | Median Income |
| 15 to 24 Years | 26 (1.6%) | $0 |
| 25 to 44 Years | 570 (35.0%) | $52,962 |
| 45 to 64 Years | 554 (34.0%) | $55,114 |
| 65+ Years | 479 (29.4%) | $20,697 |
| Total | 1,629 (100.0%) | $44,936 |
Poverty in Dundee
Income Below Poverty by Sex and Age in Dundee
With 28.7% poverty level for males and 21.5% for females among the residents of Dundee, 15 year old males and 12 to 14 year old females are the most vulnerable to poverty, with 7 males (100.0%) and 42 females (100.0%) in their respective age groups living below the poverty level.
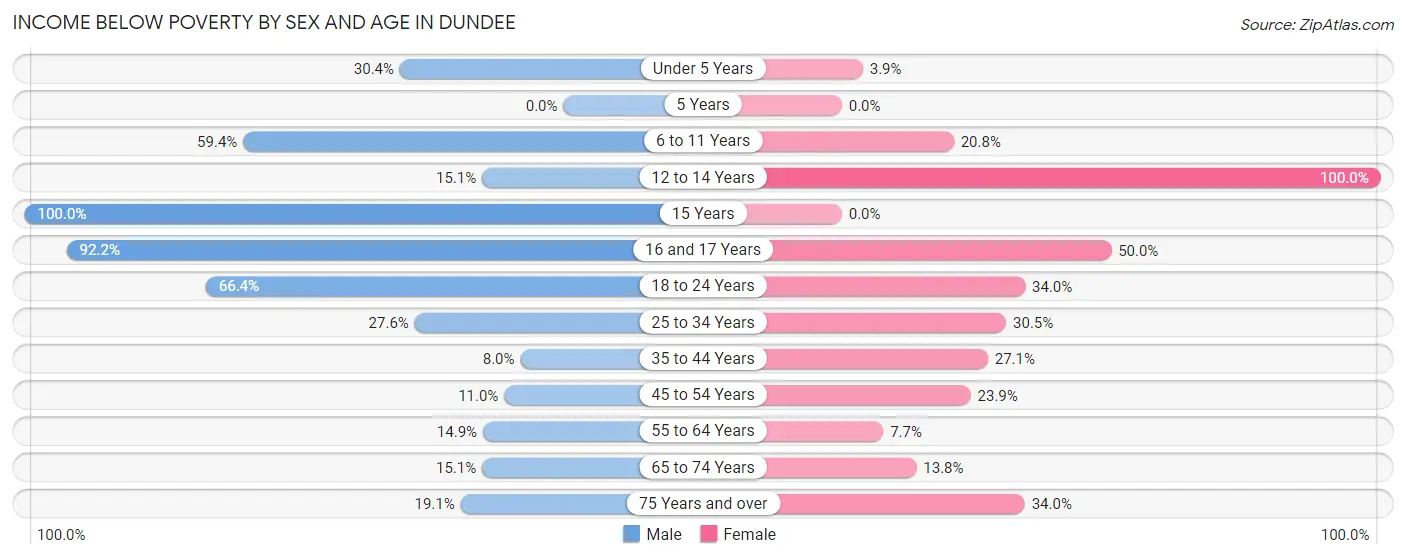
| Age Bracket | Male | Female |
| Under 5 Years | 78 (30.3%) | 15 (3.9%) |
| 5 Years | 0 (0.0%) | 0 (0.0%) |
| 6 to 11 Years | 145 (59.4%) | 48 (20.8%) |
| 12 to 14 Years | 16 (15.1%) | 42 (100.0%) |
| 15 Years | 7 (100.0%) | 0 (0.0%) |
| 16 and 17 Years | 59 (92.2%) | 8 (50.0%) |
| 18 to 24 Years | 138 (66.3%) | 65 (34.0%) |
| 25 to 34 Years | 228 (27.6%) | 165 (30.5%) |
| 35 to 44 Years | 19 (8.0%) | 42 (27.1%) |
| 45 to 54 Years | 19 (11.0%) | 71 (23.9%) |
| 55 to 64 Years | 40 (14.9%) | 22 (7.7%) |
| 65 to 74 Years | 51 (15.1%) | 40 (13.8%) |
| 75 Years and over | 25 (19.1%) | 18 (34.0%) |
| Total | 825 (28.7%) | 536 (21.5%) |
Income Above Poverty by Sex and Age in Dundee
According to the poverty statistics in Dundee, males aged 5 years and females aged 5 years are the age groups that are most secure financially, with 100.0% of males and 100.0% of females in these age groups living above the poverty line.
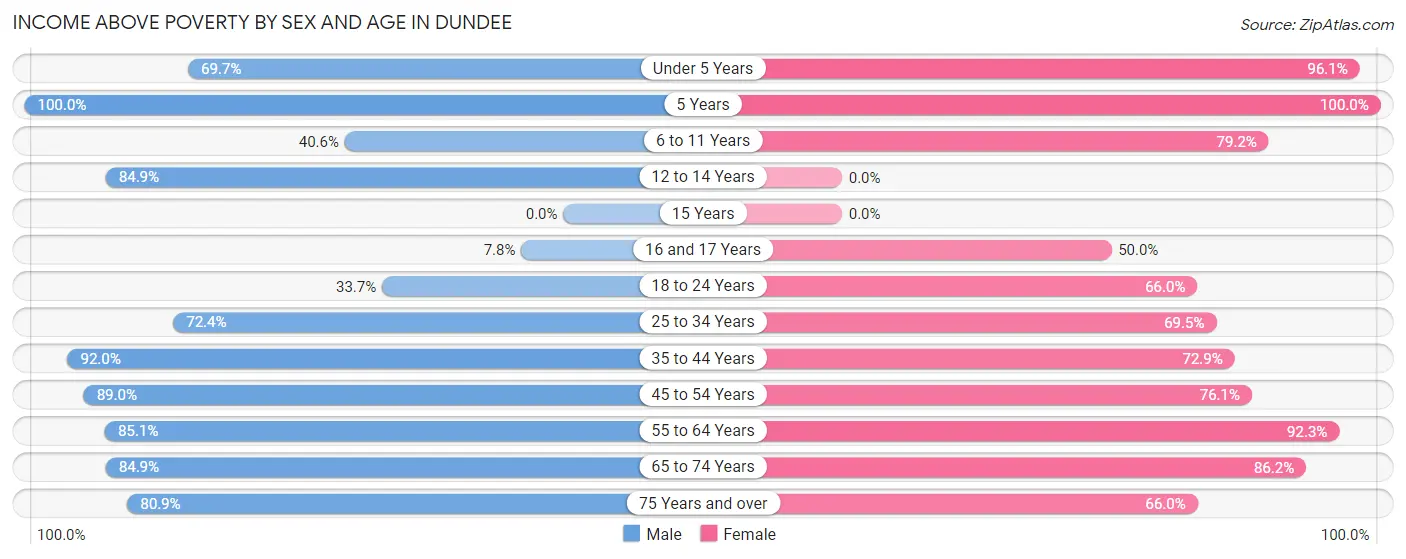
| Age Bracket | Male | Female |
| Under 5 Years | 179 (69.7%) | 370 (96.1%) |
| 5 Years | 17 (100.0%) | 10 (100.0%) |
| 6 to 11 Years | 99 (40.6%) | 183 (79.2%) |
| 12 to 14 Years | 90 (84.9%) | 0 (0.0%) |
| 15 Years | 0 (0.0%) | 0 (0.0%) |
| 16 and 17 Years | 5 (7.8%) | 8 (50.0%) |
| 18 to 24 Years | 70 (33.7%) | 126 (66.0%) |
| 25 to 34 Years | 598 (72.4%) | 376 (69.5%) |
| 35 to 44 Years | 219 (92.0%) | 113 (72.9%) |
| 45 to 54 Years | 154 (89.0%) | 226 (76.1%) |
| 55 to 64 Years | 228 (85.1%) | 264 (92.3%) |
| 65 to 74 Years | 287 (84.9%) | 249 (86.2%) |
| 75 Years and over | 106 (80.9%) | 35 (66.0%) |
| Total | 2,052 (71.3%) | 1,960 (78.5%) |
Income Below Poverty Among Married-Couple Families in Dundee
The poverty statistics for married-couple families in Dundee show that 15.7% or 146 of the total 928 families live below the poverty line. Families with 3 or 4 children have the highest poverty rate of 40.4%, comprising of 19 families. On the other hand, families with no children have the lowest poverty rate of 1.6%, which includes 9 families.
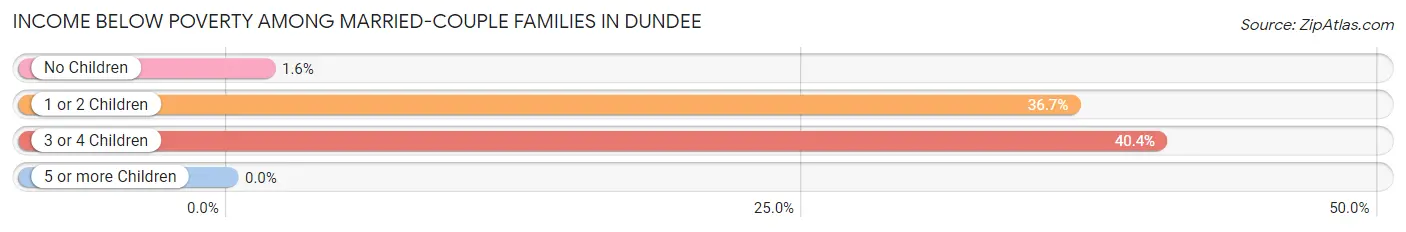
| Children | Above Poverty | Below Poverty |
| No Children | 550 (98.4%) | 9 (1.6%) |
| 1 or 2 Children | 204 (63.3%) | 118 (36.6%) |
| 3 or 4 Children | 28 (59.6%) | 19 (40.4%) |
| 5 or more Children | 0 (0.0%) | 0 (0.0%) |
| Total | 782 (84.3%) | 146 (15.7%) |
Income Below Poverty Among Single-Parent Households in Dundee
According to the poverty data in Dundee, 30.4% or 41 single-father households and 34.0% or 88 single-mother households are living below the poverty line. Among single-father households, those with 1 or 2 children have the highest poverty rate, with 34 households (42.5%) experiencing poverty. Likewise, among single-mother households, those with 3 or 4 children have the highest poverty rate, with 7 households (100.0%) falling below the poverty line.
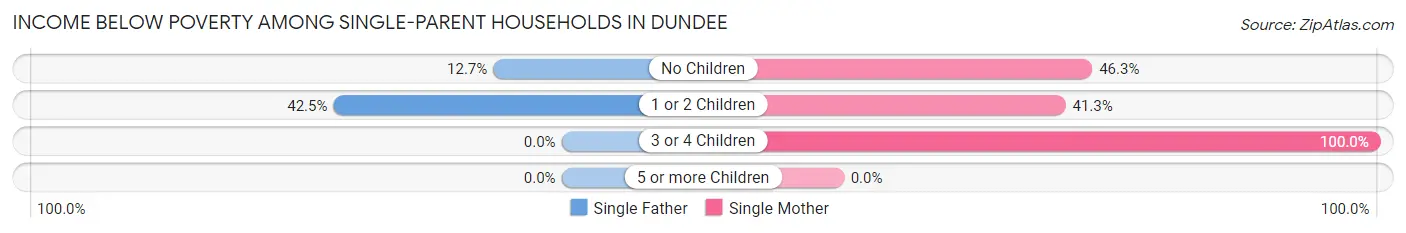
| Children | Single Father | Single Mother |
| No Children | 7 (12.7%) | 50 (46.3%) |
| 1 or 2 Children | 34 (42.5%) | 31 (41.3%) |
| 3 or 4 Children | 0 (0.0%) | 7 (100.0%) |
| 5 or more Children | 0 (0.0%) | 0 (0.0%) |
| Total | 41 (30.4%) | 88 (34.0%) |
Income Below Poverty Among Married-Couple vs Single-Parent Households in Dundee
The poverty data for Dundee shows that 146 of the married-couple family households (15.7%) and 129 of the single-parent households (32.7%) are living below the poverty level. Within the married-couple family households, those with 3 or 4 children have the highest poverty rate, with 19 households (40.4%) falling below the poverty line. Among the single-parent households, those with 3 or 4 children have the highest poverty rate, with 7 household (100.0%) living below poverty.
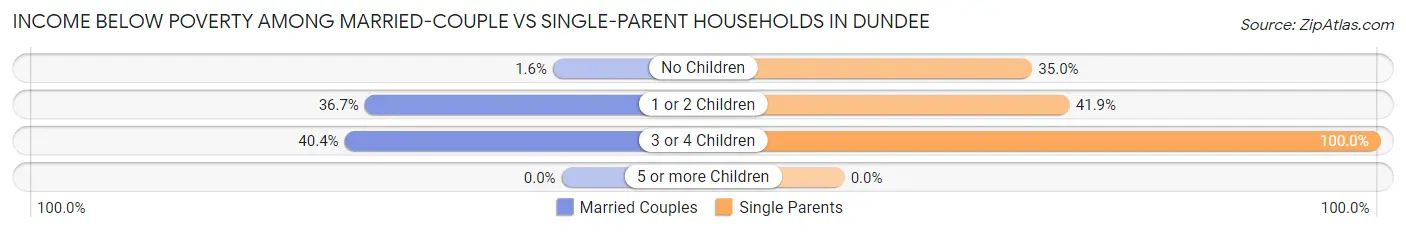
| Children | Married-Couple Families | Single-Parent Households |
| No Children | 9 (1.6%) | 57 (35.0%) |
| 1 or 2 Children | 118 (36.6%) | 65 (41.9%) |
| 3 or 4 Children | 19 (40.4%) | 7 (100.0%) |
| 5 or more Children | 0 (0.0%) | 0 (0.0%) |
| Total | 146 (15.7%) | 129 (32.7%) |
Race in Dundee
The most populous races in Dundee are Hispanic or Latino (2,969 | 55.3%), White / Caucasian (2,106 | 39.2%), and Some other Race (1,730 | 32.2%).
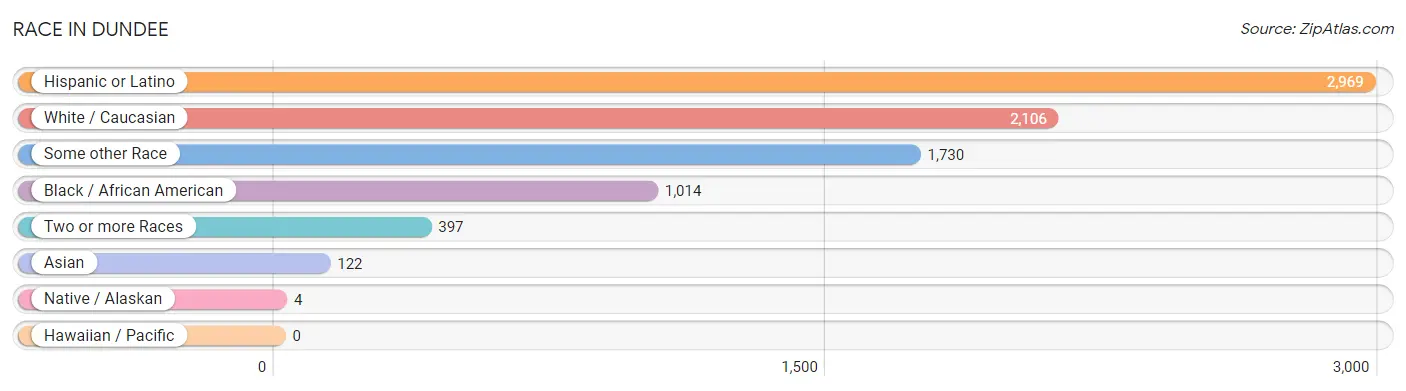
| Race | # Population | % Population |
| Asian | 122 | 2.3% |
| Black / African American | 1,014 | 18.9% |
| Hawaiian / Pacific | 0 | 0.0% |
| Hispanic or Latino | 2,969 | 55.3% |
| Native / Alaskan | 4 | 0.1% |
| White / Caucasian | 2,106 | 39.2% |
| Two or more Races | 397 | 7.4% |
| Some other Race | 1,730 | 32.2% |
| Total | 5,373 | 100.0% |
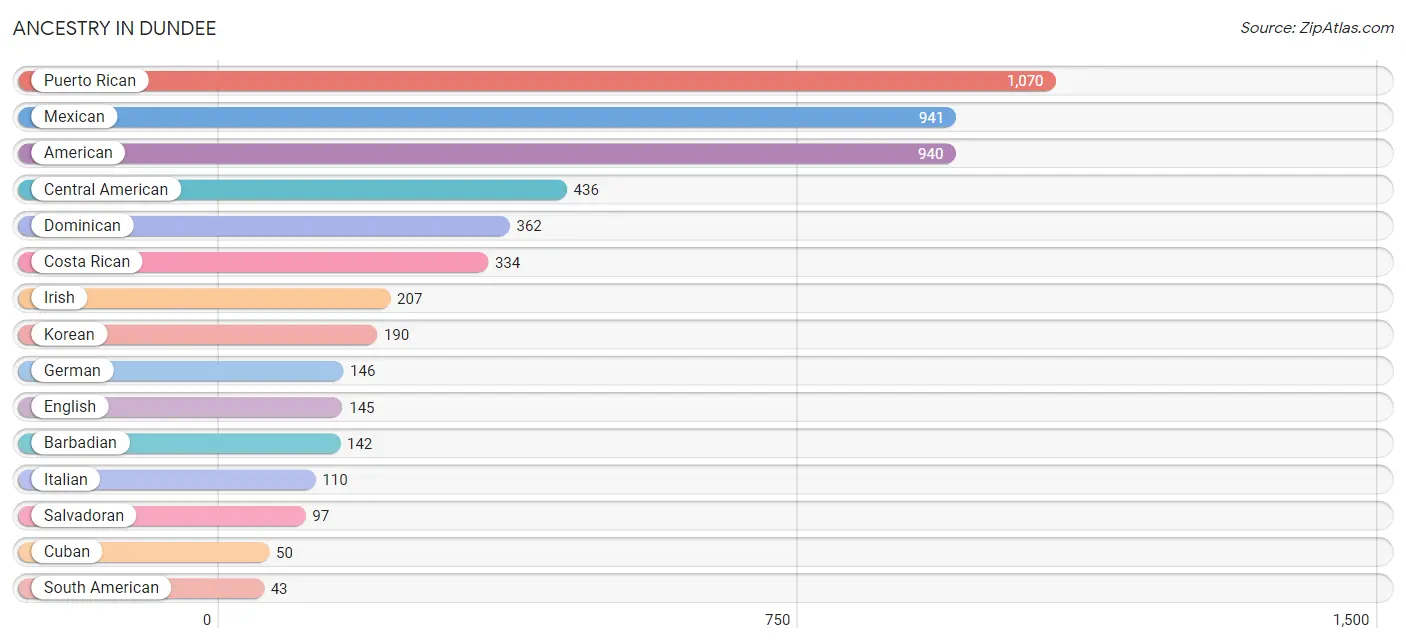
Ancestry in Dundee
The most populous ancestries reported in Dundee are Puerto Rican (1,070 | 19.9%), Mexican (941 | 17.5%), American (940 | 17.5%), Central American (436 | 8.1%), and Dominican (362 | 6.7%), together accounting for 69.8% of all Dundee residents.
| Ancestry | # Population | % Population |
| African | 5 | 0.1% |
| American | 940 | 17.5% |
| Arab | 9 | 0.2% |
| Barbadian | 142 | 2.6% |
| Belizean | 17 | 0.3% |
| British | 9 | 0.2% |
| Canadian | 5 | 0.1% |
| Central American | 436 | 8.1% |
| Central American Indian | 4 | 0.1% |
| Cherokee | 8 | 0.2% |
| Chilean | 23 | 0.4% |
| Costa Rican | 334 | 6.2% |
| Cuban | 50 | 0.9% |
| Dominican | 362 | 6.7% |
| Ecuadorian | 20 | 0.4% |
| English | 145 | 2.7% |
| French | 5 | 0.1% |
| French American Indian | 8 | 0.2% |
| French Canadian | 5 | 0.1% |
| German | 146 | 2.7% |
| Guyanese | 12 | 0.2% |
| Irish | 207 | 3.8% |
| Italian | 110 | 2.1% |
| Jamaican | 21 | 0.4% |
| Korean | 190 | 3.5% |
| Lithuanian | 19 | 0.4% |
| Mexican | 941 | 17.5% |
| Nicaraguan | 5 | 0.1% |
| Norwegian | 17 | 0.3% |
| Polish | 9 | 0.2% |
| Puerto Rican | 1,070 | 19.9% |
| Russian | 20 | 0.4% |
| Salvadoran | 97 | 1.8% |
| Scotch-Irish | 5 | 0.1% |
| Scottish | 39 | 0.7% |
| South American | 43 | 0.8% |
| Subsaharan African | 5 | 0.1% |
| Swedish | 37 | 0.7% |
| Swiss | 12 | 0.2% |
| Thai | 15 | 0.3% |
| Trinidadian and Tobagonian | 9 | 0.2% |
| Ukrainian | 9 | 0.2% |
| Welsh | 25 | 0.5% | View All 43 Rows |
Immigrants in Dundee
The most numerous immigrant groups reported in Dundee came from Latin America (905 | 16.8%), Central America (655 | 12.2%), Mexico (371 | 6.9%), Caribbean (214 | 4.0%), and Costa Rica (177 | 3.3%), together accounting for 43.2% of all Dundee residents.
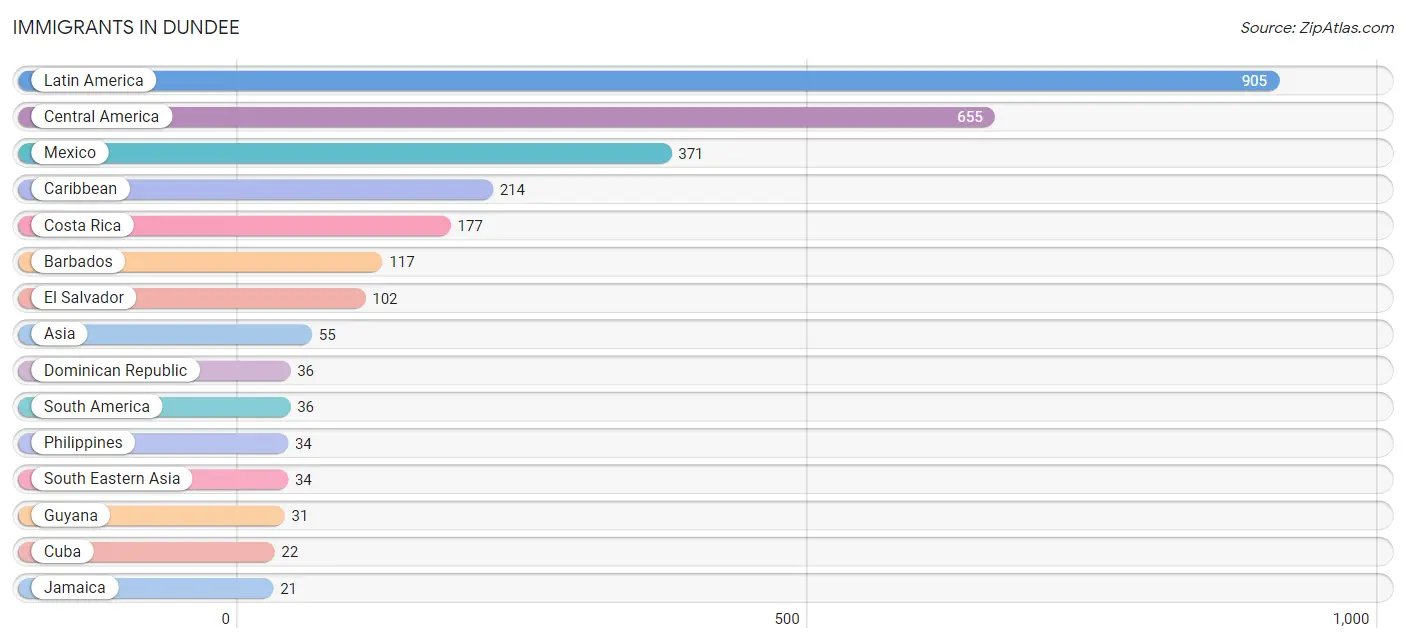
| Immigration Origin | # Population | % Population |
| Asia | 55 | 1.0% |
| Barbados | 117 | 2.2% |
| Caribbean | 214 | 4.0% |
| Central America | 655 | 12.2% |
| Costa Rica | 177 | 3.3% |
| Cuba | 22 | 0.4% |
| Dominican Republic | 36 | 0.7% |
| Ecuador | 5 | 0.1% |
| El Salvador | 102 | 1.9% |
| Europe | 9 | 0.2% |
| Guyana | 31 | 0.6% |
| Jamaica | 21 | 0.4% |
| Latin America | 905 | 16.8% |
| Mexico | 371 | 6.9% |
| Nicaragua | 5 | 0.1% |
| Northern Europe | 9 | 0.2% |
| Philippines | 34 | 0.6% |
| South America | 36 | 0.7% |
| South Eastern Asia | 34 | 0.6% |
| Trinidad and Tobago | 18 | 0.3% | View All 20 Rows |
Sex and Age in Dundee
Sex and Age in Dundee
The most populous age groups in Dundee are 30 to 34 Years (519 | 18.0%) for men and Under 5 Years (385 | 15.4%) for women.
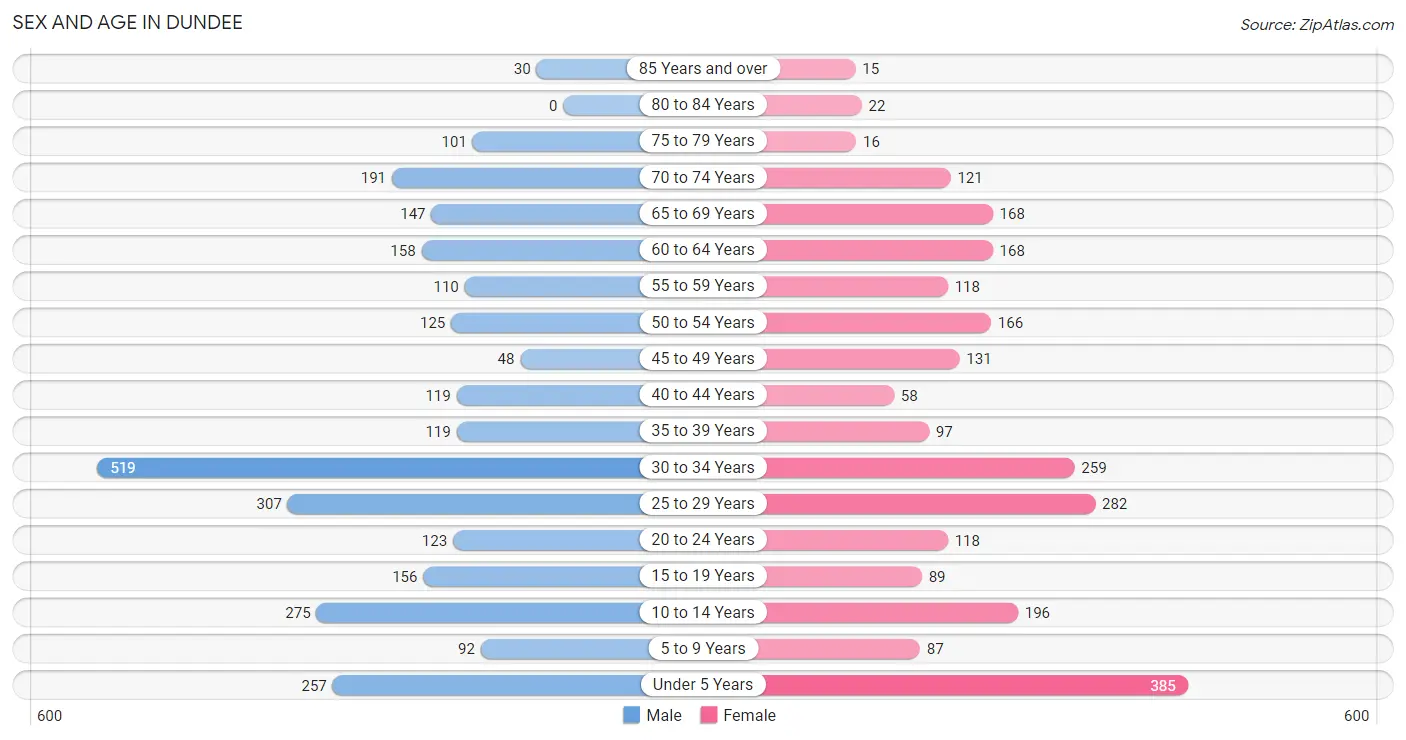
| Age Bracket | Male | Female |
| Under 5 Years | 257 (8.9%) | 385 (15.4%) |
| 5 to 9 Years | 92 (3.2%) | 87 (3.5%) |
| 10 to 14 Years | 275 (9.6%) | 196 (7.9%) |
| 15 to 19 Years | 156 (5.4%) | 89 (3.6%) |
| 20 to 24 Years | 123 (4.3%) | 118 (4.7%) |
| 25 to 29 Years | 307 (10.7%) | 282 (11.3%) |
| 30 to 34 Years | 519 (18.0%) | 259 (10.4%) |
| 35 to 39 Years | 119 (4.1%) | 97 (3.9%) |
| 40 to 44 Years | 119 (4.1%) | 58 (2.3%) |
| 45 to 49 Years | 48 (1.7%) | 131 (5.2%) |
| 50 to 54 Years | 125 (4.3%) | 166 (6.7%) |
| 55 to 59 Years | 110 (3.8%) | 118 (4.7%) |
| 60 to 64 Years | 158 (5.5%) | 168 (6.7%) |
| 65 to 69 Years | 147 (5.1%) | 168 (6.7%) |
| 70 to 74 Years | 191 (6.6%) | 121 (4.9%) |
| 75 to 79 Years | 101 (3.5%) | 16 (0.6%) |
| 80 to 84 Years | 0 (0.0%) | 22 (0.9%) |
| 85 Years and over | 30 (1.0%) | 15 (0.6%) |
| Total | 2,877 (100.0%) | 2,496 (100.0%) |
Families and Households in Dundee
Median Family Size in Dundee
The median family size in Dundee is 3.67 persons per family, with single female/mother families (259 | 19.6%) accounting for the largest median family size of 5.56 persons per family. On the other hand, single male/father families (135 | 10.2%) represent the smallest median family size with 2.45 persons per family.
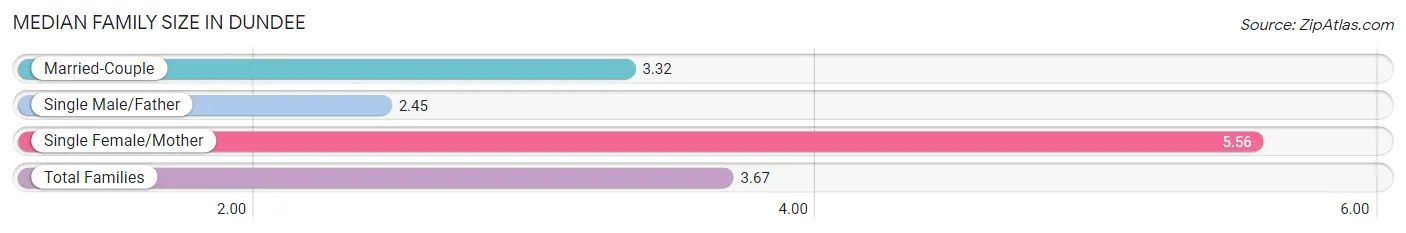
| Family Type | # Families | Family Size |
| Married-Couple | 928 (70.2%) | 3.32 |
| Single Male/Father | 135 (10.2%) | 2.45 |
| Single Female/Mother | 259 (19.6%) | 5.56 |
| Total Families | 1,322 (100.0%) | 3.67 |
Median Household Size in Dundee
The median household size in Dundee is 3.30 persons per household, with single female/mother households (259 | 15.9%) accounting for the largest median household size of 5.85 persons per household. non-family households (307 | 18.9%) represent the smallest median household size with 1.13 persons per household.
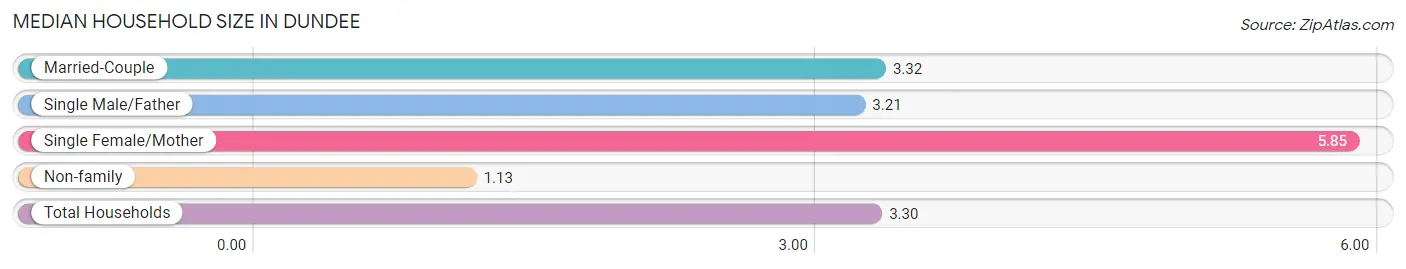
| Household Type | # Households | Household Size |
| Married-Couple | 928 (57.0%) | 3.32 |
| Single Male/Father | 135 (8.3%) | 3.21 |
| Single Female/Mother | 259 (15.9%) | 5.85 |
| Non-family | 307 (18.9%) | 1.13 |
| Total Households | 1,629 (100.0%) | 3.30 |
Household Size by Marriage Status in Dundee
Out of a total of 1,629 households in Dundee, 1,322 (81.1%) are family households, while 307 (18.9%) are nonfamily households. The most numerous type of family households are 4-person households, comprising 489, and the most common type of nonfamily households are 1-person households, comprising 270.
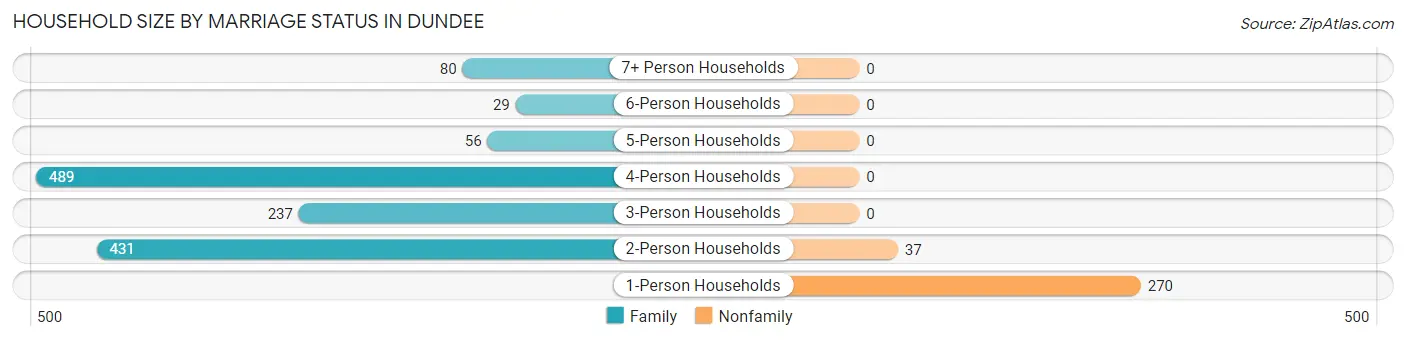
| Household Size | Family Households | Nonfamily Households |
| 1-Person Households | - | 270 (16.6%) |
| 2-Person Households | 431 (26.5%) | 37 (2.3%) |
| 3-Person Households | 237 (14.5%) | 0 (0.0%) |
| 4-Person Households | 489 (30.0%) | 0 (0.0%) |
| 5-Person Households | 56 (3.4%) | 0 (0.0%) |
| 6-Person Households | 29 (1.8%) | 0 (0.0%) |
| 7+ Person Households | 80 (4.9%) | 0 (0.0%) |
| Total | 1,322 (81.1%) | 307 (18.9%) |
Female Fertility in Dundee
Fertility by Age in Dundee
Average fertility rate in Dundee is 133.0 births per 1,000 women. Women in the age bracket of 20 to 34 years have the highest fertility rate with 231.0 births per 1,000 women. Women in the age bracket of 20 to 34 years acount for 100.0% of all women with births.
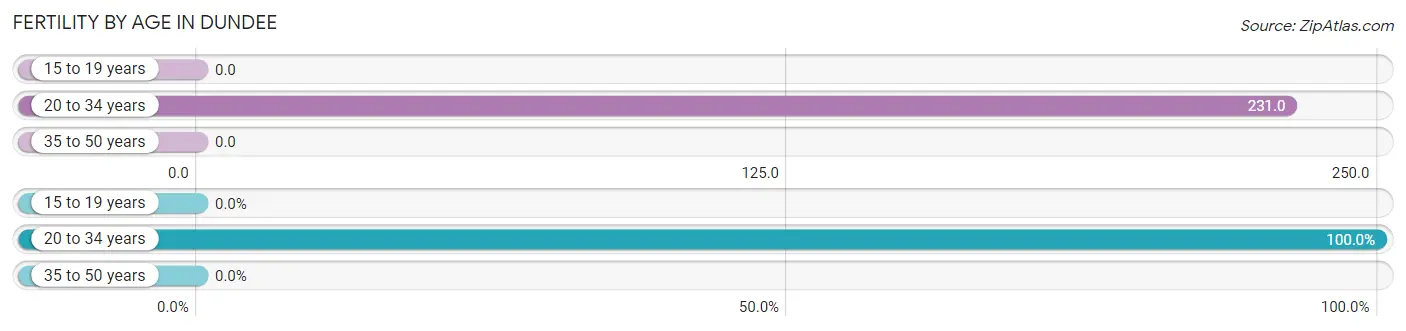
| Age Bracket | Women with Births | Births / 1,000 Women |
| 15 to 19 years | 0 (0.0%) | 0.0 |
| 20 to 34 years | 152 (100.0%) | 231.0 |
| 35 to 50 years | 0 (0.0%) | 0.0 |
| Total | 152 (100.0%) | 133.0 |
Fertility by Age by Marriage Status in Dundee
17.8% of women with births (152) in Dundee are married. The highest percentage of unmarried women with births falls into 20 to 34 years age bracket with 82.2% of them unmarried at the time of birth, while the lowest percentage of unmarried women with births belong to 20 to 34 years age bracket with 82.2% of them unmarried.
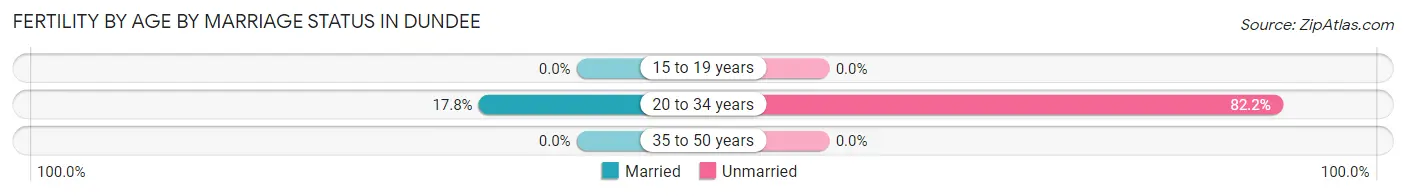
| Age Bracket | Married | Unmarried |
| 15 to 19 years | 0 (0.0%) | 0 (0.0%) |
| 20 to 34 years | 27 (17.8%) | 125 (82.2%) |
| 35 to 50 years | 0 (0.0%) | 0 (0.0%) |
| Total | 27 (17.8%) | 125 (82.2%) |
Fertility by Education in Dundee
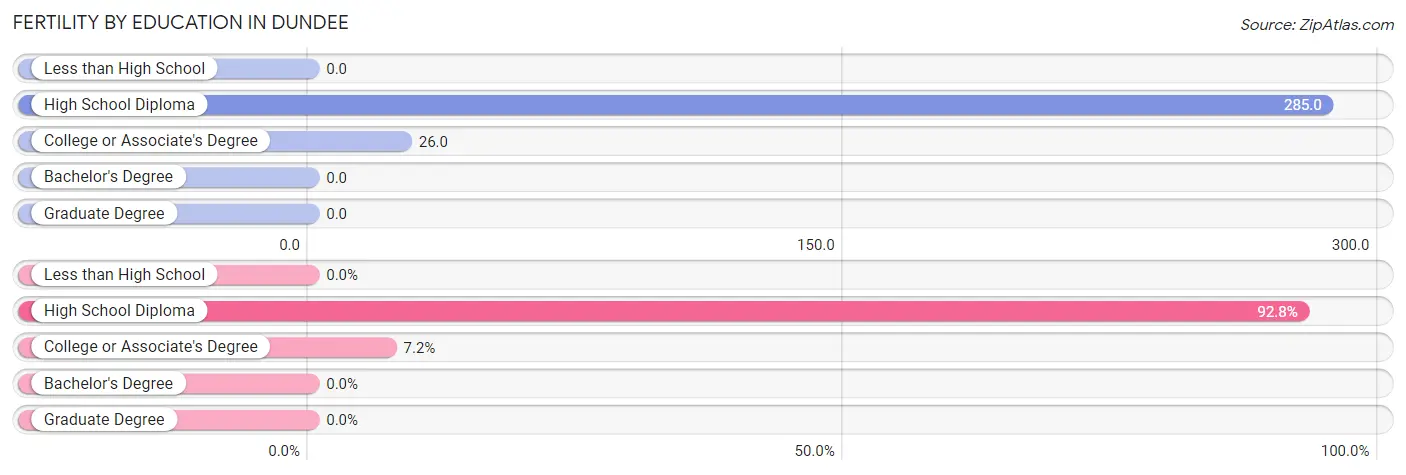
| Educational Attainment | Women with Births | Births / 1,000 Women |
| Less than High School | 0 (0.0%) | 0.0 |
| High School Diploma | 141 (92.8%) | 285.0 |
| College or Associate's Degree | 11 (7.2%) | 26.0 |
| Bachelor's Degree | 0 (0.0%) | 0.0 |
| Graduate Degree | 0 (0.0%) | 0.0 |
| Total | 152 (100.0%) | 133.0 |
Fertility by Education by Marriage Status in Dundee
82.2% of women with births in Dundee are unmarried. Women with the educational attainment of college or associate's degree are most likely to be married with 100.0% of them married at childbirth, while women with the educational attainment of high school diploma are least likely to be married with 88.6% of them unmarried at childbirth.
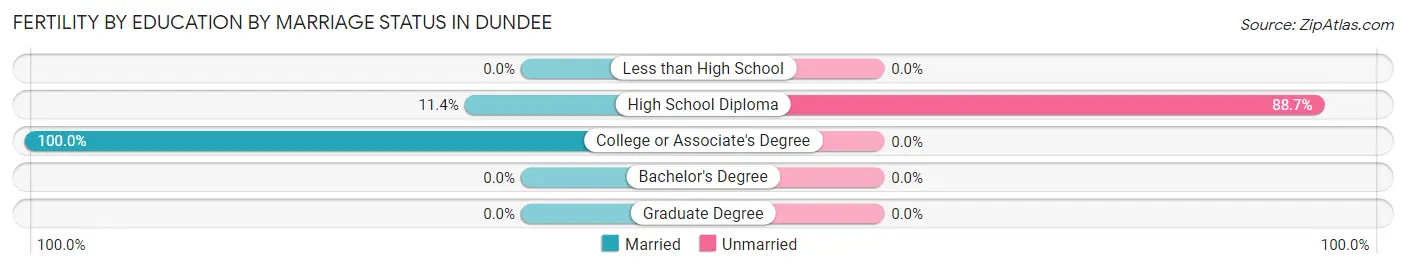
| Educational Attainment | Married | Unmarried |
| Less than High School | 0 (0.0%) | 0 (0.0%) |
| High School Diploma | 16 (11.4%) | 125 (88.6%) |
| College or Associate's Degree | 11 (100.0%) | 0 (0.0%) |
| Bachelor's Degree | 0 (0.0%) | 0 (0.0%) |
| Graduate Degree | 0 (0.0%) | 0 (0.0%) |
| Total | 27 (17.8%) | 125 (82.2%) |
Employment Characteristics in Dundee
Employment by Class of Employer in Dundee
Among the 2,184 employed individuals in Dundee, private company employees (1,684 | 77.1%), not-for-profit organizations (255 | 11.7%), and self-employed (incorporated) (132 | 6.0%) make up the most common classes of employment.
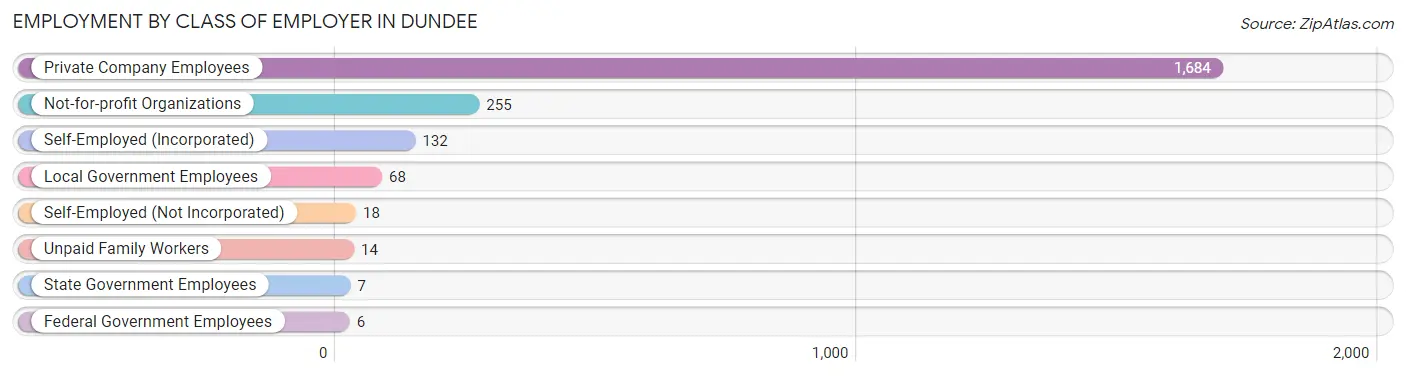
| Employer Class | # Employees | % Employees |
| Private Company Employees | 1,684 | 77.1% |
| Self-Employed (Incorporated) | 132 | 6.0% |
| Self-Employed (Not Incorporated) | 18 | 0.8% |
| Not-for-profit Organizations | 255 | 11.7% |
| Local Government Employees | 68 | 3.1% |
| State Government Employees | 7 | 0.3% |
| Federal Government Employees | 6 | 0.3% |
| Unpaid Family Workers | 14 | 0.6% |
| Total | 2,184 | 100.0% |
Employment Status by Age in Dundee
According to the labor force statistics for Dundee, out of the total population over 16 years of age (4,074), 54.0% or 2,200 individuals are in the labor force, with 0.2% or 4 of them unemployed. The age group with the highest labor force participation rate is 25 to 29 years, with 92.4% or 544 individuals in the labor force. Within the labor force, the 16 to 19 years age range has the highest percentage of unemployed individuals, with 11.9% or 5 of them being unemployed.
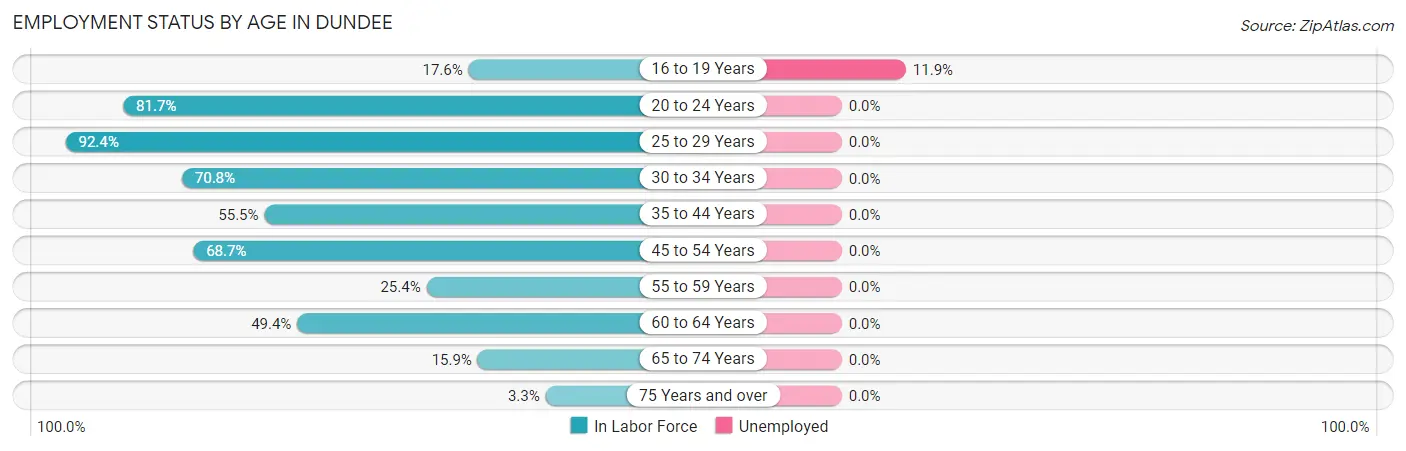
| Age Bracket | In Labor Force | Unemployed |
| 16 to 19 Years | 42 (17.6%) | 5 (11.9%) |
| 20 to 24 Years | 197 (81.7%) | 0 (0.0%) |
| 25 to 29 Years | 544 (92.4%) | 0 (0.0%) |
| 30 to 34 Years | 551 (70.8%) | 0 (0.0%) |
| 35 to 44 Years | 218 (55.5%) | 0 (0.0%) |
| 45 to 54 Years | 323 (68.7%) | 0 (0.0%) |
| 55 to 59 Years | 58 (25.4%) | 0 (0.0%) |
| 60 to 64 Years | 161 (49.4%) | 0 (0.0%) |
| 65 to 74 Years | 100 (15.9%) | 0 (0.0%) |
| 75 Years and over | 6 (3.3%) | 0 (0.0%) |
| Total | 2,200 (54.0%) | 4 (0.2%) |
Employment Status by Educational Attainment in Dundee
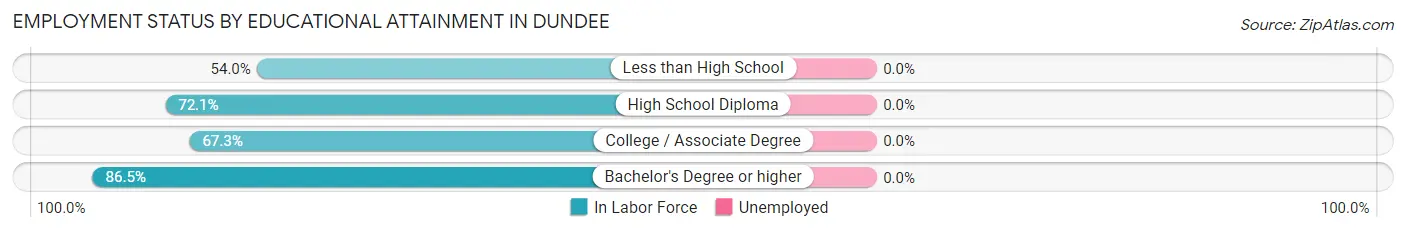
| Educational Attainment | In Labor Force | Unemployed |
| Less than High School | 387 (54.0%) | 0 (0.0%) |
| High School Diploma | 846 (72.1%) | 0 (0.0%) |
| College / Associate Degree | 531 (67.3%) | 0 (0.0%) |
| Bachelor's Degree or higher | 90 (86.5%) | 0 (0.0%) |
| Total | 1,854 (66.6%) | 0 (0.0%) |
Employment Occupations by Sex in Dundee
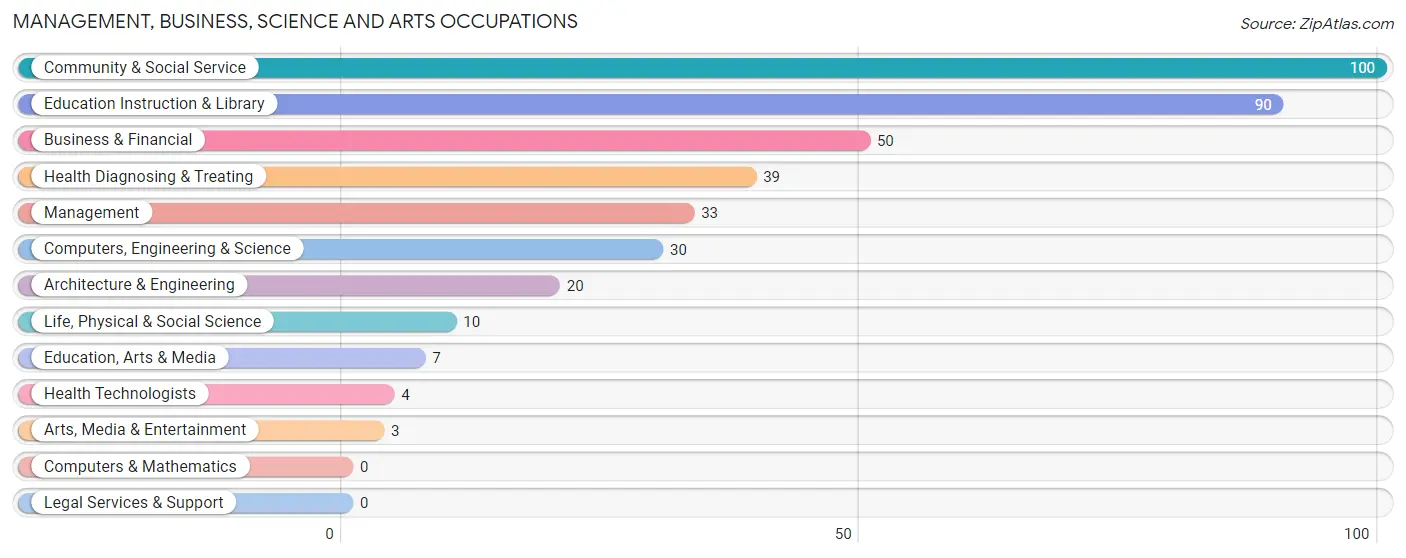
Management, Business, Science and Arts Occupations
The most common Management, Business, Science and Arts occupations in Dundee are Community & Social Service (100 | 4.6%), Education Instruction & Library (90 | 4.1%), Business & Financial (50 | 2.3%), Health Diagnosing & Treating (39 | 1.8%), and Management (33 | 1.5%).
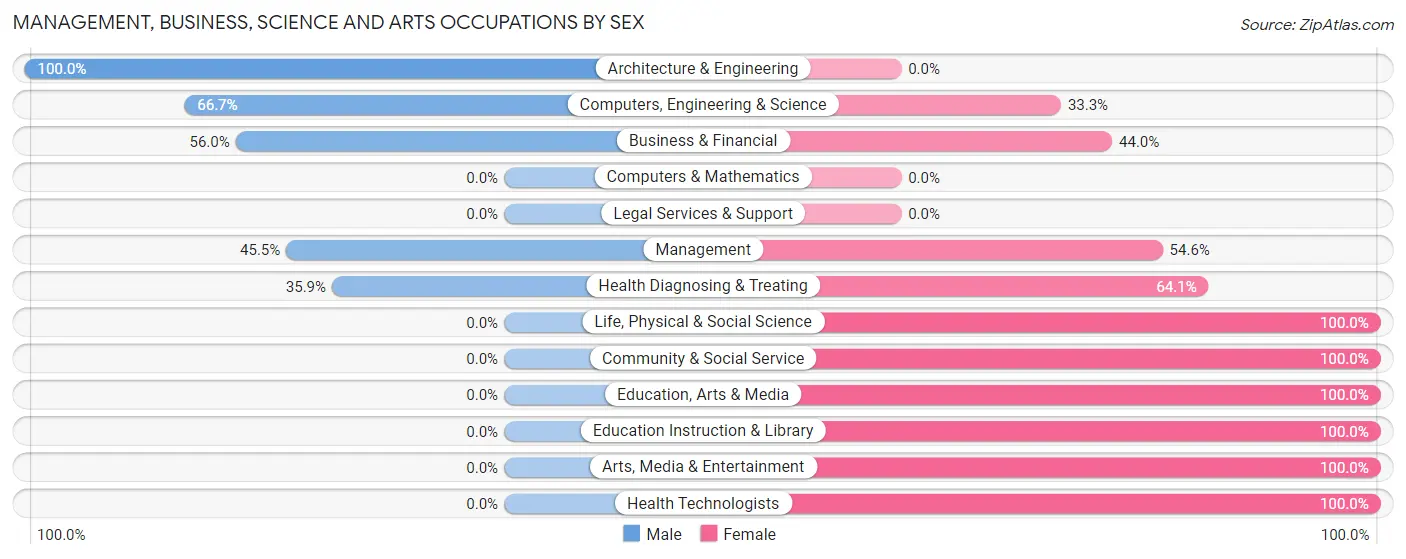
Management, Business, Science and Arts Occupations by Sex
Within the Management, Business, Science and Arts occupations in Dundee, the most male-oriented occupations are Architecture & Engineering (100.0%), Computers, Engineering & Science (66.7%), and Business & Financial (56.0%), while the most female-oriented occupations are Life, Physical & Social Science (100.0%), Community & Social Service (100.0%), and Education, Arts & Media (100.0%).
| Occupation | Male | Female |
| Management | 15 (45.5%) | 18 (54.5%) |
| Business & Financial | 28 (56.0%) | 22 (44.0%) |
| Computers, Engineering & Science | 20 (66.7%) | 10 (33.3%) |
| Computers & Mathematics | 0 (0.0%) | 0 (0.0%) |
| Architecture & Engineering | 20 (100.0%) | 0 (0.0%) |
| Life, Physical & Social Science | 0 (0.0%) | 10 (100.0%) |
| Community & Social Service | 0 (0.0%) | 100 (100.0%) |
| Education, Arts & Media | 0 (0.0%) | 7 (100.0%) |
| Legal Services & Support | 0 (0.0%) | 0 (0.0%) |
| Education Instruction & Library | 0 (0.0%) | 90 (100.0%) |
| Arts, Media & Entertainment | 0 (0.0%) | 3 (100.0%) |
| Health Diagnosing & Treating | 14 (35.9%) | 25 (64.1%) |
| Health Technologists | 0 (0.0%) | 4 (100.0%) |
| Total (Category) | 77 (30.6%) | 175 (69.4%) |
| Total (Overall) | 1,337 (60.9%) | 858 (39.1%) |
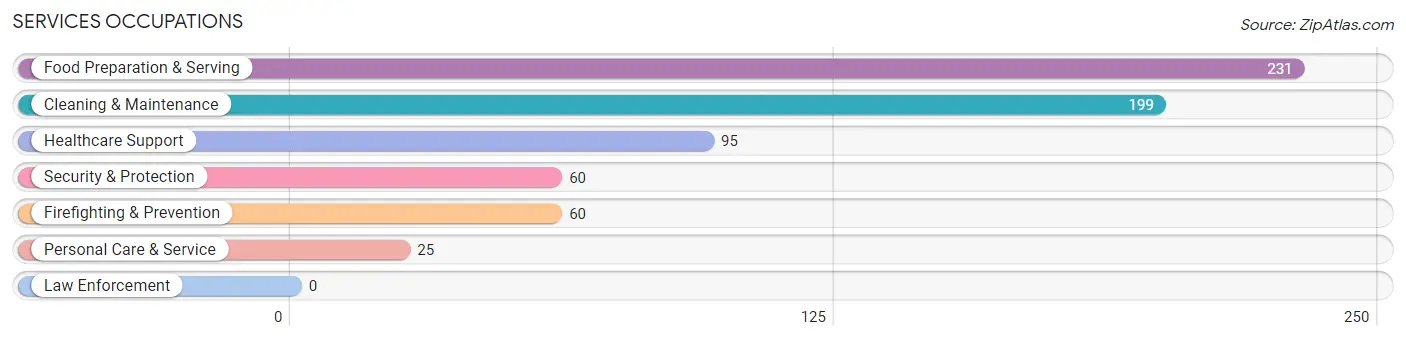
Services Occupations
The most common Services occupations in Dundee are Food Preparation & Serving (231 | 10.5%), Cleaning & Maintenance (199 | 9.1%), Healthcare Support (95 | 4.3%), Security & Protection (60 | 2.7%), and Firefighting & Prevention (60 | 2.7%).
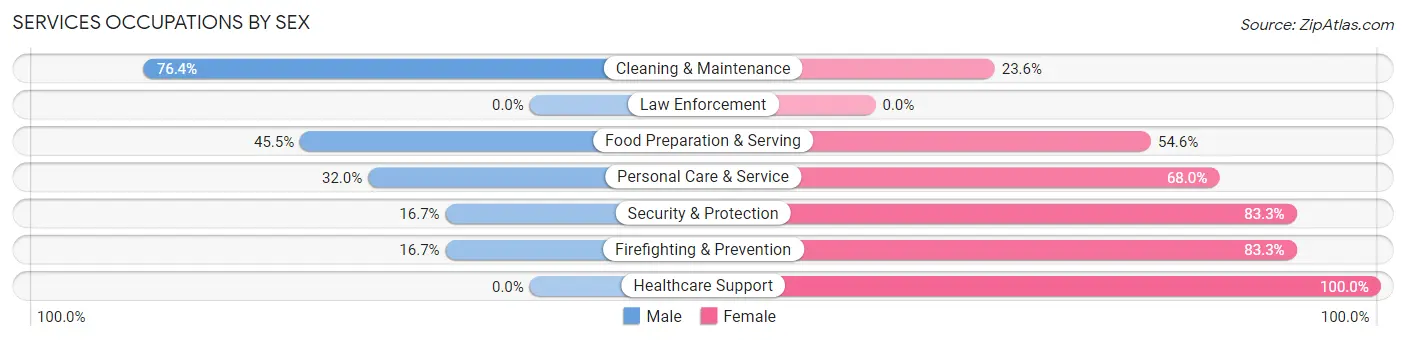
Services Occupations by Sex
Within the Services occupations in Dundee, the most male-oriented occupations are Cleaning & Maintenance (76.4%), Food Preparation & Serving (45.5%), and Personal Care & Service (32.0%), while the most female-oriented occupations are Healthcare Support (100.0%), Security & Protection (83.3%), and Firefighting & Prevention (83.3%).
| Occupation | Male | Female |
| Healthcare Support | 0 (0.0%) | 95 (100.0%) |
| Security & Protection | 10 (16.7%) | 50 (83.3%) |
| Firefighting & Prevention | 10 (16.7%) | 50 (83.3%) |
| Law Enforcement | 0 (0.0%) | 0 (0.0%) |
| Food Preparation & Serving | 105 (45.5%) | 126 (54.5%) |
| Cleaning & Maintenance | 152 (76.4%) | 47 (23.6%) |
| Personal Care & Service | 8 (32.0%) | 17 (68.0%) |
| Total (Category) | 275 (45.1%) | 335 (54.9%) |
| Total (Overall) | 1,337 (60.9%) | 858 (39.1%) |
Sales and Office Occupations
The most common Sales and Office occupations in Dundee are Sales & Related (342 | 15.6%), and Office & Administration (305 | 13.9%).

Sales and Office Occupations by Sex
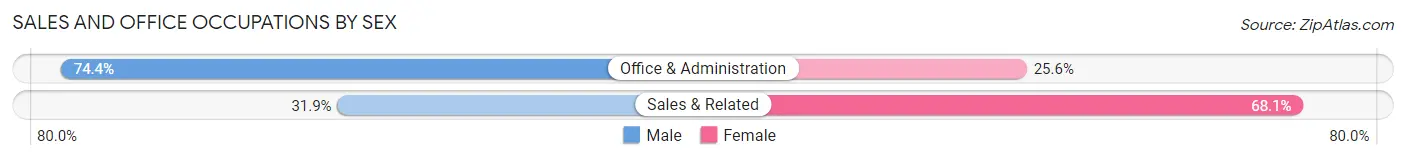
| Occupation | Male | Female |
| Sales & Related | 109 (31.9%) | 233 (68.1%) |
| Office & Administration | 227 (74.4%) | 78 (25.6%) |
| Total (Category) | 336 (51.9%) | 311 (48.1%) |
| Total (Overall) | 1,337 (60.9%) | 858 (39.1%) |
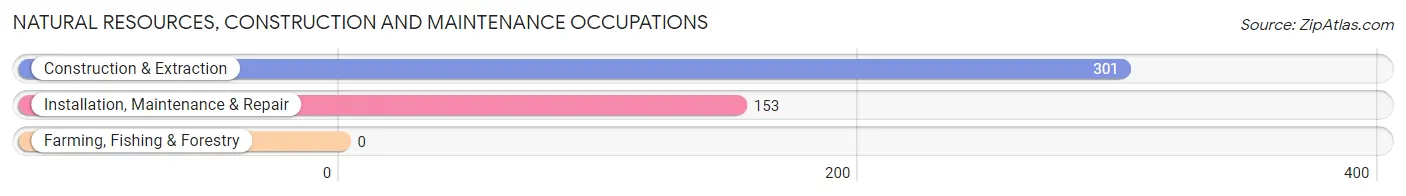
Natural Resources, Construction and Maintenance Occupations
The most common Natural Resources, Construction and Maintenance occupations in Dundee are Construction & Extraction (301 | 13.7%), and Installation, Maintenance & Repair (153 | 7.0%).
Natural Resources, Construction and Maintenance Occupations by Sex
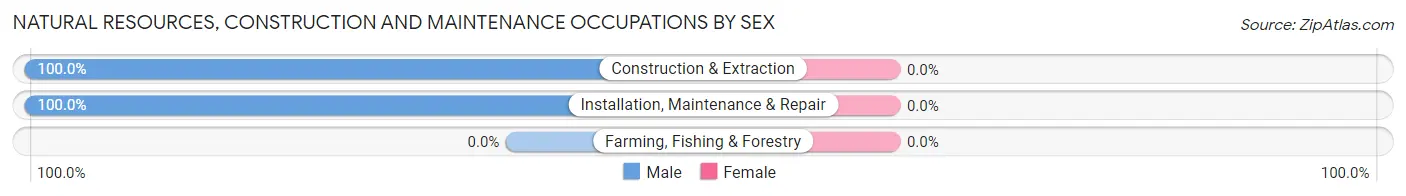
| Occupation | Male | Female |
| Farming, Fishing & Forestry | 0 (0.0%) | 0 (0.0%) |
| Construction & Extraction | 301 (100.0%) | 0 (0.0%) |
| Installation, Maintenance & Repair | 153 (100.0%) | 0 (0.0%) |
| Total (Category) | 454 (100.0%) | 0 (0.0%) |
| Total (Overall) | 1,337 (60.9%) | 858 (39.1%) |
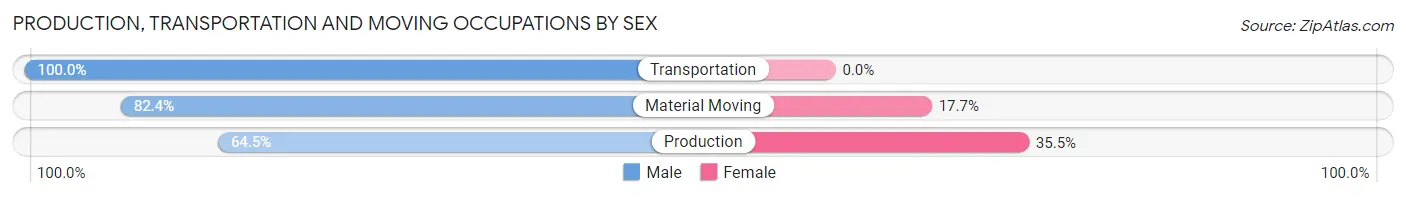
Production, Transportation and Moving Occupations
The most common Production, Transportation and Moving occupations in Dundee are Transportation (85 | 3.9%), Material Moving (85 | 3.9%), and Production (62 | 2.8%).
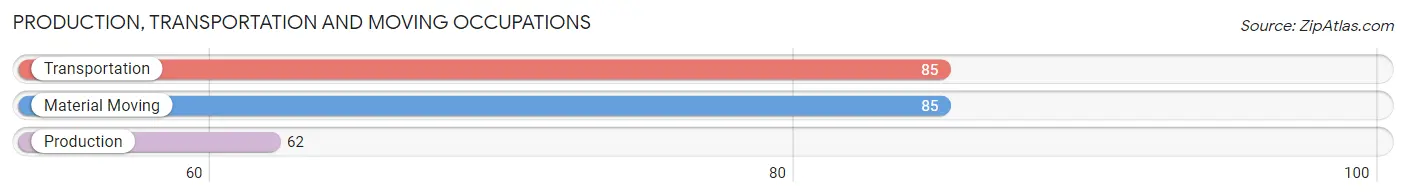
Production, Transportation and Moving Occupations by Sex
| Occupation | Male | Female |
| Production | 40 (64.5%) | 22 (35.5%) |
| Transportation | 85 (100.0%) | 0 (0.0%) |
| Material Moving | 70 (82.4%) | 15 (17.6%) |
| Total (Category) | 195 (84.1%) | 37 (16.0%) |
| Total (Overall) | 1,337 (60.9%) | 858 (39.1%) |
Employment Industries by Sex in Dundee
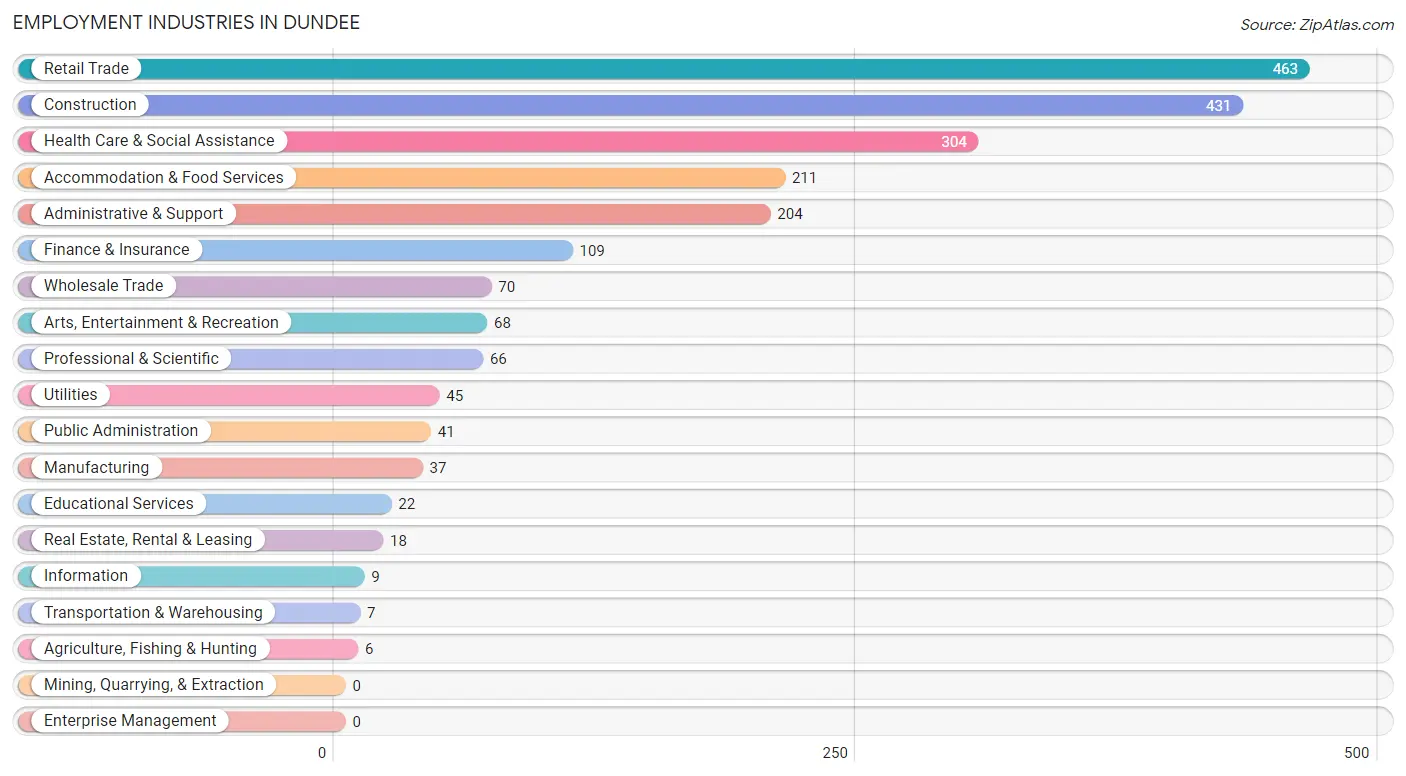
Employment Industries in Dundee
The major employment industries in Dundee include Retail Trade (463 | 21.1%), Construction (431 | 19.6%), Health Care & Social Assistance (304 | 13.9%), Accommodation & Food Services (211 | 9.6%), and Administrative & Support (204 | 9.3%).
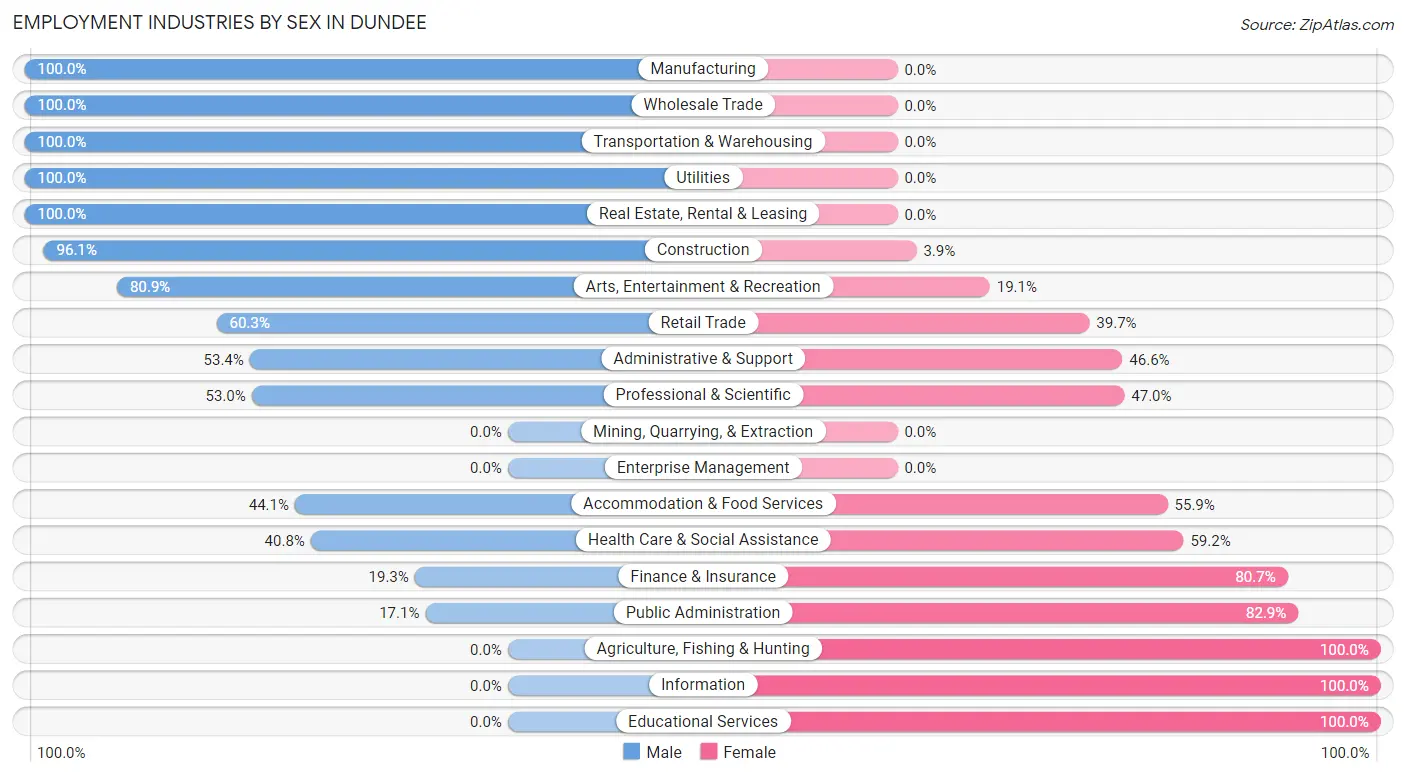
Employment Industries by Sex in Dundee
The Dundee industries that see more men than women are Manufacturing (100.0%), Wholesale Trade (100.0%), and Transportation & Warehousing (100.0%), whereas the industries that tend to have a higher number of women are Agriculture, Fishing & Hunting (100.0%), Information (100.0%), and Educational Services (100.0%).
| Industry | Male | Female |
| Agriculture, Fishing & Hunting | 0 (0.0%) | 6 (100.0%) |
| Mining, Quarrying, & Extraction | 0 (0.0%) | 0 (0.0%) |
| Construction | 414 (96.1%) | 17 (3.9%) |
| Manufacturing | 37 (100.0%) | 0 (0.0%) |
| Wholesale Trade | 70 (100.0%) | 0 (0.0%) |
| Retail Trade | 279 (60.3%) | 184 (39.7%) |
| Transportation & Warehousing | 7 (100.0%) | 0 (0.0%) |
| Utilities | 45 (100.0%) | 0 (0.0%) |
| Information | 0 (0.0%) | 9 (100.0%) |
| Finance & Insurance | 21 (19.3%) | 88 (80.7%) |
| Real Estate, Rental & Leasing | 18 (100.0%) | 0 (0.0%) |
| Professional & Scientific | 35 (53.0%) | 31 (47.0%) |
| Enterprise Management | 0 (0.0%) | 0 (0.0%) |
| Administrative & Support | 109 (53.4%) | 95 (46.6%) |
| Educational Services | 0 (0.0%) | 22 (100.0%) |
| Health Care & Social Assistance | 124 (40.8%) | 180 (59.2%) |
| Arts, Entertainment & Recreation | 55 (80.9%) | 13 (19.1%) |
| Accommodation & Food Services | 93 (44.1%) | 118 (55.9%) |
| Public Administration | 7 (17.1%) | 34 (82.9%) |
| Total | 1,337 (60.9%) | 858 (39.1%) |
Education in Dundee
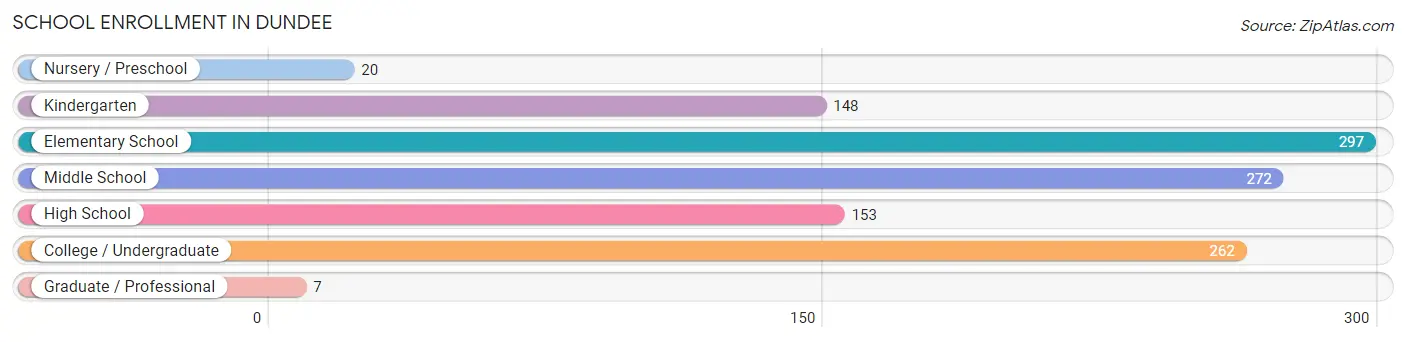
School Enrollment in Dundee
The most common levels of schooling among the 1,159 students in Dundee are elementary school (297 | 25.6%), middle school (272 | 23.5%), and college / undergraduate (262 | 22.6%).
| School Level | # Students | % Students |
| Nursery / Preschool | 20 | 1.7% |
| Kindergarten | 148 | 12.8% |
| Elementary School | 297 | 25.6% |
| Middle School | 272 | 23.5% |
| High School | 153 | 13.2% |
| College / Undergraduate | 262 | 22.6% |
| Graduate / Professional | 7 | 0.6% |
| Total | 1,159 | 100.0% |
School Enrollment by Age by Funding Source in Dundee
Out of a total of 1,159 students who are enrolled in schools in Dundee, 139 (12.0%) attend a private institution, while the remaining 1,020 (88.0%) are enrolled in public schools. The age group of 20 to 24 year olds has the highest likelihood of being enrolled in private schools, with 67 (66.3% in the age bracket) enrolled. Conversely, the age group of 3 to 4 year olds has the lowest likelihood of being enrolled in a private school, with 141 (100.0% in the age bracket) attending a public institution.
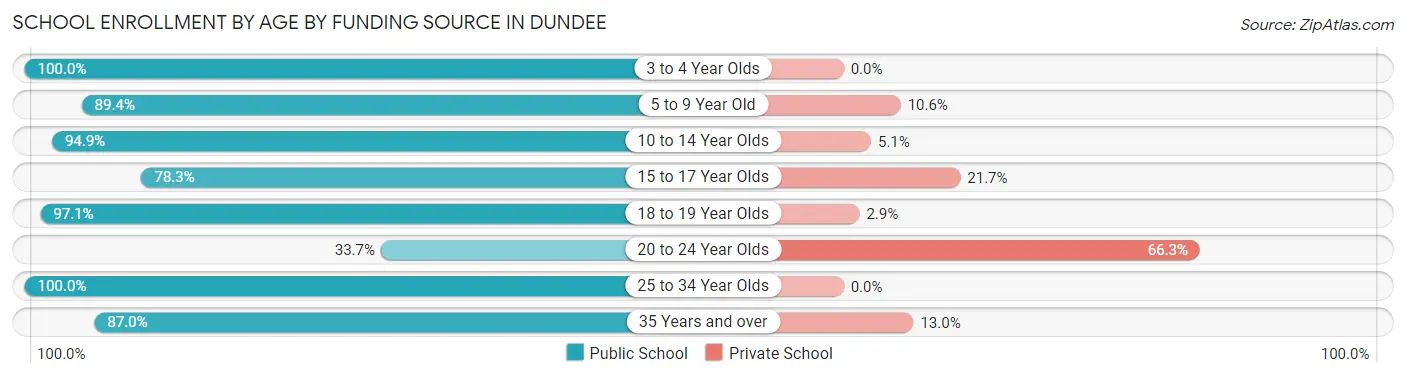
| Age Bracket | Public School | Private School |
| 3 to 4 Year Olds | 141 (100.0%) | 0 (0.0%) |
| 5 to 9 Year Old | 143 (89.4%) | 17 (10.6%) |
| 10 to 14 Year Olds | 447 (94.9%) | 24 (5.1%) |
| 15 to 17 Year Olds | 54 (78.3%) | 15 (21.7%) |
| 18 to 19 Year Olds | 99 (97.1%) | 3 (2.9%) |
| 20 to 24 Year Olds | 34 (33.7%) | 67 (66.3%) |
| 25 to 34 Year Olds | 15 (100.0%) | 0 (0.0%) |
| 35 Years and over | 87 (87.0%) | 13 (13.0%) |
| Total | 1,020 (88.0%) | 139 (12.0%) |
Educational Attainment by Field of Study in Dundee
Engineering (59 | 24.3%), computers & mathematics (44 | 18.1%), science & technology (24 | 9.9%), arts & humanities (24 | 9.9%), and physical & health sciences (21 | 8.6%) are the most common fields of study among 243 individuals in Dundee who have obtained a bachelor's degree or higher.
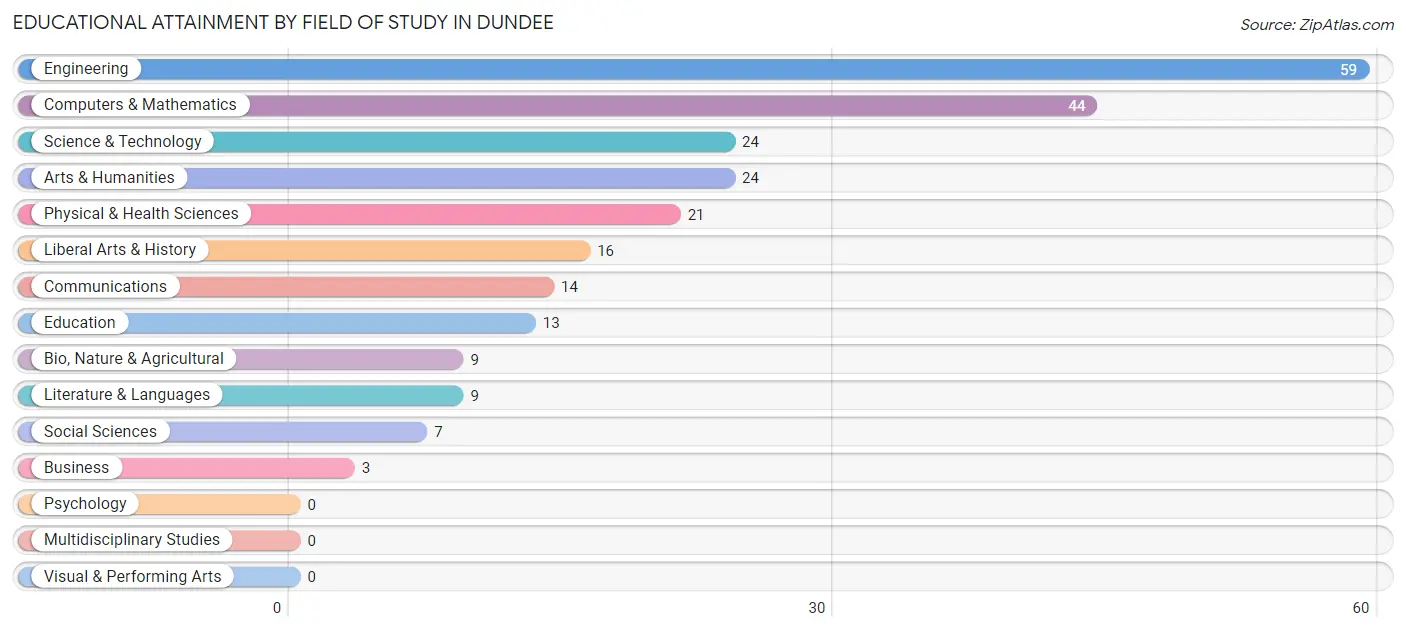
| Field of Study | # Graduates | % Graduates |
| Computers & Mathematics | 44 | 18.1% |
| Bio, Nature & Agricultural | 9 | 3.7% |
| Physical & Health Sciences | 21 | 8.6% |
| Psychology | 0 | 0.0% |
| Social Sciences | 7 | 2.9% |
| Engineering | 59 | 24.3% |
| Multidisciplinary Studies | 0 | 0.0% |
| Science & Technology | 24 | 9.9% |
| Business | 3 | 1.2% |
| Education | 13 | 5.3% |
| Literature & Languages | 9 | 3.7% |
| Liberal Arts & History | 16 | 6.6% |
| Visual & Performing Arts | 0 | 0.0% |
| Communications | 14 | 5.8% |
| Arts & Humanities | 24 | 9.9% |
| Total | 243 | 100.0% |
Transportation & Commute in Dundee
Vehicle Availability by Sex in Dundee
The most prevalent vehicle ownership categories in Dundee are males with 1 vehicle (661, accounting for 49.4%) and females with 1 vehicle (223, making up 78.0%).
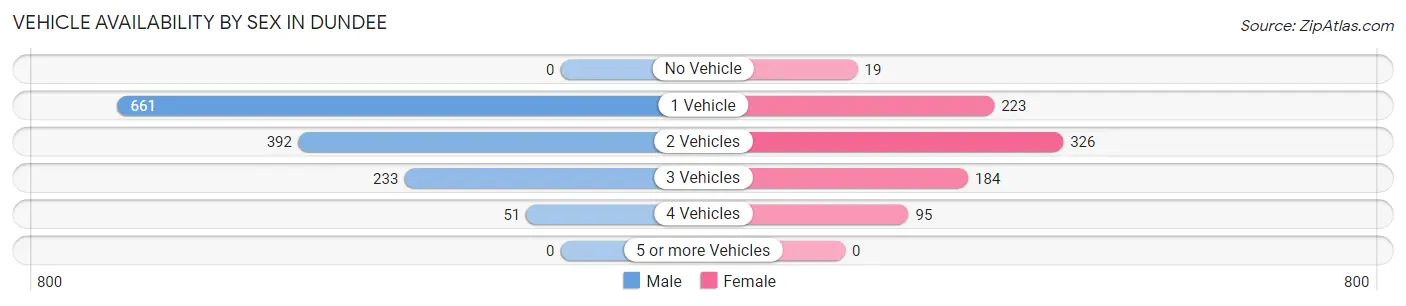
| Vehicles Available | Male | Female |
| No Vehicle | 0 (0.0%) | 19 (2.2%) |
| 1 Vehicle | 661 (49.4%) | 223 (26.3%) |
| 2 Vehicles | 392 (29.3%) | 326 (38.5%) |
| 3 Vehicles | 233 (17.4%) | 184 (21.7%) |
| 4 Vehicles | 51 (3.8%) | 95 (11.2%) |
| 5 or more Vehicles | 0 (0.0%) | 0 (0.0%) |
| Total | 1,337 (100.0%) | 847 (100.0%) |
Commute Time in Dundee
The most frequently occuring commute durations in Dundee are 20 to 24 minutes (413 commuters, 20.4%), 40 to 44 minutes (394 commuters, 19.5%), and 25 to 29 minutes (309 commuters, 15.3%).
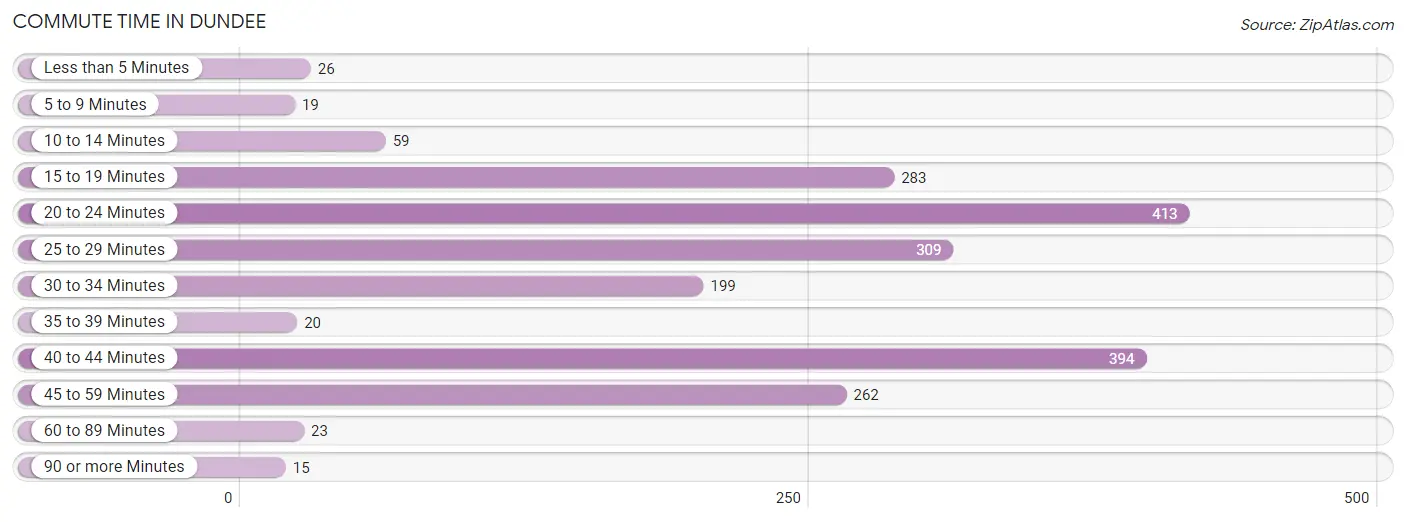
| Commute Time | # Commuters | % Commuters |
| Less than 5 Minutes | 26 | 1.3% |
| 5 to 9 Minutes | 19 | 0.9% |
| 10 to 14 Minutes | 59 | 2.9% |
| 15 to 19 Minutes | 283 | 14.0% |
| 20 to 24 Minutes | 413 | 20.4% |
| 25 to 29 Minutes | 309 | 15.3% |
| 30 to 34 Minutes | 199 | 9.8% |
| 35 to 39 Minutes | 20 | 1.0% |
| 40 to 44 Minutes | 394 | 19.5% |
| 45 to 59 Minutes | 262 | 13.0% |
| 60 to 89 Minutes | 23 | 1.1% |
| 90 or more Minutes | 15 | 0.7% |
Commute Time by Sex in Dundee
The most common commute times in Dundee are 40 to 44 minutes (339 commuters, 28.0%) for males and 25 to 29 minutes (218 commuters, 27.0%) for females.
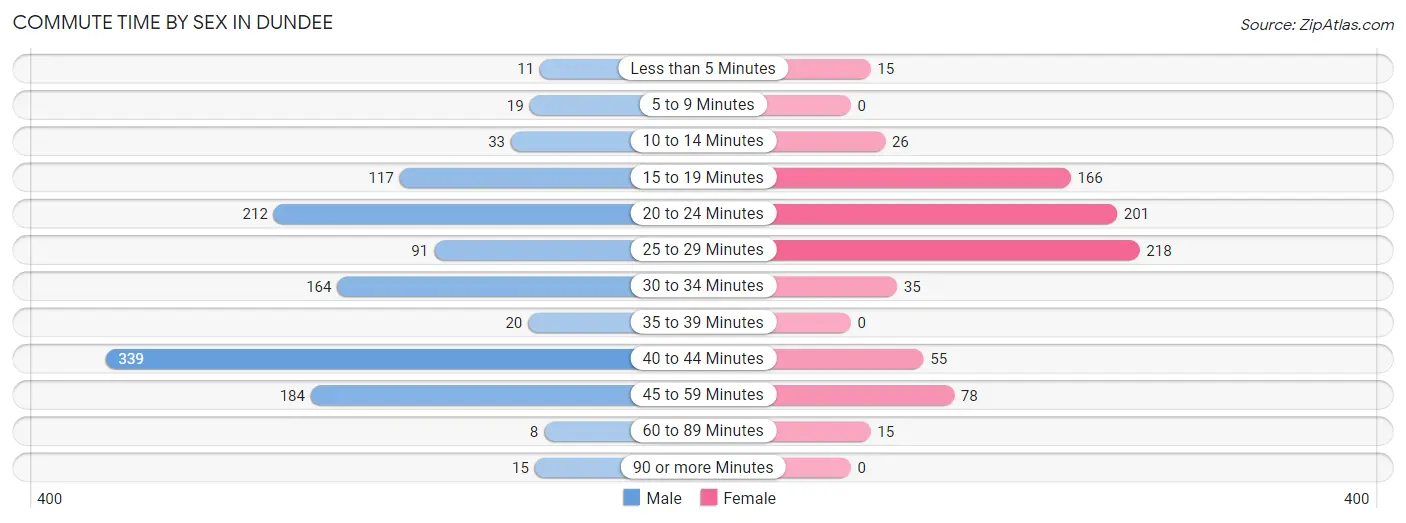
| Commute Time | Male | Female |
| Less than 5 Minutes | 11 (0.9%) | 15 (1.8%) |
| 5 to 9 Minutes | 19 (1.6%) | 0 (0.0%) |
| 10 to 14 Minutes | 33 (2.7%) | 26 (3.2%) |
| 15 to 19 Minutes | 117 (9.7%) | 166 (20.5%) |
| 20 to 24 Minutes | 212 (17.5%) | 201 (24.8%) |
| 25 to 29 Minutes | 91 (7.5%) | 218 (27.0%) |
| 30 to 34 Minutes | 164 (13.5%) | 35 (4.3%) |
| 35 to 39 Minutes | 20 (1.7%) | 0 (0.0%) |
| 40 to 44 Minutes | 339 (28.0%) | 55 (6.8%) |
| 45 to 59 Minutes | 184 (15.2%) | 78 (9.6%) |
| 60 to 89 Minutes | 8 (0.7%) | 15 (1.8%) |
| 90 or more Minutes | 15 (1.2%) | 0 (0.0%) |
Time of Departure to Work by Sex in Dundee
The most frequent times of departure to work in Dundee are 7:00 AM to 7:29 AM (464, 38.3%) for males and 7:00 AM to 7:29 AM (178, 22.0%) for females.
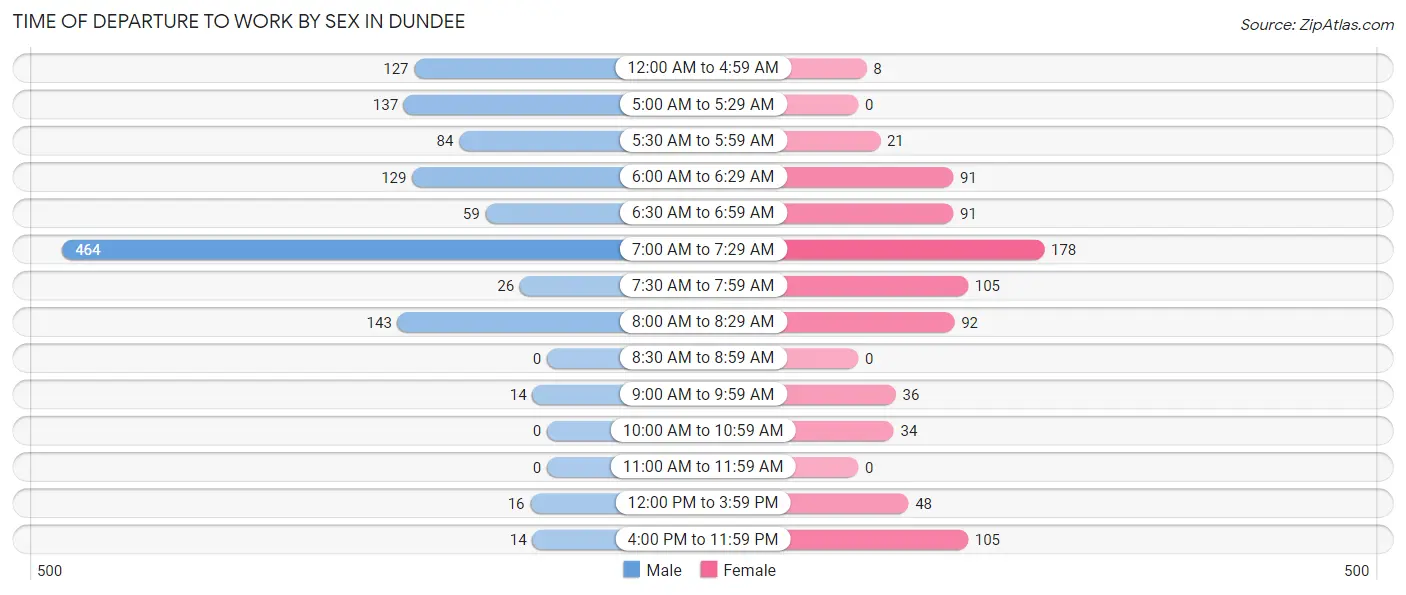
| Time of Departure | Male | Female |
| 12:00 AM to 4:59 AM | 127 (10.5%) | 8 (1.0%) |
| 5:00 AM to 5:29 AM | 137 (11.3%) | 0 (0.0%) |
| 5:30 AM to 5:59 AM | 84 (6.9%) | 21 (2.6%) |
| 6:00 AM to 6:29 AM | 129 (10.6%) | 91 (11.3%) |
| 6:30 AM to 6:59 AM | 59 (4.9%) | 91 (11.3%) |
| 7:00 AM to 7:29 AM | 464 (38.3%) | 178 (22.0%) |
| 7:30 AM to 7:59 AM | 26 (2.1%) | 105 (13.0%) |
| 8:00 AM to 8:29 AM | 143 (11.8%) | 92 (11.4%) |
| 8:30 AM to 8:59 AM | 0 (0.0%) | 0 (0.0%) |
| 9:00 AM to 9:59 AM | 14 (1.1%) | 36 (4.4%) |
| 10:00 AM to 10:59 AM | 0 (0.0%) | 34 (4.2%) |
| 11:00 AM to 11:59 AM | 0 (0.0%) | 0 (0.0%) |
| 12:00 PM to 3:59 PM | 16 (1.3%) | 48 (5.9%) |
| 4:00 PM to 11:59 PM | 14 (1.1%) | 105 (13.0%) |
| Total | 1,213 (100.0%) | 809 (100.0%) |
Housing Occupancy in Dundee
Occupancy by Ownership in Dundee
Of the total 1,629 dwellings in Dundee, owner-occupied units account for 1,185 (72.7%), while renter-occupied units make up 444 (27.3%).
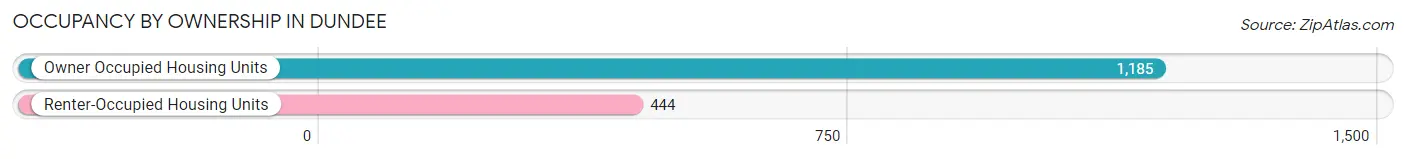
| Occupancy | # Housing Units | % Housing Units |
| Owner Occupied Housing Units | 1,185 | 72.7% |
| Renter-Occupied Housing Units | 444 | 27.3% |
| Total Occupied Housing Units | 1,629 | 100.0% |
Occupancy by Household Size in Dundee
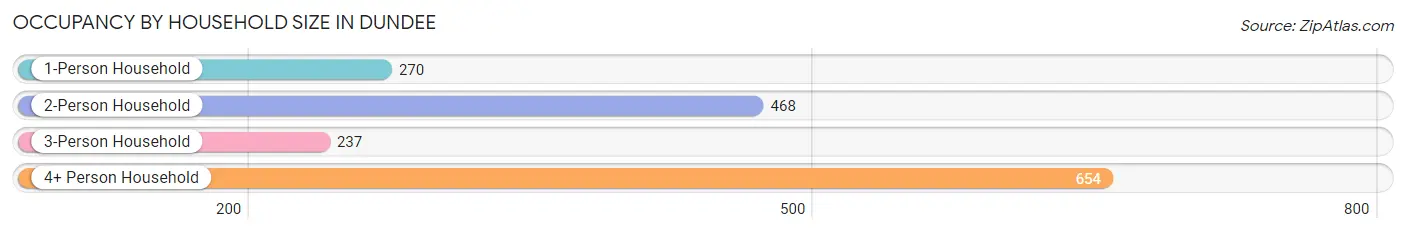
| Household Size | # Housing Units | % Housing Units |
| 1-Person Household | 270 | 16.6% |
| 2-Person Household | 468 | 28.7% |
| 3-Person Household | 237 | 14.5% |
| 4+ Person Household | 654 | 40.2% |
| Total Housing Units | 1,629 | 100.0% |
Occupancy by Ownership by Household Size in Dundee
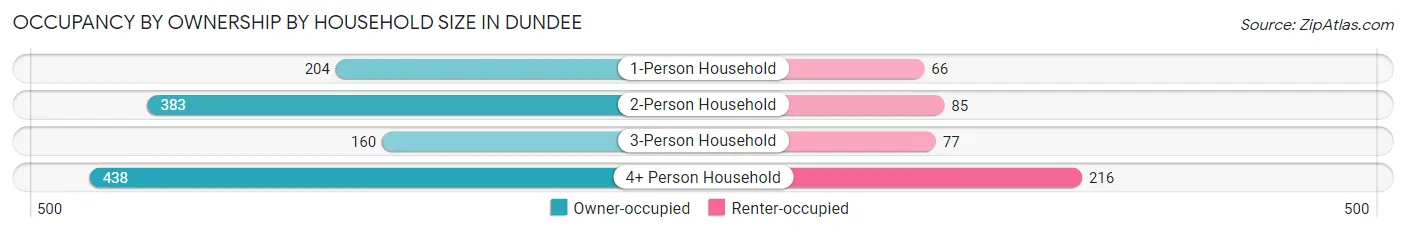
| Household Size | Owner-occupied | Renter-occupied |
| 1-Person Household | 204 (75.6%) | 66 (24.4%) |
| 2-Person Household | 383 (81.8%) | 85 (18.2%) |
| 3-Person Household | 160 (67.5%) | 77 (32.5%) |
| 4+ Person Household | 438 (67.0%) | 216 (33.0%) |
| Total Housing Units | 1,185 (72.7%) | 444 (27.3%) |
Occupancy by Educational Attainment in Dundee
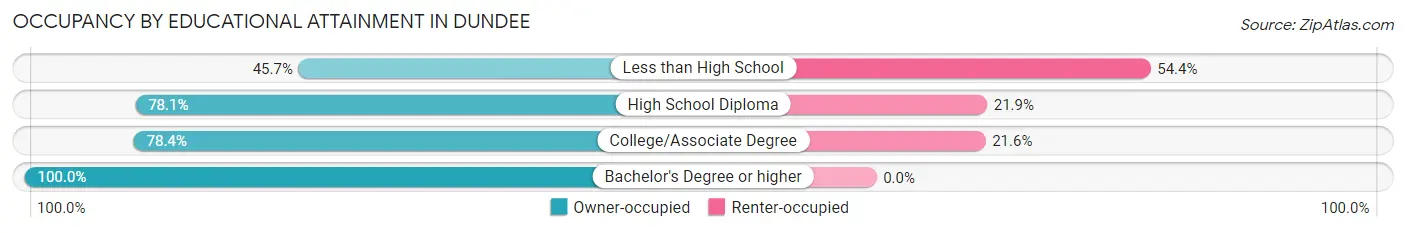
| Household Size | Owner-occupied | Renter-occupied |
| Less than High School | 168 (45.7%) | 200 (54.3%) |
| High School Diploma | 516 (78.1%) | 145 (21.9%) |
| College/Associate Degree | 359 (78.4%) | 99 (21.6%) |
| Bachelor's Degree or higher | 142 (100.0%) | 0 (0.0%) |
Occupancy by Age of Householder in Dundee
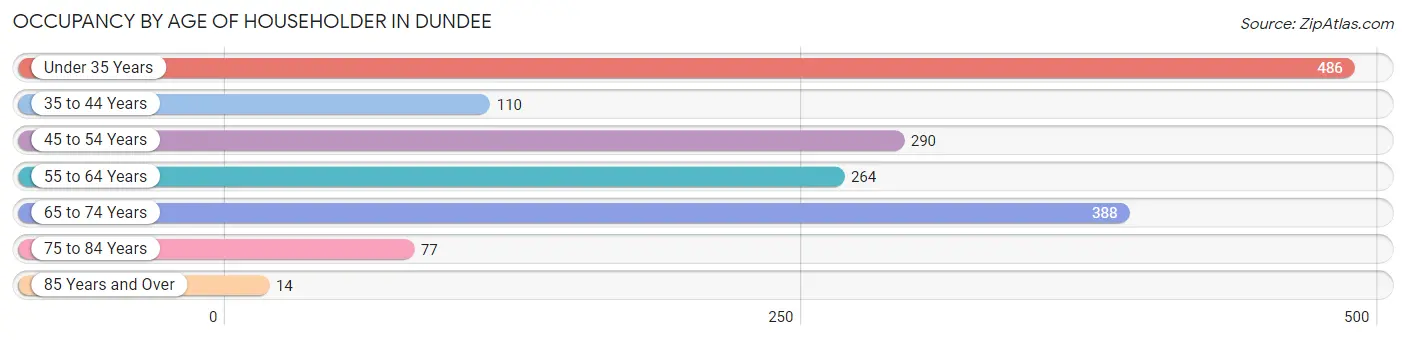
| Age Bracket | # Households | % Households |
| Under 35 Years | 486 | 29.8% |
| 35 to 44 Years | 110 | 6.8% |
| 45 to 54 Years | 290 | 17.8% |
| 55 to 64 Years | 264 | 16.2% |
| 65 to 74 Years | 388 | 23.8% |
| 75 to 84 Years | 77 | 4.7% |
| 85 Years and Over | 14 | 0.9% |
| Total | 1,629 | 100.0% |
Housing Finances in Dundee
Median Income by Occupancy in Dundee
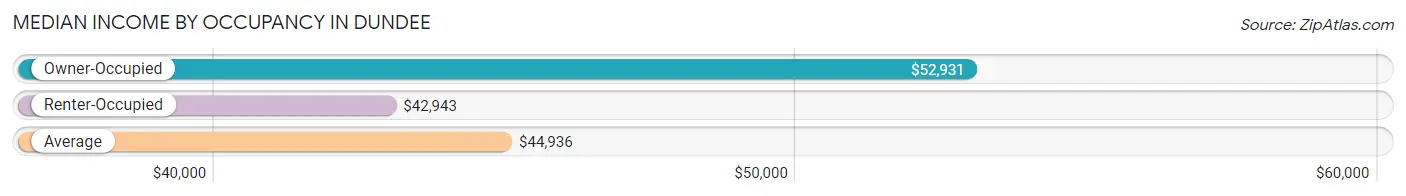
| Occupancy Type | # Households | Median Income |
| Owner-Occupied | 1,185 (72.7%) | $52,931 |
| Renter-Occupied | 444 (27.3%) | $42,943 |
| Average | 1,629 (100.0%) | $44,936 |
Occupancy by Householder Income Bracket in Dundee
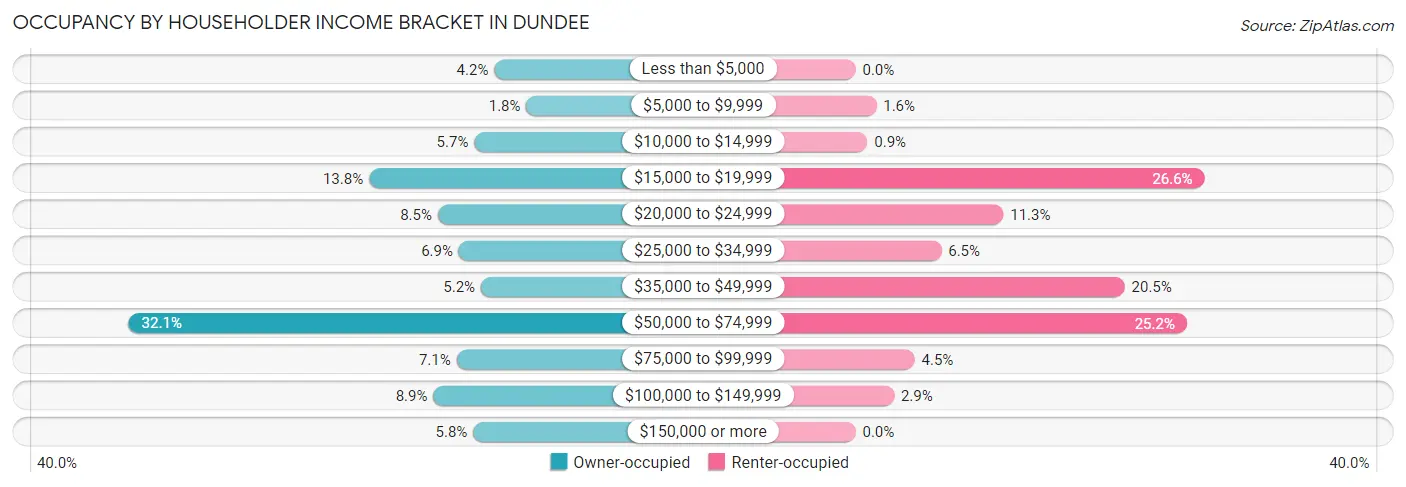
| Income Bracket | Owner-occupied | Renter-occupied |
| Less than $5,000 | 50 (4.2%) | 0 (0.0%) |
| $5,000 to $9,999 | 21 (1.8%) | 7 (1.6%) |
| $10,000 to $14,999 | 68 (5.7%) | 4 (0.9%) |
| $15,000 to $19,999 | 163 (13.8%) | 118 (26.6%) |
| $20,000 to $24,999 | 101 (8.5%) | 50 (11.3%) |
| $25,000 to $34,999 | 82 (6.9%) | 29 (6.5%) |
| $35,000 to $49,999 | 62 (5.2%) | 91 (20.5%) |
| $50,000 to $74,999 | 380 (32.1%) | 112 (25.2%) |
| $75,000 to $99,999 | 84 (7.1%) | 20 (4.5%) |
| $100,000 to $149,999 | 105 (8.9%) | 13 (2.9%) |
| $150,000 or more | 69 (5.8%) | 0 (0.0%) |
| Total | 1,185 (100.0%) | 444 (100.0%) |
Monthly Housing Cost Tiers in Dundee
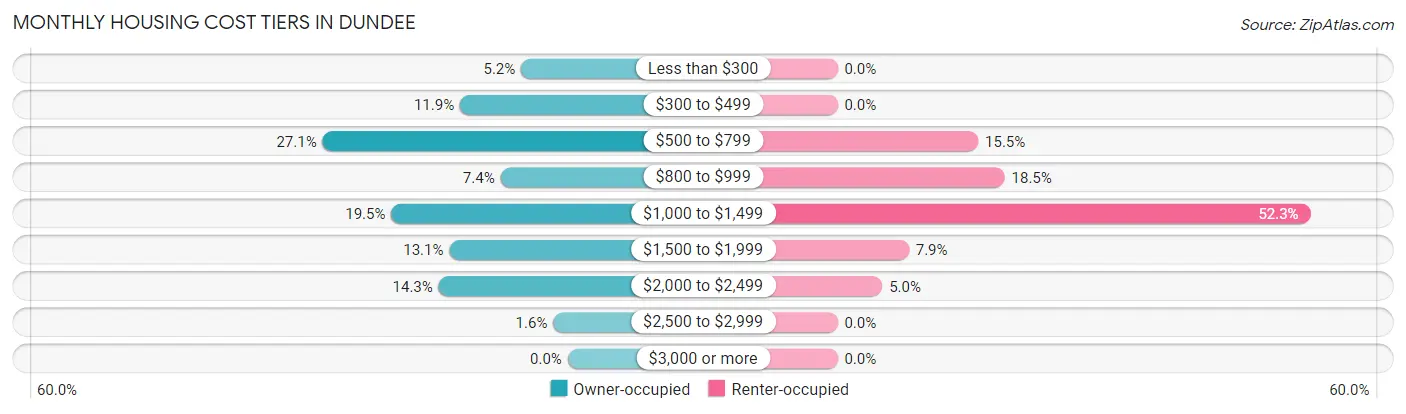
| Monthly Cost | Owner-occupied | Renter-occupied |
| Less than $300 | 61 (5.1%) | 0 (0.0%) |
| $300 to $499 | 141 (11.9%) | 0 (0.0%) |
| $500 to $799 | 321 (27.1%) | 69 (15.5%) |
| $800 to $999 | 88 (7.4%) | 82 (18.5%) |
| $1,000 to $1,499 | 231 (19.5%) | 232 (52.2%) |
| $1,500 to $1,999 | 155 (13.1%) | 35 (7.9%) |
| $2,000 to $2,499 | 169 (14.3%) | 22 (5.0%) |
| $2,500 to $2,999 | 19 (1.6%) | 0 (0.0%) |
| $3,000 or more | 0 (0.0%) | 0 (0.0%) |
| Total | 1,185 (100.0%) | 444 (100.0%) |
Physical Housing Characteristics in Dundee
Housing Structures in Dundee
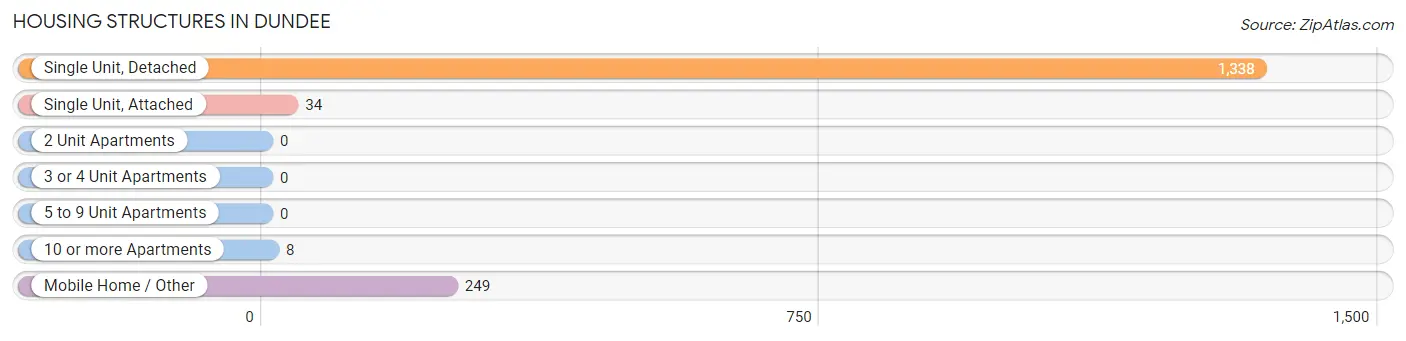
| Structure Type | # Housing Units | % Housing Units |
| Single Unit, Detached | 1,338 | 82.1% |
| Single Unit, Attached | 34 | 2.1% |
| 2 Unit Apartments | 0 | 0.0% |
| 3 or 4 Unit Apartments | 0 | 0.0% |
| 5 to 9 Unit Apartments | 0 | 0.0% |
| 10 or more Apartments | 8 | 0.5% |
| Mobile Home / Other | 249 | 15.3% |
| Total | 1,629 | 100.0% |
Housing Structures by Occupancy in Dundee
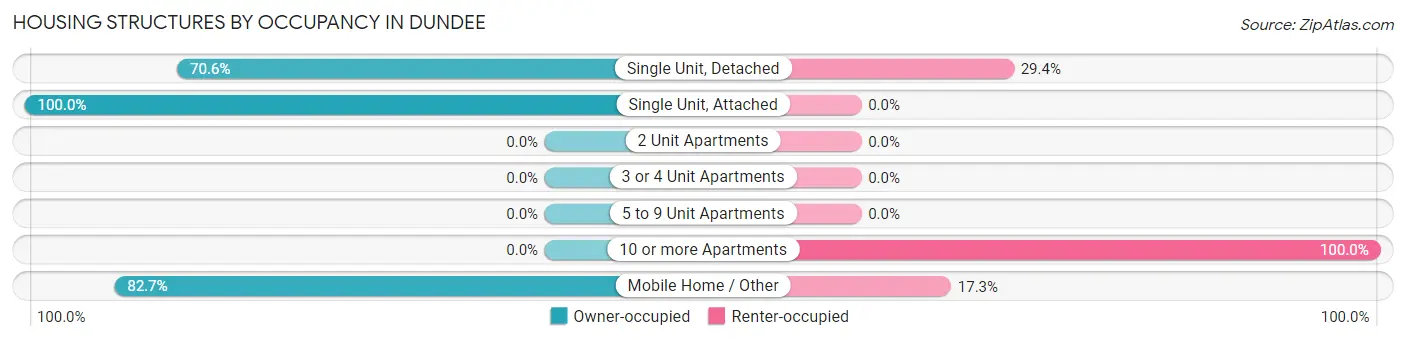
| Structure Type | Owner-occupied | Renter-occupied |
| Single Unit, Detached | 945 (70.6%) | 393 (29.4%) |
| Single Unit, Attached | 34 (100.0%) | 0 (0.0%) |
| 2 Unit Apartments | 0 (0.0%) | 0 (0.0%) |
| 3 or 4 Unit Apartments | 0 (0.0%) | 0 (0.0%) |
| 5 to 9 Unit Apartments | 0 (0.0%) | 0 (0.0%) |
| 10 or more Apartments | 0 (0.0%) | 8 (100.0%) |
| Mobile Home / Other | 206 (82.7%) | 43 (17.3%) |
| Total | 1,185 (72.7%) | 444 (27.3%) |
Housing Structures by Number of Rooms in Dundee
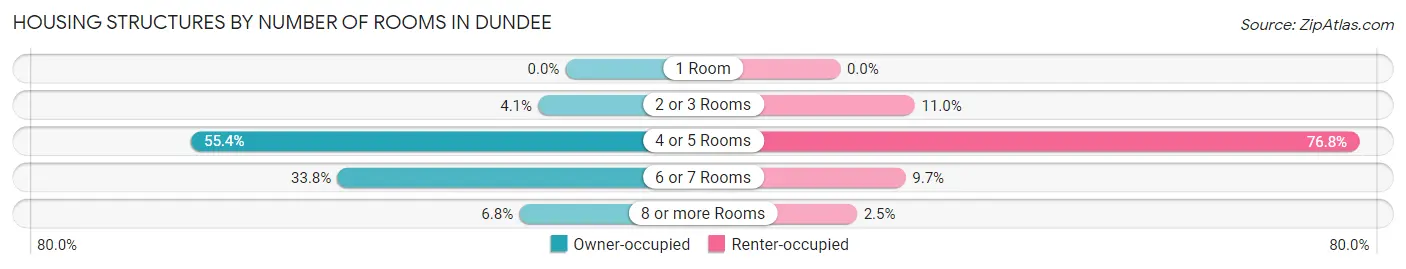
| Number of Rooms | Owner-occupied | Renter-occupied |
| 1 Room | 0 (0.0%) | 0 (0.0%) |
| 2 or 3 Rooms | 48 (4.1%) | 49 (11.0%) |
| 4 or 5 Rooms | 656 (55.4%) | 341 (76.8%) |
| 6 or 7 Rooms | 400 (33.8%) | 43 (9.7%) |
| 8 or more Rooms | 81 (6.8%) | 11 (2.5%) |
| Total | 1,185 (100.0%) | 444 (100.0%) |
Housing Structure by Heating Type in Dundee
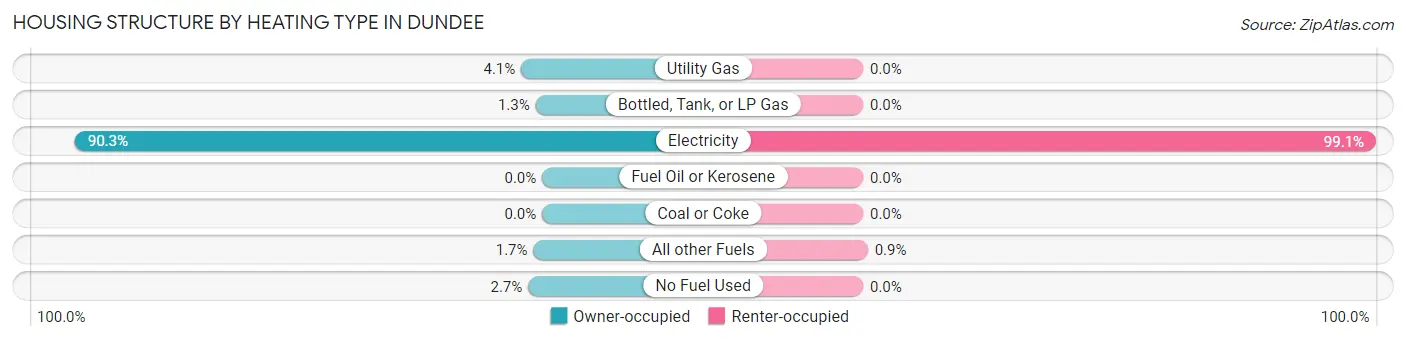
| Heating Type | Owner-occupied | Renter-occupied |
| Utility Gas | 48 (4.1%) | 0 (0.0%) |
| Bottled, Tank, or LP Gas | 15 (1.3%) | 0 (0.0%) |
| Electricity | 1,070 (90.3%) | 440 (99.1%) |
| Fuel Oil or Kerosene | 0 (0.0%) | 0 (0.0%) |
| Coal or Coke | 0 (0.0%) | 0 (0.0%) |
| All other Fuels | 20 (1.7%) | 4 (0.9%) |
| No Fuel Used | 32 (2.7%) | 0 (0.0%) |
| Total | 1,185 (100.0%) | 444 (100.0%) |
Household Vehicle Usage in Dundee
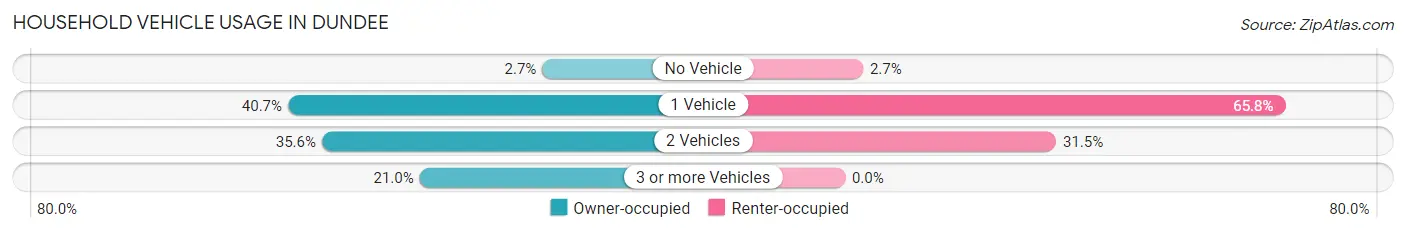
| Vehicles per Household | Owner-occupied | Renter-occupied |
| No Vehicle | 32 (2.7%) | 12 (2.7%) |
| 1 Vehicle | 482 (40.7%) | 292 (65.8%) |
| 2 Vehicles | 422 (35.6%) | 140 (31.5%) |
| 3 or more Vehicles | 249 (21.0%) | 0 (0.0%) |
| Total | 1,185 (100.0%) | 444 (100.0%) |
Real Estate & Mortgages in Dundee
Real Estate and Mortgage Overview in Dundee
| Characteristic | Without Mortgage | With Mortgage |
| Housing Units | 474 | 711 |
| Median Property Value | $151,200 | $221,300 |
| Median Household Income | - | - |
| Monthly Housing Costs | $563 | $0 |
| Real Estate Taxes | $925 | $8 |
Property Value by Mortgage Status in Dundee
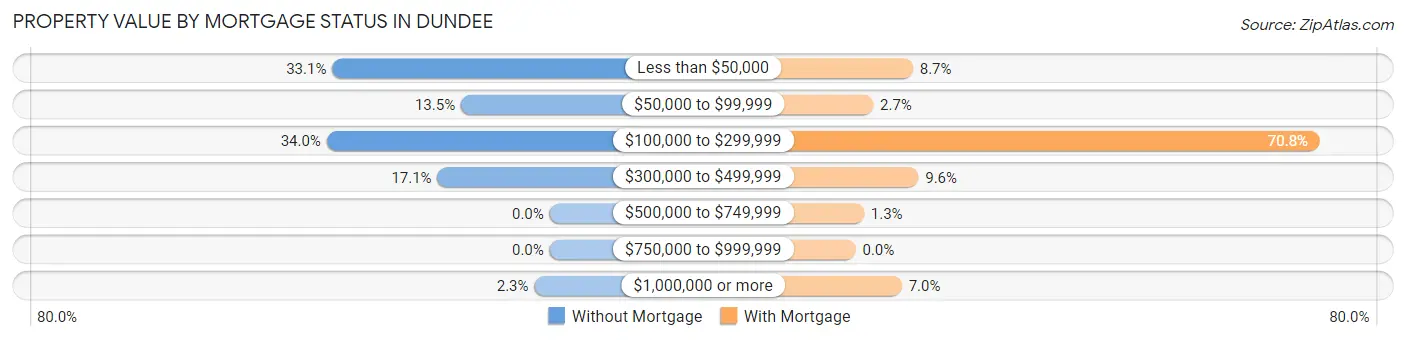
| Property Value | Without Mortgage | With Mortgage |
| Less than $50,000 | 157 (33.1%) | 62 (8.7%) |
| $50,000 to $99,999 | 64 (13.5%) | 19 (2.7%) |
| $100,000 to $299,999 | 161 (34.0%) | 503 (70.8%) |
| $300,000 to $499,999 | 81 (17.1%) | 68 (9.6%) |
| $500,000 to $749,999 | 0 (0.0%) | 9 (1.3%) |
| $750,000 to $999,999 | 0 (0.0%) | 0 (0.0%) |
| $1,000,000 or more | 11 (2.3%) | 50 (7.0%) |
| Total | 474 (100.0%) | 711 (100.0%) |
Household Income by Mortgage Status in Dundee
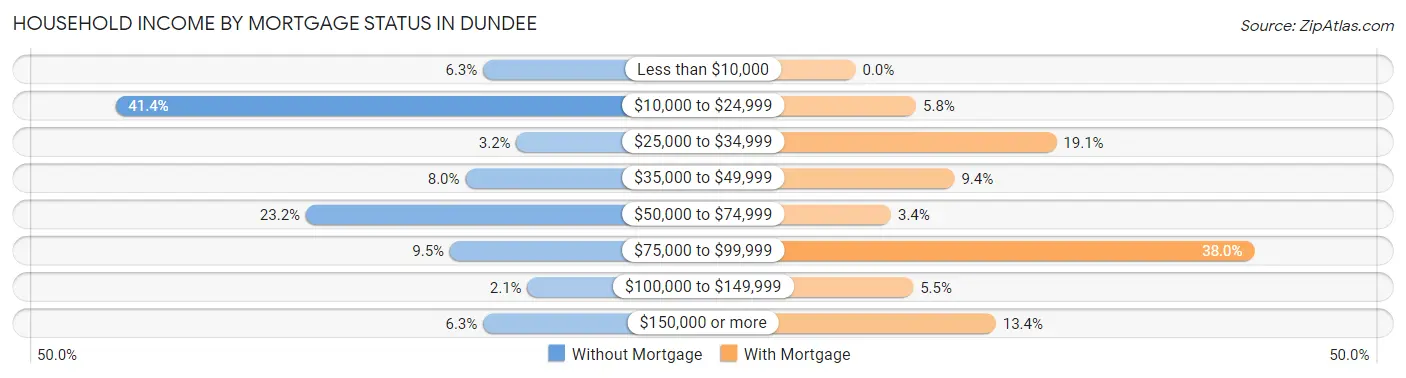
| Household Income | Without Mortgage | With Mortgage |
| Less than $10,000 | 30 (6.3%) | 0 (0.0%) |
| $10,000 to $24,999 | 196 (41.3%) | 41 (5.8%) |
| $25,000 to $34,999 | 15 (3.2%) | 136 (19.1%) |
| $35,000 to $49,999 | 38 (8.0%) | 67 (9.4%) |
| $50,000 to $74,999 | 110 (23.2%) | 24 (3.4%) |
| $75,000 to $99,999 | 45 (9.5%) | 270 (38.0%) |
| $100,000 to $149,999 | 10 (2.1%) | 39 (5.5%) |
| $150,000 or more | 30 (6.3%) | 95 (13.4%) |
| Total | 474 (100.0%) | 711 (100.0%) |
Property Value to Household Income Ratio in Dundee
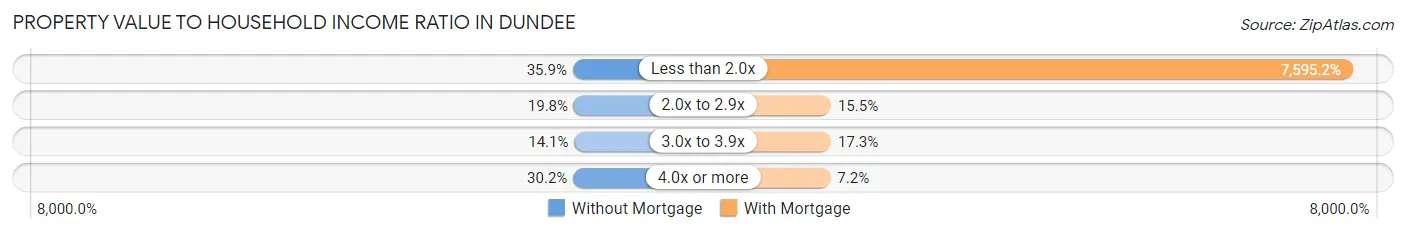
| Value-to-Income Ratio | Without Mortgage | With Mortgage |
| Less than 2.0x | 170 (35.9%) | 54,002 (7,595.2%) |
| 2.0x to 2.9x | 94 (19.8%) | 110 (15.5%) |
| 3.0x to 3.9x | 67 (14.1%) | 123 (17.3%) |
| 4.0x or more | 143 (30.2%) | 51 (7.2%) |
| Total | 474 (100.0%) | 711 (100.0%) |
Real Estate Taxes by Mortgage Status in Dundee
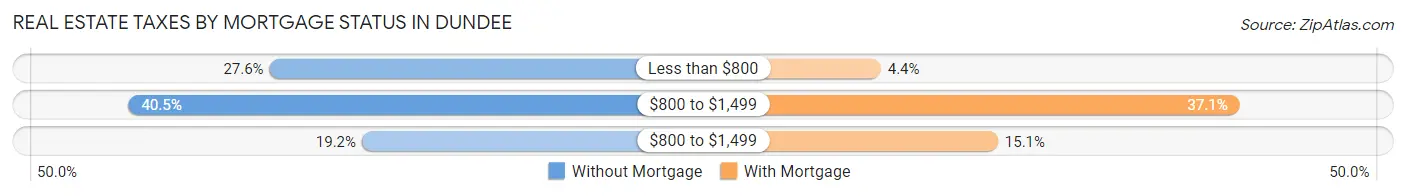
| Property Taxes | Without Mortgage | With Mortgage |
| Less than $800 | 131 (27.6%) | 31 (4.4%) |
| $800 to $1,499 | 192 (40.5%) | 264 (37.1%) |
| $800 to $1,499 | 91 (19.2%) | 107 (15.0%) |
| Total | 474 (100.0%) | 711 (100.0%) |
Health & Disability in Dundee
Health Insurance Coverage by Age in Dundee
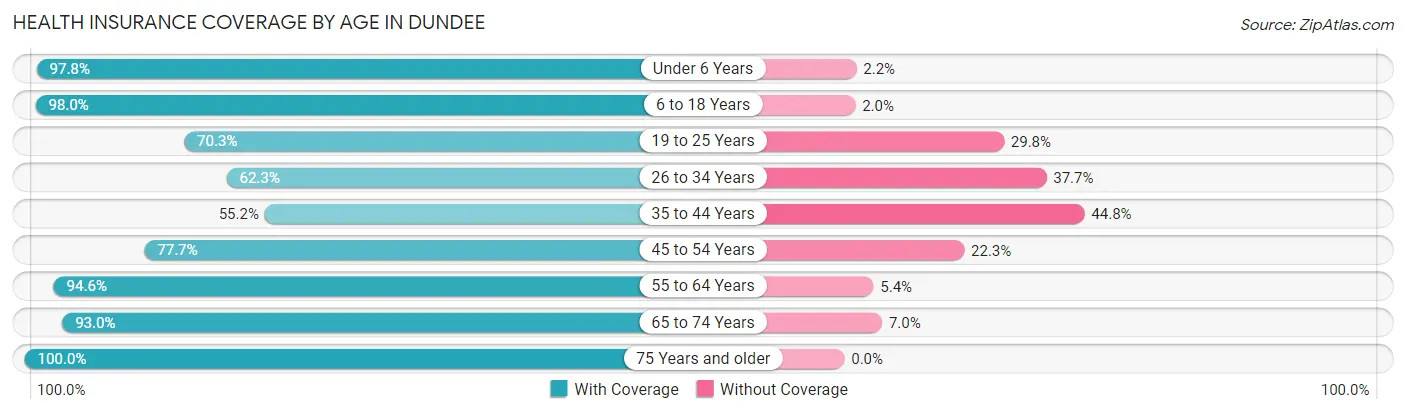
| Age Bracket | With Coverage | Without Coverage |
| Under 6 Years | 654 (97.8%) | 15 (2.2%) |
| 6 to 18 Years | 822 (98.0%) | 17 (2.0%) |
| 19 to 25 Years | 307 (70.3%) | 130 (29.7%) |
| 26 to 34 Years | 748 (62.3%) | 452 (37.7%) |
| 35 to 44 Years | 217 (55.2%) | 176 (44.8%) |
| 45 to 54 Years | 365 (77.7%) | 105 (22.3%) |
| 55 to 64 Years | 524 (94.6%) | 30 (5.4%) |
| 65 to 74 Years | 583 (93.0%) | 44 (7.0%) |
| 75 Years and older | 184 (100.0%) | 0 (0.0%) |
| Total | 4,404 (82.0%) | 969 (18.0%) |
Health Insurance Coverage by Citizenship Status in Dundee
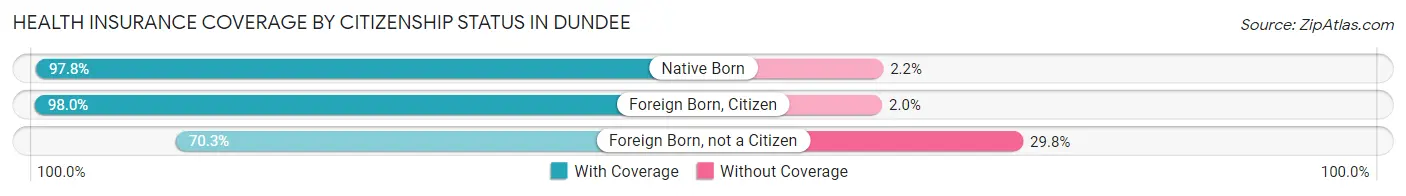
| Citizenship Status | With Coverage | Without Coverage |
| Native Born | 654 (97.8%) | 15 (2.2%) |
| Foreign Born, Citizen | 822 (98.0%) | 17 (2.0%) |
| Foreign Born, not a Citizen | 307 (70.3%) | 130 (29.7%) |
Health Insurance Coverage by Household Income in Dundee
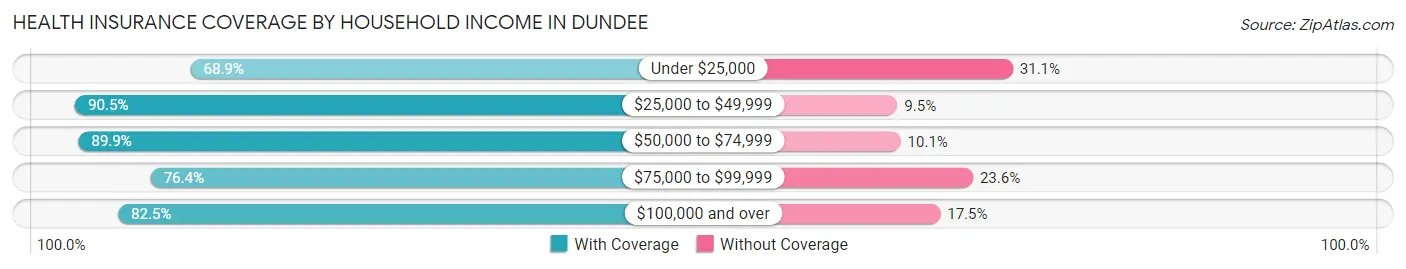
| Household Income | With Coverage | Without Coverage |
| Under $25,000 | 1,052 (68.9%) | 475 (31.1%) |
| $25,000 to $49,999 | 678 (90.5%) | 71 (9.5%) |
| $50,000 to $74,999 | 1,773 (89.9%) | 199 (10.1%) |
| $75,000 to $99,999 | 336 (76.4%) | 104 (23.6%) |
| $100,000 and over | 565 (82.5%) | 120 (17.5%) |
Public vs Private Health Insurance Coverage by Age in Dundee
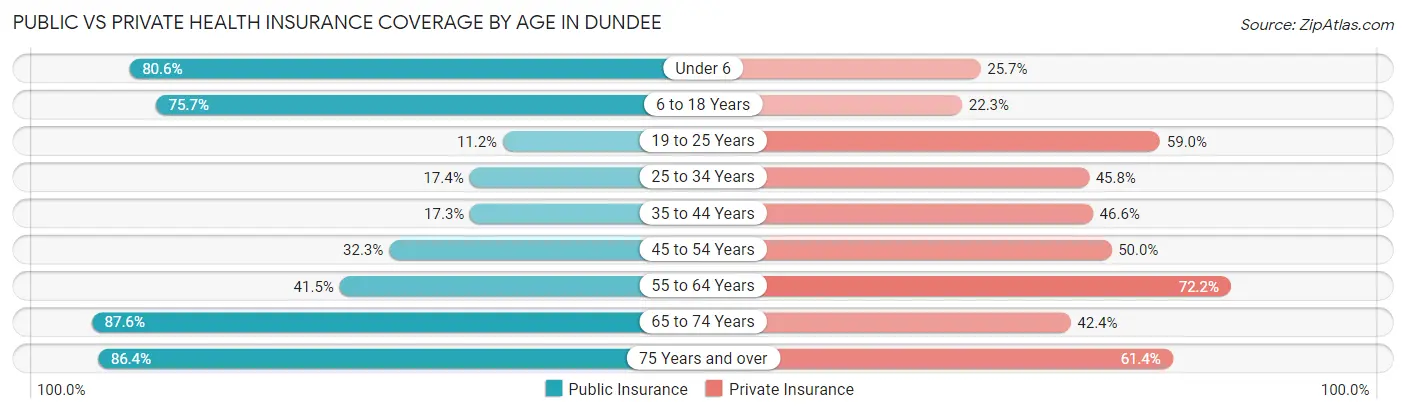
| Age Bracket | Public Insurance | Private Insurance |
| Under 6 | 539 (80.6%) | 172 (25.7%) |
| 6 to 18 Years | 635 (75.7%) | 187 (22.3%) |
| 19 to 25 Years | 49 (11.2%) | 258 (59.0%) |
| 25 to 34 Years | 209 (17.4%) | 550 (45.8%) |
| 35 to 44 Years | 68 (17.3%) | 183 (46.6%) |
| 45 to 54 Years | 152 (32.3%) | 235 (50.0%) |
| 55 to 64 Years | 230 (41.5%) | 400 (72.2%) |
| 65 to 74 Years | 549 (87.6%) | 266 (42.4%) |
| 75 Years and over | 159 (86.4%) | 113 (61.4%) |
| Total | 2,590 (48.2%) | 2,364 (44.0%) |
Disability Status by Sex by Age in Dundee
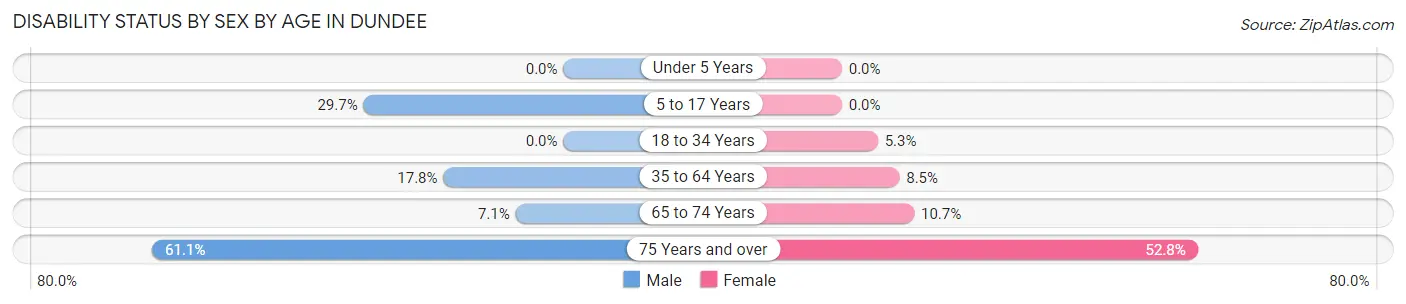
| Age Bracket | Male | Female |
| Under 5 Years | 0 (0.0%) | 0 (0.0%) |
| 5 to 17 Years | 130 (29.7%) | 0 (0.0%) |
| 18 to 34 Years | 0 (0.0%) | 39 (5.3%) |
| 35 to 64 Years | 121 (17.8%) | 63 (8.5%) |
| 65 to 74 Years | 24 (7.1%) | 31 (10.7%) |
| 75 Years and over | 80 (61.1%) | 28 (52.8%) |
Disability Class by Sex by Age in Dundee
Disability Class: Hearing Difficulty
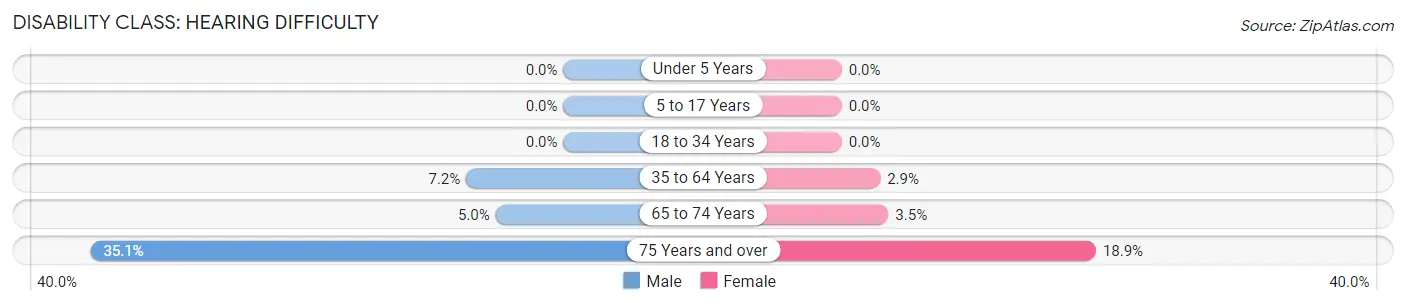
| Age Bracket | Male | Female |
| Under 5 Years | 0 (0.0%) | 0 (0.0%) |
| 5 to 17 Years | 0 (0.0%) | 0 (0.0%) |
| 18 to 34 Years | 0 (0.0%) | 0 (0.0%) |
| 35 to 64 Years | 49 (7.2%) | 21 (2.9%) |
| 65 to 74 Years | 17 (5.0%) | 10 (3.5%) |
| 75 Years and over | 46 (35.1%) | 10 (18.9%) |
Disability Class: Vision Difficulty
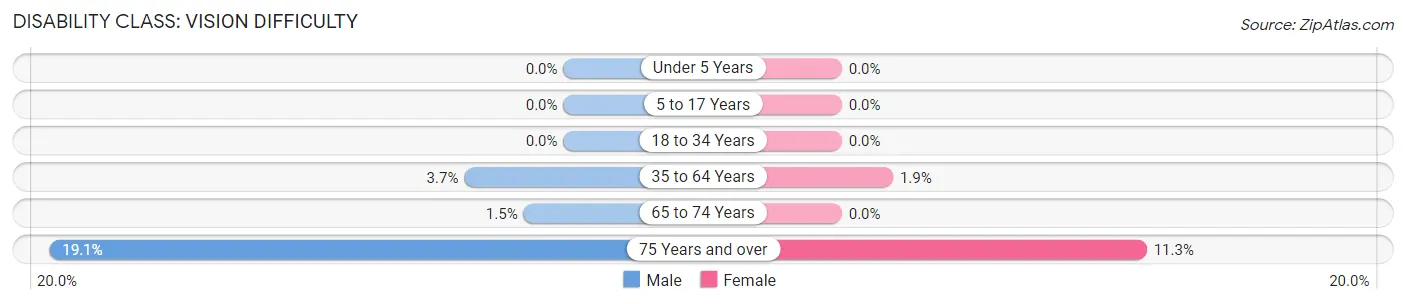
| Age Bracket | Male | Female |
| Under 5 Years | 0 (0.0%) | 0 (0.0%) |
| 5 to 17 Years | 0 (0.0%) | 0 (0.0%) |
| 18 to 34 Years | 0 (0.0%) | 0 (0.0%) |
| 35 to 64 Years | 25 (3.7%) | 14 (1.9%) |
| 65 to 74 Years | 5 (1.5%) | 0 (0.0%) |
| 75 Years and over | 25 (19.1%) | 6 (11.3%) |
Disability Class: Cognitive Difficulty
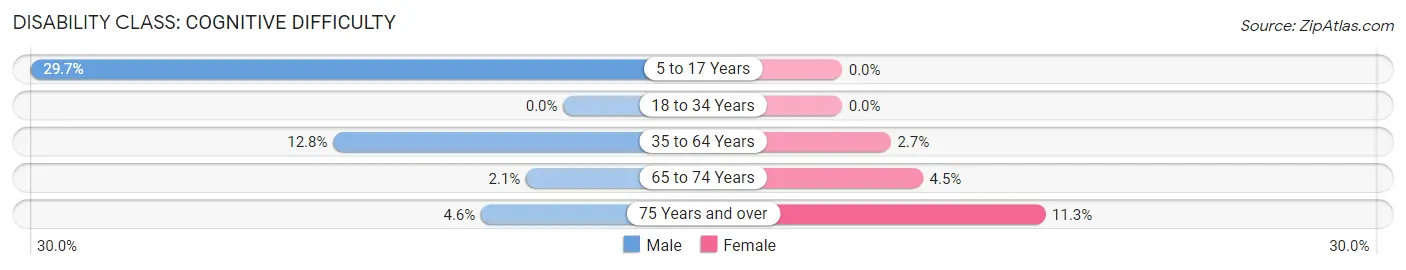
| Age Bracket | Male | Female |
| 5 to 17 Years | 130 (29.7%) | 0 (0.0%) |
| 18 to 34 Years | 0 (0.0%) | 0 (0.0%) |
| 35 to 64 Years | 87 (12.8%) | 20 (2.7%) |
| 65 to 74 Years | 7 (2.1%) | 13 (4.5%) |
| 75 Years and over | 6 (4.6%) | 6 (11.3%) |
Disability Class: Ambulatory Difficulty
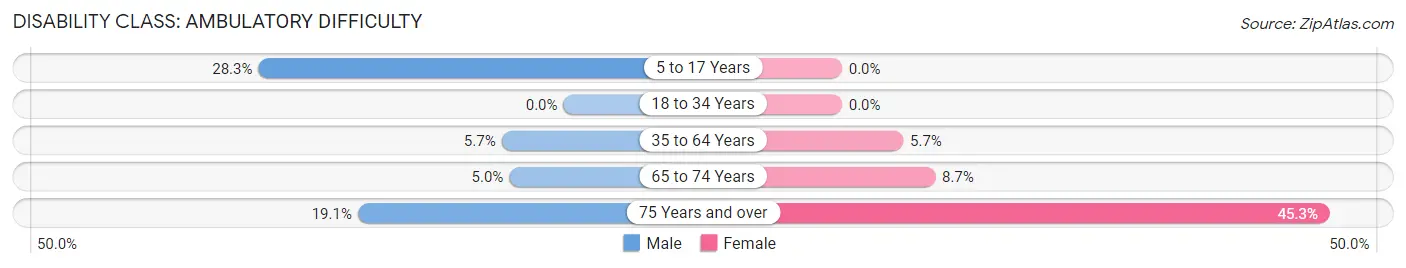
| Age Bracket | Male | Female |
| 5 to 17 Years | 124 (28.3%) | 0 (0.0%) |
| 18 to 34 Years | 0 (0.0%) | 0 (0.0%) |
| 35 to 64 Years | 39 (5.7%) | 42 (5.7%) |
| 65 to 74 Years | 17 (5.0%) | 25 (8.6%) |
| 75 Years and over | 25 (19.1%) | 24 (45.3%) |
Disability Class: Self-Care Difficulty
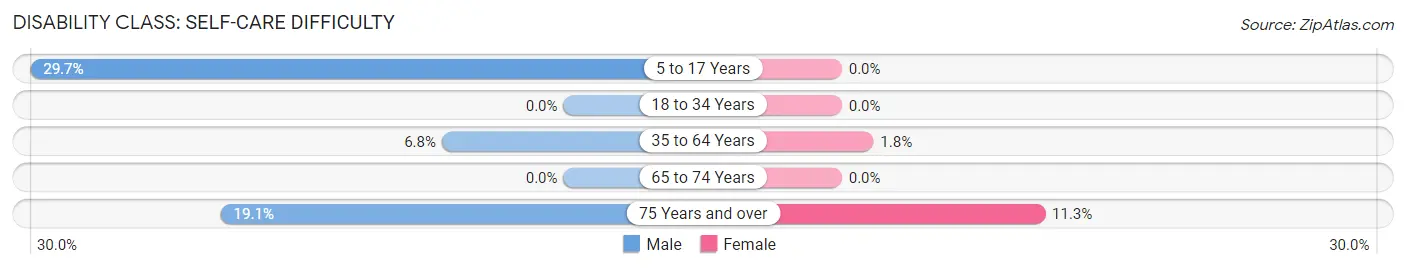
| Age Bracket | Male | Female |
| 5 to 17 Years | 130 (29.7%) | 0 (0.0%) |
| 18 to 34 Years | 0 (0.0%) | 0 (0.0%) |
| 35 to 64 Years | 46 (6.8%) | 13 (1.8%) |
| 65 to 74 Years | 0 (0.0%) | 0 (0.0%) |
| 75 Years and over | 25 (19.1%) | 6 (11.3%) |
Technology Access in Dundee
Computing Device Access in Dundee
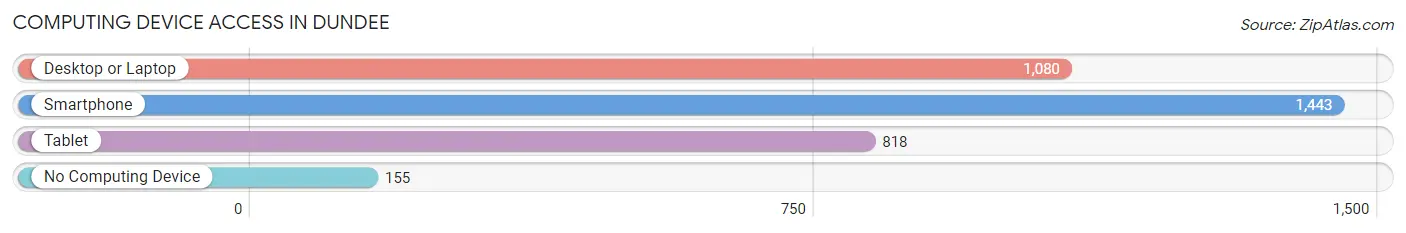
| Device Type | # Households | % Households |
| Desktop or Laptop | 1,080 | 66.3% |
| Smartphone | 1,443 | 88.6% |
| Tablet | 818 | 50.2% |
| No Computing Device | 155 | 9.5% |
| Total | 1,629 | 100.0% |
Internet Access in Dundee
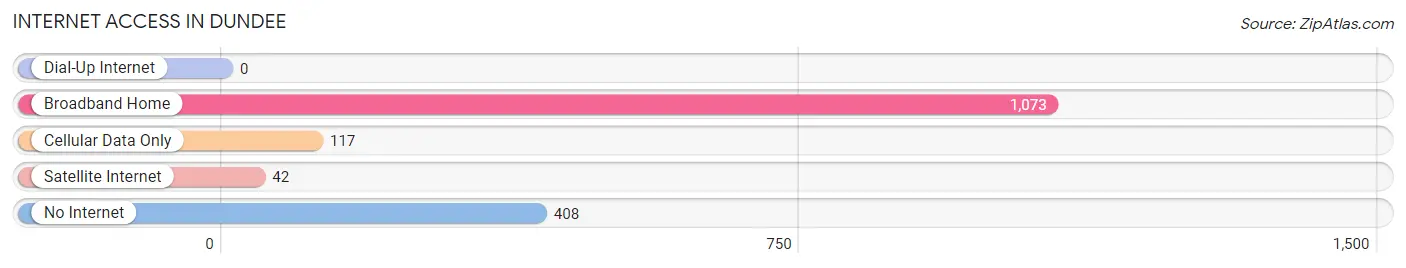
| Internet Type | # Households | % Households |
| Dial-Up Internet | 0 | 0.0% |
| Broadband Home | 1,073 | 65.9% |
| Cellular Data Only | 117 | 7.2% |
| Satellite Internet | 42 | 2.6% |
| No Internet | 408 | 25.1% |
| Total | 1,629 | 100.0% |
Dundee Summary
Dundee is a small town located in Polk County, Florida. It is situated on the eastern shore of Lake Hancock, approximately 25 miles east of Tampa. The town was founded in 1882 and has a population of approximately 3,000 people.
History
Dundee was founded in 1882 by a group of settlers from Scotland. The town was named after the city of Dundee in Scotland. The settlers were attracted to the area due to its fertile soil and abundant natural resources. The town quickly grew and by the early 1900s, it had become a thriving agricultural center. The town was also known for its citrus industry, which was a major source of income for many of the town’s residents.
In the early 1900s, Dundee was also home to a large number of African-American residents. The town was a popular destination for African-Americans who were looking for work in the citrus industry. The town also had a thriving African-American business district, which included a number of stores, restaurants, and other businesses.
Geography
Dundee is located in Polk County, Florida. It is situated on the eastern shore of Lake Hancock, approximately 25 miles east of Tampa. The town is located in a flat, low-lying area, with an elevation of just over 100 feet. The town is surrounded by citrus groves and other agricultural land.
Economy
Dundee’s economy is largely based on agriculture. The town is home to a number of citrus groves, as well as other agricultural businesses. The town is also home to a number of manufacturing and service businesses. The town is also home to a number of retail stores, restaurants, and other businesses.
Demographics
As of the 2010 census, Dundee had a population of 3,000 people. The town is predominantly white, with a small African-American population. The median household income in Dundee is $37,000, and the median home value is $125,000. The town has a low unemployment rate, and the majority of the population is employed in the agricultural and service industries.
Dundee is a small town with a rich history and a vibrant economy. The town is home to a diverse population and is a great place to live and work. The town is also home to a number of businesses, restaurants, and other attractions. Dundee is a great place to visit and explore, and it is sure to provide a unique and enjoyable experience for all who visit.
Common Questions
What is Per Capita Income in Dundee?
Per Capita income in Dundee is $17,659.
What is the Median Family Income in Dundee?
Median Family Income in Dundee is $52,912.
What is the Median Household income in Dundee?
Median Household Income in Dundee is $44,936.
What is Income or Wage Gap in Dundee?
Income or Wage Gap in Dundee is 1.8%.
Women in Dundee earn 98.2 cents for every dollar earned by a man.
What is Family Income Deficit in Dundee?
Family Income Deficit in Dundee is $9,740.
Families that are below poverty line in Dundee earn $9,740 less on average than the poverty threshold level.
What is Inequality or Gini Index in Dundee?
Inequality or Gini Index in Dundee is 0.40.
What is the Total Population of Dundee?
Total Population of Dundee is 5,373.
What is the Total Male Population of Dundee?
Total Male Population of Dundee is 2,877.
What is the Total Female Population of Dundee?
Total Female Population of Dundee is 2,496.
What is the Ratio of Males per 100 Females in Dundee?
There are 115.26 Males per 100 Females in Dundee.
What is the Ratio of Females per 100 Males in Dundee?
There are 86.76 Females per 100 Males in Dundee.
What is the Median Population Age in Dundee?
Median Population Age in Dundee is 32.6 Years.
What is the Average Family Size in Dundee
Average Family Size in Dundee is 3.7 People.
What is the Average Household Size in Dundee
Average Household Size in Dundee is 3.3 People.
How Large is the Labor Force in Dundee?
There are 2,200 People in the Labor Forcein in Dundee.
What is the Percentage of People in the Labor Force in Dundee?
54.0% of People are in the Labor Force in Dundee.
What is the Unemployment Rate in Dundee?
Unemployment Rate in Dundee is 0.2%.