Cape May Court House, NJ Map & Demographics
Cape May Court House Map
Cape May Court House Overview
$40,983
PER CAPITA INCOME
$85,443
AVG FAMILY INCOME
$66,422
AVG HOUSEHOLD INCOME
17.0%
WAGE / INCOME GAP [ % ]
83.0¢/ $1
WAGE / INCOME GAP [ $ ]
0.47
INEQUALITY / GINI INDEX
5,557
TOTAL POPULATION
2,590
MALE POPULATION
2,967
FEMALE POPULATION
87.29
MALES / 100 FEMALES
114.56
FEMALES / 100 MALES
44.9
MEDIAN AGE
2.6
AVG FAMILY SIZE
2.1
AVG HOUSEHOLD SIZE
2,437
LABOR FORCE [ PEOPLE ]
53.1%
PERCENT IN LABOR FORCE
6.9%
UNEMPLOYMENT RATE
Cape May Court House Zip Codes
Cape May Court House Area Codes
Income in Cape May Court House
Income Overview in Cape May Court House
Per Capita Income in Cape May Court House is $40,983, while median incomes of families and households are $85,443 and $66,422 respectively.
| Characteristic | Number | Measure |
| Per Capita Income | 5,557 | $40,983 |
| Median Family Income | 1,647 | $85,443 |
| Mean Family Income | 1,647 | $108,532 |
| Median Household Income | 2,586 | $66,422 |
| Mean Household Income | 2,586 | $91,258 |
| Income Deficit | 1,647 | $0 |
| Wage / Income Gap (%) | 5,557 | 16.95% |
| Wage / Income Gap ($) | 5,557 | 83.05¢ per $1 |
| Gini / Inequality Index | 5,557 | 0.47 |
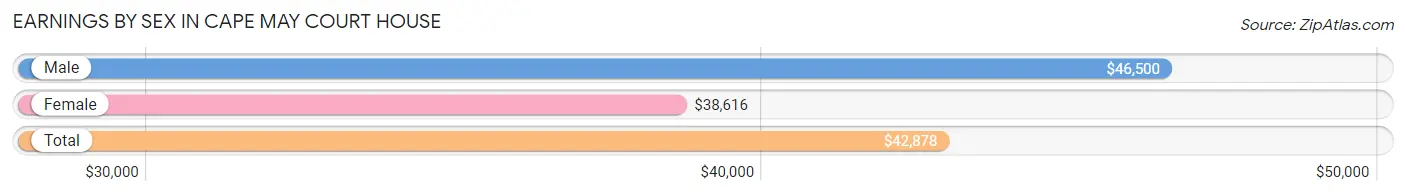
Earnings by Sex in Cape May Court House
Average Earnings in Cape May Court House are $42,878, $46,500 for men and $38,616 for women, a difference of 17.0%.
| Sex | Number | Average Earnings |
| Male | 1,196 (46.0%) | $46,500 |
| Female | 1,405 (54.0%) | $38,616 |
| Total | 2,601 (100.0%) | $42,878 |
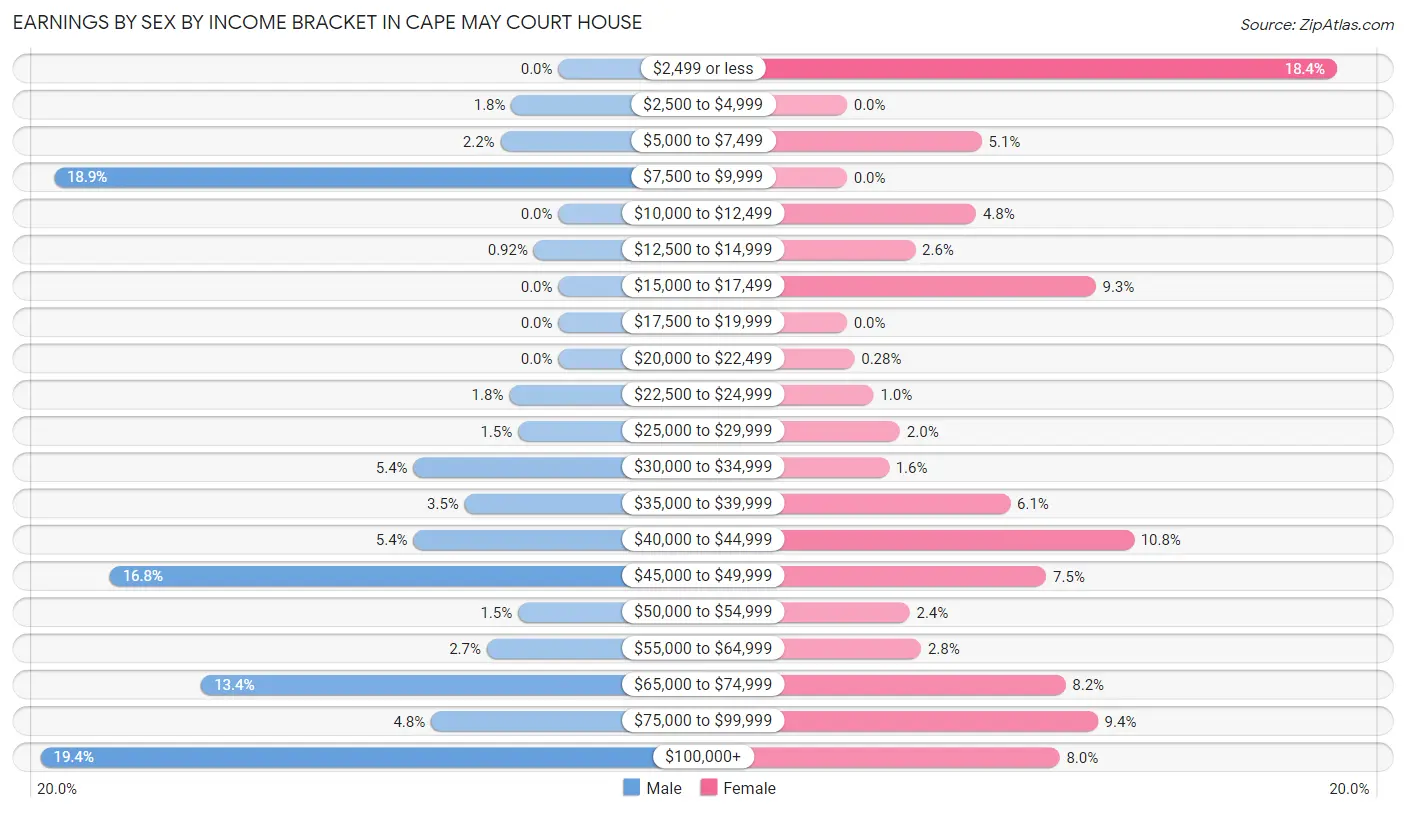
Earnings by Sex by Income Bracket in Cape May Court House
The most common earnings brackets in Cape May Court House are $100,000+ for men (232 | 19.4%) and $2,499 or less for women (258 | 18.4%).
| Income | Male | Female |
| $2,499 or less | 0 (0.0%) | 258 (18.4%) |
| $2,500 to $4,999 | 21 (1.8%) | 0 (0.0%) |
| $5,000 to $7,499 | 26 (2.2%) | 71 (5.1%) |
| $7,500 to $9,999 | 226 (18.9%) | 0 (0.0%) |
| $10,000 to $12,499 | 0 (0.0%) | 68 (4.8%) |
| $12,500 to $14,999 | 11 (0.9%) | 36 (2.6%) |
| $15,000 to $17,499 | 0 (0.0%) | 131 (9.3%) |
| $17,500 to $19,999 | 0 (0.0%) | 0 (0.0%) |
| $20,000 to $22,499 | 0 (0.0%) | 4 (0.3%) |
| $22,500 to $24,999 | 22 (1.8%) | 14 (1.0%) |
| $25,000 to $29,999 | 18 (1.5%) | 28 (2.0%) |
| $30,000 to $34,999 | 65 (5.4%) | 22 (1.6%) |
| $35,000 to $39,999 | 42 (3.5%) | 86 (6.1%) |
| $40,000 to $44,999 | 65 (5.4%) | 151 (10.7%) |
| $45,000 to $49,999 | 201 (16.8%) | 105 (7.5%) |
| $50,000 to $54,999 | 18 (1.5%) | 33 (2.4%) |
| $55,000 to $64,999 | 32 (2.7%) | 39 (2.8%) |
| $65,000 to $74,999 | 160 (13.4%) | 115 (8.2%) |
| $75,000 to $99,999 | 57 (4.8%) | 132 (9.4%) |
| $100,000+ | 232 (19.4%) | 112 (8.0%) |
| Total | 1,196 (100.0%) | 1,405 (100.0%) |
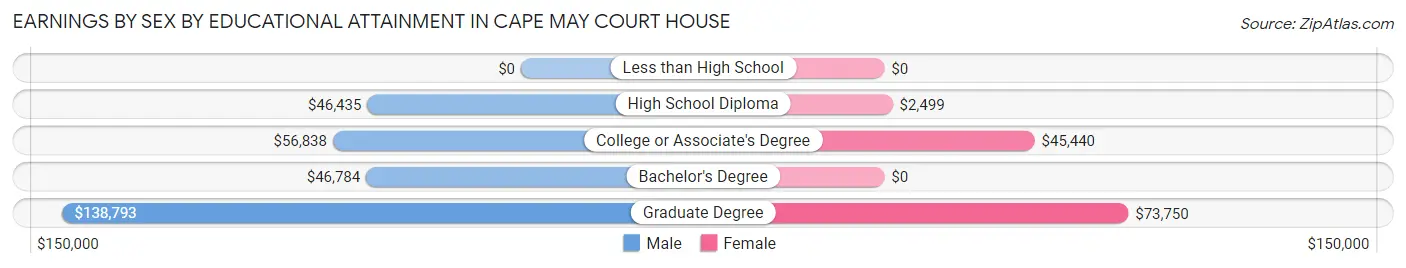
Earnings by Sex by Educational Attainment in Cape May Court House
Average earnings in Cape May Court House are $48,911 for men and $41,191 for women, a difference of 15.8%. Men with an educational attainment of graduate degree enjoy the highest average annual earnings of $138,793, while those with high school diploma education earn the least with $46,435. Women with an educational attainment of graduate degree earn the most with the average annual earnings of $73,750, while those with high school diploma education have the smallest earnings of $2,499.
| Educational Attainment | Male Income | Female Income |
| Less than High School | - | - |
| High School Diploma | $46,435 | $2,499 |
| College or Associate's Degree | $56,838 | $45,440 |
| Bachelor's Degree | $46,784 | $0 |
| Graduate Degree | $138,793 | $73,750 |
| Total | $48,911 | $41,191 |
Family Income in Cape May Court House
Family Income Brackets in Cape May Court House
According to the Cape May Court House family income data, there are 324 families falling into the $100,000 to $149,999 income range, which is the most common income bracket and makes up 19.7% of all families. Conversely, the $25,000 to $34,999 income bracket is the least frequent group with only 20 families (1.2%) belonging to this category.
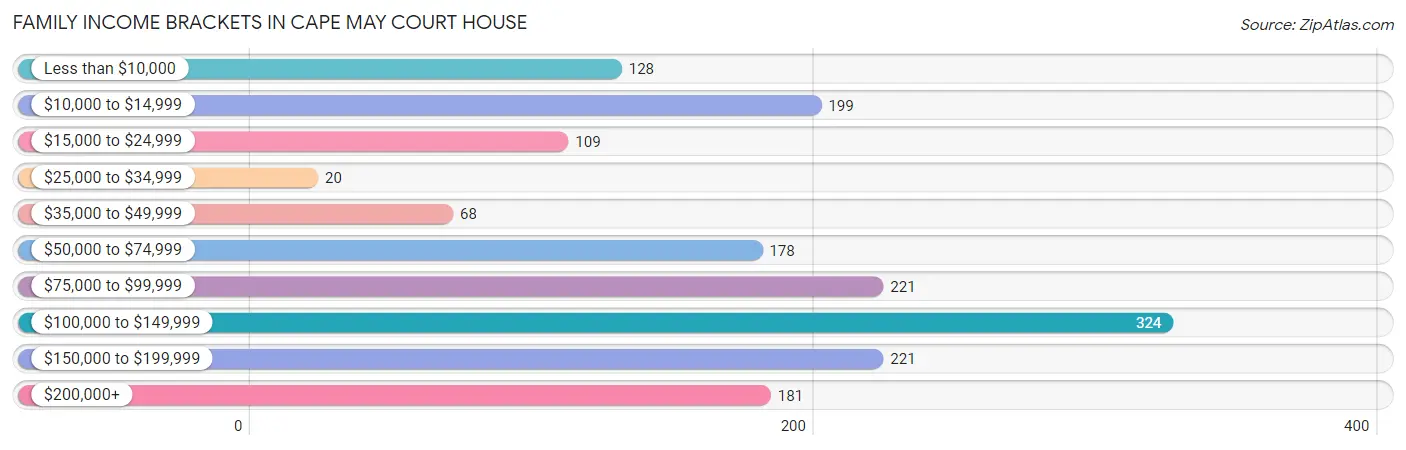
| Income Bracket | # Families | % Families |
| Less than $10,000 | 128 | 7.8% |
| $10,000 to $14,999 | 199 | 12.1% |
| $15,000 to $24,999 | 109 | 6.6% |
| $25,000 to $34,999 | 20 | 1.2% |
| $35,000 to $49,999 | 68 | 4.1% |
| $50,000 to $74,999 | 178 | 10.8% |
| $75,000 to $99,999 | 221 | 13.4% |
| $100,000 to $149,999 | 324 | 19.7% |
| $150,000 to $199,999 | 221 | 13.4% |
| $200,000+ | 181 | 11.0% |
Family Income by Famaliy Size in Cape May Court House
3-person families (150 | 9.1%) account for the highest median family income in Cape May Court House with $113,846 per family, while 2-person families (1,034 | 62.8%) have the highest median income of $39,594 per family member.
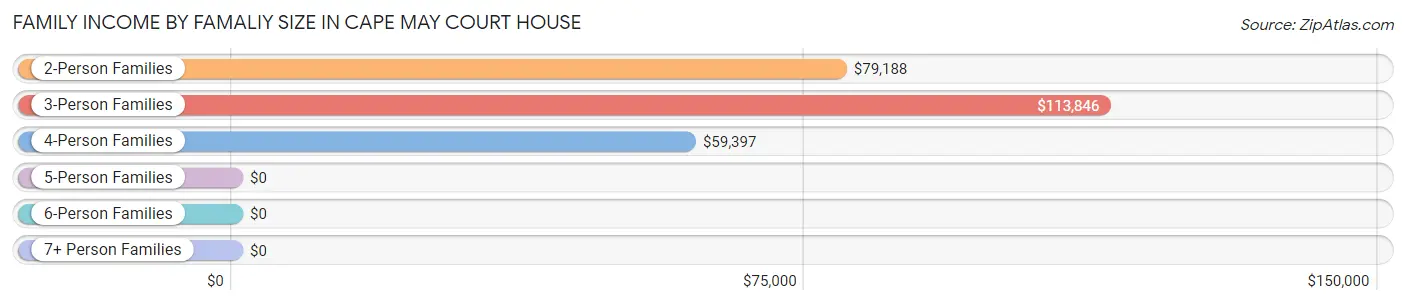
| Income Bracket | # Families | Median Income |
| 2-Person Families | 1,034 (62.8%) | $79,188 |
| 3-Person Families | 150 (9.1%) | $113,846 |
| 4-Person Families | 326 (19.8%) | $59,397 |
| 5-Person Families | 95 (5.8%) | $0 |
| 6-Person Families | 0 (0.0%) | $0 |
| 7+ Person Families | 42 (2.5%) | $0 |
| Total | 1,647 (100.0%) | $85,443 |
Family Income by Number of Earners in Cape May Court House
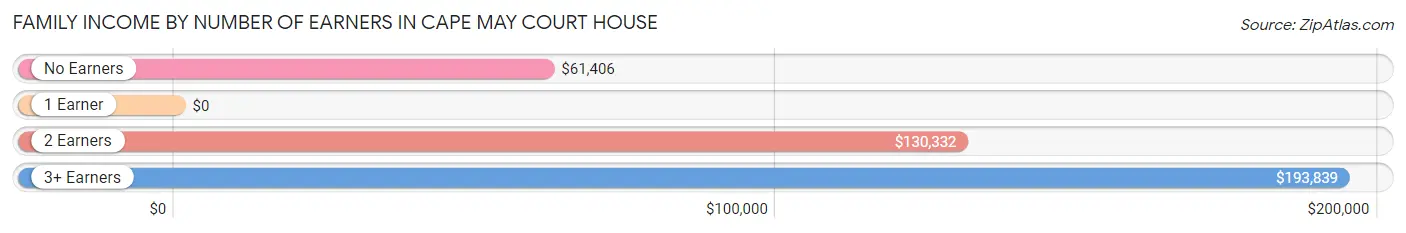
| Number of Earners | # Families | Median Income |
| No Earners | 366 (22.2%) | $61,406 |
| 1 Earner | 486 (29.5%) | $0 |
| 2 Earners | 754 (45.8%) | $130,332 |
| 3+ Earners | 41 (2.5%) | $193,839 |
| Total | 1,647 (100.0%) | $85,443 |
Household Income in Cape May Court House
Household Income Brackets in Cape May Court House
With 411 households falling in the category, the $100,000 to $149,999 income range is the most frequent in Cape May Court House, accounting for 15.9% of all households. In contrast, only 70 households (2.7%) fall into the $25,000 to $34,999 income bracket, making it the least populous group.
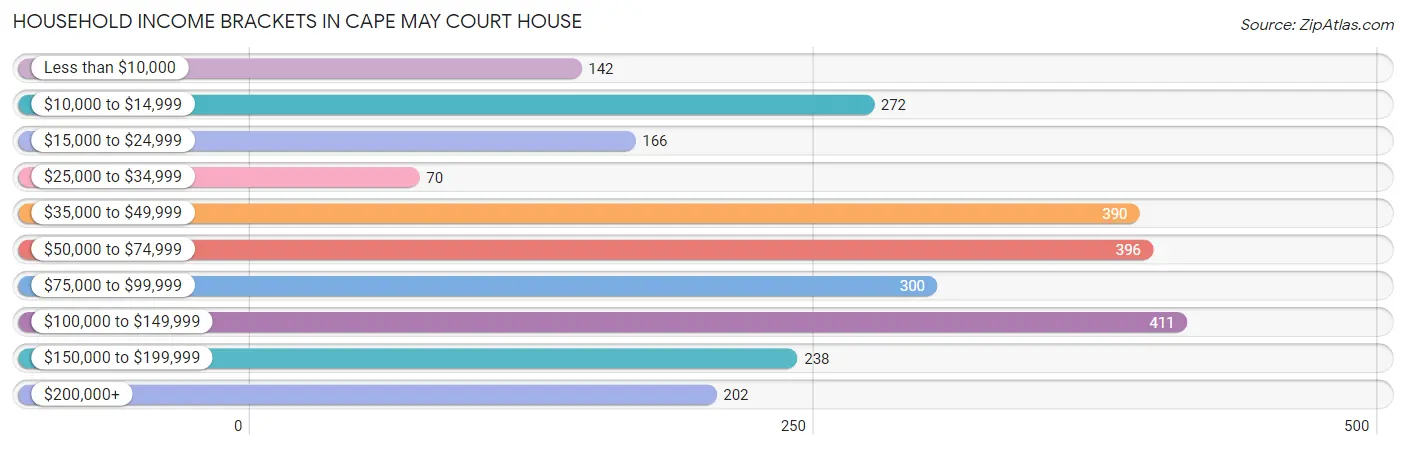
| Income Bracket | # Households | % Households |
| Less than $10,000 | 142 | 5.5% |
| $10,000 to $14,999 | 272 | 10.5% |
| $15,000 to $24,999 | 166 | 6.4% |
| $25,000 to $34,999 | 70 | 2.7% |
| $35,000 to $49,999 | 390 | 15.1% |
| $50,000 to $74,999 | 396 | 15.3% |
| $75,000 to $99,999 | 300 | 11.6% |
| $100,000 to $149,999 | 411 | 15.9% |
| $150,000 to $199,999 | 238 | 9.2% |
| $200,000+ | 202 | 7.8% |
Household Income by Householder Age in Cape May Court House
The median household income in Cape May Court House is $66,422, with the highest median household income of $85,774 found in the 45 to 64 years age bracket for the primary householder. A total of 561 households (21.7%) fall into this category. Meanwhile, the 15 to 24 years age bracket for the primary householder has the lowest median household income of $0, with 180 households (7.0%) in this group.
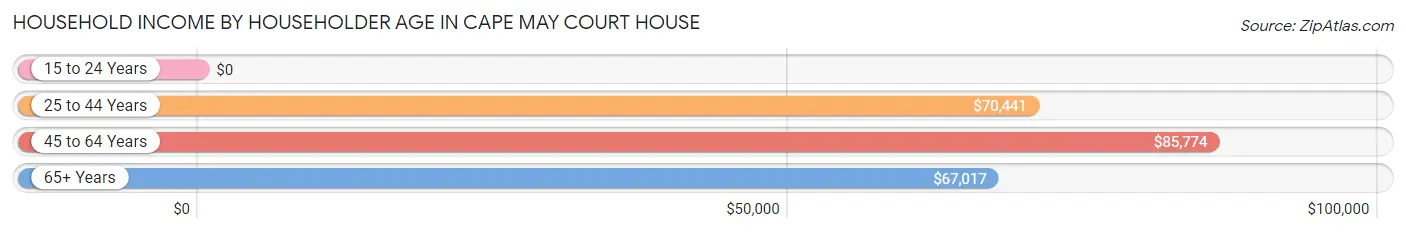
| Income Bracket | # Households | Median Income |
| 15 to 24 Years | 180 (7.0%) | $0 |
| 25 to 44 Years | 824 (31.9%) | $70,441 |
| 45 to 64 Years | 561 (21.7%) | $85,774 |
| 65+ Years | 1,021 (39.5%) | $67,017 |
| Total | 2,586 (100.0%) | $66,422 |
Poverty in Cape May Court House
Income Below Poverty by Sex and Age in Cape May Court House
With 20.6% poverty level for males and 14.1% for females among the residents of Cape May Court House, 5 year old males and 25 to 34 year old females are the most vulnerable to poverty, with 34 males (100.0%) and 144 females (38.4%) in their respective age groups living below the poverty level.
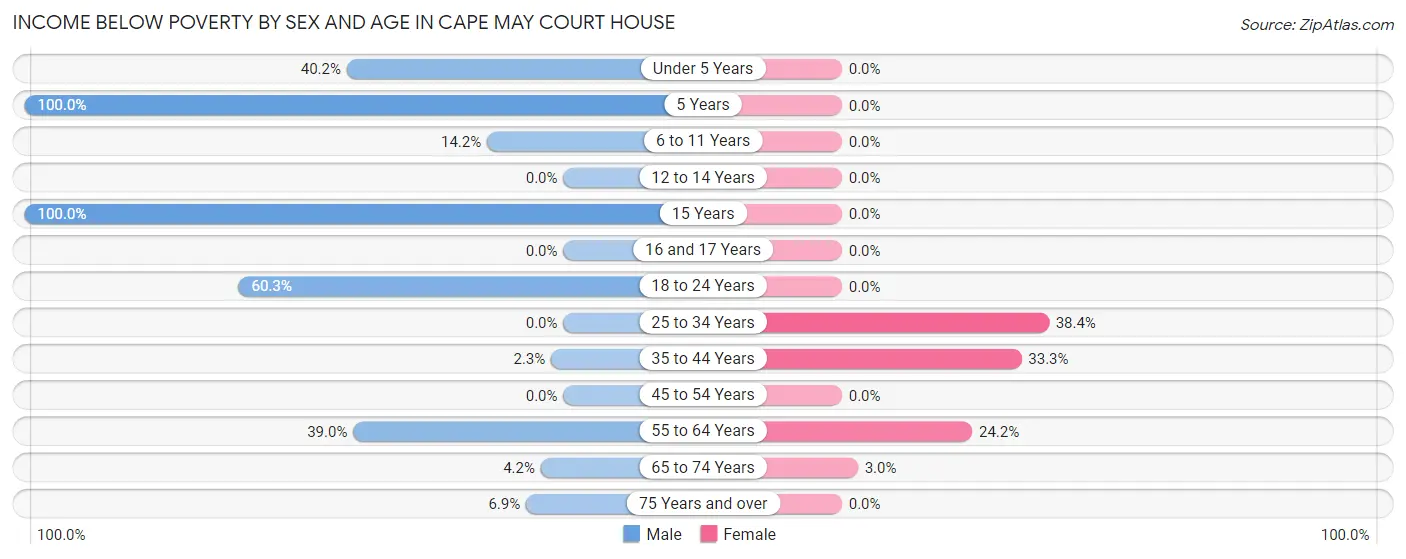
| Age Bracket | Male | Female |
| Under 5 Years | 82 (40.2%) | 0 (0.0%) |
| 5 Years | 34 (100.0%) | 0 (0.0%) |
| 6 to 11 Years | 34 (14.2%) | 0 (0.0%) |
| 12 to 14 Years | 0 (0.0%) | 0 (0.0%) |
| 15 Years | 91 (100.0%) | 0 (0.0%) |
| 16 and 17 Years | 0 (0.0%) | 0 (0.0%) |
| 18 to 24 Years | 129 (60.3%) | 0 (0.0%) |
| 25 to 34 Years | 0 (0.0%) | 144 (38.4%) |
| 35 to 44 Years | 5 (2.3%) | 160 (33.3%) |
| 45 to 54 Years | 0 (0.0%) | 0 (0.0%) |
| 55 to 64 Years | 94 (39.0%) | 80 (24.2%) |
| 65 to 74 Years | 15 (4.2%) | 18 (2.9%) |
| 75 Years and over | 26 (6.9%) | 0 (0.0%) |
| Total | 510 (20.6%) | 402 (14.1%) |
Income Above Poverty by Sex and Age in Cape May Court House
According to the poverty statistics in Cape May Court House, males aged 12 to 14 years and females aged under 5 years are the age groups that are most secure financially, with 100.0% of males and 100.0% of females in these age groups living above the poverty line.
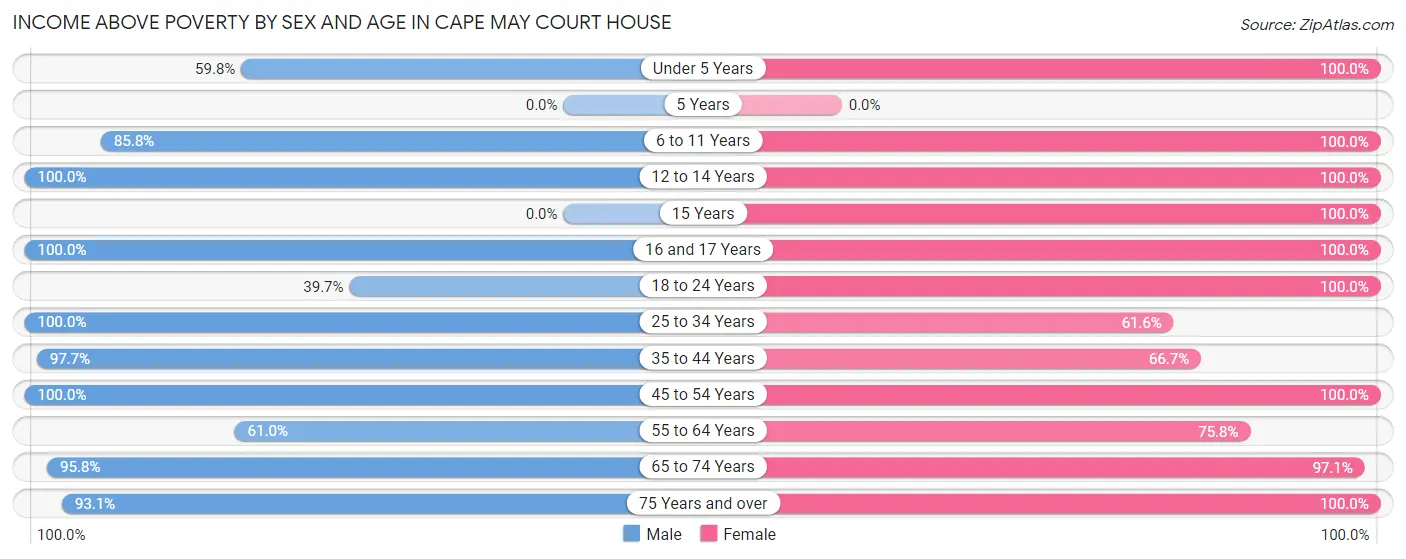
| Age Bracket | Male | Female |
| Under 5 Years | 122 (59.8%) | 33 (100.0%) |
| 5 Years | 0 (0.0%) | 0 (0.0%) |
| 6 to 11 Years | 206 (85.8%) | 152 (100.0%) |
| 12 to 14 Years | 97 (100.0%) | 62 (100.0%) |
| 15 Years | 0 (0.0%) | 35 (100.0%) |
| 16 and 17 Years | 33 (100.0%) | 71 (100.0%) |
| 18 to 24 Years | 85 (39.7%) | 236 (100.0%) |
| 25 to 34 Years | 197 (100.0%) | 231 (61.6%) |
| 35 to 44 Years | 215 (97.7%) | 320 (66.7%) |
| 45 to 54 Years | 169 (100.0%) | 177 (100.0%) |
| 55 to 64 Years | 147 (61.0%) | 251 (75.8%) |
| 65 to 74 Years | 344 (95.8%) | 592 (97.1%) |
| 75 Years and over | 349 (93.1%) | 298 (100.0%) |
| Total | 1,964 (79.4%) | 2,458 (85.9%) |
Income Below Poverty Among Married-Couple Families in Cape May Court House
The poverty statistics for married-couple families in Cape May Court House show that 4.1% or 47 of the total 1,157 families live below the poverty line. Families with no children have the highest poverty rate of 5.4%, comprising of 47 families. On the other hand, families with 1 or 2 children have the lowest poverty rate of 0.0%, which includes 0 families.
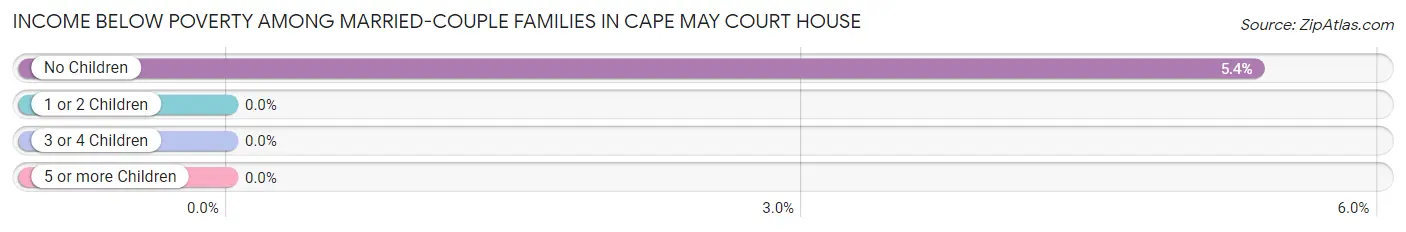
| Children | Above Poverty | Below Poverty |
| No Children | 830 (94.6%) | 47 (5.4%) |
| 1 or 2 Children | 168 (100.0%) | 0 (0.0%) |
| 3 or 4 Children | 81 (100.0%) | 0 (0.0%) |
| 5 or more Children | 31 (100.0%) | 0 (0.0%) |
| Total | 1,110 (95.9%) | 47 (4.1%) |
Income Below Poverty Among Single-Parent Households in Cape May Court House
According to the poverty data in Cape May Court House, 82.0% or 100 single-father households and 78.3% or 288 single-mother households are living below the poverty line. Among single-father households, those with no children have the highest poverty rate, with 100 households (82.0%) experiencing poverty. Likewise, among single-mother households, those with 3 or 4 children have the highest poverty rate, with 116 households (100.0%) falling below the poverty line.
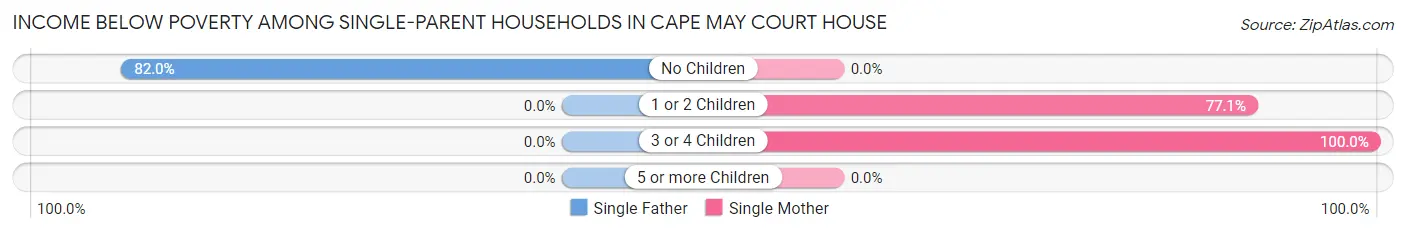
| Children | Single Father | Single Mother |
| No Children | 100 (82.0%) | 0 (0.0%) |
| 1 or 2 Children | 0 (0.0%) | 172 (77.1%) |
| 3 or 4 Children | 0 (0.0%) | 116 (100.0%) |
| 5 or more Children | 0 (0.0%) | 0 (0.0%) |
| Total | 100 (82.0%) | 288 (78.3%) |
Income Below Poverty Among Married-Couple vs Single-Parent Households in Cape May Court House
The poverty data for Cape May Court House shows that 47 of the married-couple family households (4.1%) and 388 of the single-parent households (79.2%) are living below the poverty level. Within the married-couple family households, those with no children have the highest poverty rate, with 47 households (5.4%) falling below the poverty line. Among the single-parent households, those with 3 or 4 children have the highest poverty rate, with 116 household (100.0%) living below poverty.
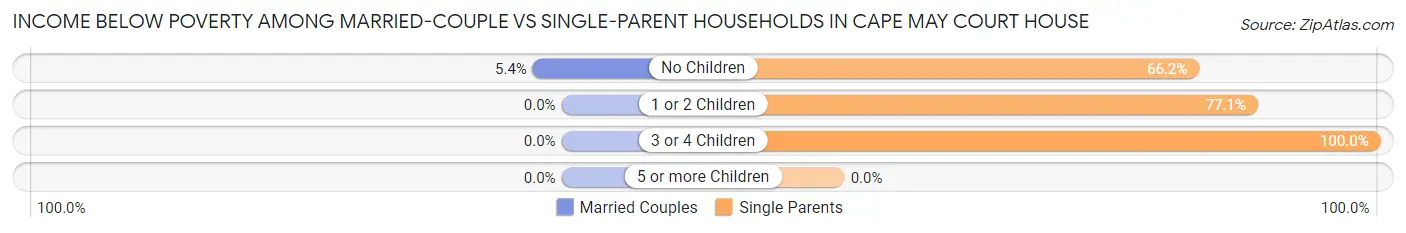
| Children | Married-Couple Families | Single-Parent Households |
| No Children | 47 (5.4%) | 100 (66.2%) |
| 1 or 2 Children | 0 (0.0%) | 172 (77.1%) |
| 3 or 4 Children | 0 (0.0%) | 116 (100.0%) |
| 5 or more Children | 0 (0.0%) | 0 (0.0%) |
| Total | 47 (4.1%) | 388 (79.2%) |
Race in Cape May Court House
The most populous races in Cape May Court House are White / Caucasian (4,534 | 81.6%), Hispanic or Latino (759 | 13.7%), and Two or more Races (356 | 6.4%).
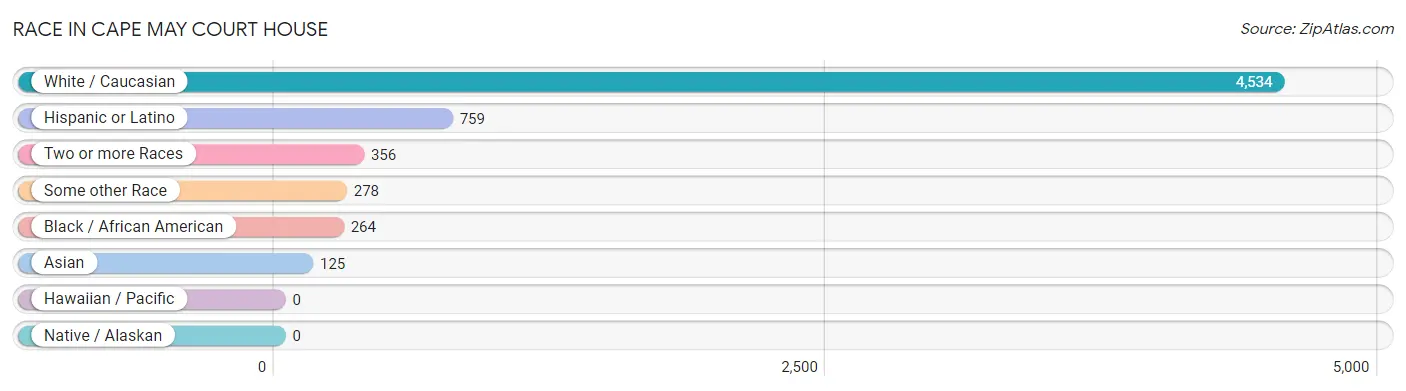
| Race | # Population | % Population |
| Asian | 125 | 2.2% |
| Black / African American | 264 | 4.8% |
| Hawaiian / Pacific | 0 | 0.0% |
| Hispanic or Latino | 759 | 13.7% |
| Native / Alaskan | 0 | 0.0% |
| White / Caucasian | 4,534 | 81.6% |
| Two or more Races | 356 | 6.4% |
| Some other Race | 278 | 5.0% |
| Total | 5,557 | 100.0% |
Ancestry in Cape May Court House
The most populous ancestries reported in Cape May Court House are Irish (1,361 | 24.5%), Italian (906 | 16.3%), English (843 | 15.2%), German (746 | 13.4%), and Polish (297 | 5.3%), together accounting for 74.7% of all Cape May Court House residents.
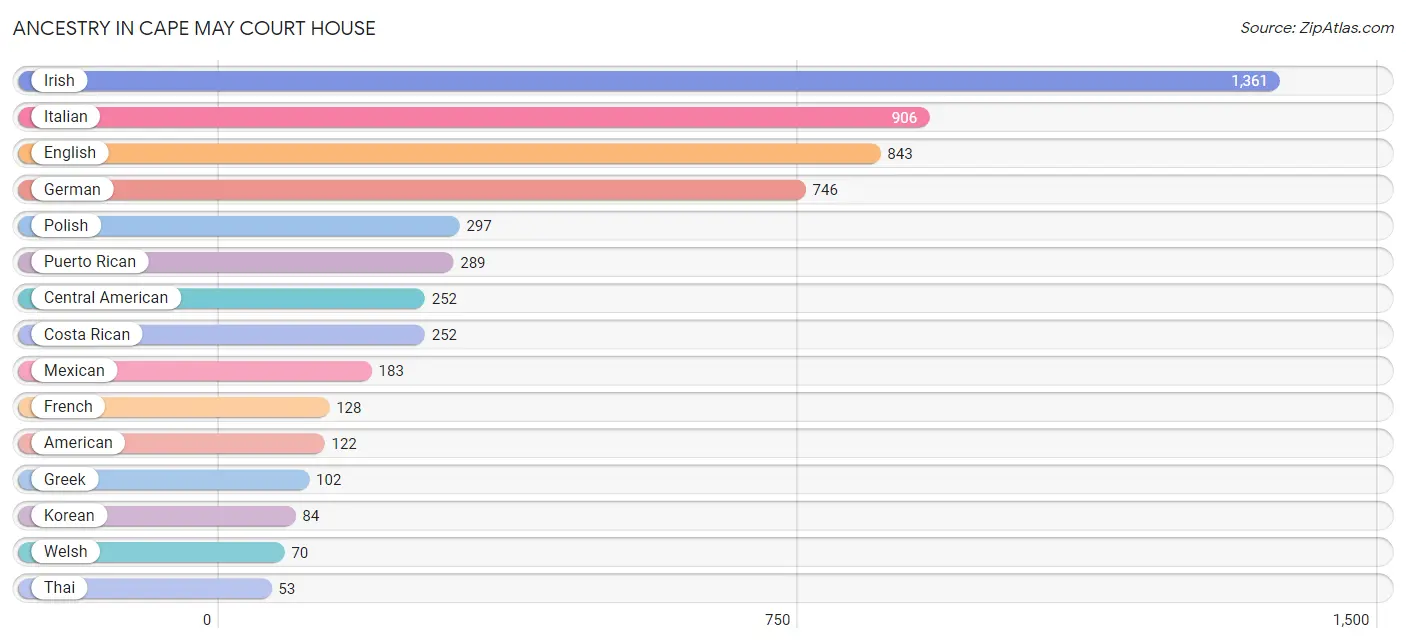
| Ancestry | # Population | % Population |
| American | 122 | 2.2% |
| Brazilian | 11 | 0.2% |
| British | 22 | 0.4% |
| Central American | 252 | 4.5% |
| Costa Rican | 252 | 4.5% |
| Dutch | 14 | 0.3% |
| English | 843 | 15.2% |
| French | 128 | 2.3% |
| German | 746 | 13.4% |
| Greek | 102 | 1.8% |
| Indian (Asian) | 48 | 0.9% |
| Irish | 1,361 | 24.5% |
| Italian | 906 | 16.3% |
| Korean | 84 | 1.5% |
| Mexican | 183 | 3.3% |
| Native Hawaiian | 25 | 0.4% |
| Norwegian | 16 | 0.3% |
| Okinawan | 19 | 0.3% |
| Polish | 297 | 5.3% |
| Puerto Rican | 289 | 5.2% |
| Russian | 35 | 0.6% |
| Scandinavian | 27 | 0.5% |
| Scottish | 27 | 0.5% |
| Slovak | 16 | 0.3% |
| Spaniard | 25 | 0.4% |
| Swedish | 43 | 0.8% |
| Thai | 53 | 0.9% |
| Ukrainian | 41 | 0.7% |
| Welsh | 70 | 1.3% |
| Yugoslavian | 29 | 0.5% | View All 30 Rows |
Immigrants in Cape May Court House
The most numerous immigrant groups reported in Cape May Court House came from Asia (106 | 1.9%), Latin America (100 | 1.8%), Central America (89 | 1.6%), Mexico (89 | 1.6%), and Philippines (59 | 1.1%), together accounting for 8.0% of all Cape May Court House residents.
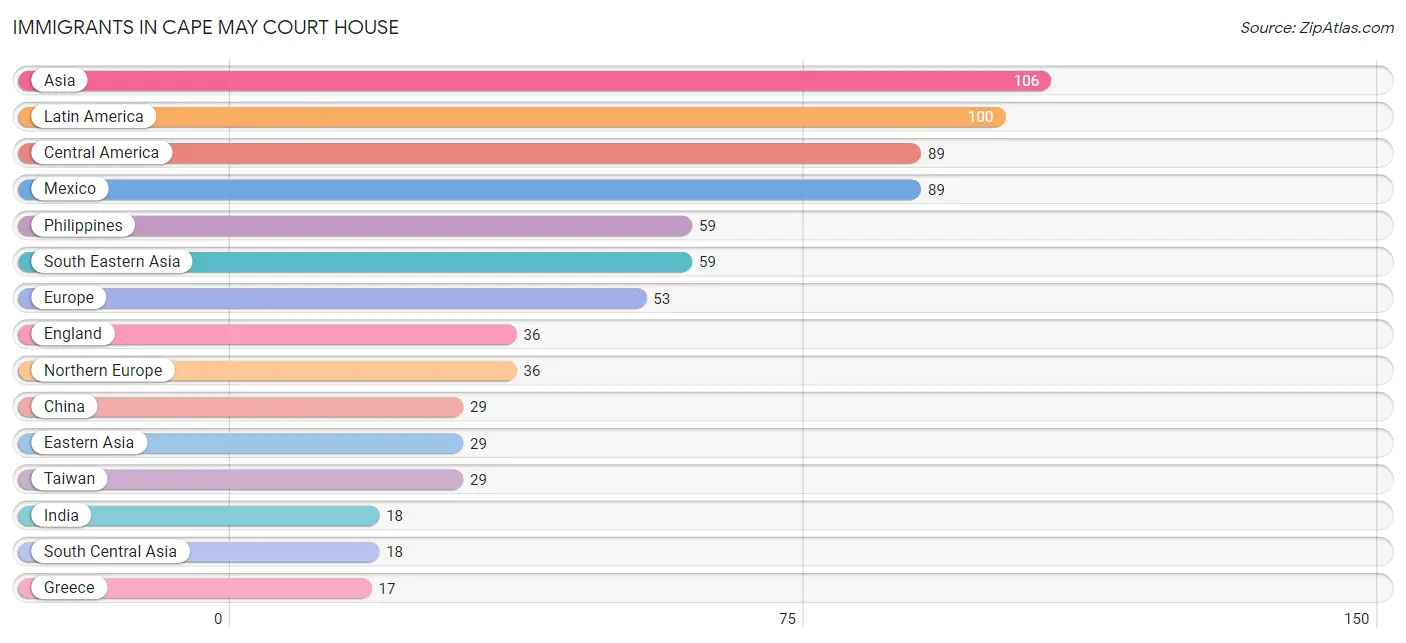
| Immigration Origin | # Population | % Population |
| Asia | 106 | 1.9% |
| Brazil | 11 | 0.2% |
| Canada | 4 | 0.1% |
| Central America | 89 | 1.6% |
| China | 29 | 0.5% |
| Eastern Asia | 29 | 0.5% |
| England | 36 | 0.6% |
| Europe | 53 | 0.9% |
| Greece | 17 | 0.3% |
| India | 18 | 0.3% |
| Latin America | 100 | 1.8% |
| Mexico | 89 | 1.6% |
| Northern Europe | 36 | 0.6% |
| Philippines | 59 | 1.1% |
| South America | 11 | 0.2% |
| South Central Asia | 18 | 0.3% |
| South Eastern Asia | 59 | 1.1% |
| Southern Europe | 17 | 0.3% |
| Taiwan | 29 | 0.5% | View All 19 Rows |
Sex and Age in Cape May Court House
Sex and Age in Cape May Court House
The most populous age groups in Cape May Court House are 5 to 9 Years (294 | 11.4%) for men and 65 to 69 Years (454 | 15.3%) for women.
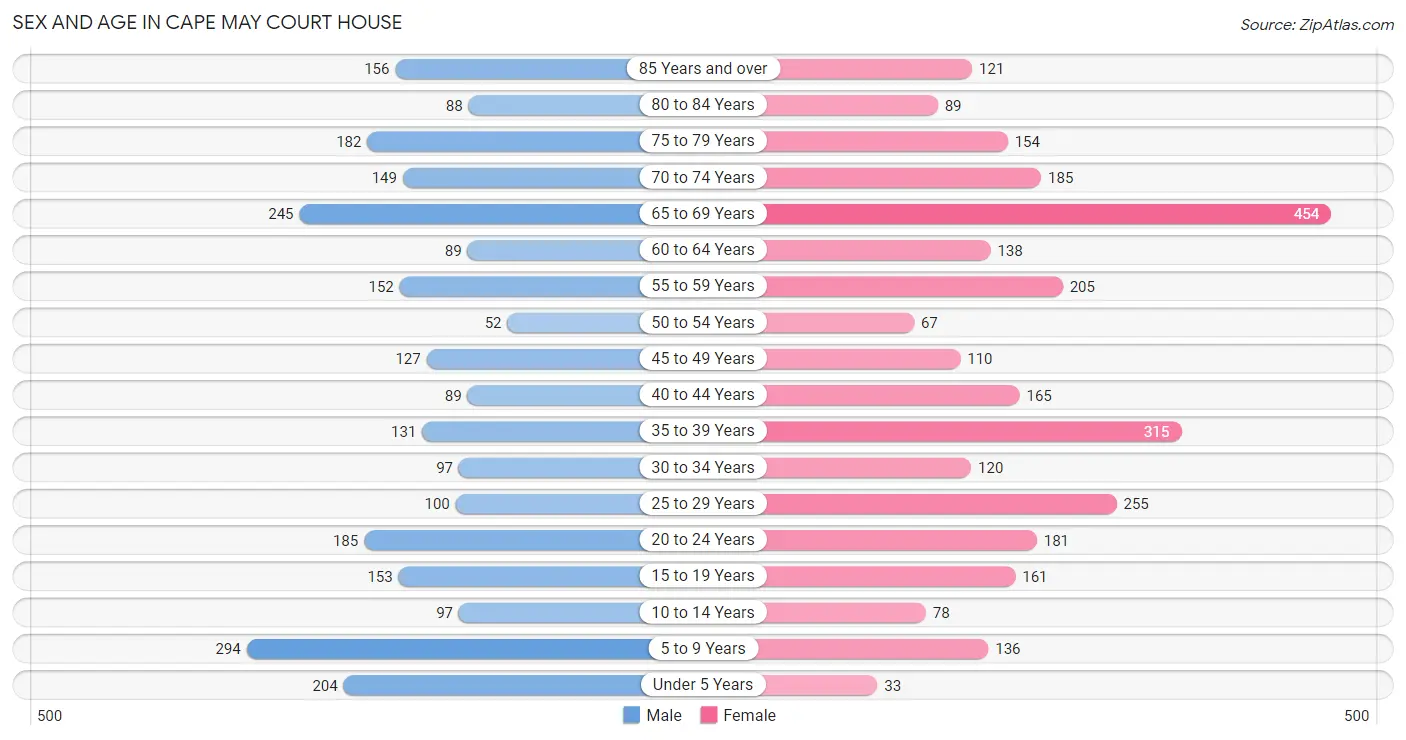
| Age Bracket | Male | Female |
| Under 5 Years | 204 (7.9%) | 33 (1.1%) |
| 5 to 9 Years | 294 (11.4%) | 136 (4.6%) |
| 10 to 14 Years | 97 (3.7%) | 78 (2.6%) |
| 15 to 19 Years | 153 (5.9%) | 161 (5.4%) |
| 20 to 24 Years | 185 (7.1%) | 181 (6.1%) |
| 25 to 29 Years | 100 (3.9%) | 255 (8.6%) |
| 30 to 34 Years | 97 (3.7%) | 120 (4.0%) |
| 35 to 39 Years | 131 (5.1%) | 315 (10.6%) |
| 40 to 44 Years | 89 (3.4%) | 165 (5.6%) |
| 45 to 49 Years | 127 (4.9%) | 110 (3.7%) |
| 50 to 54 Years | 52 (2.0%) | 67 (2.3%) |
| 55 to 59 Years | 152 (5.9%) | 205 (6.9%) |
| 60 to 64 Years | 89 (3.4%) | 138 (4.6%) |
| 65 to 69 Years | 245 (9.5%) | 454 (15.3%) |
| 70 to 74 Years | 149 (5.8%) | 185 (6.2%) |
| 75 to 79 Years | 182 (7.0%) | 154 (5.2%) |
| 80 to 84 Years | 88 (3.4%) | 89 (3.0%) |
| 85 Years and over | 156 (6.0%) | 121 (4.1%) |
| Total | 2,590 (100.0%) | 2,967 (100.0%) |
Families and Households in Cape May Court House
Median Family Size in Cape May Court House
The median family size in Cape May Court House is 2.56 persons per family, with married-couple families (1,157 | 70.3%) accounting for the largest median family size of 2.83 persons per family. On the other hand, single male/father families (122 | 7.4%) represent the smallest median family size with 1.52 persons per family.
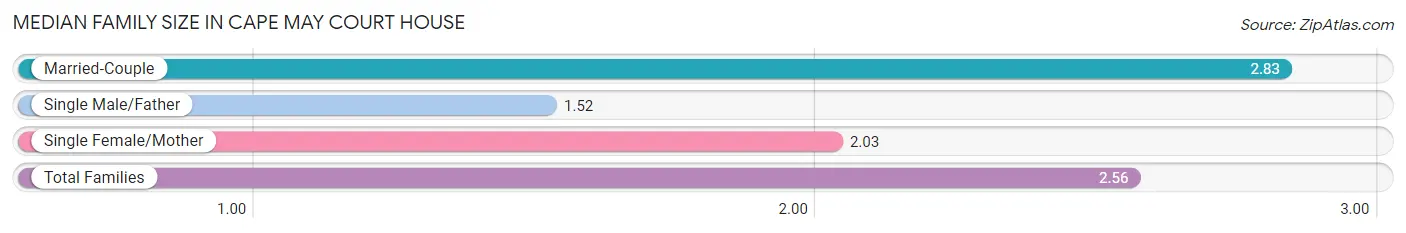
| Family Type | # Families | Family Size |
| Married-Couple | 1,157 (70.3%) | 2.83 |
| Single Male/Father | 122 (7.4%) | 1.52 |
| Single Female/Mother | 368 (22.3%) | 2.03 |
| Total Families | 1,647 (100.0%) | 2.56 |
Median Household Size in Cape May Court House
The median household size in Cape May Court House is 2.07 persons per household, with married-couple households (1,157 | 44.7%) accounting for the largest median household size of 2.83 persons per household. non-family households (939 | 36.3%) represent the smallest median household size with 1.19 persons per household.
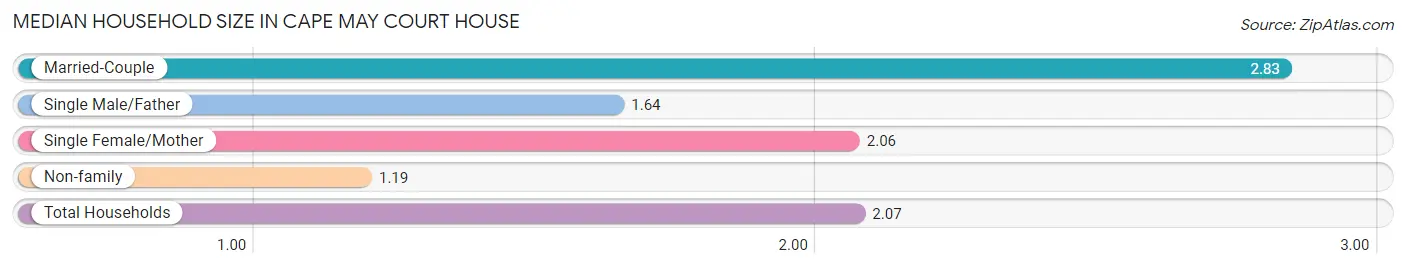
| Household Type | # Households | Household Size |
| Married-Couple | 1,157 (44.7%) | 2.83 |
| Single Male/Father | 122 (4.7%) | 1.64 |
| Single Female/Mother | 368 (14.2%) | 2.06 |
| Non-family | 939 (36.3%) | 1.19 |
| Total Households | 2,586 (100.0%) | 2.07 |
Household Size by Marriage Status in Cape May Court House
Out of a total of 2,586 households in Cape May Court House, 1,647 (63.7%) are family households, while 939 (36.3%) are nonfamily households. The most numerous type of family households are 2-person households, comprising 922, and the most common type of nonfamily households are 1-person households, comprising 669.
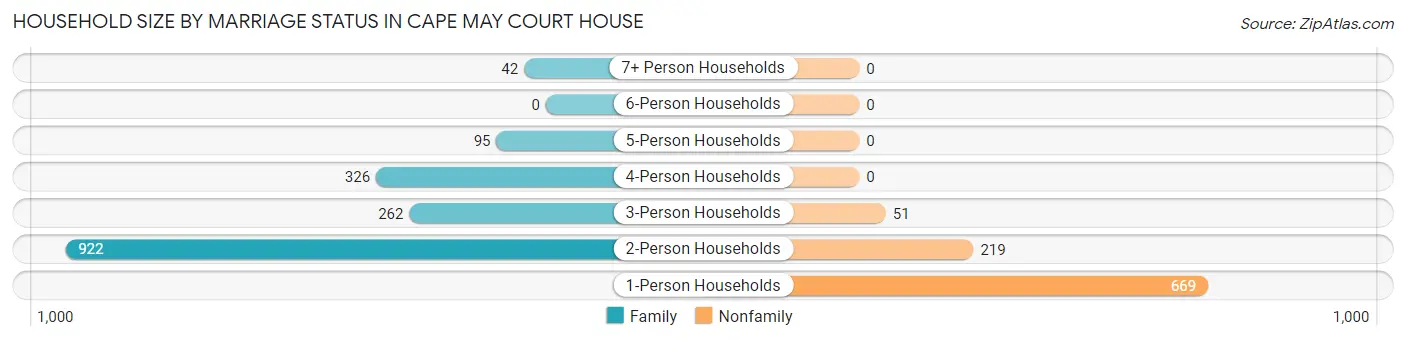
| Household Size | Family Households | Nonfamily Households |
| 1-Person Households | - | 669 (25.9%) |
| 2-Person Households | 922 (35.6%) | 219 (8.5%) |
| 3-Person Households | 262 (10.1%) | 51 (2.0%) |
| 4-Person Households | 326 (12.6%) | 0 (0.0%) |
| 5-Person Households | 95 (3.7%) | 0 (0.0%) |
| 6-Person Households | 0 (0.0%) | 0 (0.0%) |
| 7+ Person Households | 42 (1.6%) | 0 (0.0%) |
| Total | 1,647 (63.7%) | 939 (36.3%) |
Female Fertility in Cape May Court House
Fertility by Age in Cape May Court House
Average fertility rate in Cape May Court House is 114.0 births per 1,000 women. Women in the age bracket of 20 to 34 years have the highest fertility rate with 144.0 births per 1,000 women. Women in the age bracket of 20 to 34 years acount for 53.3% of all women with births.
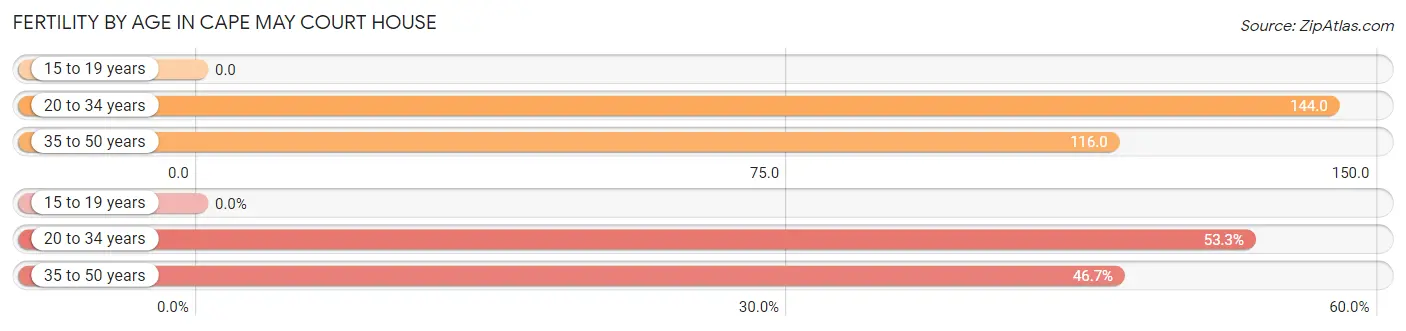
| Age Bracket | Women with Births | Births / 1,000 Women |
| 15 to 19 years | 0 (0.0%) | 0.0 |
| 20 to 34 years | 80 (53.3%) | 144.0 |
| 35 to 50 years | 70 (46.7%) | 116.0 |
| Total | 150 (100.0%) | 114.0 |
Fertility by Age by Marriage Status in Cape May Court House
46.7% of women with births (150) in Cape May Court House are married. The highest percentage of unmarried women with births falls into 20 to 34 years age bracket with 100.0% of them unmarried at the time of birth, while the lowest percentage of unmarried women with births belong to 35 to 50 years age bracket with 0.0% of them unmarried.
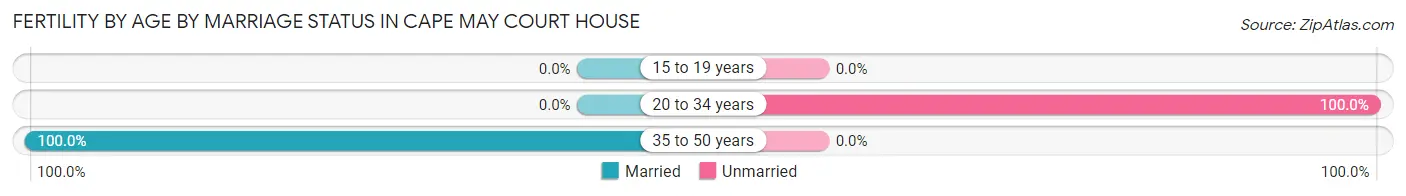
| Age Bracket | Married | Unmarried |
| 15 to 19 years | 0 (0.0%) | 0 (0.0%) |
| 20 to 34 years | 0 (0.0%) | 80 (100.0%) |
| 35 to 50 years | 70 (100.0%) | 0 (0.0%) |
| Total | 70 (46.7%) | 80 (53.3%) |
Fertility by Education in Cape May Court House
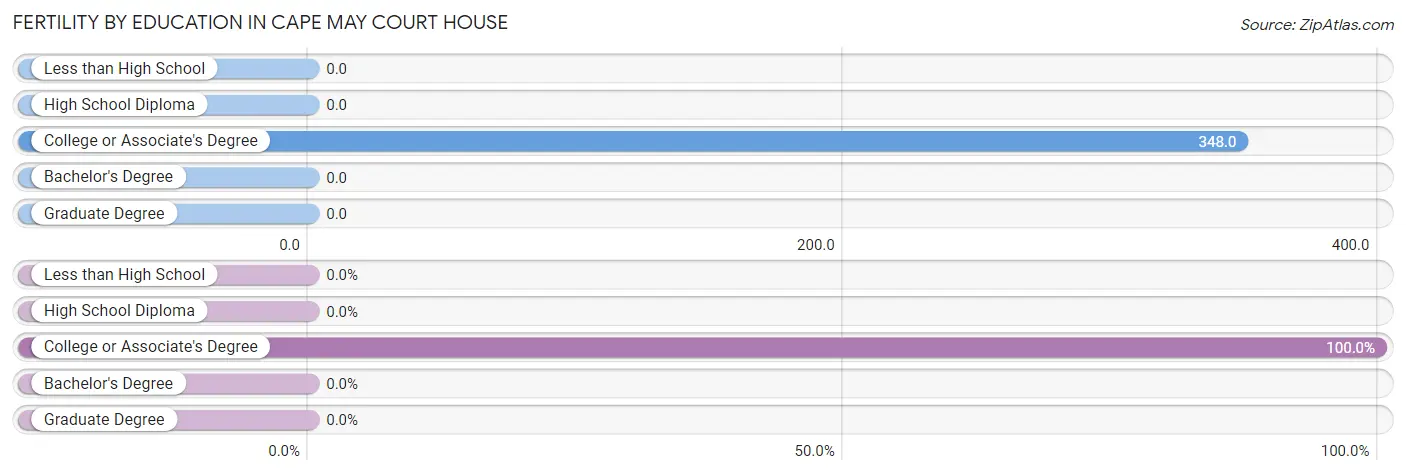
| Educational Attainment | Women with Births | Births / 1,000 Women |
| Less than High School | 0 (0.0%) | 0.0 |
| High School Diploma | 0 (0.0%) | 0.0 |
| College or Associate's Degree | 150 (100.0%) | 348.0 |
| Bachelor's Degree | 0 (0.0%) | 0.0 |
| Graduate Degree | 0 (0.0%) | 0.0 |
| Total | 150 (100.0%) | 114.0 |
Fertility by Education by Marriage Status in Cape May Court House
53.3% of women with births in Cape May Court House are unmarried. Women with the educational attainment of college or associate's degree are most likely to be married with 46.7% of them married at childbirth, while women with the educational attainment of college or associate's degree are least likely to be married with 53.3% of them unmarried at childbirth.
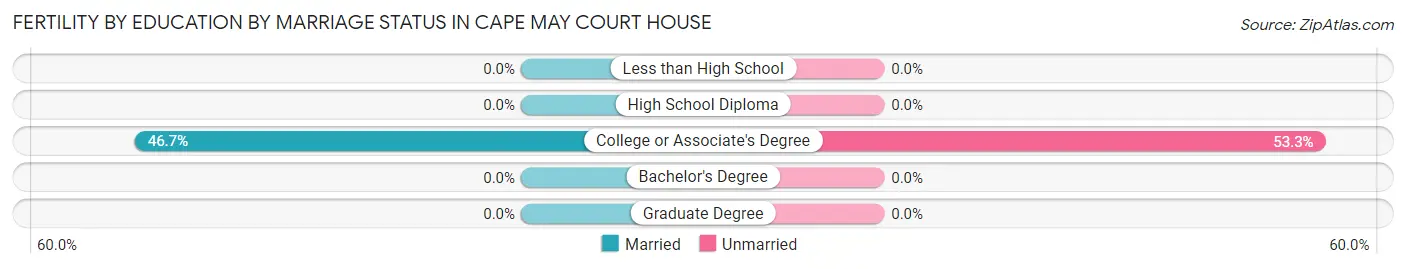
| Educational Attainment | Married | Unmarried |
| Less than High School | 0 (0.0%) | 0 (0.0%) |
| High School Diploma | 0 (0.0%) | 0 (0.0%) |
| College or Associate's Degree | 70 (46.7%) | 80 (53.3%) |
| Bachelor's Degree | 0 (0.0%) | 0 (0.0%) |
| Graduate Degree | 0 (0.0%) | 0 (0.0%) |
| Total | 70 (46.7%) | 80 (53.3%) |
Employment Characteristics in Cape May Court House
Employment by Class of Employer in Cape May Court House
Among the 2,271 employed individuals in Cape May Court House, private company employees (1,233 | 54.3%), local government employees (280 | 12.3%), and not-for-profit organizations (213 | 9.4%) make up the most common classes of employment.
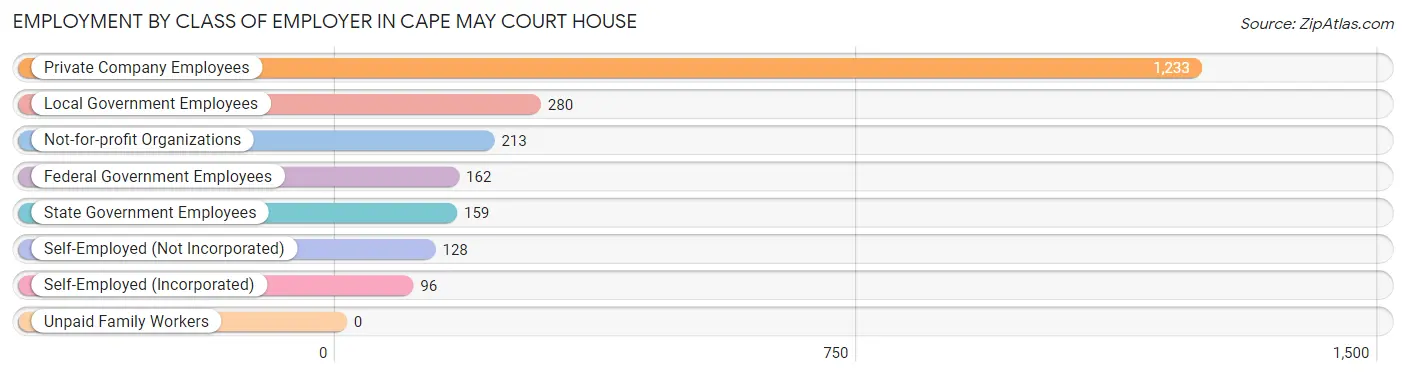
| Employer Class | # Employees | % Employees |
| Private Company Employees | 1,233 | 54.3% |
| Self-Employed (Incorporated) | 96 | 4.2% |
| Self-Employed (Not Incorporated) | 128 | 5.6% |
| Not-for-profit Organizations | 213 | 9.4% |
| Local Government Employees | 280 | 12.3% |
| State Government Employees | 159 | 7.0% |
| Federal Government Employees | 162 | 7.1% |
| Unpaid Family Workers | 0 | 0.0% |
| Total | 2,271 | 100.0% |
Employment Status by Age in Cape May Court House
According to the labor force statistics for Cape May Court House, out of the total population over 16 years of age (4,589), 53.1% or 2,437 individuals are in the labor force, with 6.9% or 168 of them unemployed. The age group with the highest labor force participation rate is 45 to 54 years, with 94.7% or 337 individuals in the labor force. Within the labor force, the 20 to 24 years age range has the highest percentage of unemployed individuals, with 18.1% or 50 of them being unemployed.
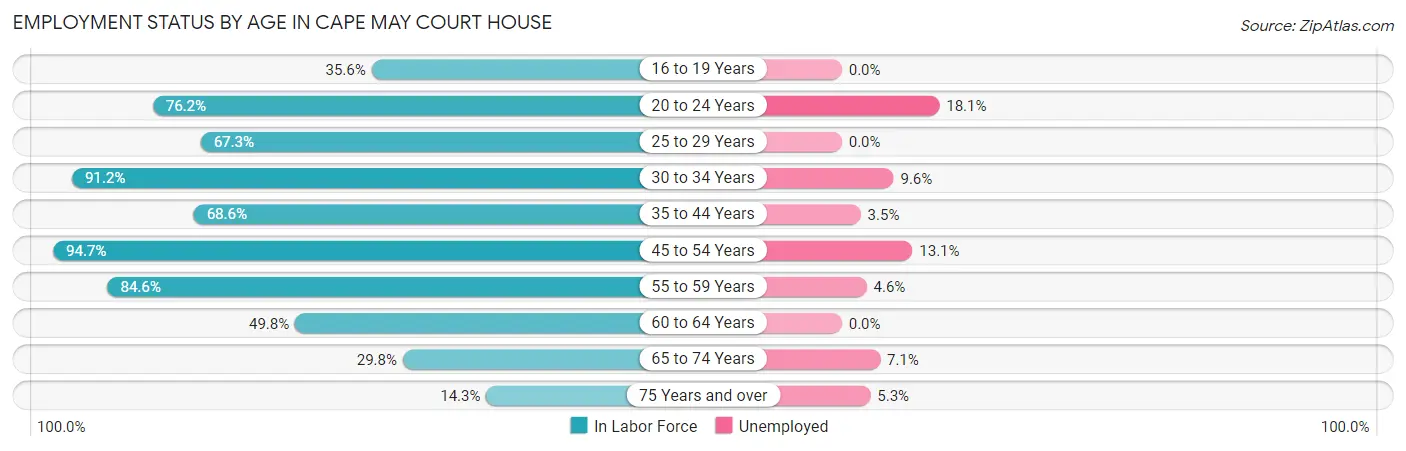
| Age Bracket | In Labor Force | Unemployed |
| 16 to 19 Years | 67 (35.6%) | 0 (0.0%) |
| 20 to 24 Years | 279 (76.2%) | 50 (18.1%) |
| 25 to 29 Years | 239 (67.3%) | 0 (0.0%) |
| 30 to 34 Years | 198 (91.2%) | 19 (9.6%) |
| 35 to 44 Years | 480 (68.6%) | 17 (3.5%) |
| 45 to 54 Years | 337 (94.7%) | 44 (13.1%) |
| 55 to 59 Years | 302 (84.6%) | 14 (4.6%) |
| 60 to 64 Years | 113 (49.8%) | 0 (0.0%) |
| 65 to 74 Years | 308 (29.8%) | 22 (7.1%) |
| 75 Years and over | 113 (14.3%) | 6 (5.3%) |
| Total | 2,437 (53.1%) | 168 (6.9%) |
Employment Status by Educational Attainment in Cape May Court House
According to labor force statistics for Cape May Court House, 75.5% of individuals (1,670) out of the total population between 25 and 64 years of age (2,212) are in the labor force, with 5.6% or 94 of them being unemployed. The group with the highest labor force participation rate are those with the educational attainment of bachelor's degree or higher, with 93.1% or 526 individuals in the labor force. Within the labor force, individuals with bachelor's degree or higher education have the highest percentage of unemployment, with 8.7% or 46 of them being unemployed.
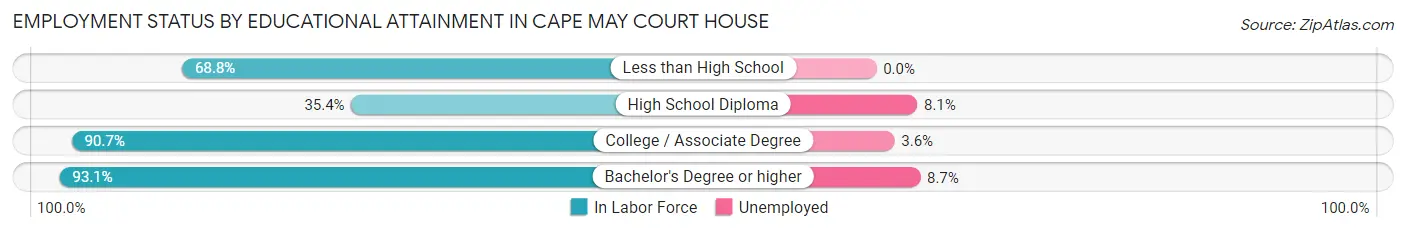
| Educational Attainment | In Labor Force | Unemployed |
| Less than High School | 66 (68.8%) | 0 (0.0%) |
| High School Diploma | 211 (35.4%) | 48 (8.1%) |
| College / Associate Degree | 866 (90.7%) | 34 (3.6%) |
| Bachelor's Degree or higher | 526 (93.1%) | 49 (8.7%) |
| Total | 1,670 (75.5%) | 124 (5.6%) |
Employment Occupations by Sex in Cape May Court House
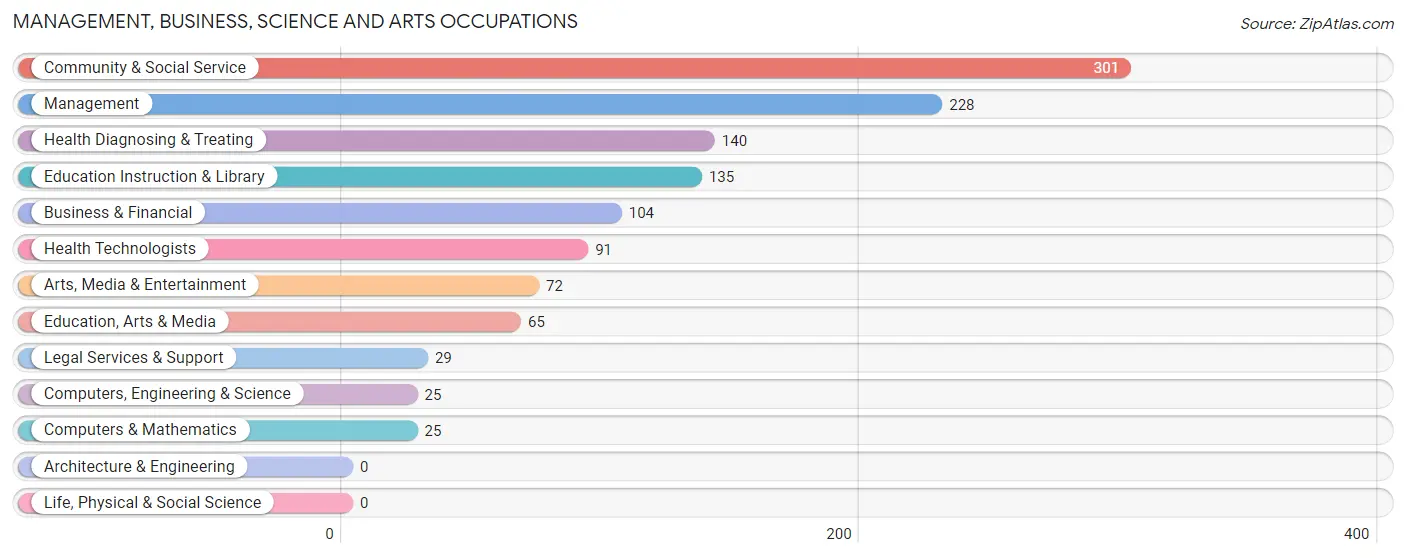
Management, Business, Science and Arts Occupations
The most common Management, Business, Science and Arts occupations in Cape May Court House are Community & Social Service (301 | 13.5%), Management (228 | 10.2%), Health Diagnosing & Treating (140 | 6.3%), Education Instruction & Library (135 | 6.1%), and Business & Financial (104 | 4.7%).
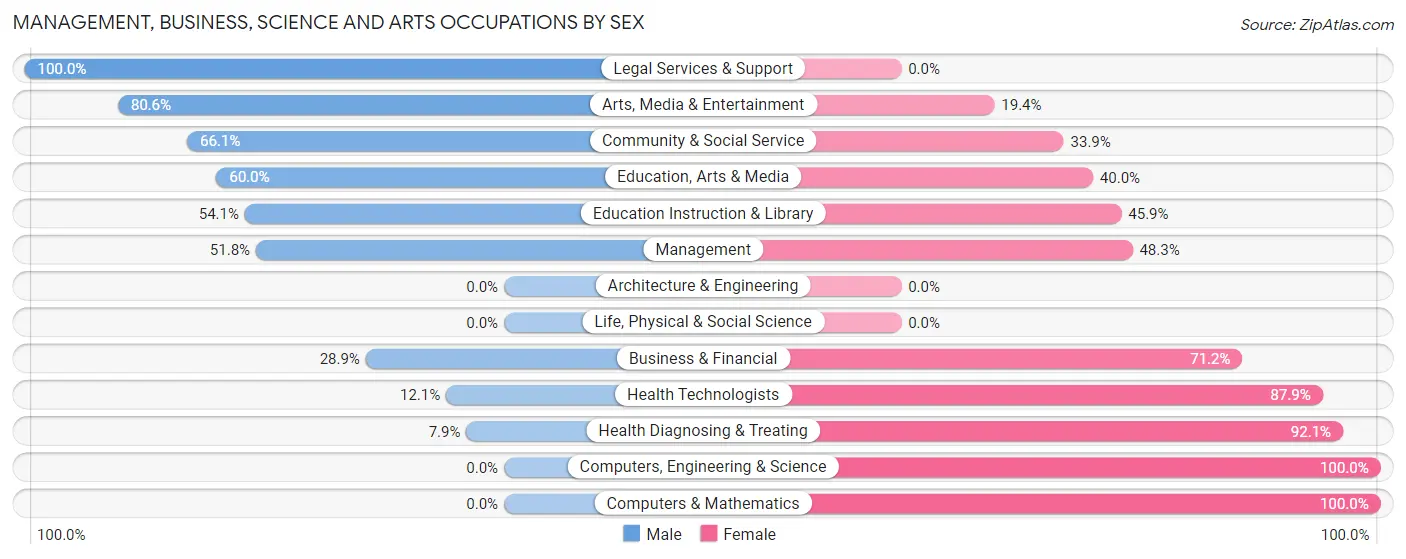
Management, Business, Science and Arts Occupations by Sex
Within the Management, Business, Science and Arts occupations in Cape May Court House, the most male-oriented occupations are Legal Services & Support (100.0%), Arts, Media & Entertainment (80.6%), and Community & Social Service (66.1%), while the most female-oriented occupations are Computers, Engineering & Science (100.0%), Computers & Mathematics (100.0%), and Health Diagnosing & Treating (92.1%).
| Occupation | Male | Female |
| Management | 118 (51.7%) | 110 (48.2%) |
| Business & Financial | 30 (28.8%) | 74 (71.2%) |
| Computers, Engineering & Science | 0 (0.0%) | 25 (100.0%) |
| Computers & Mathematics | 0 (0.0%) | 25 (100.0%) |
| Architecture & Engineering | 0 (0.0%) | 0 (0.0%) |
| Life, Physical & Social Science | 0 (0.0%) | 0 (0.0%) |
| Community & Social Service | 199 (66.1%) | 102 (33.9%) |
| Education, Arts & Media | 39 (60.0%) | 26 (40.0%) |
| Legal Services & Support | 29 (100.0%) | 0 (0.0%) |
| Education Instruction & Library | 73 (54.1%) | 62 (45.9%) |
| Arts, Media & Entertainment | 58 (80.6%) | 14 (19.4%) |
| Health Diagnosing & Treating | 11 (7.9%) | 129 (92.1%) |
| Health Technologists | 11 (12.1%) | 80 (87.9%) |
| Total (Category) | 358 (44.9%) | 440 (55.1%) |
| Total (Overall) | 1,071 (48.0%) | 1,158 (51.9%) |
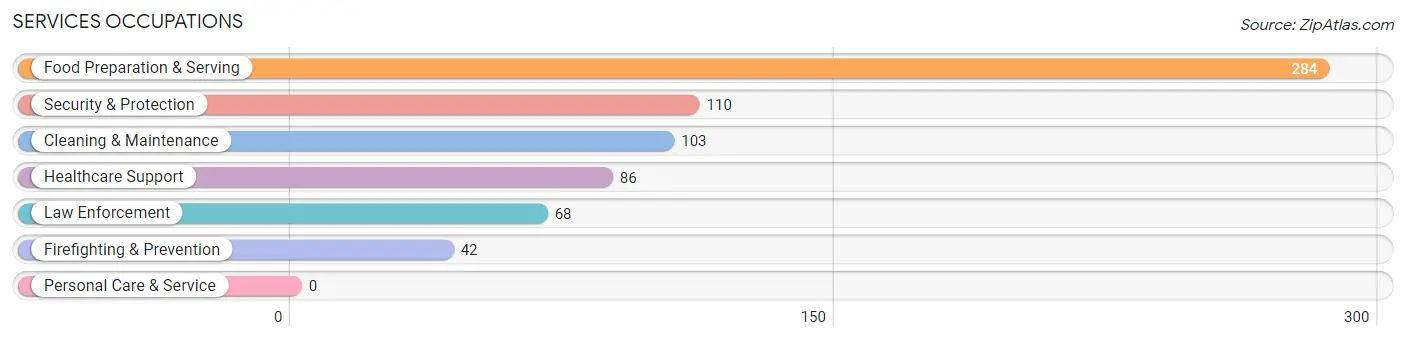
Services Occupations
The most common Services occupations in Cape May Court House are Food Preparation & Serving (284 | 12.7%), Security & Protection (110 | 4.9%), Cleaning & Maintenance (103 | 4.6%), Healthcare Support (86 | 3.9%), and Law Enforcement (68 | 3.0%).
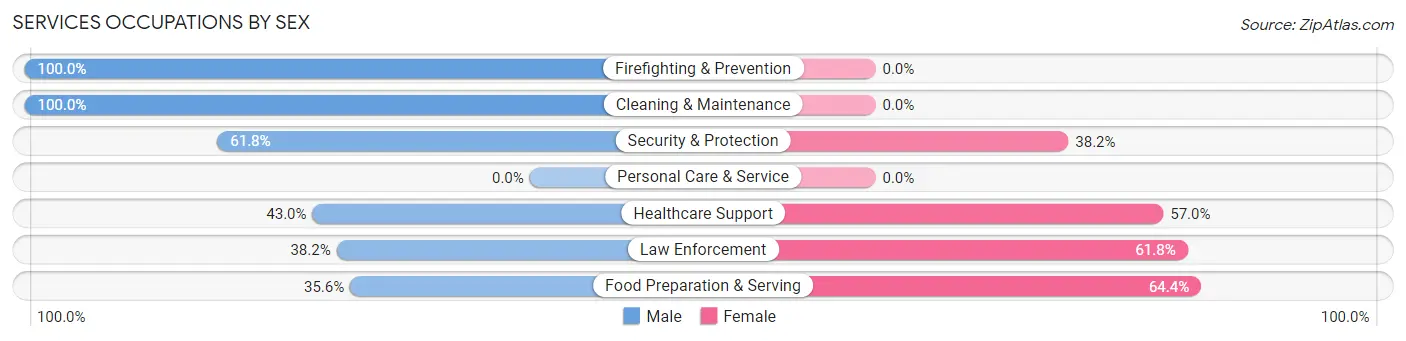
Services Occupations by Sex
Within the Services occupations in Cape May Court House, the most male-oriented occupations are Firefighting & Prevention (100.0%), Cleaning & Maintenance (100.0%), and Security & Protection (61.8%), while the most female-oriented occupations are Food Preparation & Serving (64.4%), Law Enforcement (61.8%), and Healthcare Support (57.0%).
| Occupation | Male | Female |
| Healthcare Support | 37 (43.0%) | 49 (57.0%) |
| Security & Protection | 68 (61.8%) | 42 (38.2%) |
| Firefighting & Prevention | 42 (100.0%) | 0 (0.0%) |
| Law Enforcement | 26 (38.2%) | 42 (61.8%) |
| Food Preparation & Serving | 101 (35.6%) | 183 (64.4%) |
| Cleaning & Maintenance | 103 (100.0%) | 0 (0.0%) |
| Personal Care & Service | 0 (0.0%) | 0 (0.0%) |
| Total (Category) | 309 (53.0%) | 274 (47.0%) |
| Total (Overall) | 1,071 (48.0%) | 1,158 (51.9%) |
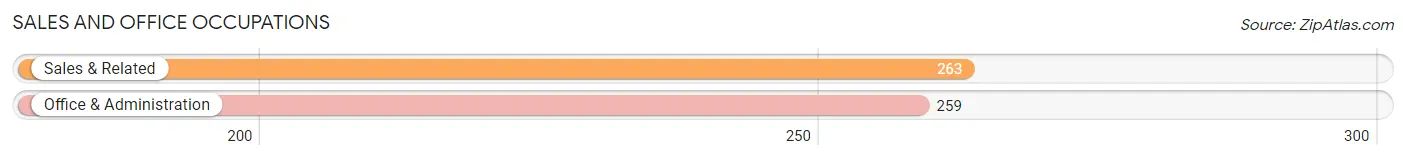
Sales and Office Occupations
The most common Sales and Office occupations in Cape May Court House are Sales & Related (263 | 11.8%), and Office & Administration (259 | 11.6%).
Sales and Office Occupations by Sex
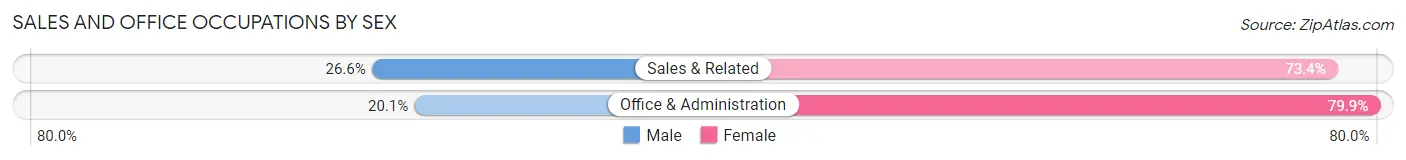
| Occupation | Male | Female |
| Sales & Related | 70 (26.6%) | 193 (73.4%) |
| Office & Administration | 52 (20.1%) | 207 (79.9%) |
| Total (Category) | 122 (23.4%) | 400 (76.6%) |
| Total (Overall) | 1,071 (48.0%) | 1,158 (51.9%) |
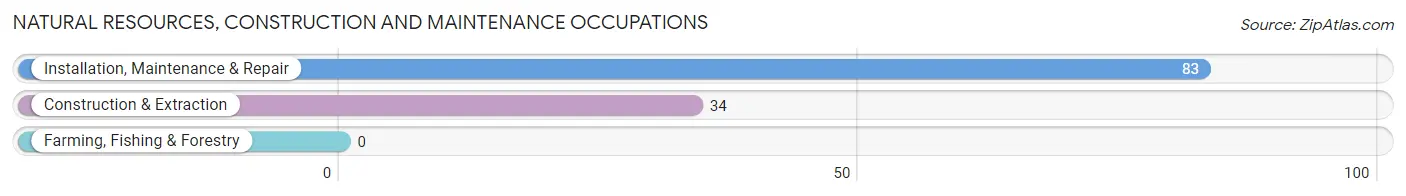
Natural Resources, Construction and Maintenance Occupations
The most common Natural Resources, Construction and Maintenance occupations in Cape May Court House are Installation, Maintenance & Repair (83 | 3.7%), and Construction & Extraction (34 | 1.5%).
Natural Resources, Construction and Maintenance Occupations by Sex
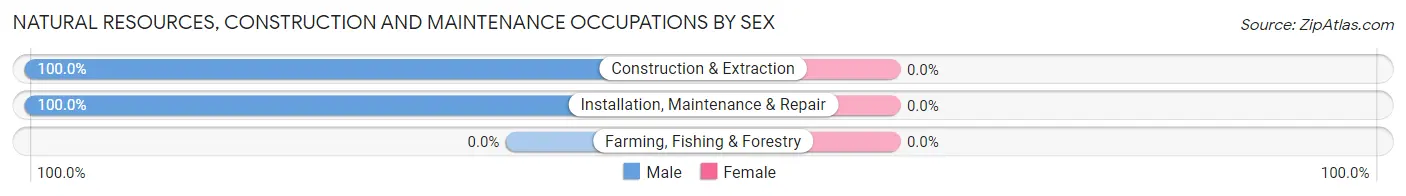
| Occupation | Male | Female |
| Farming, Fishing & Forestry | 0 (0.0%) | 0 (0.0%) |
| Construction & Extraction | 34 (100.0%) | 0 (0.0%) |
| Installation, Maintenance & Repair | 83 (100.0%) | 0 (0.0%) |
| Total (Category) | 117 (100.0%) | 0 (0.0%) |
| Total (Overall) | 1,071 (48.0%) | 1,158 (51.9%) |
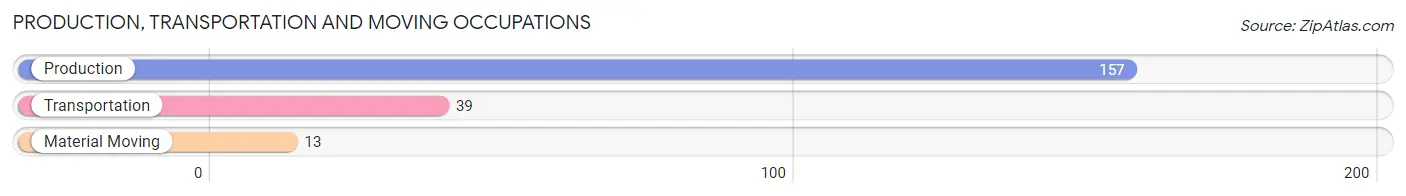
Production, Transportation and Moving Occupations
The most common Production, Transportation and Moving occupations in Cape May Court House are Production (157 | 7.0%), Transportation (39 | 1.8%), and Material Moving (13 | 0.6%).
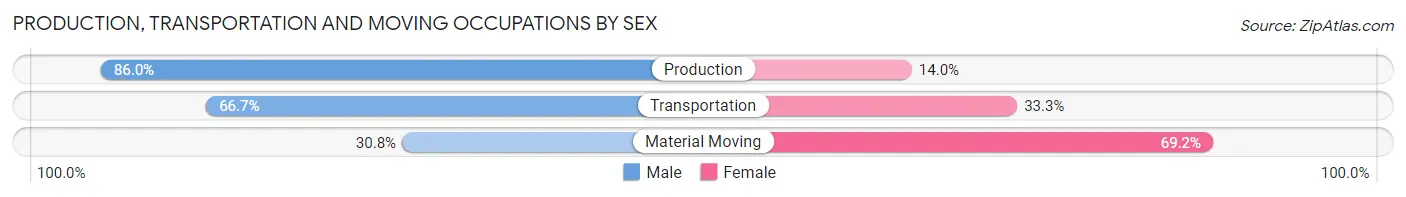
Production, Transportation and Moving Occupations by Sex
| Occupation | Male | Female |
| Production | 135 (86.0%) | 22 (14.0%) |
| Transportation | 26 (66.7%) | 13 (33.3%) |
| Material Moving | 4 (30.8%) | 9 (69.2%) |
| Total (Category) | 165 (78.9%) | 44 (21.0%) |
| Total (Overall) | 1,071 (48.0%) | 1,158 (51.9%) |
Employment Industries by Sex in Cape May Court House
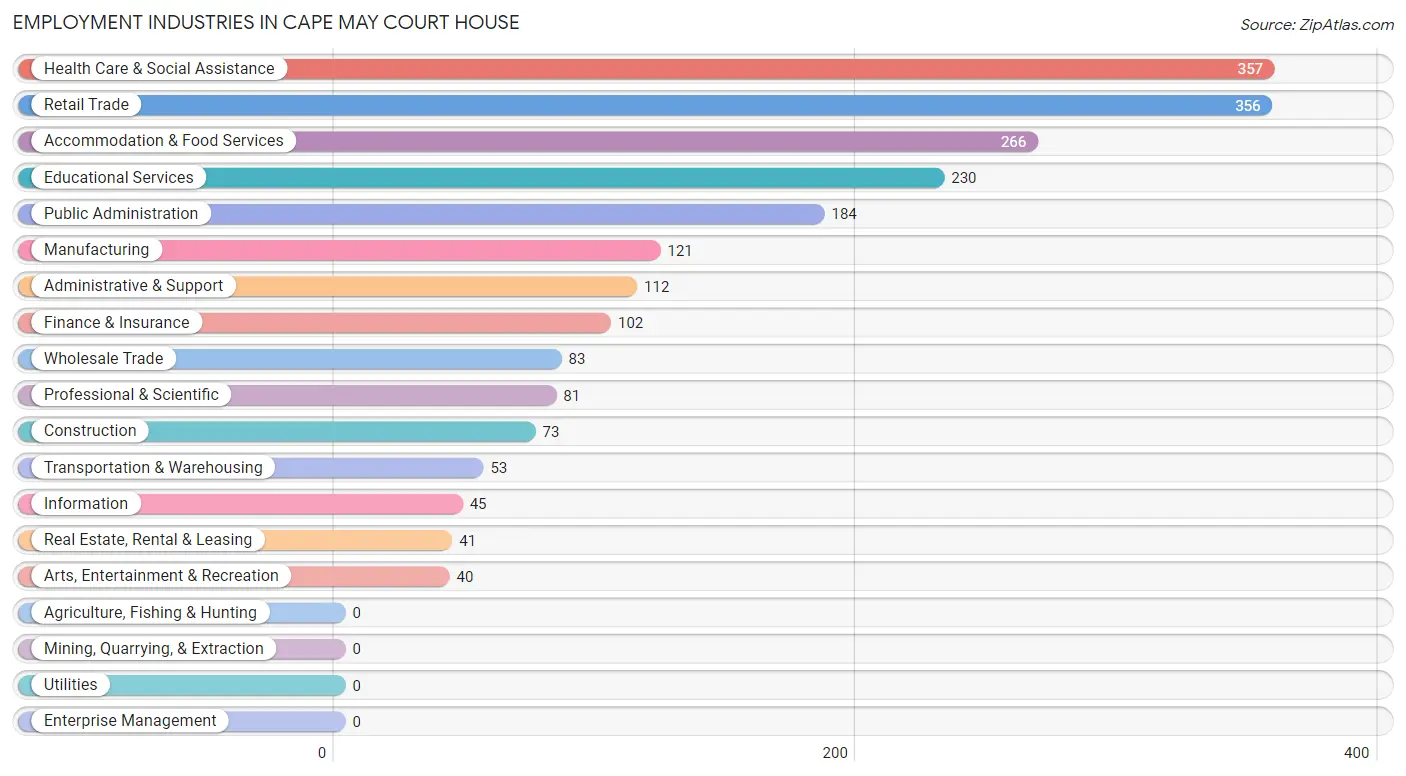
Employment Industries in Cape May Court House
The major employment industries in Cape May Court House include Health Care & Social Assistance (357 | 16.0%), Retail Trade (356 | 16.0%), Accommodation & Food Services (266 | 11.9%), Educational Services (230 | 10.3%), and Public Administration (184 | 8.3%).
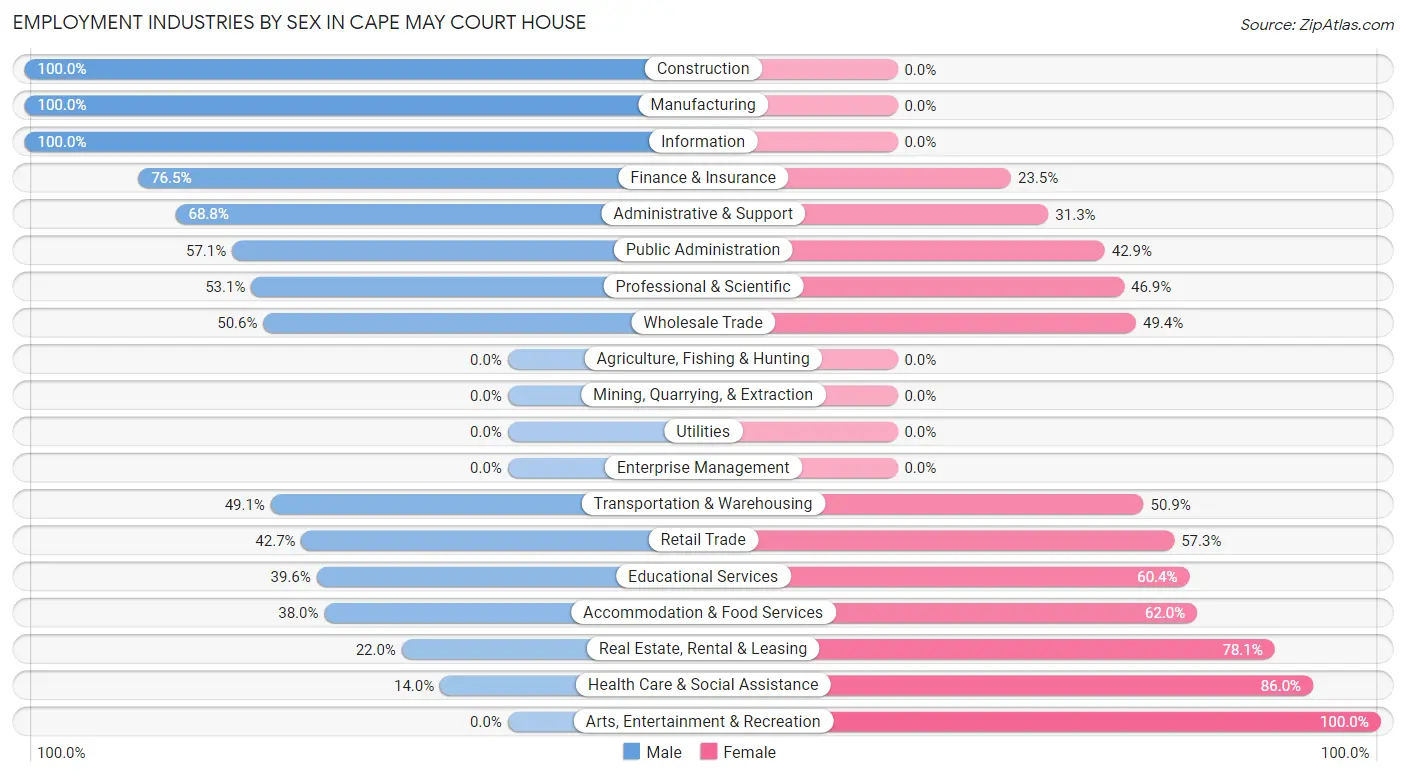
Employment Industries by Sex in Cape May Court House
The Cape May Court House industries that see more men than women are Construction (100.0%), Manufacturing (100.0%), and Information (100.0%), whereas the industries that tend to have a higher number of women are Arts, Entertainment & Recreation (100.0%), Health Care & Social Assistance (86.0%), and Real Estate, Rental & Leasing (78.0%).
| Industry | Male | Female |
| Agriculture, Fishing & Hunting | 0 (0.0%) | 0 (0.0%) |
| Mining, Quarrying, & Extraction | 0 (0.0%) | 0 (0.0%) |
| Construction | 73 (100.0%) | 0 (0.0%) |
| Manufacturing | 121 (100.0%) | 0 (0.0%) |
| Wholesale Trade | 42 (50.6%) | 41 (49.4%) |
| Retail Trade | 152 (42.7%) | 204 (57.3%) |
| Transportation & Warehousing | 26 (49.1%) | 27 (50.9%) |
| Utilities | 0 (0.0%) | 0 (0.0%) |
| Information | 45 (100.0%) | 0 (0.0%) |
| Finance & Insurance | 78 (76.5%) | 24 (23.5%) |
| Real Estate, Rental & Leasing | 9 (22.0%) | 32 (78.0%) |
| Professional & Scientific | 43 (53.1%) | 38 (46.9%) |
| Enterprise Management | 0 (0.0%) | 0 (0.0%) |
| Administrative & Support | 77 (68.8%) | 35 (31.2%) |
| Educational Services | 91 (39.6%) | 139 (60.4%) |
| Health Care & Social Assistance | 50 (14.0%) | 307 (86.0%) |
| Arts, Entertainment & Recreation | 0 (0.0%) | 40 (100.0%) |
| Accommodation & Food Services | 101 (38.0%) | 165 (62.0%) |
| Public Administration | 105 (57.1%) | 79 (42.9%) |
| Total | 1,071 (48.0%) | 1,158 (51.9%) |
Education in Cape May Court House
School Enrollment in Cape May Court House
The most common levels of schooling among the 1,437 students in Cape May Court House are elementary school (396 | 27.6%), high school (387 | 26.9%), and college / undergraduate (343 | 23.9%).
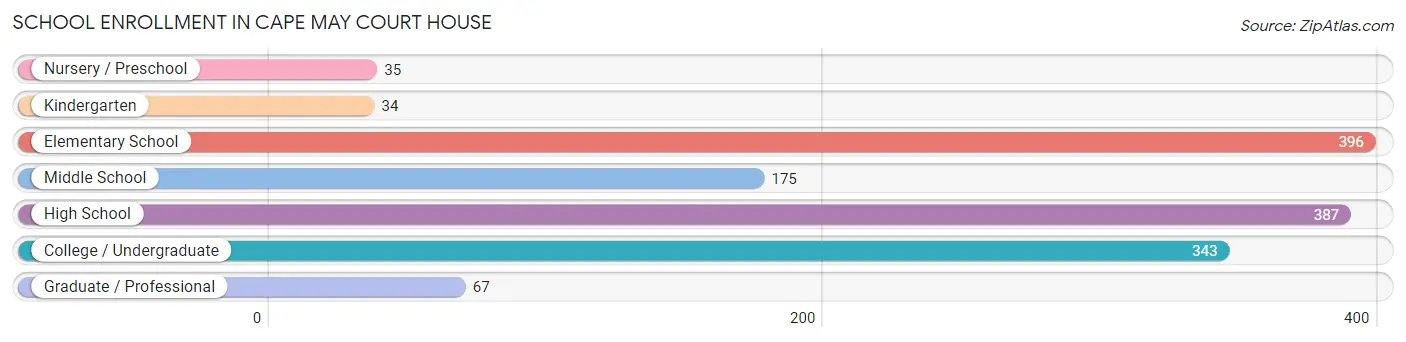
| School Level | # Students | % Students |
| Nursery / Preschool | 35 | 2.4% |
| Kindergarten | 34 | 2.4% |
| Elementary School | 396 | 27.6% |
| Middle School | 175 | 12.2% |
| High School | 387 | 26.9% |
| College / Undergraduate | 343 | 23.9% |
| Graduate / Professional | 67 | 4.7% |
| Total | 1,437 | 100.0% |
School Enrollment by Age by Funding Source in Cape May Court House
Out of a total of 1,437 students who are enrolled in schools in Cape May Court House, 76 (5.3%) attend a private institution, while the remaining 1,361 (94.7%) are enrolled in public schools. The age group of 3 to 4 year olds has the highest likelihood of being enrolled in private schools, with 35 (100.0% in the age bracket) enrolled. Conversely, the age group of 10 to 14 year olds has the lowest likelihood of being enrolled in a private school, with 175 (100.0% in the age bracket) attending a public institution.
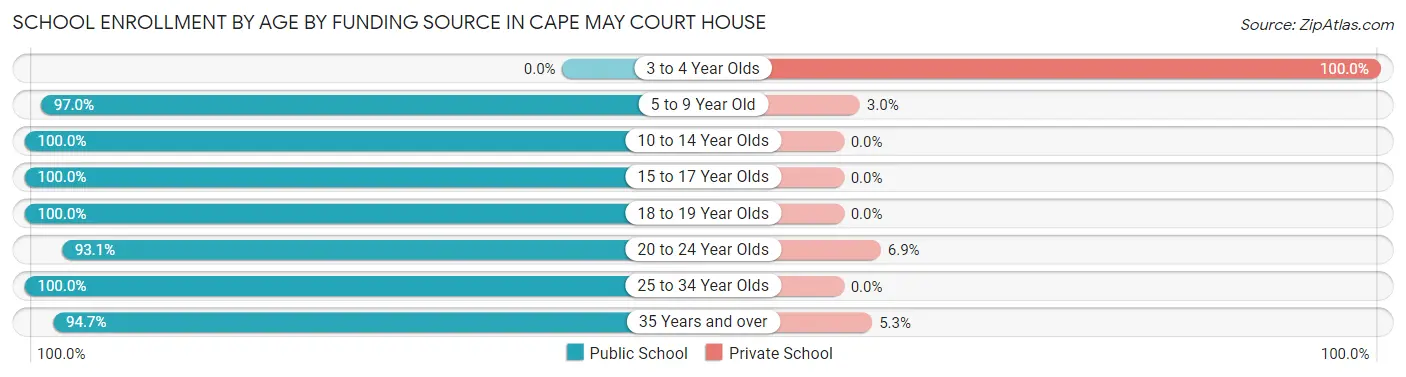
| Age Bracket | Public School | Private School |
| 3 to 4 Year Olds | 0 (0.0%) | 35 (100.0%) |
| 5 to 9 Year Old | 417 (97.0%) | 13 (3.0%) |
| 10 to 14 Year Olds | 175 (100.0%) | 0 (0.0%) |
| 15 to 17 Year Olds | 230 (100.0%) | 0 (0.0%) |
| 18 to 19 Year Olds | 84 (100.0%) | 0 (0.0%) |
| 20 to 24 Year Olds | 188 (93.1%) | 14 (6.9%) |
| 25 to 34 Year Olds | 18 (100.0%) | 0 (0.0%) |
| 35 Years and over | 249 (94.7%) | 14 (5.3%) |
| Total | 1,361 (94.7%) | 76 (5.3%) |
Educational Attainment by Field of Study in Cape May Court House
Education (190 | 15.8%), communications (143 | 11.9%), liberal arts & history (125 | 10.4%), arts & humanities (123 | 10.2%), and bio, nature & agricultural (119 | 9.9%) are the most common fields of study among 1,201 individuals in Cape May Court House who have obtained a bachelor's degree or higher.
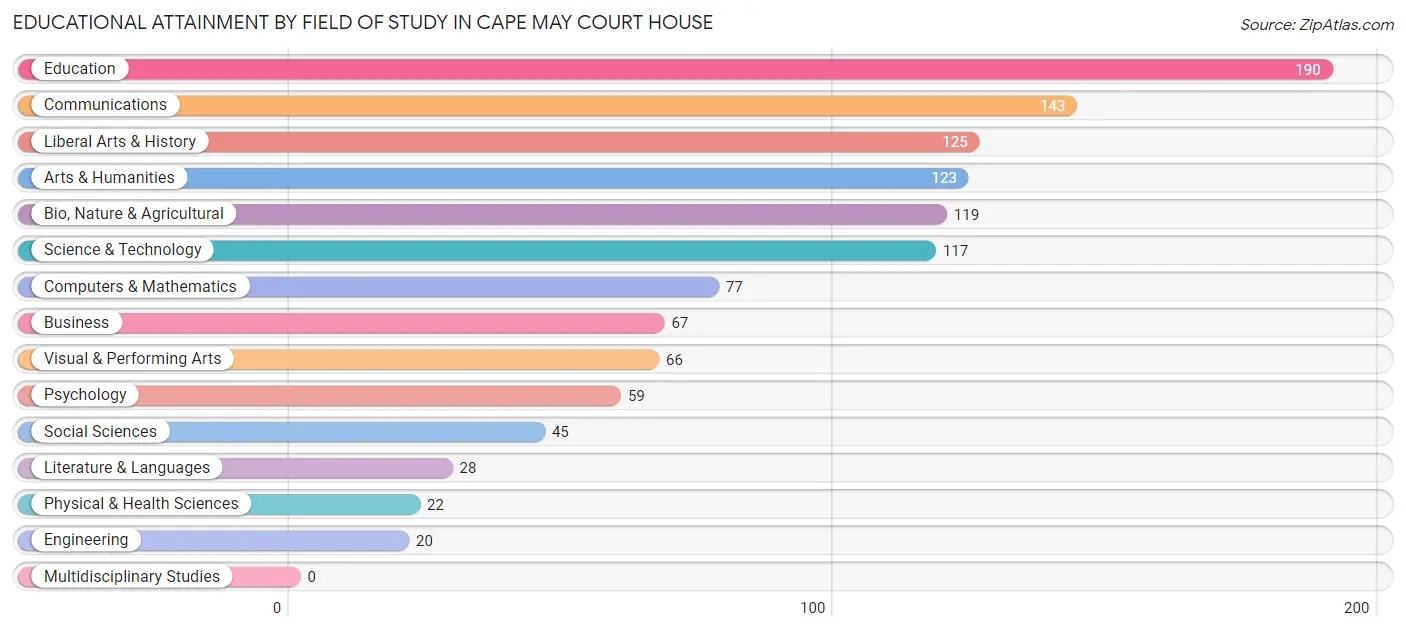
| Field of Study | # Graduates | % Graduates |
| Computers & Mathematics | 77 | 6.4% |
| Bio, Nature & Agricultural | 119 | 9.9% |
| Physical & Health Sciences | 22 | 1.8% |
| Psychology | 59 | 4.9% |
| Social Sciences | 45 | 3.7% |
| Engineering | 20 | 1.7% |
| Multidisciplinary Studies | 0 | 0.0% |
| Science & Technology | 117 | 9.7% |
| Business | 67 | 5.6% |
| Education | 190 | 15.8% |
| Literature & Languages | 28 | 2.3% |
| Liberal Arts & History | 125 | 10.4% |
| Visual & Performing Arts | 66 | 5.5% |
| Communications | 143 | 11.9% |
| Arts & Humanities | 123 | 10.2% |
| Total | 1,201 | 100.0% |
Transportation & Commute in Cape May Court House
Vehicle Availability by Sex in Cape May Court House
The most prevalent vehicle ownership categories in Cape May Court House are males with 2 vehicles (519, accounting for 46.6%) and females with 2 vehicles (570, making up 44.8%).
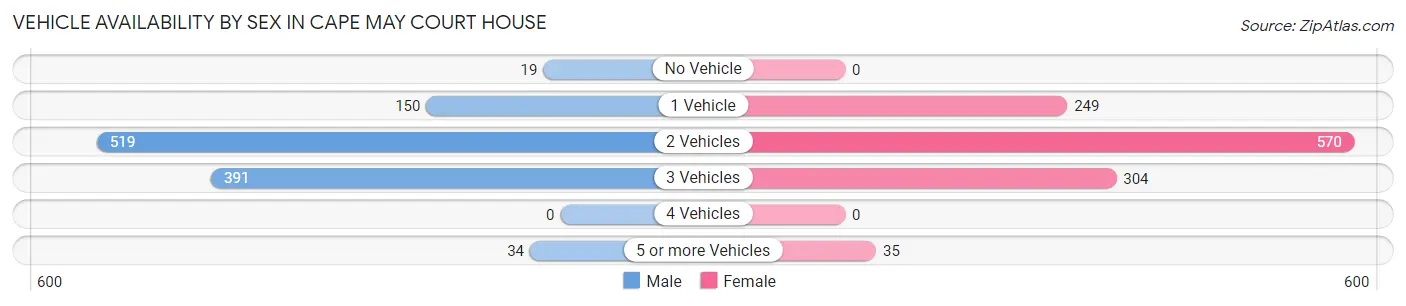
| Vehicles Available | Male | Female |
| No Vehicle | 19 (1.7%) | 0 (0.0%) |
| 1 Vehicle | 150 (13.5%) | 249 (21.5%) |
| 2 Vehicles | 519 (46.6%) | 570 (49.2%) |
| 3 Vehicles | 391 (35.1%) | 304 (26.3%) |
| 4 Vehicles | 0 (0.0%) | 0 (0.0%) |
| 5 or more Vehicles | 34 (3.0%) | 35 (3.0%) |
| Total | 1,113 (100.0%) | 1,158 (100.0%) |
Commute Time in Cape May Court House
The most frequently occuring commute durations in Cape May Court House are 10 to 14 minutes (515 commuters, 24.9%), 15 to 19 minutes (443 commuters, 21.4%), and 5 to 9 minutes (433 commuters, 20.9%).
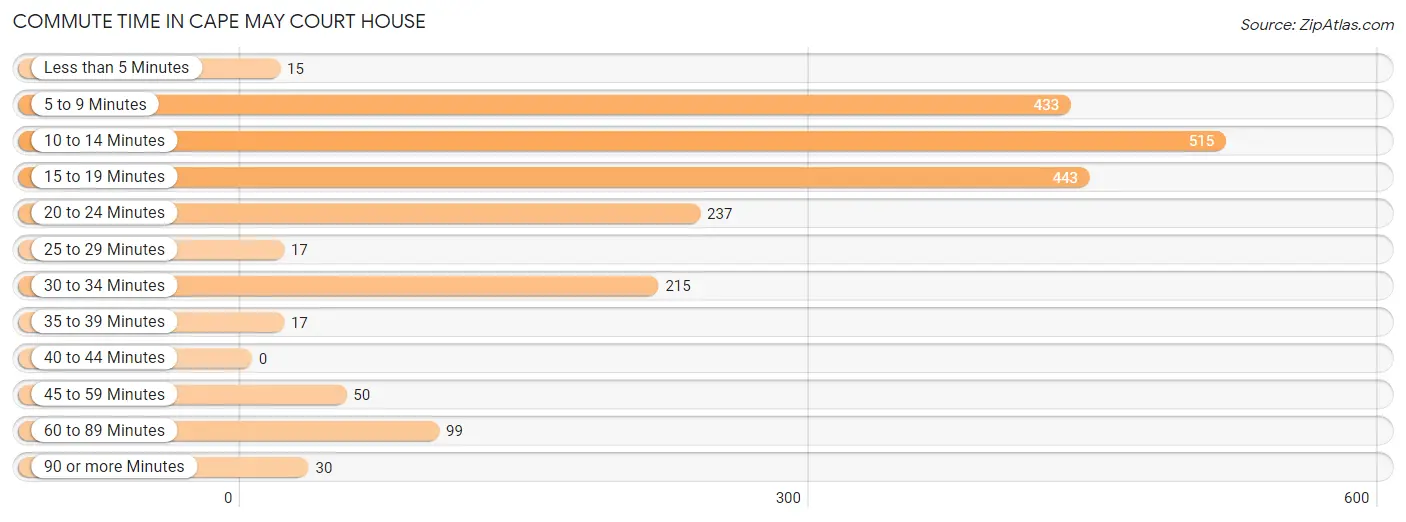
| Commute Time | # Commuters | % Commuters |
| Less than 5 Minutes | 15 | 0.7% |
| 5 to 9 Minutes | 433 | 20.9% |
| 10 to 14 Minutes | 515 | 24.9% |
| 15 to 19 Minutes | 443 | 21.4% |
| 20 to 24 Minutes | 237 | 11.4% |
| 25 to 29 Minutes | 17 | 0.8% |
| 30 to 34 Minutes | 215 | 10.4% |
| 35 to 39 Minutes | 17 | 0.8% |
| 40 to 44 Minutes | 0 | 0.0% |
| 45 to 59 Minutes | 50 | 2.4% |
| 60 to 89 Minutes | 99 | 4.8% |
| 90 or more Minutes | 30 | 1.5% |
Commute Time by Sex in Cape May Court House
The most common commute times in Cape May Court House are 15 to 19 minutes (243 commuters, 22.8%) for males and 10 to 14 minutes (341 commuters, 34.0%) for females.
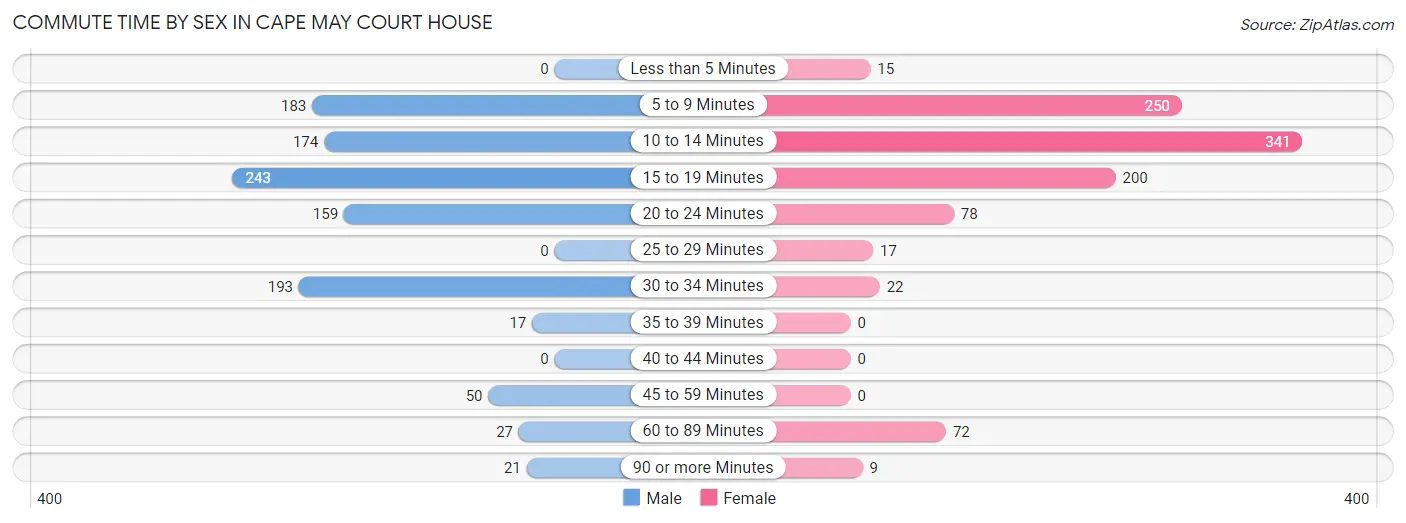
| Commute Time | Male | Female |
| Less than 5 Minutes | 0 (0.0%) | 15 (1.5%) |
| 5 to 9 Minutes | 183 (17.2%) | 250 (24.9%) |
| 10 to 14 Minutes | 174 (16.3%) | 341 (34.0%) |
| 15 to 19 Minutes | 243 (22.8%) | 200 (19.9%) |
| 20 to 24 Minutes | 159 (14.9%) | 78 (7.8%) |
| 25 to 29 Minutes | 0 (0.0%) | 17 (1.7%) |
| 30 to 34 Minutes | 193 (18.1%) | 22 (2.2%) |
| 35 to 39 Minutes | 17 (1.6%) | 0 (0.0%) |
| 40 to 44 Minutes | 0 (0.0%) | 0 (0.0%) |
| 45 to 59 Minutes | 50 (4.7%) | 0 (0.0%) |
| 60 to 89 Minutes | 27 (2.5%) | 72 (7.2%) |
| 90 or more Minutes | 21 (2.0%) | 9 (0.9%) |
Time of Departure to Work by Sex in Cape May Court House
The most frequent times of departure to work in Cape May Court House are 6:00 AM to 6:29 AM (248, 23.2%) for males and 7:30 AM to 7:59 AM (142, 14.1%) for females.
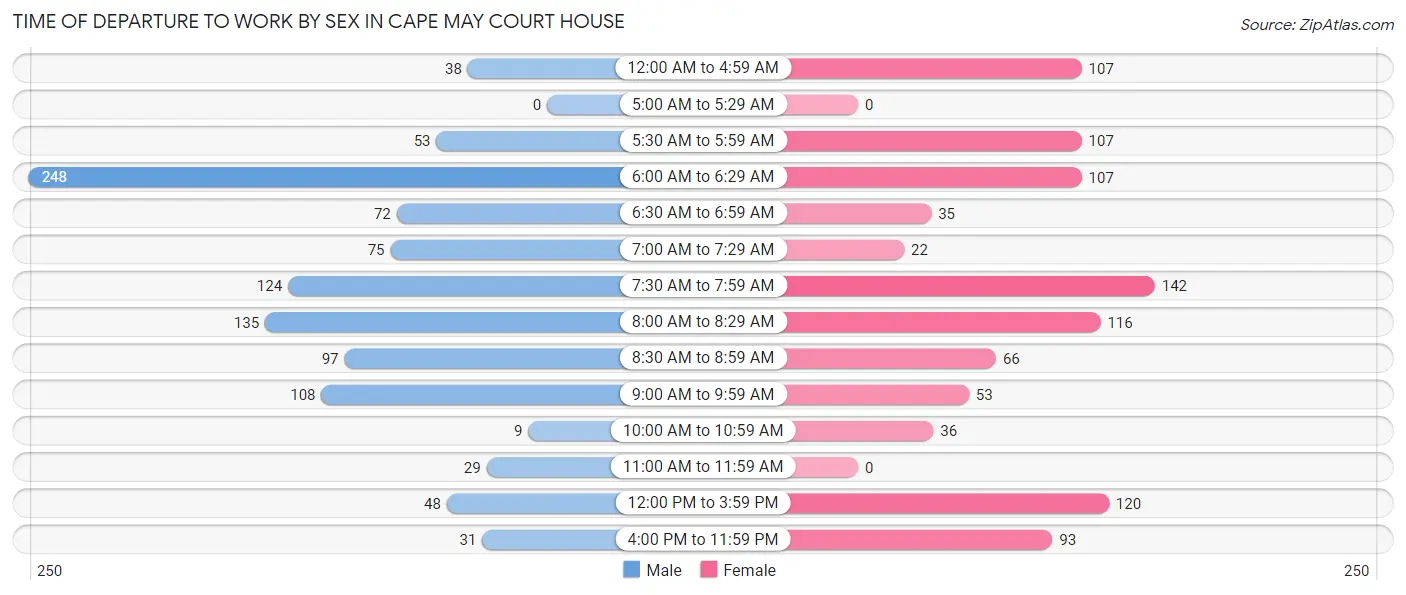
| Time of Departure | Male | Female |
| 12:00 AM to 4:59 AM | 38 (3.6%) | 107 (10.7%) |
| 5:00 AM to 5:29 AM | 0 (0.0%) | 0 (0.0%) |
| 5:30 AM to 5:59 AM | 53 (5.0%) | 107 (10.7%) |
| 6:00 AM to 6:29 AM | 248 (23.2%) | 107 (10.7%) |
| 6:30 AM to 6:59 AM | 72 (6.8%) | 35 (3.5%) |
| 7:00 AM to 7:29 AM | 75 (7.0%) | 22 (2.2%) |
| 7:30 AM to 7:59 AM | 124 (11.6%) | 142 (14.1%) |
| 8:00 AM to 8:29 AM | 135 (12.7%) | 116 (11.6%) |
| 8:30 AM to 8:59 AM | 97 (9.1%) | 66 (6.6%) |
| 9:00 AM to 9:59 AM | 108 (10.1%) | 53 (5.3%) |
| 10:00 AM to 10:59 AM | 9 (0.8%) | 36 (3.6%) |
| 11:00 AM to 11:59 AM | 29 (2.7%) | 0 (0.0%) |
| 12:00 PM to 3:59 PM | 48 (4.5%) | 120 (11.9%) |
| 4:00 PM to 11:59 PM | 31 (2.9%) | 93 (9.3%) |
| Total | 1,067 (100.0%) | 1,004 (100.0%) |
Housing Occupancy in Cape May Court House
Occupancy by Ownership in Cape May Court House
Of the total 2,586 dwellings in Cape May Court House, owner-occupied units account for 1,637 (63.3%), while renter-occupied units make up 949 (36.7%).
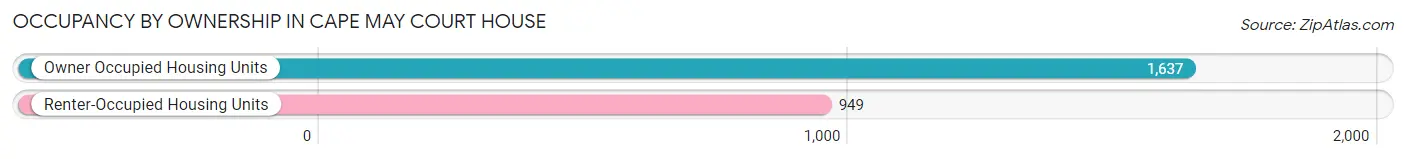
| Occupancy | # Housing Units | % Housing Units |
| Owner Occupied Housing Units | 1,637 | 63.3% |
| Renter-Occupied Housing Units | 949 | 36.7% |
| Total Occupied Housing Units | 2,586 | 100.0% |
Occupancy by Household Size in Cape May Court House
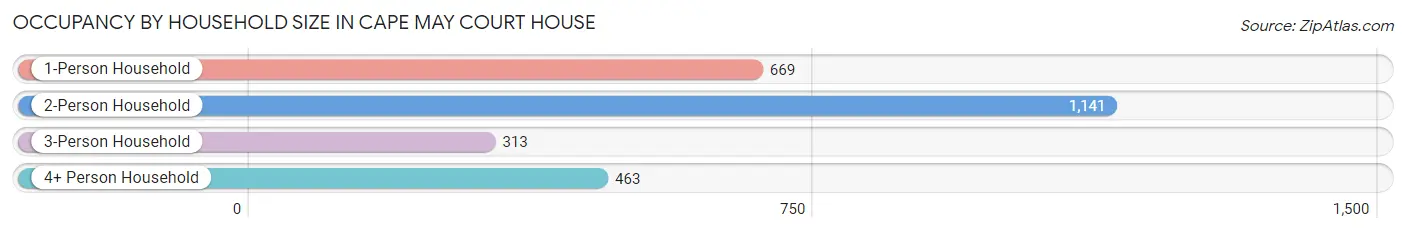
| Household Size | # Housing Units | % Housing Units |
| 1-Person Household | 669 | 25.9% |
| 2-Person Household | 1,141 | 44.1% |
| 3-Person Household | 313 | 12.1% |
| 4+ Person Household | 463 | 17.9% |
| Total Housing Units | 2,586 | 100.0% |
Occupancy by Ownership by Household Size in Cape May Court House
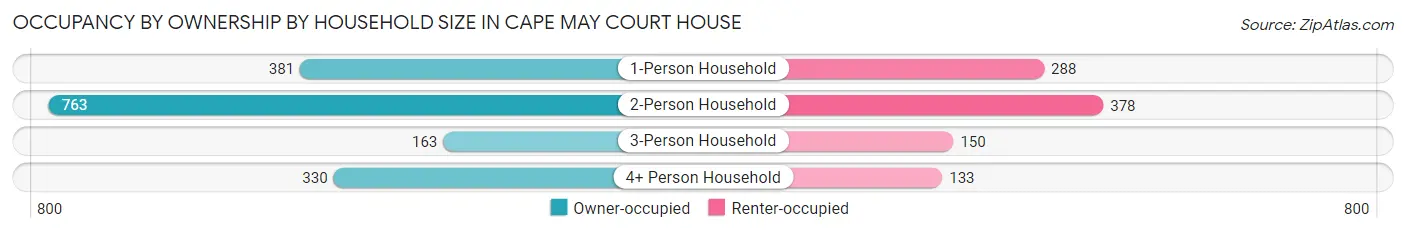
| Household Size | Owner-occupied | Renter-occupied |
| 1-Person Household | 381 (57.0%) | 288 (43.0%) |
| 2-Person Household | 763 (66.9%) | 378 (33.1%) |
| 3-Person Household | 163 (52.1%) | 150 (47.9%) |
| 4+ Person Household | 330 (71.3%) | 133 (28.7%) |
| Total Housing Units | 1,637 (63.3%) | 949 (36.7%) |
Occupancy by Educational Attainment in Cape May Court House
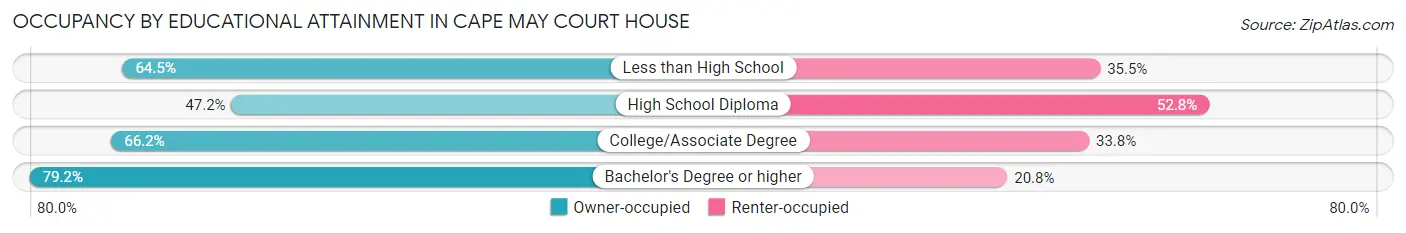
| Household Size | Owner-occupied | Renter-occupied |
| Less than High School | 98 (64.5%) | 54 (35.5%) |
| High School Diploma | 413 (47.2%) | 462 (52.8%) |
| College/Associate Degree | 555 (66.2%) | 283 (33.8%) |
| Bachelor's Degree or higher | 571 (79.2%) | 150 (20.8%) |
Occupancy by Age of Householder in Cape May Court House
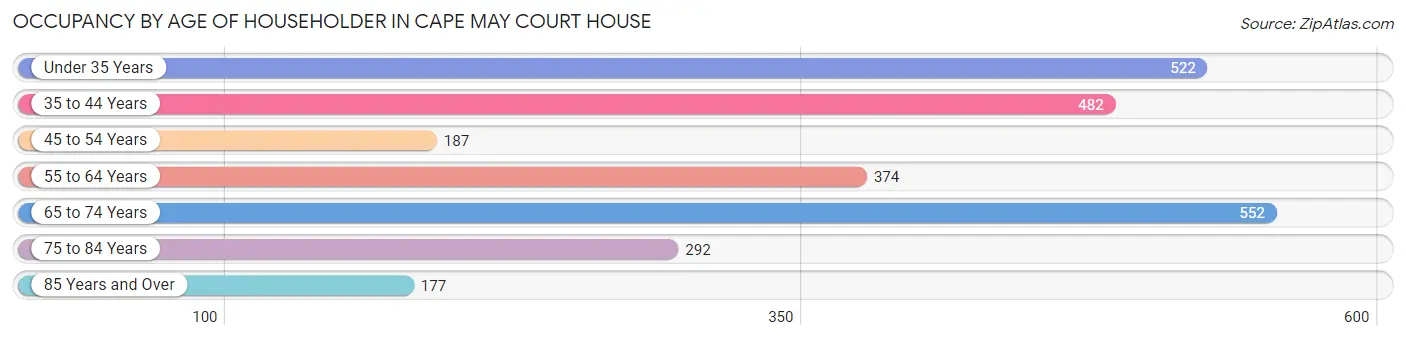
| Age Bracket | # Households | % Households |
| Under 35 Years | 522 | 20.2% |
| 35 to 44 Years | 482 | 18.6% |
| 45 to 54 Years | 187 | 7.2% |
| 55 to 64 Years | 374 | 14.5% |
| 65 to 74 Years | 552 | 21.3% |
| 75 to 84 Years | 292 | 11.3% |
| 85 Years and Over | 177 | 6.8% |
| Total | 2,586 | 100.0% |
Housing Finances in Cape May Court House
Median Income by Occupancy in Cape May Court House
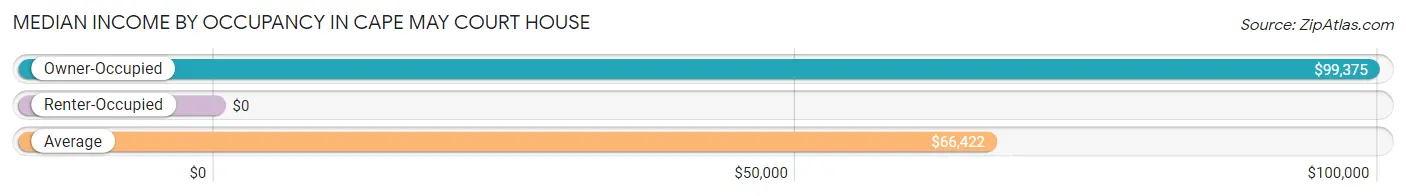
| Occupancy Type | # Households | Median Income |
| Owner-Occupied | 1,637 (63.3%) | $99,375 |
| Renter-Occupied | 949 (36.7%) | $0 |
| Average | 2,586 (100.0%) | $66,422 |
Occupancy by Householder Income Bracket in Cape May Court House
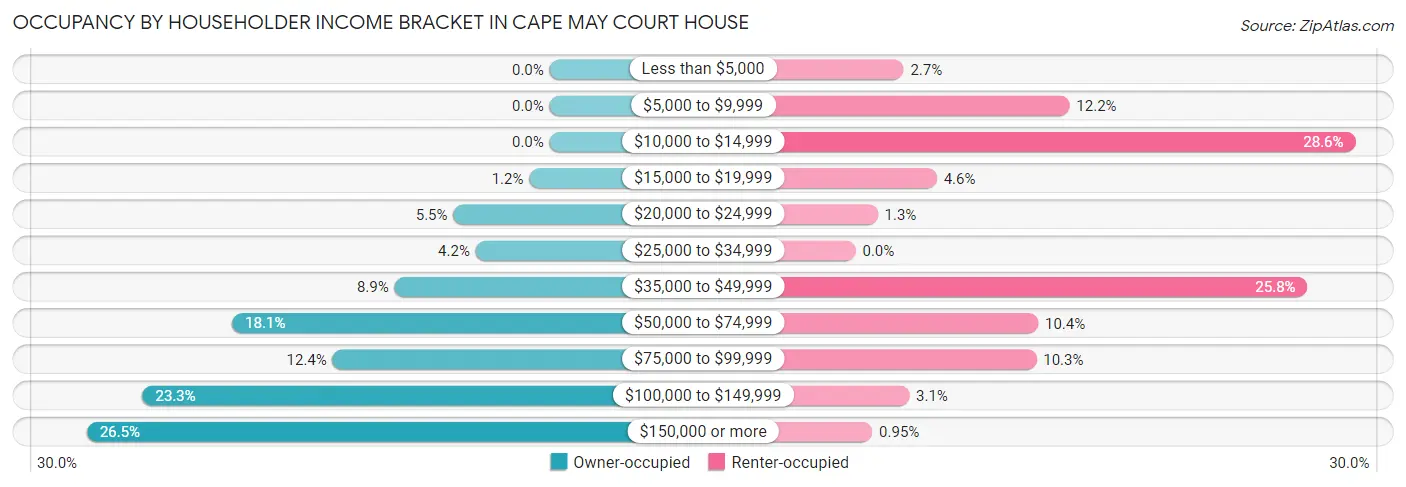
| Income Bracket | Owner-occupied | Renter-occupied |
| Less than $5,000 | 0 (0.0%) | 26 (2.7%) |
| $5,000 to $9,999 | 0 (0.0%) | 116 (12.2%) |
| $10,000 to $14,999 | 0 (0.0%) | 271 (28.6%) |
| $15,000 to $19,999 | 19 (1.2%) | 44 (4.6%) |
| $20,000 to $24,999 | 90 (5.5%) | 12 (1.3%) |
| $25,000 to $34,999 | 69 (4.2%) | 0 (0.0%) |
| $35,000 to $49,999 | 145 (8.9%) | 245 (25.8%) |
| $50,000 to $74,999 | 297 (18.1%) | 99 (10.4%) |
| $75,000 to $99,999 | 203 (12.4%) | 98 (10.3%) |
| $100,000 to $149,999 | 381 (23.3%) | 29 (3.1%) |
| $150,000 or more | 433 (26.5%) | 9 (0.9%) |
| Total | 1,637 (100.0%) | 949 (100.0%) |
Monthly Housing Cost Tiers in Cape May Court House
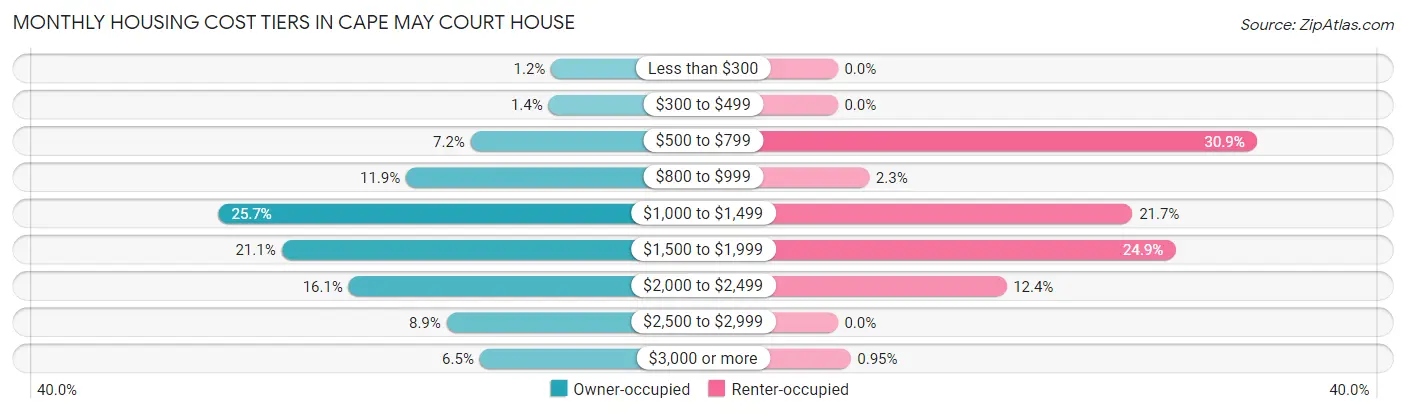
| Monthly Cost | Owner-occupied | Renter-occupied |
| Less than $300 | 20 (1.2%) | 0 (0.0%) |
| $300 to $499 | 23 (1.4%) | 0 (0.0%) |
| $500 to $799 | 117 (7.1%) | 293 (30.9%) |
| $800 to $999 | 195 (11.9%) | 22 (2.3%) |
| $1,000 to $1,499 | 421 (25.7%) | 206 (21.7%) |
| $1,500 to $1,999 | 345 (21.1%) | 236 (24.9%) |
| $2,000 to $2,499 | 264 (16.1%) | 118 (12.4%) |
| $2,500 to $2,999 | 146 (8.9%) | 0 (0.0%) |
| $3,000 or more | 106 (6.5%) | 9 (0.9%) |
| Total | 1,637 (100.0%) | 949 (100.0%) |
Physical Housing Characteristics in Cape May Court House
Housing Structures in Cape May Court House
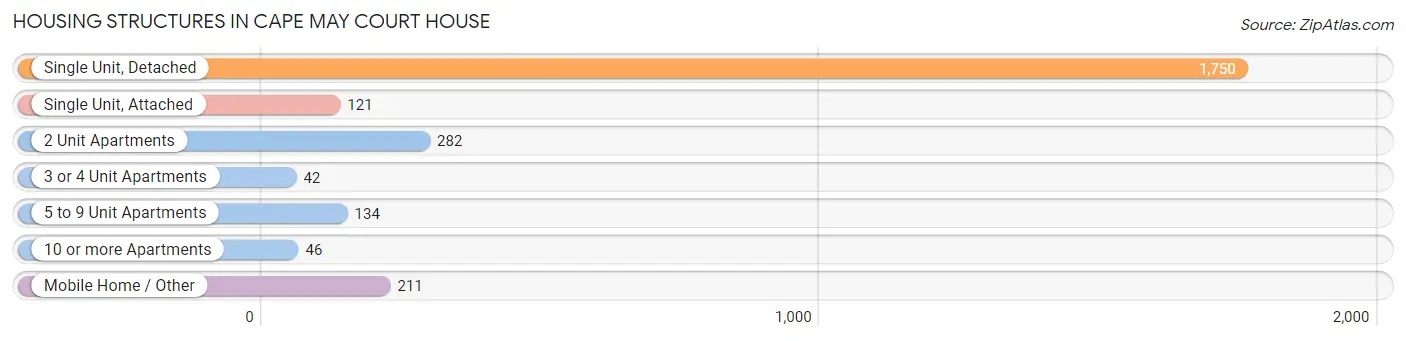
| Structure Type | # Housing Units | % Housing Units |
| Single Unit, Detached | 1,750 | 67.7% |
| Single Unit, Attached | 121 | 4.7% |
| 2 Unit Apartments | 282 | 10.9% |
| 3 or 4 Unit Apartments | 42 | 1.6% |
| 5 to 9 Unit Apartments | 134 | 5.2% |
| 10 or more Apartments | 46 | 1.8% |
| Mobile Home / Other | 211 | 8.2% |
| Total | 2,586 | 100.0% |
Housing Structures by Occupancy in Cape May Court House
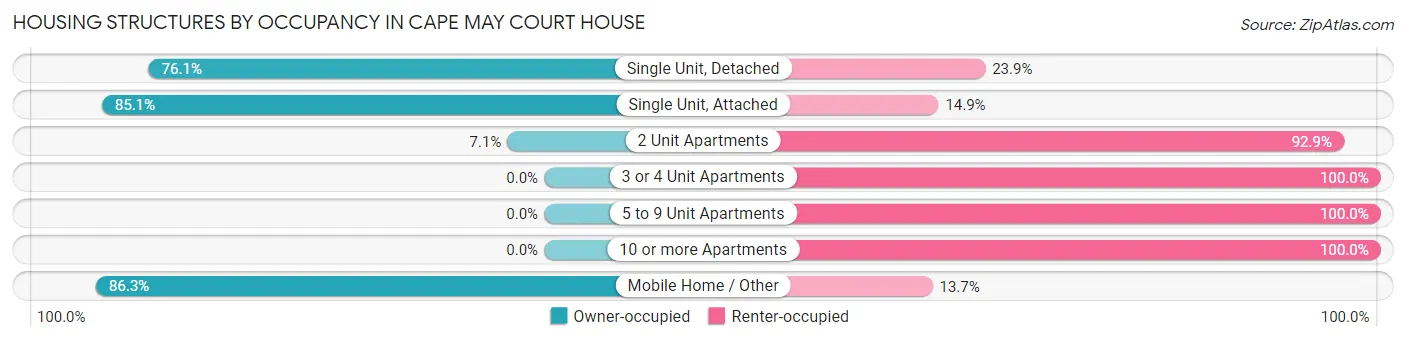
| Structure Type | Owner-occupied | Renter-occupied |
| Single Unit, Detached | 1,332 (76.1%) | 418 (23.9%) |
| Single Unit, Attached | 103 (85.1%) | 18 (14.9%) |
| 2 Unit Apartments | 20 (7.1%) | 262 (92.9%) |
| 3 or 4 Unit Apartments | 0 (0.0%) | 42 (100.0%) |
| 5 to 9 Unit Apartments | 0 (0.0%) | 134 (100.0%) |
| 10 or more Apartments | 0 (0.0%) | 46 (100.0%) |
| Mobile Home / Other | 182 (86.3%) | 29 (13.7%) |
| Total | 1,637 (63.3%) | 949 (36.7%) |
Housing Structures by Number of Rooms in Cape May Court House
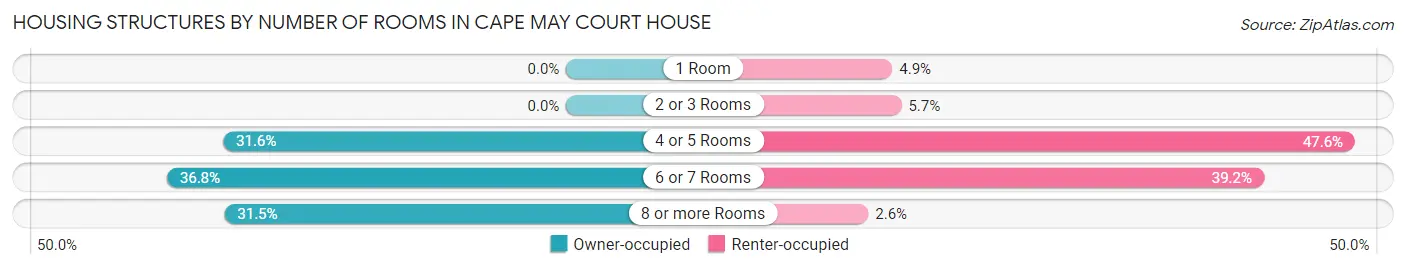
| Number of Rooms | Owner-occupied | Renter-occupied |
| 1 Room | 0 (0.0%) | 46 (4.9%) |
| 2 or 3 Rooms | 0 (0.0%) | 54 (5.7%) |
| 4 or 5 Rooms | 518 (31.6%) | 452 (47.6%) |
| 6 or 7 Rooms | 603 (36.8%) | 372 (39.2%) |
| 8 or more Rooms | 516 (31.5%) | 25 (2.6%) |
| Total | 1,637 (100.0%) | 949 (100.0%) |
Housing Structure by Heating Type in Cape May Court House
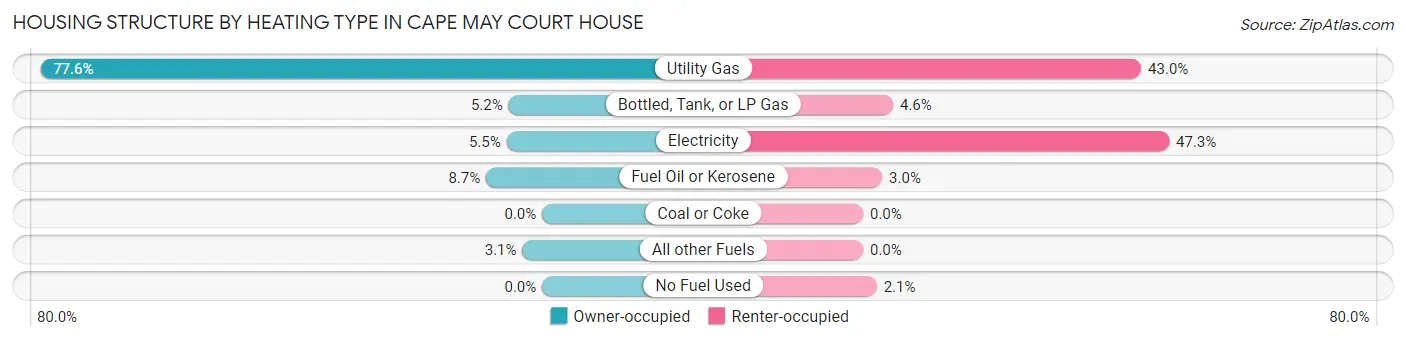
| Heating Type | Owner-occupied | Renter-occupied |
| Utility Gas | 1,270 (77.6%) | 408 (43.0%) |
| Bottled, Tank, or LP Gas | 85 (5.2%) | 44 (4.6%) |
| Electricity | 90 (5.5%) | 449 (47.3%) |
| Fuel Oil or Kerosene | 142 (8.7%) | 28 (2.9%) |
| Coal or Coke | 0 (0.0%) | 0 (0.0%) |
| All other Fuels | 50 (3.0%) | 0 (0.0%) |
| No Fuel Used | 0 (0.0%) | 20 (2.1%) |
| Total | 1,637 (100.0%) | 949 (100.0%) |
Household Vehicle Usage in Cape May Court House
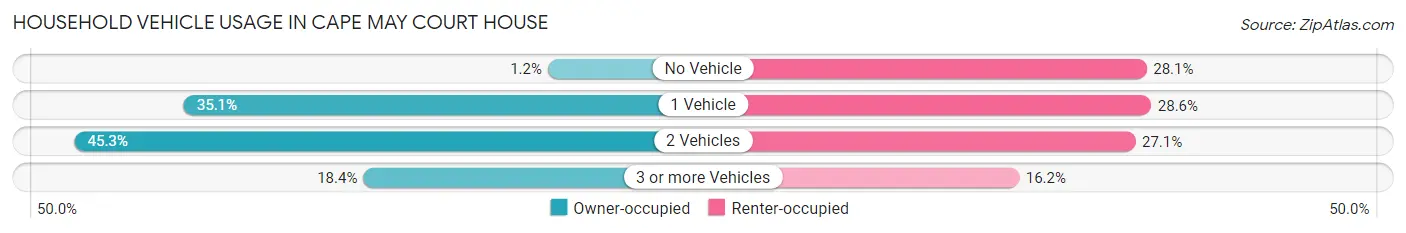
| Vehicles per Household | Owner-occupied | Renter-occupied |
| No Vehicle | 19 (1.2%) | 267 (28.1%) |
| 1 Vehicle | 575 (35.1%) | 271 (28.6%) |
| 2 Vehicles | 742 (45.3%) | 257 (27.1%) |
| 3 or more Vehicles | 301 (18.4%) | 154 (16.2%) |
| Total | 1,637 (100.0%) | 949 (100.0%) |
Real Estate & Mortgages in Cape May Court House
Real Estate and Mortgage Overview in Cape May Court House
| Characteristic | Without Mortgage | With Mortgage |
| Housing Units | 631 | 1,006 |
| Median Property Value | $359,400 | $332,400 |
| Median Household Income | $93,958 | $226 |
| Monthly Housing Costs | $971 | $106 |
| Real Estate Taxes | $5,567 | $70 |
Property Value by Mortgage Status in Cape May Court House
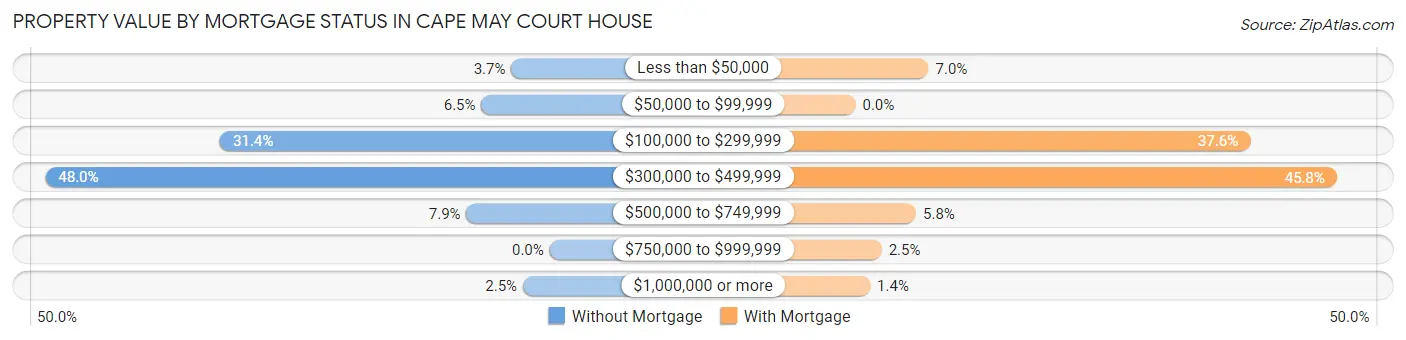
| Property Value | Without Mortgage | With Mortgage |
| Less than $50,000 | 23 (3.6%) | 70 (7.0%) |
| $50,000 to $99,999 | 41 (6.5%) | 0 (0.0%) |
| $100,000 to $299,999 | 198 (31.4%) | 378 (37.6%) |
| $300,000 to $499,999 | 303 (48.0%) | 461 (45.8%) |
| $500,000 to $749,999 | 50 (7.9%) | 58 (5.8%) |
| $750,000 to $999,999 | 0 (0.0%) | 25 (2.5%) |
| $1,000,000 or more | 16 (2.5%) | 14 (1.4%) |
| Total | 631 (100.0%) | 1,006 (100.0%) |
Household Income by Mortgage Status in Cape May Court House
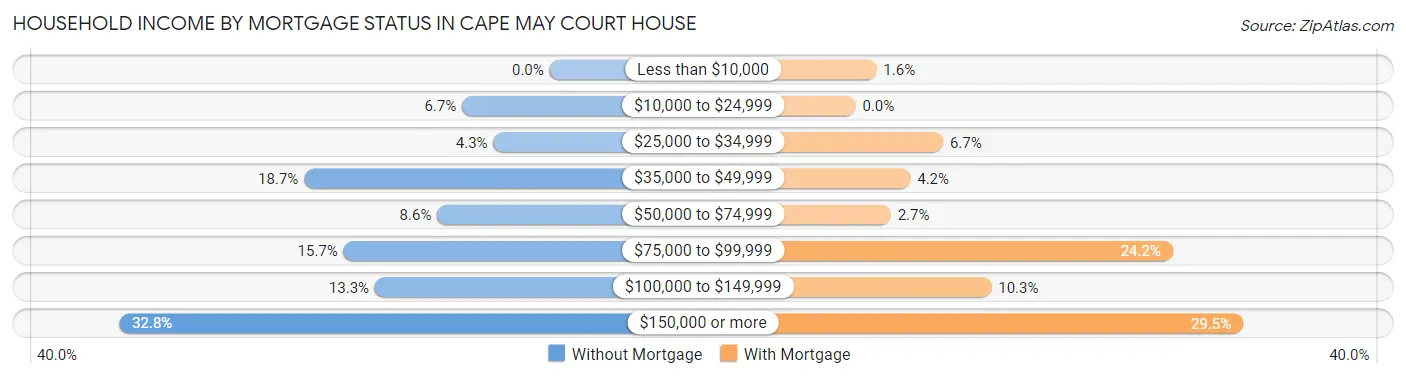
| Household Income | Without Mortgage | With Mortgage |
| Less than $10,000 | 0 (0.0%) | 16 (1.6%) |
| $10,000 to $24,999 | 42 (6.7%) | 0 (0.0%) |
| $25,000 to $34,999 | 27 (4.3%) | 67 (6.7%) |
| $35,000 to $49,999 | 118 (18.7%) | 42 (4.2%) |
| $50,000 to $74,999 | 54 (8.6%) | 27 (2.7%) |
| $75,000 to $99,999 | 99 (15.7%) | 243 (24.2%) |
| $100,000 to $149,999 | 84 (13.3%) | 104 (10.3%) |
| $150,000 or more | 207 (32.8%) | 297 (29.5%) |
| Total | 631 (100.0%) | 1,006 (100.0%) |
Property Value to Household Income Ratio in Cape May Court House
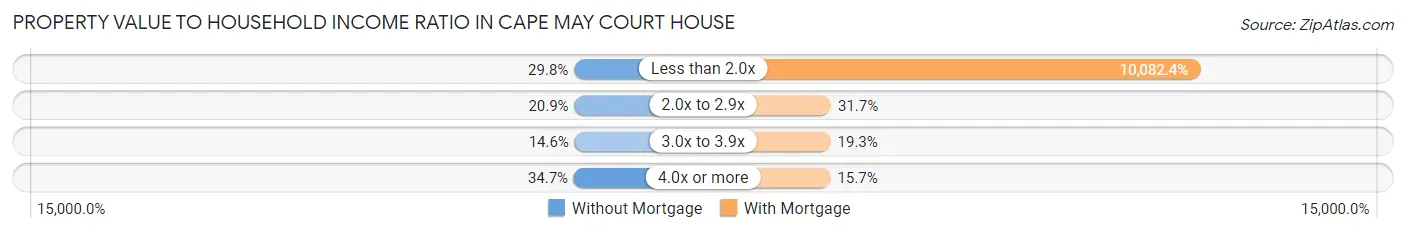
| Value-to-Income Ratio | Without Mortgage | With Mortgage |
| Less than 2.0x | 188 (29.8%) | 101,429 (10,082.4%) |
| 2.0x to 2.9x | 132 (20.9%) | 319 (31.7%) |
| 3.0x to 3.9x | 92 (14.6%) | 194 (19.3%) |
| 4.0x or more | 219 (34.7%) | 158 (15.7%) |
| Total | 631 (100.0%) | 1,006 (100.0%) |
Real Estate Taxes by Mortgage Status in Cape May Court House
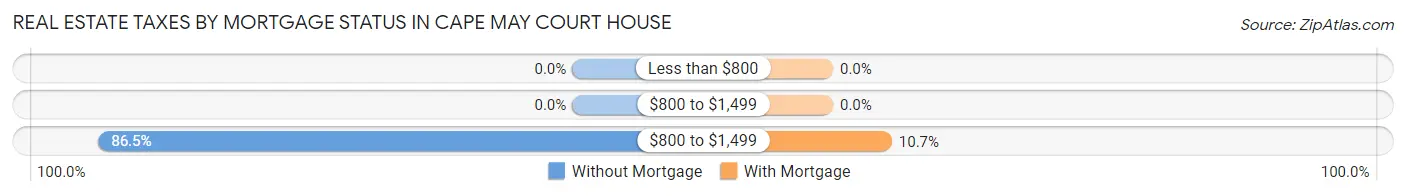
| Property Taxes | Without Mortgage | With Mortgage |
| Less than $800 | 0 (0.0%) | 0 (0.0%) |
| $800 to $1,499 | 0 (0.0%) | 0 (0.0%) |
| $800 to $1,499 | 546 (86.5%) | 108 (10.7%) |
| Total | 631 (100.0%) | 1,006 (100.0%) |
Health & Disability in Cape May Court House
Health Insurance Coverage by Age in Cape May Court House
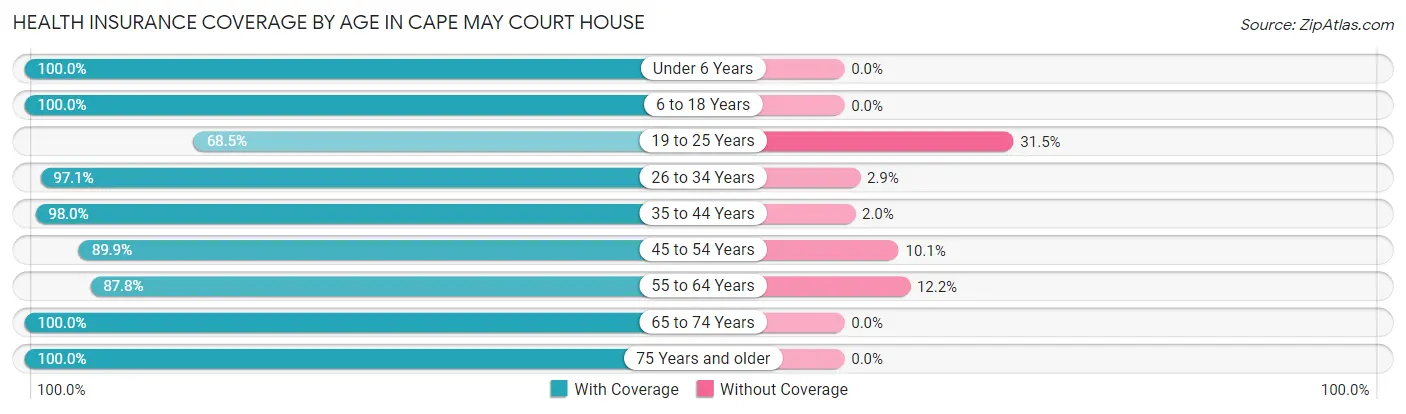
| Age Bracket | With Coverage | Without Coverage |
| Under 6 Years | 271 (100.0%) | 0 (0.0%) |
| 6 to 18 Years | 864 (100.0%) | 0 (0.0%) |
| 19 to 25 Years | 254 (68.5%) | 117 (31.5%) |
| 26 to 34 Years | 530 (97.1%) | 16 (2.9%) |
| 35 to 44 Years | 686 (98.0%) | 14 (2.0%) |
| 45 to 54 Years | 311 (89.9%) | 35 (10.1%) |
| 55 to 64 Years | 502 (87.8%) | 70 (12.2%) |
| 65 to 74 Years | 969 (100.0%) | 0 (0.0%) |
| 75 Years and older | 673 (100.0%) | 0 (0.0%) |
| Total | 5,060 (95.3%) | 252 (4.7%) |
Health Insurance Coverage by Citizenship Status in Cape May Court House
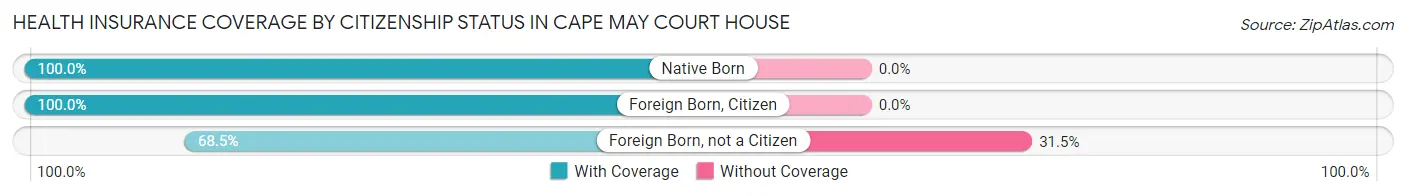
| Citizenship Status | With Coverage | Without Coverage |
| Native Born | 271 (100.0%) | 0 (0.0%) |
| Foreign Born, Citizen | 864 (100.0%) | 0 (0.0%) |
| Foreign Born, not a Citizen | 254 (68.5%) | 117 (31.5%) |
Health Insurance Coverage by Household Income in Cape May Court House
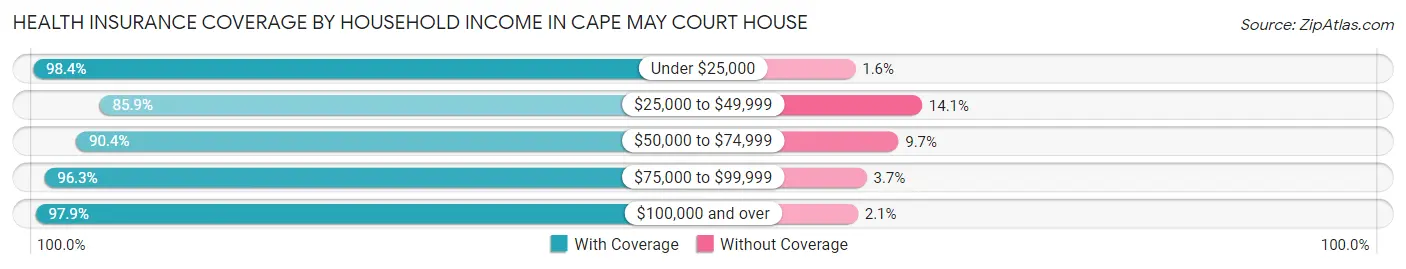
| Household Income | With Coverage | Without Coverage |
| Under $25,000 | 864 (98.4%) | 14 (1.6%) |
| $25,000 to $49,999 | 611 (85.9%) | 100 (14.1%) |
| $50,000 to $74,999 | 618 (90.3%) | 66 (9.7%) |
| $75,000 to $99,999 | 546 (96.3%) | 21 (3.7%) |
| $100,000 and over | 2,420 (97.9%) | 51 (2.1%) |
Public vs Private Health Insurance Coverage by Age in Cape May Court House
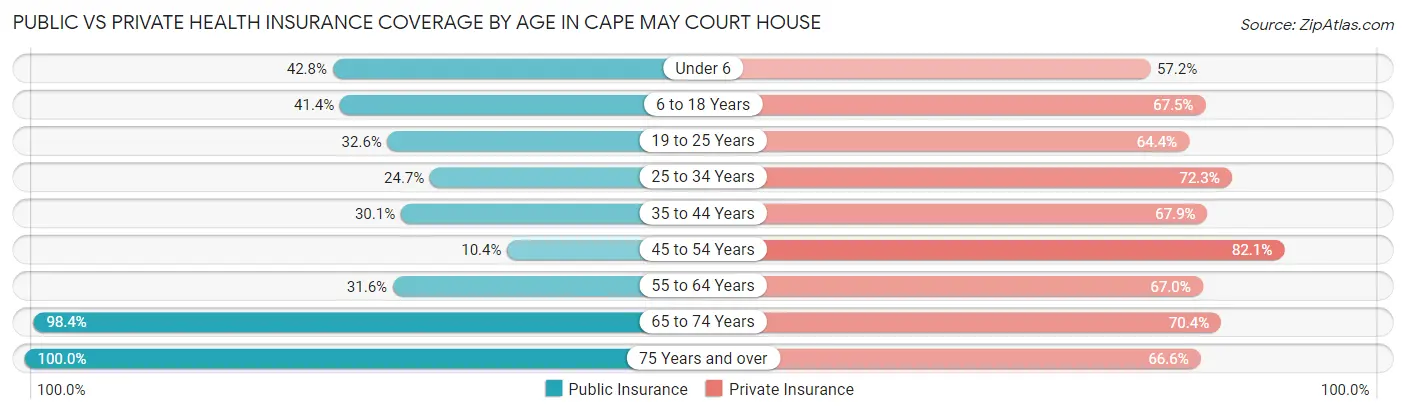
| Age Bracket | Public Insurance | Private Insurance |
| Under 6 | 116 (42.8%) | 155 (57.2%) |
| 6 to 18 Years | 358 (41.4%) | 583 (67.5%) |
| 19 to 25 Years | 121 (32.6%) | 239 (64.4%) |
| 25 to 34 Years | 135 (24.7%) | 395 (72.3%) |
| 35 to 44 Years | 211 (30.1%) | 475 (67.9%) |
| 45 to 54 Years | 36 (10.4%) | 284 (82.1%) |
| 55 to 64 Years | 181 (31.6%) | 383 (67.0%) |
| 65 to 74 Years | 953 (98.4%) | 682 (70.4%) |
| 75 Years and over | 673 (100.0%) | 448 (66.6%) |
| Total | 2,784 (52.4%) | 3,644 (68.6%) |
Disability Status by Sex by Age in Cape May Court House
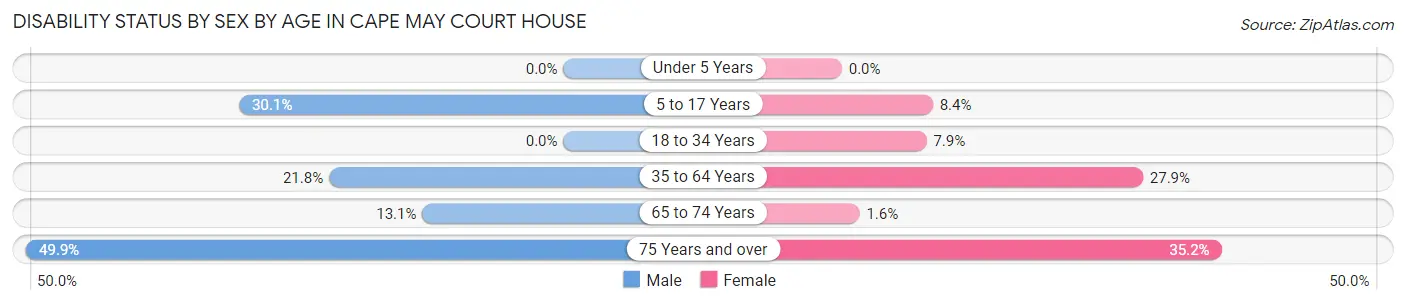
| Age Bracket | Male | Female |
| Under 5 Years | 0 (0.0%) | 0 (0.0%) |
| 5 to 17 Years | 155 (30.1%) | 27 (8.4%) |
| 18 to 34 Years | 0 (0.0%) | 48 (7.9%) |
| 35 to 64 Years | 137 (21.7%) | 276 (27.9%) |
| 65 to 74 Years | 47 (13.1%) | 10 (1.6%) |
| 75 Years and over | 187 (49.9%) | 105 (35.2%) |
Disability Class by Sex by Age in Cape May Court House
Disability Class: Hearing Difficulty
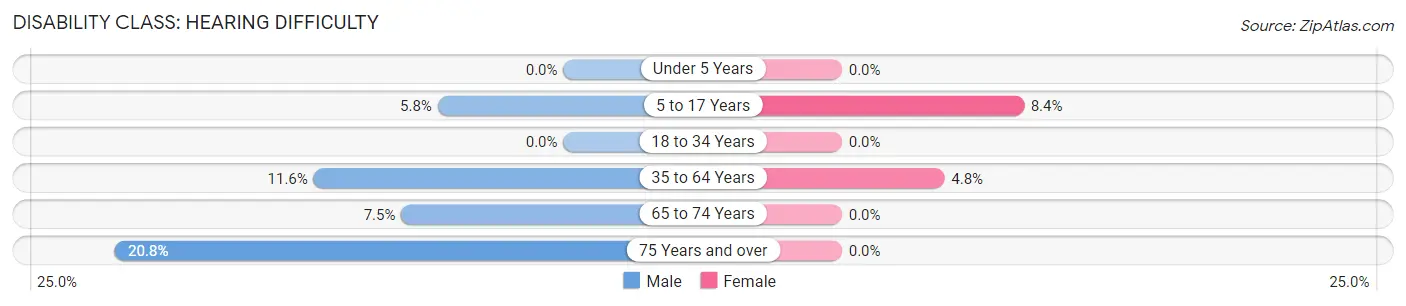
| Age Bracket | Male | Female |
| Under 5 Years | 0 (0.0%) | 0 (0.0%) |
| 5 to 17 Years | 30 (5.8%) | 27 (8.4%) |
| 18 to 34 Years | 0 (0.0%) | 0 (0.0%) |
| 35 to 64 Years | 73 (11.6%) | 47 (4.8%) |
| 65 to 74 Years | 27 (7.5%) | 0 (0.0%) |
| 75 Years and over | 78 (20.8%) | 0 (0.0%) |
Disability Class: Vision Difficulty
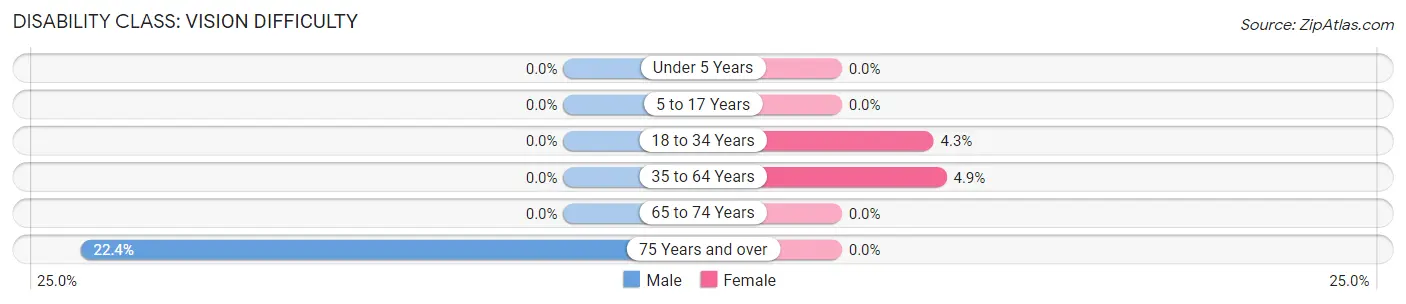
| Age Bracket | Male | Female |
| Under 5 Years | 0 (0.0%) | 0 (0.0%) |
| 5 to 17 Years | 0 (0.0%) | 0 (0.0%) |
| 18 to 34 Years | 0 (0.0%) | 26 (4.3%) |
| 35 to 64 Years | 0 (0.0%) | 48 (4.9%) |
| 65 to 74 Years | 0 (0.0%) | 0 (0.0%) |
| 75 Years and over | 84 (22.4%) | 0 (0.0%) |
Disability Class: Cognitive Difficulty
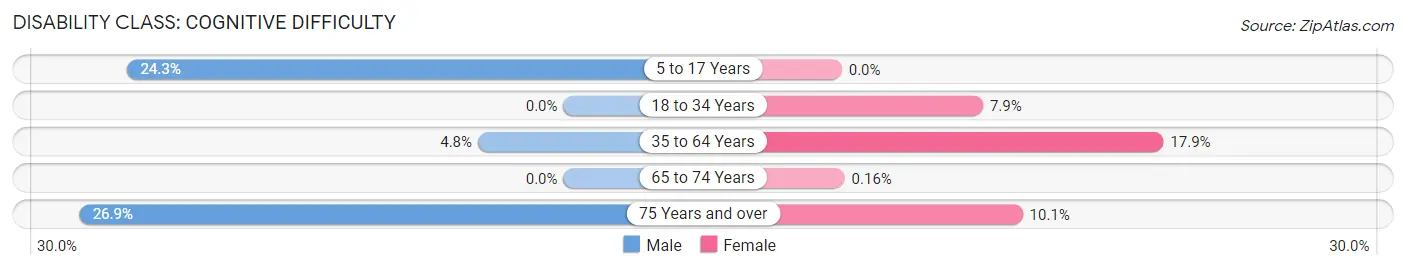
| Age Bracket | Male | Female |
| 5 to 17 Years | 125 (24.3%) | 0 (0.0%) |
| 18 to 34 Years | 0 (0.0%) | 48 (7.9%) |
| 35 to 64 Years | 30 (4.8%) | 177 (17.9%) |
| 65 to 74 Years | 0 (0.0%) | 1 (0.2%) |
| 75 Years and over | 101 (26.9%) | 30 (10.1%) |
Disability Class: Ambulatory Difficulty
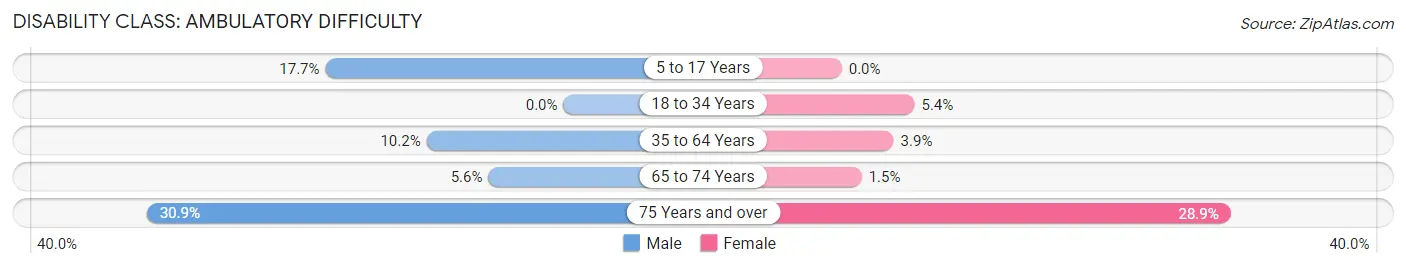
| Age Bracket | Male | Female |
| 5 to 17 Years | 91 (17.7%) | 0 (0.0%) |
| 18 to 34 Years | 0 (0.0%) | 33 (5.4%) |
| 35 to 64 Years | 64 (10.2%) | 38 (3.8%) |
| 65 to 74 Years | 20 (5.6%) | 9 (1.5%) |
| 75 Years and over | 116 (30.9%) | 86 (28.9%) |
Disability Class: Self-Care Difficulty
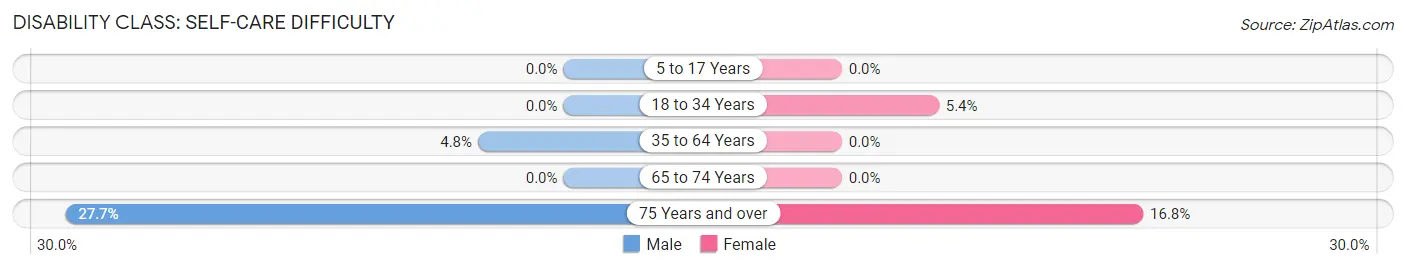
| Age Bracket | Male | Female |
| 5 to 17 Years | 0 (0.0%) | 0 (0.0%) |
| 18 to 34 Years | 0 (0.0%) | 33 (5.4%) |
| 35 to 64 Years | 30 (4.8%) | 0 (0.0%) |
| 65 to 74 Years | 0 (0.0%) | 0 (0.0%) |
| 75 Years and over | 104 (27.7%) | 50 (16.8%) |
Technology Access in Cape May Court House
Computing Device Access in Cape May Court House
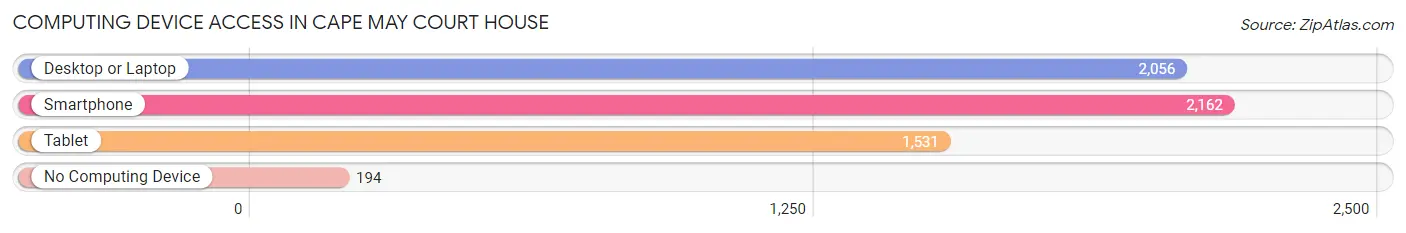
| Device Type | # Households | % Households |
| Desktop or Laptop | 2,056 | 79.5% |
| Smartphone | 2,162 | 83.6% |
| Tablet | 1,531 | 59.2% |
| No Computing Device | 194 | 7.5% |
| Total | 2,586 | 100.0% |
Internet Access in Cape May Court House
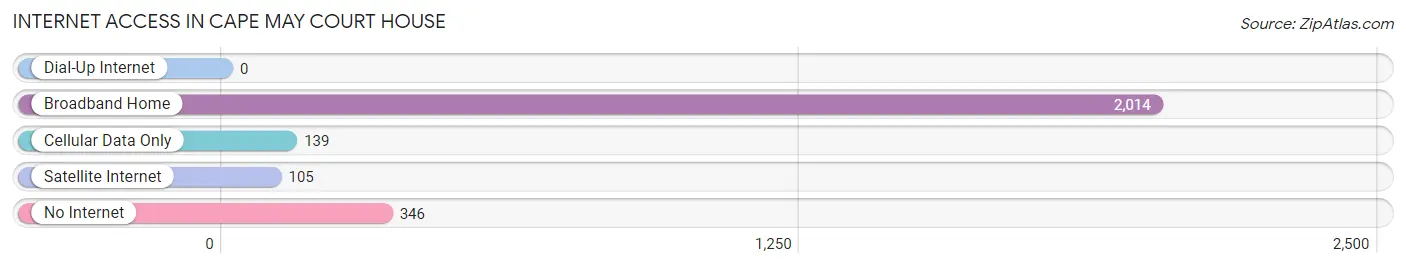
| Internet Type | # Households | % Households |
| Dial-Up Internet | 0 | 0.0% |
| Broadband Home | 2,014 | 77.9% |
| Cellular Data Only | 139 | 5.4% |
| Satellite Internet | 105 | 4.1% |
| No Internet | 346 | 13.4% |
| Total | 2,586 | 100.0% |
Cape May Court House Summary
Cape May Court House is a census-designated place (CDP) located in Middle Township, Cape May County, New Jersey, United States. As of the 2010 United States Census, the CDP's population was 5,338.
Geography
Cape May Court House is located at 39°2'45" North, 74°55'45" West (39.04583, -74.92917). It is located in the center of Middle Township, and is bordered to the north by the town of Rio Grande, to the east by the town of Dennis Township, to the south by the town of Lower Township, and to the west by the town of Upper Township.
According to the United States Census Bureau, the CDP has a total area of 8.3 square miles (21.5 km2), of which 8.2 square miles (21.3 km2) is land and 0.1 square miles (0.2 km2) (1.17%) is water.
History
Cape May Court House was originally known as "Middleton", and was established in 1703. The name was changed to "Cape May Court House" in 1848, when the county seat was moved from Cape May City to the village. The village was incorporated as a borough in 1872, but was dissolved in 1891.
The area was a popular resort destination in the late 19th and early 20th centuries, and was home to several large hotels. The area was also home to a number of farms, and was the site of the first commercial cranberry bog in the United States.
Economy
Cape May Court House is the commercial and governmental center of Cape May County. The county government is the largest employer in the area, and the county courthouse is located in the center of the CDP.
The area is also home to a number of retail stores, restaurants, and other businesses. The area is also home to a number of medical facilities, including Cape Regional Medical Center, Cape May County Medical Center, and Cape Regional Medical Center.
Demographics
As of the 2010 United States Census, there were 5,338 people, 2,093 households, and 1,372 families residing in the CDP. The population density was 648.3 per square mile (250.2/km2). There were 2,309 housing units at an average density of 281.3 per square mile (108.7/km2). The racial makeup of the CDP was 94.2% White, 2.2% African American, 0.2% Native American, 1.2% Asian, 0.1% Pacific Islander, 0.9% from other races, and 1.2% from two or more races. Hispanic or Latino of any race were 3.3% of the population.
There were 2,093 households, out of which 28.2% had children under the age of 18 living with them, 51.2% were married couples living together, 10.7% had a female householder with no husband present, and 33.7% were non-families. 28.2% of all households were made up of individuals, and 12.2% had someone living alone who was 65 years of age or older. The average household size was 2.53 and the average family size was 3.13.
In the CDP, the population was spread out, with 23.2% under the age of 18, 7.2% from 18 to 24, 25.2% from 25 to 44, 28.2% from 45 to 64, and 16.2% who were 65 years of age or older. The median age was 40.7 years. For every 100 females, there were 94.2 males. For every 100 females age 18 and over, there were 91.2 males.
The median income for a household in the CDP was $50,972, and the median income for a family was $62,857. Males had a median income of $45,938 versus $35,938 for females. The per capita income for the CDP was $25,945. About 5.2% of families and 7.2% of the population were below the poverty line, including 8.2% of those under age 18 and 6.2% of those age 65 or over.
Common Questions
What is Per Capita Income in Cape May Court House?
Per Capita income in Cape May Court House is $40,983.
What is the Median Family Income in Cape May Court House?
Median Family Income in Cape May Court House is $85,443.
What is the Median Household income in Cape May Court House?
Median Household Income in Cape May Court House is $66,422.
What is Income or Wage Gap in Cape May Court House?
Income or Wage Gap in Cape May Court House is 17.0%.
Women in Cape May Court House earn 83.0 cents for every dollar earned by a man.
What is Inequality or Gini Index in Cape May Court House?
Inequality or Gini Index in Cape May Court House is 0.47.
What is the Total Population of Cape May Court House?
Total Population of Cape May Court House is 5,557.
What is the Total Male Population of Cape May Court House?
Total Male Population of Cape May Court House is 2,590.
What is the Total Female Population of Cape May Court House?
Total Female Population of Cape May Court House is 2,967.
What is the Ratio of Males per 100 Females in Cape May Court House?
There are 87.29 Males per 100 Females in Cape May Court House.
What is the Ratio of Females per 100 Males in Cape May Court House?
There are 114.56 Females per 100 Males in Cape May Court House.
What is the Median Population Age in Cape May Court House?
Median Population Age in Cape May Court House is 44.9 Years.
What is the Average Family Size in Cape May Court House
Average Family Size in Cape May Court House is 2.6 People.
What is the Average Household Size in Cape May Court House
Average Household Size in Cape May Court House is 2.1 People.
How Large is the Labor Force in Cape May Court House?
There are 2,437 People in the Labor Forcein in Cape May Court House.
What is the Percentage of People in the Labor Force in Cape May Court House?
53.1% of People are in the Labor Force in Cape May Court House.
What is the Unemployment Rate in Cape May Court House?
Unemployment Rate in Cape May Court House is 6.9%.