Fernandina Beach, FL Map & Demographics
Fernandina Beach Map
Fernandina Beach Overview
$58,231
PER CAPITA INCOME
$108,320
AVG FAMILY INCOME
$86,494
AVG HOUSEHOLD INCOME
33.5%
WAGE / INCOME GAP [ % ]
66.5¢/ $1
WAGE / INCOME GAP [ $ ]
$8,040
FAMILY INCOME DEFICIT
0.49
INEQUALITY / GINI INDEX
13,028
TOTAL POPULATION
6,319
MALE POPULATION
6,709
FEMALE POPULATION
94.19
MALES / 100 FEMALES
106.17
FEMALES / 100 MALES
57.6
MEDIAN AGE
2.7
AVG FAMILY SIZE
2.1
AVG HOUSEHOLD SIZE
6,164
LABOR FORCE [ PEOPLE ]
52.7%
PERCENT IN LABOR FORCE
2.9%
UNEMPLOYMENT RATE
Fernandina Beach Zip Codes
Fernandina Beach Area Codes
Income in Fernandina Beach
Income Overview in Fernandina Beach
Per Capita Income in Fernandina Beach is $58,231, while median incomes of families and households are $108,320 and $86,494 respectively.
| Characteristic | Number | Measure |
| Per Capita Income | 13,028 | $58,231 |
| Median Family Income | 3,712 | $108,320 |
| Mean Family Income | 3,712 | $133,086 |
| Median Household Income | 6,068 | $86,494 |
| Mean Household Income | 6,068 | $121,266 |
| Income Deficit | 3,712 | $8,040 |
| Wage / Income Gap (%) | 13,028 | 33.46% |
| Wage / Income Gap ($) | 13,028 | 66.54¢ per $1 |
| Gini / Inequality Index | 13,028 | 0.49 |
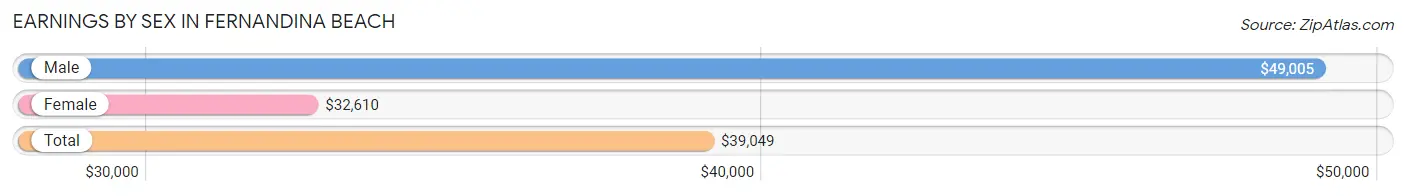
Earnings by Sex in Fernandina Beach
Average Earnings in Fernandina Beach are $39,049, $49,005 for men and $32,610 for women, a difference of 33.5%.
| Sex | Number | Average Earnings |
| Male | 3,319 (50.3%) | $49,005 |
| Female | 3,276 (49.7%) | $32,610 |
| Total | 6,595 (100.0%) | $39,049 |
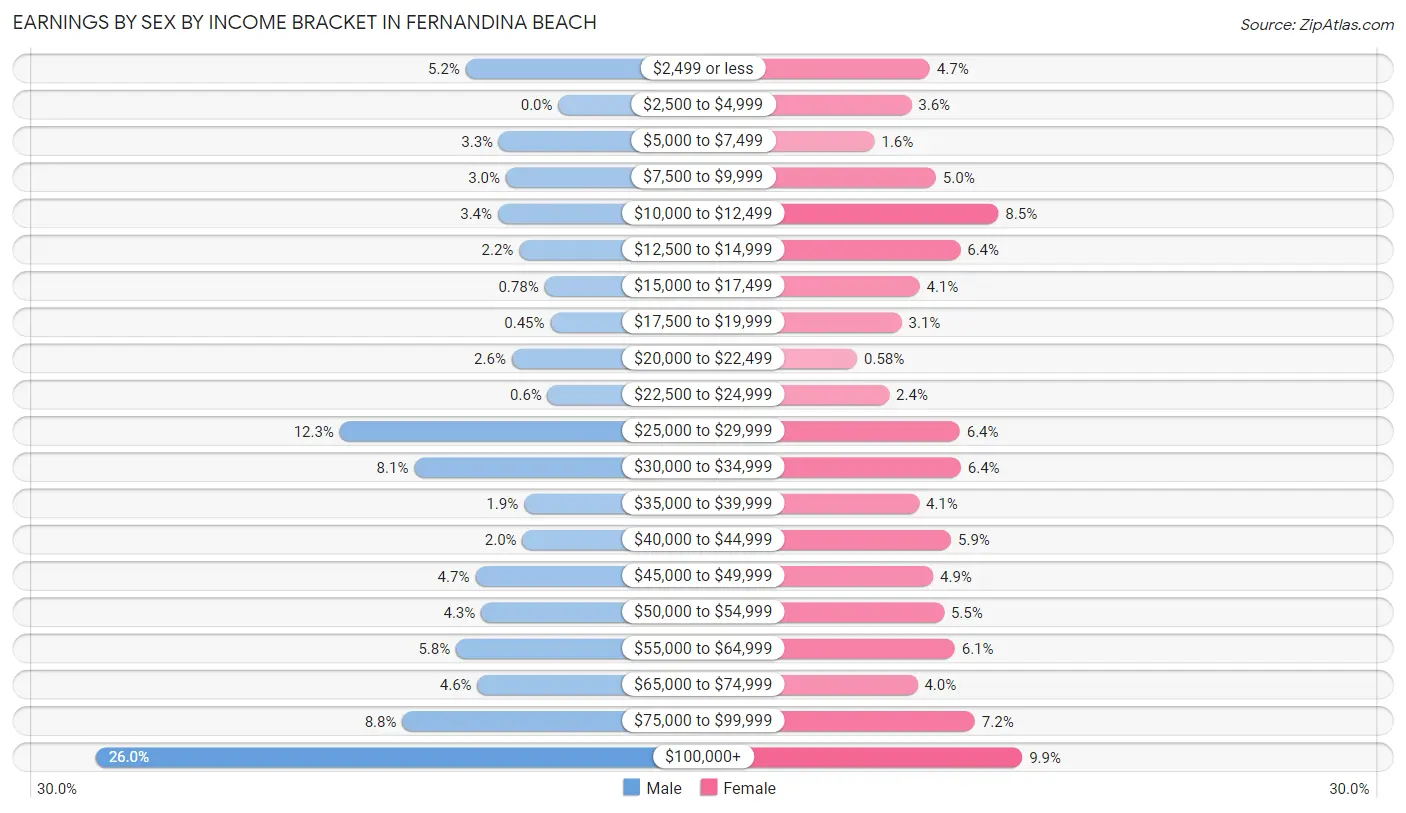
Earnings by Sex by Income Bracket in Fernandina Beach
The most common earnings brackets in Fernandina Beach are $100,000+ for men (863 | 26.0%) and $100,000+ for women (323 | 9.9%).
| Income | Male | Female |
| $2,499 or less | 173 (5.2%) | 153 (4.7%) |
| $2,500 to $4,999 | 0 (0.0%) | 119 (3.6%) |
| $5,000 to $7,499 | 111 (3.3%) | 51 (1.6%) |
| $7,500 to $9,999 | 98 (2.9%) | 164 (5.0%) |
| $10,000 to $12,499 | 113 (3.4%) | 279 (8.5%) |
| $12,500 to $14,999 | 73 (2.2%) | 209 (6.4%) |
| $15,000 to $17,499 | 26 (0.8%) | 134 (4.1%) |
| $17,500 to $19,999 | 15 (0.4%) | 101 (3.1%) |
| $20,000 to $22,499 | 87 (2.6%) | 19 (0.6%) |
| $22,500 to $24,999 | 20 (0.6%) | 78 (2.4%) |
| $25,000 to $29,999 | 408 (12.3%) | 208 (6.4%) |
| $30,000 to $34,999 | 269 (8.1%) | 210 (6.4%) |
| $35,000 to $39,999 | 64 (1.9%) | 133 (4.1%) |
| $40,000 to $44,999 | 67 (2.0%) | 192 (5.9%) |
| $45,000 to $49,999 | 155 (4.7%) | 159 (4.9%) |
| $50,000 to $54,999 | 144 (4.3%) | 179 (5.5%) |
| $55,000 to $64,999 | 191 (5.8%) | 199 (6.1%) |
| $65,000 to $74,999 | 151 (4.5%) | 130 (4.0%) |
| $75,000 to $99,999 | 291 (8.8%) | 236 (7.2%) |
| $100,000+ | 863 (26.0%) | 323 (9.9%) |
| Total | 3,319 (100.0%) | 3,276 (100.0%) |
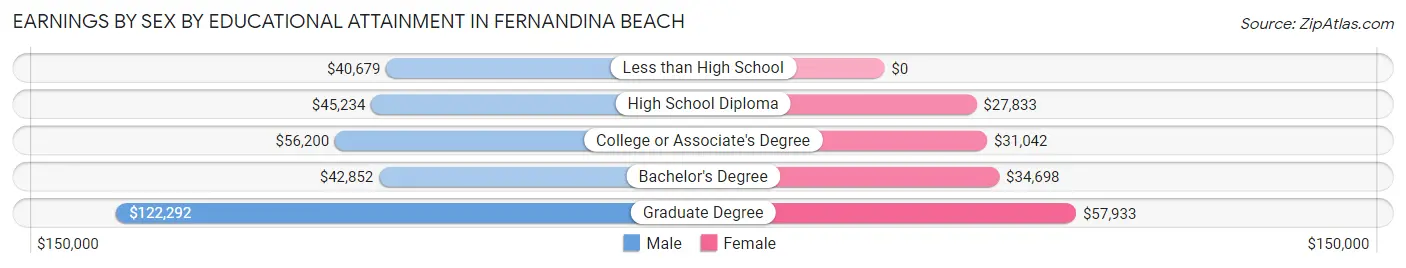
Earnings by Sex by Educational Attainment in Fernandina Beach
Average earnings in Fernandina Beach are $51,859 for men and $36,980 for women, a difference of 28.7%. Men with an educational attainment of graduate degree enjoy the highest average annual earnings of $122,292, while those with less than high school education earn the least with $40,679. Women with an educational attainment of graduate degree earn the most with the average annual earnings of $57,933, while those with high school diploma education have the smallest earnings of $27,833.
| Educational Attainment | Male Income | Female Income |
| Less than High School | $40,679 | $0 |
| High School Diploma | $45,234 | $27,833 |
| College or Associate's Degree | $56,200 | $31,042 |
| Bachelor's Degree | $42,852 | $34,698 |
| Graduate Degree | $122,292 | $57,933 |
| Total | $51,859 | $36,980 |
Family Income in Fernandina Beach
Family Income Brackets in Fernandina Beach
According to the Fernandina Beach family income data, there are 809 families falling into the $100,000 to $149,999 income range, which is the most common income bracket and makes up 21.8% of all families. Conversely, the $10,000 to $14,999 income bracket is the least frequent group with only 71 families (1.9%) belonging to this category.
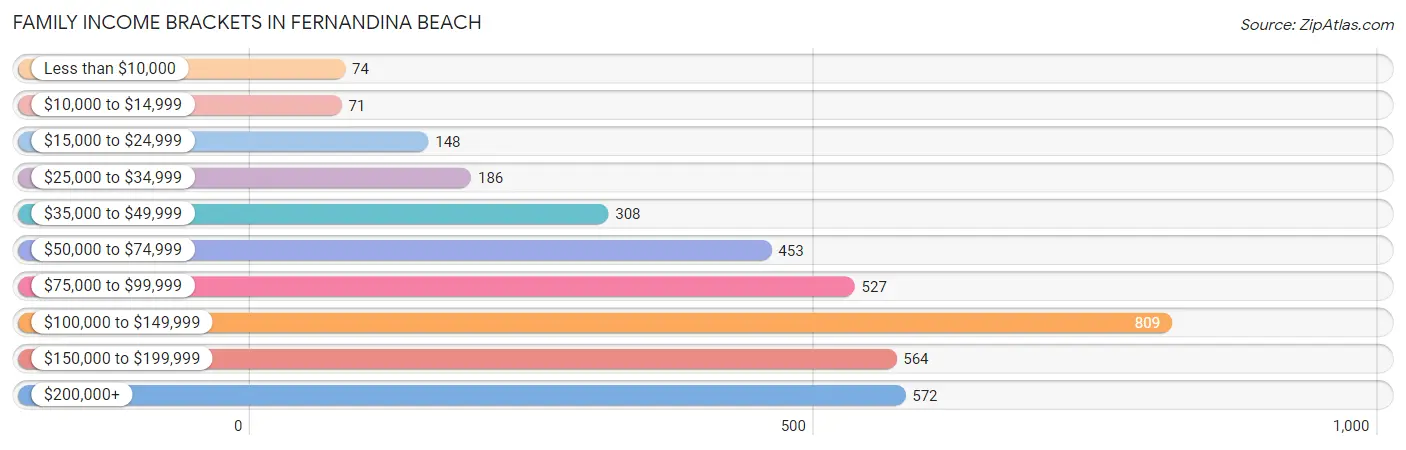
| Income Bracket | # Families | % Families |
| Less than $10,000 | 74 | 2.0% |
| $10,000 to $14,999 | 71 | 1.9% |
| $15,000 to $24,999 | 148 | 4.0% |
| $25,000 to $34,999 | 186 | 5.0% |
| $35,000 to $49,999 | 308 | 8.3% |
| $50,000 to $74,999 | 453 | 12.2% |
| $75,000 to $99,999 | 527 | 14.2% |
| $100,000 to $149,999 | 809 | 21.8% |
| $150,000 to $199,999 | 564 | 15.2% |
| $200,000+ | 572 | 15.4% |
Family Income by Famaliy Size in Fernandina Beach
4-person families (170 | 4.6%) account for the highest median family income in Fernandina Beach with $192,763 per family, while 2-person families (2,737 | 73.7%) have the highest median income of $48,722 per family member.
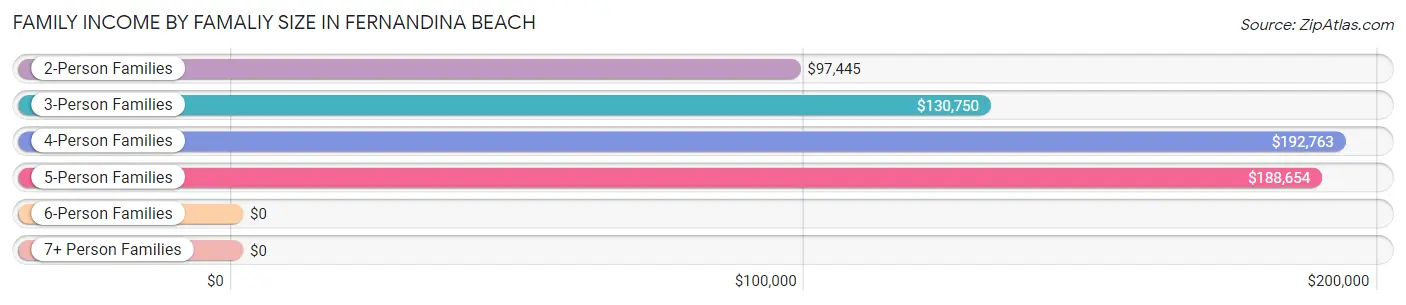
| Income Bracket | # Families | Median Income |
| 2-Person Families | 2,737 (73.7%) | $97,445 |
| 3-Person Families | 607 (16.4%) | $130,750 |
| 4-Person Families | 170 (4.6%) | $192,763 |
| 5-Person Families | 124 (3.3%) | $188,654 |
| 6-Person Families | 26 (0.7%) | $0 |
| 7+ Person Families | 48 (1.3%) | $0 |
| Total | 3,712 (100.0%) | $108,320 |
Family Income by Number of Earners in Fernandina Beach
The median family income in Fernandina Beach is $108,320, with families comprising 3+ earners (320) having the highest median family income of $154,951, while families with no earners (993) have the lowest median family income of $88,456, accounting for 8.6% and 26.8% of families, respectively.
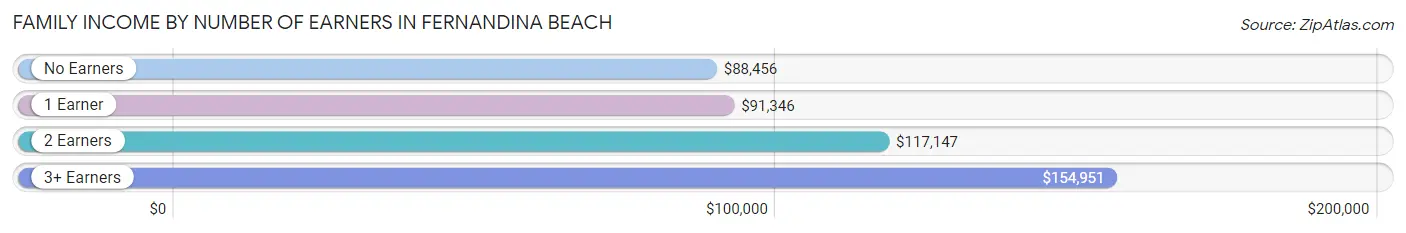
| Number of Earners | # Families | Median Income |
| No Earners | 993 (26.8%) | $88,456 |
| 1 Earner | 1,118 (30.1%) | $91,346 |
| 2 Earners | 1,281 (34.5%) | $117,147 |
| 3+ Earners | 320 (8.6%) | $154,951 |
| Total | 3,712 (100.0%) | $108,320 |
Household Income in Fernandina Beach
Household Income Brackets in Fernandina Beach
With 1,092 households falling in the category, the $100,000 to $149,999 income range is the most frequent in Fernandina Beach, accounting for 18.0% of all households. In contrast, only 218 households (3.6%) fall into the $10,000 to $14,999 income bracket, making it the least populous group.
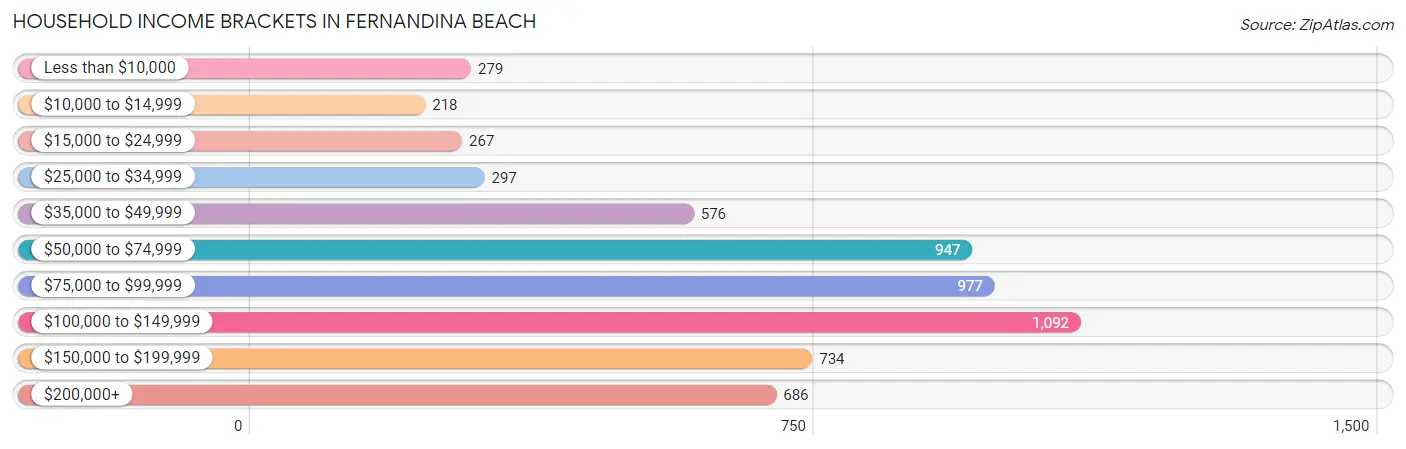
| Income Bracket | # Households | % Households |
| Less than $10,000 | 279 | 4.6% |
| $10,000 to $14,999 | 218 | 3.6% |
| $15,000 to $24,999 | 267 | 4.4% |
| $25,000 to $34,999 | 297 | 4.9% |
| $35,000 to $49,999 | 576 | 9.5% |
| $50,000 to $74,999 | 947 | 15.6% |
| $75,000 to $99,999 | 977 | 16.1% |
| $100,000 to $149,999 | 1,092 | 18.0% |
| $150,000 to $199,999 | 734 | 12.1% |
| $200,000+ | 686 | 11.3% |
Household Income by Householder Age in Fernandina Beach
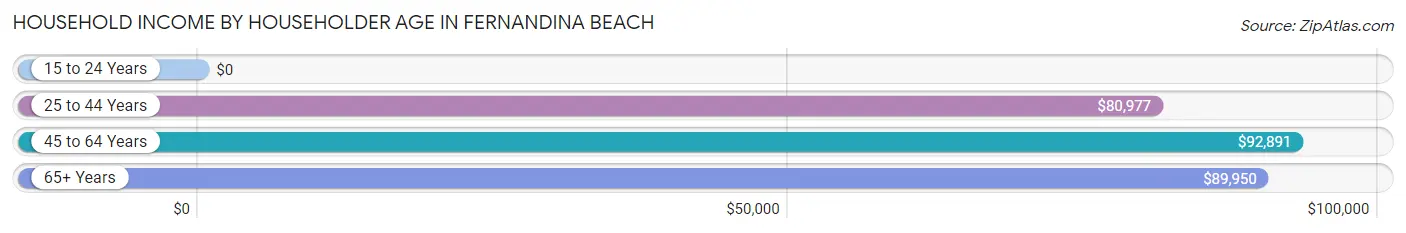
The median household income in Fernandina Beach is $86,494, with the highest median household income of $92,891 found in the 45 to 64 years age bracket for the primary householder. A total of 2,223 households (36.6%) fall into this category. Meanwhile, the 15 to 24 years age bracket for the primary householder has the lowest median household income of $0, with 59 households (1.0%) in this group.
| Income Bracket | # Households | Median Income |
| 15 to 24 Years | 59 (1.0%) | $0 |
| 25 to 44 Years | 887 (14.6%) | $80,977 |
| 45 to 64 Years | 2,223 (36.6%) | $92,891 |
| 65+ Years | 2,899 (47.8%) | $89,950 |
| Total | 6,068 (100.0%) | $86,494 |
Poverty in Fernandina Beach
Income Below Poverty by Sex and Age in Fernandina Beach
With 7.8% poverty level for males and 14.8% for females among the residents of Fernandina Beach, 6 to 11 year old males and 6 to 11 year old females are the most vulnerable to poverty, with 84 males (30.2%) and 113 females (74.8%) in their respective age groups living below the poverty level.
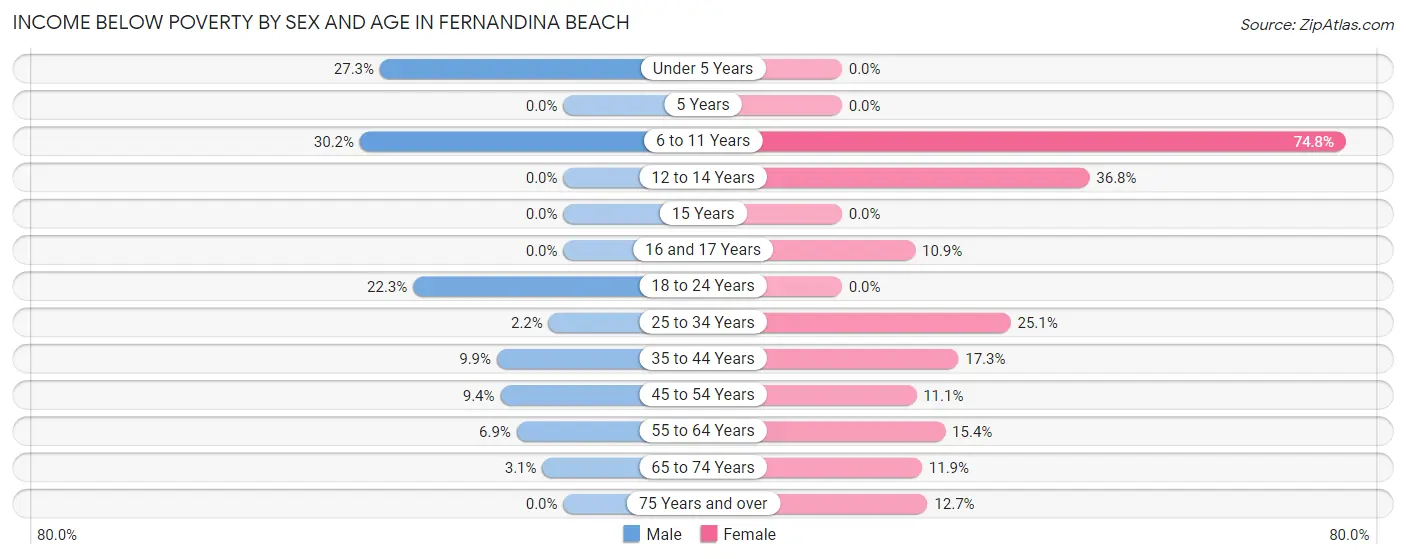
| Age Bracket | Male | Female |
| Under 5 Years | 91 (27.3%) | 0 (0.0%) |
| 5 Years | 0 (0.0%) | 0 (0.0%) |
| 6 to 11 Years | 84 (30.2%) | 113 (74.8%) |
| 12 to 14 Years | 0 (0.0%) | 50 (36.8%) |
| 15 Years | 0 (0.0%) | 0 (0.0%) |
| 16 and 17 Years | 0 (0.0%) | 11 (10.9%) |
| 18 to 24 Years | 54 (22.3%) | 0 (0.0%) |
| 25 to 34 Years | 14 (2.2%) | 104 (25.1%) |
| 35 to 44 Years | 61 (9.9%) | 87 (17.3%) |
| 45 to 54 Years | 76 (9.3%) | 84 (11.1%) |
| 55 to 64 Years | 62 (6.9%) | 219 (15.3%) |
| 65 to 74 Years | 43 (3.1%) | 164 (11.9%) |
| 75 Years and over | 0 (0.0%) | 144 (12.7%) |
| Total | 485 (7.8%) | 976 (14.8%) |
Income Above Poverty by Sex and Age in Fernandina Beach
According to the poverty statistics in Fernandina Beach, males aged 12 to 14 years and females aged under 5 years are the age groups that are most secure financially, with 100.0% of males and 100.0% of females in these age groups living above the poverty line.
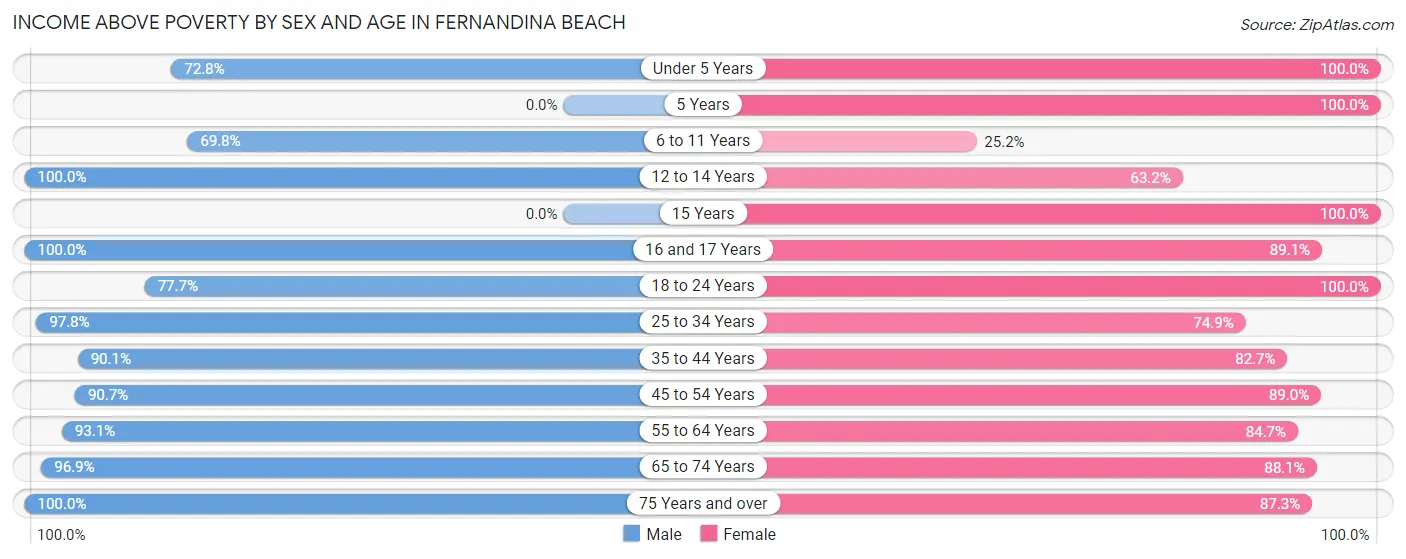
| Age Bracket | Male | Female |
| Under 5 Years | 243 (72.8%) | 144 (100.0%) |
| 5 Years | 0 (0.0%) | 48 (100.0%) |
| 6 to 11 Years | 194 (69.8%) | 38 (25.2%) |
| 12 to 14 Years | 222 (100.0%) | 86 (63.2%) |
| 15 Years | 0 (0.0%) | 19 (100.0%) |
| 16 and 17 Years | 95 (100.0%) | 90 (89.1%) |
| 18 to 24 Years | 188 (77.7%) | 367 (100.0%) |
| 25 to 34 Years | 625 (97.8%) | 311 (74.9%) |
| 35 to 44 Years | 557 (90.1%) | 416 (82.7%) |
| 45 to 54 Years | 737 (90.6%) | 676 (88.9%) |
| 55 to 64 Years | 833 (93.1%) | 1,208 (84.7%) |
| 65 to 74 Years | 1,334 (96.9%) | 1,215 (88.1%) |
| 75 Years and over | 698 (100.0%) | 989 (87.3%) |
| Total | 5,726 (92.2%) | 5,607 (85.2%) |
Income Below Poverty Among Married-Couple Families in Fernandina Beach
The poverty statistics for married-couple families in Fernandina Beach show that 2.9% or 84 of the total 2,875 families live below the poverty line. Families with 1 or 2 children have the highest poverty rate of 8.0%, comprising of 35 families. On the other hand, families with 3 or 4 children have the lowest poverty rate of 0.0%, which includes 0 families.
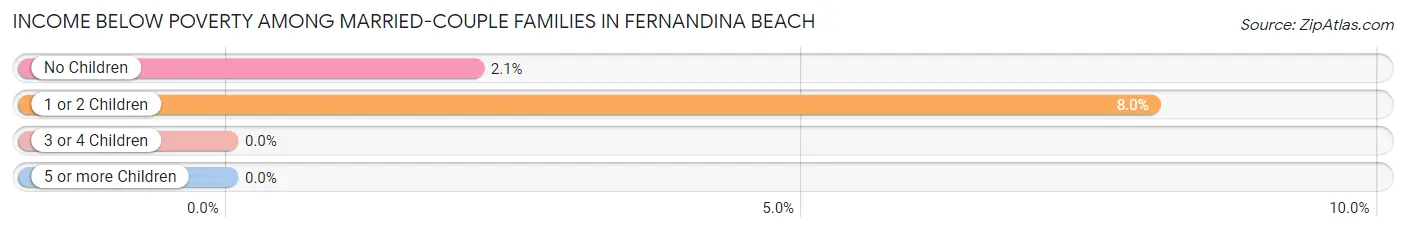
| Children | Above Poverty | Below Poverty |
| No Children | 2,242 (97.9%) | 49 (2.1%) |
| 1 or 2 Children | 401 (92.0%) | 35 (8.0%) |
| 3 or 4 Children | 148 (100.0%) | 0 (0.0%) |
| 5 or more Children | 0 (0.0%) | 0 (0.0%) |
| Total | 2,791 (97.1%) | 84 (2.9%) |
Income Below Poverty Among Single-Parent Households in Fernandina Beach
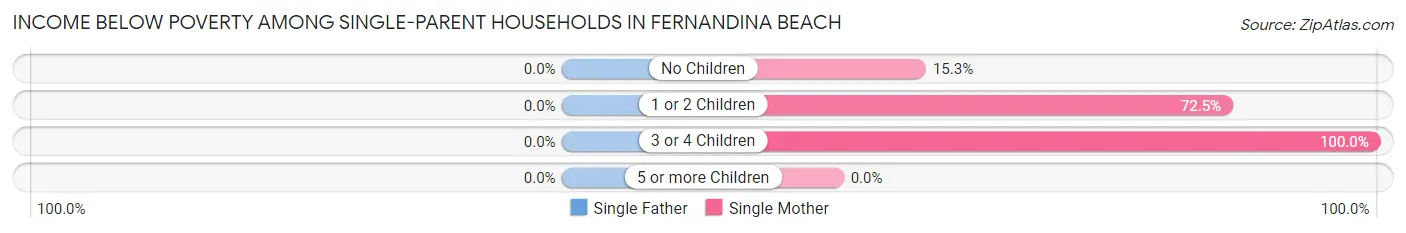
| Children | Single Father | Single Mother |
| No Children | 0 (0.0%) | 63 (15.3%) |
| 1 or 2 Children | 0 (0.0%) | 87 (72.5%) |
| 3 or 4 Children | 0 (0.0%) | 14 (100.0%) |
| 5 or more Children | 0 (0.0%) | 0 (0.0%) |
| Total | 0 (0.0%) | 164 (30.1%) |
Income Below Poverty Among Married-Couple vs Single-Parent Households in Fernandina Beach
The poverty data for Fernandina Beach shows that 84 of the married-couple family households (2.9%) and 164 of the single-parent households (19.6%) are living below the poverty level. Within the married-couple family households, those with 1 or 2 children have the highest poverty rate, with 35 households (8.0%) falling below the poverty line. Among the single-parent households, those with 1 or 2 children have the highest poverty rate, with 87 household (49.4%) living below poverty.
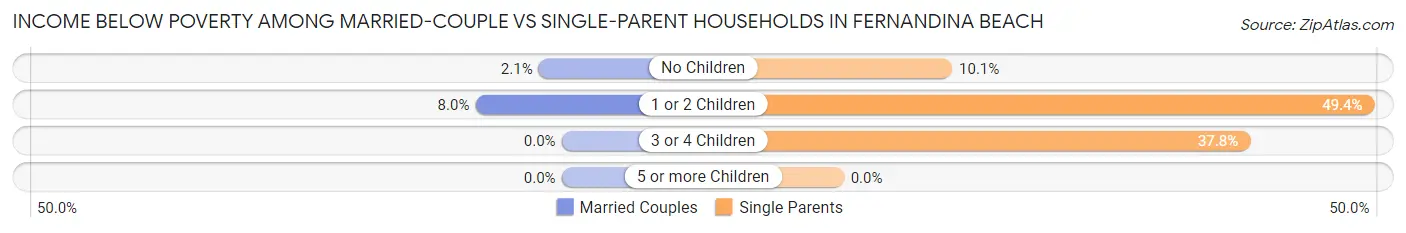
| Children | Married-Couple Families | Single-Parent Households |
| No Children | 49 (2.1%) | 63 (10.1%) |
| 1 or 2 Children | 35 (8.0%) | 87 (49.4%) |
| 3 or 4 Children | 0 (0.0%) | 14 (37.8%) |
| 5 or more Children | 0 (0.0%) | 0 (0.0%) |
| Total | 84 (2.9%) | 164 (19.6%) |
Race in Fernandina Beach
The most populous races in Fernandina Beach are White / Caucasian (10,873 | 83.5%), Hispanic or Latino (1,602 | 12.3%), and Black / African American (1,293 | 9.9%).
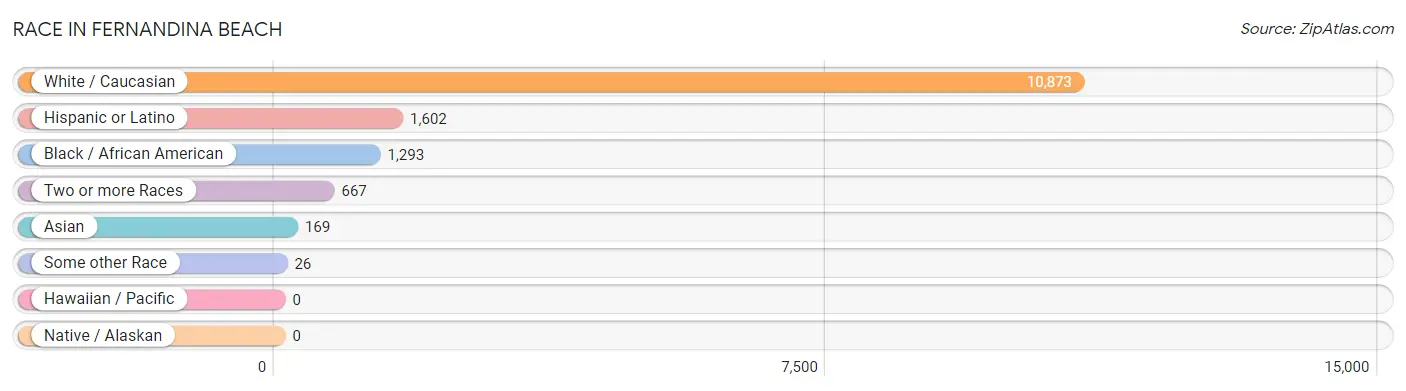
| Race | # Population | % Population |
| Asian | 169 | 1.3% |
| Black / African American | 1,293 | 9.9% |
| Hawaiian / Pacific | 0 | 0.0% |
| Hispanic or Latino | 1,602 | 12.3% |
| Native / Alaskan | 0 | 0.0% |
| White / Caucasian | 10,873 | 83.5% |
| Two or more Races | 667 | 5.1% |
| Some other Race | 26 | 0.2% |
| Total | 13,028 | 100.0% |
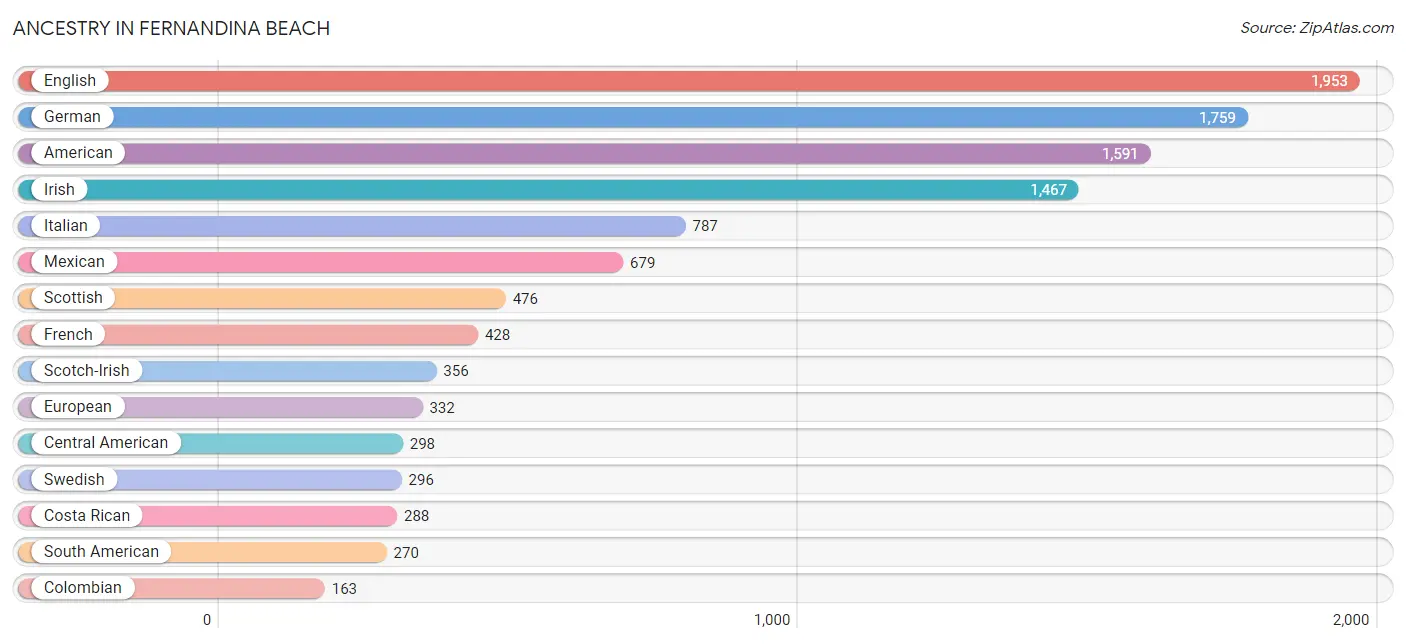
Ancestry in Fernandina Beach
The most populous ancestries reported in Fernandina Beach are English (1,953 | 15.0%), German (1,759 | 13.5%), American (1,591 | 12.2%), Irish (1,467 | 11.3%), and Italian (787 | 6.0%), together accounting for 58.0% of all Fernandina Beach residents.
| Ancestry | # Population | % Population |
| American | 1,591 | 12.2% |
| Arab | 7 | 0.1% |
| Argentinean | 72 | 0.5% |
| Austrian | 8 | 0.1% |
| Belgian | 15 | 0.1% |
| British | 144 | 1.1% |
| Burmese | 42 | 0.3% |
| Canadian | 27 | 0.2% |
| Cape Verdean | 11 | 0.1% |
| Central American | 298 | 2.3% |
| Cherokee | 36 | 0.3% |
| Colombian | 163 | 1.3% |
| Costa Rican | 288 | 2.2% |
| Creek | 10 | 0.1% |
| Croatian | 96 | 0.7% |
| Cuban | 143 | 1.1% |
| Czech | 43 | 0.3% |
| Danish | 18 | 0.1% |
| Dominican | 50 | 0.4% |
| Dutch | 54 | 0.4% |
| Eastern European | 17 | 0.1% |
| English | 1,953 | 15.0% |
| European | 332 | 2.5% |
| Finnish | 42 | 0.3% |
| French | 428 | 3.3% |
| French Canadian | 62 | 0.5% |
| German | 1,759 | 13.5% |
| Greek | 40 | 0.3% |
| Haitian | 16 | 0.1% |
| Hungarian | 115 | 0.9% |
| Icelander | 9 | 0.1% |
| Indian (Asian) | 89 | 0.7% |
| Irish | 1,467 | 11.3% |
| Italian | 787 | 6.0% |
| Korean | 112 | 0.9% |
| Lebanese | 7 | 0.1% |
| Lithuanian | 58 | 0.4% |
| Mexican | 679 | 5.2% |
| Norwegian | 103 | 0.8% |
| Polish | 163 | 1.3% |
| Puerto Rican | 79 | 0.6% |
| Russian | 43 | 0.3% |
| Salvadoran | 10 | 0.1% |
| Scandinavian | 10 | 0.1% |
| Scotch-Irish | 356 | 2.7% |
| Scottish | 476 | 3.6% |
| Seminole | 9 | 0.1% |
| Slovak | 26 | 0.2% |
| South American | 270 | 2.1% |
| Spanish | 62 | 0.5% |
| Subsaharan African | 11 | 0.1% |
| Swedish | 296 | 2.3% |
| Swiss | 41 | 0.3% |
| Ukrainian | 38 | 0.3% |
| Uruguayan | 35 | 0.3% |
| Welsh | 101 | 0.8% | View All 56 Rows |
Immigrants in Fernandina Beach
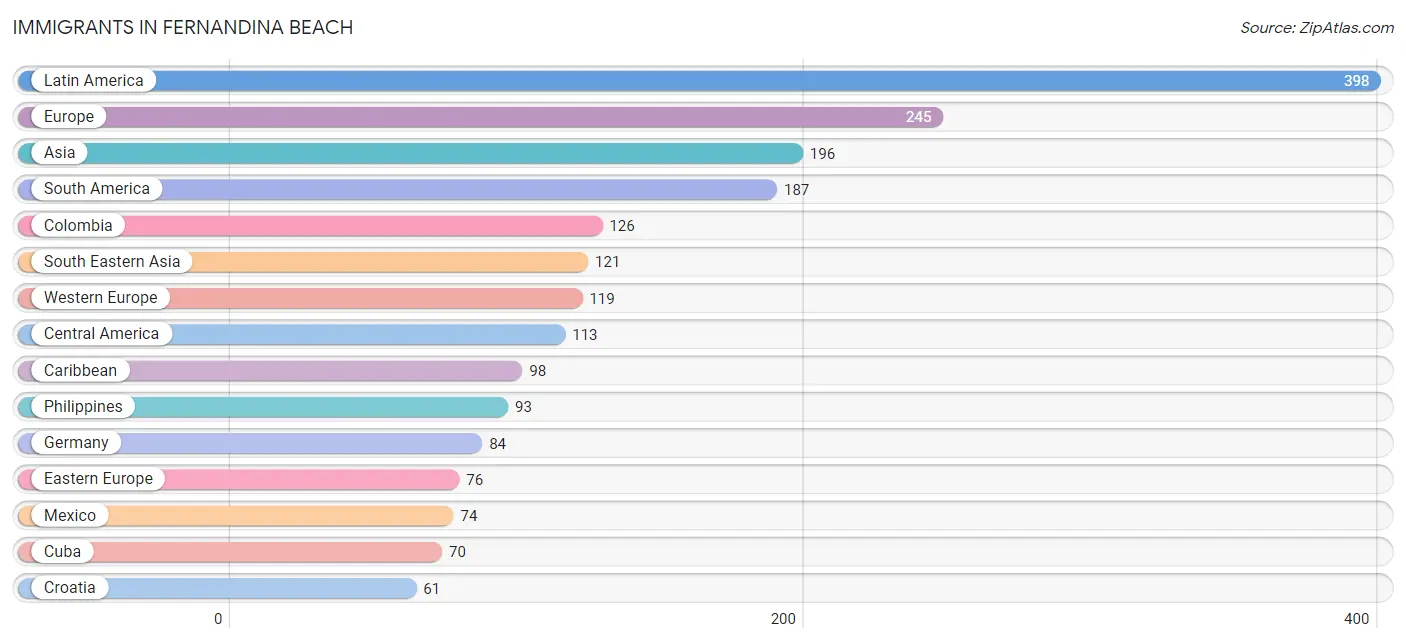
The most numerous immigrant groups reported in Fernandina Beach came from Latin America (398 | 3.0%), Europe (245 | 1.9%), Asia (196 | 1.5%), South America (187 | 1.4%), and Colombia (126 | 1.0%), together accounting for 8.8% of all Fernandina Beach residents.
| Immigration Origin | # Population | % Population |
| Africa | 13 | 0.1% |
| Argentina | 26 | 0.2% |
| Asia | 196 | 1.5% |
| Bangladesh | 24 | 0.2% |
| Canada | 48 | 0.4% |
| Caribbean | 98 | 0.7% |
| Central America | 113 | 0.9% |
| Colombia | 126 | 1.0% |
| Costa Rica | 29 | 0.2% |
| Croatia | 61 | 0.5% |
| Cuba | 70 | 0.5% |
| Denmark | 10 | 0.1% |
| Dominican Republic | 23 | 0.2% |
| Eastern Asia | 22 | 0.2% |
| Eastern Europe | 76 | 0.6% |
| El Salvador | 10 | 0.1% |
| England | 15 | 0.1% |
| Europe | 245 | 1.9% |
| France | 35 | 0.3% |
| Germany | 84 | 0.6% |
| Haiti | 5 | 0.0% |
| Ireland | 12 | 0.1% |
| Korea | 22 | 0.2% |
| Latin America | 398 | 3.0% |
| Mexico | 74 | 0.6% |
| Northern Europe | 50 | 0.4% |
| Pakistan | 29 | 0.2% |
| Philippines | 93 | 0.7% |
| Russia | 15 | 0.1% |
| Singapore | 28 | 0.2% |
| South Africa | 13 | 0.1% |
| South America | 187 | 1.4% |
| South Central Asia | 53 | 0.4% |
| South Eastern Asia | 121 | 0.9% |
| Uruguay | 35 | 0.3% |
| Western Europe | 119 | 0.9% | View All 36 Rows |
Sex and Age in Fernandina Beach
Sex and Age in Fernandina Beach
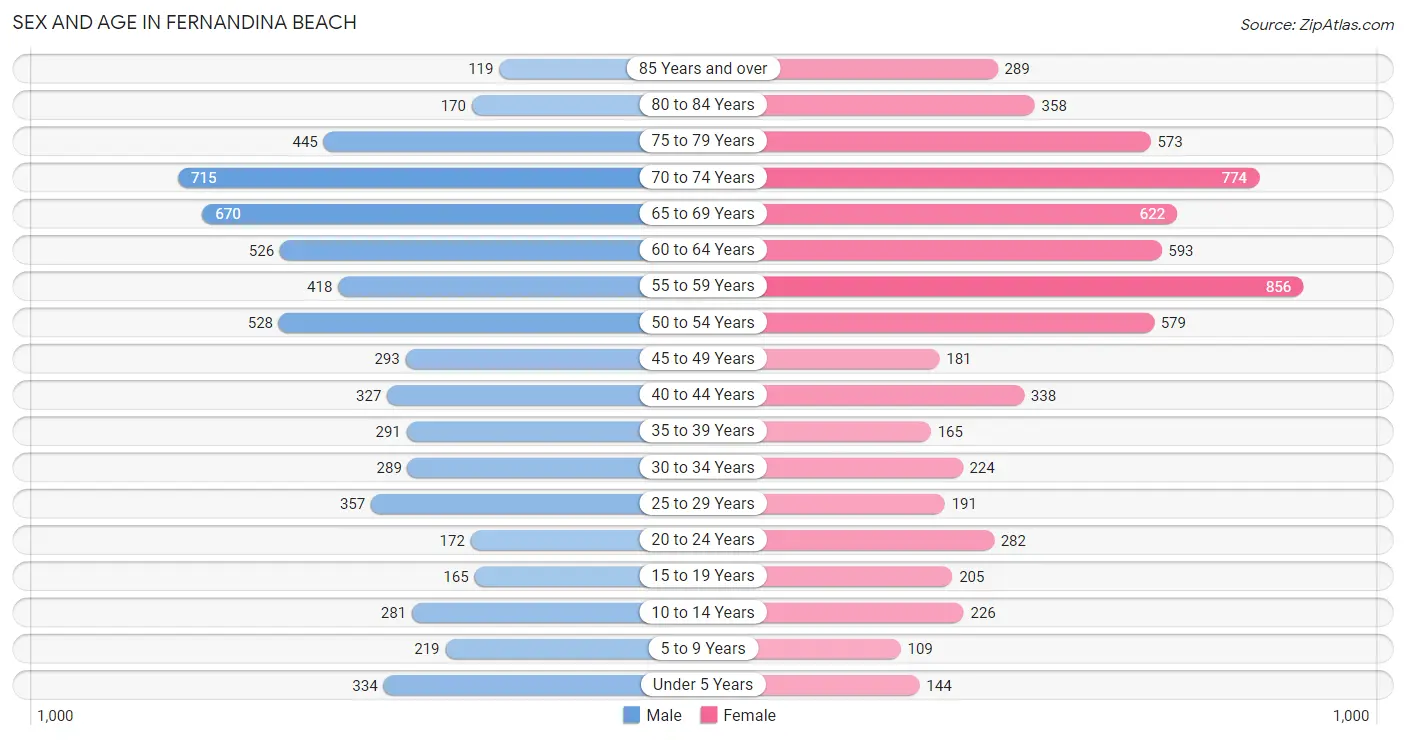
The most populous age groups in Fernandina Beach are 70 to 74 Years (715 | 11.3%) for men and 55 to 59 Years (856 | 12.8%) for women.
| Age Bracket | Male | Female |
| Under 5 Years | 334 (5.3%) | 144 (2.1%) |
| 5 to 9 Years | 219 (3.5%) | 109 (1.6%) |
| 10 to 14 Years | 281 (4.4%) | 226 (3.4%) |
| 15 to 19 Years | 165 (2.6%) | 205 (3.1%) |
| 20 to 24 Years | 172 (2.7%) | 282 (4.2%) |
| 25 to 29 Years | 357 (5.7%) | 191 (2.9%) |
| 30 to 34 Years | 289 (4.6%) | 224 (3.3%) |
| 35 to 39 Years | 291 (4.6%) | 165 (2.5%) |
| 40 to 44 Years | 327 (5.2%) | 338 (5.0%) |
| 45 to 49 Years | 293 (4.6%) | 181 (2.7%) |
| 50 to 54 Years | 528 (8.4%) | 579 (8.6%) |
| 55 to 59 Years | 418 (6.6%) | 856 (12.8%) |
| 60 to 64 Years | 526 (8.3%) | 593 (8.8%) |
| 65 to 69 Years | 670 (10.6%) | 622 (9.3%) |
| 70 to 74 Years | 715 (11.3%) | 774 (11.5%) |
| 75 to 79 Years | 445 (7.0%) | 573 (8.5%) |
| 80 to 84 Years | 170 (2.7%) | 358 (5.3%) |
| 85 Years and over | 119 (1.9%) | 289 (4.3%) |
| Total | 6,319 (100.0%) | 6,709 (100.0%) |
Families and Households in Fernandina Beach
Median Family Size in Fernandina Beach
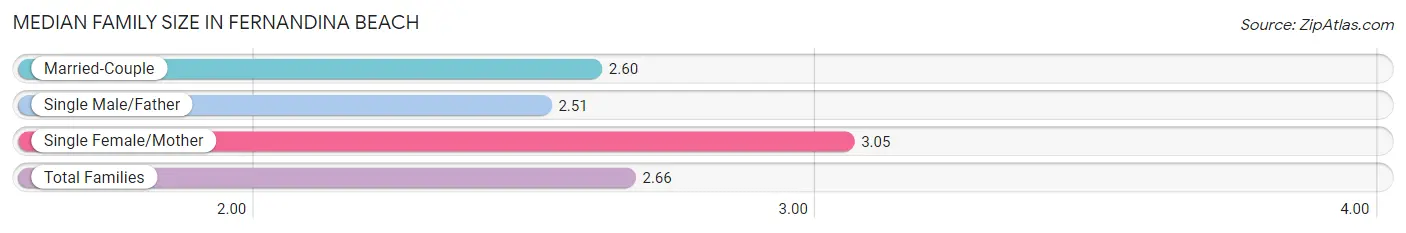
The median family size in Fernandina Beach is 2.66 persons per family, with single female/mother families (545 | 14.7%) accounting for the largest median family size of 3.05 persons per family. On the other hand, single male/father families (292 | 7.9%) represent the smallest median family size with 2.51 persons per family.
| Family Type | # Families | Family Size |
| Married-Couple | 2,875 (77.4%) | 2.60 |
| Single Male/Father | 292 (7.9%) | 2.51 |
| Single Female/Mother | 545 (14.7%) | 3.05 |
| Total Families | 3,712 (100.0%) | 2.66 |
Median Household Size in Fernandina Beach
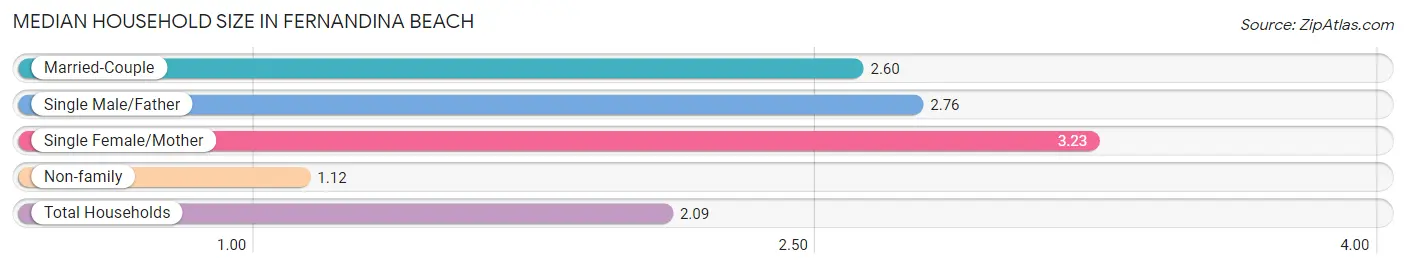
The median household size in Fernandina Beach is 2.09 persons per household, with single female/mother households (545 | 9.0%) accounting for the largest median household size of 3.23 persons per household. non-family households (2,356 | 38.8%) represent the smallest median household size with 1.12 persons per household.
| Household Type | # Households | Household Size |
| Married-Couple | 2,875 (47.4%) | 2.60 |
| Single Male/Father | 292 (4.8%) | 2.76 |
| Single Female/Mother | 545 (9.0%) | 3.23 |
| Non-family | 2,356 (38.8%) | 1.12 |
| Total Households | 6,068 (100.0%) | 2.09 |
Household Size by Marriage Status in Fernandina Beach
Out of a total of 6,068 households in Fernandina Beach, 3,712 (61.2%) are family households, while 2,356 (38.8%) are nonfamily households. The most numerous type of family households are 2-person households, comprising 2,642, and the most common type of nonfamily households are 1-person households, comprising 2,056.
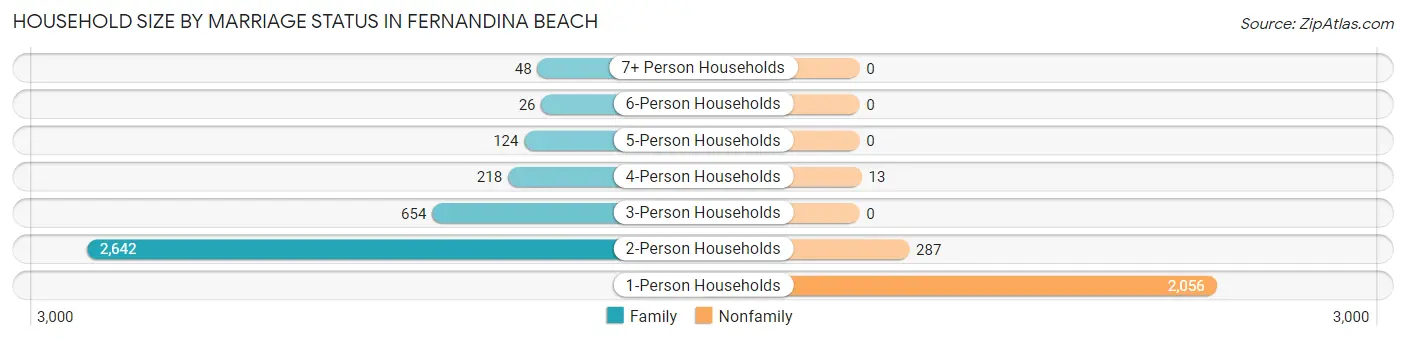
| Household Size | Family Households | Nonfamily Households |
| 1-Person Households | - | 2,056 (33.9%) |
| 2-Person Households | 2,642 (43.5%) | 287 (4.7%) |
| 3-Person Households | 654 (10.8%) | 0 (0.0%) |
| 4-Person Households | 218 (3.6%) | 13 (0.2%) |
| 5-Person Households | 124 (2.0%) | 0 (0.0%) |
| 6-Person Households | 26 (0.4%) | 0 (0.0%) |
| 7+ Person Households | 48 (0.8%) | 0 (0.0%) |
| Total | 3,712 (61.2%) | 2,356 (38.8%) |
Female Fertility in Fernandina Beach
Fertility by Age in Fernandina Beach
Average fertility rate in Fernandina Beach is 76.0 births per 1,000 women. Women in the age bracket of 20 to 34 years have the highest fertility rate with 98.0 births per 1,000 women. Women in the age bracket of 20 to 34 years acount for 53.1% of all women with births.
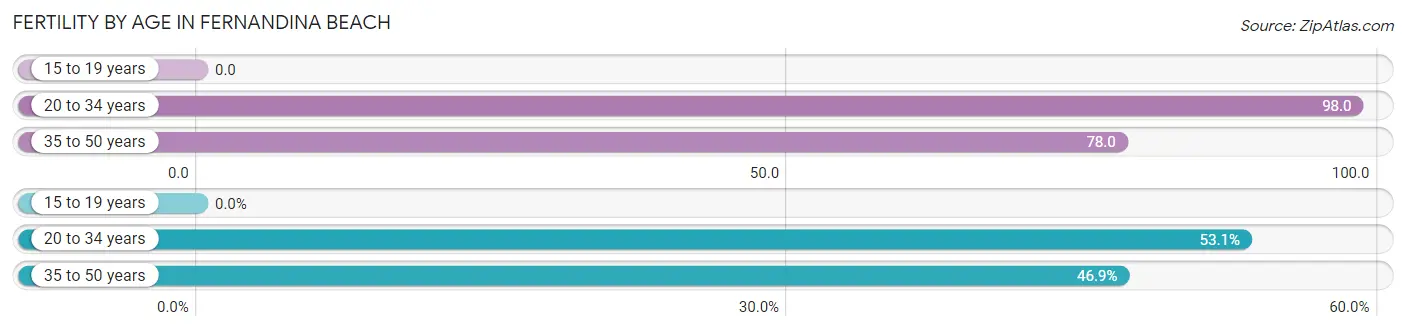
| Age Bracket | Women with Births | Births / 1,000 Women |
| 15 to 19 years | 0 (0.0%) | 0.0 |
| 20 to 34 years | 68 (53.1%) | 98.0 |
| 35 to 50 years | 60 (46.9%) | 78.0 |
| Total | 128 (100.0%) | 76.0 |
Fertility by Age by Marriage Status in Fernandina Beach
35.9% of women with births (128) in Fernandina Beach are married. The highest percentage of unmarried women with births falls into 35 to 50 years age bracket with 73.3% of them unmarried at the time of birth, while the lowest percentage of unmarried women with births belong to 20 to 34 years age bracket with 55.9% of them unmarried.
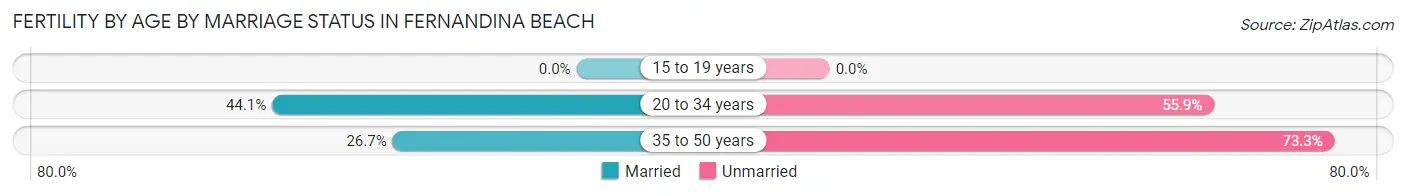
| Age Bracket | Married | Unmarried |
| 15 to 19 years | 0 (0.0%) | 0 (0.0%) |
| 20 to 34 years | 30 (44.1%) | 38 (55.9%) |
| 35 to 50 years | 16 (26.7%) | 44 (73.3%) |
| Total | 46 (35.9%) | 82 (64.1%) |
Fertility by Education in Fernandina Beach
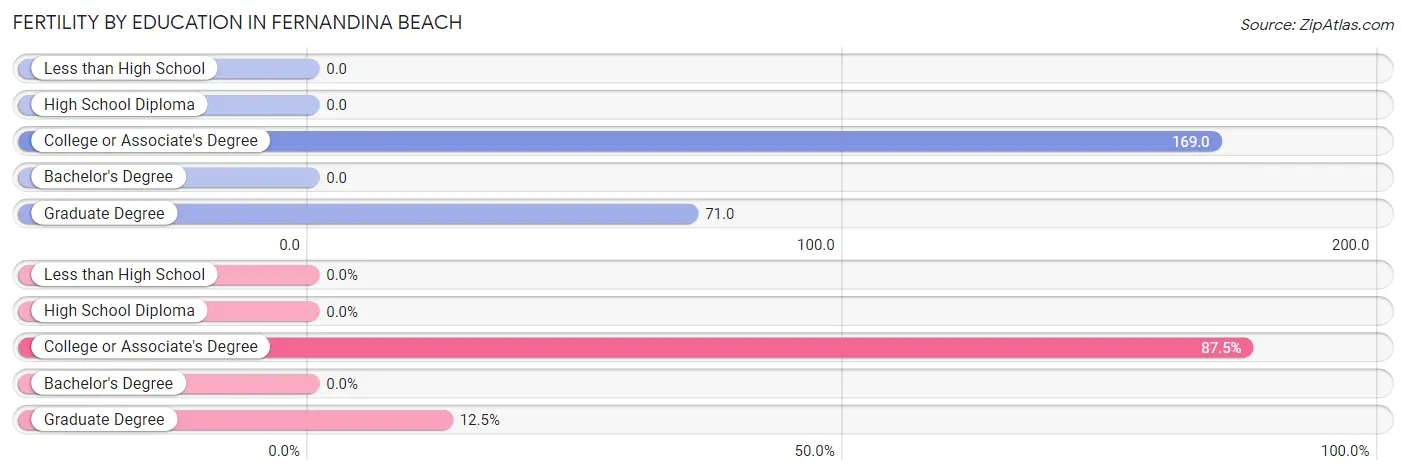
| Educational Attainment | Women with Births | Births / 1,000 Women |
| Less than High School | 0 (0.0%) | 0.0 |
| High School Diploma | 0 (0.0%) | 0.0 |
| College or Associate's Degree | 112 (87.5%) | 169.0 |
| Bachelor's Degree | 0 (0.0%) | 0.0 |
| Graduate Degree | 16 (12.5%) | 71.0 |
| Total | 128 (100.0%) | 76.0 |
Fertility by Education by Marriage Status in Fernandina Beach
64.1% of women with births in Fernandina Beach are unmarried. Women with the educational attainment of graduate degree are most likely to be married with 100.0% of them married at childbirth, while women with the educational attainment of college or associate's degree are least likely to be married with 73.2% of them unmarried at childbirth.
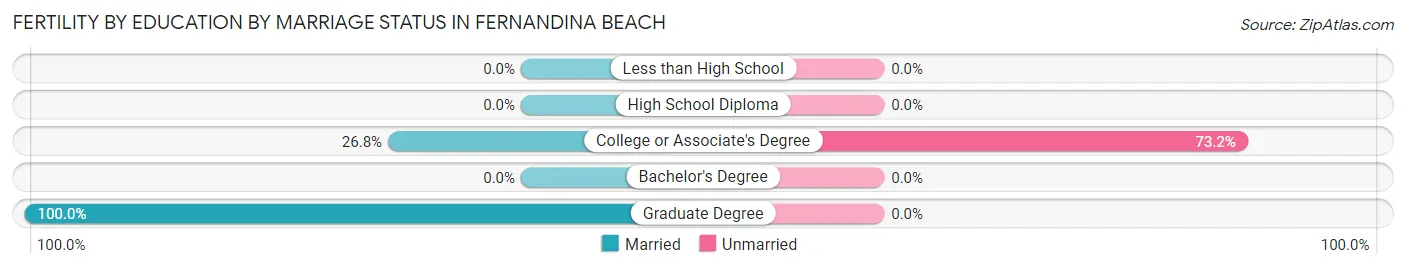
| Educational Attainment | Married | Unmarried |
| Less than High School | 0 (0.0%) | 0 (0.0%) |
| High School Diploma | 0 (0.0%) | 0 (0.0%) |
| College or Associate's Degree | 30 (26.8%) | 82 (73.2%) |
| Bachelor's Degree | 0 (0.0%) | 0 (0.0%) |
| Graduate Degree | 16 (100.0%) | 0 (0.0%) |
| Total | 46 (35.9%) | 82 (64.1%) |
Employment Characteristics in Fernandina Beach
Employment by Class of Employer in Fernandina Beach
Among the 5,972 employed individuals in Fernandina Beach, private company employees (3,349 | 56.1%), self-employed (not incorporated) (628 | 10.5%), and not-for-profit organizations (580 | 9.7%) make up the most common classes of employment.
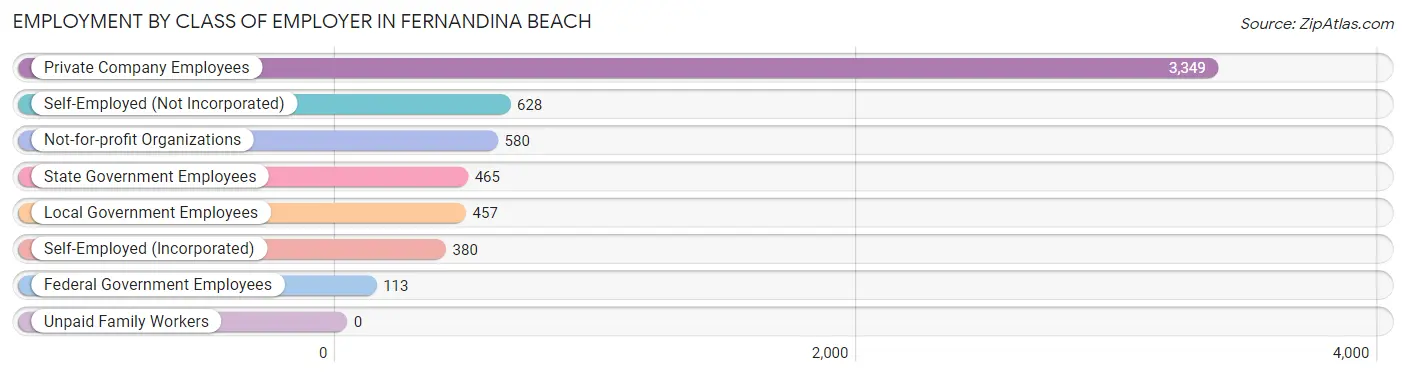
| Employer Class | # Employees | % Employees |
| Private Company Employees | 3,349 | 56.1% |
| Self-Employed (Incorporated) | 380 | 6.4% |
| Self-Employed (Not Incorporated) | 628 | 10.5% |
| Not-for-profit Organizations | 580 | 9.7% |
| Local Government Employees | 457 | 7.6% |
| State Government Employees | 465 | 7.8% |
| Federal Government Employees | 113 | 1.9% |
| Unpaid Family Workers | 0 | 0.0% |
| Total | 5,972 | 100.0% |
Employment Status by Age in Fernandina Beach
According to the labor force statistics for Fernandina Beach, out of the total population over 16 years of age (11,696), 52.7% or 6,164 individuals are in the labor force, with 2.9% or 179 of them unemployed. The age group with the highest labor force participation rate is 25 to 29 years, with 88.9% or 487 individuals in the labor force. Within the labor force, the 30 to 34 years age range has the highest percentage of unemployed individuals, with 8.8% or 40 of them being unemployed.
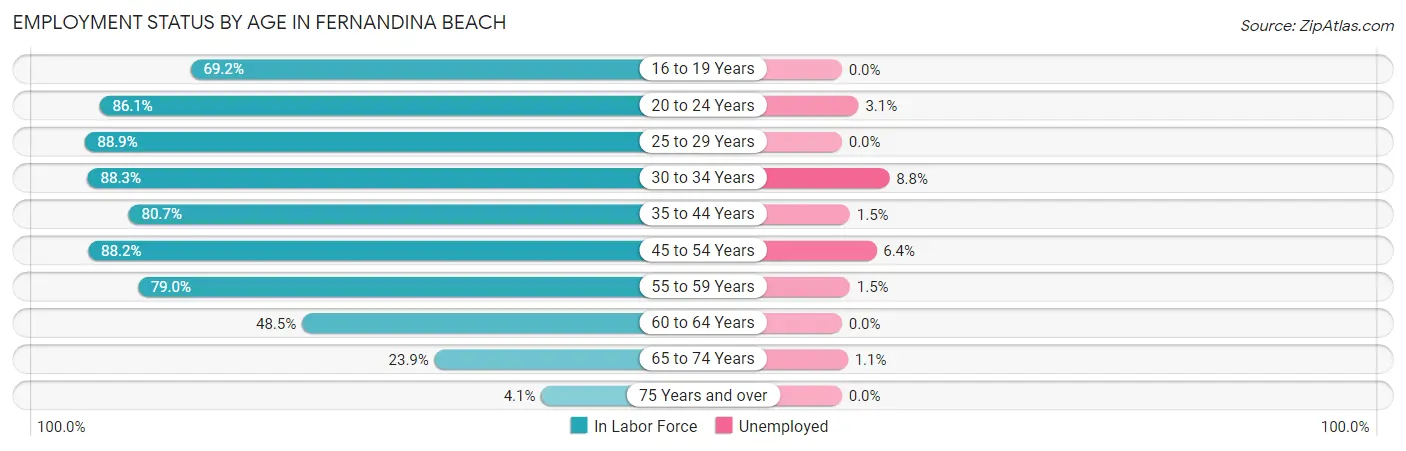
| Age Bracket | In Labor Force | Unemployed |
| 16 to 19 Years | 243 (69.2%) | 0 (0.0%) |
| 20 to 24 Years | 391 (86.1%) | 12 (3.1%) |
| 25 to 29 Years | 487 (88.9%) | 0 (0.0%) |
| 30 to 34 Years | 453 (88.3%) | 40 (8.8%) |
| 35 to 44 Years | 905 (80.7%) | 14 (1.5%) |
| 45 to 54 Years | 1,394 (88.2%) | 89 (6.4%) |
| 55 to 59 Years | 1,006 (79.0%) | 15 (1.5%) |
| 60 to 64 Years | 543 (48.5%) | 0 (0.0%) |
| 65 to 74 Years | 665 (23.9%) | 7 (1.1%) |
| 75 Years and over | 80 (4.1%) | 0 (0.0%) |
| Total | 6,164 (52.7%) | 179 (2.9%) |
Employment Status by Educational Attainment in Fernandina Beach
According to labor force statistics for Fernandina Beach, 77.8% of individuals (4,789) out of the total population between 25 and 64 years of age (6,156) are in the labor force, with 3.3% or 158 of them being unemployed. The group with the highest labor force participation rate are those with the educational attainment of bachelor's degree or higher, with 83.1% or 2,310 individuals in the labor force. Within the labor force, individuals with college / associate degree education have the highest percentage of unemployment, with 8.3% or 132 of them being unemployed.
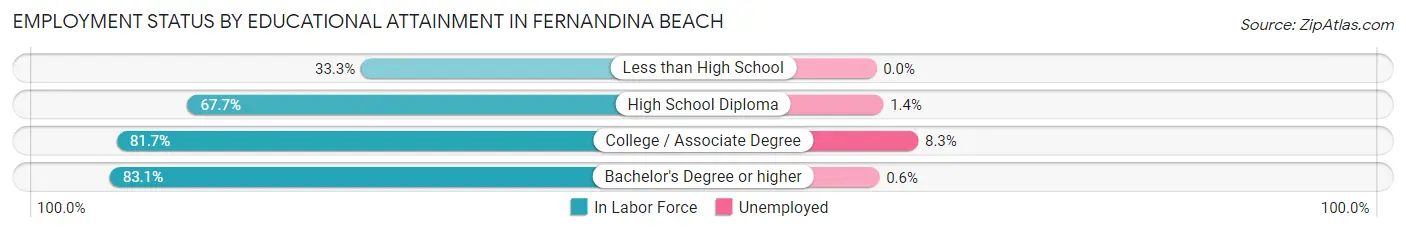
| Educational Attainment | In Labor Force | Unemployed |
| Less than High School | 77 (33.3%) | 0 (0.0%) |
| High School Diploma | 810 (67.7%) | 17 (1.4%) |
| College / Associate Degree | 1,592 (81.7%) | 162 (8.3%) |
| Bachelor's Degree or higher | 2,310 (83.1%) | 17 (0.6%) |
| Total | 4,789 (77.8%) | 203 (3.3%) |
Employment Occupations by Sex in Fernandina Beach
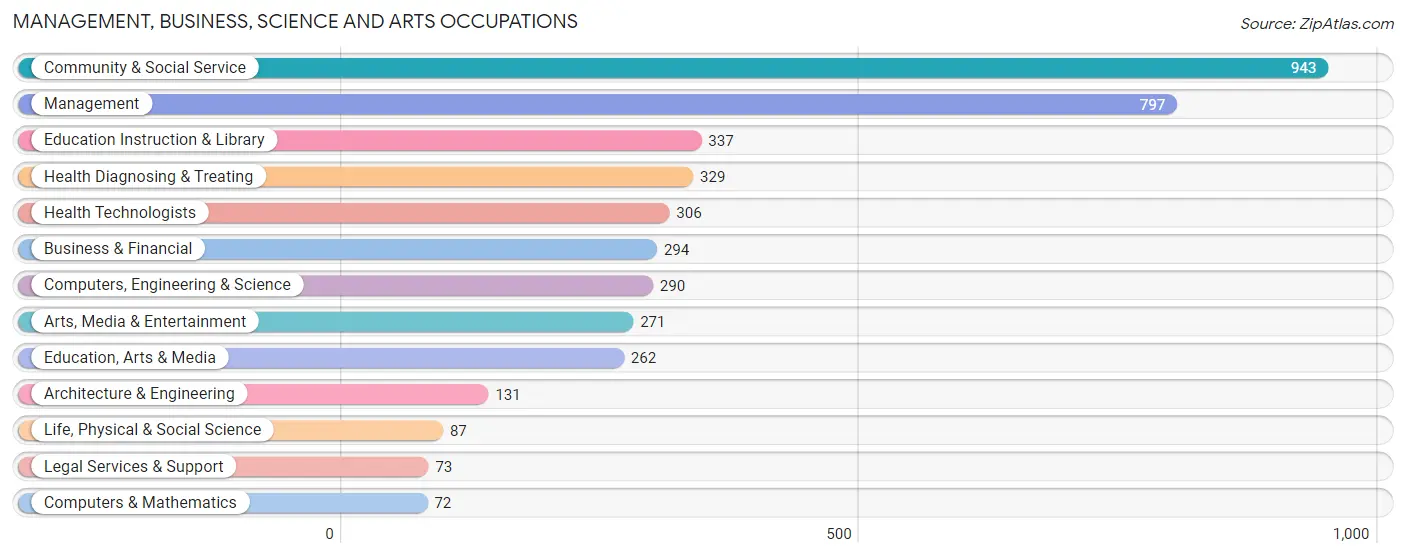
Management, Business, Science and Arts Occupations
The most common Management, Business, Science and Arts occupations in Fernandina Beach are Community & Social Service (943 | 15.8%), Management (797 | 13.4%), Education Instruction & Library (337 | 5.7%), Health Diagnosing & Treating (329 | 5.5%), and Health Technologists (306 | 5.1%).
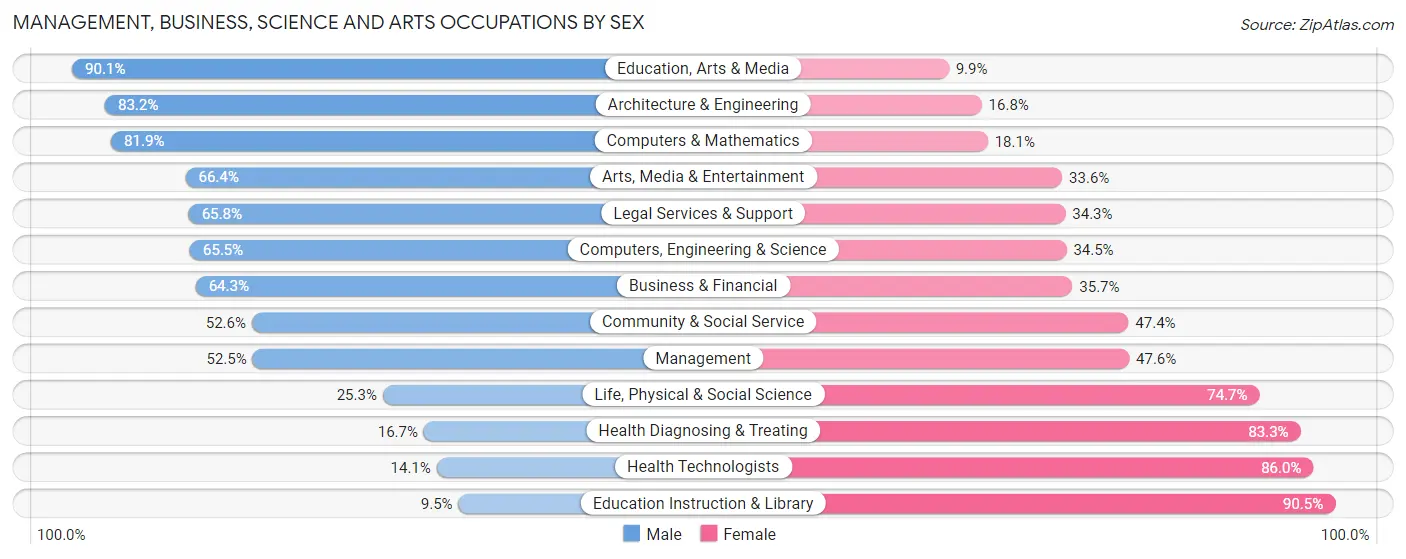
Management, Business, Science and Arts Occupations by Sex
Within the Management, Business, Science and Arts occupations in Fernandina Beach, the most male-oriented occupations are Education, Arts & Media (90.1%), Architecture & Engineering (83.2%), and Computers & Mathematics (81.9%), while the most female-oriented occupations are Education Instruction & Library (90.5%), Health Technologists (86.0%), and Health Diagnosing & Treating (83.3%).
| Occupation | Male | Female |
| Management | 418 (52.4%) | 379 (47.5%) |
| Business & Financial | 189 (64.3%) | 105 (35.7%) |
| Computers, Engineering & Science | 190 (65.5%) | 100 (34.5%) |
| Computers & Mathematics | 59 (81.9%) | 13 (18.1%) |
| Architecture & Engineering | 109 (83.2%) | 22 (16.8%) |
| Life, Physical & Social Science | 22 (25.3%) | 65 (74.7%) |
| Community & Social Service | 496 (52.6%) | 447 (47.4%) |
| Education, Arts & Media | 236 (90.1%) | 26 (9.9%) |
| Legal Services & Support | 48 (65.7%) | 25 (34.3%) |
| Education Instruction & Library | 32 (9.5%) | 305 (90.5%) |
| Arts, Media & Entertainment | 180 (66.4%) | 91 (33.6%) |
| Health Diagnosing & Treating | 55 (16.7%) | 274 (83.3%) |
| Health Technologists | 43 (14.1%) | 263 (86.0%) |
| Total (Category) | 1,348 (50.8%) | 1,305 (49.2%) |
| Total (Overall) | 3,023 (50.7%) | 2,944 (49.3%) |
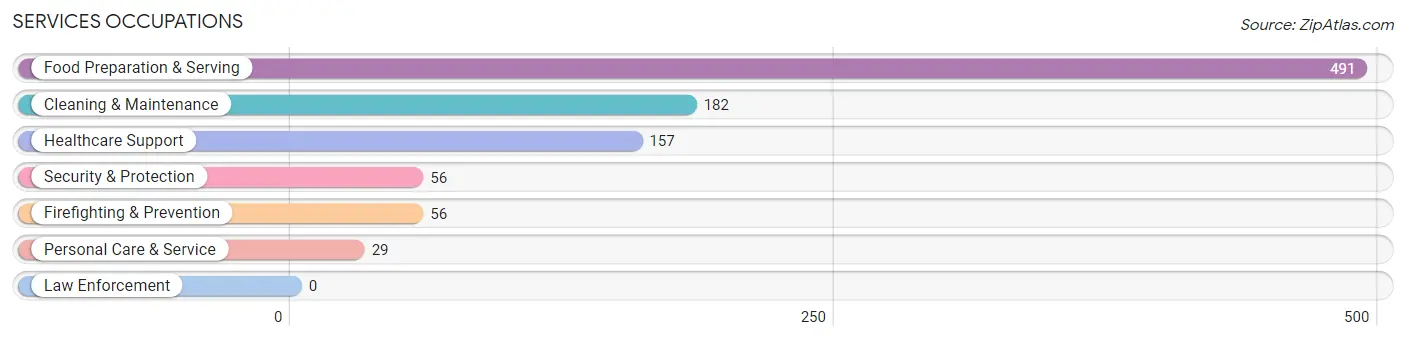
Services Occupations
The most common Services occupations in Fernandina Beach are Food Preparation & Serving (491 | 8.2%), Cleaning & Maintenance (182 | 3.0%), Healthcare Support (157 | 2.6%), Security & Protection (56 | 0.9%), and Firefighting & Prevention (56 | 0.9%).
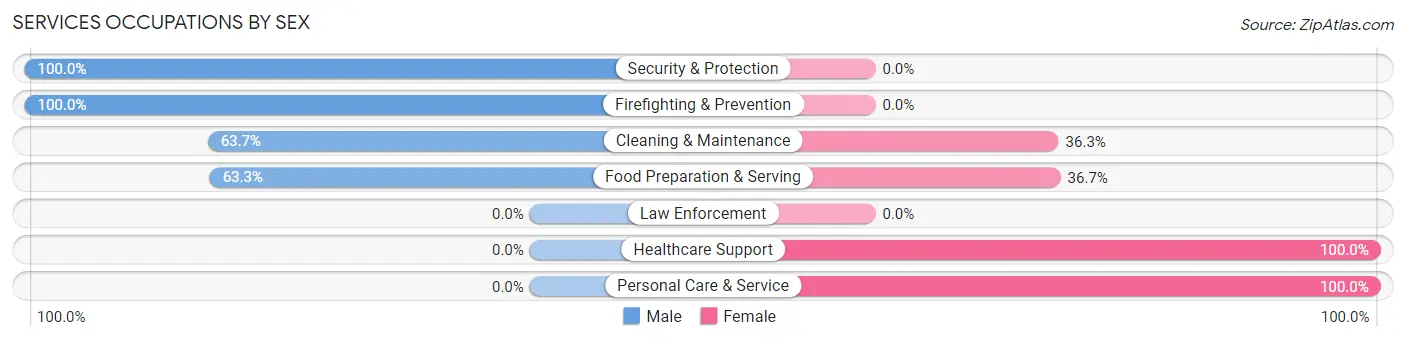
Services Occupations by Sex
Within the Services occupations in Fernandina Beach, the most male-oriented occupations are Security & Protection (100.0%), Firefighting & Prevention (100.0%), and Cleaning & Maintenance (63.7%), while the most female-oriented occupations are Healthcare Support (100.0%), Personal Care & Service (100.0%), and Food Preparation & Serving (36.7%).
| Occupation | Male | Female |
| Healthcare Support | 0 (0.0%) | 157 (100.0%) |
| Security & Protection | 56 (100.0%) | 0 (0.0%) |
| Firefighting & Prevention | 56 (100.0%) | 0 (0.0%) |
| Law Enforcement | 0 (0.0%) | 0 (0.0%) |
| Food Preparation & Serving | 311 (63.3%) | 180 (36.7%) |
| Cleaning & Maintenance | 116 (63.7%) | 66 (36.3%) |
| Personal Care & Service | 0 (0.0%) | 29 (100.0%) |
| Total (Category) | 483 (52.8%) | 432 (47.2%) |
| Total (Overall) | 3,023 (50.7%) | 2,944 (49.3%) |
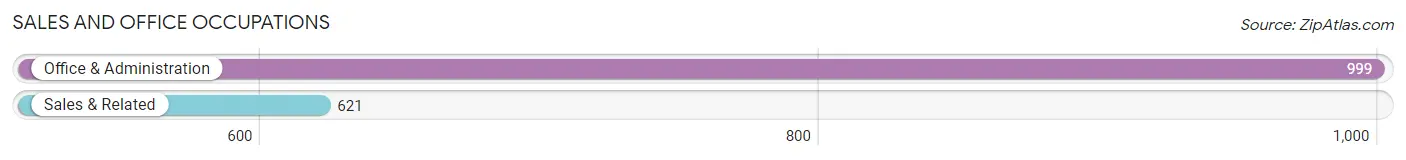
Sales and Office Occupations
The most common Sales and Office occupations in Fernandina Beach are Office & Administration (999 | 16.7%), and Sales & Related (621 | 10.4%).
Sales and Office Occupations by Sex
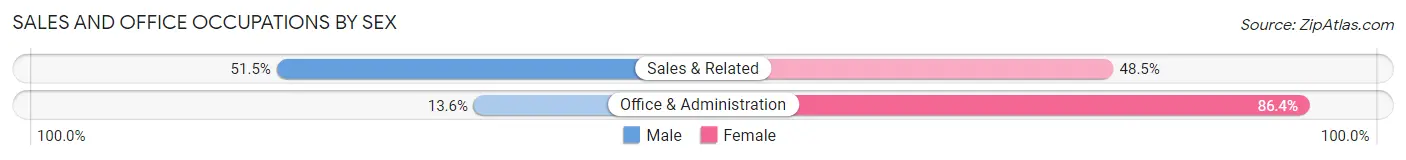
| Occupation | Male | Female |
| Sales & Related | 320 (51.5%) | 301 (48.5%) |
| Office & Administration | 136 (13.6%) | 863 (86.4%) |
| Total (Category) | 456 (28.1%) | 1,164 (71.9%) |
| Total (Overall) | 3,023 (50.7%) | 2,944 (49.3%) |
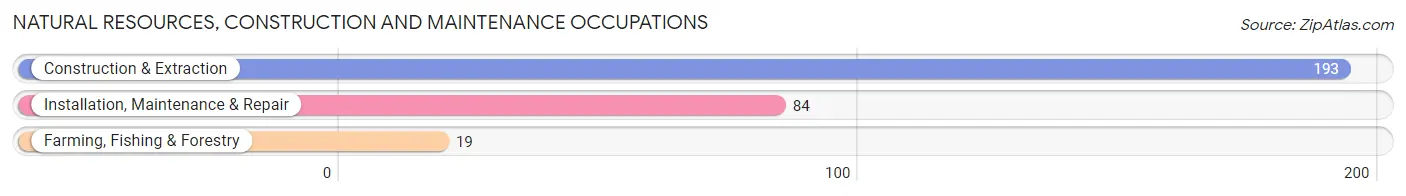
Natural Resources, Construction and Maintenance Occupations
The most common Natural Resources, Construction and Maintenance occupations in Fernandina Beach are Construction & Extraction (193 | 3.2%), Installation, Maintenance & Repair (84 | 1.4%), and Farming, Fishing & Forestry (19 | 0.3%).
Natural Resources, Construction and Maintenance Occupations by Sex
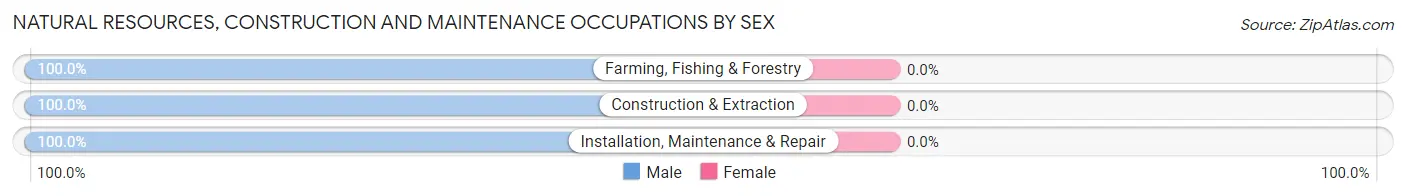
| Occupation | Male | Female |
| Farming, Fishing & Forestry | 19 (100.0%) | 0 (0.0%) |
| Construction & Extraction | 193 (100.0%) | 0 (0.0%) |
| Installation, Maintenance & Repair | 84 (100.0%) | 0 (0.0%) |
| Total (Category) | 296 (100.0%) | 0 (0.0%) |
| Total (Overall) | 3,023 (50.7%) | 2,944 (49.3%) |
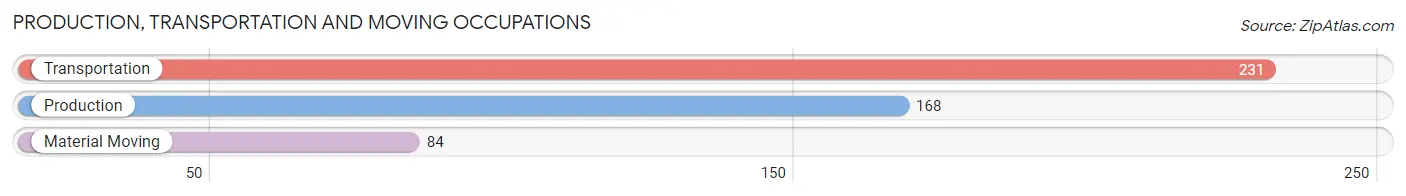
Production, Transportation and Moving Occupations
The most common Production, Transportation and Moving occupations in Fernandina Beach are Transportation (231 | 3.9%), Production (168 | 2.8%), and Material Moving (84 | 1.4%).
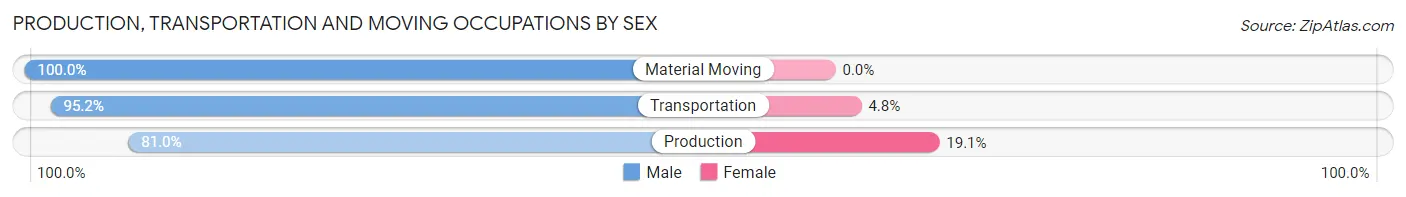
Production, Transportation and Moving Occupations by Sex
| Occupation | Male | Female |
| Production | 136 (80.9%) | 32 (19.1%) |
| Transportation | 220 (95.2%) | 11 (4.8%) |
| Material Moving | 84 (100.0%) | 0 (0.0%) |
| Total (Category) | 440 (91.1%) | 43 (8.9%) |
| Total (Overall) | 3,023 (50.7%) | 2,944 (49.3%) |
Employment Industries by Sex in Fernandina Beach
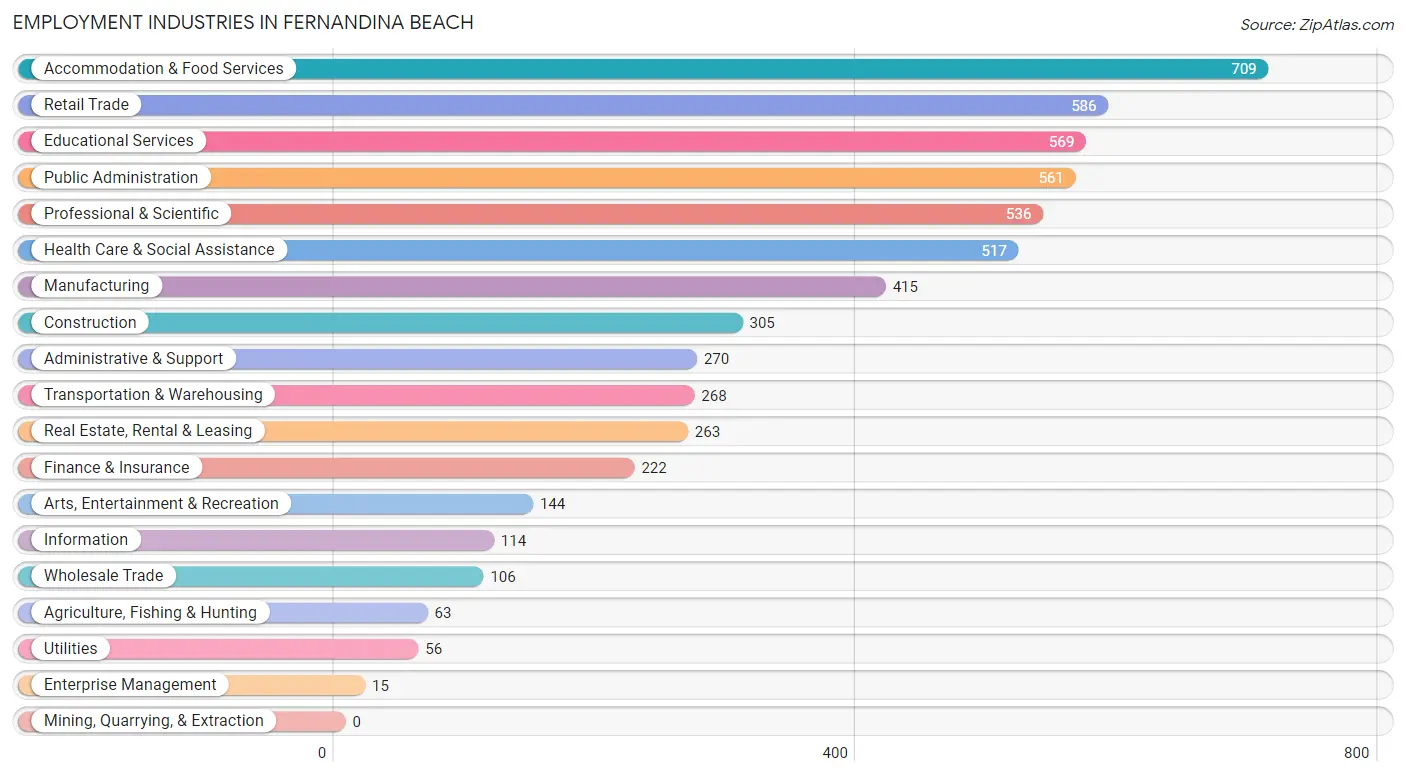
Employment Industries in Fernandina Beach
The major employment industries in Fernandina Beach include Accommodation & Food Services (709 | 11.9%), Retail Trade (586 | 9.8%), Educational Services (569 | 9.5%), Public Administration (561 | 9.4%), and Professional & Scientific (536 | 9.0%).
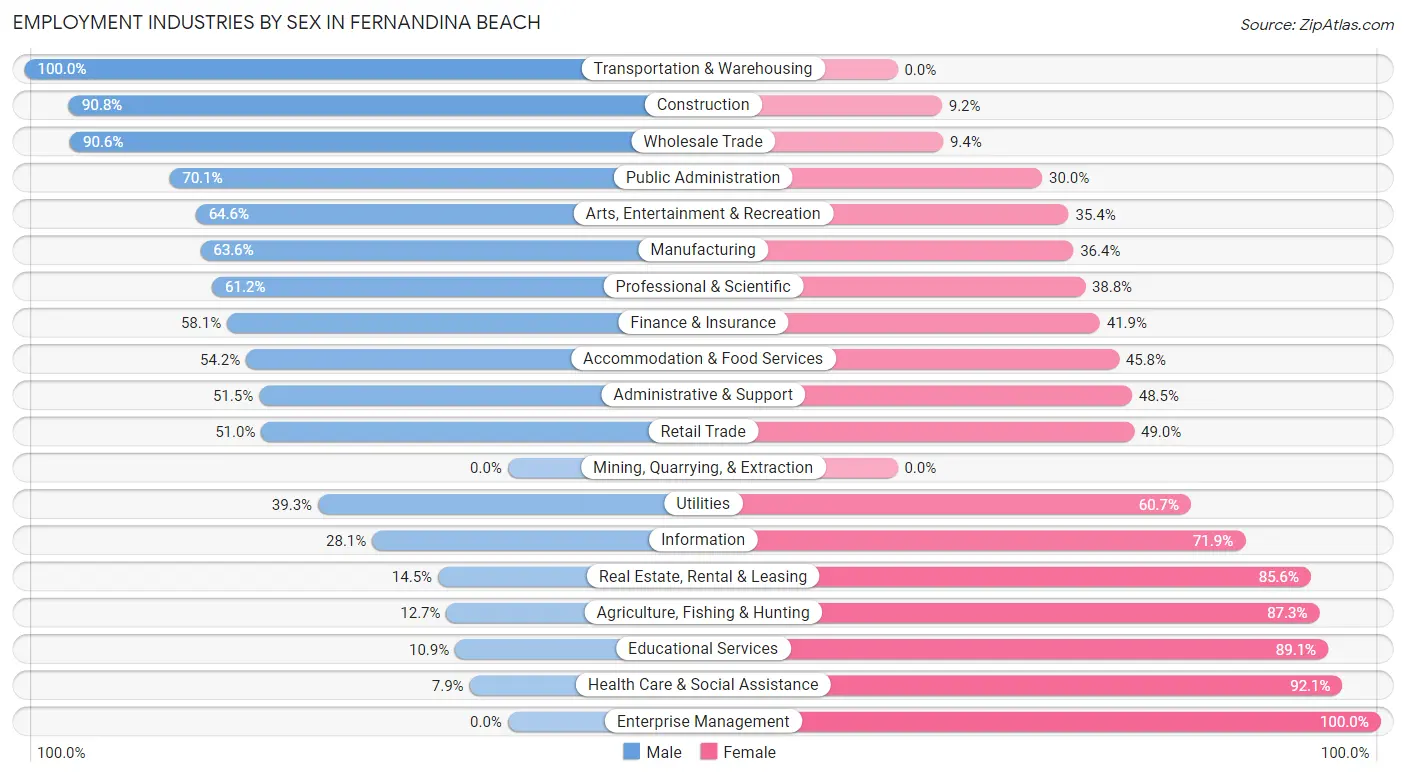
Employment Industries by Sex in Fernandina Beach
The Fernandina Beach industries that see more men than women are Transportation & Warehousing (100.0%), Construction (90.8%), and Wholesale Trade (90.6%), whereas the industries that tend to have a higher number of women are Enterprise Management (100.0%), Health Care & Social Assistance (92.1%), and Educational Services (89.1%).
| Industry | Male | Female |
| Agriculture, Fishing & Hunting | 8 (12.7%) | 55 (87.3%) |
| Mining, Quarrying, & Extraction | 0 (0.0%) | 0 (0.0%) |
| Construction | 277 (90.8%) | 28 (9.2%) |
| Manufacturing | 264 (63.6%) | 151 (36.4%) |
| Wholesale Trade | 96 (90.6%) | 10 (9.4%) |
| Retail Trade | 299 (51.0%) | 287 (49.0%) |
| Transportation & Warehousing | 268 (100.0%) | 0 (0.0%) |
| Utilities | 22 (39.3%) | 34 (60.7%) |
| Information | 32 (28.1%) | 82 (71.9%) |
| Finance & Insurance | 129 (58.1%) | 93 (41.9%) |
| Real Estate, Rental & Leasing | 38 (14.4%) | 225 (85.6%) |
| Professional & Scientific | 328 (61.2%) | 208 (38.8%) |
| Enterprise Management | 0 (0.0%) | 15 (100.0%) |
| Administrative & Support | 139 (51.5%) | 131 (48.5%) |
| Educational Services | 62 (10.9%) | 507 (89.1%) |
| Health Care & Social Assistance | 41 (7.9%) | 476 (92.1%) |
| Arts, Entertainment & Recreation | 93 (64.6%) | 51 (35.4%) |
| Accommodation & Food Services | 384 (54.2%) | 325 (45.8%) |
| Public Administration | 393 (70.1%) | 168 (29.9%) |
| Total | 3,023 (50.7%) | 2,944 (49.3%) |
Education in Fernandina Beach
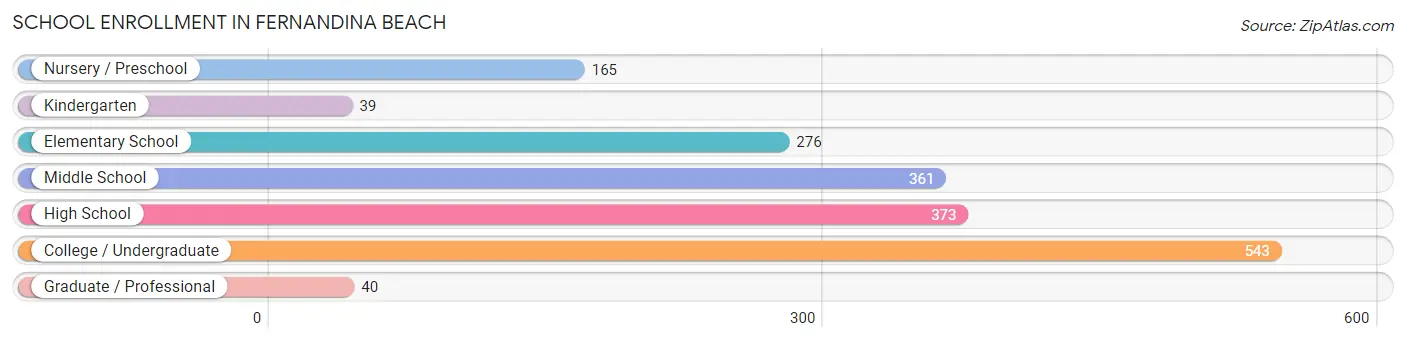
School Enrollment in Fernandina Beach
The most common levels of schooling among the 1,797 students in Fernandina Beach are college / undergraduate (543 | 30.2%), high school (373 | 20.8%), and middle school (361 | 20.1%).
| School Level | # Students | % Students |
| Nursery / Preschool | 165 | 9.2% |
| Kindergarten | 39 | 2.2% |
| Elementary School | 276 | 15.4% |
| Middle School | 361 | 20.1% |
| High School | 373 | 20.8% |
| College / Undergraduate | 543 | 30.2% |
| Graduate / Professional | 40 | 2.2% |
| Total | 1,797 | 100.0% |
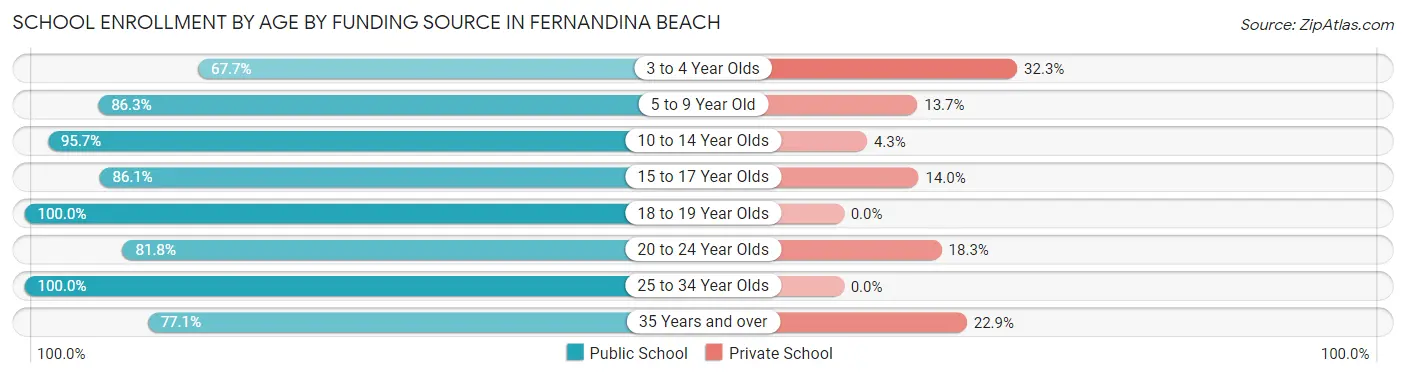
School Enrollment by Age by Funding Source in Fernandina Beach
Out of a total of 1,797 students who are enrolled in schools in Fernandina Beach, 228 (12.7%) attend a private institution, while the remaining 1,569 (87.3%) are enrolled in public schools. The age group of 3 to 4 year olds has the highest likelihood of being enrolled in private schools, with 42 (32.3% in the age bracket) enrolled. Conversely, the age group of 18 to 19 year olds has the lowest likelihood of being enrolled in a private school, with 97 (100.0% in the age bracket) attending a public institution.
| Age Bracket | Public School | Private School |
| 3 to 4 Year Olds | 88 (67.7%) | 42 (32.3%) |
| 5 to 9 Year Old | 283 (86.3%) | 45 (13.7%) |
| 10 to 14 Year Olds | 485 (95.7%) | 22 (4.3%) |
| 15 to 17 Year Olds | 185 (86.1%) | 30 (14.0%) |
| 18 to 19 Year Olds | 97 (100.0%) | 0 (0.0%) |
| 20 to 24 Year Olds | 224 (81.8%) | 50 (18.2%) |
| 25 to 34 Year Olds | 76 (100.0%) | 0 (0.0%) |
| 35 Years and over | 131 (77.1%) | 39 (22.9%) |
| Total | 1,569 (87.3%) | 228 (12.7%) |
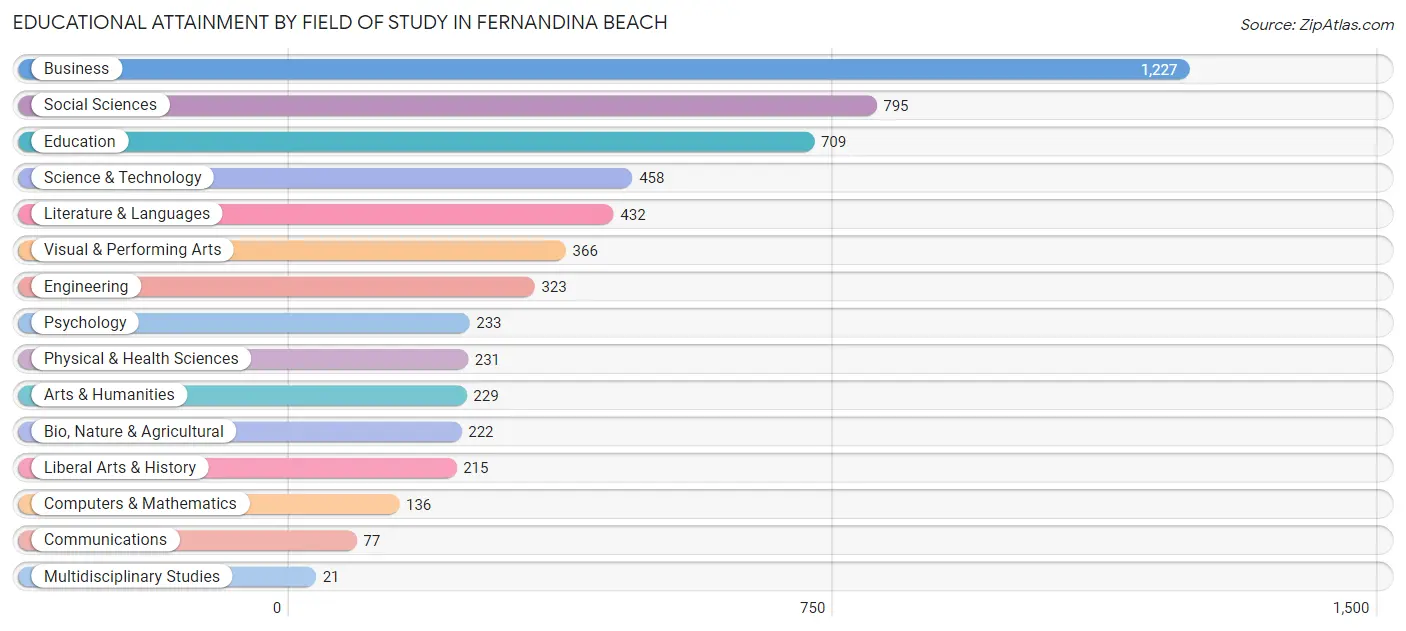
Educational Attainment by Field of Study in Fernandina Beach
Business (1,227 | 21.6%), social sciences (795 | 14.0%), education (709 | 12.5%), science & technology (458 | 8.1%), and literature & languages (432 | 7.6%) are the most common fields of study among 5,674 individuals in Fernandina Beach who have obtained a bachelor's degree or higher.
| Field of Study | # Graduates | % Graduates |
| Computers & Mathematics | 136 | 2.4% |
| Bio, Nature & Agricultural | 222 | 3.9% |
| Physical & Health Sciences | 231 | 4.1% |
| Psychology | 233 | 4.1% |
| Social Sciences | 795 | 14.0% |
| Engineering | 323 | 5.7% |
| Multidisciplinary Studies | 21 | 0.4% |
| Science & Technology | 458 | 8.1% |
| Business | 1,227 | 21.6% |
| Education | 709 | 12.5% |
| Literature & Languages | 432 | 7.6% |
| Liberal Arts & History | 215 | 3.8% |
| Visual & Performing Arts | 366 | 6.5% |
| Communications | 77 | 1.4% |
| Arts & Humanities | 229 | 4.0% |
| Total | 5,674 | 100.0% |
Transportation & Commute in Fernandina Beach
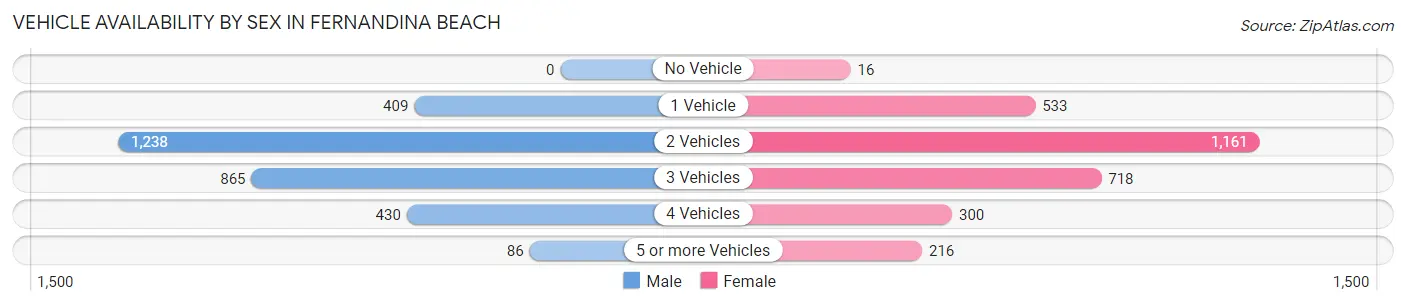
Vehicle Availability by Sex in Fernandina Beach
The most prevalent vehicle ownership categories in Fernandina Beach are males with 2 vehicles (1,238, accounting for 40.9%) and females with 2 vehicles (1,161, making up 42.0%).
| Vehicles Available | Male | Female |
| No Vehicle | 0 (0.0%) | 16 (0.5%) |
| 1 Vehicle | 409 (13.5%) | 533 (18.1%) |
| 2 Vehicles | 1,238 (40.9%) | 1,161 (39.4%) |
| 3 Vehicles | 865 (28.6%) | 718 (24.4%) |
| 4 Vehicles | 430 (14.2%) | 300 (10.2%) |
| 5 or more Vehicles | 86 (2.8%) | 216 (7.3%) |
| Total | 3,028 (100.0%) | 2,944 (100.0%) |
Commute Time in Fernandina Beach
The most frequently occuring commute durations in Fernandina Beach are 5 to 9 minutes (1,315 commuters, 25.5%), 10 to 14 minutes (1,038 commuters, 20.2%), and 15 to 19 minutes (569 commuters, 11.0%).
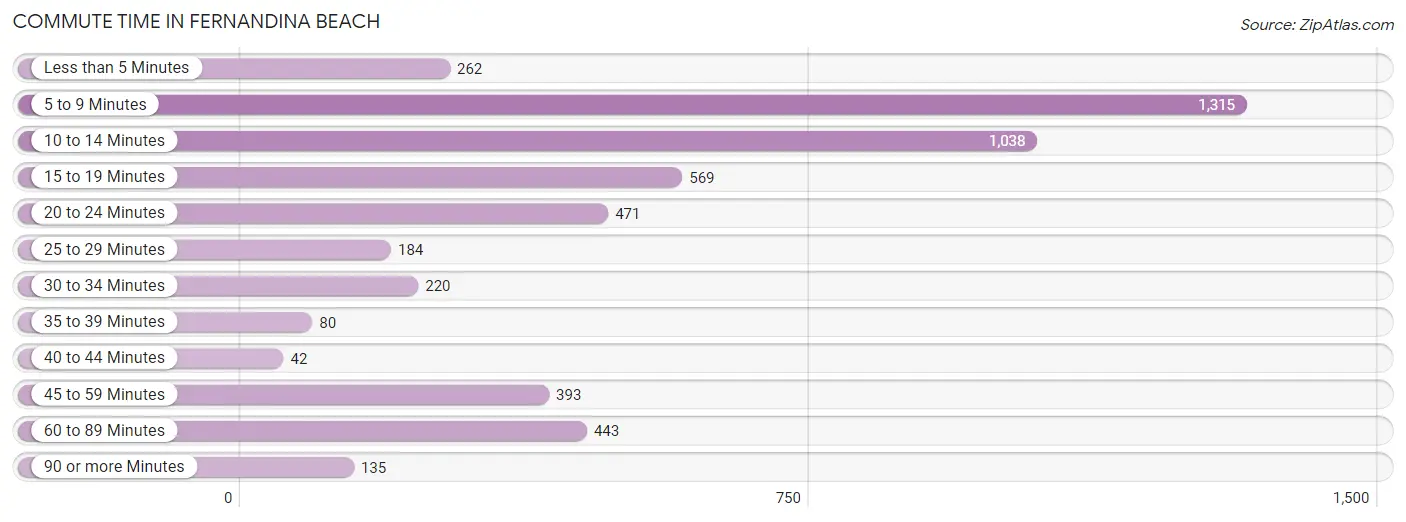
| Commute Time | # Commuters | % Commuters |
| Less than 5 Minutes | 262 | 5.1% |
| 5 to 9 Minutes | 1,315 | 25.5% |
| 10 to 14 Minutes | 1,038 | 20.2% |
| 15 to 19 Minutes | 569 | 11.0% |
| 20 to 24 Minutes | 471 | 9.1% |
| 25 to 29 Minutes | 184 | 3.6% |
| 30 to 34 Minutes | 220 | 4.3% |
| 35 to 39 Minutes | 80 | 1.5% |
| 40 to 44 Minutes | 42 | 0.8% |
| 45 to 59 Minutes | 393 | 7.6% |
| 60 to 89 Minutes | 443 | 8.6% |
| 90 or more Minutes | 135 | 2.6% |
Commute Time by Sex in Fernandina Beach
The most common commute times in Fernandina Beach are 5 to 9 minutes (487 commuters, 18.4%) for males and 5 to 9 minutes (828 commuters, 33.0%) for females.
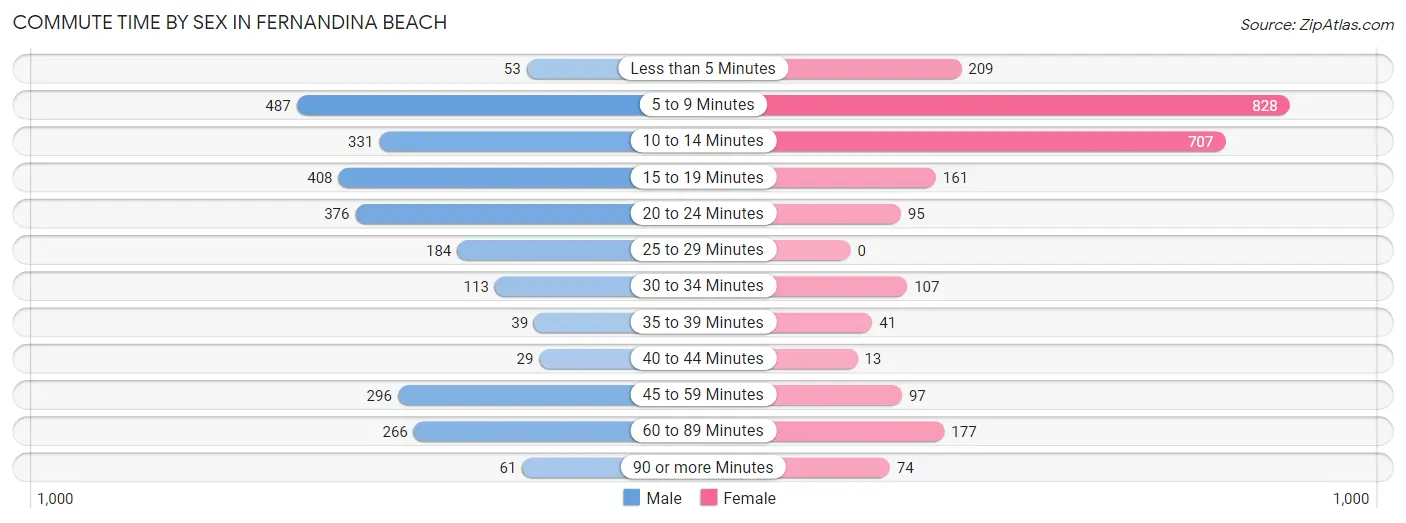
| Commute Time | Male | Female |
| Less than 5 Minutes | 53 (2.0%) | 209 (8.3%) |
| 5 to 9 Minutes | 487 (18.4%) | 828 (33.0%) |
| 10 to 14 Minutes | 331 (12.5%) | 707 (28.2%) |
| 15 to 19 Minutes | 408 (15.4%) | 161 (6.4%) |
| 20 to 24 Minutes | 376 (14.2%) | 95 (3.8%) |
| 25 to 29 Minutes | 184 (7.0%) | 0 (0.0%) |
| 30 to 34 Minutes | 113 (4.3%) | 107 (4.3%) |
| 35 to 39 Minutes | 39 (1.5%) | 41 (1.6%) |
| 40 to 44 Minutes | 29 (1.1%) | 13 (0.5%) |
| 45 to 59 Minutes | 296 (11.2%) | 97 (3.9%) |
| 60 to 89 Minutes | 266 (10.1%) | 177 (7.0%) |
| 90 or more Minutes | 61 (2.3%) | 74 (2.9%) |
Time of Departure to Work by Sex in Fernandina Beach
The most frequent times of departure to work in Fernandina Beach are 8:00 AM to 8:29 AM (448, 17.0%) for males and 7:30 AM to 7:59 AM (562, 22.4%) for females.
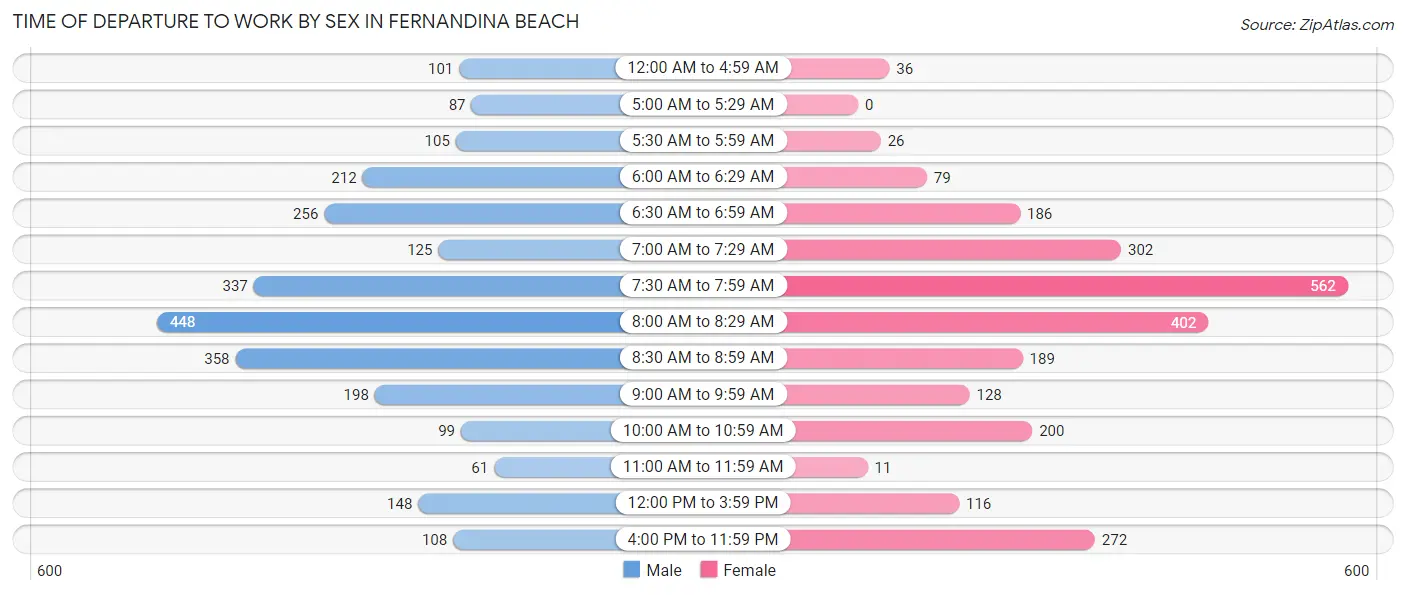
| Time of Departure | Male | Female |
| 12:00 AM to 4:59 AM | 101 (3.8%) | 36 (1.4%) |
| 5:00 AM to 5:29 AM | 87 (3.3%) | 0 (0.0%) |
| 5:30 AM to 5:59 AM | 105 (4.0%) | 26 (1.0%) |
| 6:00 AM to 6:29 AM | 212 (8.0%) | 79 (3.2%) |
| 6:30 AM to 6:59 AM | 256 (9.7%) | 186 (7.4%) |
| 7:00 AM to 7:29 AM | 125 (4.7%) | 302 (12.0%) |
| 7:30 AM to 7:59 AM | 337 (12.8%) | 562 (22.4%) |
| 8:00 AM to 8:29 AM | 448 (17.0%) | 402 (16.0%) |
| 8:30 AM to 8:59 AM | 358 (13.6%) | 189 (7.5%) |
| 9:00 AM to 9:59 AM | 198 (7.5%) | 128 (5.1%) |
| 10:00 AM to 10:59 AM | 99 (3.7%) | 200 (8.0%) |
| 11:00 AM to 11:59 AM | 61 (2.3%) | 11 (0.4%) |
| 12:00 PM to 3:59 PM | 148 (5.6%) | 116 (4.6%) |
| 4:00 PM to 11:59 PM | 108 (4.1%) | 272 (10.8%) |
| Total | 2,643 (100.0%) | 2,509 (100.0%) |
Housing Occupancy in Fernandina Beach
Occupancy by Ownership in Fernandina Beach
Of the total 6,068 dwellings in Fernandina Beach, owner-occupied units account for 4,984 (82.1%), while renter-occupied units make up 1,084 (17.9%).
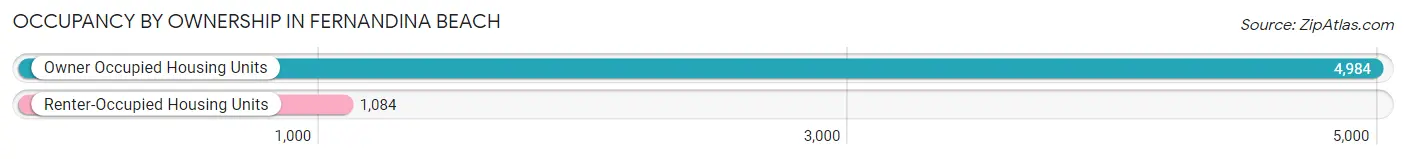
| Occupancy | # Housing Units | % Housing Units |
| Owner Occupied Housing Units | 4,984 | 82.1% |
| Renter-Occupied Housing Units | 1,084 | 17.9% |
| Total Occupied Housing Units | 6,068 | 100.0% |
Occupancy by Household Size in Fernandina Beach
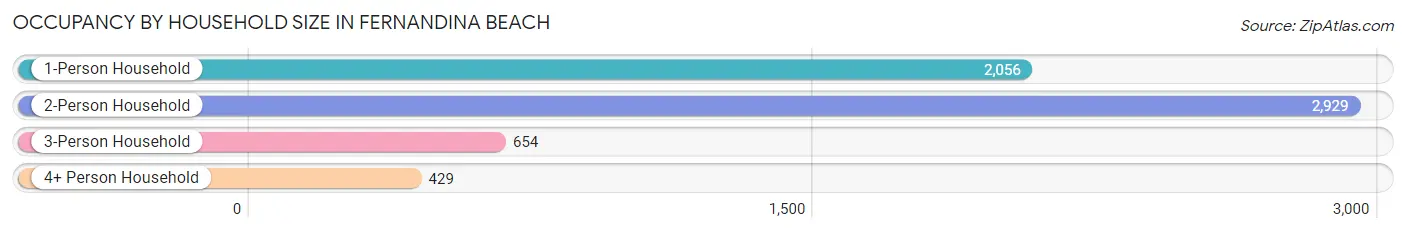
| Household Size | # Housing Units | % Housing Units |
| 1-Person Household | 2,056 | 33.9% |
| 2-Person Household | 2,929 | 48.3% |
| 3-Person Household | 654 | 10.8% |
| 4+ Person Household | 429 | 7.1% |
| Total Housing Units | 6,068 | 100.0% |
Occupancy by Ownership by Household Size in Fernandina Beach
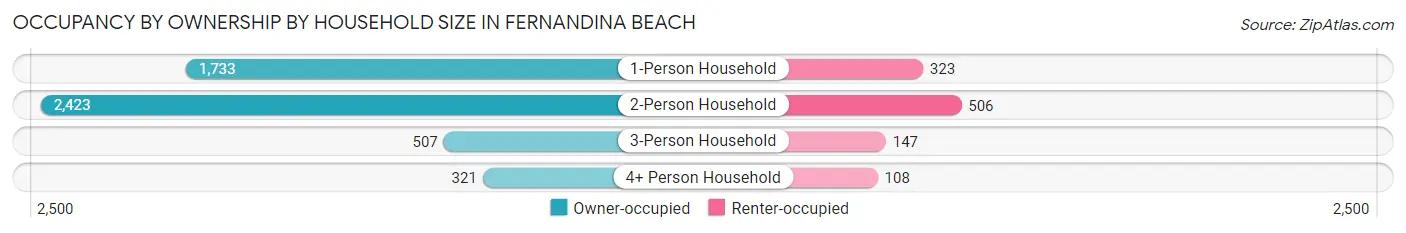
| Household Size | Owner-occupied | Renter-occupied |
| 1-Person Household | 1,733 (84.3%) | 323 (15.7%) |
| 2-Person Household | 2,423 (82.7%) | 506 (17.3%) |
| 3-Person Household | 507 (77.5%) | 147 (22.5%) |
| 4+ Person Household | 321 (74.8%) | 108 (25.2%) |
| Total Housing Units | 4,984 (82.1%) | 1,084 (17.9%) |
Occupancy by Educational Attainment in Fernandina Beach
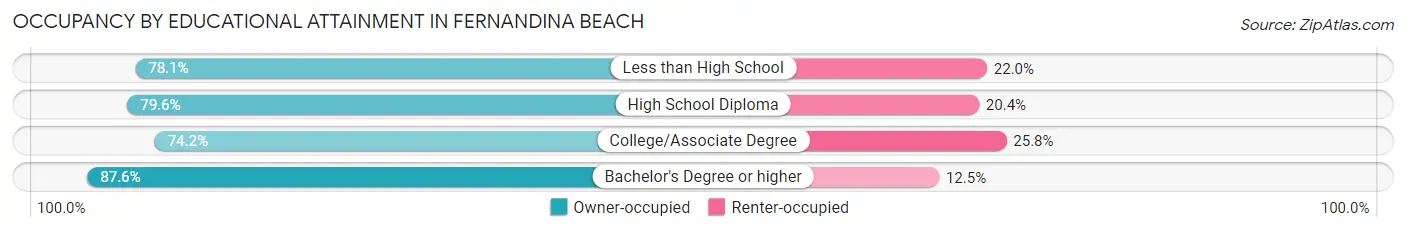
| Household Size | Owner-occupied | Renter-occupied |
| Less than High School | 128 (78.0%) | 36 (22.0%) |
| High School Diploma | 696 (79.6%) | 178 (20.4%) |
| College/Associate Degree | 1,354 (74.2%) | 471 (25.8%) |
| Bachelor's Degree or higher | 2,806 (87.5%) | 399 (12.4%) |
Occupancy by Age of Householder in Fernandina Beach
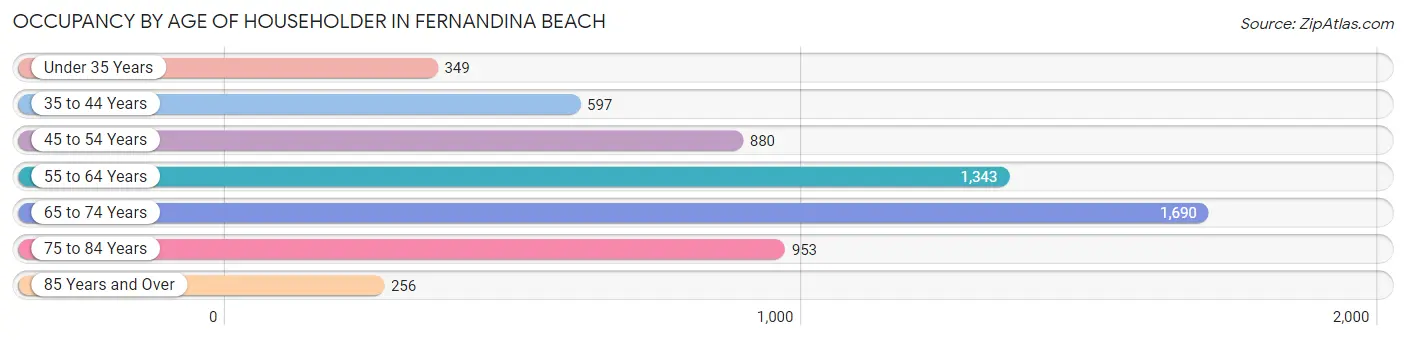
| Age Bracket | # Households | % Households |
| Under 35 Years | 349 | 5.8% |
| 35 to 44 Years | 597 | 9.8% |
| 45 to 54 Years | 880 | 14.5% |
| 55 to 64 Years | 1,343 | 22.1% |
| 65 to 74 Years | 1,690 | 27.9% |
| 75 to 84 Years | 953 | 15.7% |
| 85 Years and Over | 256 | 4.2% |
| Total | 6,068 | 100.0% |
Housing Finances in Fernandina Beach
Median Income by Occupancy in Fernandina Beach
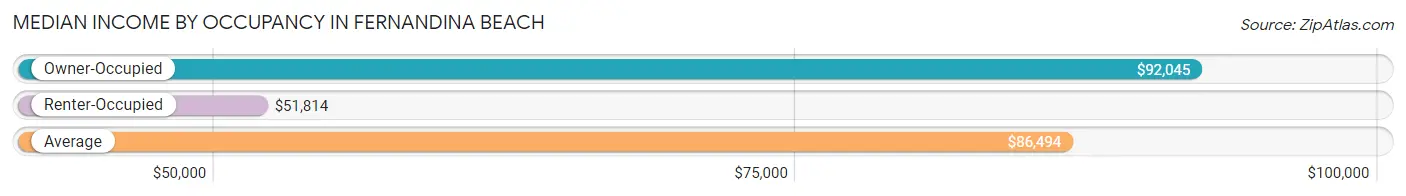
| Occupancy Type | # Households | Median Income |
| Owner-Occupied | 4,984 (82.1%) | $92,045 |
| Renter-Occupied | 1,084 (17.9%) | $51,814 |
| Average | 6,068 (100.0%) | $86,494 |
Occupancy by Householder Income Bracket in Fernandina Beach
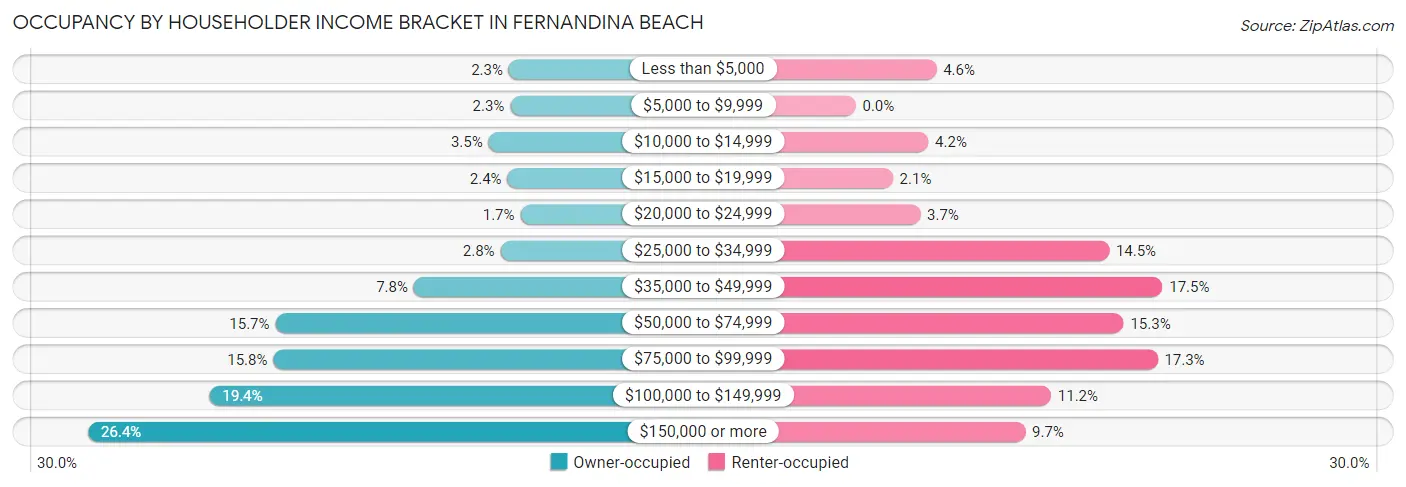
| Income Bracket | Owner-occupied | Renter-occupied |
| Less than $5,000 | 116 (2.3%) | 50 (4.6%) |
| $5,000 to $9,999 | 112 (2.2%) | 0 (0.0%) |
| $10,000 to $14,999 | 174 (3.5%) | 45 (4.2%) |
| $15,000 to $19,999 | 120 (2.4%) | 23 (2.1%) |
| $20,000 to $24,999 | 83 (1.7%) | 40 (3.7%) |
| $25,000 to $34,999 | 140 (2.8%) | 157 (14.5%) |
| $35,000 to $49,999 | 387 (7.8%) | 190 (17.5%) |
| $50,000 to $74,999 | 781 (15.7%) | 166 (15.3%) |
| $75,000 to $99,999 | 787 (15.8%) | 187 (17.2%) |
| $100,000 to $149,999 | 969 (19.4%) | 121 (11.2%) |
| $150,000 or more | 1,315 (26.4%) | 105 (9.7%) |
| Total | 4,984 (100.0%) | 1,084 (100.0%) |
Monthly Housing Cost Tiers in Fernandina Beach
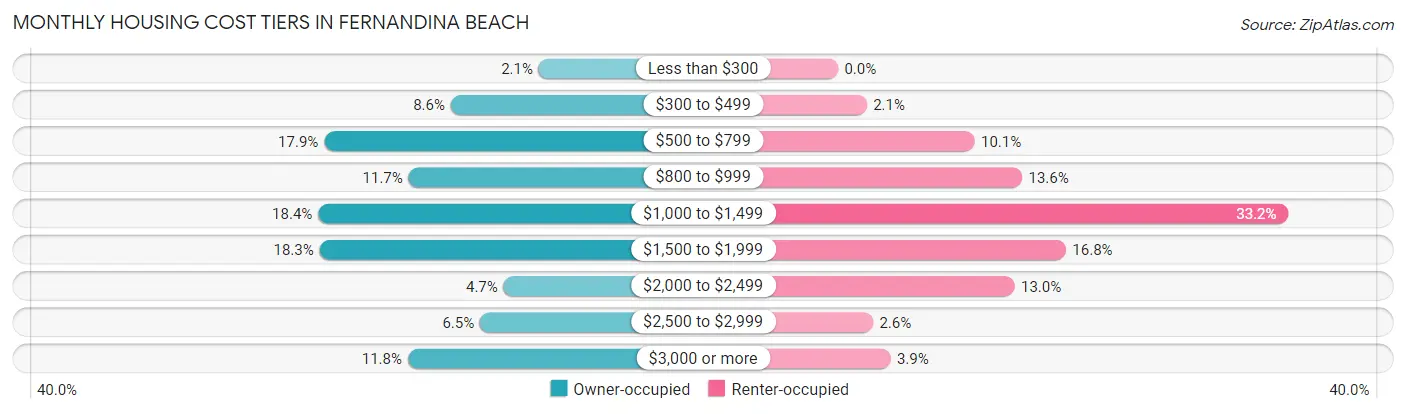
| Monthly Cost | Owner-occupied | Renter-occupied |
| Less than $300 | 106 (2.1%) | 0 (0.0%) |
| $300 to $499 | 429 (8.6%) | 23 (2.1%) |
| $500 to $799 | 894 (17.9%) | 109 (10.1%) |
| $800 to $999 | 584 (11.7%) | 147 (13.6%) |
| $1,000 to $1,499 | 916 (18.4%) | 360 (33.2%) |
| $1,500 to $1,999 | 911 (18.3%) | 182 (16.8%) |
| $2,000 to $2,499 | 235 (4.7%) | 141 (13.0%) |
| $2,500 to $2,999 | 322 (6.5%) | 28 (2.6%) |
| $3,000 or more | 587 (11.8%) | 42 (3.9%) |
| Total | 4,984 (100.0%) | 1,084 (100.0%) |
Physical Housing Characteristics in Fernandina Beach
Housing Structures in Fernandina Beach
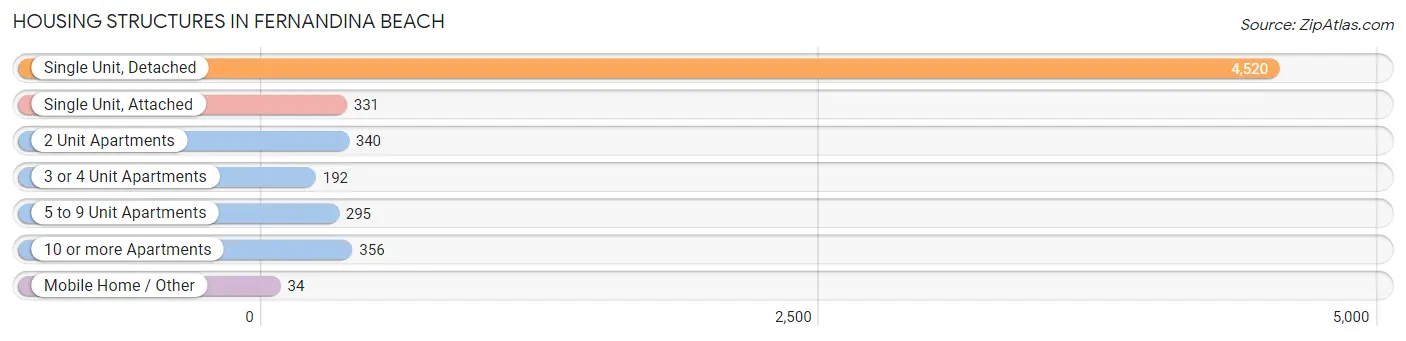
| Structure Type | # Housing Units | % Housing Units |
| Single Unit, Detached | 4,520 | 74.5% |
| Single Unit, Attached | 331 | 5.4% |
| 2 Unit Apartments | 340 | 5.6% |
| 3 or 4 Unit Apartments | 192 | 3.2% |
| 5 to 9 Unit Apartments | 295 | 4.9% |
| 10 or more Apartments | 356 | 5.9% |
| Mobile Home / Other | 34 | 0.6% |
| Total | 6,068 | 100.0% |
Housing Structures by Occupancy in Fernandina Beach
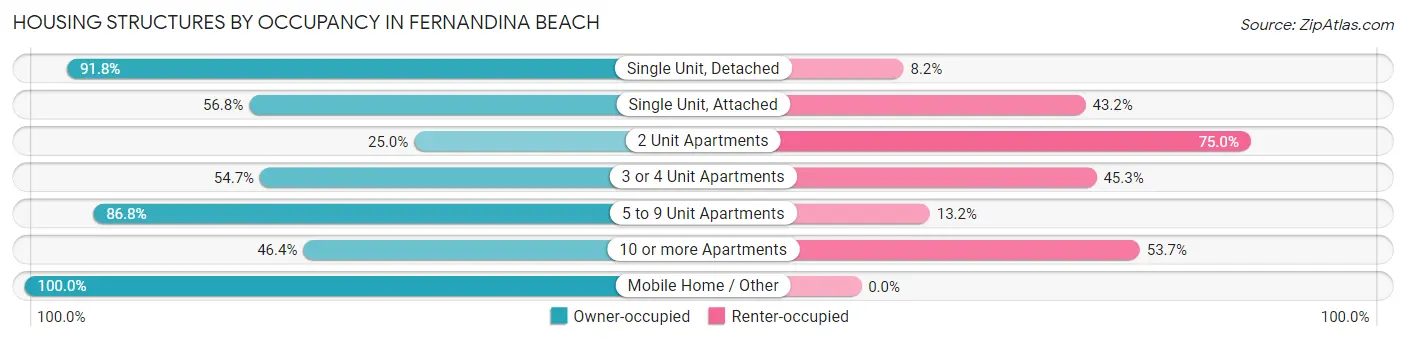
| Structure Type | Owner-occupied | Renter-occupied |
| Single Unit, Detached | 4,151 (91.8%) | 369 (8.2%) |
| Single Unit, Attached | 188 (56.8%) | 143 (43.2%) |
| 2 Unit Apartments | 85 (25.0%) | 255 (75.0%) |
| 3 or 4 Unit Apartments | 105 (54.7%) | 87 (45.3%) |
| 5 to 9 Unit Apartments | 256 (86.8%) | 39 (13.2%) |
| 10 or more Apartments | 165 (46.4%) | 191 (53.6%) |
| Mobile Home / Other | 34 (100.0%) | 0 (0.0%) |
| Total | 4,984 (82.1%) | 1,084 (17.9%) |
Housing Structures by Number of Rooms in Fernandina Beach
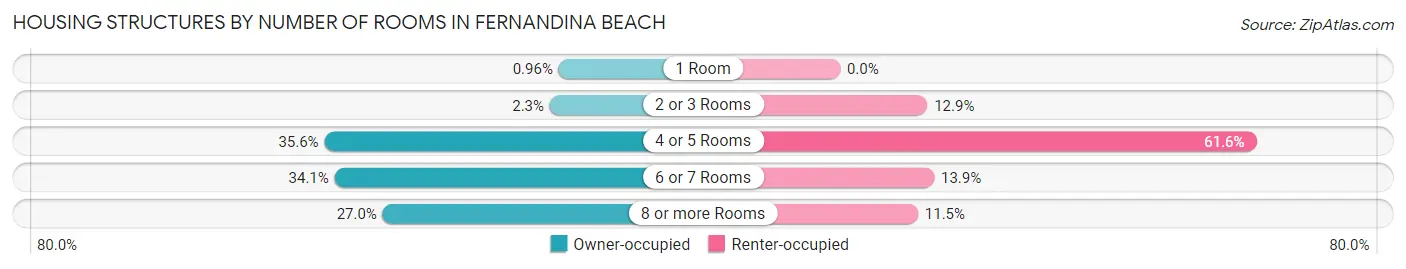
| Number of Rooms | Owner-occupied | Renter-occupied |
| 1 Room | 48 (1.0%) | 0 (0.0%) |
| 2 or 3 Rooms | 113 (2.3%) | 140 (12.9%) |
| 4 or 5 Rooms | 1,776 (35.6%) | 668 (61.6%) |
| 6 or 7 Rooms | 1,701 (34.1%) | 151 (13.9%) |
| 8 or more Rooms | 1,346 (27.0%) | 125 (11.5%) |
| Total | 4,984 (100.0%) | 1,084 (100.0%) |
Housing Structure by Heating Type in Fernandina Beach
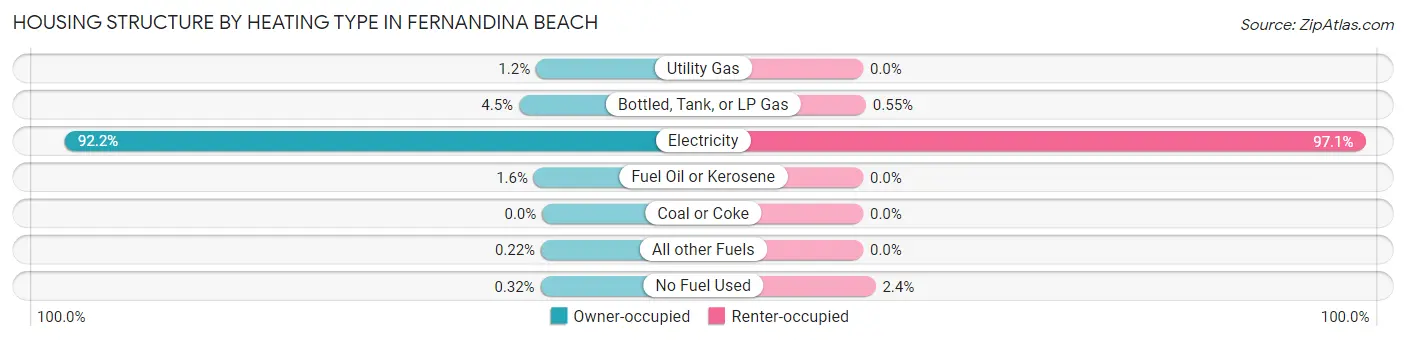
| Heating Type | Owner-occupied | Renter-occupied |
| Utility Gas | 59 (1.2%) | 0 (0.0%) |
| Bottled, Tank, or LP Gas | 223 (4.5%) | 6 (0.5%) |
| Electricity | 4,595 (92.2%) | 1,052 (97.1%) |
| Fuel Oil or Kerosene | 80 (1.6%) | 0 (0.0%) |
| Coal or Coke | 0 (0.0%) | 0 (0.0%) |
| All other Fuels | 11 (0.2%) | 0 (0.0%) |
| No Fuel Used | 16 (0.3%) | 26 (2.4%) |
| Total | 4,984 (100.0%) | 1,084 (100.0%) |
Household Vehicle Usage in Fernandina Beach
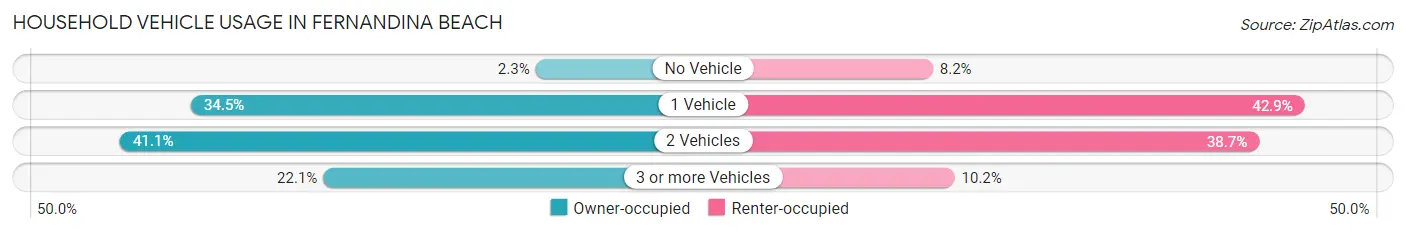
| Vehicles per Household | Owner-occupied | Renter-occupied |
| No Vehicle | 115 (2.3%) | 89 (8.2%) |
| 1 Vehicle | 1,718 (34.5%) | 465 (42.9%) |
| 2 Vehicles | 2,048 (41.1%) | 419 (38.7%) |
| 3 or more Vehicles | 1,103 (22.1%) | 111 (10.2%) |
| Total | 4,984 (100.0%) | 1,084 (100.0%) |
Real Estate & Mortgages in Fernandina Beach
Real Estate and Mortgage Overview in Fernandina Beach
| Characteristic | Without Mortgage | With Mortgage |
| Housing Units | 2,342 | 2,642 |
| Median Property Value | $431,000 | $422,900 |
| Median Household Income | $64,755 | $938 |
| Monthly Housing Costs | $763 | $540 |
| Real Estate Taxes | $3,586 | $51 |
Property Value by Mortgage Status in Fernandina Beach
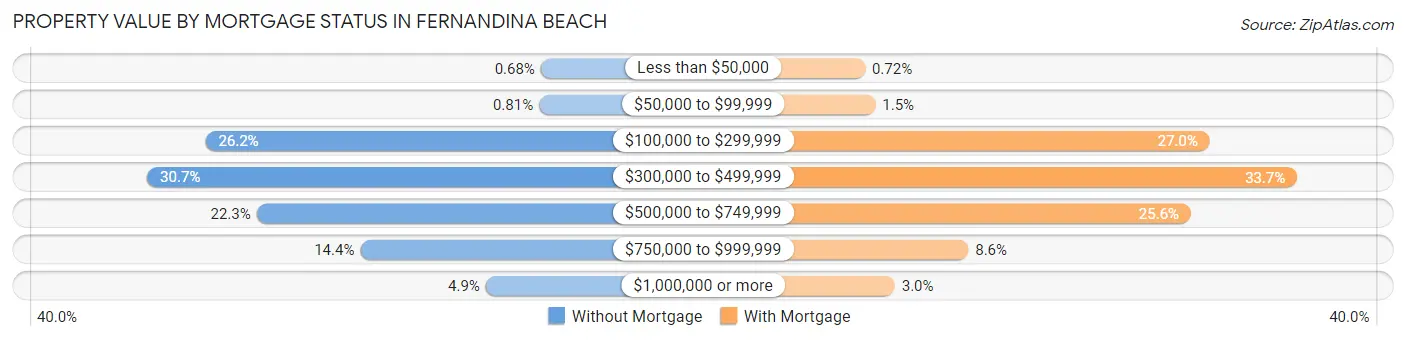
| Property Value | Without Mortgage | With Mortgage |
| Less than $50,000 | 16 (0.7%) | 19 (0.7%) |
| $50,000 to $99,999 | 19 (0.8%) | 40 (1.5%) |
| $100,000 to $299,999 | 614 (26.2%) | 713 (27.0%) |
| $300,000 to $499,999 | 718 (30.7%) | 889 (33.7%) |
| $500,000 to $749,999 | 523 (22.3%) | 675 (25.6%) |
| $750,000 to $999,999 | 338 (14.4%) | 227 (8.6%) |
| $1,000,000 or more | 114 (4.9%) | 79 (3.0%) |
| Total | 2,342 (100.0%) | 2,642 (100.0%) |
Household Income by Mortgage Status in Fernandina Beach
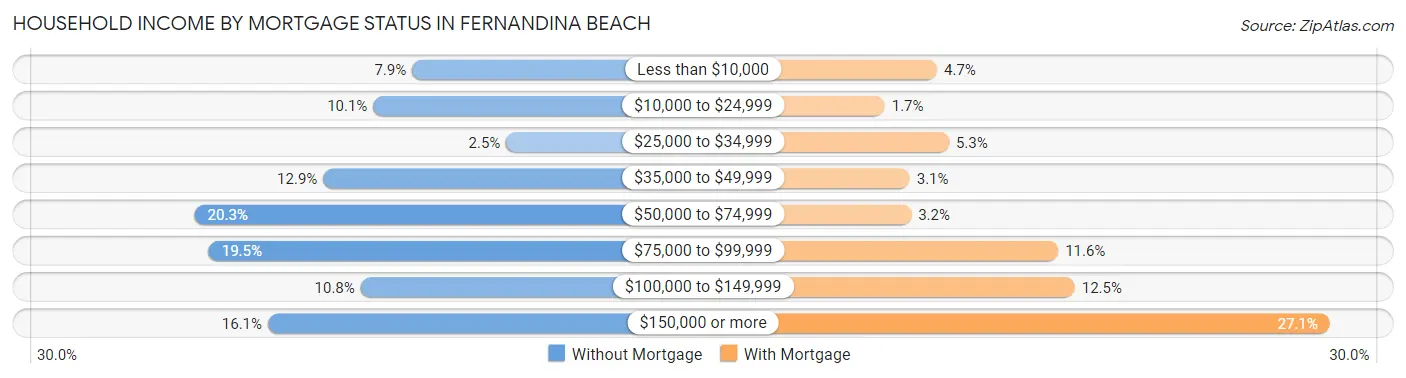
| Household Income | Without Mortgage | With Mortgage |
| Less than $10,000 | 184 (7.9%) | 123 (4.7%) |
| $10,000 to $24,999 | 236 (10.1%) | 44 (1.7%) |
| $25,000 to $34,999 | 58 (2.5%) | 141 (5.3%) |
| $35,000 to $49,999 | 303 (12.9%) | 82 (3.1%) |
| $50,000 to $74,999 | 475 (20.3%) | 84 (3.2%) |
| $75,000 to $99,999 | 456 (19.5%) | 306 (11.6%) |
| $100,000 to $149,999 | 253 (10.8%) | 331 (12.5%) |
| $150,000 or more | 377 (16.1%) | 716 (27.1%) |
| Total | 2,342 (100.0%) | 2,642 (100.0%) |
Property Value to Household Income Ratio in Fernandina Beach
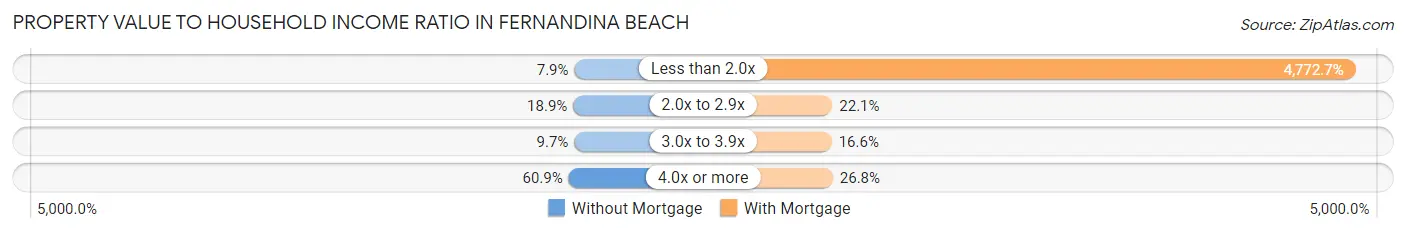
| Value-to-Income Ratio | Without Mortgage | With Mortgage |
| Less than 2.0x | 184 (7.9%) | 126,094 (4,772.7%) |
| 2.0x to 2.9x | 442 (18.9%) | 585 (22.1%) |
| 3.0x to 3.9x | 227 (9.7%) | 438 (16.6%) |
| 4.0x or more | 1,425 (60.9%) | 708 (26.8%) |
| Total | 2,342 (100.0%) | 2,642 (100.0%) |
Real Estate Taxes by Mortgage Status in Fernandina Beach
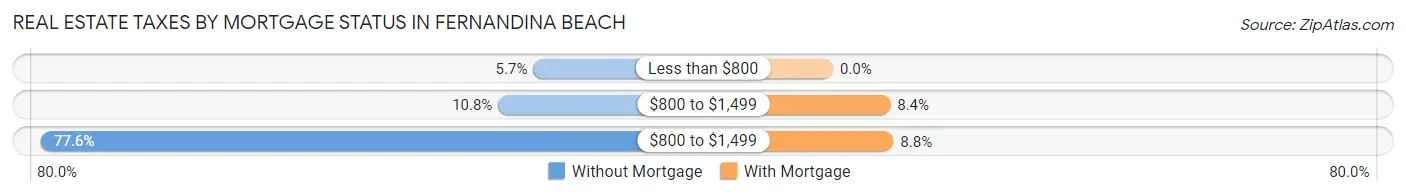
| Property Taxes | Without Mortgage | With Mortgage |
| Less than $800 | 133 (5.7%) | 0 (0.0%) |
| $800 to $1,499 | 253 (10.8%) | 221 (8.4%) |
| $800 to $1,499 | 1,817 (77.6%) | 233 (8.8%) |
| Total | 2,342 (100.0%) | 2,642 (100.0%) |
Health & Disability in Fernandina Beach
Health Insurance Coverage by Age in Fernandina Beach
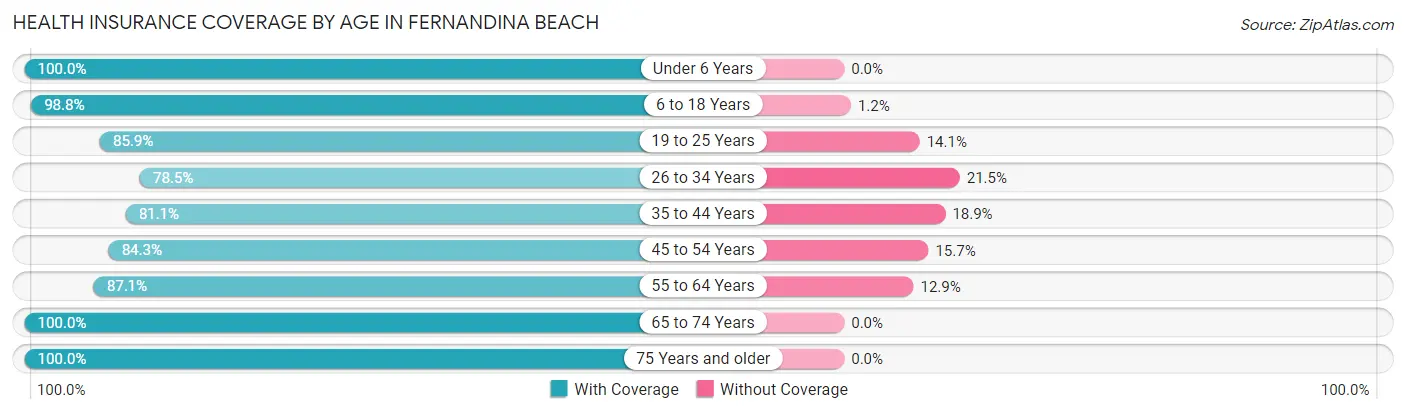
| Age Bracket | With Coverage | Without Coverage |
| Under 6 Years | 526 (100.0%) | 0 (0.0%) |
| 6 to 18 Years | 1,036 (98.8%) | 13 (1.2%) |
| 19 to 25 Years | 745 (85.9%) | 122 (14.1%) |
| 26 to 34 Years | 579 (78.5%) | 159 (21.5%) |
| 35 to 44 Years | 899 (81.1%) | 209 (18.9%) |
| 45 to 54 Years | 1,326 (84.3%) | 247 (15.7%) |
| 55 to 64 Years | 2,022 (87.1%) | 300 (12.9%) |
| 65 to 74 Years | 2,756 (100.0%) | 0 (0.0%) |
| 75 Years and older | 1,831 (100.0%) | 0 (0.0%) |
| Total | 11,720 (91.8%) | 1,050 (8.2%) |
Health Insurance Coverage by Citizenship Status in Fernandina Beach
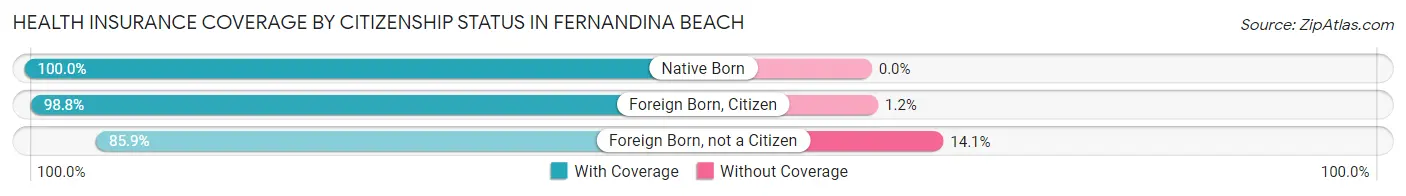
| Citizenship Status | With Coverage | Without Coverage |
| Native Born | 526 (100.0%) | 0 (0.0%) |
| Foreign Born, Citizen | 1,036 (98.8%) | 13 (1.2%) |
| Foreign Born, not a Citizen | 745 (85.9%) | 122 (14.1%) |
Health Insurance Coverage by Household Income in Fernandina Beach
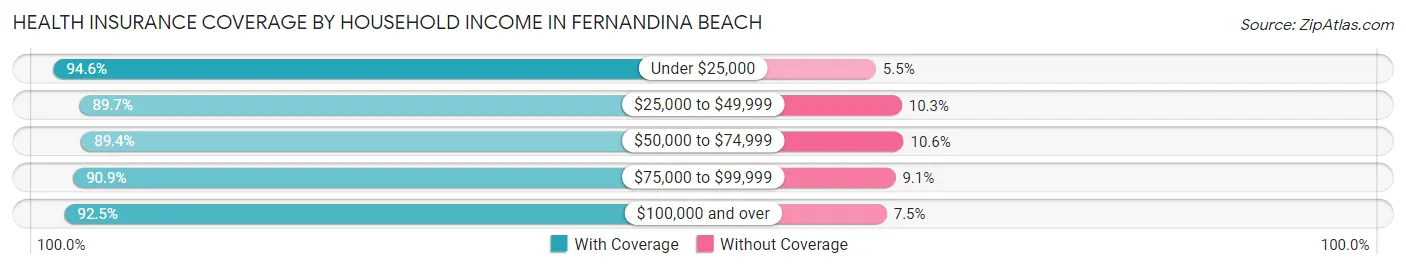
| Household Income | With Coverage | Without Coverage |
| Under $25,000 | 1,267 (94.6%) | 73 (5.4%) |
| $25,000 to $49,999 | 1,506 (89.7%) | 173 (10.3%) |
| $50,000 to $74,999 | 1,497 (89.4%) | 178 (10.6%) |
| $75,000 to $99,999 | 1,654 (90.9%) | 166 (9.1%) |
| $100,000 and over | 5,684 (92.5%) | 460 (7.5%) |
Public vs Private Health Insurance Coverage by Age in Fernandina Beach
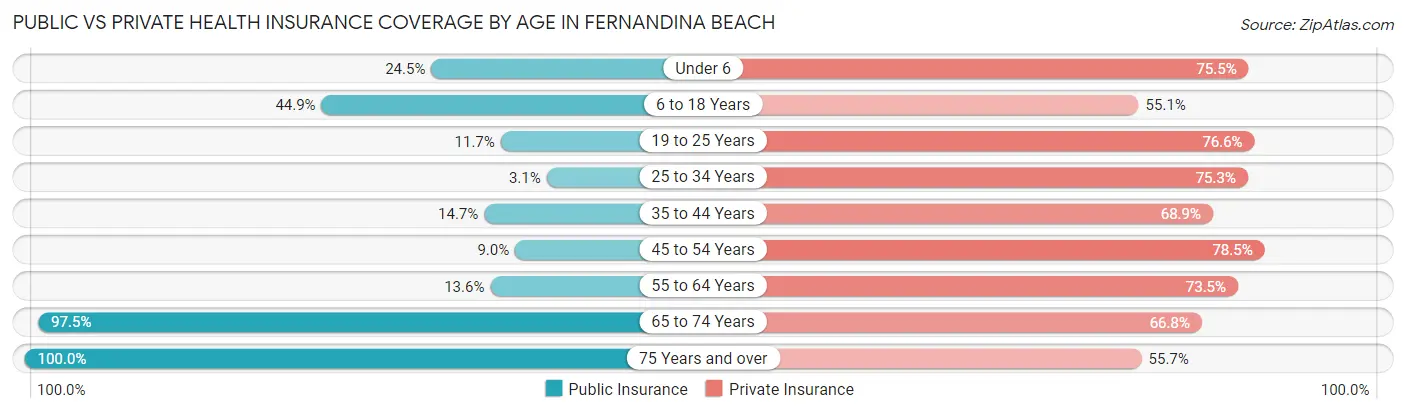
| Age Bracket | Public Insurance | Private Insurance |
| Under 6 | 129 (24.5%) | 397 (75.5%) |
| 6 to 18 Years | 471 (44.9%) | 578 (55.1%) |
| 19 to 25 Years | 101 (11.7%) | 664 (76.6%) |
| 25 to 34 Years | 23 (3.1%) | 556 (75.3%) |
| 35 to 44 Years | 163 (14.7%) | 763 (68.9%) |
| 45 to 54 Years | 141 (9.0%) | 1,234 (78.4%) |
| 55 to 64 Years | 315 (13.6%) | 1,707 (73.5%) |
| 65 to 74 Years | 2,687 (97.5%) | 1,841 (66.8%) |
| 75 Years and over | 1,831 (100.0%) | 1,019 (55.6%) |
| Total | 5,861 (45.9%) | 8,759 (68.6%) |
Disability Status by Sex by Age in Fernandina Beach
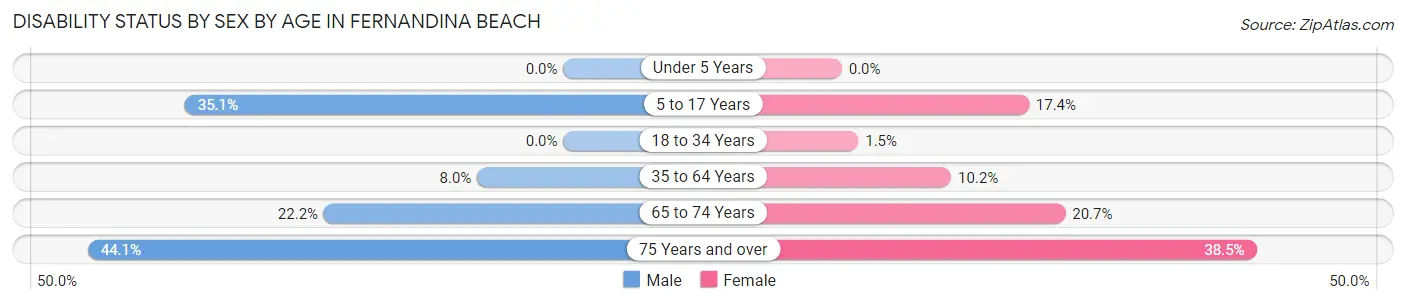
| Age Bracket | Male | Female |
| Under 5 Years | 0 (0.0%) | 0 (0.0%) |
| 5 to 17 Years | 209 (35.1%) | 79 (17.4%) |
| 18 to 34 Years | 0 (0.0%) | 12 (1.5%) |
| 35 to 64 Years | 185 (8.0%) | 273 (10.2%) |
| 65 to 74 Years | 306 (22.2%) | 286 (20.7%) |
| 75 Years and over | 308 (44.1%) | 436 (38.5%) |
Disability Class by Sex by Age in Fernandina Beach
Disability Class: Hearing Difficulty
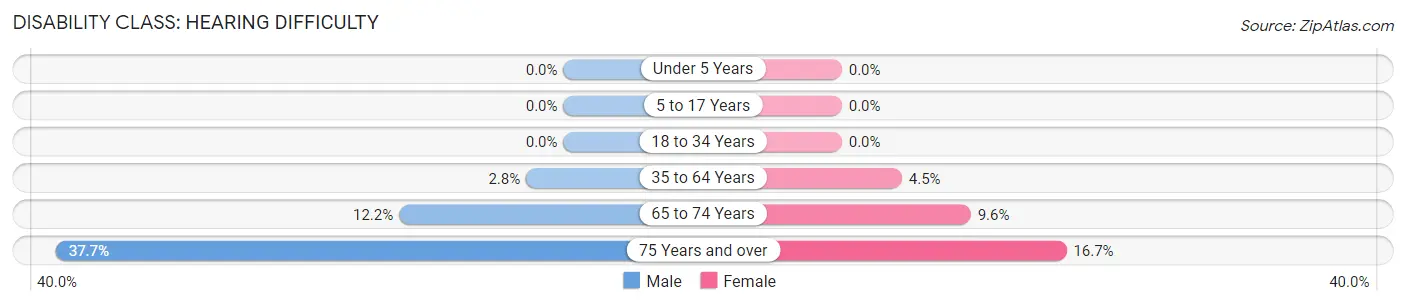
| Age Bracket | Male | Female |
| Under 5 Years | 0 (0.0%) | 0 (0.0%) |
| 5 to 17 Years | 0 (0.0%) | 0 (0.0%) |
| 18 to 34 Years | 0 (0.0%) | 0 (0.0%) |
| 35 to 64 Years | 64 (2.8%) | 120 (4.5%) |
| 65 to 74 Years | 168 (12.2%) | 132 (9.6%) |
| 75 Years and over | 263 (37.7%) | 189 (16.7%) |
Disability Class: Vision Difficulty
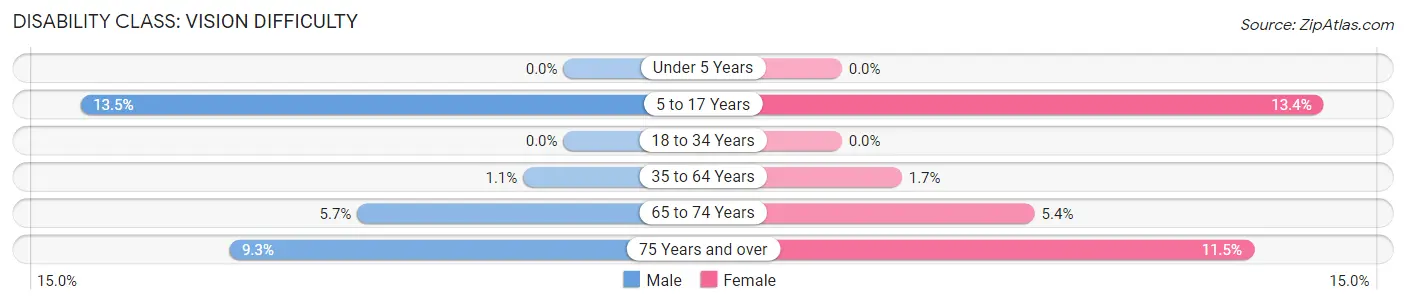
| Age Bracket | Male | Female |
| Under 5 Years | 0 (0.0%) | 0 (0.0%) |
| 5 to 17 Years | 80 (13.5%) | 61 (13.4%) |
| 18 to 34 Years | 0 (0.0%) | 0 (0.0%) |
| 35 to 64 Years | 26 (1.1%) | 45 (1.7%) |
| 65 to 74 Years | 79 (5.7%) | 74 (5.4%) |
| 75 Years and over | 65 (9.3%) | 130 (11.5%) |
Disability Class: Cognitive Difficulty
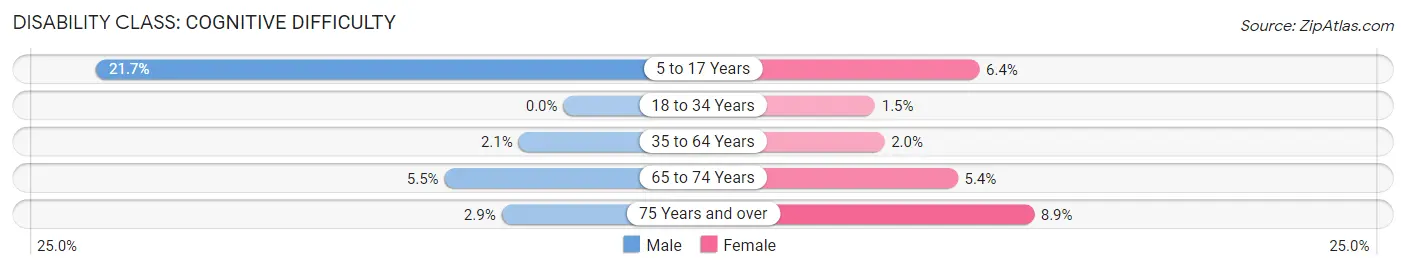
| Age Bracket | Male | Female |
| 5 to 17 Years | 129 (21.7%) | 29 (6.4%) |
| 18 to 34 Years | 0 (0.0%) | 12 (1.5%) |
| 35 to 64 Years | 48 (2.1%) | 53 (2.0%) |
| 65 to 74 Years | 76 (5.5%) | 74 (5.4%) |
| 75 Years and over | 20 (2.9%) | 101 (8.9%) |
Disability Class: Ambulatory Difficulty
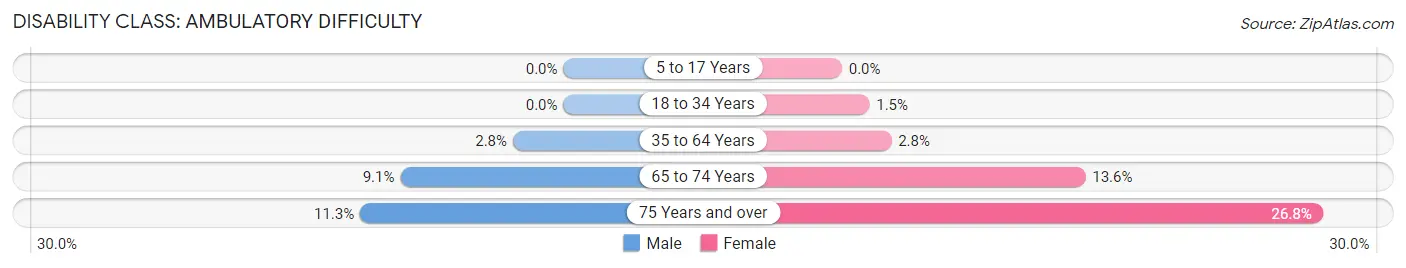
| Age Bracket | Male | Female |
| 5 to 17 Years | 0 (0.0%) | 0 (0.0%) |
| 18 to 34 Years | 0 (0.0%) | 12 (1.5%) |
| 35 to 64 Years | 65 (2.8%) | 74 (2.8%) |
| 65 to 74 Years | 125 (9.1%) | 187 (13.6%) |
| 75 Years and over | 79 (11.3%) | 304 (26.8%) |
Disability Class: Self-Care Difficulty
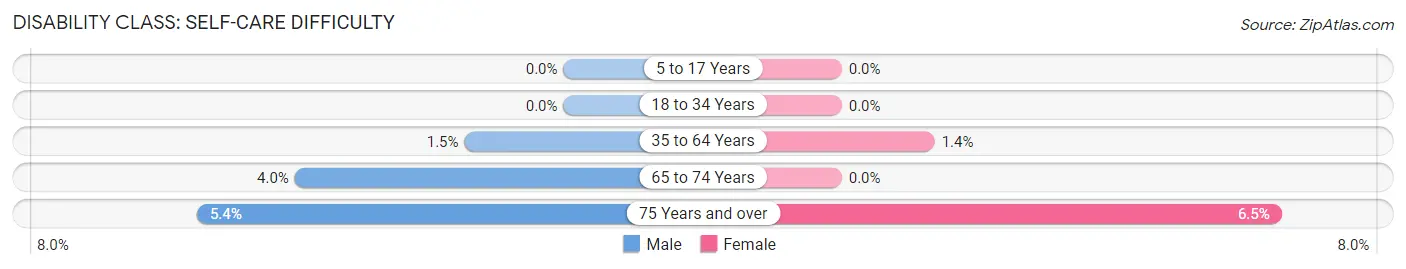
| Age Bracket | Male | Female |
| 5 to 17 Years | 0 (0.0%) | 0 (0.0%) |
| 18 to 34 Years | 0 (0.0%) | 0 (0.0%) |
| 35 to 64 Years | 34 (1.5%) | 37 (1.4%) |
| 65 to 74 Years | 55 (4.0%) | 0 (0.0%) |
| 75 Years and over | 38 (5.4%) | 74 (6.5%) |
Technology Access in Fernandina Beach
Computing Device Access in Fernandina Beach
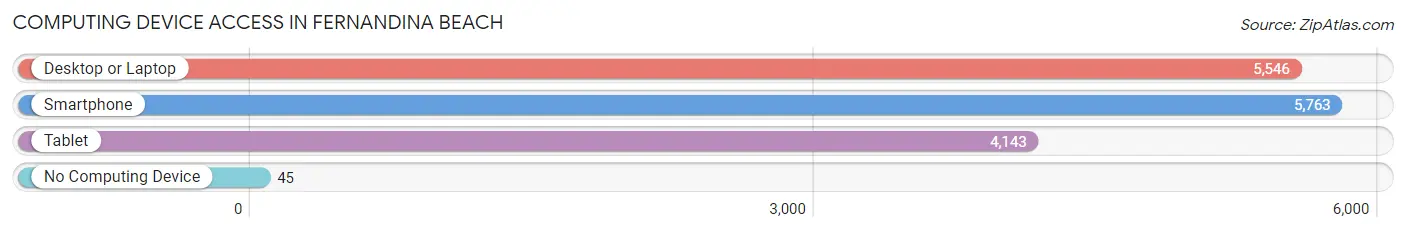
| Device Type | # Households | % Households |
| Desktop or Laptop | 5,546 | 91.4% |
| Smartphone | 5,763 | 95.0% |
| Tablet | 4,143 | 68.3% |
| No Computing Device | 45 | 0.7% |
| Total | 6,068 | 100.0% |
Internet Access in Fernandina Beach
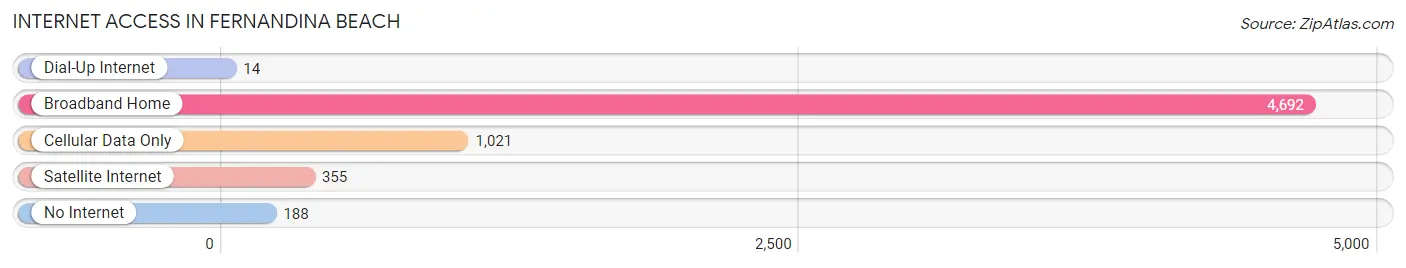
| Internet Type | # Households | % Households |
| Dial-Up Internet | 14 | 0.2% |
| Broadband Home | 4,692 | 77.3% |
| Cellular Data Only | 1,021 | 16.8% |
| Satellite Internet | 355 | 5.9% |
| No Internet | 188 | 3.1% |
| Total | 6,068 | 100.0% |
Fernandina Beach Summary
Fernandina Beach is a city located on Amelia Island in Nassau County, Florida. It is the northernmost city on Florida's Atlantic coast, and is the county seat of Nassau County. The city is situated on the Amelia River, which flows into the Atlantic Ocean. Fernandina Beach is known for its historic downtown district, which is home to many restaurants, shops, and galleries.
History
Fernandina Beach was founded in 1811 by the Spanish, who named it after King Ferdinand VII of Spain. The city was originally a trading post and port for the Spanish, and was later used as a base for the Confederate Navy during the Civil War. After the war, the city was incorporated in 1873.
In the late 19th century, Fernandina Beach became a popular tourist destination, and many of the city's historic buildings were built during this time. The city was also home to the first golf course in Florida, which was built in 1895.
In the early 20th century, Fernandina Beach was a major port for the timber industry, and the city's economy was largely based on the lumber trade. The city was also home to a large naval base during World War II.
Geography
Fernandina Beach is located on Amelia Island, which is situated off the coast of northeastern Florida. The city is bordered by the Atlantic Ocean to the east, the Amelia River to the north, and the Nassau Sound to the south. The city covers an area of 8.3 square miles, and has a population of 12,539 as of the 2010 census.
The city is located in a humid subtropical climate zone, and has hot, humid summers and mild winters. The average temperature in Fernandina Beach is 73°F, and the average annual precipitation is 54 inches.
Economy
Fernandina Beach's economy is largely based on tourism, with many visitors coming to the city to enjoy its beaches, historic downtown district, and other attractions. The city is also home to a number of businesses, including restaurants, retail stores, and professional services.
The city is also home to a number of manufacturing companies, including a paper mill, a boat building company, and a seafood processing plant. The city is also home to a number of military installations, including Naval Air Station Jacksonville and Naval Submarine Base Kings Bay.
Demographics
As of the 2010 census, Fernandina Beach had a population of 12,539. The racial makeup of the city was 79.2% White, 14.3% African American, 0.7% Native American, 1.7% Asian, 0.1% Pacific Islander, 1.7% from other races, and 2.1% from two or more races. Hispanic or Latino of any race were 5.3% of the population.
The median household income in Fernandina Beach was $45,837, and the median family income was $54,837. The per capita income for the city was $27,837. About 11.3% of the population was below the poverty line.
Common Questions
What is Per Capita Income in Fernandina Beach?
Per Capita income in Fernandina Beach is $58,231.
What is the Median Family Income in Fernandina Beach?
Median Family Income in Fernandina Beach is $108,320.
What is the Median Household income in Fernandina Beach?
Median Household Income in Fernandina Beach is $86,494.
What is Income or Wage Gap in Fernandina Beach?
Income or Wage Gap in Fernandina Beach is 33.5%.
Women in Fernandina Beach earn 66.5 cents for every dollar earned by a man.
What is Family Income Deficit in Fernandina Beach?
Family Income Deficit in Fernandina Beach is $8,040.
Families that are below poverty line in Fernandina Beach earn $8,040 less on average than the poverty threshold level.
What is Inequality or Gini Index in Fernandina Beach?
Inequality or Gini Index in Fernandina Beach is 0.49.
What is the Total Population of Fernandina Beach?
Total Population of Fernandina Beach is 13,028.
What is the Total Male Population of Fernandina Beach?
Total Male Population of Fernandina Beach is 6,319.
What is the Total Female Population of Fernandina Beach?
Total Female Population of Fernandina Beach is 6,709.
What is the Ratio of Males per 100 Females in Fernandina Beach?
There are 94.19 Males per 100 Females in Fernandina Beach.
What is the Ratio of Females per 100 Males in Fernandina Beach?
There are 106.17 Females per 100 Males in Fernandina Beach.
What is the Median Population Age in Fernandina Beach?
Median Population Age in Fernandina Beach is 57.6 Years.
What is the Average Family Size in Fernandina Beach
Average Family Size in Fernandina Beach is 2.7 People.
What is the Average Household Size in Fernandina Beach
Average Household Size in Fernandina Beach is 2.1 People.
How Large is the Labor Force in Fernandina Beach?
There are 6,164 People in the Labor Forcein in Fernandina Beach.
What is the Percentage of People in the Labor Force in Fernandina Beach?
52.7% of People are in the Labor Force in Fernandina Beach.
What is the Unemployment Rate in Fernandina Beach?
Unemployment Rate in Fernandina Beach is 2.9%.