Seminole GED/Equivalency
COMPARE
Seminole
Select to Compare
GED/Equivalency
Seminole GED/Equivalency
82.8%
GED/EQUIVALENCY
0.1/ 100
METRIC RATING
275th/ 347
METRIC RANK
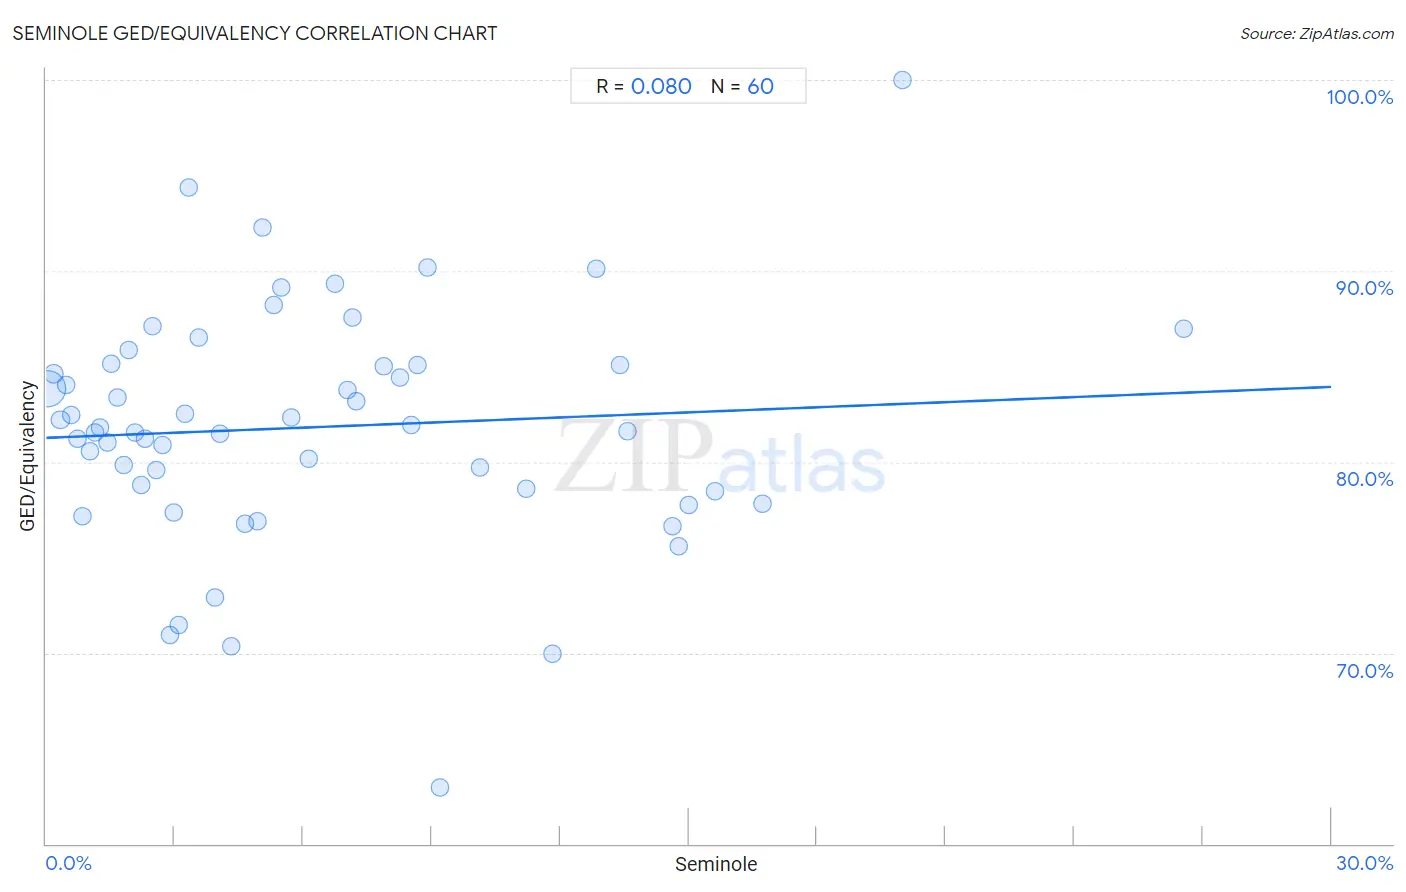
Seminole GED/Equivalency Correlation Chart
The statistical analysis conducted on geographies consisting of 118,314,162 people shows a slight positive correlation between the proportion of Seminole and percentage of population with at least ged/equivalency education in the United States with a correlation coefficient (R) of 0.080 and weighted average of 82.8%. On average, for every 1% (one percent) increase in Seminole within a typical geography, there is an increase of 0.089% in percentage of population with at least ged/equivalency education.
It is essential to understand that the correlation between the percentage of Seminole and percentage of population with at least ged/equivalency education does not imply a direct cause-and-effect relationship. It remains uncertain whether the presence of Seminole influences an upward or downward trend in the level of percentage of population with at least ged/equivalency education within an area, or if Seminole simply ended up residing in those areas with higher or lower levels of percentage of population with at least ged/equivalency education due to other factors.
Demographics Similar to Seminole by GED/Equivalency
In terms of ged/equivalency, the demographic groups most similar to Seminole are Black/African American (82.8%, a difference of 0.020%), Arapaho (82.8%, a difference of 0.040%), Immigrants from Trinidad and Tobago (82.8%, a difference of 0.060%), Immigrants from Laos (82.7%, a difference of 0.070%), and Pennsylvania German (82.9%, a difference of 0.080%).
| Demographics | Rating | Rank | GED/Equivalency |
| Immigrants from Burma/Myanmar | 0.2 /100 | #268 | Tragic 83.0% |
| Hopi | 0.2 /100 | #269 | Tragic 83.0% |
| Immigrants from Jamaica | 0.2 /100 | #270 | Tragic 82.9% |
| U.S. Virgin Islanders | 0.2 /100 | #271 | Tragic 82.9% |
| Barbadians | 0.1 /100 | #272 | Tragic 82.9% |
| Pennsylvania Germans | 0.1 /100 | #273 | Tragic 82.9% |
| Immigrants from Trinidad and Tobago | 0.1 /100 | #274 | Tragic 82.8% |
| Seminole | 0.1 /100 | #275 | Tragic 82.8% |
| Blacks/African Americans | 0.1 /100 | #276 | Tragic 82.8% |
| Arapaho | 0.1 /100 | #277 | Tragic 82.8% |
| Immigrants from Laos | 0.1 /100 | #278 | Tragic 82.7% |
| Immigrants from Fiji | 0.1 /100 | #279 | Tragic 82.7% |
| Cheyenne | 0.1 /100 | #280 | Tragic 82.7% |
| Sioux | 0.1 /100 | #281 | Tragic 82.6% |
| Immigrants | 0.1 /100 | #282 | Tragic 82.6% |
Seminole GED/Equivalency Correlation Summary
| Measurement | Seminole Data | GED/Equivalency Data |
| Minimum | 0.021% | 63.0% |
| Maximum | 26.6% | 100.0% |
| Range | 26.5% | 37.0% |
| Mean | 6.2% | 81.8% |
| Median | 4.5% | 81.7% |
| Interquartile 25% (IQ1) | 2.0% | 78.5% |
| Interquartile 75% (IQ3) | 8.8% | 85.1% |
| Interquartile Range (IQR) | 6.8% | 6.5% |
| Standard Deviation (Sample) | 5.6% | 6.2% |
| Standard Deviation (Population) | 5.6% | 6.1% |
Correlation Details
| Seminole Percentile | Sample Size | GED/Equivalency |
[ 0.0% - 0.5% ] 0.021% | 107,220,258 | 83.8% |
[ 0.0% - 0.5% ] 0.18% | 6,405,917 | 84.6% |
[ 0.0% - 0.5% ] 0.33% | 2,259,380 | 82.2% |
[ 0.0% - 0.5% ] 0.46% | 924,362 | 84.0% |
[ 0.5% - 1.0% ] 0.58% | 467,574 | 82.5% |
[ 0.5% - 1.0% ] 0.73% | 194,343 | 81.2% |
[ 0.5% - 1.0% ] 0.84% | 151,779 | 77.2% |
[ 1.0% - 1.5% ] 1.02% | 124,575 | 80.6% |
[ 1.0% - 1.5% ] 1.13% | 179,231 | 81.6% |
[ 1.0% - 1.5% ] 1.25% | 63,479 | 81.8% |
[ 1.0% - 1.5% ] 1.42% | 30,407 | 81.0% |
[ 1.5% - 2.0% ] 1.52% | 14,866 | 85.2% |
[ 1.5% - 2.0% ] 1.67% | 25,341 | 83.3% |
[ 1.5% - 2.0% ] 1.81% | 61,754 | 79.8% |
[ 1.5% - 2.0% ] 1.92% | 7,561 | 85.9% |
[ 2.0% - 2.5% ] 2.07% | 41,984 | 81.5% |
[ 2.0% - 2.5% ] 2.22% | 22,385 | 78.8% |
[ 2.0% - 2.5% ] 2.30% | 22,869 | 81.2% |
[ 2.0% - 2.5% ] 2.48% | 6,282 | 87.1% |
[ 2.5% - 3.0% ] 2.57% | 1,787 | 79.5% |
[ 2.5% - 3.0% ] 2.72% | 4,003 | 80.9% |
[ 2.5% - 3.0% ] 2.90% | 9,350 | 71.0% |
[ 2.5% - 3.0% ] 2.96% | 6,920 | 77.4% |
[ 3.0% - 3.5% ] 3.11% | 9,976 | 71.4% |
[ 3.0% - 3.5% ] 3.23% | 4,178 | 82.5% |
[ 3.0% - 3.5% ] 3.33% | 60 | 94.3% |
[ 3.5% - 4.0% ] 3.56% | 3,964 | 86.5% |
[ 3.5% - 4.0% ] 3.93% | 280 | 72.9% |
[ 4.0% - 4.5% ] 4.05% | 2,422 | 81.5% |
[ 4.0% - 4.5% ] 4.31% | 116 | 70.3% |
[ 4.5% - 5.0% ] 4.63% | 216 | 76.7% |
[ 4.5% - 5.0% ] 4.94% | 162 | 76.9% |
[ 5.0% - 5.5% ] 5.06% | 257 | 92.3% |
[ 5.0% - 5.5% ] 5.32% | 1,110 | 88.2% |
[ 5.0% - 5.5% ] 5.48% | 292 | 89.1% |
[ 5.5% - 6.0% ] 5.71% | 403 | 82.3% |
[ 6.0% - 6.5% ] 6.12% | 245 | 80.1% |
[ 6.5% - 7.0% ] 6.73% | 1,367 | 89.3% |
[ 7.0% - 7.5% ] 7.03% | 313 | 83.8% |
[ 7.0% - 7.5% ] 7.14% | 168 | 87.6% |
[ 7.0% - 7.5% ] 7.23% | 1,190 | 83.2% |
[ 7.5% - 8.0% ] 7.89% | 1,166 | 85.0% |
[ 8.0% - 8.5% ] 8.25% | 1,805 | 84.4% |
[ 8.5% - 9.0% ] 8.51% | 188 | 81.9% |
[ 8.5% - 9.0% ] 8.67% | 2,019 | 85.1% |
[ 8.5% - 9.0% ] 8.89% | 405 | 90.2% |
[ 9.0% - 9.5% ] 9.20% | 174 | 63.0% |
[ 10.0% - 10.5% ] 10.11% | 445 | 79.7% |
[ 11.0% - 11.5% ] 11.19% | 12,329 | 78.6% |
[ 11.5% - 12.0% ] 11.83% | 372 | 70.0% |
[ 12.5% - 13.0% ] 12.84% | 958 | 90.1% |
[ 13.0% - 13.5% ] 13.40% | 2,887 | 85.1% |
[ 13.5% - 14.0% ] 13.57% | 5,578 | 81.6% |
[ 14.5% - 15.0% ] 14.63% | 1,169 | 76.6% |
[ 14.5% - 15.0% ] 14.77% | 7,144 | 75.6% |
[ 15.0% - 15.5% ] 15.01% | 3,124 | 77.8% |
[ 15.5% - 16.0% ] 15.60% | 564 | 78.5% |
[ 16.5% - 17.0% ] 16.73% | 550 | 77.8% |
[ 20.0% - 20.5% ] 20.00% | 95 | 100.0% |
[ 26.5% - 27.0% ] 26.56% | 64 | 87.0% |