Seminole 2 or more Vehicles in Household
COMPARE
Seminole
Select to Compare
2 or more Vehicles in Household
Seminole 2 or more Vehicles in Household
56.2%
2+ VEHICLES AVAILABLE
81.7/ 100
METRIC RATING
143rd/ 347
METRIC RANK
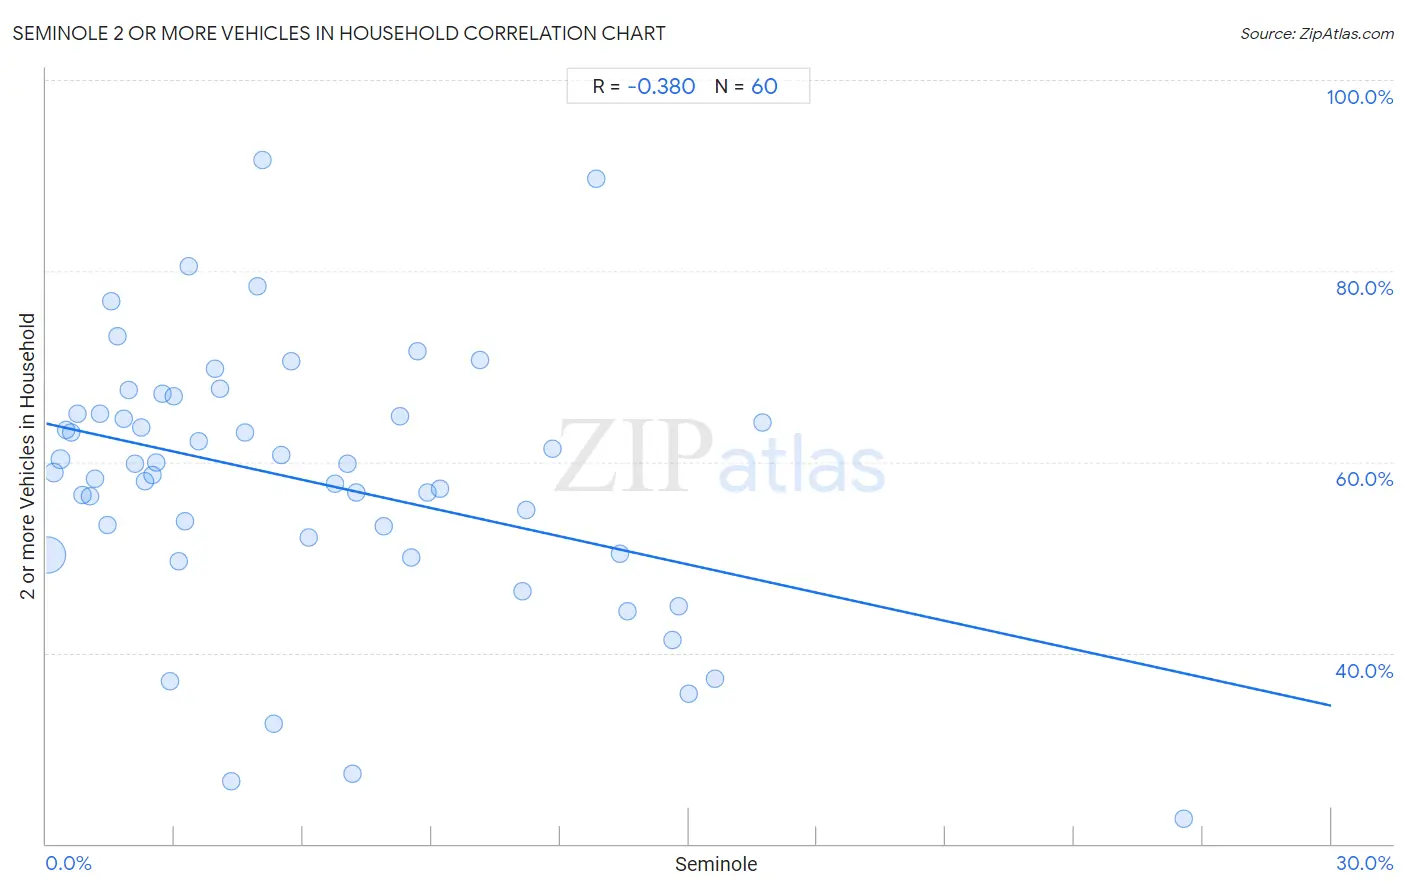
Seminole 2 or more Vehicles in Household Correlation Chart
The statistical analysis conducted on geographies consisting of 118,307,027 people shows a mild negative correlation between the proportion of Seminole and percentage of households with 2 or more vehicles available in the United States with a correlation coefficient (R) of -0.380 and weighted average of 56.2%. On average, for every 1% (one percent) increase in Seminole within a typical geography, there is a decrease of 0.98% in percentage of households with 2 or more vehicles available.
It is essential to understand that the correlation between the percentage of Seminole and percentage of households with 2 or more vehicles available does not imply a direct cause-and-effect relationship. It remains uncertain whether the presence of Seminole influences an upward or downward trend in the level of percentage of households with 2 or more vehicles available within an area, or if Seminole simply ended up residing in those areas with higher or lower levels of percentage of households with 2 or more vehicles available due to other factors.
Demographics Similar to Seminole by 2 or more Vehicles in Household
In terms of 2 or more vehicles in household, the demographic groups most similar to Seminole are Immigrants from Syria (56.2%, a difference of 0.020%), Syrian (56.2%, a difference of 0.030%), Venezuelan (56.1%, a difference of 0.070%), South African (56.2%, a difference of 0.090%), and Serbian (56.1%, a difference of 0.090%).
| Demographics | Rating | Rank | 2 or more Vehicles in Household |
| Immigrants from Asia | 86.0 /100 | #136 | Excellent 56.3% |
| Cubans | 84.8 /100 | #137 | Excellent 56.3% |
| Salvadorans | 84.7 /100 | #138 | Excellent 56.3% |
| Armenians | 84.3 /100 | #139 | Excellent 56.3% |
| Latvians | 83.6 /100 | #140 | Excellent 56.2% |
| Immigrants from Cambodia | 83.6 /100 | #141 | Excellent 56.2% |
| South Africans | 83.1 /100 | #142 | Excellent 56.2% |
| Seminole | 81.7 /100 | #143 | Excellent 56.2% |
| Immigrants from Syria | 81.4 /100 | #144 | Excellent 56.2% |
| Syrians | 81.2 /100 | #145 | Excellent 56.2% |
| Venezuelans | 80.7 /100 | #146 | Excellent 56.1% |
| Serbians | 80.3 /100 | #147 | Excellent 56.1% |
| Immigrants from Moldova | 80.2 /100 | #148 | Excellent 56.1% |
| Chileans | 80.2 /100 | #149 | Excellent 56.1% |
| Nicaraguans | 79.9 /100 | #150 | Good 56.1% |
Seminole 2 or more Vehicles in Household Correlation Summary
| Measurement | Seminole Data | 2 or more Vehicles in Household Data |
| Minimum | 0.021% | 22.6% |
| Maximum | 26.6% | 91.7% |
| Range | 26.5% | 69.1% |
| Mean | 6.1% | 58.0% |
| Median | 4.5% | 59.3% |
| Interquartile 25% (IQ1) | 2.0% | 51.3% |
| Interquartile 75% (IQ3) | 8.8% | 65.0% |
| Interquartile Range (IQR) | 6.8% | 13.7% |
| Standard Deviation (Sample) | 5.4% | 13.9% |
| Standard Deviation (Population) | 5.3% | 13.8% |
Correlation Details
| Seminole Percentile | Sample Size | 2 or more Vehicles in Household |
[ 0.0% - 0.5% ] 0.021% | 107,220,258 | 50.2% |
[ 0.0% - 0.5% ] 0.18% | 6,405,917 | 58.9% |
[ 0.0% - 0.5% ] 0.33% | 2,256,309 | 60.3% |
[ 0.0% - 0.5% ] 0.46% | 921,162 | 63.4% |
[ 0.5% - 1.0% ] 0.58% | 466,751 | 63.1% |
[ 0.5% - 1.0% ] 0.73% | 194,343 | 65.0% |
[ 0.5% - 1.0% ] 0.84% | 151,779 | 56.6% |
[ 1.0% - 1.5% ] 1.02% | 124,575 | 56.4% |
[ 1.0% - 1.5% ] 1.13% | 179,231 | 58.2% |
[ 1.0% - 1.5% ] 1.25% | 63,479 | 65.0% |
[ 1.0% - 1.5% ] 1.42% | 30,407 | 53.3% |
[ 1.5% - 2.0% ] 1.52% | 14,866 | 76.8% |
[ 1.5% - 2.0% ] 1.67% | 25,341 | 73.2% |
[ 1.5% - 2.0% ] 1.81% | 61,754 | 64.6% |
[ 1.5% - 2.0% ] 1.92% | 7,561 | 67.5% |
[ 2.0% - 2.5% ] 2.07% | 41,984 | 59.7% |
[ 2.0% - 2.5% ] 2.22% | 22,385 | 63.6% |
[ 2.0% - 2.5% ] 2.30% | 22,869 | 58.0% |
[ 2.0% - 2.5% ] 2.48% | 6,282 | 58.6% |
[ 2.5% - 3.0% ] 2.57% | 1,787 | 59.9% |
[ 2.5% - 3.0% ] 2.72% | 4,003 | 67.2% |
[ 2.5% - 3.0% ] 2.90% | 9,350 | 37.0% |
[ 2.5% - 3.0% ] 2.96% | 6,920 | 66.9% |
[ 3.0% - 3.5% ] 3.11% | 9,976 | 49.6% |
[ 3.0% - 3.5% ] 3.23% | 4,178 | 53.8% |
[ 3.0% - 3.5% ] 3.33% | 60 | 80.5% |
[ 3.5% - 4.0% ] 3.56% | 3,964 | 62.1% |
[ 3.5% - 4.0% ] 3.93% | 280 | 69.7% |
[ 4.0% - 4.5% ] 4.05% | 2,422 | 67.7% |
[ 4.0% - 4.5% ] 4.31% | 116 | 26.5% |
[ 4.5% - 5.0% ] 4.63% | 216 | 63.0% |
[ 4.5% - 5.0% ] 4.94% | 162 | 78.5% |
[ 5.0% - 5.5% ] 5.06% | 257 | 91.7% |
[ 5.0% - 5.5% ] 5.32% | 1,110 | 32.5% |
[ 5.0% - 5.5% ] 5.48% | 292 | 60.7% |
[ 5.5% - 6.0% ] 5.71% | 403 | 70.5% |
[ 6.0% - 6.5% ] 6.12% | 245 | 52.1% |
[ 6.5% - 7.0% ] 6.73% | 1,367 | 57.8% |
[ 7.0% - 7.5% ] 7.03% | 313 | 59.8% |
[ 7.0% - 7.5% ] 7.14% | 168 | 27.3% |
[ 7.0% - 7.5% ] 7.23% | 1,190 | 56.8% |
[ 7.5% - 8.0% ] 7.89% | 1,166 | 53.2% |
[ 8.0% - 8.5% ] 8.25% | 1,805 | 64.8% |
[ 8.5% - 9.0% ] 8.51% | 188 | 50.0% |
[ 8.5% - 9.0% ] 8.67% | 2,019 | 71.6% |
[ 8.5% - 9.0% ] 8.89% | 405 | 56.8% |
[ 9.0% - 9.5% ] 9.20% | 174 | 57.1% |
[ 10.0% - 10.5% ] 10.11% | 445 | 70.6% |
[ 11.0% - 11.5% ] 11.11% | 54 | 46.4% |
[ 11.0% - 11.5% ] 11.19% | 12,329 | 54.9% |
[ 11.5% - 12.0% ] 11.83% | 372 | 61.4% |
[ 12.5% - 13.0% ] 12.84% | 958 | 89.6% |
[ 13.0% - 13.5% ] 13.40% | 2,887 | 50.4% |
[ 13.5% - 14.0% ] 13.57% | 5,578 | 44.3% |
[ 14.5% - 15.0% ] 14.63% | 1,169 | 41.4% |
[ 14.5% - 15.0% ] 14.77% | 7,144 | 44.9% |
[ 15.0% - 15.5% ] 15.01% | 3,124 | 35.7% |
[ 15.5% - 16.0% ] 15.60% | 564 | 37.3% |
[ 16.5% - 17.0% ] 16.73% | 550 | 64.1% |
[ 26.5% - 27.0% ] 26.56% | 64 | 22.6% |