Seminole 4 or more Vehicles in Household

COMPARE

Seminole
Race
Ancestry
AfghanAfricanAlaska NativeAlaskan AthabascanAlbanianAleutAlsatianAmericanApacheArabArapahoArgentineanArmenianAssyrian/Chaldean/SyriacAustralianAustrianBahamianBangladeshiBarbadianBasqueBelgianBelizeanBermudanBhutaneseBlackfeetBolivianBrazilianBritishBritish West IndianBulgarianBurmeseCajunCambodianCanadianCape VerdeanCarpatho RusynCelticCentral AmericanCentral American IndianCherokeeCheyenneChickasawChileanChineseChippewaChoctawColombianColvilleComancheCosta RicanCreeCreekCroatianCrowCubanCypriotCzechCzechoslovakianDanishDelawareDominicanDutchDutch West IndianEastern EuropeanEcuadorianEgyptianEnglishEstonianEthiopianEuropeanFijianFilipinoFinnishFrenchFrench American IndianFrench CanadianGermanGerman RussianGhanaianGreekGuamanian/ChamorroGuatemalanGuyaneseHaitianHmongHonduranHopiHoumaHungarianIcelanderIndian (Asian)IndonesianInupiatIranianIraqiIrishIroquoisIsraeliItalianJamaicanJapaneseJordanianKenyanKiowaKoreanLaotianLatvianLebaneseLiberianLithuanianLumbeeLuxembourgerMacedonianMalaysianMalteseMarshalleseMenomineeMexicanMexican American IndianMongolianMoroccanNative HawaiianNavajoNepaleseNew ZealanderNicaraguanNigerianNorthern EuropeanNorwegianOkinawanOsageOttawaPaiutePakistaniPalestinianPanamanianParaguayanPennsylvania GermanPeruvianPimaPolishPortuguesePotawatomiPuebloPuerto RicanPuget Sound SalishRomanianRussianSalvadoranSamoanScandinavianScotch-IrishScottishSeminoleSenegaleseSerbianShoshoneSierra LeoneanSiouxSlavicSlovakSloveneSomaliSouth AfricanSouth AmericanSouth American IndianSoviet UnionSpaniardSpanishSpanish AmericanSpanish American IndianSri LankanSubsaharan AfricanSudaneseSwedishSwissSyrianTaiwaneseThaiTlingit-HaidaTohono O'OdhamTonganTrinidadian and TobagonianTsimshianTurkishU.S. Virgin IslanderUgandanUkrainianUruguayanUteVenezuelanVietnameseWelshWest IndianYakamaYaquiYugoslavianYumanYup'ikZimbabwean
Immigration
NonimmigrantsImmigrantsAfghanistanAfricaAlbaniaArgentinaArmeniaAsiaAustraliaAustriaBahamasBangladeshBarbadosBelarusBelgiumBelizeBoliviaBosnia and HerzegovinaBrazilBulgariaBurma/MyanmarCabo VerdeCambodiaCameroonCanadaCaribbeanCentral AmericaChileChinaColombiaCongoCosta RicaCroatiaCubaCzechoslovakiaDenmarkDominicaDominican RepublicEastern AfricaEastern AsiaEastern EuropeEcuadorEgyptEl SalvadorEnglandEritreaEthiopiaEuropeFijiFranceGermanyGhanaGreeceGrenadaGuatemalaGuyanaHaitiHondurasHong KongHungaryIndiaIndonesiaIranIraqIrelandIsraelItalyJamaicaJapanJordanKazakhstanKenyaKoreaKuwaitLaosLatin AmericaLatviaLebanonLiberiaLithuaniaMalaysiaMexicoMicronesiaMiddle AfricaMoldovaMoroccoNepalNetherlandsNicaraguaNigeriaNorth AmericaNorth MacedoniaNorthern AfricaNorthern EuropeNorwayOceaniaPakistanPanamaPeruPhilippinesPolandPortugalRomaniaRussiaSaudi ArabiaScotlandSenegalSerbiaSierra LeoneSingaporeSomaliaSouth AfricaSouth AmericaSouth Central AsiaSouth Eastern AsiaSouthern EuropeSpainSri LankaSt. Vincent and the GrenadinesSudanSwedenSwitzerlandSyriaTaiwanThailandTrinidad and TobagoTurkeyUgandaUkraineUruguayUzbekistanVenezuelaVietnamWest IndiesWestern AfricaWestern AsiaWestern EuropeYemenZaireZimbabweAzores
Select to Compare
Race
Ancestry
AfghanAfricanAlaska NativeAlaskan AthabascanAlbanianAleutAlsatianAmericanApacheArabArapahoArgentineanArmenianAssyrian/Chaldean/SyriacAustralianAustrianBahamianBangladeshiBarbadianBasqueBelgianBelizeanBermudanBhutaneseBlackfeetBolivianBrazilianBritishBritish West IndianBulgarianBurmeseCajunCambodianCanadianCape VerdeanCarpatho RusynCelticCentral AmericanCentral American IndianCherokeeCheyenneChickasawChileanChineseChippewaChoctawColombianColvilleComancheCosta RicanCreeCreekCroatianCrowCubanCypriotCzechCzechoslovakianDanishDelawareDominicanDutchDutch West IndianEastern EuropeanEcuadorianEgyptianEnglishEstonianEthiopianEuropeanFijianFilipinoFinnishFrenchFrench American IndianFrench CanadianGermanGerman RussianGhanaianGreekGuamanian/ChamorroGuatemalanGuyaneseHaitianHmongHonduranHopiHoumaHungarianIcelanderIndian (Asian)IndonesianInupiatIranianIraqiIrishIroquoisIsraeliItalianJamaicanJapaneseJordanianKenyanKiowaKoreanLaotianLatvianLebaneseLiberianLithuanianLumbeeLuxembourgerMacedonianMalaysianMalteseMarshalleseMenomineeMexicanMexican American IndianMongolianMoroccanNative HawaiianNavajoNepaleseNew ZealanderNicaraguanNigerianNorthern EuropeanNorwegianOkinawanOsageOttawaPaiutePakistaniPalestinianPanamanianParaguayanPennsylvania GermanPeruvianPimaPolishPortuguesePotawatomiPuebloPuerto RicanPuget Sound SalishRomanianRussianSalvadoranSamoanScandinavianScotch-IrishScottishSenegaleseSerbianShoshoneSierra LeoneanSiouxSlavicSlovakSloveneSomaliSouth AfricanSouth AmericanSouth American IndianSoviet UnionSpaniardSpanishSpanish AmericanSpanish American IndianSri LankanSubsaharan AfricanSudaneseSwedishSwissSyrianTaiwaneseThaiTlingit-HaidaTohono O'OdhamTonganTrinidadian and TobagonianTsimshianTurkishU.S. Virgin IslanderUgandanUkrainianUruguayanUteVenezuelanVietnameseWelshWest IndianYakamaYaquiYugoslavianYumanYup'ikZimbabwean
Immigration
NonimmigrantsImmigrantsAfghanistanAfricaAlbaniaArgentinaArmeniaAsiaAustraliaAustriaBahamasBangladeshBarbadosBelarusBelgiumBelizeBoliviaBosnia and HerzegovinaBrazilBulgariaBurma/MyanmarCabo VerdeCambodiaCameroonCanadaCaribbeanCentral AmericaChileChinaColombiaCongoCosta RicaCroatiaCubaCzechoslovakiaDenmarkDominicaDominican RepublicEastern AfricaEastern AsiaEastern EuropeEcuadorEgyptEl SalvadorEnglandEritreaEthiopiaEuropeFijiFranceGermanyGhanaGreeceGrenadaGuatemalaGuyanaHaitiHondurasHong KongHungaryIndiaIndonesiaIranIraqIrelandIsraelItalyJamaicaJapanJordanKazakhstanKenyaKoreaKuwaitLaosLatin AmericaLatviaLebanonLiberiaLithuaniaMalaysiaMexicoMicronesiaMiddle AfricaMoldovaMoroccoNepalNetherlandsNicaraguaNigeriaNorth AmericaNorth MacedoniaNorthern AfricaNorthern EuropeNorwayOceaniaPakistanPanamaPeruPhilippinesPolandPortugalRomaniaRussiaSaudi ArabiaScotlandSenegalSerbiaSierra LeoneSingaporeSomaliaSouth AfricaSouth AmericaSouth Central AsiaSouth Eastern AsiaSouthern EuropeSpainSri LankaSt. Vincent and the GrenadinesSudanSwedenSwitzerlandSyriaTaiwanThailandTrinidad and TobagoTurkeyUgandaUkraineUruguayUzbekistanVenezuelaVietnamWest IndiesWestern AfricaWestern AsiaWestern EuropeYemenZaireZimbabweAzores
4 or more Vehicles in Household
Income
Poverty
Unemployment
Labor Participation
Family Structure
Vehicle Availability
Education Level
Disability

Seminole 4 or more Vehicles in Household
Exceptional

7.0%
4+ VEHICLES AVAILABLE
98.8/ 100
METRIC RATING
99th/ 347
METRIC RANK

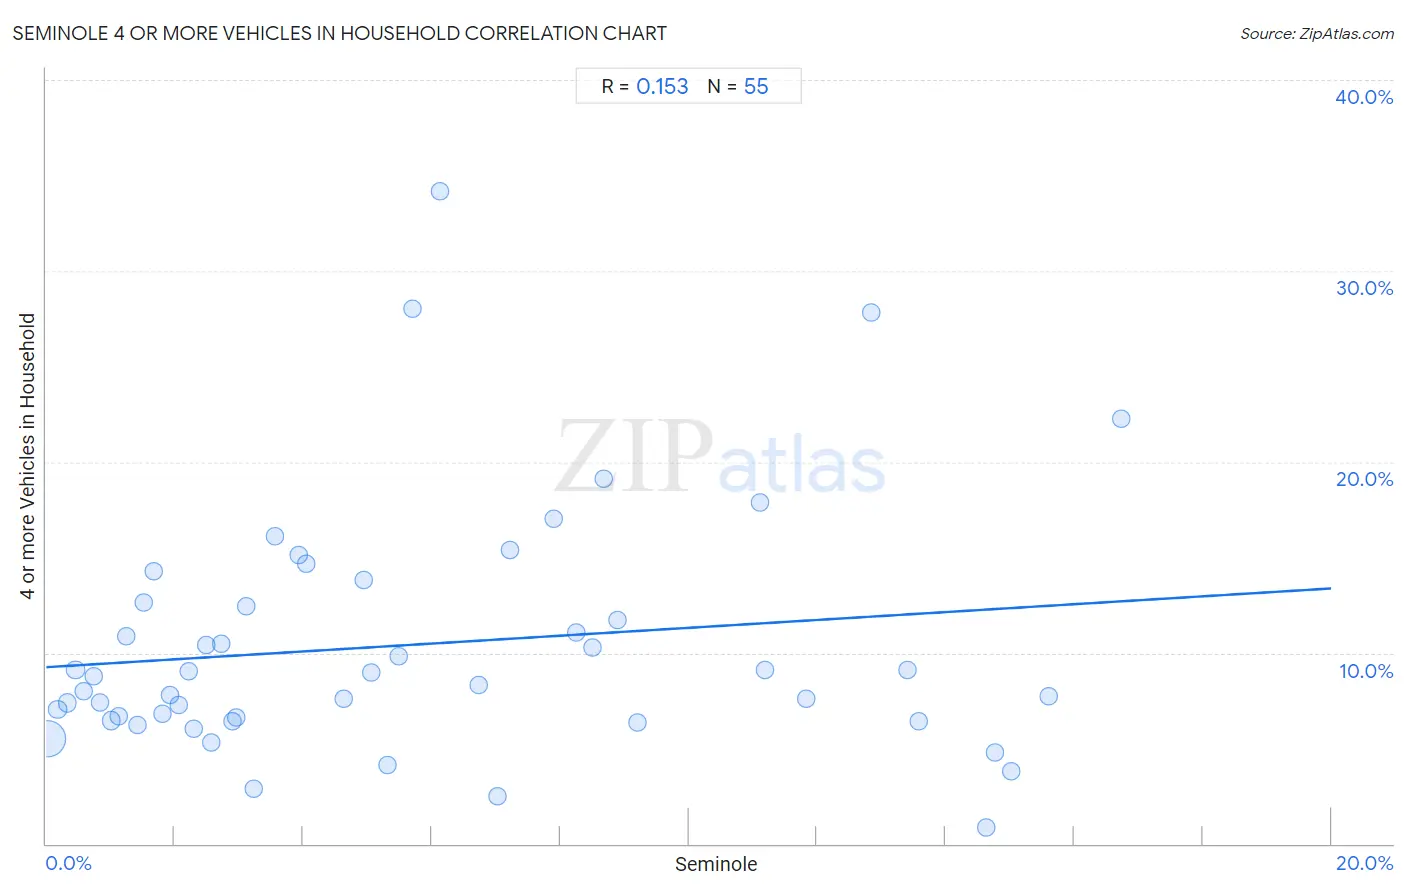
Seminole 4 or more Vehicles in Household Correlation Chart

The statistical analysis conducted on geographies consisting of 118,205,543 people shows a poor positive correlation between the proportion of Seminole and percentage of households with 4 or more vehicles available in the United States with a correlation coefficient (R) of 0.153 and weighted average of 7.0%. On average, for every 1% (one percent) increase in Seminole within a typical geography, there is an increase of 0.21% in percentage of households with 4 or more vehicles available.
Seminole 4 or more Vehicles in Household
It is essential to understand that the correlation between the percentage of Seminole and percentage of households with 4 or more vehicles available does not imply a direct cause-and-effect relationship. It remains uncertain whether the presence of Seminole influences an upward or downward trend in the level of percentage of households with 4 or more vehicles available within an area, or if Seminole simply ended up residing in those areas with higher or lower levels of percentage of households with 4 or more vehicles available due to other factors.

Demographics Similar to Seminole by 4 or more Vehicles in Household

In terms of 4 or more vehicles in household, the demographic groups most similar to Seminole are Taiwanese (7.0%, a difference of 0.080%), Pakistani (7.0%, a difference of 0.15%), Asian (7.0%, a difference of 0.21%), Blackfeet (7.0%, a difference of 0.22%), and Irish (7.1%, a difference of 0.44%).
DemographicsRating | Rank4 or more Vehicles in Household
Immigrants from Latin America
99.4
/100
|
#92
Exceptional
7.1%
Immigrants from Afghanistan
99.3
/100
|
#93
Exceptional
7.1%
Dutch West Indians
99.3
/100
|
#94
Exceptional
7.1%
Czechoslovakians
99.3
/100
|
#95
Exceptional
7.1%
Central Americans
99.3
/100
|
#96
Exceptional
7.1%
Celtics
99.1
/100
|
#97
Exceptional
7.1%
Irish
99.0
/100
|
#98
Exceptional
7.1%
Seminole
98.8
/100
|
#99
Exceptional
7.0%
Taiwanese
98.7
/100
|
#100
Exceptional
7.0%
Pakistanis
98.7
/100
|
#101
Exceptional
7.0%
Asians
98.6
/100
|
#102
Exceptional
7.0%
Blackfeet
98.6
/100
|
#103
Exceptional
7.0%
Hmong
98.3
/100
|
#104
Exceptional
7.0%
German Russians
98.3
/100
|
#105
Exceptional
7.0%
Guatemalans
98.1
/100
|
#106
Exceptional
7.0%

Seminole 4 or more Vehicles in Household Correlation Summary

MeasurementSeminole Data4 or more Vehicles in Household Data
Minimum0.021%0.87%
Maximum16.7%34.2%
Range16.7%33.3%
Mean5.7%10.4%
Median4.0%8.8%
Interquartile 25% (IQ1)1.8%6.4%
Interquartile 75% (IQ3)8.7%12.6%
Interquartile Range (IQR)6.9%6.2%
Standard Deviation (Sample)4.8%6.4%
Standard Deviation (Population)4.7%6.4%

Correlation Details

Seminole PercentileSample Size4 or more Vehicles in Household
[
0.0%
-
0.5%
]
0.021%
107,151,8355.5%
[
0.0%
-
0.5%
]
0.18%
6,376,3167.0%
[
0.0%
-
0.5%
]
0.33%
2,255,4577.4%
[
0.0%
-
0.5%
]
0.46%
921,1629.1%
[
0.5%
-
1.0%
]
0.58%
466,7518.0%
[
0.5%
-
1.0%
]
0.73%
194,3438.8%
[
0.5%
-
1.0%
]
0.84%
151,4357.4%
[
1.0%
-
1.5%
]
1.02%
124,5756.4%
[
1.0%
-
1.5%
]
1.13%
178,2886.7%
[
1.0%
-
1.5%
]
1.25%
63,47910.8%
[
1.0%
-
1.5%
]
1.42%
30,4076.2%
[
1.5%
-
2.0%
]
1.52%
14,86612.6%
[
1.5%
-
2.0%
]
1.67%
25,34114.3%
[
1.5%
-
2.0%
]
1.81%
61,7546.8%
[
1.5%
-
2.0%
]
1.92%
7,5617.8%
[
2.0%
-
2.5%
]
2.07%
41,9847.3%
[
2.0%
-
2.5%
]
2.22%
22,1149.0%
[
2.0%
-
2.5%
]
2.30%
22,8696.0%
[
2.0%
-
2.5%
]
2.48%
6,28210.4%
[
2.5%
-
3.0%
]
2.57%
1,7875.3%
[
2.5%
-
3.0%
]
2.72%
4,00310.5%
[
2.5%
-
3.0%
]
2.90%
9,2816.4%
[
2.5%
-
3.0%
]
2.96%
6,9206.6%
[
3.0%
-
3.5%
]
3.11%
9,84812.5%
[
3.0%
-
3.5%
]
3.23%
4,1782.9%
[
3.5%
-
4.0%
]
3.56%
3,96416.1%
[
3.5%
-
4.0%
]
3.93%
28015.1%
[
4.0%
-
4.5%
]
4.05%
2,42214.6%
[
4.5%
-
5.0%
]
4.63%
2167.6%
[
4.5%
-
5.0%
]
4.94%
16213.8%
[
5.0%
-
5.5%
]
5.06%
2579.0%
[
5.0%
-
5.5%
]
5.32%
1,1104.1%
[
5.0%
-
5.5%
]
5.48%
2929.8%
[
5.5%
-
6.0%
]
5.71%
40328.0%
[
6.0%
-
6.5%
]
6.12%
24534.2%
[
6.5%
-
7.0%
]
6.73%
1,3678.3%
[
7.0%
-
7.5%
]
7.03%
3132.5%
[
7.0%
-
7.5%
]
7.23%
1,19015.4%
[
7.5%
-
8.0%
]
7.89%
1,16617.0%
[
8.0%
-
8.5%
]
8.25%
1,80511.1%
[
8.5%
-
9.0%
]
8.51%
18810.3%
[
8.5%
-
9.0%
]
8.67%
2,01919.1%
[
8.5%
-
9.0%
]
8.89%
40511.7%
[
9.0%
-
9.5%
]
9.20%
1746.3%
[
11.0%
-
11.5%
]
11.11%
5417.9%
[
11.0%
-
11.5%
]
11.19%
12,3299.1%
[
11.5%
-
12.0%
]
11.83%
3727.6%
[
12.5%
-
13.0%
]
12.84%
95827.9%
[
13.0%
-
13.5%
]
13.40%
2,8879.1%
[
13.5%
-
14.0%
]
13.57%
5,5786.4%
[
14.5%
-
15.0%
]
14.63%
1,1690.87%
[
14.5%
-
15.0%
]
14.77%
7,1444.8%
[
15.0%
-
15.5%
]
15.01%
3,1243.8%
[
15.5%
-
16.0%
]
15.60%
5647.7%
[
16.5%
-
17.0%
]
16.73%
55022.3%