Seminole Wage/Income Gap

COMPARE

Seminole
Race
Ancestry
AfghanAfricanAlaska NativeAlaskan AthabascanAlbanianAleutAlsatianAmericanApacheArabArapahoArgentineanArmenianAssyrian/Chaldean/SyriacAustralianAustrianBahamianBangladeshiBarbadianBasqueBelgianBelizeanBermudanBhutaneseBlackfeetBolivianBrazilianBritishBritish West IndianBulgarianBurmeseCajunCambodianCanadianCape VerdeanCarpatho RusynCelticCentral AmericanCentral American IndianCherokeeCheyenneChickasawChileanChineseChippewaChoctawColombianColvilleComancheCosta RicanCreeCreekCroatianCrowCubanCypriotCzechCzechoslovakianDanishDelawareDominicanDutchDutch West IndianEastern EuropeanEcuadorianEgyptianEnglishEstonianEthiopianEuropeanFijianFilipinoFinnishFrenchFrench American IndianFrench CanadianGermanGerman RussianGhanaianGreekGuamanian/ChamorroGuatemalanGuyaneseHaitianHmongHonduranHopiHoumaHungarianIcelanderIndian (Asian)IndonesianInupiatIranianIraqiIrishIroquoisIsraeliItalianJamaicanJapaneseJordanianKenyanKiowaKoreanLaotianLatvianLebaneseLiberianLithuanianLumbeeLuxembourgerMacedonianMalaysianMalteseMarshalleseMenomineeMexicanMexican American IndianMongolianMoroccanNative HawaiianNavajoNepaleseNew ZealanderNicaraguanNigerianNorthern EuropeanNorwegianOkinawanOsageOttawaPaiutePakistaniPalestinianPanamanianParaguayanPennsylvania GermanPeruvianPimaPolishPortuguesePotawatomiPuebloPuerto RicanPuget Sound SalishRomanianRussianSalvadoranSamoanScandinavianScotch-IrishScottishSeminoleSenegaleseSerbianShoshoneSierra LeoneanSiouxSlavicSlovakSloveneSomaliSouth AfricanSouth AmericanSouth American IndianSoviet UnionSpaniardSpanishSpanish AmericanSpanish American IndianSri LankanSubsaharan AfricanSudaneseSwedishSwissSyrianTaiwaneseThaiTlingit-HaidaTohono O'OdhamTonganTrinidadian and TobagonianTsimshianTurkishU.S. Virgin IslanderUgandanUkrainianUruguayanUteVenezuelanVietnameseWelshWest IndianYakamaYaquiYugoslavianYumanYup'ikZimbabwean
Immigration
NonimmigrantsImmigrantsAfghanistanAfricaAlbaniaArgentinaArmeniaAsiaAustraliaAustriaBahamasBangladeshBarbadosBelarusBelgiumBelizeBoliviaBosnia and HerzegovinaBrazilBulgariaBurma/MyanmarCabo VerdeCambodiaCameroonCanadaCaribbeanCentral AmericaChileChinaColombiaCongoCosta RicaCroatiaCubaCzechoslovakiaDenmarkDominicaDominican RepublicEastern AfricaEastern AsiaEastern EuropeEcuadorEgyptEl SalvadorEnglandEritreaEthiopiaEuropeFijiFranceGermanyGhanaGreeceGrenadaGuatemalaGuyanaHaitiHondurasHong KongHungaryIndiaIndonesiaIranIraqIrelandIsraelItalyJamaicaJapanJordanKazakhstanKenyaKoreaKuwaitLaosLatin AmericaLatviaLebanonLiberiaLithuaniaMalaysiaMexicoMicronesiaMiddle AfricaMoldovaMoroccoNepalNetherlandsNicaraguaNigeriaNorth AmericaNorth MacedoniaNorthern AfricaNorthern EuropeNorwayOceaniaPakistanPanamaPeruPhilippinesPolandPortugalRomaniaRussiaSaudi ArabiaScotlandSenegalSerbiaSierra LeoneSingaporeSomaliaSouth AfricaSouth AmericaSouth Central AsiaSouth Eastern AsiaSouthern EuropeSpainSri LankaSt. Vincent and the GrenadinesSudanSwedenSwitzerlandSyriaTaiwanThailandTrinidad and TobagoTurkeyUgandaUkraineUruguayUzbekistanVenezuelaVietnamWest IndiesWestern AfricaWestern AsiaWestern EuropeYemenZaireZimbabweAzores
Select to Compare
Race
Ancestry
AfghanAfricanAlaska NativeAlaskan AthabascanAlbanianAleutAlsatianAmericanApacheArabArapahoArgentineanArmenianAssyrian/Chaldean/SyriacAustralianAustrianBahamianBangladeshiBarbadianBasqueBelgianBelizeanBermudanBhutaneseBlackfeetBolivianBrazilianBritishBritish West IndianBulgarianBurmeseCajunCambodianCanadianCape VerdeanCarpatho RusynCelticCentral AmericanCentral American IndianCherokeeCheyenneChickasawChileanChineseChippewaChoctawColombianColvilleComancheCosta RicanCreeCreekCroatianCrowCubanCypriotCzechCzechoslovakianDanishDelawareDominicanDutchDutch West IndianEastern EuropeanEcuadorianEgyptianEnglishEstonianEthiopianEuropeanFijianFilipinoFinnishFrenchFrench American IndianFrench CanadianGermanGerman RussianGhanaianGreekGuamanian/ChamorroGuatemalanGuyaneseHaitianHmongHonduranHopiHoumaHungarianIcelanderIndian (Asian)IndonesianInupiatIranianIraqiIrishIroquoisIsraeliItalianJamaicanJapaneseJordanianKenyanKiowaKoreanLaotianLatvianLebaneseLiberianLithuanianLumbeeLuxembourgerMacedonianMalaysianMalteseMarshalleseMenomineeMexicanMexican American IndianMongolianMoroccanNative HawaiianNavajoNepaleseNew ZealanderNicaraguanNigerianNorthern EuropeanNorwegianOkinawanOsageOttawaPaiutePakistaniPalestinianPanamanianParaguayanPennsylvania GermanPeruvianPimaPolishPortuguesePotawatomiPuebloPuerto RicanPuget Sound SalishRomanianRussianSalvadoranSamoanScandinavianScotch-IrishScottishSenegaleseSerbianShoshoneSierra LeoneanSiouxSlavicSlovakSloveneSomaliSouth AfricanSouth AmericanSouth American IndianSoviet UnionSpaniardSpanishSpanish AmericanSpanish American IndianSri LankanSubsaharan AfricanSudaneseSwedishSwissSyrianTaiwaneseThaiTlingit-HaidaTohono O'OdhamTonganTrinidadian and TobagonianTsimshianTurkishU.S. Virgin IslanderUgandanUkrainianUruguayanUteVenezuelanVietnameseWelshWest IndianYakamaYaquiYugoslavianYumanYup'ikZimbabwean
Immigration
NonimmigrantsImmigrantsAfghanistanAfricaAlbaniaArgentinaArmeniaAsiaAustraliaAustriaBahamasBangladeshBarbadosBelarusBelgiumBelizeBoliviaBosnia and HerzegovinaBrazilBulgariaBurma/MyanmarCabo VerdeCambodiaCameroonCanadaCaribbeanCentral AmericaChileChinaColombiaCongoCosta RicaCroatiaCubaCzechoslovakiaDenmarkDominicaDominican RepublicEastern AfricaEastern AsiaEastern EuropeEcuadorEgyptEl SalvadorEnglandEritreaEthiopiaEuropeFijiFranceGermanyGhanaGreeceGrenadaGuatemalaGuyanaHaitiHondurasHong KongHungaryIndiaIndonesiaIranIraqIrelandIsraelItalyJamaicaJapanJordanKazakhstanKenyaKoreaKuwaitLaosLatin AmericaLatviaLebanonLiberiaLithuaniaMalaysiaMexicoMicronesiaMiddle AfricaMoldovaMoroccoNepalNetherlandsNicaraguaNigeriaNorth AmericaNorth MacedoniaNorthern AfricaNorthern EuropeNorwayOceaniaPakistanPanamaPeruPhilippinesPolandPortugalRomaniaRussiaSaudi ArabiaScotlandSenegalSerbiaSierra LeoneSingaporeSomaliaSouth AfricaSouth AmericaSouth Central AsiaSouth Eastern AsiaSouthern EuropeSpainSri LankaSt. Vincent and the GrenadinesSudanSwedenSwitzerlandSyriaTaiwanThailandTrinidad and TobagoTurkeyUgandaUkraineUruguayUzbekistanVenezuelaVietnamWest IndiesWestern AfricaWestern AsiaWestern EuropeYemenZaireZimbabweAzores
Wage/Income Gap
Income
Poverty
Unemployment
Labor Participation
Family Structure
Vehicle Availability
Education Level
Disability

Seminole Wage/Income Gap
Good

25.6%
WAGE/INCOME GAP
62.6/ 100
METRIC RATING
168th/ 347
METRIC RANK

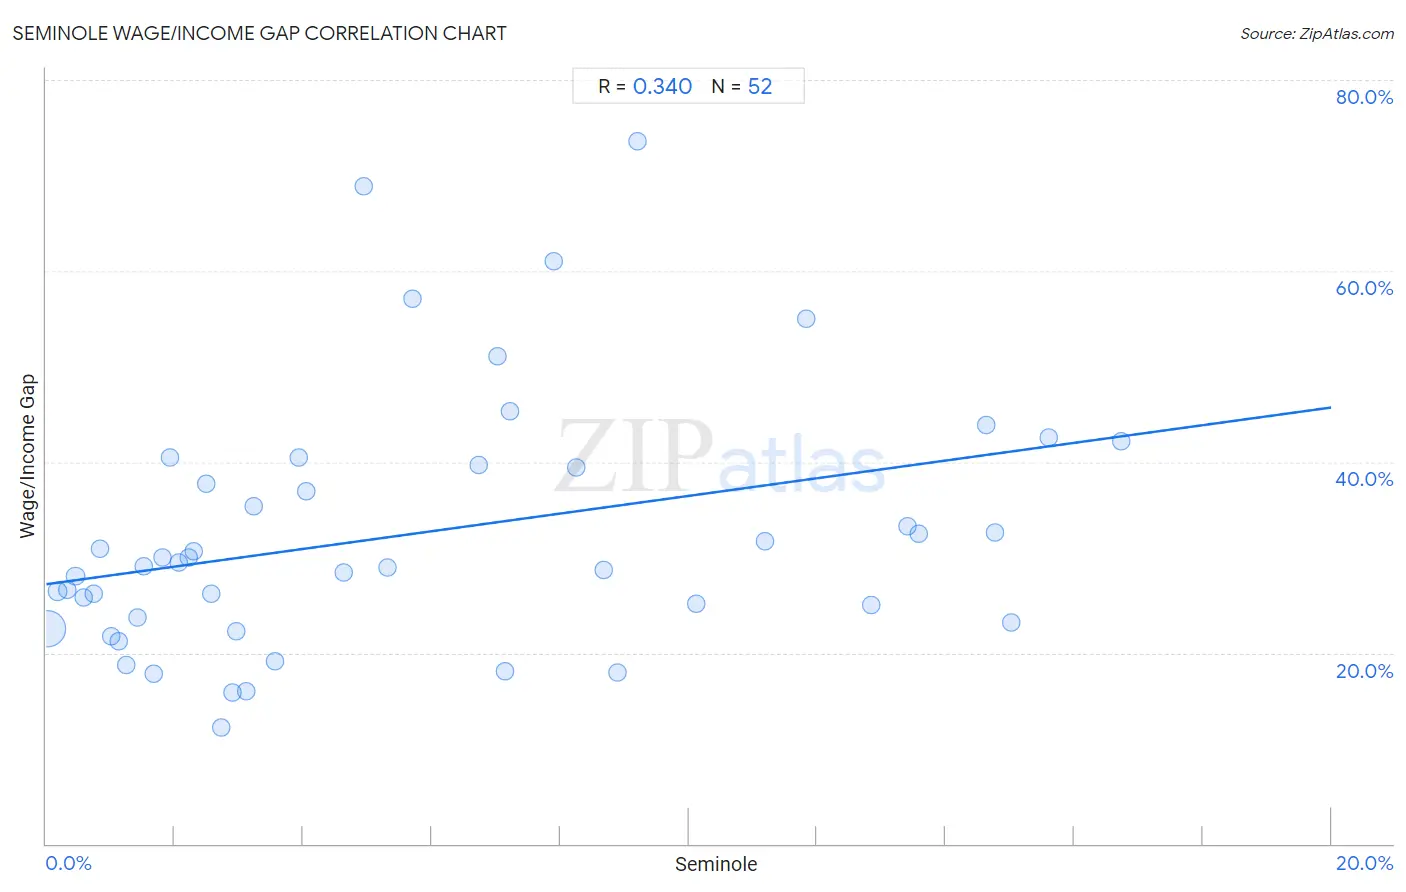
Seminole Wage/Income Gap Correlation Chart

The statistical analysis conducted on geographies consisting of 118,242,273 people shows a mild positive correlation between the proportion of Seminole and wage/income gap percentage in the United States with a correlation coefficient (R) of 0.340 and weighted average of 25.6%. On average, for every 1% (one percent) increase in Seminole within a typical geography, there is an increase of 0.93% in wage/income gap percentage.
Seminole Wage/Income Gap
It is essential to understand that the correlation between the percentage of Seminole and wage/income gap percentage does not imply a direct cause-and-effect relationship. It remains uncertain whether the presence of Seminole influences an upward or downward trend in the level of wage/income gap percentage within an area, or if Seminole simply ended up residing in those areas with higher or lower levels of wage/income gap percentage due to other factors.

Demographics Similar to Seminole by Wage/Income Gap

In terms of wage/income gap, the demographic groups most similar to Seminole are Paiute (25.5%, a difference of 0.020%), Immigrants from Ukraine (25.5%, a difference of 0.080%), Immigrants from Hong Kong (25.5%, a difference of 0.090%), Peruvian (25.6%, a difference of 0.18%), and Immigrants from Oceania (25.6%, a difference of 0.35%).
DemographicsRating | RankWage/Income Gap
Albanians
69.4
/100
|
#161
Good
25.4%
Shoshone
69.0
/100
|
#162
Good
25.4%
Native Hawaiians
69.0
/100
|
#163
Good
25.4%
Koreans
68.6
/100
|
#164
Good
25.4%
Immigrants from Hong Kong
64.0
/100
|
#165
Good
25.5%
Immigrants from Ukraine
63.8
/100
|
#166
Good
25.5%
Paiute
62.9
/100
|
#167
Good
25.5%
Seminole
62.6
/100
|
#168
Good
25.6%
Peruvians
60.1
/100
|
#169
Good
25.6%
Immigrants from Oceania
57.5
/100
|
#170
Average
25.6%
Immigrants from Greece
56.6
/100
|
#171
Average
25.7%
Immigrants from Chile
53.2
/100
|
#172
Average
25.7%
Immigrants from Belarus
52.9
/100
|
#173
Average
25.7%
Alaskan Athabascans
50.0
/100
|
#174
Average
25.8%
Sri Lankans
47.0
/100
|
#175
Average
25.8%

Seminole Wage/Income Gap Correlation Summary

MeasurementSeminole DataWage/Income Gap Data
Minimum0.021%12.2%
Maximum16.7%73.6%
Range16.7%61.3%
Mean5.7%32.4%
Median3.7%29.3%
Interquartile 25% (IQ1)1.7%23.5%
Interquartile 75% (IQ3)8.8%39.5%
Interquartile Range (IQR)7.0%16.1%
Standard Deviation (Sample)4.9%13.3%
Standard Deviation (Population)4.8%13.2%

Correlation Details

Seminole PercentileSample SizeWage/Income Gap
[
0.0%
-
0.5%
]
0.021%
107,209,87822.6%
[
0.0%
-
0.5%
]
0.18%
6,398,80126.5%
[
0.0%
-
0.5%
]
0.33%
2,243,74926.6%
[
0.0%
-
0.5%
]
0.46%
918,35828.0%
[
0.5%
-
1.0%
]
0.58%
462,15725.7%
[
0.5%
-
1.0%
]
0.73%
190,55926.2%
[
0.5%
-
1.0%
]
0.84%
142,60430.9%
[
1.0%
-
1.5%
]
1.02%
121,87721.7%
[
1.0%
-
1.5%
]
1.13%
178,19621.2%
[
1.0%
-
1.5%
]
1.25%
59,30818.7%
[
1.0%
-
1.5%
]
1.42%
30,40723.7%
[
1.5%
-
2.0%
]
1.52%
14,86629.0%
[
1.5%
-
2.0%
]
1.67%
23,74317.8%
[
1.5%
-
2.0%
]
1.81%
61,25330.0%
[
1.5%
-
2.0%
]
1.92%
7,56140.4%
[
2.0%
-
2.5%
]
2.07%
40,44929.5%
[
2.0%
-
2.5%
]
2.22%
22,11430.0%
[
2.0%
-
2.5%
]
2.30%
22,38730.7%
[
2.0%
-
2.5%
]
2.48%
6,28237.7%
[
2.5%
-
3.0%
]
2.58%
1,35826.1%
[
2.5%
-
3.0%
]
2.72%
4,00312.2%
[
2.5%
-
3.0%
]
2.90%
9,28115.8%
[
2.5%
-
3.0%
]
2.96%
6,92022.2%
[
3.0%
-
3.5%
]
3.11%
9,84815.9%
[
3.0%
-
3.5%
]
3.23%
4,17835.4%
[
3.5%
-
4.0%
]
3.56%
3,96419.1%
[
3.5%
-
4.0%
]
3.93%
28040.5%
[
4.0%
-
4.5%
]
4.05%
2,27436.9%
[
4.5%
-
5.0%
]
4.63%
21628.4%
[
4.5%
-
5.0%
]
4.94%
16268.9%
[
5.0%
-
5.5%
]
5.32%
1,11028.9%
[
5.5%
-
6.0%
]
5.71%
40357.1%
[
6.5%
-
7.0%
]
6.73%
1,36739.7%
[
7.0%
-
7.5%
]
7.03%
31351.0%
[
7.0%
-
7.5%
]
7.14%
16818.1%
[
7.0%
-
7.5%
]
7.23%
1,19045.3%
[
7.5%
-
8.0%
]
7.89%
1,16661.0%
[
8.0%
-
8.5%
]
8.25%
1,80539.4%
[
8.5%
-
9.0%
]
8.67%
2,01928.6%
[
8.5%
-
9.0%
]
8.89%
40517.9%
[
9.0%
-
9.5%
]
9.20%
17473.6%
[
10.0%
-
10.5%
]
10.11%
44525.2%
[
11.0%
-
11.5%
]
11.19%
12,32931.7%
[
11.5%
-
12.0%
]
11.83%
37255.1%
[
12.5%
-
13.0%
]
12.84%
95825.1%
[
13.0%
-
13.5%
]
13.40%
2,88733.3%
[
13.5%
-
14.0%
]
13.57%
5,57832.5%
[
14.5%
-
15.0%
]
14.63%
1,16943.9%
[
14.5%
-
15.0%
]
14.77%
7,14432.6%
[
15.0%
-
15.5%
]
15.01%
3,12423.2%
[
15.5%
-
16.0%
]
15.60%
56442.5%
[
16.5%
-
17.0%
]
16.73%
55042.1%