Seminole Unemployment Among Women with Children Ages 6 to 17 years
COMPARE
Seminole
Select to Compare
Unemployment Among Women with Children Ages 6 to 17 years
Seminole Unemployment Among Women with Children Ages 6 to 17 years
9.7%
UNEMPLOYMENT | WOMEN W/ CHILDREN 6 TO 17
0.1/ 100
METRIC RATING
280th/ 347
METRIC RANK
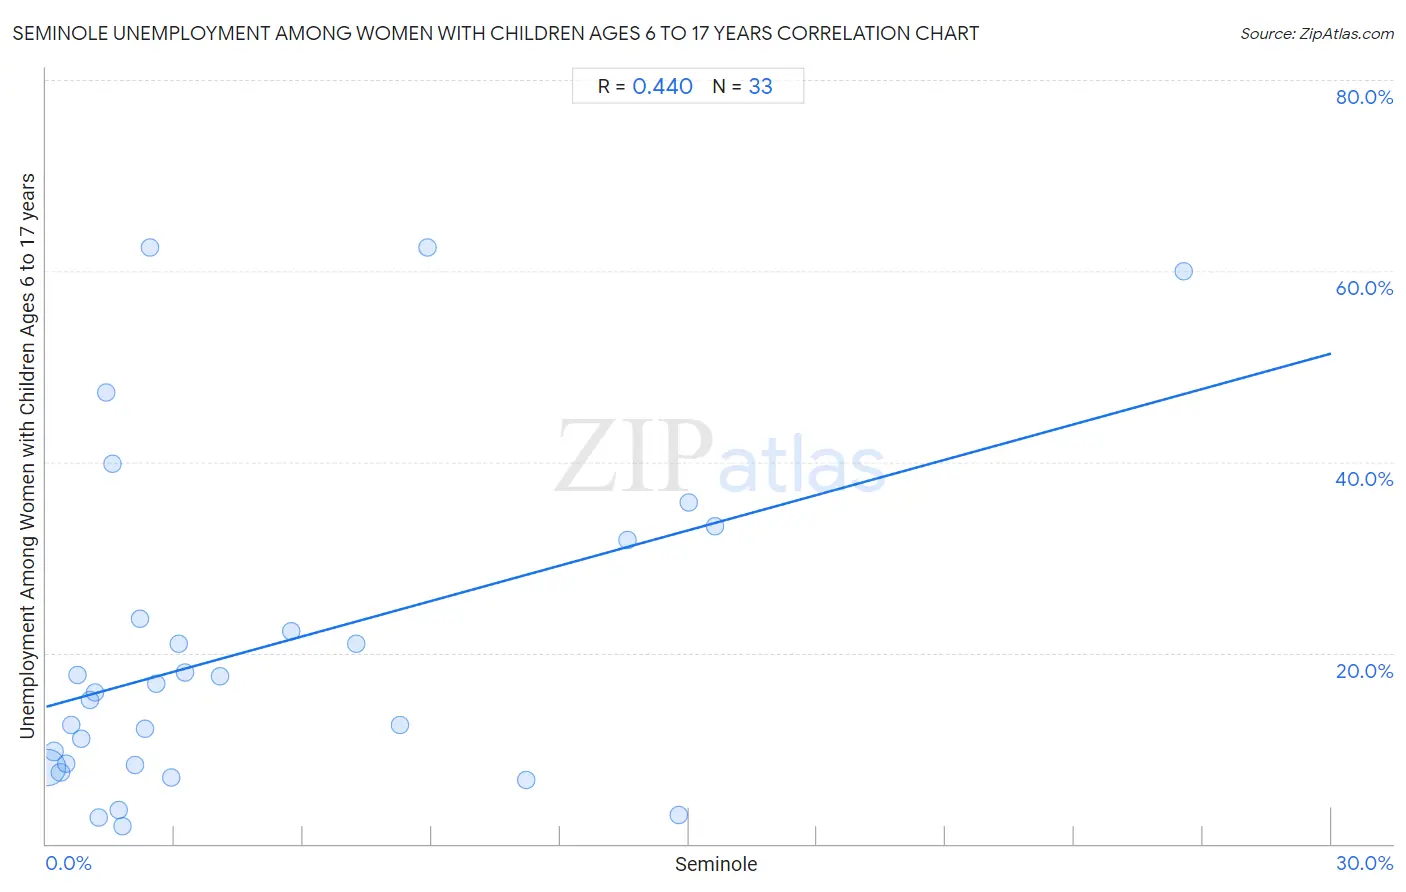
Seminole Unemployment Among Women with Children Ages 6 to 17 years Correlation Chart
The statistical analysis conducted on geographies consisting of 102,585,790 people shows a moderate positive correlation between the proportion of Seminole and unemployment rate among women with children between the ages 6 and 17 in the United States with a correlation coefficient (R) of 0.440 and weighted average of 9.7%. On average, for every 1% (one percent) increase in Seminole within a typical geography, there is an increase of 1.2% in unemployment rate among women with children between the ages 6 and 17.
It is essential to understand that the correlation between the percentage of Seminole and unemployment rate among women with children between the ages 6 and 17 does not imply a direct cause-and-effect relationship. It remains uncertain whether the presence of Seminole influences an upward or downward trend in the level of unemployment rate among women with children between the ages 6 and 17 within an area, or if Seminole simply ended up residing in those areas with higher or lower levels of unemployment rate among women with children between the ages 6 and 17 due to other factors.
Demographics Similar to Seminole by Unemployment Among Women with Children Ages 6 to 17 years
In terms of unemployment among women with children ages 6 to 17 years, the demographic groups most similar to Seminole are Scotch-Irish (9.7%, a difference of 0.19%), French (9.7%, a difference of 0.22%), British West Indian (9.7%, a difference of 0.29%), Immigrants from Portugal (9.7%, a difference of 0.35%), and U.S. Virgin Islander (9.7%, a difference of 0.36%).
| Demographics | Rating | Rank | Unemployment Among Women with Children Ages 6 to 17 years |
| Whites/Caucasians | 0.1 /100 | #273 | Tragic 9.6% |
| Aleuts | 0.1 /100 | #274 | Tragic 9.6% |
| U.S. Virgin Islanders | 0.1 /100 | #275 | Tragic 9.7% |
| Immigrants from Portugal | 0.1 /100 | #276 | Tragic 9.7% |
| British West Indians | 0.1 /100 | #277 | Tragic 9.7% |
| French | 0.1 /100 | #278 | Tragic 9.7% |
| Scotch-Irish | 0.1 /100 | #279 | Tragic 9.7% |
| Seminole | 0.1 /100 | #280 | Tragic 9.7% |
| Jamaicans | 0.0 /100 | #281 | Tragic 9.8% |
| Slovaks | 0.0 /100 | #282 | Tragic 9.8% |
| Central American Indians | 0.0 /100 | #283 | Tragic 9.9% |
| Yakama | 0.0 /100 | #284 | Tragic 9.9% |
| Hispanics or Latinos | 0.0 /100 | #285 | Tragic 9.9% |
| Choctaw | 0.0 /100 | #286 | Tragic 9.9% |
| Sierra Leoneans | 0.0 /100 | #287 | Tragic 9.9% |
Seminole Unemployment Among Women with Children Ages 6 to 17 years Correlation Summary
| Measurement | Seminole Data | Unemployment Among Women with Children Ages 6 to 17 years Data |
| Minimum | 0.018% | 1.8% |
| Maximum | 26.6% | 62.5% |
| Range | 26.5% | 60.7% |
| Mean | 5.0% | 20.5% |
| Median | 2.3% | 15.9% |
| Interquartile 25% (IQ1) | 1.1% | 8.2% |
| Interquartile 75% (IQ3) | 7.7% | 27.7% |
| Interquartile Range (IQR) | 6.7% | 19.5% |
| Standard Deviation (Sample) | 6.1% | 17.2% |
| Standard Deviation (Population) | 6.0% | 16.9% |
Correlation Details
| Seminole Percentile | Sample Size | Unemployment Among Women with Children Ages 6 to 17 years |
[ 0.0% - 0.5% ] 0.018% | 95,566,181 | 8.0% |
[ 0.0% - 0.5% ] 0.18% | 4,472,465 | 9.7% |
[ 0.0% - 0.5% ] 0.33% | 1,459,471 | 7.5% |
[ 0.0% - 0.5% ] 0.46% | 481,602 | 8.4% |
[ 0.5% - 1.0% ] 0.58% | 255,073 | 12.4% |
[ 0.5% - 1.0% ] 0.74% | 70,936 | 17.7% |
[ 0.5% - 1.0% ] 0.83% | 44,738 | 11.0% |
[ 1.0% - 1.5% ] 1.02% | 36,732 | 15.1% |
[ 1.0% - 1.5% ] 1.15% | 34,796 | 15.9% |
[ 1.0% - 1.5% ] 1.23% | 7,553 | 2.8% |
[ 1.0% - 1.5% ] 1.41% | 3,045 | 47.3% |
[ 1.5% - 2.0% ] 1.54% | 2,399 | 39.9% |
[ 1.5% - 2.0% ] 1.68% | 1,069 | 3.6% |
[ 1.5% - 2.0% ] 1.79% | 31,584 | 1.8% |
[ 2.0% - 2.5% ] 2.06% | 31,391 | 8.3% |
[ 2.0% - 2.5% ] 2.18% | 6,554 | 23.5% |
[ 2.0% - 2.5% ] 2.31% | 21,950 | 12.1% |
[ 2.0% - 2.5% ] 2.42% | 1,485 | 62.5% |
[ 2.5% - 3.0% ] 2.57% | 428 | 16.7% |
[ 2.5% - 3.0% ] 2.91% | 7,729 | 7.0% |
[ 3.0% - 3.5% ] 3.11% | 9,848 | 20.9% |
[ 3.0% - 3.5% ] 3.23% | 4,178 | 17.9% |
[ 4.0% - 4.5% ] 4.05% | 1,977 | 17.6% |
[ 5.5% - 6.0% ] 5.71% | 403 | 22.2% |
[ 7.0% - 7.5% ] 7.23% | 1,190 | 21.0% |
[ 8.0% - 8.5% ] 8.25% | 1,805 | 12.5% |
[ 8.5% - 9.0% ] 8.89% | 405 | 62.5% |
[ 11.0% - 11.5% ] 11.19% | 12,329 | 6.7% |
[ 13.5% - 14.0% ] 13.57% | 5,578 | 31.8% |
[ 14.5% - 15.0% ] 14.77% | 7,144 | 3.0% |
[ 15.0% - 15.5% ] 15.01% | 3,124 | 35.7% |
[ 15.5% - 16.0% ] 15.60% | 564 | 33.3% |
[ 26.5% - 27.0% ] 26.56% | 64 | 60.0% |