Seminole vs Immigrants from Venezuela Married-Couple Family Poverty
COMPARE
Seminole
Immigrants from Venezuela
Married-Couple Family Poverty
Married-Couple Family Poverty Comparison
Seminole
Immigrants from Venezuela
6.4%
MARRIED-COUPLE FAMILY POVERTY
0.0/ 100
METRIC RATING
282nd/ 347
METRIC RANK
5.8%
MARRIED-COUPLE FAMILY POVERTY
1.8/ 100
METRIC RATING
246th/ 347
METRIC RANK
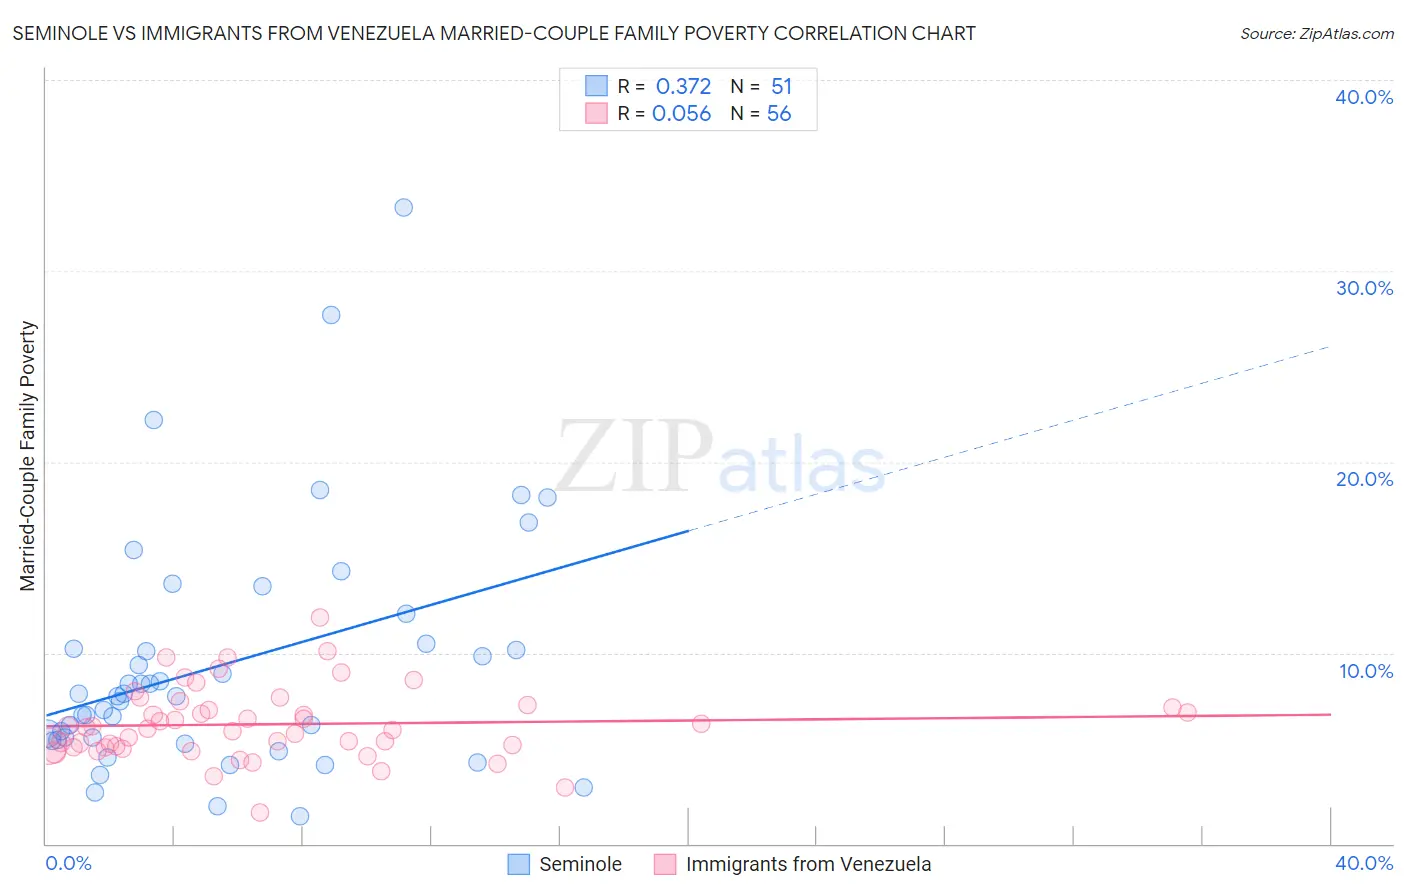
Seminole vs Immigrants from Venezuela Married-Couple Family Poverty Correlation Chart
The statistical analysis conducted on geographies consisting of 118,024,519 people shows a mild positive correlation between the proportion of Seminole and poverty level among married-couple families in the United States with a correlation coefficient (R) of 0.372 and weighted average of 6.4%. Similarly, the statistical analysis conducted on geographies consisting of 286,630,688 people shows a slight positive correlation between the proportion of Immigrants from Venezuela and poverty level among married-couple families in the United States with a correlation coefficient (R) of 0.056 and weighted average of 5.8%, a difference of 10.0%.
Married-Couple Family Poverty Correlation Summary
| Measurement | Seminole | Immigrants from Venezuela |
| Minimum | 1.5% | 1.7% |
| Maximum | 33.3% | 11.8% |
| Range | 31.9% | 10.2% |
| Mean | 9.4% | 6.3% |
| Median | 7.7% | 6.0% |
| Interquartile 25% (IQ1) | 5.4% | 5.1% |
| Interquartile 75% (IQ3) | 10.4% | 7.2% |
| Interquartile Range (IQR) | 5.0% | 2.1% |
| Standard Deviation (Sample) | 6.3% | 1.9% |
| Standard Deviation (Population) | 6.3% | 1.9% |
Similar Demographics by Married-Couple Family Poverty
Demographics Similar to Seminole by Married-Couple Family Poverty
In terms of married-couple family poverty, the demographic groups most similar to Seminole are Mexican American Indian (6.4%, a difference of 0.0%), Ute (6.4%, a difference of 0.38%), Dutch West Indian (6.4%, a difference of 0.50%), West Indian (6.4%, a difference of 0.51%), and Houma (6.4%, a difference of 0.56%).
| Demographics | Rating | Rank | Married-Couple Family Poverty |
| Choctaw | 0.1 /100 | #275 | Tragic 6.3% |
| Yaqui | 0.1 /100 | #276 | Tragic 6.3% |
| Indonesians | 0.1 /100 | #277 | Tragic 6.3% |
| Immigrants | Trinidad and Tobago | 0.1 /100 | #278 | Tragic 6.4% |
| Houma | 0.0 /100 | #279 | Tragic 6.4% |
| West Indians | 0.0 /100 | #280 | Tragic 6.4% |
| Mexican American Indians | 0.0 /100 | #281 | Tragic 6.4% |
| Seminole | 0.0 /100 | #282 | Tragic 6.4% |
| Ute | 0.0 /100 | #283 | Tragic 6.4% |
| Dutch West Indians | 0.0 /100 | #284 | Tragic 6.4% |
| Blacks/African Americans | 0.0 /100 | #285 | Tragic 6.5% |
| Guyanese | 0.0 /100 | #286 | Tragic 6.5% |
| Ecuadorians | 0.0 /100 | #287 | Tragic 6.5% |
| Salvadorans | 0.0 /100 | #288 | Tragic 6.5% |
| Nepalese | 0.0 /100 | #289 | Tragic 6.5% |
Demographics Similar to Immigrants from Venezuela by Married-Couple Family Poverty
In terms of married-couple family poverty, the demographic groups most similar to Immigrants from Venezuela are Immigrants from Afghanistan (5.8%, a difference of 0.52%), Iraqi (5.9%, a difference of 0.62%), Chickasaw (5.8%, a difference of 0.66%), Somali (5.8%, a difference of 0.68%), and Immigrants from Western Africa (5.8%, a difference of 0.83%).
| Demographics | Rating | Rank | Married-Couple Family Poverty |
| Venezuelans | 2.7 /100 | #239 | Tragic 5.8% |
| Fijians | 2.5 /100 | #240 | Tragic 5.8% |
| Immigrants | Panama | 2.5 /100 | #241 | Tragic 5.8% |
| Immigrants | Western Africa | 2.4 /100 | #242 | Tragic 5.8% |
| Somalis | 2.3 /100 | #243 | Tragic 5.8% |
| Chickasaw | 2.3 /100 | #244 | Tragic 5.8% |
| Immigrants | Afghanistan | 2.1 /100 | #245 | Tragic 5.8% |
| Immigrants | Venezuela | 1.8 /100 | #246 | Tragic 5.8% |
| Iraqis | 1.4 /100 | #247 | Tragic 5.9% |
| Cree | 1.2 /100 | #248 | Tragic 5.9% |
| Tsimshian | 1.1 /100 | #249 | Tragic 5.9% |
| Immigrants | Eritrea | 1.1 /100 | #250 | Tragic 5.9% |
| Immigrants | Ghana | 1.0 /100 | #251 | Tragic 5.9% |
| Immigrants | Western Asia | 0.7 /100 | #252 | Tragic 6.0% |
| Africans | 0.7 /100 | #253 | Tragic 6.0% |