Seminole Receiving Food Stamps
COMPARE
Seminole
Select to Compare
Receiving Food Stamps
Seminole Receiving Food Stamps
14.8%
PUBLIC INCOME | FOOD STAMPS
0.1/ 100
METRIC RATING
277th/ 347
METRIC RANK
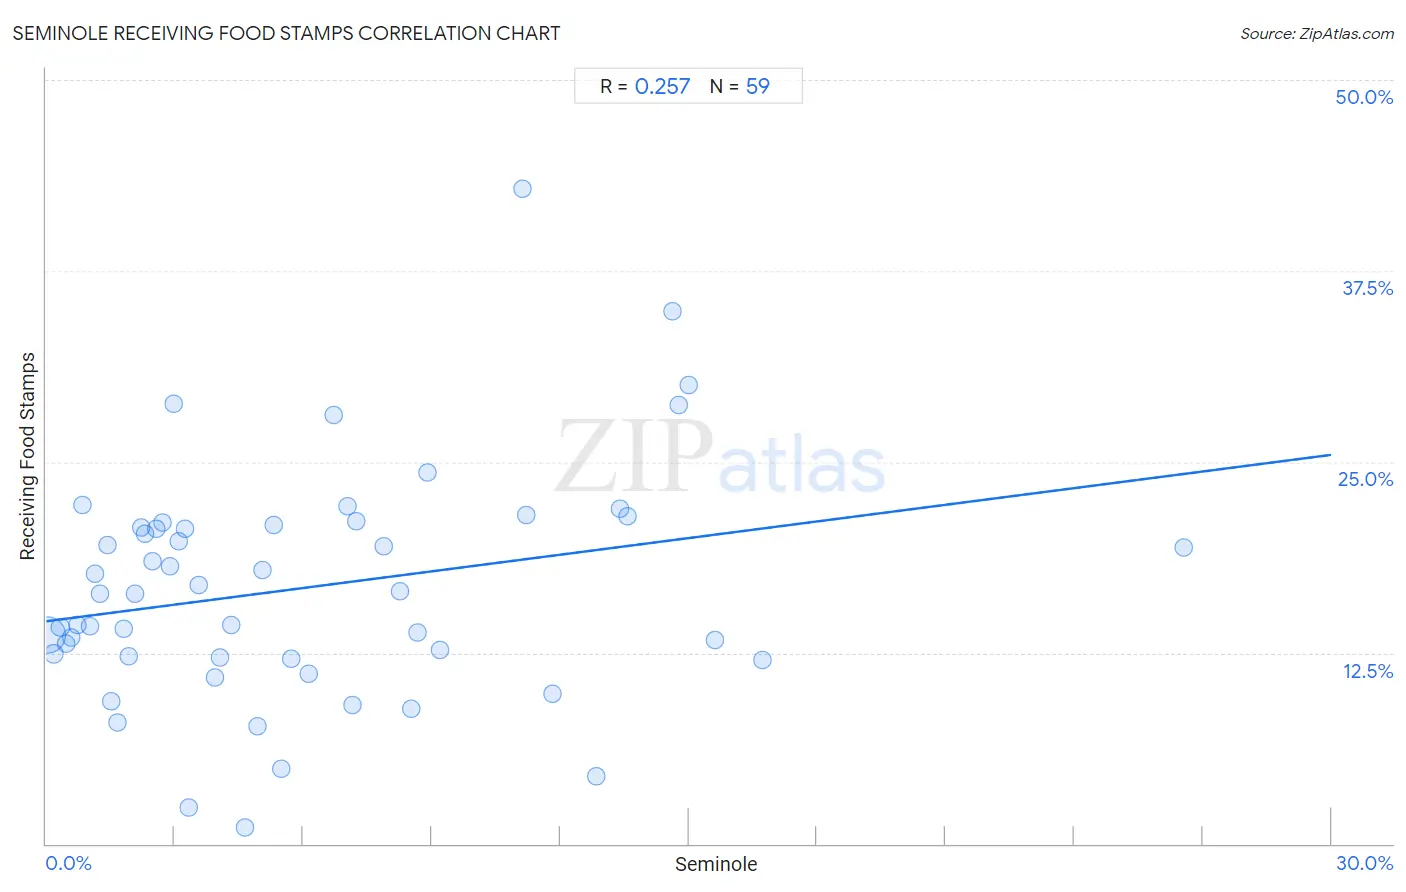
Seminole Receiving Food Stamps Correlation Chart
The statistical analysis conducted on geographies consisting of 118,279,359 people shows a weak positive correlation between the proportion of Seminole and percentage of population receiving government assistance and/or food stamps in the United States with a correlation coefficient (R) of 0.257 and weighted average of 14.8%. On average, for every 1% (one percent) increase in Seminole within a typical geography, there is an increase of 0.36% in percentage of population receiving government assistance and/or food stamps.
It is essential to understand that the correlation between the percentage of Seminole and percentage of population receiving government assistance and/or food stamps does not imply a direct cause-and-effect relationship. It remains uncertain whether the presence of Seminole influences an upward or downward trend in the level of percentage of population receiving government assistance and/or food stamps within an area, or if Seminole simply ended up residing in those areas with higher or lower levels of percentage of population receiving government assistance and/or food stamps due to other factors.
Demographics Similar to Seminole by Receiving Food Stamps
In terms of receiving food stamps, the demographic groups most similar to Seminole are Liberian (14.8%, a difference of 0.050%), Belizean (14.8%, a difference of 0.13%), Kiowa (14.9%, a difference of 0.40%), Ecuadorian (14.9%, a difference of 0.45%), and Ute (14.7%, a difference of 0.76%).
| Demographics | Rating | Rank | Receiving Food Stamps |
| Mexicans | 0.1 /100 | #270 | Tragic 14.6% |
| Immigrants from Guatemala | 0.1 /100 | #271 | Tragic 14.6% |
| Chippewa | 0.1 /100 | #272 | Tragic 14.7% |
| Alaskan Athabascans | 0.1 /100 | #273 | Tragic 14.7% |
| Immigrants from Western Africa | 0.1 /100 | #274 | Tragic 14.7% |
| Ute | 0.1 /100 | #275 | Tragic 14.7% |
| Liberians | 0.1 /100 | #276 | Tragic 14.8% |
| Seminole | 0.1 /100 | #277 | Tragic 14.8% |
| Belizeans | 0.1 /100 | #278 | Tragic 14.8% |
| Kiowa | 0.0 /100 | #279 | Tragic 14.9% |
| Ecuadorians | 0.0 /100 | #280 | Tragic 14.9% |
| Spanish American Indians | 0.0 /100 | #281 | Tragic 14.9% |
| Immigrants from Central America | 0.0 /100 | #282 | Tragic 15.0% |
| Bangladeshis | 0.0 /100 | #283 | Tragic 15.0% |
| Immigrants from Ecuador | 0.0 /100 | #284 | Tragic 15.0% |
Seminole Receiving Food Stamps Correlation Summary
| Measurement | Seminole Data | Receiving Food Stamps Data |
| Minimum | 0.021% | 1.1% |
| Maximum | 26.6% | 42.9% |
| Range | 26.5% | 41.8% |
| Mean | 6.0% | 16.8% |
| Median | 4.3% | 16.4% |
| Interquartile 25% (IQ1) | 1.9% | 12.2% |
| Interquartile 75% (IQ3) | 8.7% | 20.9% |
| Interquartile Range (IQR) | 6.7% | 8.7% |
| Standard Deviation (Sample) | 5.4% | 7.6% |
| Standard Deviation (Population) | 5.3% | 7.5% |
Correlation Details
| Seminole Percentile | Sample Size | Receiving Food Stamps |
[ 0.0% - 0.5% ] 0.021% | 107,205,729 | 13.7% |
[ 0.0% - 0.5% ] 0.18% | 6,405,917 | 12.4% |
[ 0.0% - 0.5% ] 0.33% | 2,256,015 | 14.2% |
[ 0.0% - 0.5% ] 0.46% | 920,702 | 13.1% |
[ 0.5% - 1.0% ] 0.58% | 463,595 | 13.5% |
[ 0.5% - 1.0% ] 0.73% | 193,469 | 14.3% |
[ 0.5% - 1.0% ] 0.84% | 144,150 | 22.2% |
[ 1.0% - 1.5% ] 1.02% | 124,575 | 14.3% |
[ 1.0% - 1.5% ] 1.13% | 179,231 | 17.7% |
[ 1.0% - 1.5% ] 1.25% | 63,479 | 16.4% |
[ 1.0% - 1.5% ] 1.42% | 30,407 | 19.5% |
[ 1.5% - 2.0% ] 1.52% | 14,866 | 9.3% |
[ 1.5% - 2.0% ] 1.67% | 25,341 | 7.9% |
[ 1.5% - 2.0% ] 1.81% | 61,754 | 14.1% |
[ 1.5% - 2.0% ] 1.92% | 7,561 | 12.3% |
[ 2.0% - 2.5% ] 2.07% | 41,984 | 16.4% |
[ 2.0% - 2.5% ] 2.22% | 22,385 | 20.7% |
[ 2.0% - 2.5% ] 2.30% | 22,869 | 20.3% |
[ 2.0% - 2.5% ] 2.48% | 6,282 | 18.5% |
[ 2.5% - 3.0% ] 2.57% | 1,787 | 20.6% |
[ 2.5% - 3.0% ] 2.72% | 4,003 | 21.0% |
[ 2.5% - 3.0% ] 2.90% | 9,350 | 18.2% |
[ 2.5% - 3.0% ] 2.96% | 6,920 | 28.8% |
[ 3.0% - 3.5% ] 3.11% | 9,976 | 19.8% |
[ 3.0% - 3.5% ] 3.23% | 4,178 | 20.6% |
[ 3.0% - 3.5% ] 3.33% | 60 | 2.4% |
[ 3.5% - 4.0% ] 3.56% | 3,964 | 16.9% |
[ 3.5% - 4.0% ] 3.93% | 280 | 10.9% |
[ 4.0% - 4.5% ] 4.05% | 2,422 | 12.2% |
[ 4.0% - 4.5% ] 4.31% | 116 | 14.3% |
[ 4.5% - 5.0% ] 4.63% | 216 | 1.1% |
[ 4.5% - 5.0% ] 4.94% | 162 | 7.7% |
[ 5.0% - 5.5% ] 5.06% | 257 | 17.9% |
[ 5.0% - 5.5% ] 5.32% | 1,110 | 20.9% |
[ 5.0% - 5.5% ] 5.48% | 292 | 4.9% |
[ 5.5% - 6.0% ] 5.71% | 403 | 12.1% |
[ 6.0% - 6.5% ] 6.12% | 245 | 11.1% |
[ 6.5% - 7.0% ] 6.72% | 1,086 | 28.1% |
[ 7.0% - 7.5% ] 7.03% | 313 | 22.1% |
[ 7.0% - 7.5% ] 7.14% | 168 | 9.1% |
[ 7.0% - 7.5% ] 7.23% | 1,190 | 21.1% |
[ 7.5% - 8.0% ] 7.89% | 1,166 | 19.5% |
[ 8.0% - 8.5% ] 8.25% | 1,805 | 16.5% |
[ 8.5% - 9.0% ] 8.51% | 188 | 8.8% |
[ 8.5% - 9.0% ] 8.67% | 2,019 | 13.8% |
[ 8.5% - 9.0% ] 8.89% | 405 | 24.3% |
[ 9.0% - 9.5% ] 9.20% | 174 | 12.7% |
[ 11.0% - 11.5% ] 11.11% | 54 | 42.9% |
[ 11.0% - 11.5% ] 11.19% | 12,329 | 21.5% |
[ 11.5% - 12.0% ] 11.83% | 372 | 9.8% |
[ 12.5% - 13.0% ] 12.84% | 958 | 4.4% |
[ 13.0% - 13.5% ] 13.40% | 2,887 | 21.9% |
[ 13.5% - 14.0% ] 13.57% | 5,578 | 21.4% |
[ 14.5% - 15.0% ] 14.63% | 1,169 | 34.9% |
[ 14.5% - 15.0% ] 14.77% | 7,144 | 28.7% |
[ 15.0% - 15.5% ] 15.01% | 3,124 | 30.0% |
[ 15.5% - 16.0% ] 15.60% | 564 | 13.3% |
[ 16.5% - 17.0% ] 16.73% | 550 | 12.0% |
[ 26.5% - 27.0% ] 26.56% | 64 | 19.4% |