Millerville, MN Map & Demographics
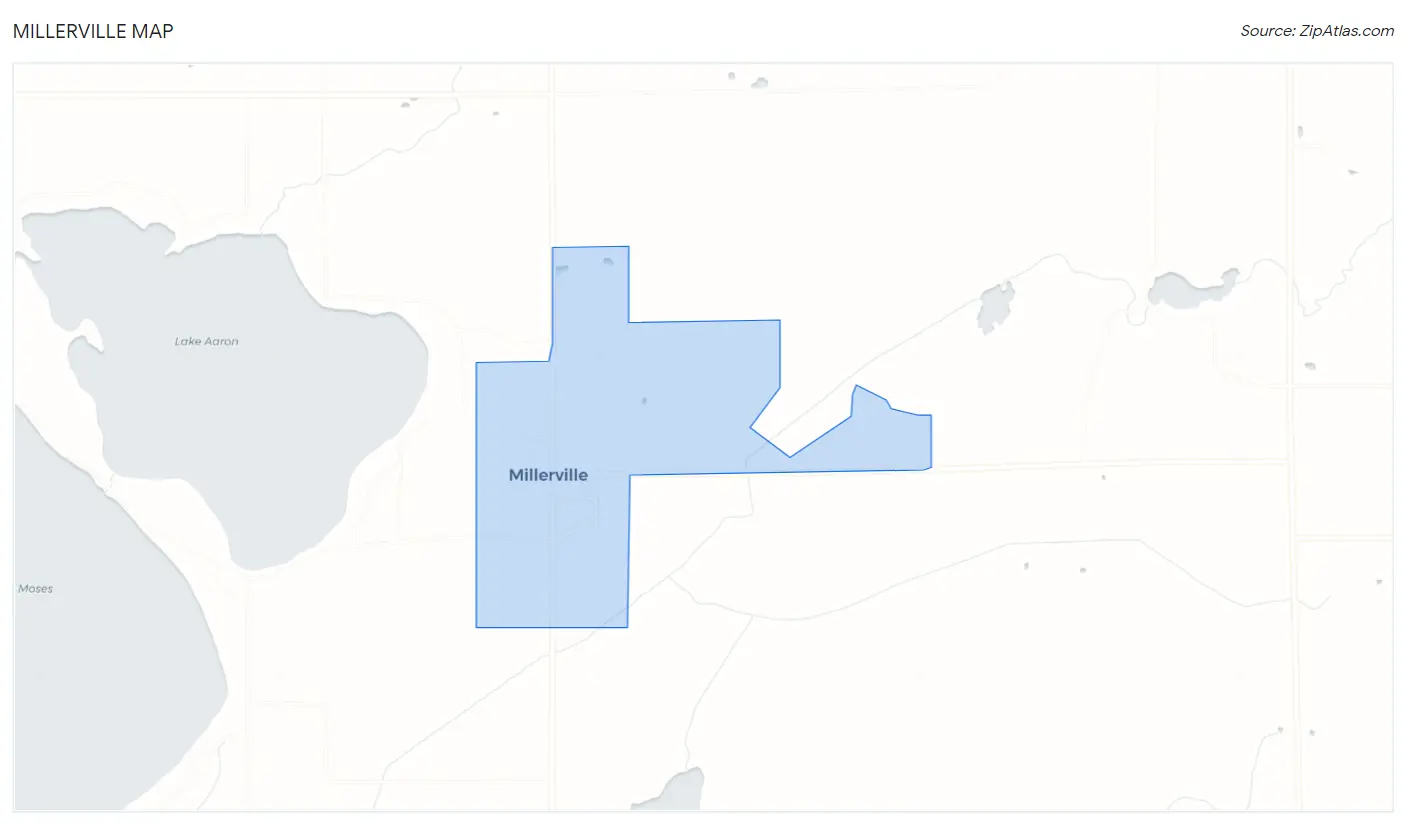
Millerville Map
Millerville Overview
$32,274
PER CAPITA INCOME
$88,438
AVG FAMILY INCOME
$83,000
AVG HOUSEHOLD INCOME
24.7%
WAGE / INCOME GAP [ % ]
75.3¢/ $1
WAGE / INCOME GAP [ $ ]
0.30
INEQUALITY / GINI INDEX
112
TOTAL POPULATION
62
MALE POPULATION
50
FEMALE POPULATION
124.00
MALES / 100 FEMALES
80.65
FEMALES / 100 MALES
35.0
MEDIAN AGE
3.0
AVG FAMILY SIZE
2.4
AVG HOUSEHOLD SIZE
62
LABOR FORCE [ PEOPLE ]
86.1%
PERCENT IN LABOR FORCE
Income in Millerville
Income Overview in Millerville
Per Capita Income in Millerville is $32,274, while median incomes of families and households are $88,438 and $83,000 respectively.
| Characteristic | Number | Measure |
| Per Capita Income | 112 | $32,274 |
| Median Family Income | 29 | $88,438 |
| Mean Family Income | 29 | $84,372 |
| Median Household Income | 46 | $83,000 |
| Mean Household Income | 46 | $81,463 |
| Income Deficit | 29 | $0 |
| Wage / Income Gap (%) | 112 | 24.67% |
| Wage / Income Gap ($) | 112 | 75.33¢ per $1 |
| Gini / Inequality Index | 112 | 0.30 |
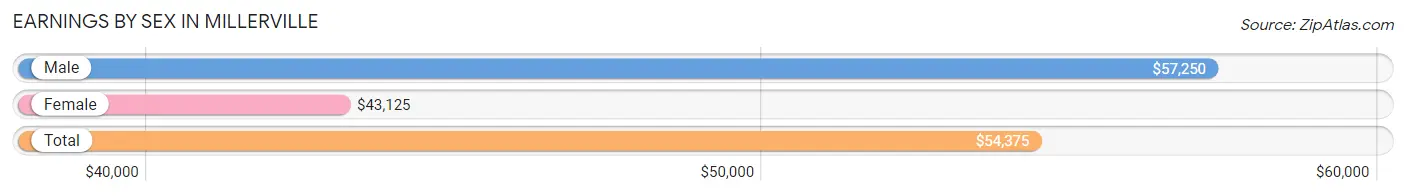
Earnings by Sex in Millerville
Average Earnings in Millerville are $54,375, $57,250 for men and $43,125 for women, a difference of 24.7%.
| Sex | Number | Average Earnings |
| Male | 31 (50.0%) | $57,250 |
| Female | 31 (50.0%) | $43,125 |
| Total | 62 (100.0%) | $54,375 |
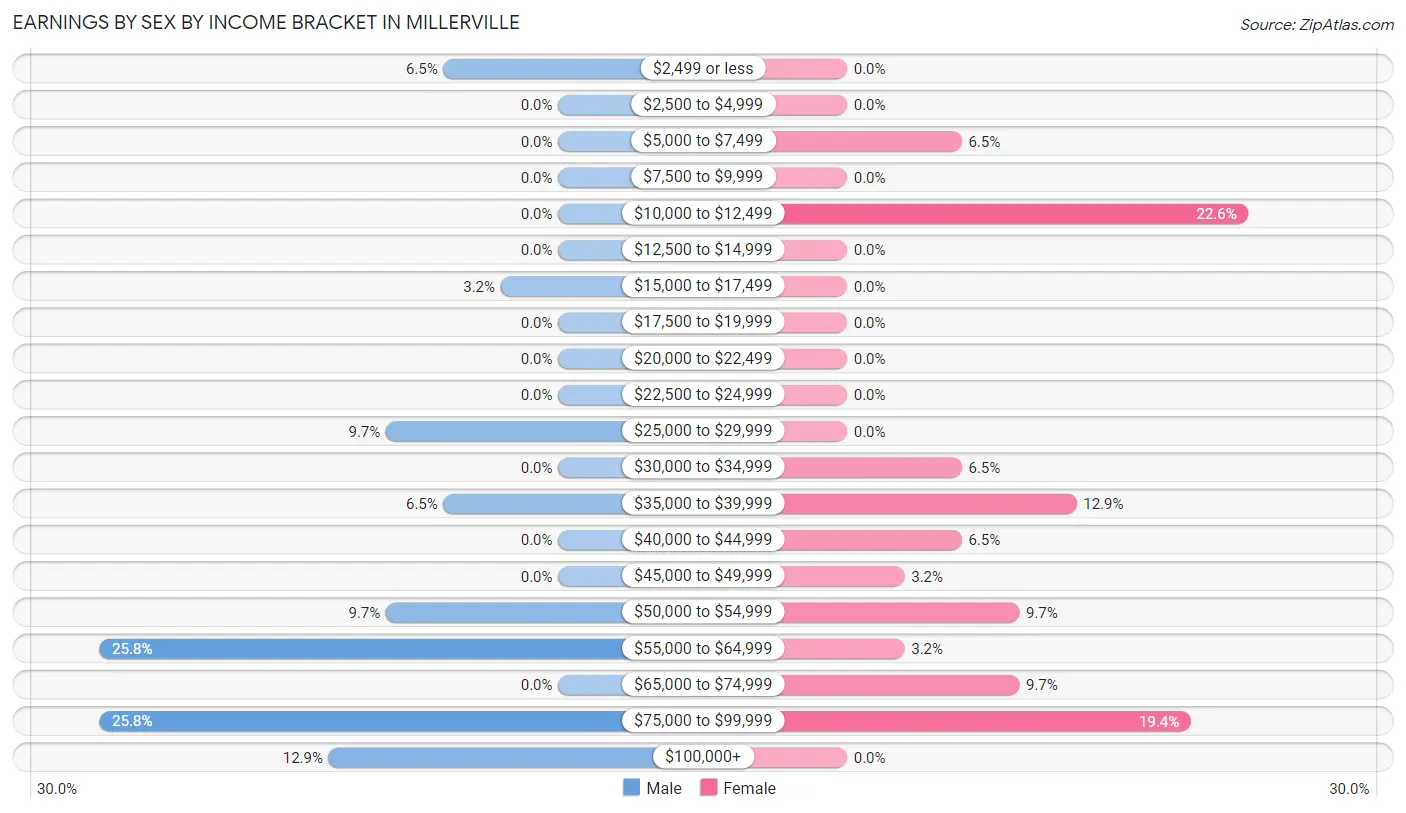
Earnings by Sex by Income Bracket in Millerville
The most common earnings brackets in Millerville are $55,000 to $64,999 for men (8 | 25.8%) and $10,000 to $12,499 for women (7 | 22.6%).
| Income | Male | Female |
| $2,499 or less | 2 (6.5%) | 0 (0.0%) |
| $2,500 to $4,999 | 0 (0.0%) | 0 (0.0%) |
| $5,000 to $7,499 | 0 (0.0%) | 2 (6.5%) |
| $7,500 to $9,999 | 0 (0.0%) | 0 (0.0%) |
| $10,000 to $12,499 | 0 (0.0%) | 7 (22.6%) |
| $12,500 to $14,999 | 0 (0.0%) | 0 (0.0%) |
| $15,000 to $17,499 | 1 (3.2%) | 0 (0.0%) |
| $17,500 to $19,999 | 0 (0.0%) | 0 (0.0%) |
| $20,000 to $22,499 | 0 (0.0%) | 0 (0.0%) |
| $22,500 to $24,999 | 0 (0.0%) | 0 (0.0%) |
| $25,000 to $29,999 | 3 (9.7%) | 0 (0.0%) |
| $30,000 to $34,999 | 0 (0.0%) | 2 (6.5%) |
| $35,000 to $39,999 | 2 (6.5%) | 4 (12.9%) |
| $40,000 to $44,999 | 0 (0.0%) | 2 (6.5%) |
| $45,000 to $49,999 | 0 (0.0%) | 1 (3.2%) |
| $50,000 to $54,999 | 3 (9.7%) | 3 (9.7%) |
| $55,000 to $64,999 | 8 (25.8%) | 1 (3.2%) |
| $65,000 to $74,999 | 0 (0.0%) | 3 (9.7%) |
| $75,000 to $99,999 | 8 (25.8%) | 6 (19.4%) |
| $100,000+ | 4 (12.9%) | 0 (0.0%) |
| Total | 31 (100.0%) | 31 (100.0%) |
Earnings by Sex by Educational Attainment in Millerville
Average earnings in Millerville are $57,000 for men and $43,125 for women, a difference of 24.3%. Men with an educational attainment of high school diploma enjoy the highest average annual earnings of $57,250, while those with high school diploma education earn the least with $57,250. Women with an educational attainment of bachelor's degree earn the most with the average annual earnings of $69,583, while those with college or associate's degree education have the smallest earnings of $36,250.
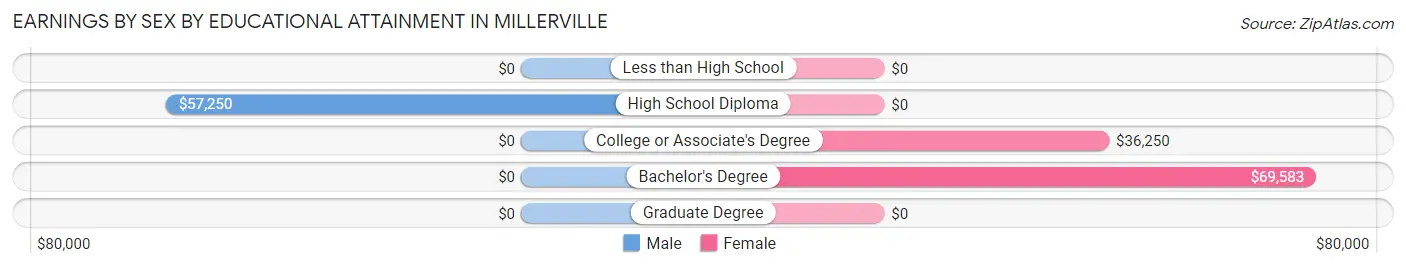
| Educational Attainment | Male Income | Female Income |
| Less than High School | - | - |
| High School Diploma | $57,250 | $0 |
| College or Associate's Degree | - | - |
| Bachelor's Degree | - | - |
| Graduate Degree | - | - |
| Total | $57,000 | $43,125 |
Family Income in Millerville
Family Income Brackets in Millerville
According to the Millerville family income data, there are 7 families falling into the $75,000 to $99,999 income range, which is the most common income bracket and makes up 24.1% of all families.
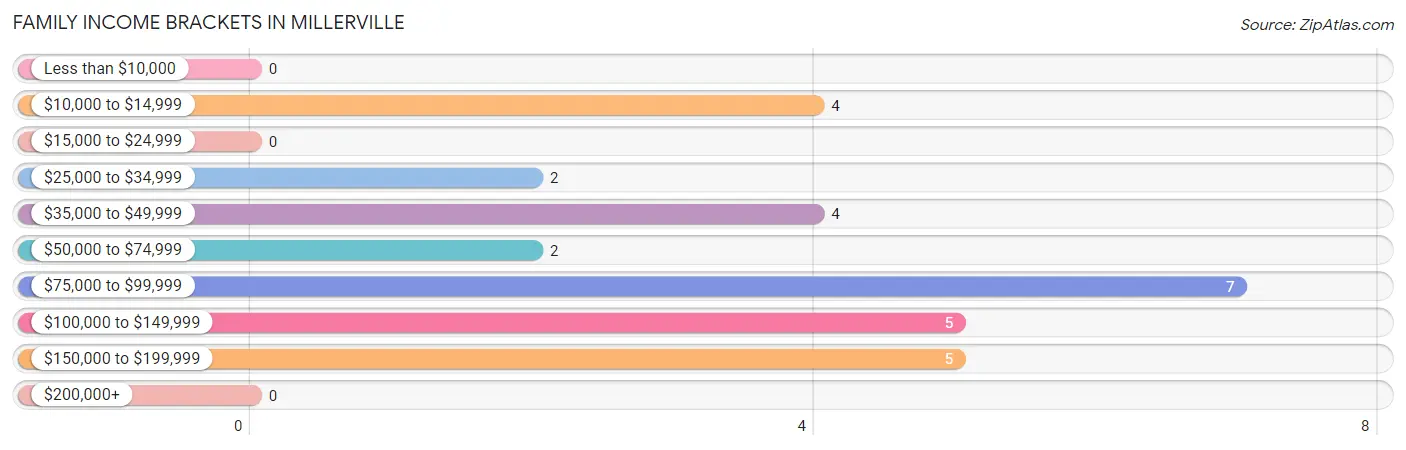
| Income Bracket | # Families | % Families |
| Less than $10,000 | 0 | 0.0% |
| $10,000 to $14,999 | 4 | 13.8% |
| $15,000 to $24,999 | 0 | 0.0% |
| $25,000 to $34,999 | 2 | 6.9% |
| $35,000 to $49,999 | 4 | 13.8% |
| $50,000 to $74,999 | 2 | 6.9% |
| $75,000 to $99,999 | 7 | 24.1% |
| $100,000 to $149,999 | 5 | 17.2% |
| $150,000 to $199,999 | 5 | 17.2% |
| $200,000+ | 0 | 0.0% |
Family Income by Famaliy Size in Millerville
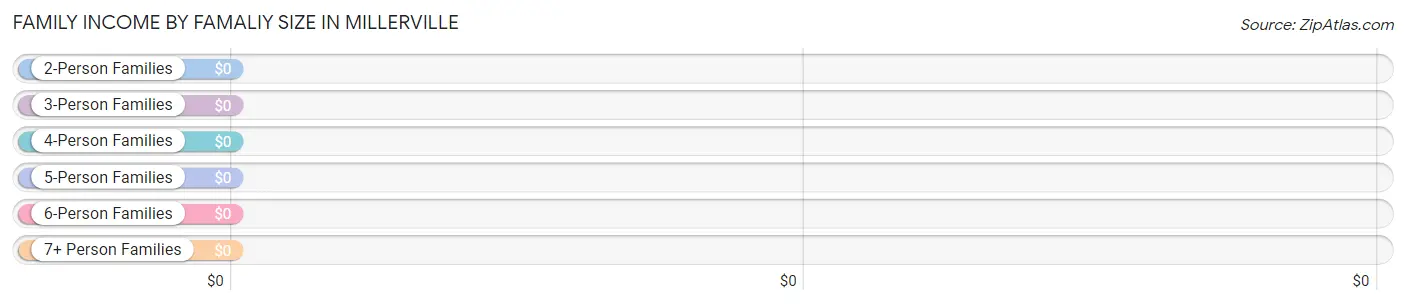
| Income Bracket | # Families | Median Income |
| 2-Person Families | 11 (37.9%) | $0 |
| 3-Person Families | 8 (27.6%) | $0 |
| 4-Person Families | 3 (10.3%) | $0 |
| 5-Person Families | 5 (17.2%) | $0 |
| 6-Person Families | 2 (6.9%) | $0 |
| 7+ Person Families | 0 (0.0%) | $0 |
| Total | 29 (100.0%) | $88,438 |
Family Income by Number of Earners in Millerville
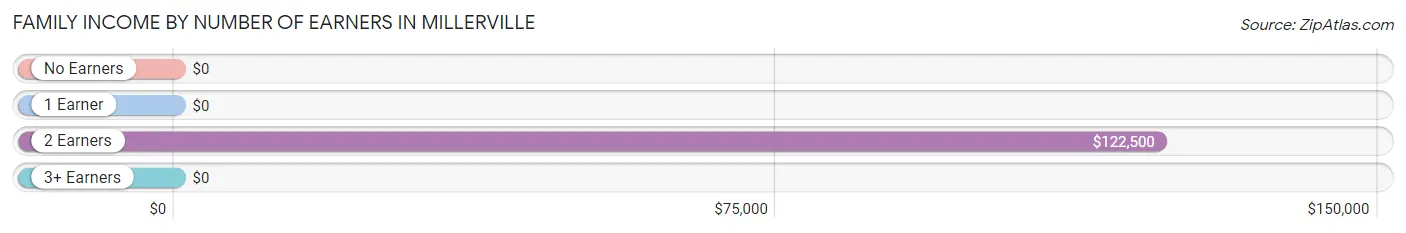
| Number of Earners | # Families | Median Income |
| No Earners | 2 (6.9%) | $0 |
| 1 Earner | 12 (41.4%) | $0 |
| 2 Earners | 14 (48.3%) | $122,500 |
| 3+ Earners | 1 (3.5%) | $0 |
| Total | 29 (100.0%) | $88,438 |
Household Income in Millerville
Household Income Brackets in Millerville
With 10 households falling in the category, the $50,000 to $74,999 income range is the most frequent in Millerville, accounting for 21.7% of all households.
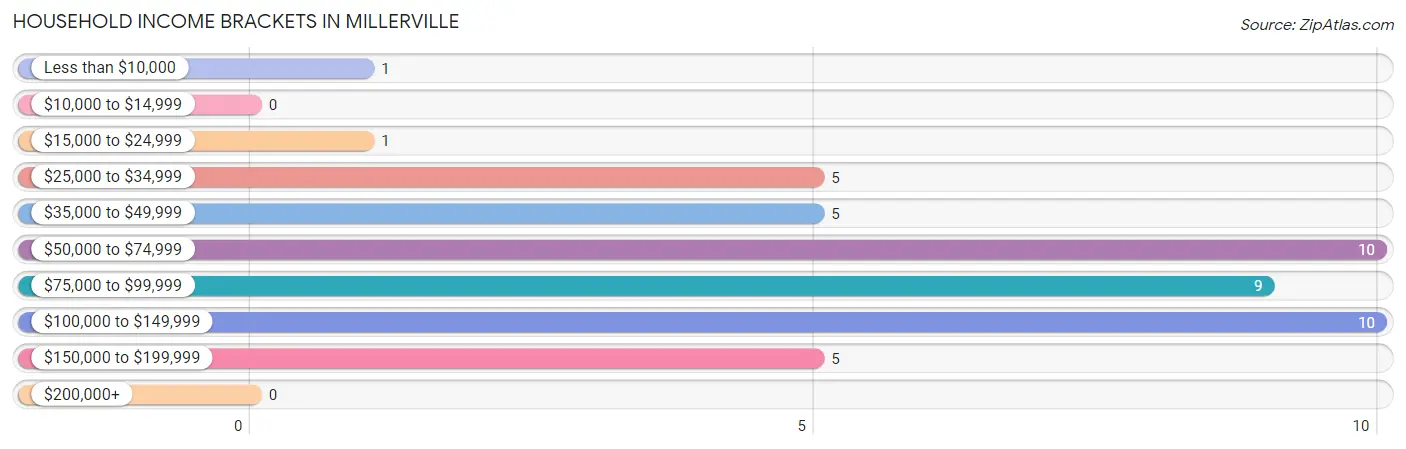
| Income Bracket | # Households | % Households |
| Less than $10,000 | 1 | 2.2% |
| $10,000 to $14,999 | 0 | 0.0% |
| $15,000 to $24,999 | 1 | 2.2% |
| $25,000 to $34,999 | 5 | 10.9% |
| $35,000 to $49,999 | 5 | 10.9% |
| $50,000 to $74,999 | 10 | 21.7% |
| $75,000 to $99,999 | 9 | 19.6% |
| $100,000 to $149,999 | 10 | 21.7% |
| $150,000 to $199,999 | 5 | 10.9% |
| $200,000+ | 0 | 0.0% |
Household Income by Householder Age in Millerville
The median household income in Millerville is $83,000, with the highest median household income of $93,750 found in the 45 to 64 years age bracket for the primary householder. A total of 12 households (26.1%) fall into this category. Meanwhile, the 15 to 24 years age bracket for the primary householder has the lowest median household income of $0, with 1 households (2.2%) in this group.
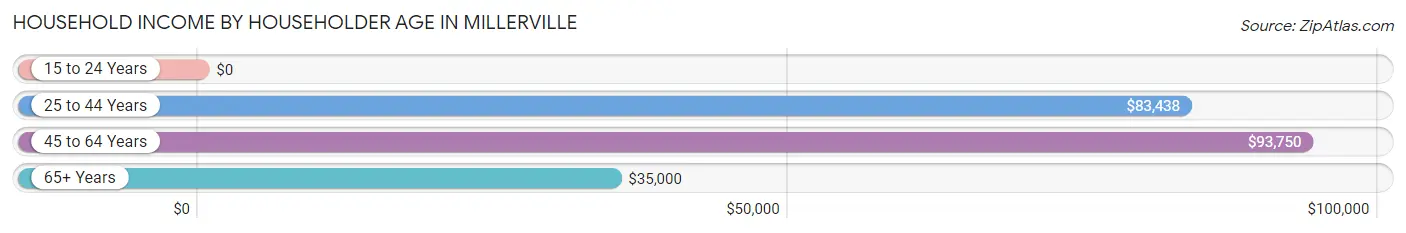
| Income Bracket | # Households | Median Income |
| 15 to 24 Years | 1 (2.2%) | $0 |
| 25 to 44 Years | 23 (50.0%) | $83,438 |
| 45 to 64 Years | 12 (26.1%) | $93,750 |
| 65+ Years | 10 (21.7%) | $35,000 |
| Total | 46 (100.0%) | $83,000 |
Poverty in Millerville
Income Below Poverty by Sex and Age in Millerville
With 8.1% poverty level for males and 16.0% for females among the residents of Millerville, 6 to 11 year old males and under 5 year old females are the most vulnerable to poverty, with 4 males (21.0%) and 4 females (57.1%) in their respective age groups living below the poverty level.
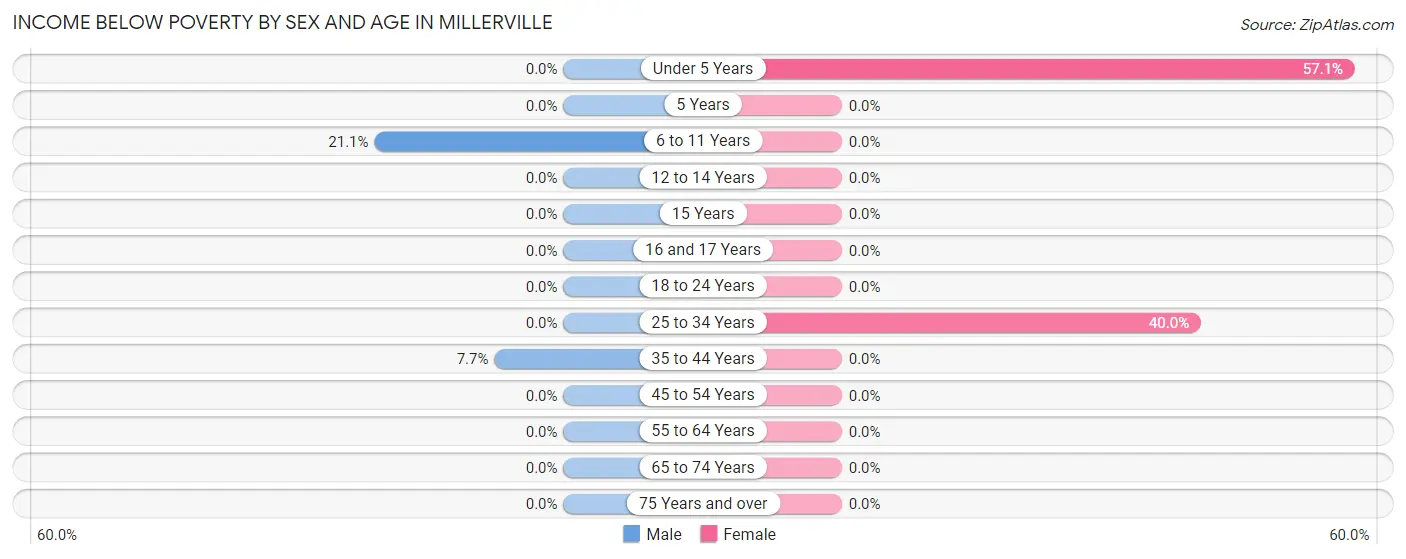
| Age Bracket | Male | Female |
| Under 5 Years | 0 (0.0%) | 4 (57.1%) |
| 5 Years | 0 (0.0%) | 0 (0.0%) |
| 6 to 11 Years | 4 (21.0%) | 0 (0.0%) |
| 12 to 14 Years | 0 (0.0%) | 0 (0.0%) |
| 15 Years | 0 (0.0%) | 0 (0.0%) |
| 16 and 17 Years | 0 (0.0%) | 0 (0.0%) |
| 18 to 24 Years | 0 (0.0%) | 0 (0.0%) |
| 25 to 34 Years | 0 (0.0%) | 4 (40.0%) |
| 35 to 44 Years | 1 (7.7%) | 0 (0.0%) |
| 45 to 54 Years | 0 (0.0%) | 0 (0.0%) |
| 55 to 64 Years | 0 (0.0%) | 0 (0.0%) |
| 65 to 74 Years | 0 (0.0%) | 0 (0.0%) |
| 75 Years and over | 0 (0.0%) | 0 (0.0%) |
| Total | 5 (8.1%) | 8 (16.0%) |
Income Above Poverty by Sex and Age in Millerville
According to the poverty statistics in Millerville, males aged under 5 years and females aged 5 years are the age groups that are most secure financially, with 100.0% of males and 100.0% of females in these age groups living above the poverty line.
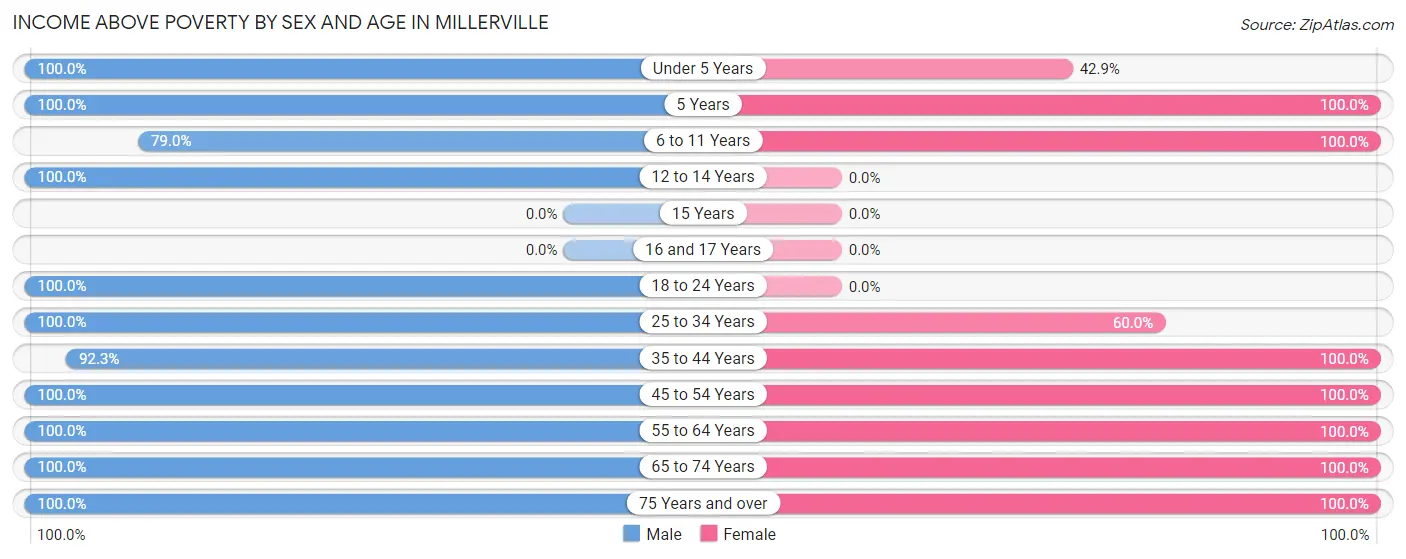
| Age Bracket | Male | Female |
| Under 5 Years | 2 (100.0%) | 3 (42.9%) |
| 5 Years | 3 (100.0%) | 6 (100.0%) |
| 6 to 11 Years | 15 (78.9%) | 1 (100.0%) |
| 12 to 14 Years | 2 (100.0%) | 0 (0.0%) |
| 15 Years | 0 (0.0%) | 0 (0.0%) |
| 16 and 17 Years | 0 (0.0%) | 0 (0.0%) |
| 18 to 24 Years | 1 (100.0%) | 0 (0.0%) |
| 25 to 34 Years | 5 (100.0%) | 6 (60.0%) |
| 35 to 44 Years | 12 (92.3%) | 10 (100.0%) |
| 45 to 54 Years | 6 (100.0%) | 3 (100.0%) |
| 55 to 64 Years | 2 (100.0%) | 6 (100.0%) |
| 65 to 74 Years | 4 (100.0%) | 3 (100.0%) |
| 75 Years and over | 5 (100.0%) | 4 (100.0%) |
| Total | 57 (91.9%) | 42 (84.0%) |
Income Below Poverty Among Married-Couple Families in Millerville
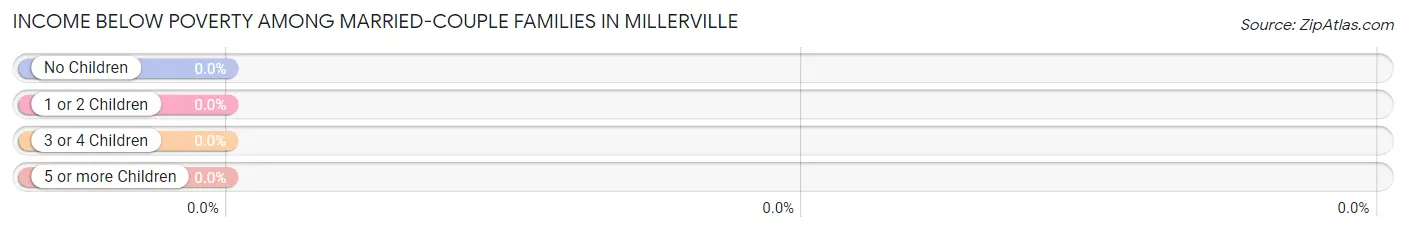
| Children | Above Poverty | Below Poverty |
| No Children | 9 (100.0%) | 0 (0.0%) |
| 1 or 2 Children | 3 (100.0%) | 0 (0.0%) |
| 3 or 4 Children | 7 (100.0%) | 0 (0.0%) |
| 5 or more Children | 0 (0.0%) | 0 (0.0%) |
| Total | 19 (100.0%) | 0 (0.0%) |
Income Below Poverty Among Single-Parent Households in Millerville
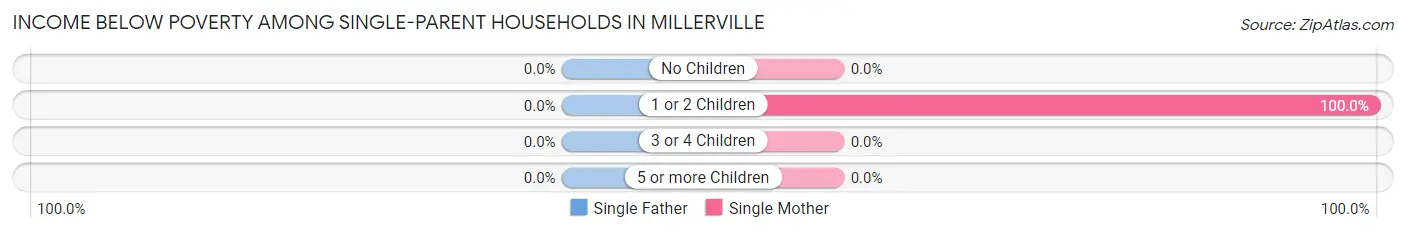
| Children | Single Father | Single Mother |
| No Children | 0 (0.0%) | 0 (0.0%) |
| 1 or 2 Children | 0 (0.0%) | 4 (100.0%) |
| 3 or 4 Children | 0 (0.0%) | 0 (0.0%) |
| 5 or more Children | 0 (0.0%) | 0 (0.0%) |
| Total | 0 (0.0%) | 4 (100.0%) |
Income Below Poverty Among Married-Couple vs Single-Parent Households in Millerville
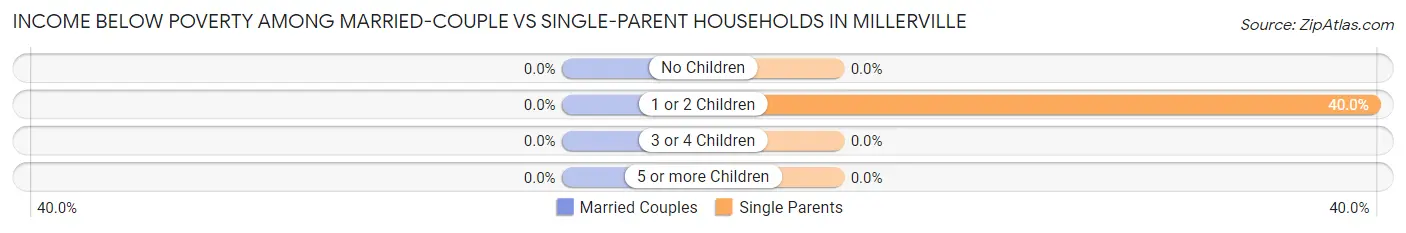
| Children | Married-Couple Families | Single-Parent Households |
| No Children | 0 (0.0%) | 0 (0.0%) |
| 1 or 2 Children | 0 (0.0%) | 4 (40.0%) |
| 3 or 4 Children | 0 (0.0%) | 0 (0.0%) |
| 5 or more Children | 0 (0.0%) | 0 (0.0%) |
| Total | 0 (0.0%) | 4 (40.0%) |
Race in Millerville
The most populous races in Millerville are , and White / Caucasian (112 | 100.0%).
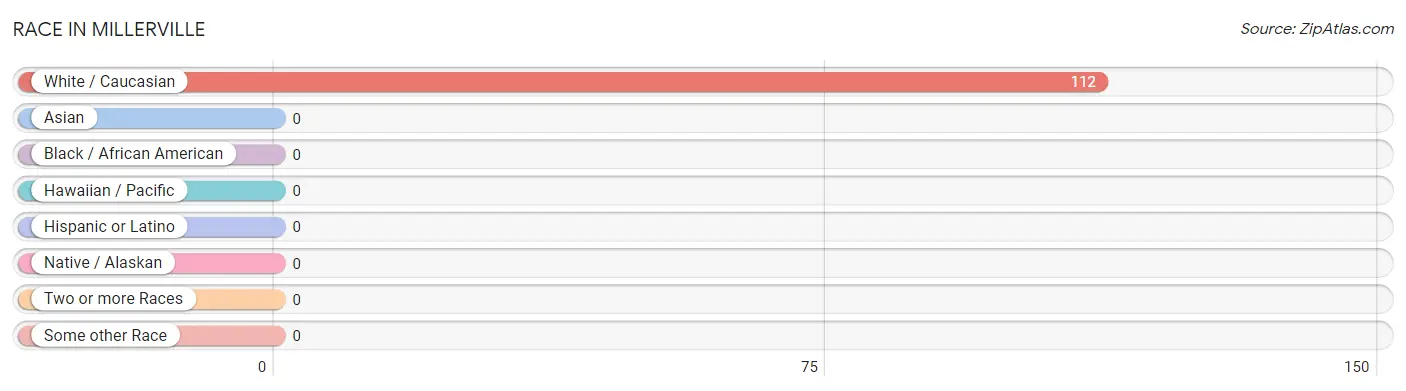
| Race | # Population | % Population |
| Asian | 0 | 0.0% |
| Black / African American | 0 | 0.0% |
| Hawaiian / Pacific | 0 | 0.0% |
| Hispanic or Latino | 0 | 0.0% |
| Native / Alaskan | 0 | 0.0% |
| White / Caucasian | 112 | 100.0% |
| Two or more Races | 0 | 0.0% |
| Some other Race | 0 | 0.0% |
| Total | 112 | 100.0% |
Ancestry in Millerville
The most populous ancestries reported in Millerville are German (62 | 55.4%), American (11 | 9.8%), Polish (9 | 8.0%), French (7 | 6.2%), and Norwegian (7 | 6.2%), together accounting for 85.7% of all Millerville residents.
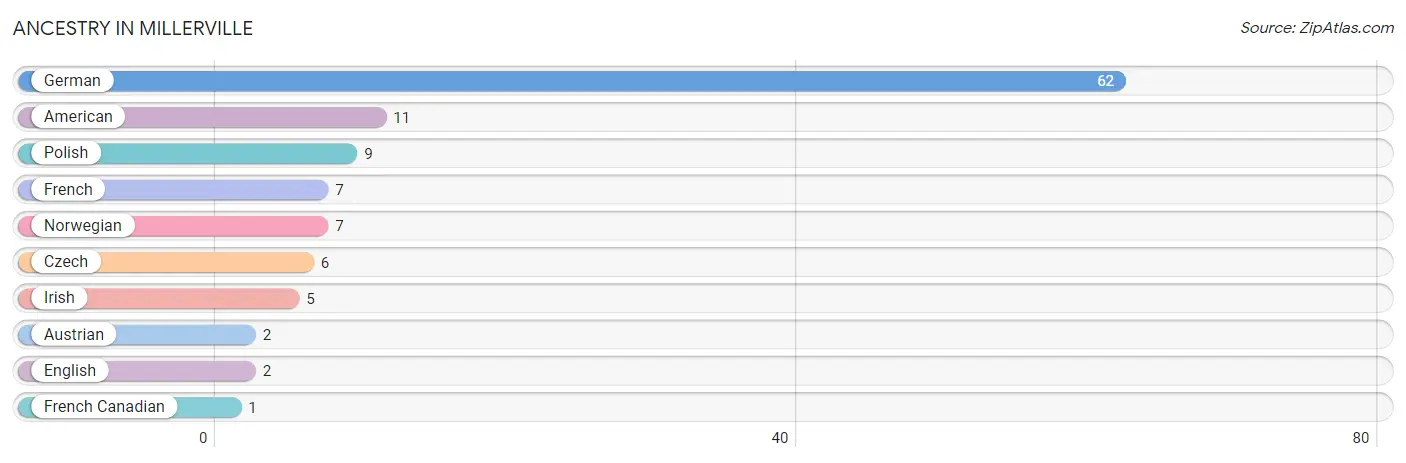
| Ancestry | # Population | % Population |
| American | 11 | 9.8% |
| Austrian | 2 | 1.8% |
| Czech | 6 | 5.4% |
| English | 2 | 1.8% |
| French | 7 | 6.2% |
| French Canadian | 1 | 0.9% |
| German | 62 | 55.4% |
| Irish | 5 | 4.5% |
| Norwegian | 7 | 6.2% |
| Polish | 9 | 8.0% | View All 10 Rows |
Immigrants in Millerville
The most numerous immigrant groups reported in Millerville came from Europe (3 | 2.7%), Western Europe (3 | 2.7%), Germany (2 | 1.8%), and Netherlands (1 | 0.9%), together accounting for 8.0% of all Millerville residents.
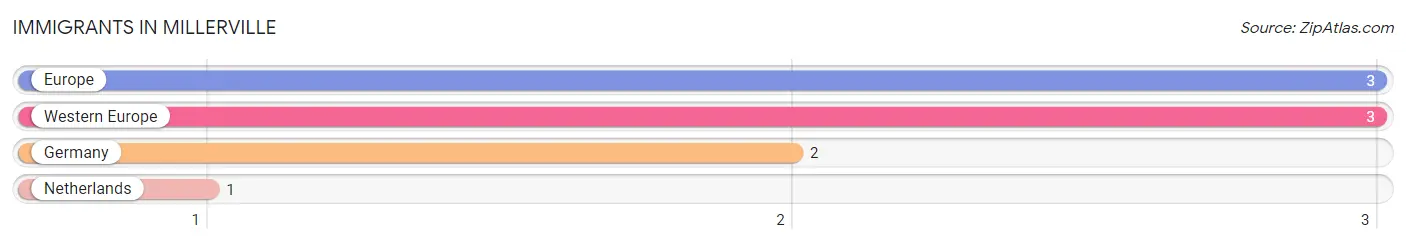
| Immigration Origin | # Population | % Population |
| Europe | 3 | 2.7% |
| Germany | 2 | 1.8% |
| Netherlands | 1 | 0.9% |
| Western Europe | 3 | 2.7% | View All 4 Rows |
Sex and Age in Millerville
Sex and Age in Millerville
The most populous age groups in Millerville are 5 to 9 Years (20 | 32.3%) for men and Under 5 Years (7 | 14.0%) for women.
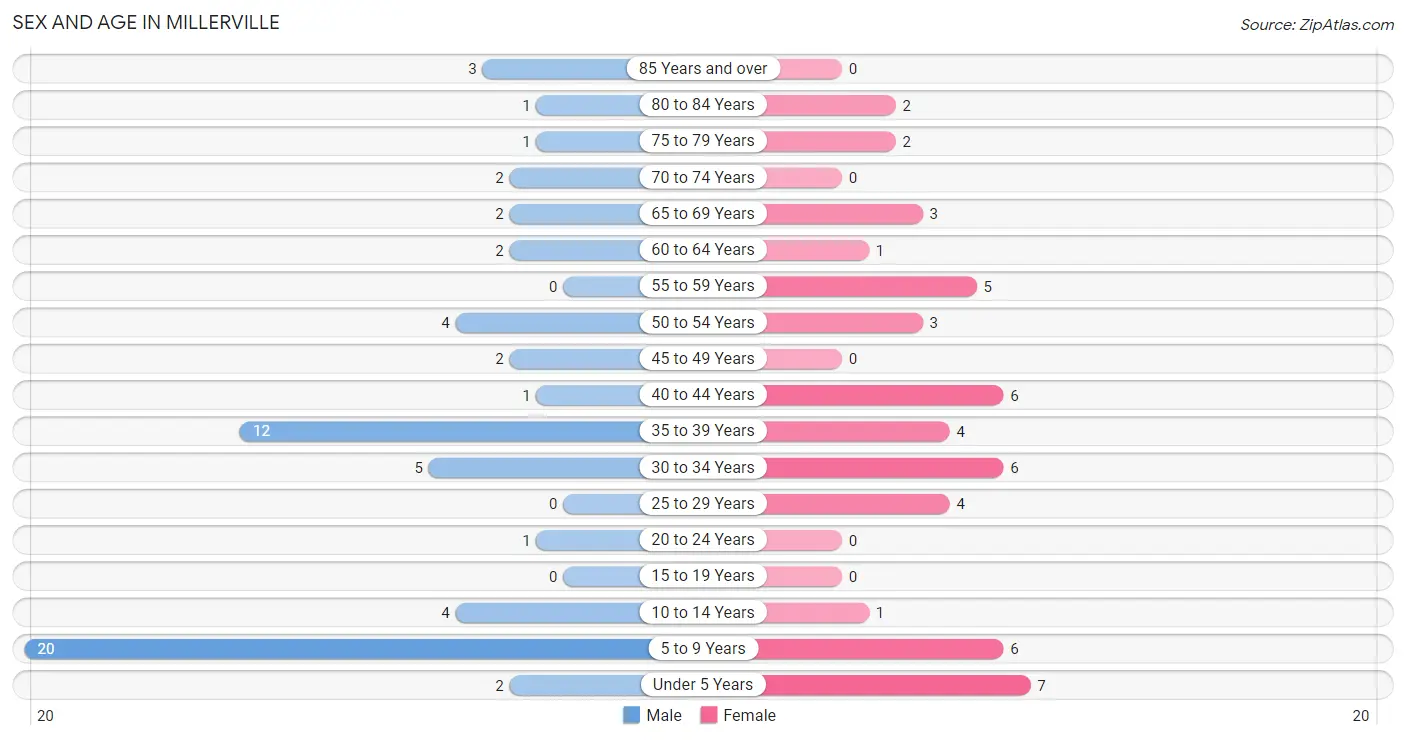
| Age Bracket | Male | Female |
| Under 5 Years | 2 (3.2%) | 7 (14.0%) |
| 5 to 9 Years | 20 (32.3%) | 6 (12.0%) |
| 10 to 14 Years | 4 (6.5%) | 1 (2.0%) |
| 15 to 19 Years | 0 (0.0%) | 0 (0.0%) |
| 20 to 24 Years | 1 (1.6%) | 0 (0.0%) |
| 25 to 29 Years | 0 (0.0%) | 4 (8.0%) |
| 30 to 34 Years | 5 (8.1%) | 6 (12.0%) |
| 35 to 39 Years | 12 (19.4%) | 4 (8.0%) |
| 40 to 44 Years | 1 (1.6%) | 6 (12.0%) |
| 45 to 49 Years | 2 (3.2%) | 0 (0.0%) |
| 50 to 54 Years | 4 (6.5%) | 3 (6.0%) |
| 55 to 59 Years | 0 (0.0%) | 5 (10.0%) |
| 60 to 64 Years | 2 (3.2%) | 1 (2.0%) |
| 65 to 69 Years | 2 (3.2%) | 3 (6.0%) |
| 70 to 74 Years | 2 (3.2%) | 0 (0.0%) |
| 75 to 79 Years | 1 (1.6%) | 2 (4.0%) |
| 80 to 84 Years | 1 (1.6%) | 2 (4.0%) |
| 85 Years and over | 3 (4.8%) | 0 (0.0%) |
| Total | 62 (100.0%) | 50 (100.0%) |
Families and Households in Millerville
Median Family Size in Millerville
The median family size in Millerville is 2.97 persons per family, with married-couple families (19 | 65.5%) accounting for the largest median family size of 3.16 persons per family. On the other hand, single male/father families (6 | 20.7%) represent the smallest median family size with 2.33 persons per family.
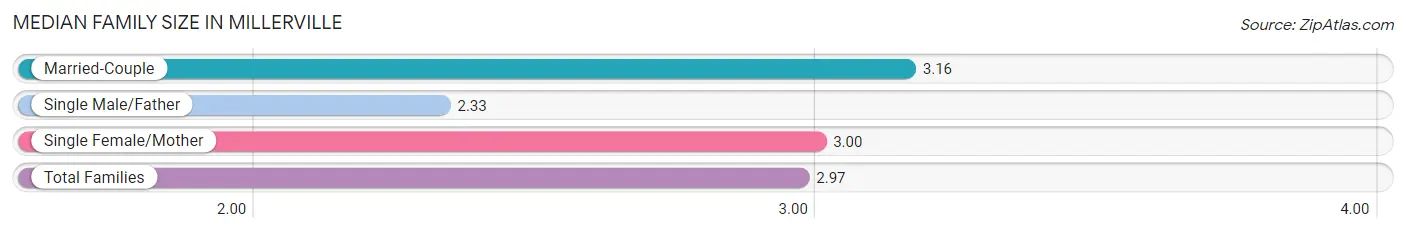
| Family Type | # Families | Family Size |
| Married-Couple | 19 (65.5%) | 3.16 |
| Single Male/Father | 6 (20.7%) | 2.33 |
| Single Female/Mother | 4 (13.8%) | 3.00 |
| Total Families | 29 (100.0%) | 2.97 |
Median Household Size in Millerville
The median household size in Millerville is 2.43 persons per household, with single female/mother households (4 | 8.7%) accounting for the largest median household size of 4.25 persons per household. non-family households (17 | 37.0%) represent the smallest median household size with 1.06 persons per household.
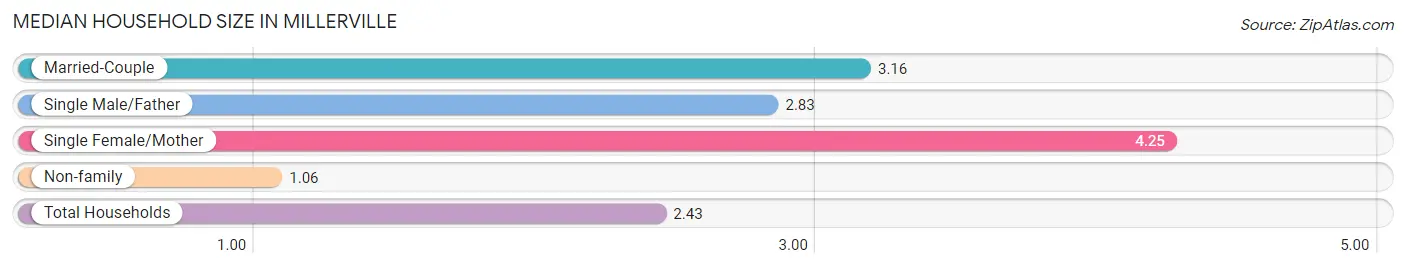
| Household Type | # Households | Household Size |
| Married-Couple | 19 (41.3%) | 3.16 |
| Single Male/Father | 6 (13.0%) | 2.83 |
| Single Female/Mother | 4 (8.7%) | 4.25 |
| Non-family | 17 (37.0%) | 1.06 |
| Total Households | 46 (100.0%) | 2.43 |
Household Size by Marriage Status in Millerville
Out of a total of 46 households in Millerville, 29 (63.0%) are family households, while 17 (37.0%) are nonfamily households. The most numerous type of family households are 2-person households, comprising 11, and the most common type of nonfamily households are 1-person households, comprising 15.
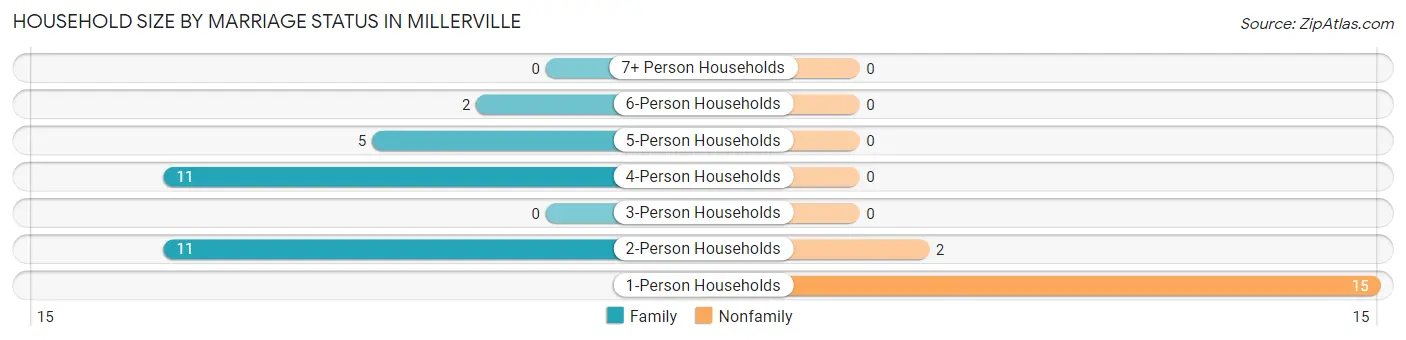
| Household Size | Family Households | Nonfamily Households |
| 1-Person Households | - | 15 (32.6%) |
| 2-Person Households | 11 (23.9%) | 2 (4.3%) |
| 3-Person Households | 0 (0.0%) | 0 (0.0%) |
| 4-Person Households | 11 (23.9%) | 0 (0.0%) |
| 5-Person Households | 5 (10.9%) | 0 (0.0%) |
| 6-Person Households | 2 (4.3%) | 0 (0.0%) |
| 7+ Person Households | 0 (0.0%) | 0 (0.0%) |
| Total | 29 (63.0%) | 17 (37.0%) |
Female Fertility in Millerville
Fertility by Age in Millerville
| Age Bracket | Women with Births | Births / 1,000 Women |
| 15 to 19 years | 0 (0.0%) | 0.0 |
| 20 to 34 years | 0 (0.0%) | 0.0 |
| 35 to 50 years | 0 (0.0%) | 0.0 |
| Total | 0 (0.0%) | 0.0 |
Fertility by Age by Marriage Status in Millerville
| Age Bracket | Married | Unmarried |
| 15 to 19 years | 0 (0.0%) | 0 (0.0%) |
| 20 to 34 years | 0 (0.0%) | 0 (0.0%) |
| 35 to 50 years | 0 (0.0%) | 0 (0.0%) |
| Total | 0 (0.0%) | 0 (0.0%) |
Fertility by Education in Millerville
| Educational Attainment | Women with Births | Births / 1,000 Women |
| Less than High School | 0 (0.0%) | 0.0 |
| High School Diploma | 0 (0.0%) | 0.0 |
| College or Associate's Degree | 0 (0.0%) | 0.0 |
| Bachelor's Degree | 0 (0.0%) | 0.0 |
| Graduate Degree | 0 (0.0%) | 0.0 |
| Total | 0 (0.0%) | 0.0 |
Fertility by Education by Marriage Status in Millerville
| Educational Attainment | Married | Unmarried |
| Less than High School | 0 (0.0%) | 0 (0.0%) |
| High School Diploma | 0 (0.0%) | 0 (0.0%) |
| College or Associate's Degree | 0 (0.0%) | 0 (0.0%) |
| Bachelor's Degree | 0 (0.0%) | 0 (0.0%) |
| Graduate Degree | 0 (0.0%) | 0 (0.0%) |
| Total | 0 (0.0%) | 0 (0.0%) |
Employment Characteristics in Millerville
Employment by Class of Employer in Millerville
Among the 62 employed individuals in Millerville, private company employees (44 | 71.0%), not-for-profit organizations (7 | 11.3%), and local government employees (5 | 8.1%) make up the most common classes of employment.
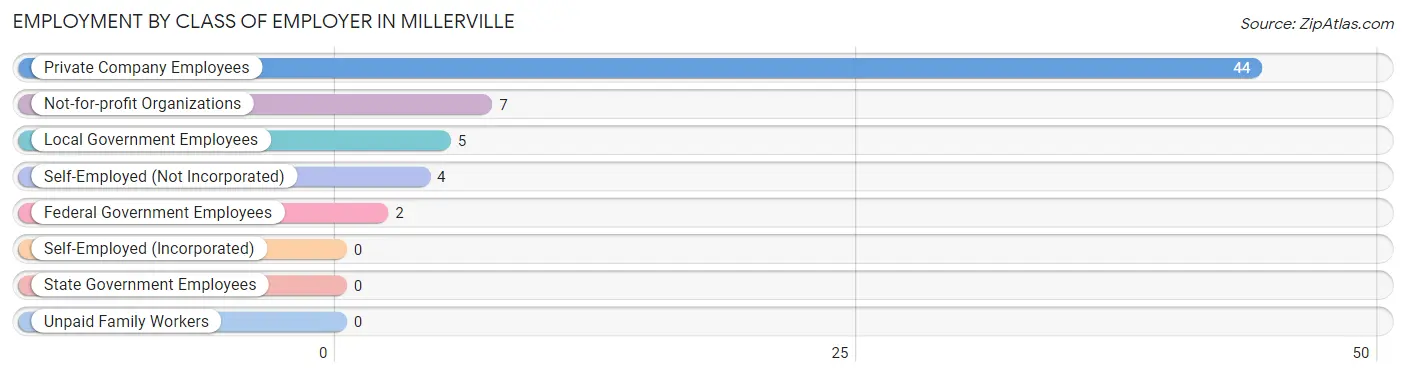
| Employer Class | # Employees | % Employees |
| Private Company Employees | 44 | 71.0% |
| Self-Employed (Incorporated) | 0 | 0.0% |
| Self-Employed (Not Incorporated) | 4 | 6.5% |
| Not-for-profit Organizations | 7 | 11.3% |
| Local Government Employees | 5 | 8.1% |
| State Government Employees | 0 | 0.0% |
| Federal Government Employees | 2 | 3.2% |
| Unpaid Family Workers | 0 | 0.0% |
| Total | 62 | 100.0% |
Employment Status by Age in Millerville
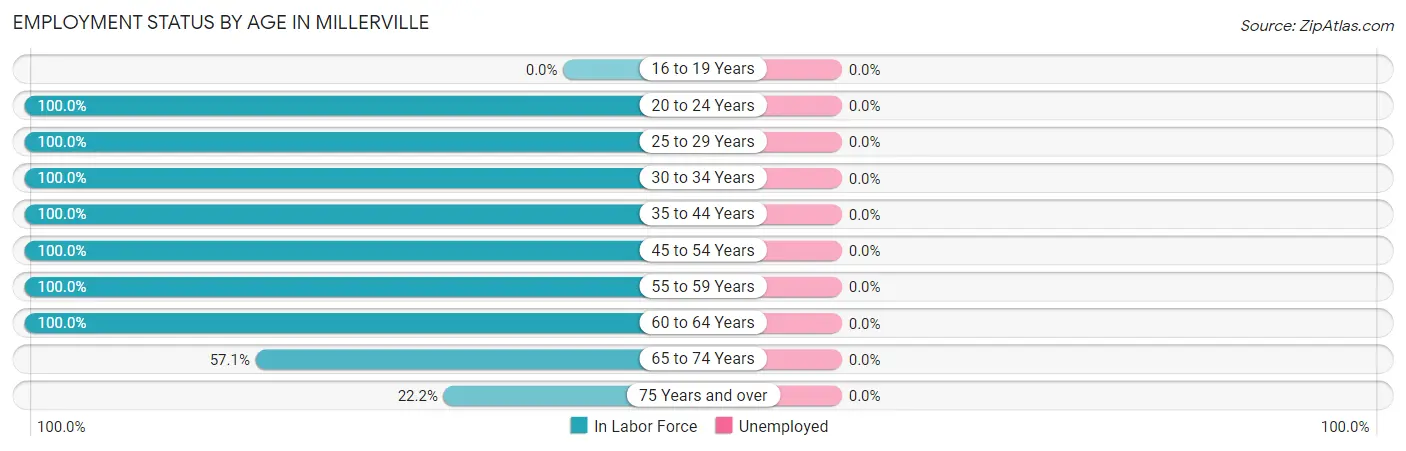
| Age Bracket | In Labor Force | Unemployed |
| 16 to 19 Years | 0 (0.0%) | 0 (0.0%) |
| 20 to 24 Years | 1 (100.0%) | 0 (0.0%) |
| 25 to 29 Years | 4 (100.0%) | 0 (0.0%) |
| 30 to 34 Years | 11 (100.0%) | 0 (0.0%) |
| 35 to 44 Years | 23 (100.0%) | 0 (0.0%) |
| 45 to 54 Years | 9 (100.0%) | 0 (0.0%) |
| 55 to 59 Years | 5 (100.0%) | 0 (0.0%) |
| 60 to 64 Years | 3 (100.0%) | 0 (0.0%) |
| 65 to 74 Years | 4 (57.1%) | 0 (0.0%) |
| 75 Years and over | 2 (22.2%) | 0 (0.0%) |
| Total | 62 (86.1%) | 0 (0.0%) |
Employment Status by Educational Attainment in Millerville
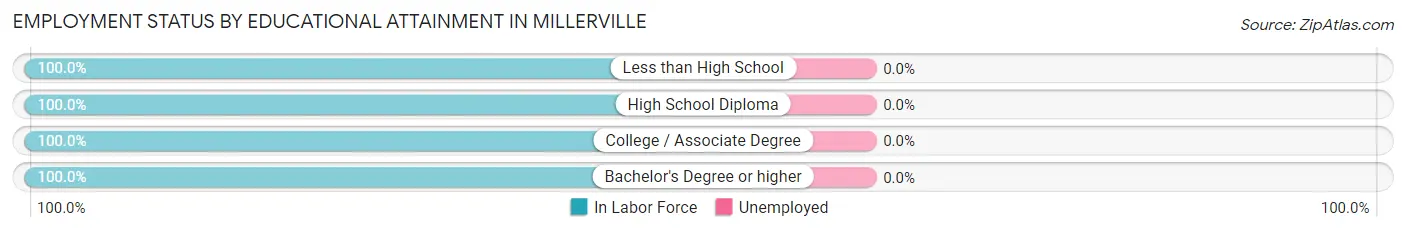
| Educational Attainment | In Labor Force | Unemployed |
| Less than High School | 2 (100.0%) | 0 (0.0%) |
| High School Diploma | 23 (100.0%) | 0 (0.0%) |
| College / Associate Degree | 17 (100.0%) | 0 (0.0%) |
| Bachelor's Degree or higher | 13 (100.0%) | 0 (0.0%) |
| Total | 55 (100.0%) | 0 (0.0%) |
Employment Occupations by Sex in Millerville
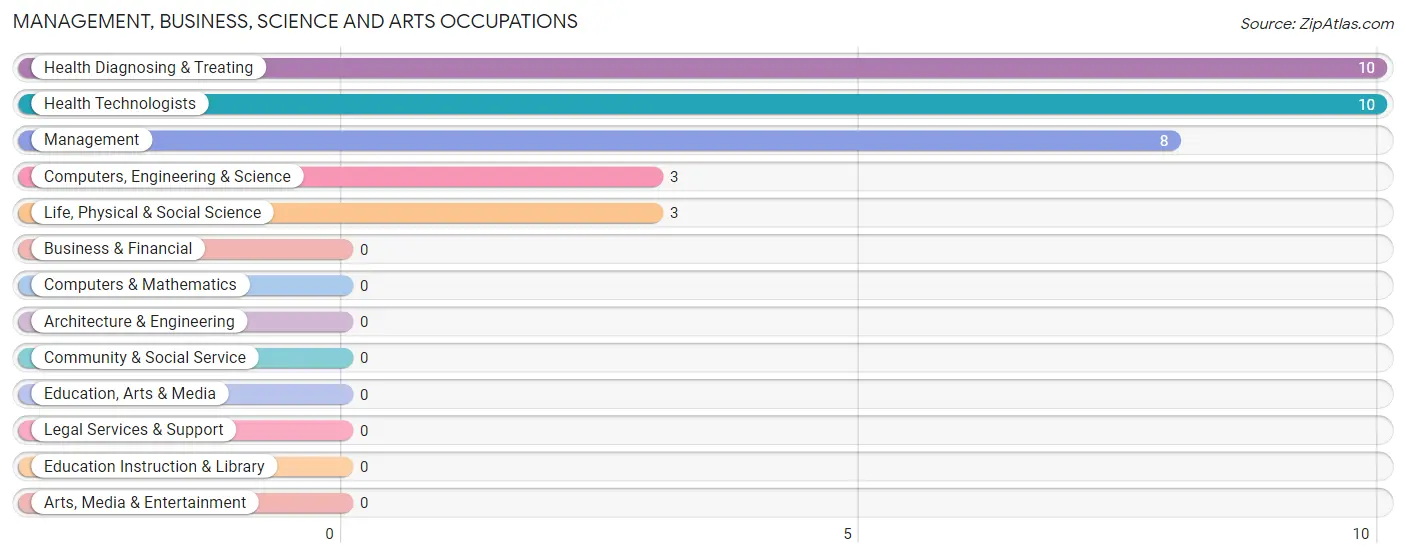
Management, Business, Science and Arts Occupations
The most common Management, Business, Science and Arts occupations in Millerville are Health Diagnosing & Treating (10 | 16.1%), Health Technologists (10 | 16.1%), Management (8 | 12.9%), Computers, Engineering & Science (3 | 4.8%), and Life, Physical & Social Science (3 | 4.8%).
Management, Business, Science and Arts Occupations by Sex
Within the Management, Business, Science and Arts occupations in Millerville, the most male-oriented occupations are Management (62.5%), Computers, Engineering & Science (33.3%), and Life, Physical & Social Science (33.3%), while the most female-oriented occupations are Health Diagnosing & Treating (100.0%), Health Technologists (100.0%), and Computers, Engineering & Science (66.7%).
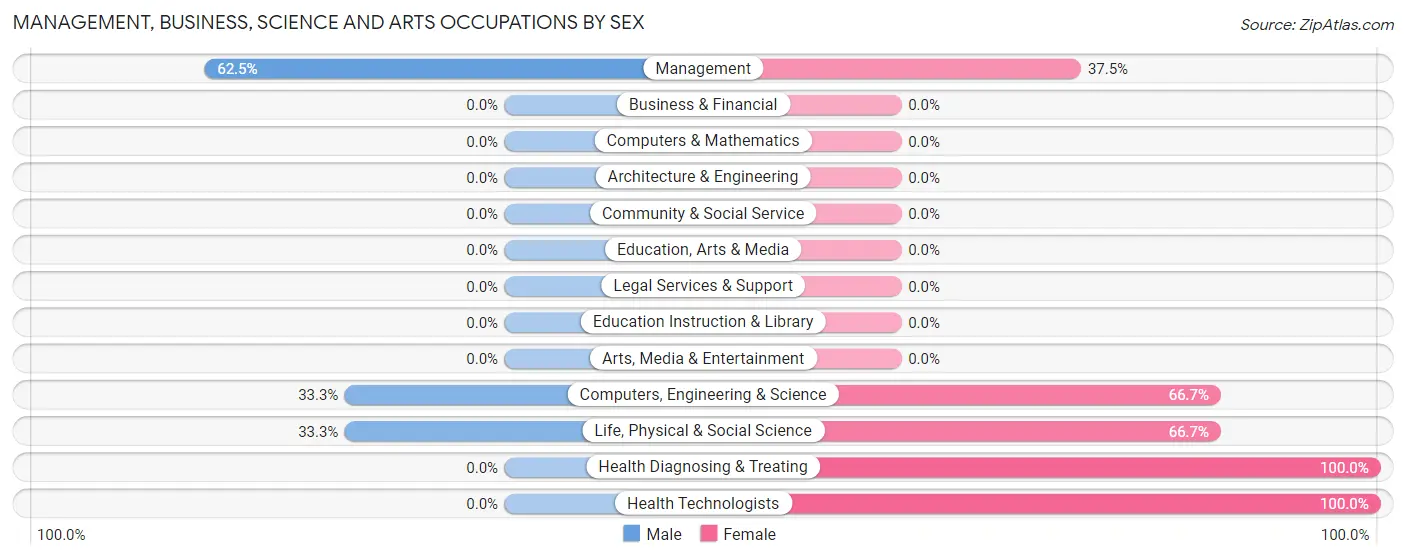
| Occupation | Male | Female |
| Management | 5 (62.5%) | 3 (37.5%) |
| Business & Financial | 0 (0.0%) | 0 (0.0%) |
| Computers, Engineering & Science | 1 (33.3%) | 2 (66.7%) |
| Computers & Mathematics | 0 (0.0%) | 0 (0.0%) |
| Architecture & Engineering | 0 (0.0%) | 0 (0.0%) |
| Life, Physical & Social Science | 1 (33.3%) | 2 (66.7%) |
| Community & Social Service | 0 (0.0%) | 0 (0.0%) |
| Education, Arts & Media | 0 (0.0%) | 0 (0.0%) |
| Legal Services & Support | 0 (0.0%) | 0 (0.0%) |
| Education Instruction & Library | 0 (0.0%) | 0 (0.0%) |
| Arts, Media & Entertainment | 0 (0.0%) | 0 (0.0%) |
| Health Diagnosing & Treating | 0 (0.0%) | 10 (100.0%) |
| Health Technologists | 0 (0.0%) | 10 (100.0%) |
| Total (Category) | 6 (28.6%) | 15 (71.4%) |
| Total (Overall) | 31 (50.0%) | 31 (50.0%) |
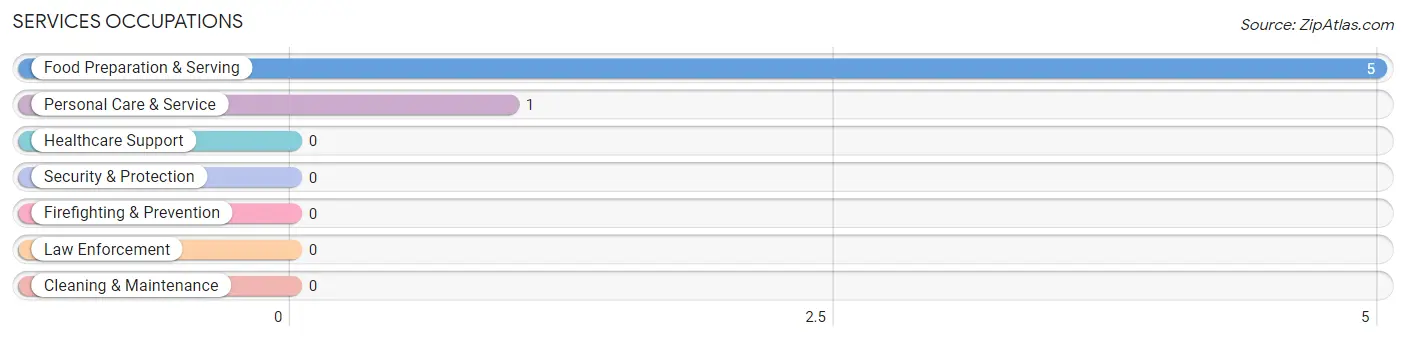
Services Occupations
The most common Services occupations in Millerville are Food Preparation & Serving (5 | 8.1%), and Personal Care & Service (1 | 1.6%).
Services Occupations by Sex
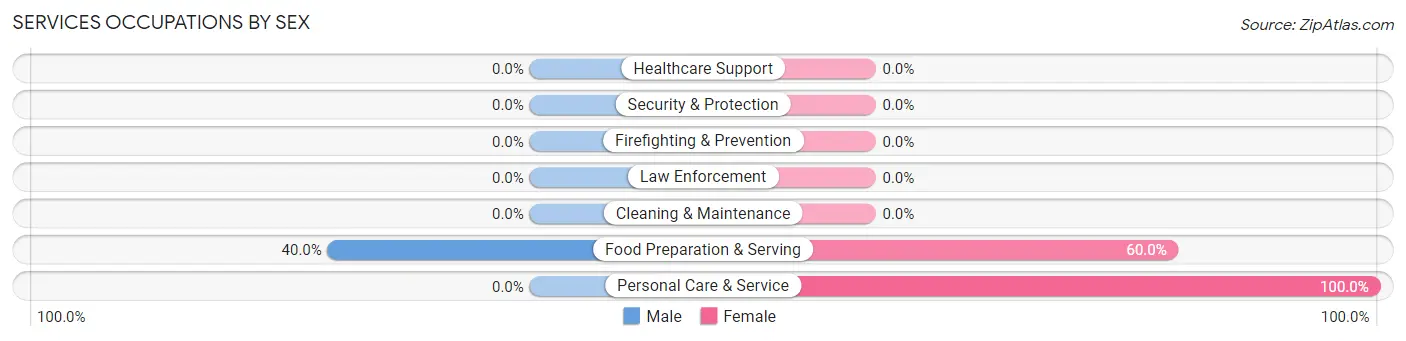
| Occupation | Male | Female |
| Healthcare Support | 0 (0.0%) | 0 (0.0%) |
| Security & Protection | 0 (0.0%) | 0 (0.0%) |
| Firefighting & Prevention | 0 (0.0%) | 0 (0.0%) |
| Law Enforcement | 0 (0.0%) | 0 (0.0%) |
| Food Preparation & Serving | 2 (40.0%) | 3 (60.0%) |
| Cleaning & Maintenance | 0 (0.0%) | 0 (0.0%) |
| Personal Care & Service | 0 (0.0%) | 1 (100.0%) |
| Total (Category) | 2 (33.3%) | 4 (66.7%) |
| Total (Overall) | 31 (50.0%) | 31 (50.0%) |
Sales and Office Occupations
The most common Sales and Office occupations in Millerville are Office & Administration (8 | 12.9%), and Sales & Related (6 | 9.7%).
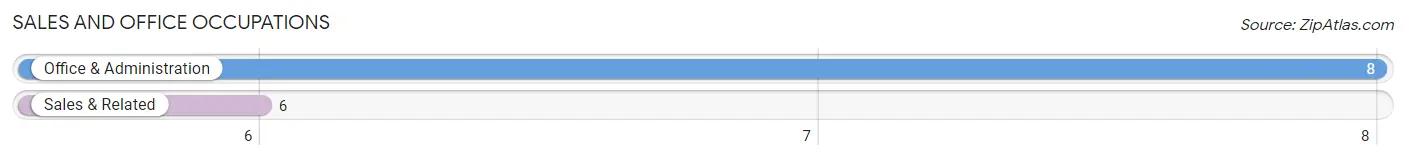
Sales and Office Occupations by Sex

| Occupation | Male | Female |
| Sales & Related | 4 (66.7%) | 2 (33.3%) |
| Office & Administration | 3 (37.5%) | 5 (62.5%) |
| Total (Category) | 7 (50.0%) | 7 (50.0%) |
| Total (Overall) | 31 (50.0%) | 31 (50.0%) |
Natural Resources, Construction and Maintenance Occupations
The most common Natural Resources, Construction and Maintenance occupations in Millerville are Construction & Extraction (10 | 16.1%), and Installation, Maintenance & Repair (4 | 6.5%).
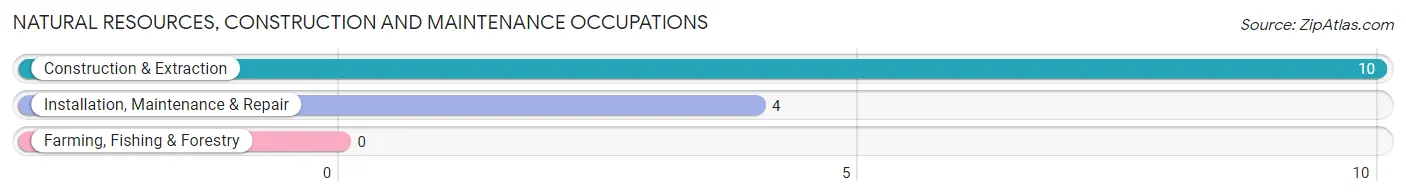
Natural Resources, Construction and Maintenance Occupations by Sex
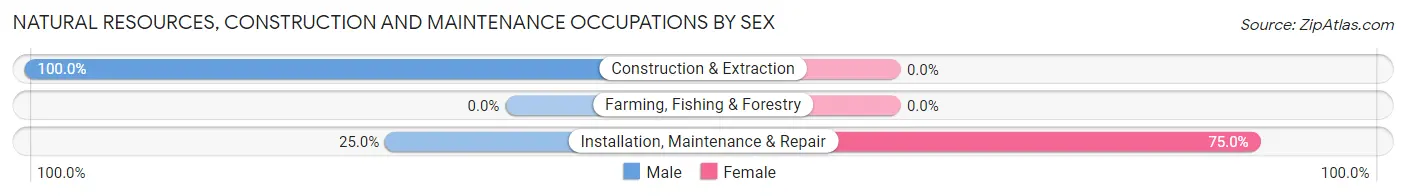
| Occupation | Male | Female |
| Farming, Fishing & Forestry | 0 (0.0%) | 0 (0.0%) |
| Construction & Extraction | 10 (100.0%) | 0 (0.0%) |
| Installation, Maintenance & Repair | 1 (25.0%) | 3 (75.0%) |
| Total (Category) | 11 (78.6%) | 3 (21.4%) |
| Total (Overall) | 31 (50.0%) | 31 (50.0%) |
Production, Transportation and Moving Occupations
The most common Production, Transportation and Moving occupations in Millerville are Production (4 | 6.5%), and Transportation (3 | 4.8%).
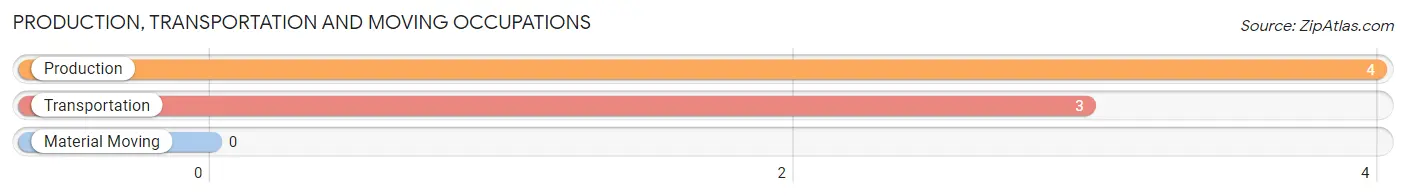
Production, Transportation and Moving Occupations by Sex
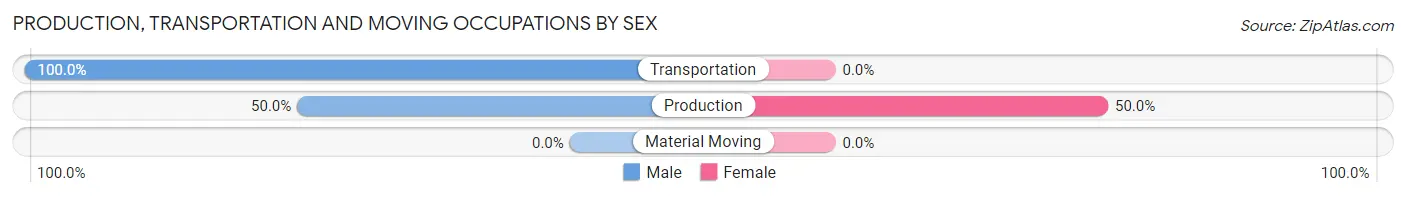
| Occupation | Male | Female |
| Production | 2 (50.0%) | 2 (50.0%) |
| Transportation | 3 (100.0%) | 0 (0.0%) |
| Material Moving | 0 (0.0%) | 0 (0.0%) |
| Total (Category) | 5 (71.4%) | 2 (28.6%) |
| Total (Overall) | 31 (50.0%) | 31 (50.0%) |
Employment Industries by Sex in Millerville
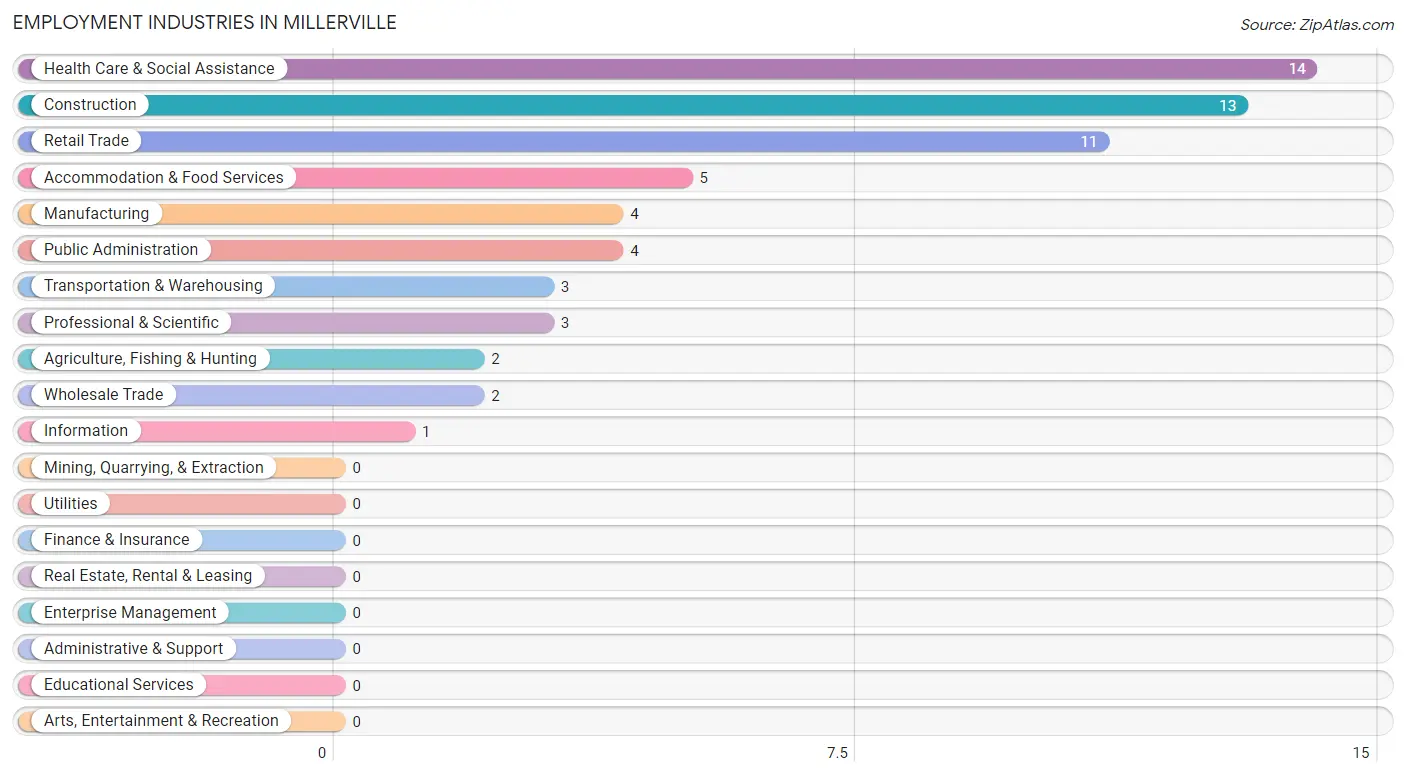
Employment Industries in Millerville
The major employment industries in Millerville include Health Care & Social Assistance (14 | 22.6%), Construction (13 | 21.0%), Retail Trade (11 | 17.7%), Accommodation & Food Services (5 | 8.1%), and Manufacturing (4 | 6.5%).
Employment Industries by Sex in Millerville
The Millerville industries that see more men than women are Agriculture, Fishing & Hunting (100.0%), Construction (100.0%), and Wholesale Trade (100.0%), whereas the industries that tend to have a higher number of women are Professional & Scientific (100.0%), Public Administration (100.0%), and Health Care & Social Assistance (85.7%).
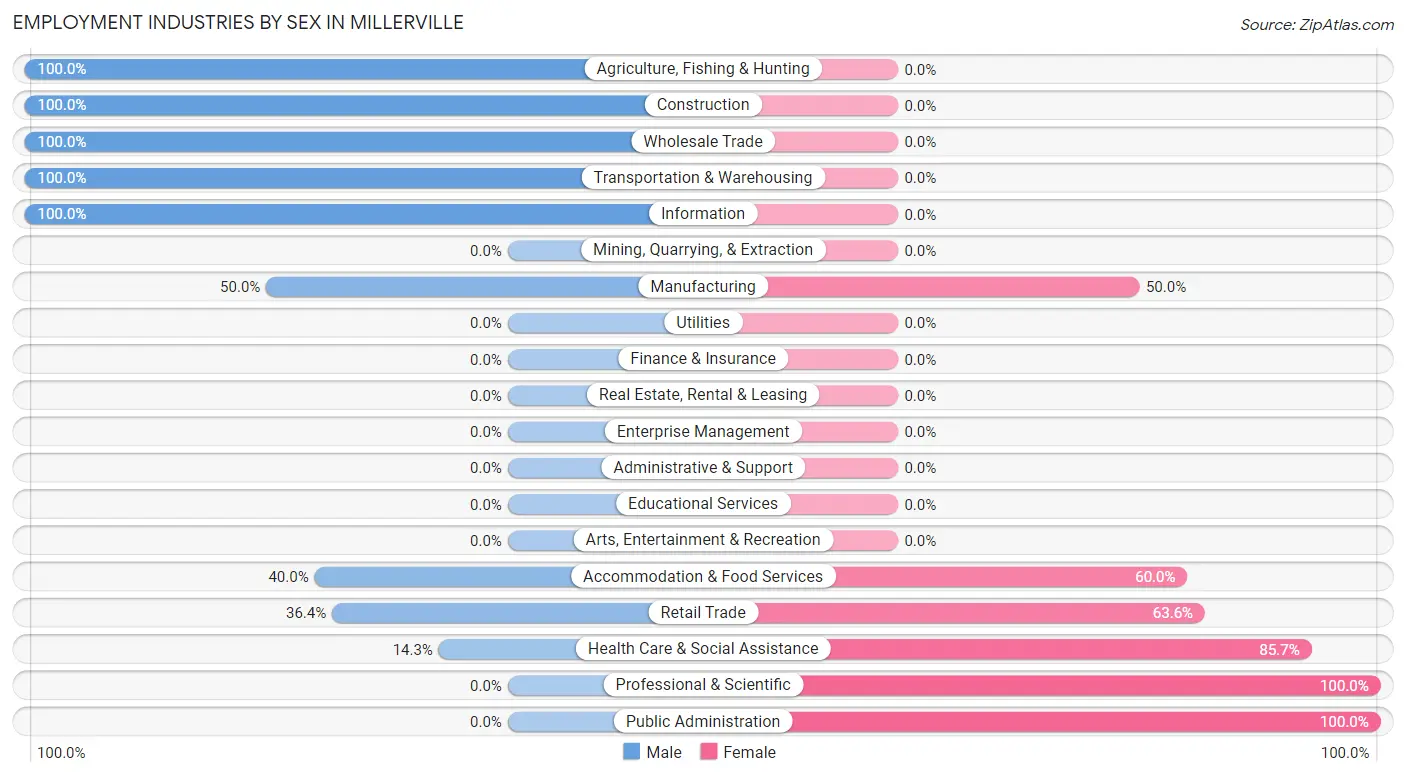
| Industry | Male | Female |
| Agriculture, Fishing & Hunting | 2 (100.0%) | 0 (0.0%) |
| Mining, Quarrying, & Extraction | 0 (0.0%) | 0 (0.0%) |
| Construction | 13 (100.0%) | 0 (0.0%) |
| Manufacturing | 2 (50.0%) | 2 (50.0%) |
| Wholesale Trade | 2 (100.0%) | 0 (0.0%) |
| Retail Trade | 4 (36.4%) | 7 (63.6%) |
| Transportation & Warehousing | 3 (100.0%) | 0 (0.0%) |
| Utilities | 0 (0.0%) | 0 (0.0%) |
| Information | 1 (100.0%) | 0 (0.0%) |
| Finance & Insurance | 0 (0.0%) | 0 (0.0%) |
| Real Estate, Rental & Leasing | 0 (0.0%) | 0 (0.0%) |
| Professional & Scientific | 0 (0.0%) | 3 (100.0%) |
| Enterprise Management | 0 (0.0%) | 0 (0.0%) |
| Administrative & Support | 0 (0.0%) | 0 (0.0%) |
| Educational Services | 0 (0.0%) | 0 (0.0%) |
| Health Care & Social Assistance | 2 (14.3%) | 12 (85.7%) |
| Arts, Entertainment & Recreation | 0 (0.0%) | 0 (0.0%) |
| Accommodation & Food Services | 2 (40.0%) | 3 (60.0%) |
| Public Administration | 0 (0.0%) | 4 (100.0%) |
| Total | 31 (50.0%) | 31 (50.0%) |
Education in Millerville
School Enrollment in Millerville
The most common levels of schooling among the 36 students in Millerville are elementary school (14 | 38.9%), kindergarten (10 | 27.8%), and middle school (7 | 19.4%).
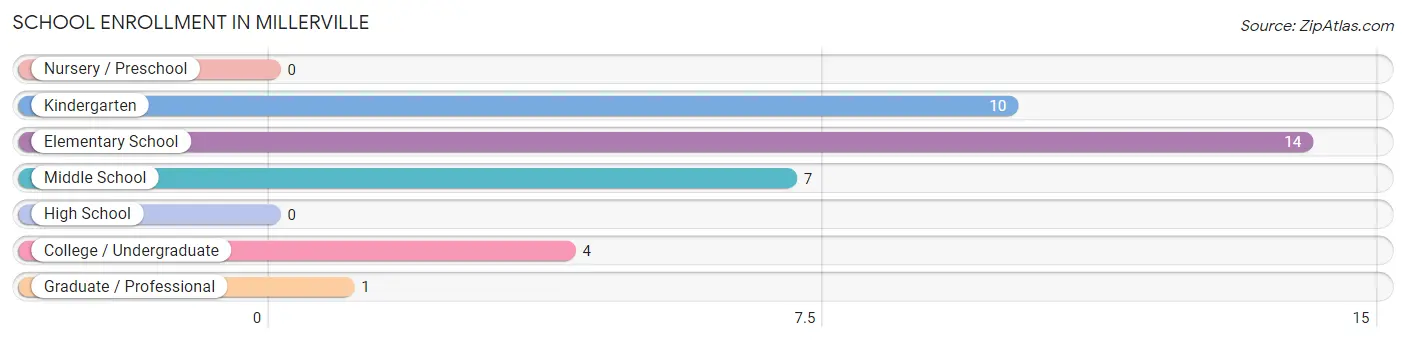
| School Level | # Students | % Students |
| Nursery / Preschool | 0 | 0.0% |
| Kindergarten | 10 | 27.8% |
| Elementary School | 14 | 38.9% |
| Middle School | 7 | 19.4% |
| High School | 0 | 0.0% |
| College / Undergraduate | 4 | 11.1% |
| Graduate / Professional | 1 | 2.8% |
| Total | 36 | 100.0% |
School Enrollment by Age by Funding Source in Millerville
Out of a total of 36 students who are enrolled in schools in Millerville, 5 (13.9%) attend a private institution, while the remaining 31 (86.1%) are enrolled in public schools. The age group of 35 years and over has the highest likelihood of being enrolled in private schools, with 1 (100.0% in the age bracket) enrolled. Conversely, the age group of 10 to 14 year olds has the lowest likelihood of being enrolled in a private school, with 5 (100.0% in the age bracket) attending a public institution.
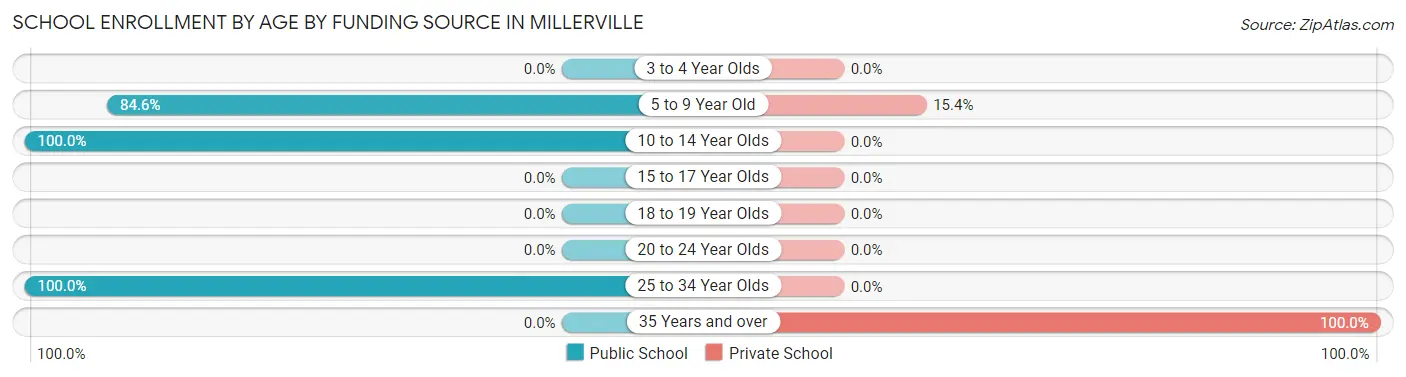
| Age Bracket | Public School | Private School |
| 3 to 4 Year Olds | 0 (0.0%) | 0 (0.0%) |
| 5 to 9 Year Old | 22 (84.6%) | 4 (15.4%) |
| 10 to 14 Year Olds | 5 (100.0%) | 0 (0.0%) |
| 15 to 17 Year Olds | 0 (0.0%) | 0 (0.0%) |
| 18 to 19 Year Olds | 0 (0.0%) | 0 (0.0%) |
| 20 to 24 Year Olds | 0 (0.0%) | 0 (0.0%) |
| 25 to 34 Year Olds | 4 (100.0%) | 0 (0.0%) |
| 35 Years and over | 0 (0.0%) | 1 (100.0%) |
| Total | 31 (86.1%) | 5 (13.9%) |
Educational Attainment by Field of Study in Millerville
Business (5 | 33.3%), science & technology (4 | 26.7%), bio, nature & agricultural (3 | 20.0%), arts & humanities (2 | 13.3%), and education (1 | 6.7%) are the most common fields of study among 15 individuals in Millerville who have obtained a bachelor's degree or higher.
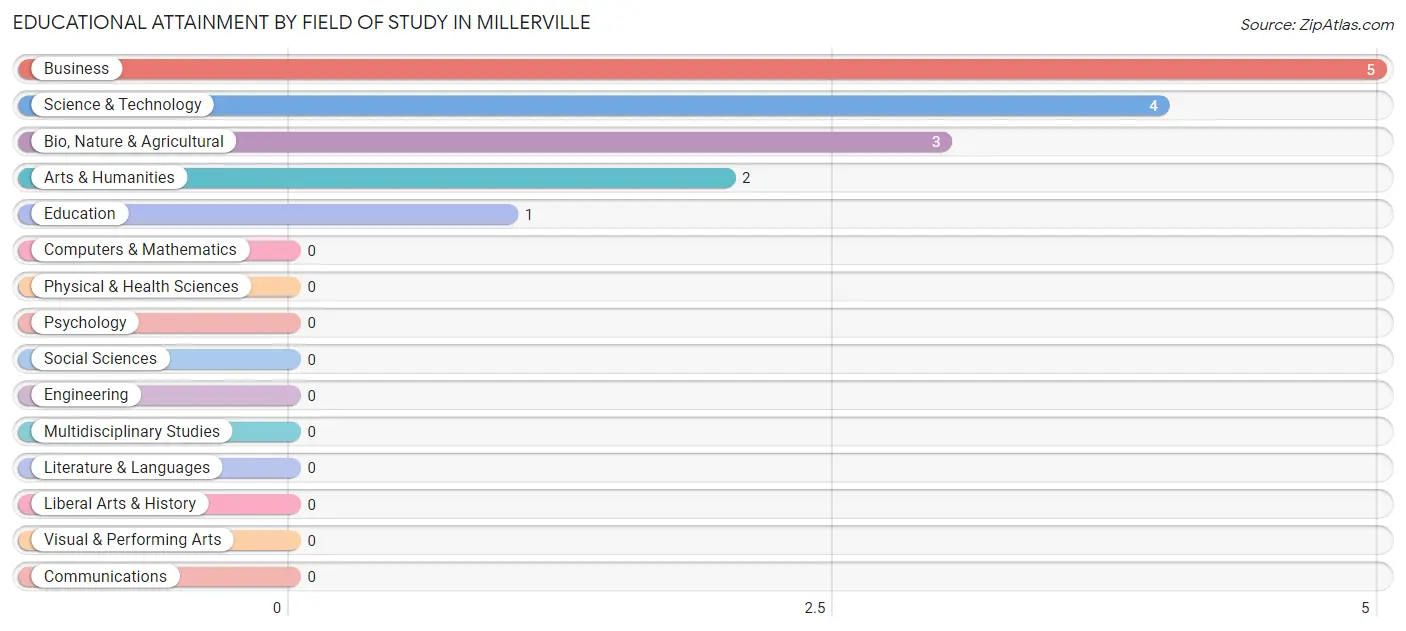
| Field of Study | # Graduates | % Graduates |
| Computers & Mathematics | 0 | 0.0% |
| Bio, Nature & Agricultural | 3 | 20.0% |
| Physical & Health Sciences | 0 | 0.0% |
| Psychology | 0 | 0.0% |
| Social Sciences | 0 | 0.0% |
| Engineering | 0 | 0.0% |
| Multidisciplinary Studies | 0 | 0.0% |
| Science & Technology | 4 | 26.7% |
| Business | 5 | 33.3% |
| Education | 1 | 6.7% |
| Literature & Languages | 0 | 0.0% |
| Liberal Arts & History | 0 | 0.0% |
| Visual & Performing Arts | 0 | 0.0% |
| Communications | 0 | 0.0% |
| Arts & Humanities | 2 | 13.3% |
| Total | 15 | 100.0% |
Transportation & Commute in Millerville
Vehicle Availability by Sex in Millerville
The most prevalent vehicle ownership categories in Millerville are males with 2 vehicles (10, accounting for 32.3%) and females with 2 vehicles (7, making up 32.3%).
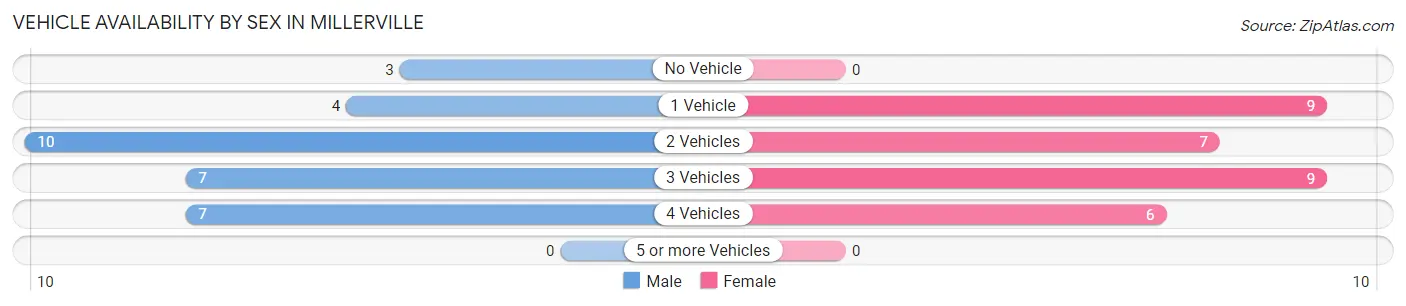
| Vehicles Available | Male | Female |
| No Vehicle | 3 (9.7%) | 0 (0.0%) |
| 1 Vehicle | 4 (12.9%) | 9 (29.0%) |
| 2 Vehicles | 10 (32.3%) | 7 (22.6%) |
| 3 Vehicles | 7 (22.6%) | 9 (29.0%) |
| 4 Vehicles | 7 (22.6%) | 6 (19.4%) |
| 5 or more Vehicles | 0 (0.0%) | 0 (0.0%) |
| Total | 31 (100.0%) | 31 (100.0%) |
Commute Time in Millerville
The most frequently occuring commute durations in Millerville are 30 to 34 minutes (21 commuters, 35.0%), 25 to 29 minutes (12 commuters, 20.0%), and 60 to 89 minutes (7 commuters, 11.7%).
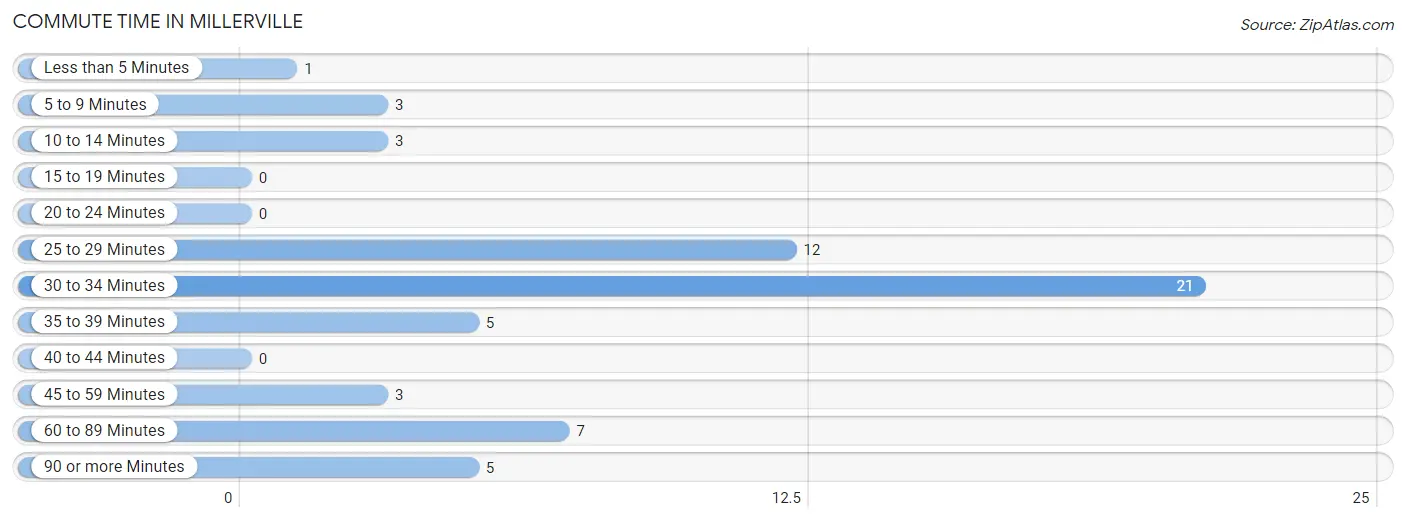
| Commute Time | # Commuters | % Commuters |
| Less than 5 Minutes | 1 | 1.7% |
| 5 to 9 Minutes | 3 | 5.0% |
| 10 to 14 Minutes | 3 | 5.0% |
| 15 to 19 Minutes | 0 | 0.0% |
| 20 to 24 Minutes | 0 | 0.0% |
| 25 to 29 Minutes | 12 | 20.0% |
| 30 to 34 Minutes | 21 | 35.0% |
| 35 to 39 Minutes | 5 | 8.3% |
| 40 to 44 Minutes | 0 | 0.0% |
| 45 to 59 Minutes | 3 | 5.0% |
| 60 to 89 Minutes | 7 | 11.7% |
| 90 or more Minutes | 5 | 8.3% |
Commute Time by Sex in Millerville
The most common commute times in Millerville are 25 to 29 minutes (10 commuters, 34.5%) for males and 30 to 34 minutes (12 commuters, 38.7%) for females.
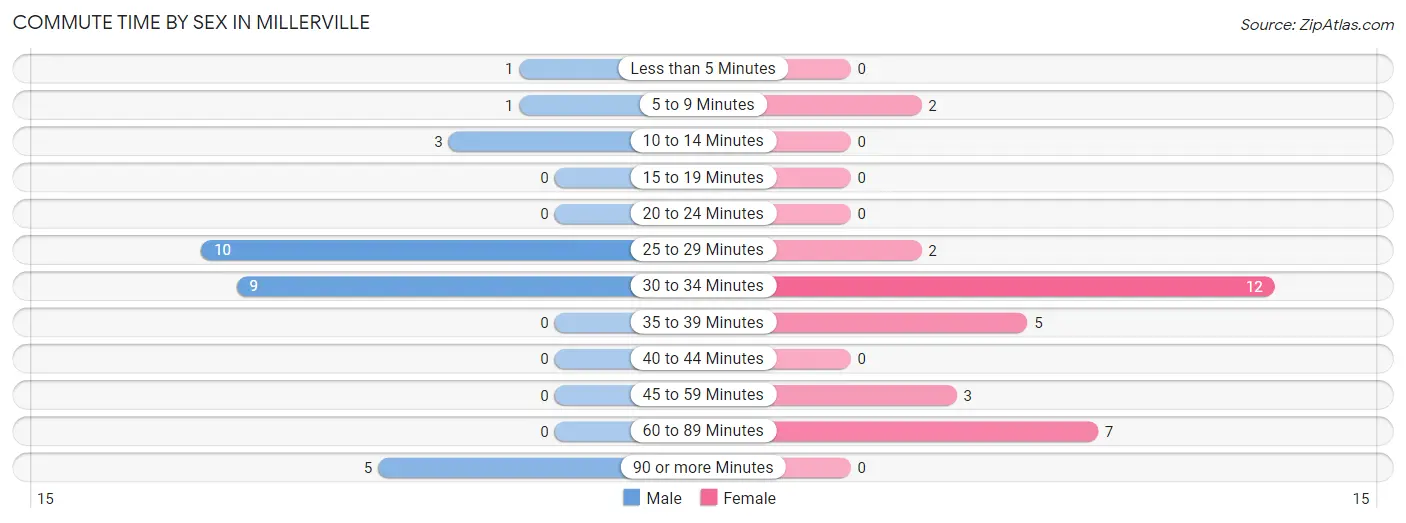
| Commute Time | Male | Female |
| Less than 5 Minutes | 1 (3.5%) | 0 (0.0%) |
| 5 to 9 Minutes | 1 (3.5%) | 2 (6.5%) |
| 10 to 14 Minutes | 3 (10.3%) | 0 (0.0%) |
| 15 to 19 Minutes | 0 (0.0%) | 0 (0.0%) |
| 20 to 24 Minutes | 0 (0.0%) | 0 (0.0%) |
| 25 to 29 Minutes | 10 (34.5%) | 2 (6.5%) |
| 30 to 34 Minutes | 9 (31.0%) | 12 (38.7%) |
| 35 to 39 Minutes | 0 (0.0%) | 5 (16.1%) |
| 40 to 44 Minutes | 0 (0.0%) | 0 (0.0%) |
| 45 to 59 Minutes | 0 (0.0%) | 3 (9.7%) |
| 60 to 89 Minutes | 0 (0.0%) | 7 (22.6%) |
| 90 or more Minutes | 5 (17.2%) | 0 (0.0%) |
Time of Departure to Work by Sex in Millerville
The most frequent times of departure to work in Millerville are 12:00 AM to 4:59 AM (7, 24.1%) for males and 7:00 AM to 7:29 AM (7, 22.6%) for females.
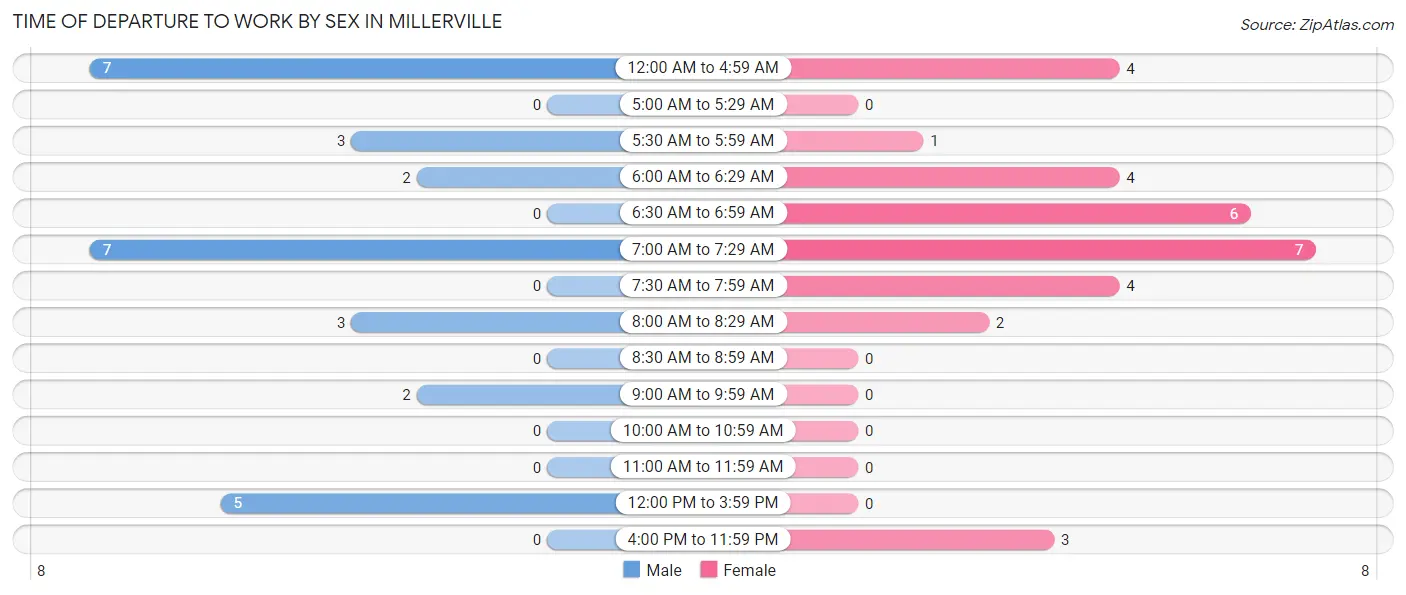
| Time of Departure | Male | Female |
| 12:00 AM to 4:59 AM | 7 (24.1%) | 4 (12.9%) |
| 5:00 AM to 5:29 AM | 0 (0.0%) | 0 (0.0%) |
| 5:30 AM to 5:59 AM | 3 (10.3%) | 1 (3.2%) |
| 6:00 AM to 6:29 AM | 2 (6.9%) | 4 (12.9%) |
| 6:30 AM to 6:59 AM | 0 (0.0%) | 6 (19.4%) |
| 7:00 AM to 7:29 AM | 7 (24.1%) | 7 (22.6%) |
| 7:30 AM to 7:59 AM | 0 (0.0%) | 4 (12.9%) |
| 8:00 AM to 8:29 AM | 3 (10.3%) | 2 (6.5%) |
| 8:30 AM to 8:59 AM | 0 (0.0%) | 0 (0.0%) |
| 9:00 AM to 9:59 AM | 2 (6.9%) | 0 (0.0%) |
| 10:00 AM to 10:59 AM | 0 (0.0%) | 0 (0.0%) |
| 11:00 AM to 11:59 AM | 0 (0.0%) | 0 (0.0%) |
| 12:00 PM to 3:59 PM | 5 (17.2%) | 0 (0.0%) |
| 4:00 PM to 11:59 PM | 0 (0.0%) | 3 (9.7%) |
| Total | 29 (100.0%) | 31 (100.0%) |
Housing Occupancy in Millerville
Occupancy by Ownership in Millerville
Of the total 46 dwellings in Millerville, owner-occupied units account for 35 (76.1%), while renter-occupied units make up 11 (23.9%).
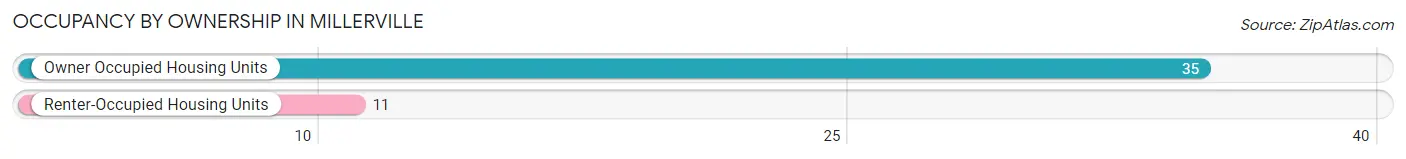
| Occupancy | # Housing Units | % Housing Units |
| Owner Occupied Housing Units | 35 | 76.1% |
| Renter-Occupied Housing Units | 11 | 23.9% |
| Total Occupied Housing Units | 46 | 100.0% |
Occupancy by Household Size in Millerville
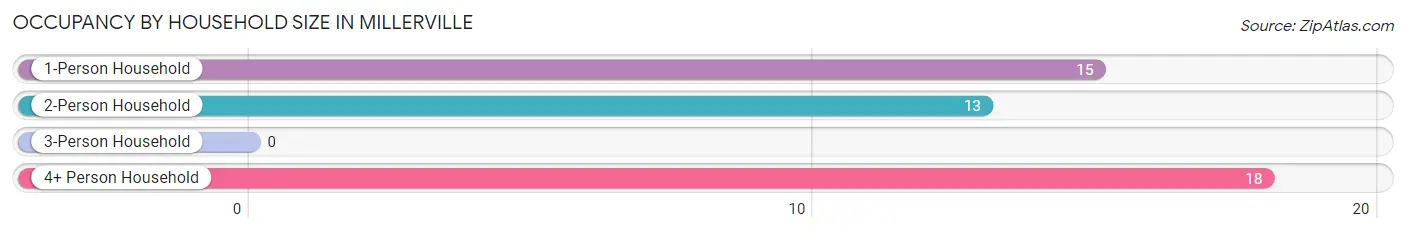
| Household Size | # Housing Units | % Housing Units |
| 1-Person Household | 15 | 32.6% |
| 2-Person Household | 13 | 28.3% |
| 3-Person Household | 0 | 0.0% |
| 4+ Person Household | 18 | 39.1% |
| Total Housing Units | 46 | 100.0% |
Occupancy by Ownership by Household Size in Millerville
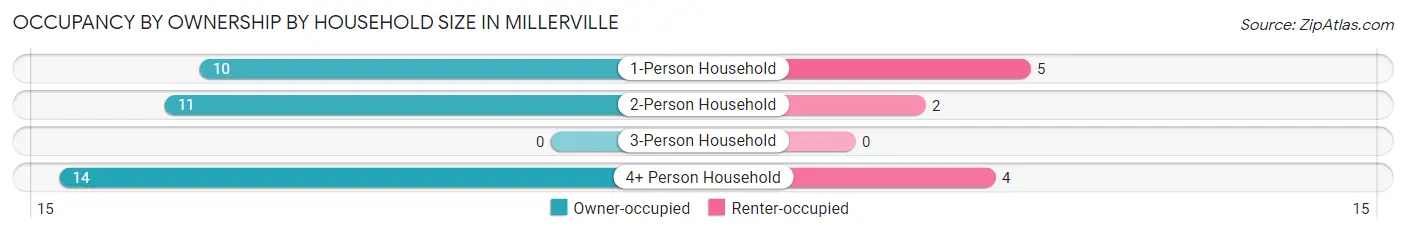
| Household Size | Owner-occupied | Renter-occupied |
| 1-Person Household | 10 (66.7%) | 5 (33.3%) |
| 2-Person Household | 11 (84.6%) | 2 (15.4%) |
| 3-Person Household | 0 (0.0%) | 0 (0.0%) |
| 4+ Person Household | 14 (77.8%) | 4 (22.2%) |
| Total Housing Units | 35 (76.1%) | 11 (23.9%) |
Occupancy by Educational Attainment in Millerville
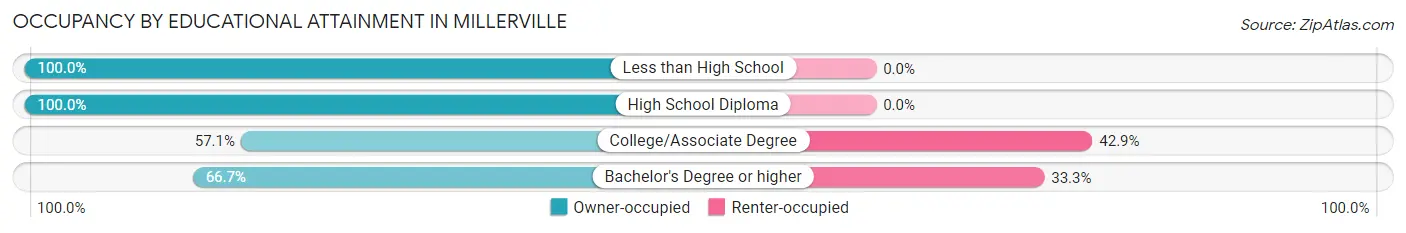
| Household Size | Owner-occupied | Renter-occupied |
| Less than High School | 4 (100.0%) | 0 (0.0%) |
| High School Diploma | 13 (100.0%) | 0 (0.0%) |
| College/Associate Degree | 8 (57.1%) | 6 (42.9%) |
| Bachelor's Degree or higher | 10 (66.7%) | 5 (33.3%) |
Occupancy by Age of Householder in Millerville
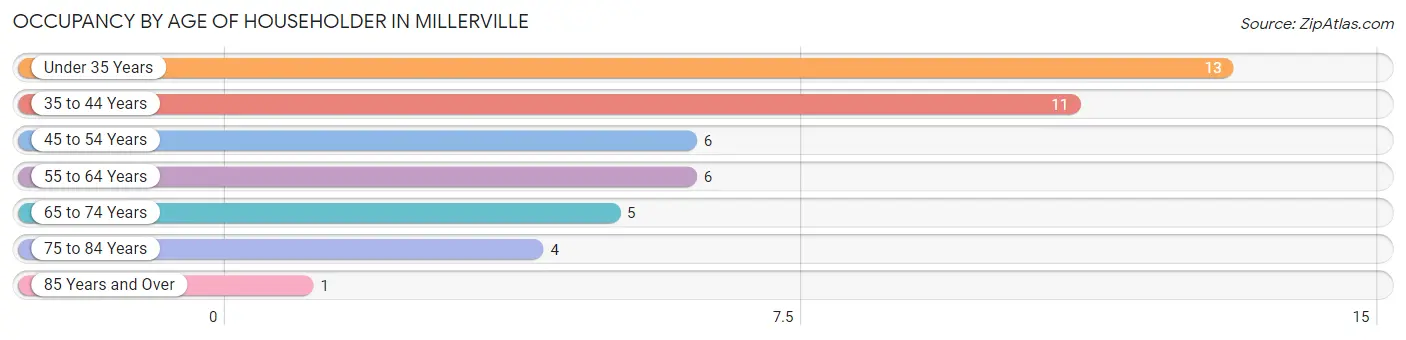
| Age Bracket | # Households | % Households |
| Under 35 Years | 13 | 28.3% |
| 35 to 44 Years | 11 | 23.9% |
| 45 to 54 Years | 6 | 13.0% |
| 55 to 64 Years | 6 | 13.0% |
| 65 to 74 Years | 5 | 10.9% |
| 75 to 84 Years | 4 | 8.7% |
| 85 Years and Over | 1 | 2.2% |
| Total | 46 | 100.0% |
Housing Finances in Millerville
Median Income by Occupancy in Millerville
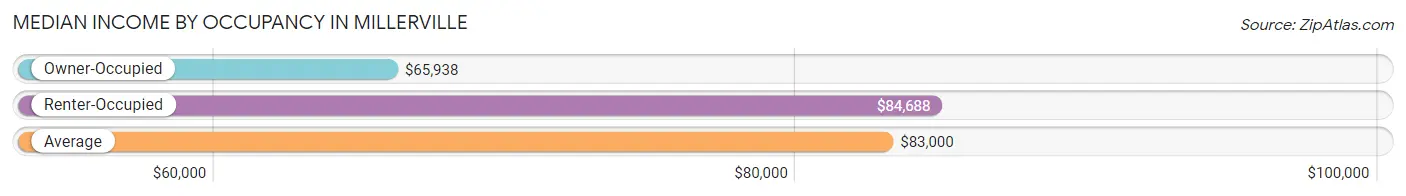
| Occupancy Type | # Households | Median Income |
| Owner-Occupied | 35 (76.1%) | $65,938 |
| Renter-Occupied | 11 (23.9%) | $84,688 |
| Average | 46 (100.0%) | $83,000 |
Occupancy by Householder Income Bracket in Millerville
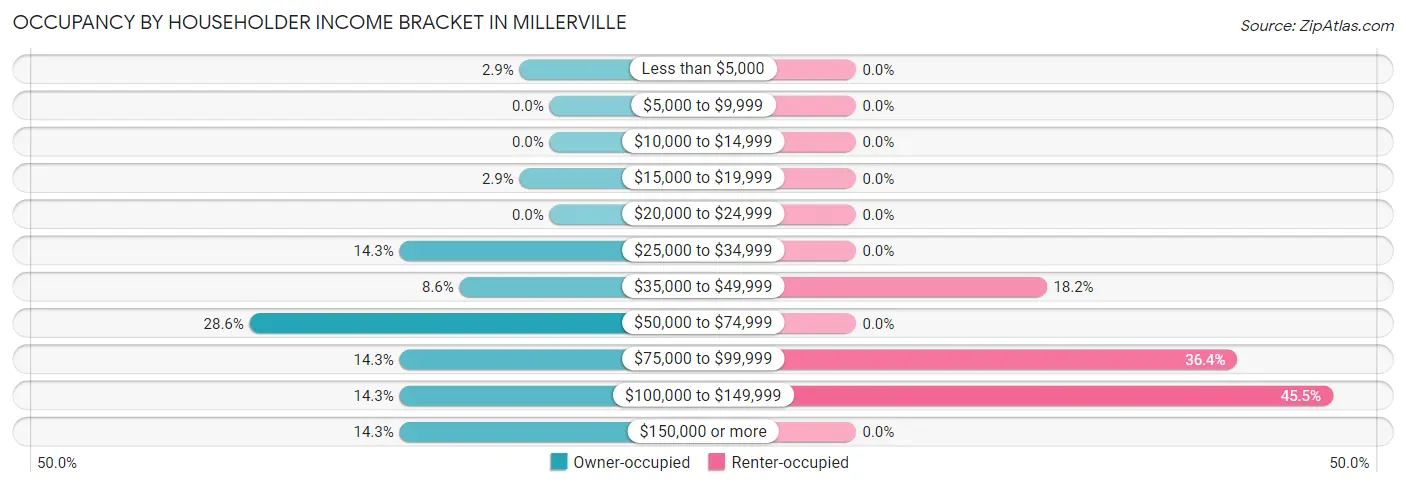
| Income Bracket | Owner-occupied | Renter-occupied |
| Less than $5,000 | 1 (2.9%) | 0 (0.0%) |
| $5,000 to $9,999 | 0 (0.0%) | 0 (0.0%) |
| $10,000 to $14,999 | 0 (0.0%) | 0 (0.0%) |
| $15,000 to $19,999 | 1 (2.9%) | 0 (0.0%) |
| $20,000 to $24,999 | 0 (0.0%) | 0 (0.0%) |
| $25,000 to $34,999 | 5 (14.3%) | 0 (0.0%) |
| $35,000 to $49,999 | 3 (8.6%) | 2 (18.2%) |
| $50,000 to $74,999 | 10 (28.6%) | 0 (0.0%) |
| $75,000 to $99,999 | 5 (14.3%) | 4 (36.4%) |
| $100,000 to $149,999 | 5 (14.3%) | 5 (45.5%) |
| $150,000 or more | 5 (14.3%) | 0 (0.0%) |
| Total | 35 (100.0%) | 11 (100.0%) |
Monthly Housing Cost Tiers in Millerville
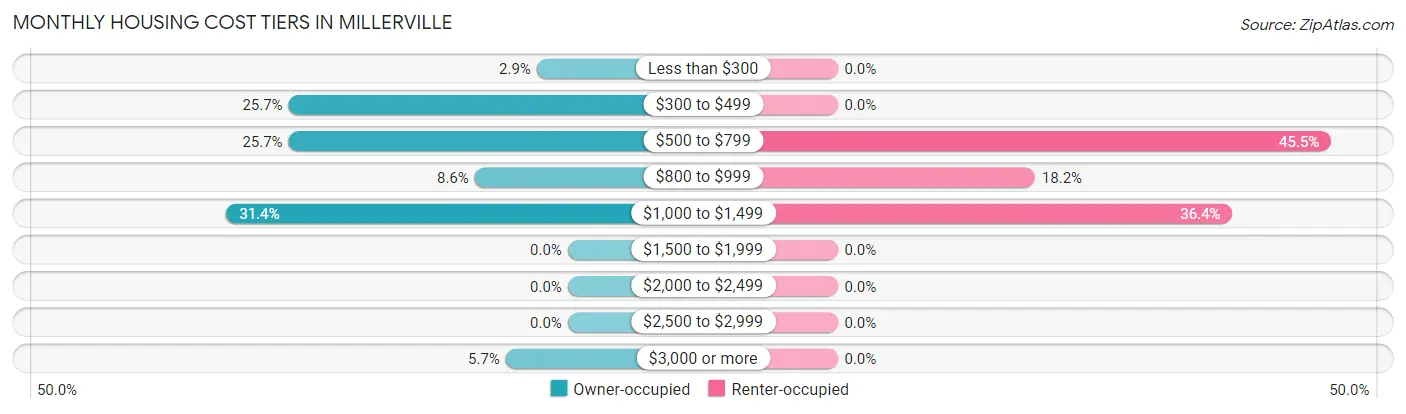
| Monthly Cost | Owner-occupied | Renter-occupied |
| Less than $300 | 1 (2.9%) | 0 (0.0%) |
| $300 to $499 | 9 (25.7%) | 0 (0.0%) |
| $500 to $799 | 9 (25.7%) | 5 (45.5%) |
| $800 to $999 | 3 (8.6%) | 2 (18.2%) |
| $1,000 to $1,499 | 11 (31.4%) | 4 (36.4%) |
| $1,500 to $1,999 | 0 (0.0%) | 0 (0.0%) |
| $2,000 to $2,499 | 0 (0.0%) | 0 (0.0%) |
| $2,500 to $2,999 | 0 (0.0%) | 0 (0.0%) |
| $3,000 or more | 2 (5.7%) | 0 (0.0%) |
| Total | 35 (100.0%) | 11 (100.0%) |
Physical Housing Characteristics in Millerville
Housing Structures in Millerville
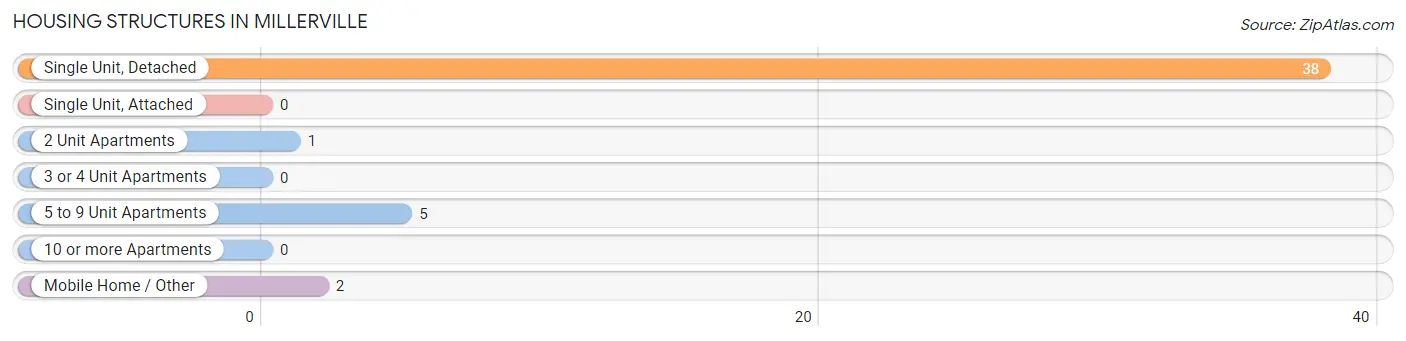
| Structure Type | # Housing Units | % Housing Units |
| Single Unit, Detached | 38 | 82.6% |
| Single Unit, Attached | 0 | 0.0% |
| 2 Unit Apartments | 1 | 2.2% |
| 3 or 4 Unit Apartments | 0 | 0.0% |
| 5 to 9 Unit Apartments | 5 | 10.9% |
| 10 or more Apartments | 0 | 0.0% |
| Mobile Home / Other | 2 | 4.3% |
| Total | 46 | 100.0% |
Housing Structures by Occupancy in Millerville
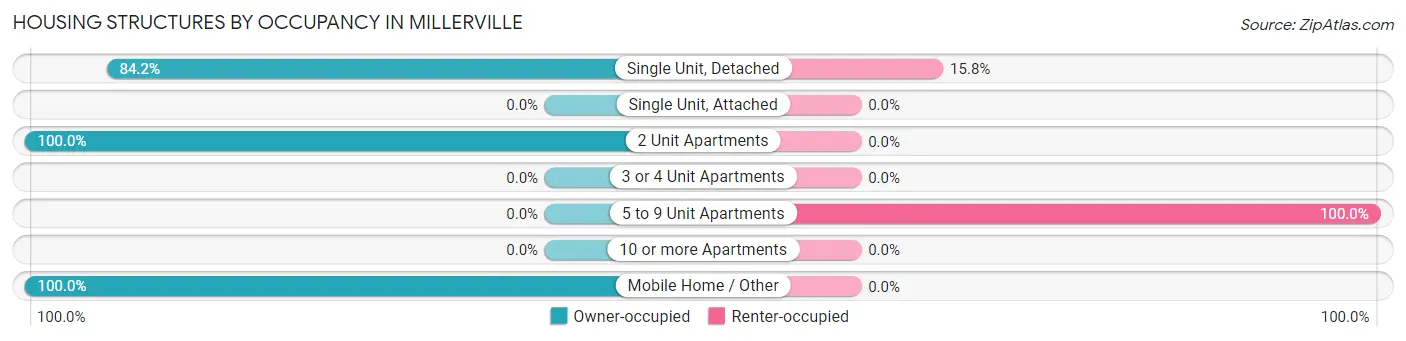
| Structure Type | Owner-occupied | Renter-occupied |
| Single Unit, Detached | 32 (84.2%) | 6 (15.8%) |
| Single Unit, Attached | 0 (0.0%) | 0 (0.0%) |
| 2 Unit Apartments | 1 (100.0%) | 0 (0.0%) |
| 3 or 4 Unit Apartments | 0 (0.0%) | 0 (0.0%) |
| 5 to 9 Unit Apartments | 0 (0.0%) | 5 (100.0%) |
| 10 or more Apartments | 0 (0.0%) | 0 (0.0%) |
| Mobile Home / Other | 2 (100.0%) | 0 (0.0%) |
| Total | 35 (76.1%) | 11 (23.9%) |
Housing Structures by Number of Rooms in Millerville
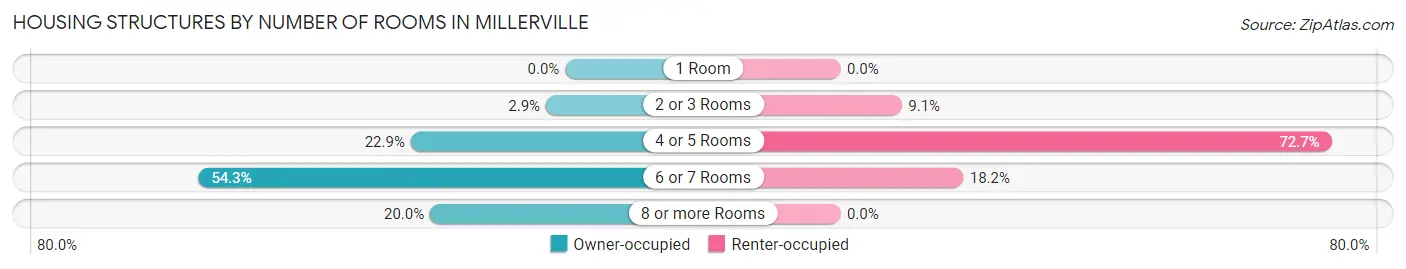
| Number of Rooms | Owner-occupied | Renter-occupied |
| 1 Room | 0 (0.0%) | 0 (0.0%) |
| 2 or 3 Rooms | 1 (2.9%) | 1 (9.1%) |
| 4 or 5 Rooms | 8 (22.9%) | 8 (72.7%) |
| 6 or 7 Rooms | 19 (54.3%) | 2 (18.2%) |
| 8 or more Rooms | 7 (20.0%) | 0 (0.0%) |
| Total | 35 (100.0%) | 11 (100.0%) |
Housing Structure by Heating Type in Millerville
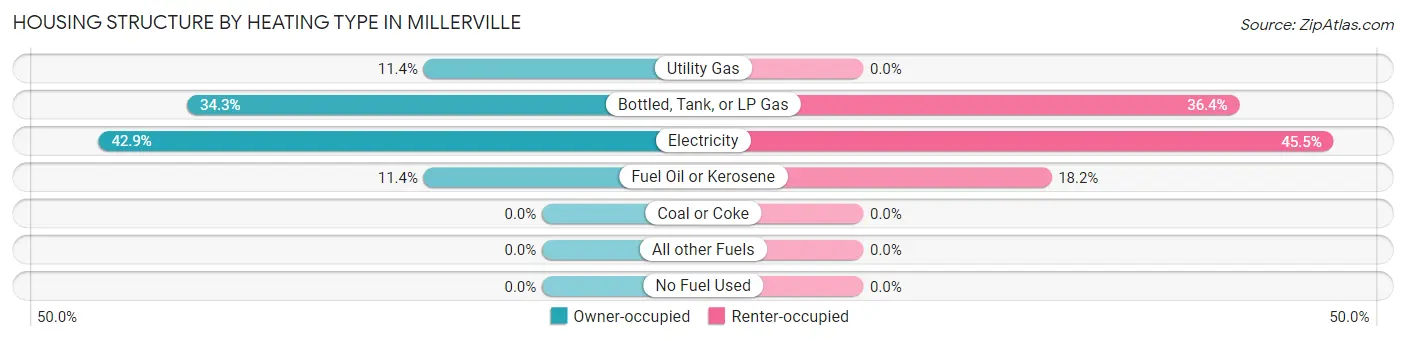
| Heating Type | Owner-occupied | Renter-occupied |
| Utility Gas | 4 (11.4%) | 0 (0.0%) |
| Bottled, Tank, or LP Gas | 12 (34.3%) | 4 (36.4%) |
| Electricity | 15 (42.9%) | 5 (45.5%) |
| Fuel Oil or Kerosene | 4 (11.4%) | 2 (18.2%) |
| Coal or Coke | 0 (0.0%) | 0 (0.0%) |
| All other Fuels | 0 (0.0%) | 0 (0.0%) |
| No Fuel Used | 0 (0.0%) | 0 (0.0%) |
| Total | 35 (100.0%) | 11 (100.0%) |
Household Vehicle Usage in Millerville
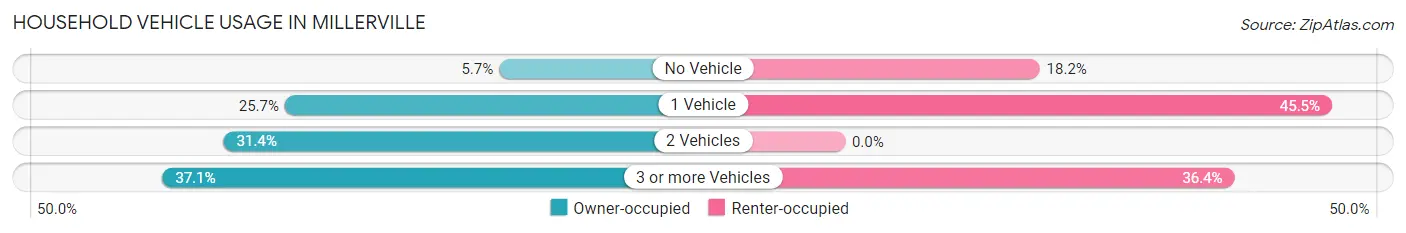
| Vehicles per Household | Owner-occupied | Renter-occupied |
| No Vehicle | 2 (5.7%) | 2 (18.2%) |
| 1 Vehicle | 9 (25.7%) | 5 (45.5%) |
| 2 Vehicles | 11 (31.4%) | 0 (0.0%) |
| 3 or more Vehicles | 13 (37.1%) | 4 (36.4%) |
| Total | 35 (100.0%) | 11 (100.0%) |
Real Estate & Mortgages in Millerville
Real Estate and Mortgage Overview in Millerville
| Characteristic | Without Mortgage | With Mortgage |
| Housing Units | 17 | 18 |
| Median Property Value | $152,500 | $181,300 |
| Median Household Income | $58,125 | $4 |
| Monthly Housing Costs | $463 | $2 |
| Real Estate Taxes | $1,250 | $0 |
Property Value by Mortgage Status in Millerville
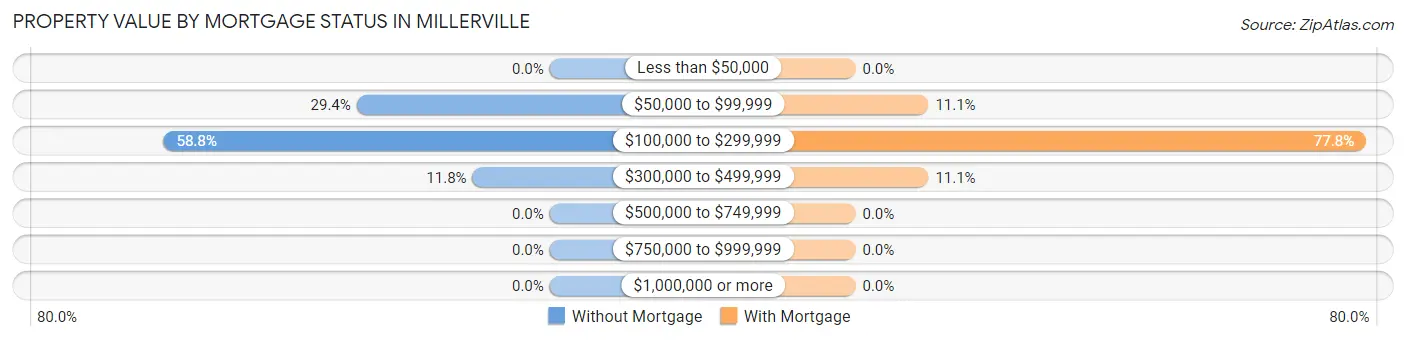
| Property Value | Without Mortgage | With Mortgage |
| Less than $50,000 | 0 (0.0%) | 0 (0.0%) |
| $50,000 to $99,999 | 5 (29.4%) | 2 (11.1%) |
| $100,000 to $299,999 | 10 (58.8%) | 14 (77.8%) |
| $300,000 to $499,999 | 2 (11.8%) | 2 (11.1%) |
| $500,000 to $749,999 | 0 (0.0%) | 0 (0.0%) |
| $750,000 to $999,999 | 0 (0.0%) | 0 (0.0%) |
| $1,000,000 or more | 0 (0.0%) | 0 (0.0%) |
| Total | 17 (100.0%) | 18 (100.0%) |
Household Income by Mortgage Status in Millerville
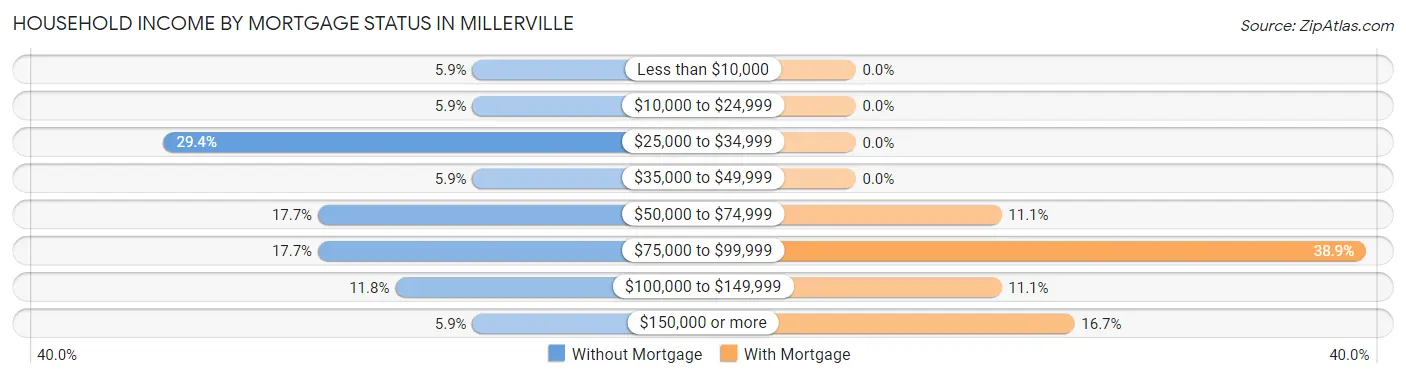
| Household Income | Without Mortgage | With Mortgage |
| Less than $10,000 | 1 (5.9%) | 0 (0.0%) |
| $10,000 to $24,999 | 1 (5.9%) | 0 (0.0%) |
| $25,000 to $34,999 | 5 (29.4%) | 0 (0.0%) |
| $35,000 to $49,999 | 1 (5.9%) | 0 (0.0%) |
| $50,000 to $74,999 | 3 (17.6%) | 2 (11.1%) |
| $75,000 to $99,999 | 3 (17.6%) | 7 (38.9%) |
| $100,000 to $149,999 | 2 (11.8%) | 2 (11.1%) |
| $150,000 or more | 1 (5.9%) | 3 (16.7%) |
| Total | 17 (100.0%) | 18 (100.0%) |
Property Value to Household Income Ratio in Millerville
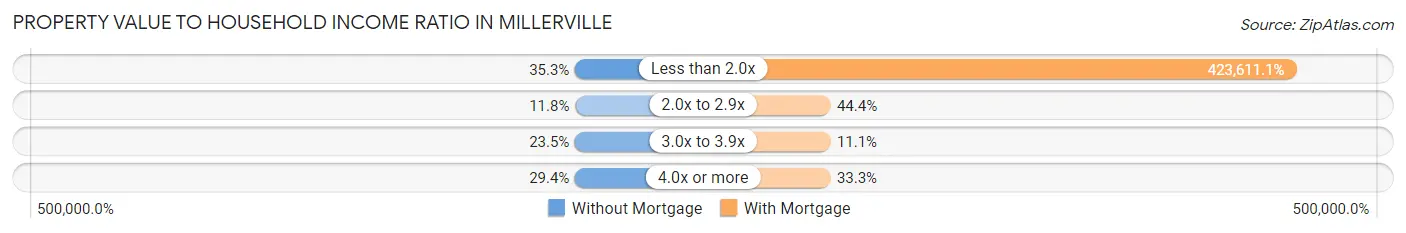
| Value-to-Income Ratio | Without Mortgage | With Mortgage |
| Less than 2.0x | 6 (35.3%) | 76,250 (423,611.1%) |
| 2.0x to 2.9x | 2 (11.8%) | 8 (44.4%) |
| 3.0x to 3.9x | 4 (23.5%) | 2 (11.1%) |
| 4.0x or more | 5 (29.4%) | 6 (33.3%) |
| Total | 17 (100.0%) | 18 (100.0%) |
Real Estate Taxes by Mortgage Status in Millerville
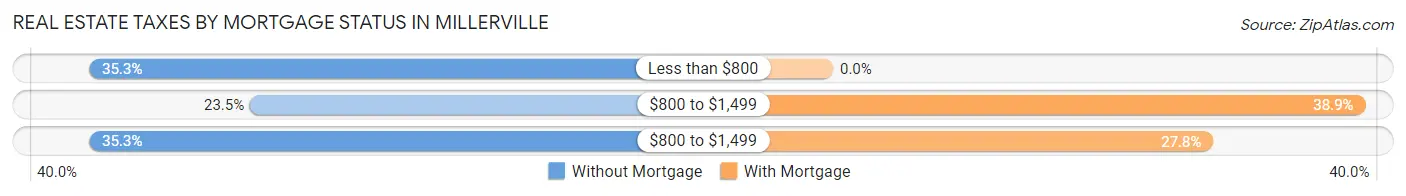
| Property Taxes | Without Mortgage | With Mortgage |
| Less than $800 | 6 (35.3%) | 0 (0.0%) |
| $800 to $1,499 | 4 (23.5%) | 7 (38.9%) |
| $800 to $1,499 | 6 (35.3%) | 5 (27.8%) |
| Total | 17 (100.0%) | 18 (100.0%) |
Health & Disability in Millerville
Health Insurance Coverage by Age in Millerville
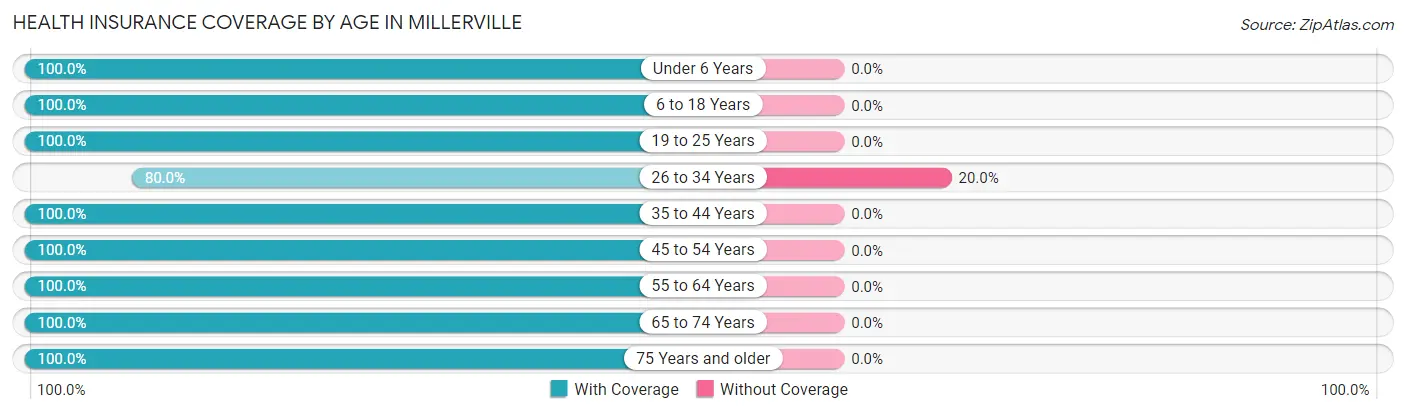
| Age Bracket | With Coverage | Without Coverage |
| Under 6 Years | 18 (100.0%) | 0 (0.0%) |
| 6 to 18 Years | 22 (100.0%) | 0 (0.0%) |
| 19 to 25 Years | 1 (100.0%) | 0 (0.0%) |
| 26 to 34 Years | 12 (80.0%) | 3 (20.0%) |
| 35 to 44 Years | 23 (100.0%) | 0 (0.0%) |
| 45 to 54 Years | 9 (100.0%) | 0 (0.0%) |
| 55 to 64 Years | 8 (100.0%) | 0 (0.0%) |
| 65 to 74 Years | 7 (100.0%) | 0 (0.0%) |
| 75 Years and older | 9 (100.0%) | 0 (0.0%) |
| Total | 109 (97.3%) | 3 (2.7%) |
Health Insurance Coverage by Citizenship Status in Millerville
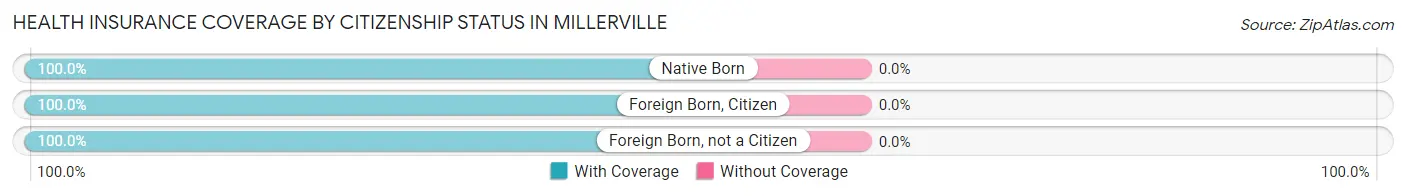
| Citizenship Status | With Coverage | Without Coverage |
| Native Born | 18 (100.0%) | 0 (0.0%) |
| Foreign Born, Citizen | 22 (100.0%) | 0 (0.0%) |
| Foreign Born, not a Citizen | 1 (100.0%) | 0 (0.0%) |
Health Insurance Coverage by Household Income in Millerville
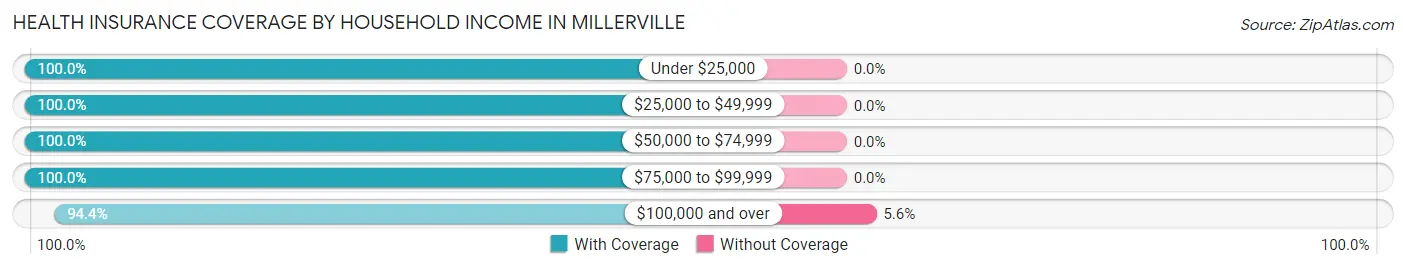
| Household Income | With Coverage | Without Coverage |
| Under $25,000 | 2 (100.0%) | 0 (0.0%) |
| $25,000 to $49,999 | 14 (100.0%) | 0 (0.0%) |
| $50,000 to $74,999 | 24 (100.0%) | 0 (0.0%) |
| $75,000 to $99,999 | 18 (100.0%) | 0 (0.0%) |
| $100,000 and over | 51 (94.4%) | 3 (5.6%) |
Public vs Private Health Insurance Coverage by Age in Millerville
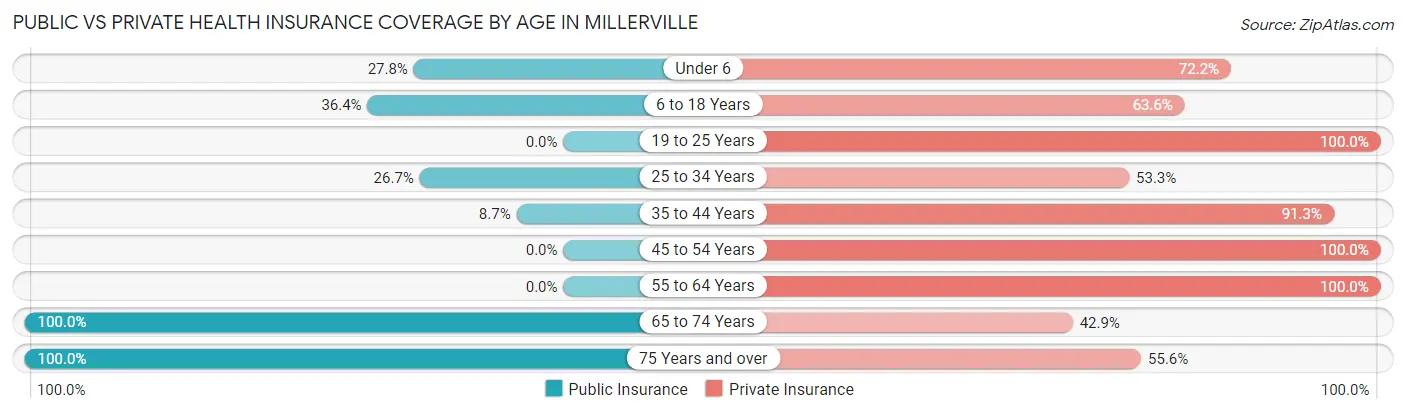
| Age Bracket | Public Insurance | Private Insurance |
| Under 6 | 5 (27.8%) | 13 (72.2%) |
| 6 to 18 Years | 8 (36.4%) | 14 (63.6%) |
| 19 to 25 Years | 0 (0.0%) | 1 (100.0%) |
| 25 to 34 Years | 4 (26.7%) | 8 (53.3%) |
| 35 to 44 Years | 2 (8.7%) | 21 (91.3%) |
| 45 to 54 Years | 0 (0.0%) | 9 (100.0%) |
| 55 to 64 Years | 0 (0.0%) | 8 (100.0%) |
| 65 to 74 Years | 7 (100.0%) | 3 (42.9%) |
| 75 Years and over | 9 (100.0%) | 5 (55.6%) |
| Total | 35 (31.2%) | 82 (73.2%) |
Disability Status by Sex by Age in Millerville
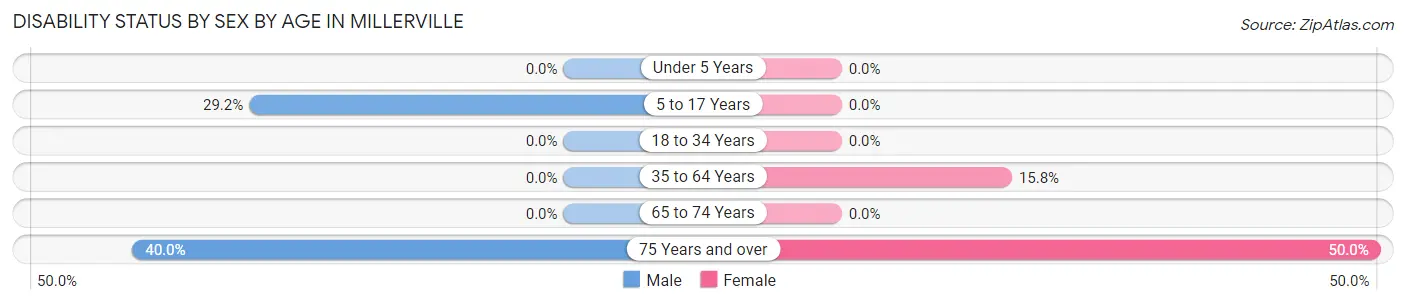
| Age Bracket | Male | Female |
| Under 5 Years | 0 (0.0%) | 0 (0.0%) |
| 5 to 17 Years | 7 (29.2%) | 0 (0.0%) |
| 18 to 34 Years | 0 (0.0%) | 0 (0.0%) |
| 35 to 64 Years | 0 (0.0%) | 3 (15.8%) |
| 65 to 74 Years | 0 (0.0%) | 0 (0.0%) |
| 75 Years and over | 2 (40.0%) | 2 (50.0%) |
Disability Class by Sex by Age in Millerville
Disability Class: Hearing Difficulty
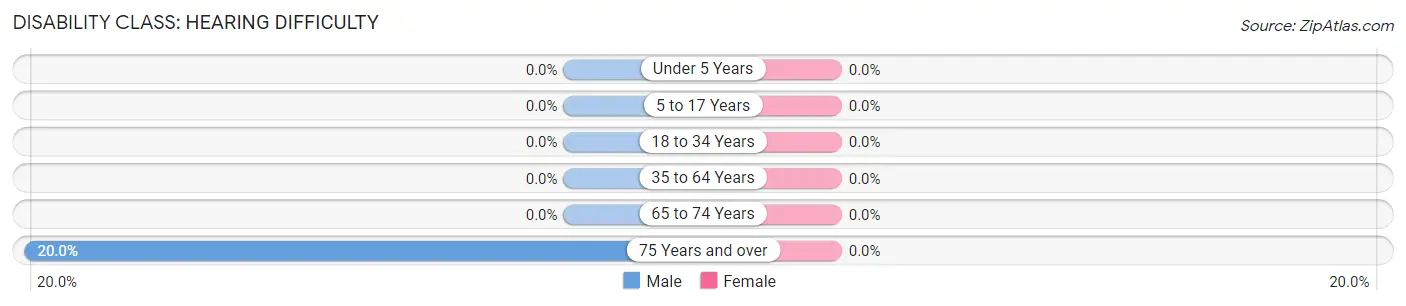
| Age Bracket | Male | Female |
| Under 5 Years | 0 (0.0%) | 0 (0.0%) |
| 5 to 17 Years | 0 (0.0%) | 0 (0.0%) |
| 18 to 34 Years | 0 (0.0%) | 0 (0.0%) |
| 35 to 64 Years | 0 (0.0%) | 0 (0.0%) |
| 65 to 74 Years | 0 (0.0%) | 0 (0.0%) |
| 75 Years and over | 1 (20.0%) | 0 (0.0%) |
Disability Class: Vision Difficulty
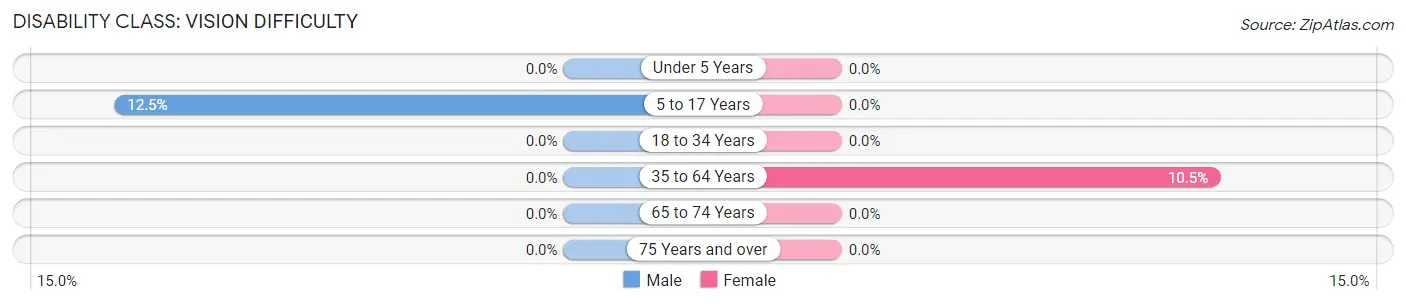
| Age Bracket | Male | Female |
| Under 5 Years | 0 (0.0%) | 0 (0.0%) |
| 5 to 17 Years | 3 (12.5%) | 0 (0.0%) |
| 18 to 34 Years | 0 (0.0%) | 0 (0.0%) |
| 35 to 64 Years | 0 (0.0%) | 2 (10.5%) |
| 65 to 74 Years | 0 (0.0%) | 0 (0.0%) |
| 75 Years and over | 0 (0.0%) | 0 (0.0%) |
Disability Class: Cognitive Difficulty
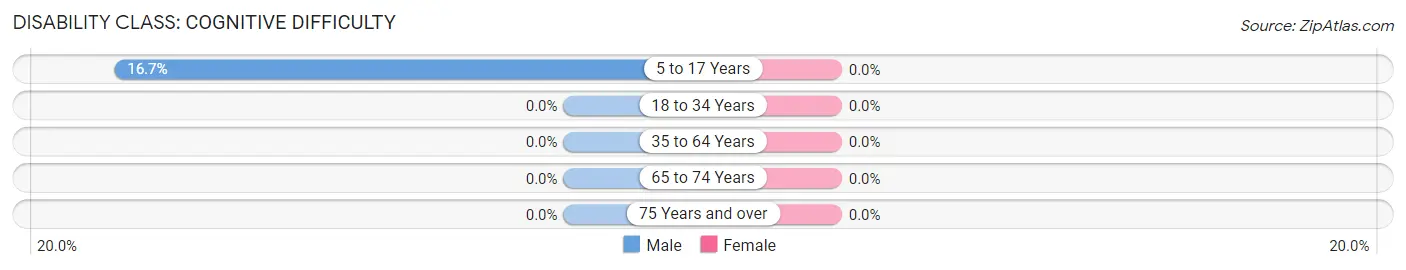
| Age Bracket | Male | Female |
| 5 to 17 Years | 4 (16.7%) | 0 (0.0%) |
| 18 to 34 Years | 0 (0.0%) | 0 (0.0%) |
| 35 to 64 Years | 0 (0.0%) | 0 (0.0%) |
| 65 to 74 Years | 0 (0.0%) | 0 (0.0%) |
| 75 Years and over | 0 (0.0%) | 0 (0.0%) |
Disability Class: Ambulatory Difficulty
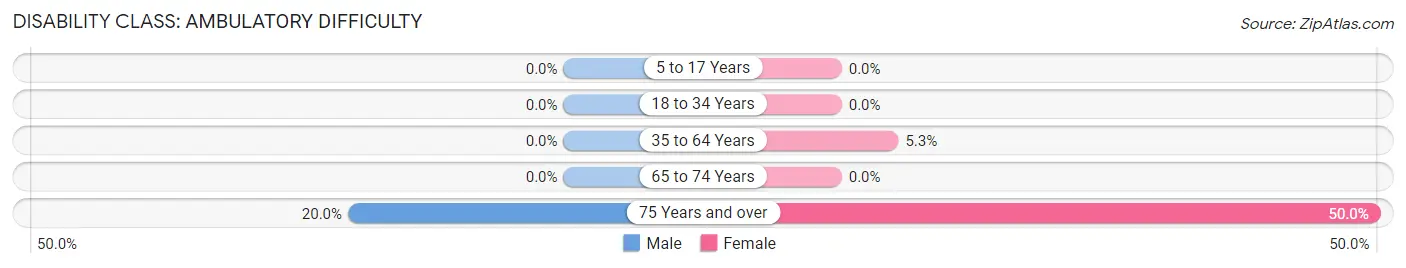
| Age Bracket | Male | Female |
| 5 to 17 Years | 0 (0.0%) | 0 (0.0%) |
| 18 to 34 Years | 0 (0.0%) | 0 (0.0%) |
| 35 to 64 Years | 0 (0.0%) | 1 (5.3%) |
| 65 to 74 Years | 0 (0.0%) | 0 (0.0%) |
| 75 Years and over | 1 (20.0%) | 2 (50.0%) |
Disability Class: Self-Care Difficulty
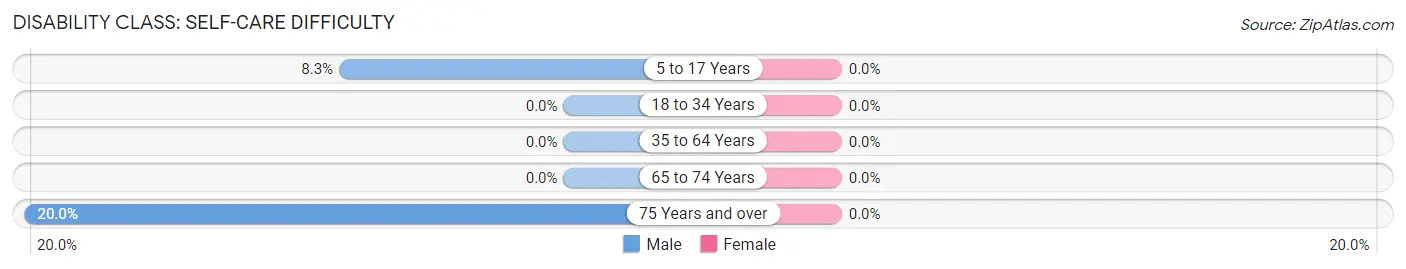
| Age Bracket | Male | Female |
| 5 to 17 Years | 2 (8.3%) | 0 (0.0%) |
| 18 to 34 Years | 0 (0.0%) | 0 (0.0%) |
| 35 to 64 Years | 0 (0.0%) | 0 (0.0%) |
| 65 to 74 Years | 0 (0.0%) | 0 (0.0%) |
| 75 Years and over | 1 (20.0%) | 0 (0.0%) |
Technology Access in Millerville
Computing Device Access in Millerville
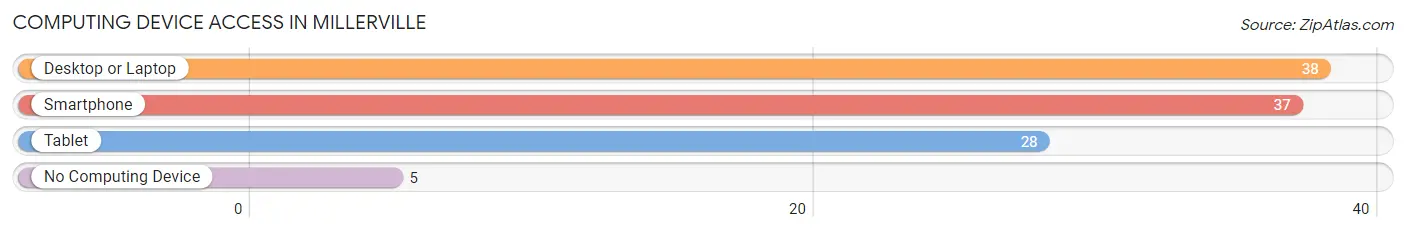
| Device Type | # Households | % Households |
| Desktop or Laptop | 38 | 82.6% |
| Smartphone | 37 | 80.4% |
| Tablet | 28 | 60.9% |
| No Computing Device | 5 | 10.9% |
| Total | 46 | 100.0% |
Internet Access in Millerville
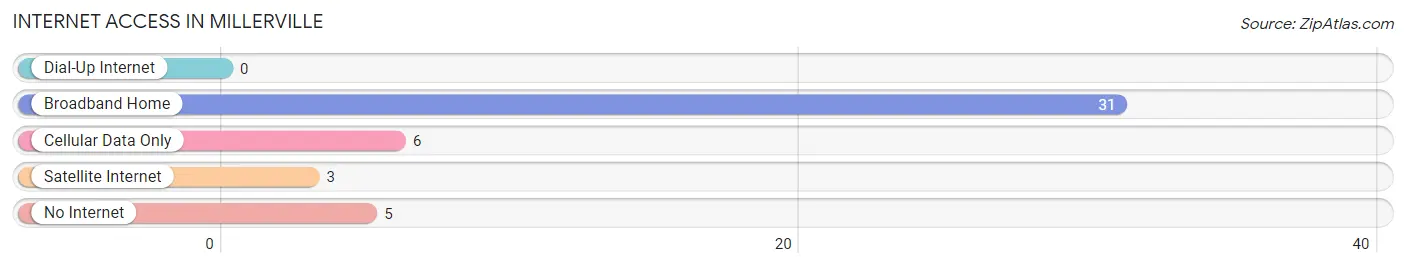
| Internet Type | # Households | % Households |
| Dial-Up Internet | 0 | 0.0% |
| Broadband Home | 31 | 67.4% |
| Cellular Data Only | 6 | 13.0% |
| Satellite Internet | 3 | 6.5% |
| No Internet | 5 | 10.9% |
| Total | 46 | 100.0% |
Millerville Summary
Millerville, Minnesota is a small city located in Douglas County, in the west-central part of the state. It is situated on the banks of the Otter Tail River, and is surrounded by rolling hills and farmland. The city has a population of approximately 1,500 people, and is known for its small-town charm and friendly atmosphere.
History
Millerville was founded in 1881 by a group of settlers from Wisconsin. The city was named after the nearby Millerville Mill, which was built in 1876. The mill was used to grind grain and produce flour, and was a major source of income for the early settlers.
In the early 1900s, the city began to grow and prosper. The railroad arrived in 1906, and the city was incorporated in 1908. The railroad brought new businesses and industries to the area, and the population began to grow.
In the 1950s, the city began to decline. The railroad was abandoned, and many of the businesses and industries moved away. The population began to decline, and the city was in danger of becoming a ghost town.
In the late 1970s, the city began to experience a resurgence. New businesses and industries moved into the area, and the population began to grow again. Today, Millerville is a thriving small city with a population of approximately 1,500 people.
Geography
Millerville is located in the west-central part of Minnesota, in Douglas County. It is situated on the banks of the Otter Tail River, and is surrounded by rolling hills and farmland. The city is located approximately 30 miles south of the city of Fergus Falls, and is about 90 miles northwest of the Twin Cities.
The climate in Millerville is typical of the Midwest, with cold winters and warm summers. The average temperature in January is around 10 degrees Fahrenheit, and the average temperature in July is around 75 degrees Fahrenheit.
Economy
Millerville’s economy is largely based on agriculture and tourism. The city is home to several farms, and the surrounding area is known for its fertile soil and abundant crops. The city is also home to several small businesses, including restaurants, shops, and other services.
Tourism is also an important part of the local economy. The city is home to several parks and recreational areas, and is a popular destination for outdoor enthusiasts. The city also hosts several festivals and events throughout the year, which attract visitors from all over the region.
Demographics
As of the 2010 census, the population of Millerville was 1,500 people. The racial makeup of the city was 97.3% White, 0.7% African American, 0.3% Native American, 0.3% Asian, and 1.3% from other races. The median household income was $41,250, and the median age was 43.
Millerville is a small city with a friendly atmosphere and a strong sense of community. The city is home to several churches, and is known for its small-town charm and welcoming atmosphere. The city is also home to several parks and recreational areas, and is a popular destination for outdoor enthusiasts.
Common Questions
What is Per Capita Income in Millerville?
Per Capita income in Millerville is $32,274.
What is the Median Family Income in Millerville?
Median Family Income in Millerville is $88,438.
What is the Median Household income in Millerville?
Median Household Income in Millerville is $83,000.
What is Income or Wage Gap in Millerville?
Income or Wage Gap in Millerville is 24.7%.
Women in Millerville earn 75.3 cents for every dollar earned by a man.
What is Inequality or Gini Index in Millerville?
Inequality or Gini Index in Millerville is 0.30.
What is the Total Population of Millerville?
Total Population of Millerville is 112.
What is the Total Male Population of Millerville?
Total Male Population of Millerville is 62.
What is the Total Female Population of Millerville?
Total Female Population of Millerville is 50.
What is the Ratio of Males per 100 Females in Millerville?
There are 124.00 Males per 100 Females in Millerville.
What is the Ratio of Females per 100 Males in Millerville?
There are 80.65 Females per 100 Males in Millerville.
What is the Median Population Age in Millerville?
Median Population Age in Millerville is 35.0 Years.
What is the Average Family Size in Millerville
Average Family Size in Millerville is 3.0 People.
What is the Average Household Size in Millerville
Average Household Size in Millerville is 2.4 People.
How Large is the Labor Force in Millerville?
There are 62 People in the Labor Forcein in Millerville.
What is the Percentage of People in the Labor Force in Millerville?
86.1% of People are in the Labor Force in Millerville.