Redwood Falls, MN Map & Demographics
Redwood Falls Map
Redwood Falls Overview
$32,061
PER CAPITA INCOME
$82,011
AVG FAMILY INCOME
$64,214
AVG HOUSEHOLD INCOME
29.6%
WAGE / INCOME GAP [ % ]
70.4¢/ $1
WAGE / INCOME GAP [ $ ]
0.40
INEQUALITY / GINI INDEX
5,091
TOTAL POPULATION
2,503
MALE POPULATION
2,588
FEMALE POPULATION
96.72
MALES / 100 FEMALES
103.40
FEMALES / 100 MALES
39.9
MEDIAN AGE
3.0
AVG FAMILY SIZE
2.4
AVG HOUSEHOLD SIZE
2,469
LABOR FORCE [ PEOPLE ]
60.1%
PERCENT IN LABOR FORCE
1.0%
UNEMPLOYMENT RATE
Redwood Falls Zip Codes
Redwood Falls Area Codes
Income in Redwood Falls
Income Overview in Redwood Falls
Per Capita Income in Redwood Falls is $32,061, while median incomes of families and households are $82,011 and $64,214 respectively.
| Characteristic | Number | Measure |
| Per Capita Income | 5,091 | $32,061 |
| Median Family Income | 1,277 | $82,011 |
| Mean Family Income | 1,277 | $93,547 |
| Median Household Income | 2,072 | $64,214 |
| Mean Household Income | 2,072 | $75,274 |
| Income Deficit | 1,277 | $0 |
| Wage / Income Gap (%) | 5,091 | 29.59% |
| Wage / Income Gap ($) | 5,091 | 70.41¢ per $1 |
| Gini / Inequality Index | 5,091 | 0.40 |
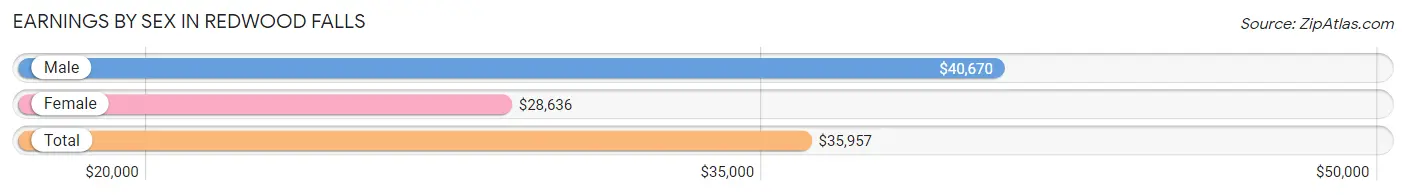
Earnings by Sex in Redwood Falls
Average Earnings in Redwood Falls are $35,957, $40,670 for men and $28,636 for women, a difference of 29.6%.
| Sex | Number | Average Earnings |
| Male | 1,415 (51.7%) | $40,670 |
| Female | 1,320 (48.3%) | $28,636 |
| Total | 2,735 (100.0%) | $35,957 |
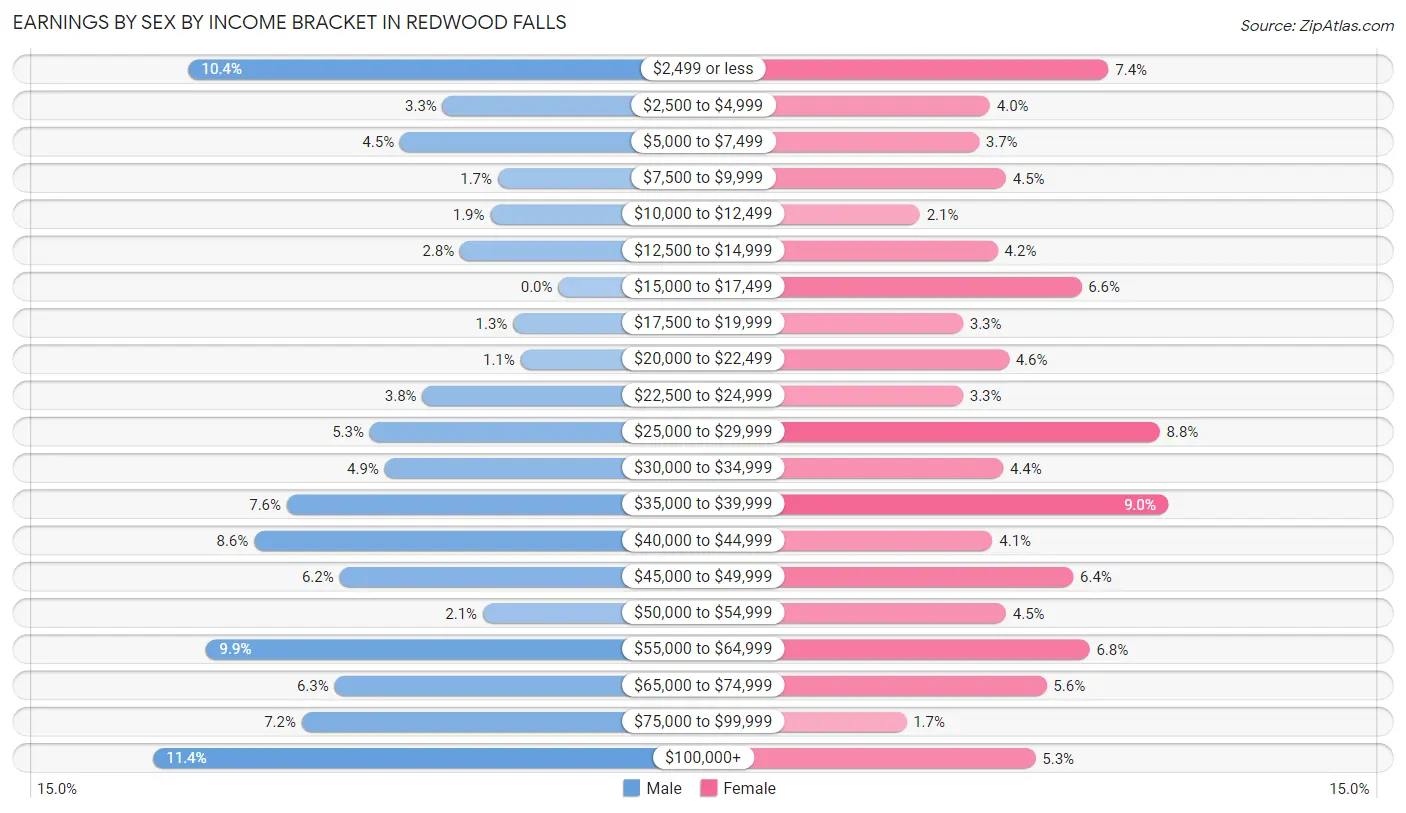
Earnings by Sex by Income Bracket in Redwood Falls
The most common earnings brackets in Redwood Falls are $100,000+ for men (161 | 11.4%) and $35,000 to $39,999 for women (119 | 9.0%).
| Income | Male | Female |
| $2,499 or less | 147 (10.4%) | 97 (7.3%) |
| $2,500 to $4,999 | 46 (3.3%) | 53 (4.0%) |
| $5,000 to $7,499 | 63 (4.4%) | 49 (3.7%) |
| $7,500 to $9,999 | 24 (1.7%) | 59 (4.5%) |
| $10,000 to $12,499 | 27 (1.9%) | 27 (2.1%) |
| $12,500 to $14,999 | 39 (2.8%) | 56 (4.2%) |
| $15,000 to $17,499 | 0 (0.0%) | 87 (6.6%) |
| $17,500 to $19,999 | 18 (1.3%) | 43 (3.3%) |
| $20,000 to $22,499 | 15 (1.1%) | 60 (4.5%) |
| $22,500 to $24,999 | 54 (3.8%) | 43 (3.3%) |
| $25,000 to $29,999 | 75 (5.3%) | 116 (8.8%) |
| $30,000 to $34,999 | 69 (4.9%) | 58 (4.4%) |
| $35,000 to $39,999 | 108 (7.6%) | 119 (9.0%) |
| $40,000 to $44,999 | 121 (8.6%) | 54 (4.1%) |
| $45,000 to $49,999 | 87 (6.1%) | 84 (6.4%) |
| $50,000 to $54,999 | 30 (2.1%) | 59 (4.5%) |
| $55,000 to $64,999 | 140 (9.9%) | 90 (6.8%) |
| $65,000 to $74,999 | 89 (6.3%) | 74 (5.6%) |
| $75,000 to $99,999 | 102 (7.2%) | 22 (1.7%) |
| $100,000+ | 161 (11.4%) | 70 (5.3%) |
| Total | 1,415 (100.0%) | 1,320 (100.0%) |
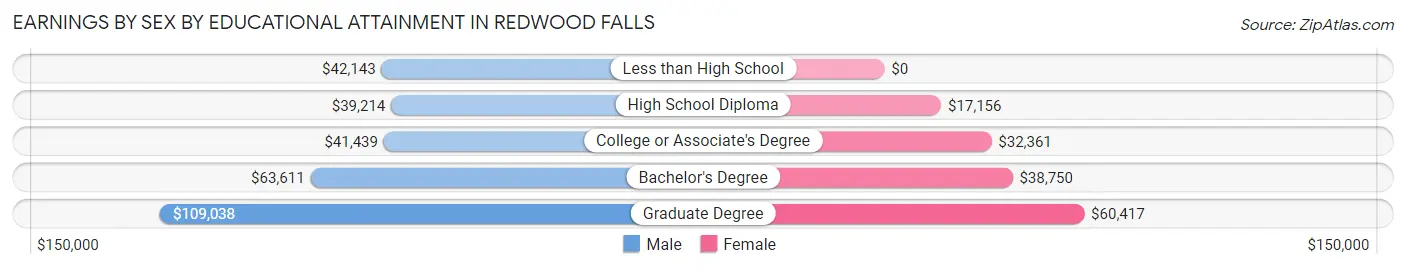
Earnings by Sex by Educational Attainment in Redwood Falls
Average earnings in Redwood Falls are $45,091 for men and $31,462 for women, a difference of 30.2%. Men with an educational attainment of graduate degree enjoy the highest average annual earnings of $109,038, while those with high school diploma education earn the least with $39,214. Women with an educational attainment of graduate degree earn the most with the average annual earnings of $60,417, while those with high school diploma education have the smallest earnings of $17,156.
| Educational Attainment | Male Income | Female Income |
| Less than High School | $42,143 | $0 |
| High School Diploma | $39,214 | $17,156 |
| College or Associate's Degree | $41,439 | $32,361 |
| Bachelor's Degree | $63,611 | $38,750 |
| Graduate Degree | $109,038 | $60,417 |
| Total | $45,091 | $31,462 |
Family Income in Redwood Falls
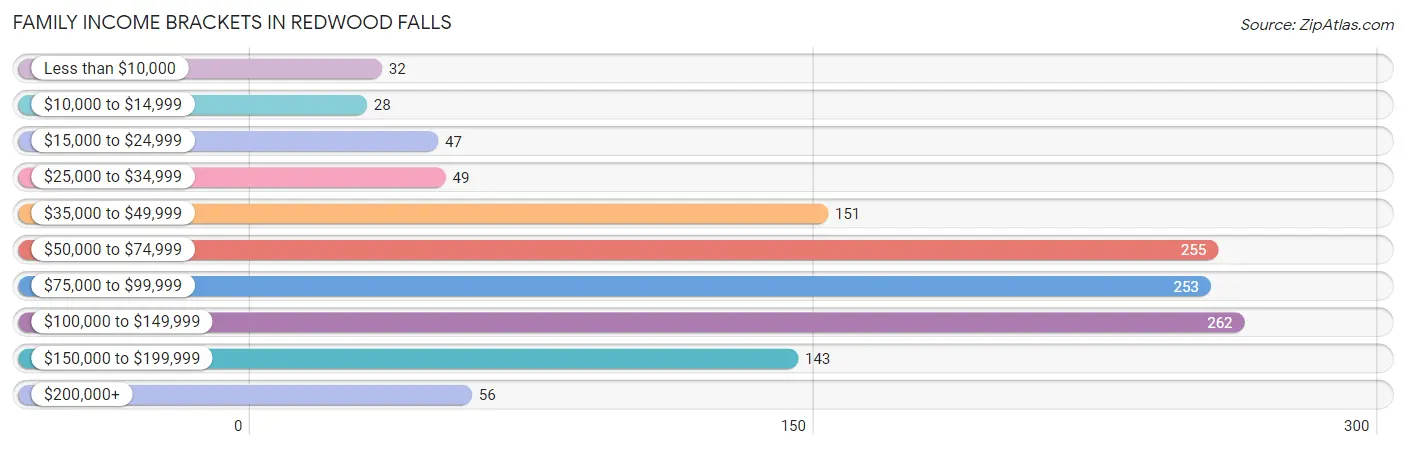
Family Income Brackets in Redwood Falls
According to the Redwood Falls family income data, there are 262 families falling into the $100,000 to $149,999 income range, which is the most common income bracket and makes up 20.5% of all families. Conversely, the $10,000 to $14,999 income bracket is the least frequent group with only 28 families (2.2%) belonging to this category.
| Income Bracket | # Families | % Families |
| Less than $10,000 | 32 | 2.5% |
| $10,000 to $14,999 | 28 | 2.2% |
| $15,000 to $24,999 | 47 | 3.7% |
| $25,000 to $34,999 | 49 | 3.8% |
| $35,000 to $49,999 | 151 | 11.8% |
| $50,000 to $74,999 | 255 | 20.0% |
| $75,000 to $99,999 | 253 | 19.8% |
| $100,000 to $149,999 | 262 | 20.5% |
| $150,000 to $199,999 | 143 | 11.2% |
| $200,000+ | 56 | 4.4% |
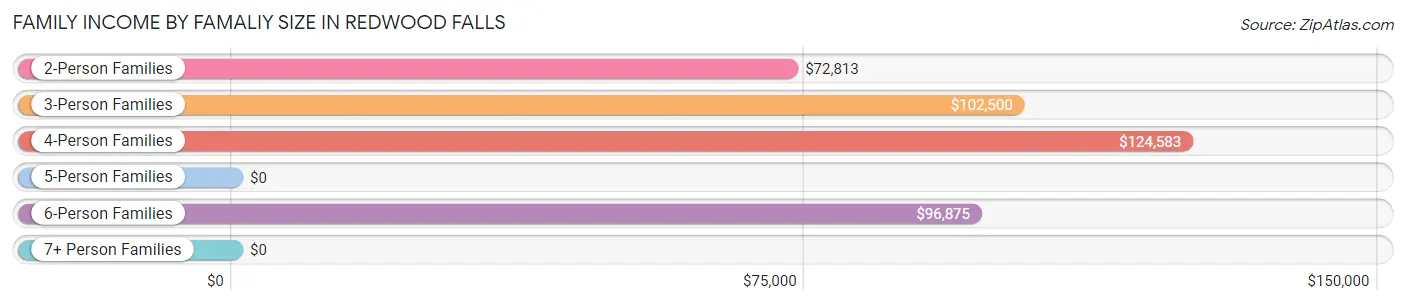
Family Income by Famaliy Size in Redwood Falls
4-person families (139 | 10.9%) account for the highest median family income in Redwood Falls with $124,583 per family, while 2-person families (787 | 61.6%) have the highest median income of $36,406 per family member.
| Income Bracket | # Families | Median Income |
| 2-Person Families | 787 (61.6%) | $72,813 |
| 3-Person Families | 134 (10.5%) | $102,500 |
| 4-Person Families | 139 (10.9%) | $124,583 |
| 5-Person Families | 121 (9.5%) | $0 |
| 6-Person Families | 96 (7.5%) | $96,875 |
| 7+ Person Families | 0 (0.0%) | $0 |
| Total | 1,277 (100.0%) | $82,011 |
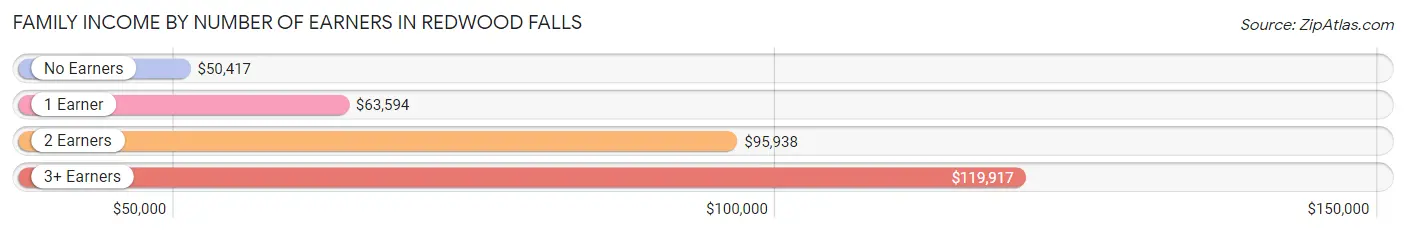
Family Income by Number of Earners in Redwood Falls
The median family income in Redwood Falls is $82,011, with families comprising 3+ earners (131) having the highest median family income of $119,917, while families with no earners (236) have the lowest median family income of $50,417, accounting for 10.3% and 18.5% of families, respectively.
| Number of Earners | # Families | Median Income |
| No Earners | 236 (18.5%) | $50,417 |
| 1 Earner | 324 (25.4%) | $63,594 |
| 2 Earners | 586 (45.9%) | $95,938 |
| 3+ Earners | 131 (10.3%) | $119,917 |
| Total | 1,277 (100.0%) | $82,011 |
Household Income in Redwood Falls
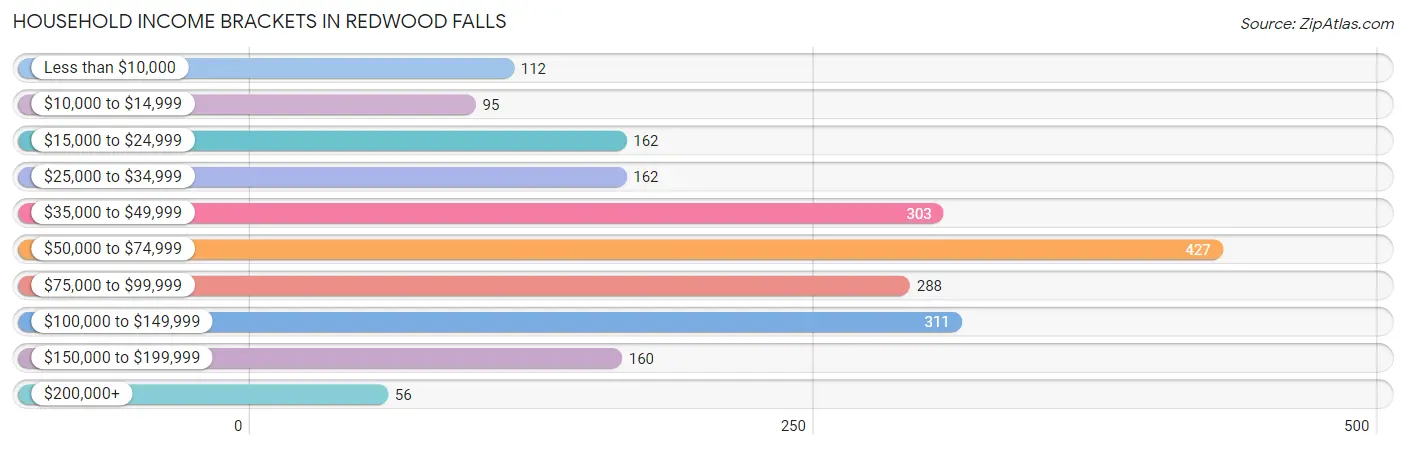
Household Income Brackets in Redwood Falls
With 427 households falling in the category, the $50,000 to $74,999 income range is the most frequent in Redwood Falls, accounting for 20.6% of all households. In contrast, only 56 households (2.7%) fall into the $200,000+ income bracket, making it the least populous group.
| Income Bracket | # Households | % Households |
| Less than $10,000 | 112 | 5.4% |
| $10,000 to $14,999 | 95 | 4.6% |
| $15,000 to $24,999 | 162 | 7.8% |
| $25,000 to $34,999 | 162 | 7.8% |
| $35,000 to $49,999 | 303 | 14.6% |
| $50,000 to $74,999 | 427 | 20.6% |
| $75,000 to $99,999 | 288 | 13.9% |
| $100,000 to $149,999 | 311 | 15.0% |
| $150,000 to $199,999 | 160 | 7.7% |
| $200,000+ | 56 | 2.7% |
Household Income by Householder Age in Redwood Falls
The median household income in Redwood Falls is $64,214, with the highest median household income of $77,396 found in the 25 to 44 years age bracket for the primary householder. A total of 559 households (27.0%) fall into this category. Meanwhile, the 15 to 24 years age bracket for the primary householder has the lowest median household income of $33,021, with 137 households (6.6%) in this group.
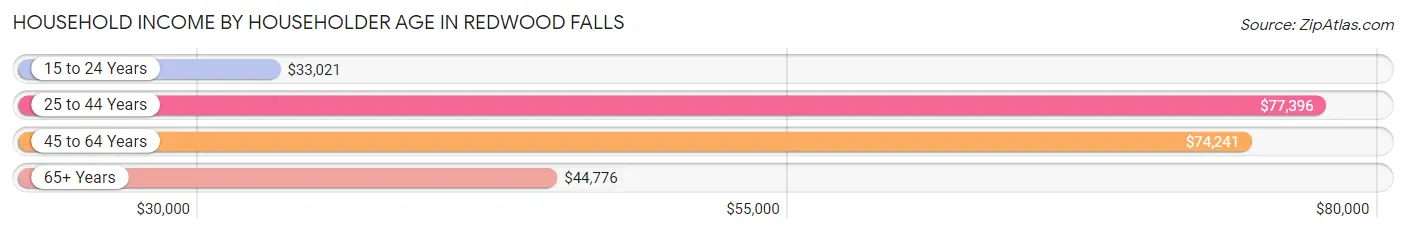
| Income Bracket | # Households | Median Income |
| 15 to 24 Years | 137 (6.6%) | $33,021 |
| 25 to 44 Years | 559 (27.0%) | $77,396 |
| 45 to 64 Years | 623 (30.1%) | $74,241 |
| 65+ Years | 753 (36.3%) | $44,776 |
| Total | 2,072 (100.0%) | $64,214 |
Poverty in Redwood Falls
Income Below Poverty by Sex and Age in Redwood Falls
With 11.9% poverty level for males and 11.1% for females among the residents of Redwood Falls, 18 to 24 year old males and 25 to 34 year old females are the most vulnerable to poverty, with 72 males (28.1%) and 85 females (25.6%) in their respective age groups living below the poverty level.
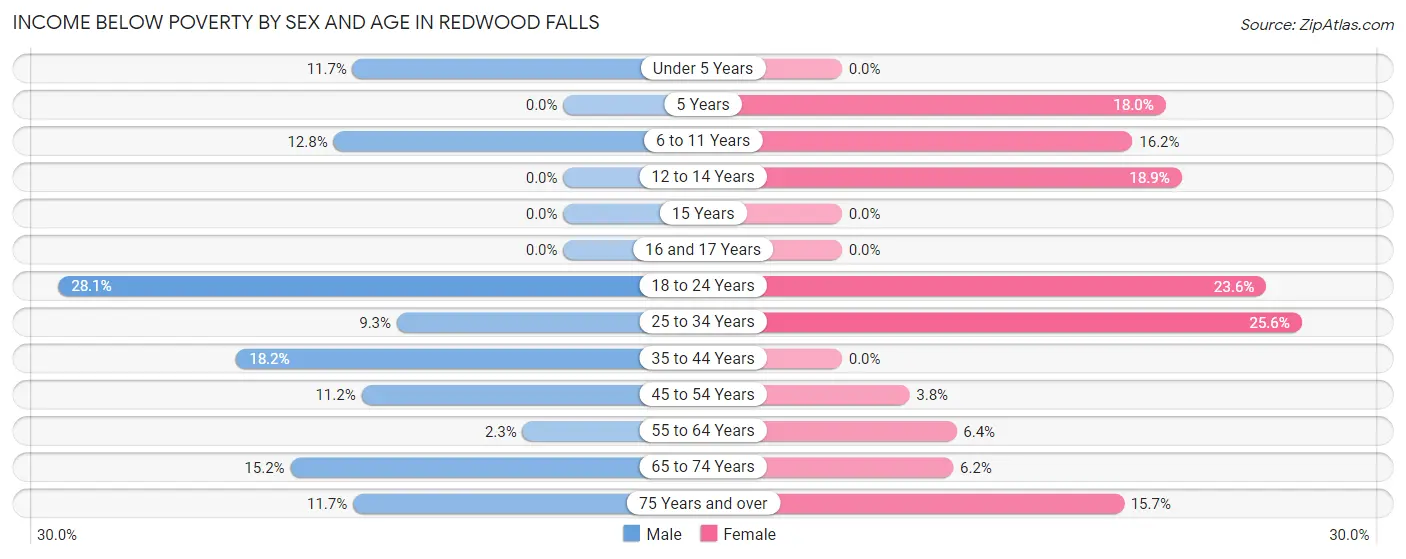
| Age Bracket | Male | Female |
| Under 5 Years | 19 (11.7%) | 0 (0.0%) |
| 5 Years | 0 (0.0%) | 11 (18.0%) |
| 6 to 11 Years | 21 (12.8%) | 28 (16.2%) |
| 12 to 14 Years | 0 (0.0%) | 14 (18.9%) |
| 15 Years | 0 (0.0%) | 0 (0.0%) |
| 16 and 17 Years | 0 (0.0%) | 0 (0.0%) |
| 18 to 24 Years | 72 (28.1%) | 43 (23.6%) |
| 25 to 34 Years | 24 (9.3%) | 85 (25.6%) |
| 35 to 44 Years | 51 (18.2%) | 0 (0.0%) |
| 45 to 54 Years | 28 (11.2%) | 12 (3.8%) |
| 55 to 64 Years | 6 (2.3%) | 19 (6.4%) |
| 65 to 74 Years | 45 (15.2%) | 23 (6.2%) |
| 75 Years and over | 24 (11.7%) | 46 (15.7%) |
| Total | 290 (11.9%) | 281 (11.1%) |
Income Above Poverty by Sex and Age in Redwood Falls
According to the poverty statistics in Redwood Falls, males aged 5 years and females aged under 5 years are the age groups that are most secure financially, with 100.0% of males and 100.0% of females in these age groups living above the poverty line.
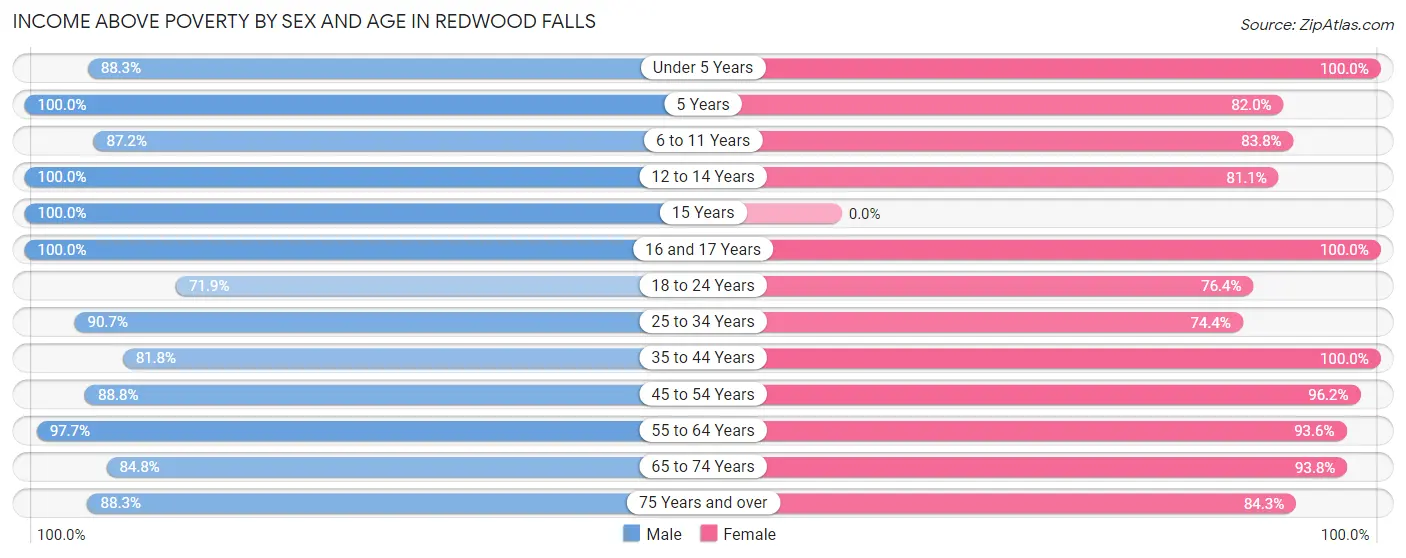
| Age Bracket | Male | Female |
| Under 5 Years | 143 (88.3%) | 95 (100.0%) |
| 5 Years | 3 (100.0%) | 50 (82.0%) |
| 6 to 11 Years | 143 (87.2%) | 145 (83.8%) |
| 12 to 14 Years | 189 (100.0%) | 60 (81.1%) |
| 15 Years | 34 (100.0%) | 0 (0.0%) |
| 16 and 17 Years | 67 (100.0%) | 97 (100.0%) |
| 18 to 24 Years | 184 (71.9%) | 139 (76.4%) |
| 25 to 34 Years | 235 (90.7%) | 247 (74.4%) |
| 35 to 44 Years | 229 (81.8%) | 233 (100.0%) |
| 45 to 54 Years | 221 (88.8%) | 307 (96.2%) |
| 55 to 64 Years | 258 (97.7%) | 279 (93.6%) |
| 65 to 74 Years | 251 (84.8%) | 348 (93.8%) |
| 75 Years and over | 181 (88.3%) | 247 (84.3%) |
| Total | 2,138 (88.1%) | 2,247 (88.9%) |
Income Below Poverty Among Married-Couple Families in Redwood Falls
The poverty statistics for married-couple families in Redwood Falls show that 4.2% or 43 of the total 1,033 families live below the poverty line. Families with 3 or 4 children have the highest poverty rate of 8.1%, comprising of 13 families. On the other hand, families with 1 or 2 children have the lowest poverty rate of 0.0%, which includes 0 families.

| Children | Above Poverty | Below Poverty |
| No Children | 642 (95.5%) | 30 (4.5%) |
| 1 or 2 Children | 200 (100.0%) | 0 (0.0%) |
| 3 or 4 Children | 148 (91.9%) | 13 (8.1%) |
| 5 or more Children | 0 (0.0%) | 0 (0.0%) |
| Total | 990 (95.8%) | 43 (4.2%) |
Income Below Poverty Among Single-Parent Households in Redwood Falls
According to the poverty data in Redwood Falls, 30.0% or 27 single-father households and 11.7% or 18 single-mother households are living below the poverty line. Among single-father households, those with 3 or 4 children have the highest poverty rate, with 15 households (83.3%) experiencing poverty. Likewise, among single-mother households, those with no children have the highest poverty rate, with 12 households (15.6%) falling below the poverty line.
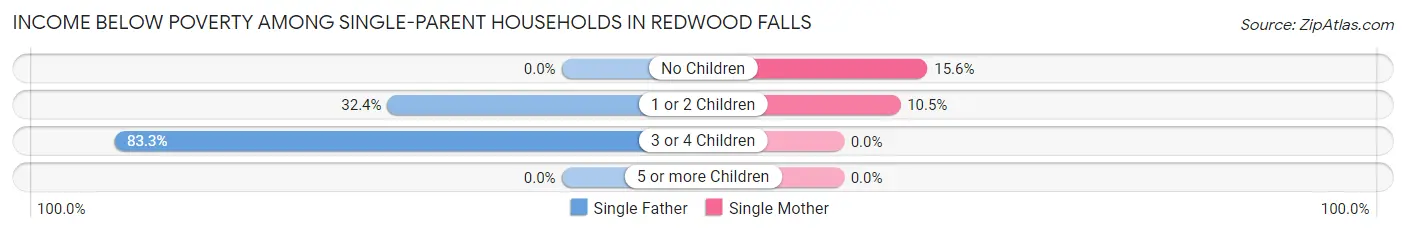
| Children | Single Father | Single Mother |
| No Children | 0 (0.0%) | 12 (15.6%) |
| 1 or 2 Children | 12 (32.4%) | 6 (10.5%) |
| 3 or 4 Children | 15 (83.3%) | 0 (0.0%) |
| 5 or more Children | 0 (0.0%) | 0 (0.0%) |
| Total | 27 (30.0%) | 18 (11.7%) |
Income Below Poverty Among Married-Couple vs Single-Parent Households in Redwood Falls
The poverty data for Redwood Falls shows that 43 of the married-couple family households (4.2%) and 45 of the single-parent households (18.4%) are living below the poverty level. Within the married-couple family households, those with 3 or 4 children have the highest poverty rate, with 13 households (8.1%) falling below the poverty line. Among the single-parent households, those with 3 or 4 children have the highest poverty rate, with 15 household (39.5%) living below poverty.
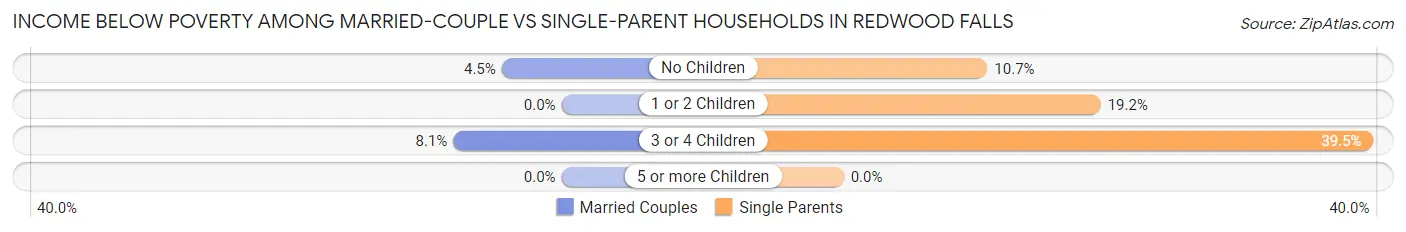
| Children | Married-Couple Families | Single-Parent Households |
| No Children | 30 (4.5%) | 12 (10.7%) |
| 1 or 2 Children | 0 (0.0%) | 18 (19.2%) |
| 3 or 4 Children | 13 (8.1%) | 15 (39.5%) |
| 5 or more Children | 0 (0.0%) | 0 (0.0%) |
| Total | 43 (4.2%) | 45 (18.4%) |
Race in Redwood Falls
The most populous races in Redwood Falls are White / Caucasian (4,584 | 90.0%), Two or more Races (234 | 4.6%), and Hispanic or Latino (219 | 4.3%).
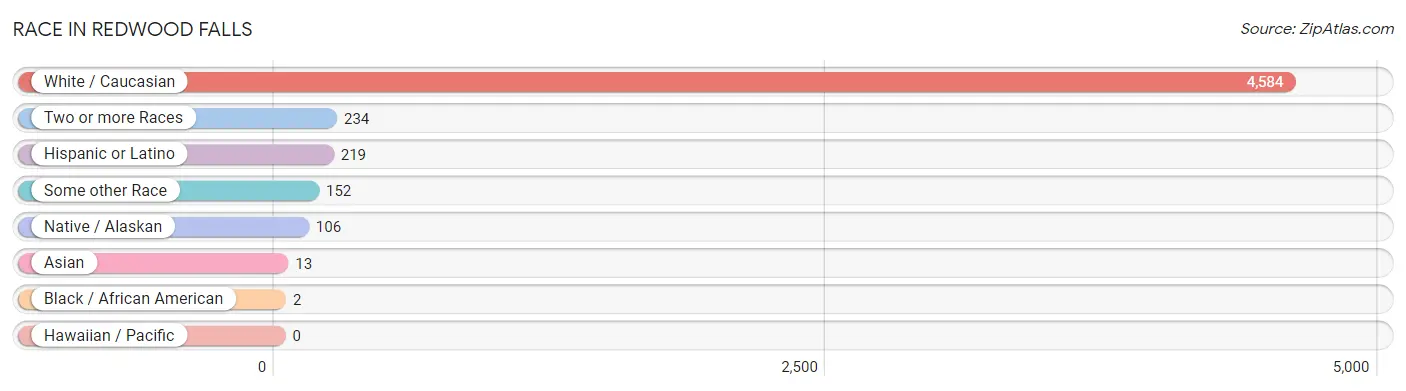
| Race | # Population | % Population |
| Asian | 13 | 0.3% |
| Black / African American | 2 | 0.0% |
| Hawaiian / Pacific | 0 | 0.0% |
| Hispanic or Latino | 219 | 4.3% |
| Native / Alaskan | 106 | 2.1% |
| White / Caucasian | 4,584 | 90.0% |
| Two or more Races | 234 | 4.6% |
| Some other Race | 152 | 3.0% |
| Total | 5,091 | 100.0% |
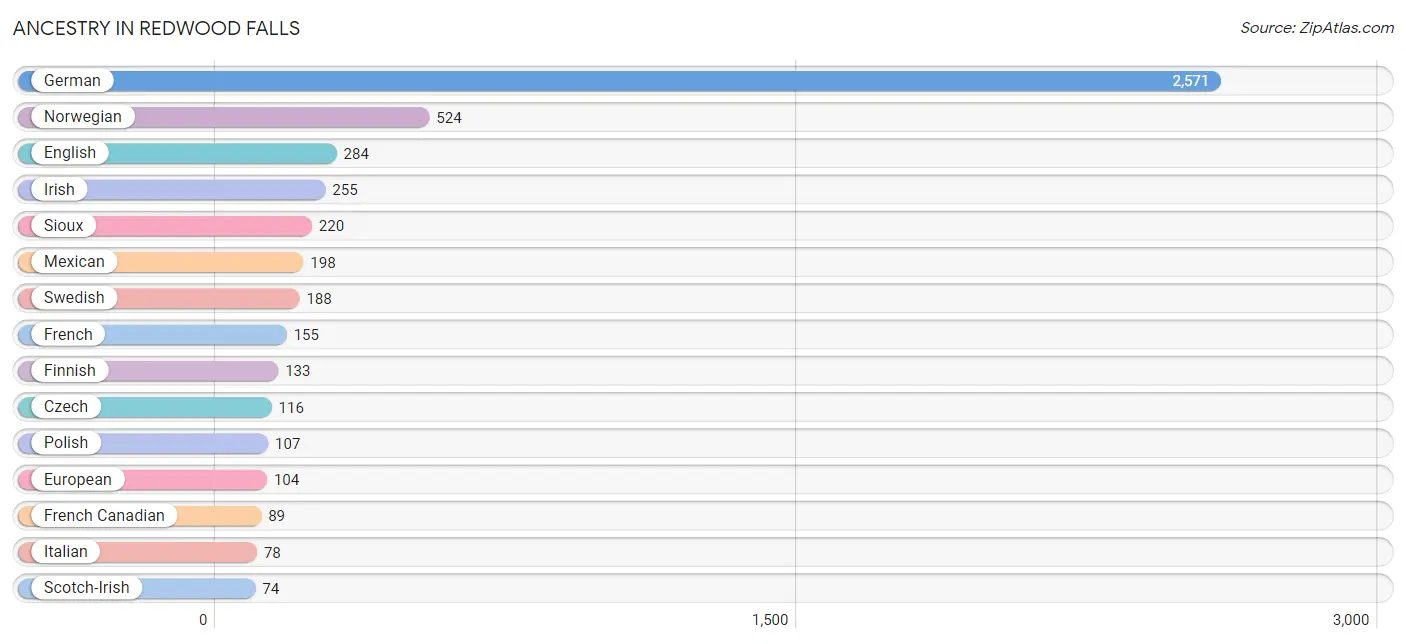
Ancestry in Redwood Falls
The most populous ancestries reported in Redwood Falls are German (2,571 | 50.5%), Norwegian (524 | 10.3%), English (284 | 5.6%), Irish (255 | 5.0%), and Sioux (220 | 4.3%), together accounting for 75.7% of all Redwood Falls residents.
| Ancestry | # Population | % Population |
| American | 71 | 1.4% |
| Belgian | 29 | 0.6% |
| British | 10 | 0.2% |
| Burmese | 36 | 0.7% |
| Central American | 1 | 0.0% |
| Chippewa | 38 | 0.7% |
| Colombian | 10 | 0.2% |
| Czech | 116 | 2.3% |
| Czechoslovakian | 49 | 1.0% |
| Danish | 58 | 1.1% |
| Dutch | 54 | 1.1% |
| English | 284 | 5.6% |
| European | 104 | 2.0% |
| Finnish | 133 | 2.6% |
| French | 155 | 3.0% |
| French Canadian | 89 | 1.8% |
| German | 2,571 | 50.5% |
| Honduran | 1 | 0.0% |
| Irish | 255 | 5.0% |
| Italian | 78 | 1.5% |
| Korean | 13 | 0.3% |
| Latvian | 1 | 0.0% |
| Mexican | 198 | 3.9% |
| Northern European | 21 | 0.4% |
| Norwegian | 524 | 10.3% |
| Pennsylvania German | 20 | 0.4% |
| Polish | 107 | 2.1% |
| Scandinavian | 46 | 0.9% |
| Scotch-Irish | 74 | 1.5% |
| Scottish | 65 | 1.3% |
| Sioux | 220 | 4.3% |
| Slovak | 9 | 0.2% |
| South American | 10 | 0.2% |
| Spaniard | 10 | 0.2% |
| Swedish | 188 | 3.7% |
| Swiss | 9 | 0.2% |
| Welsh | 32 | 0.6% | View All 37 Rows |
Immigrants in Redwood Falls
The most numerous immigrant groups reported in Redwood Falls came from Asia (26 | 0.5%), Canada (22 | 0.4%), Europe (21 | 0.4%), Southern Europe (21 | 0.4%), and Eastern Asia (13 | 0.3%), together accounting for 2.0% of all Redwood Falls residents.
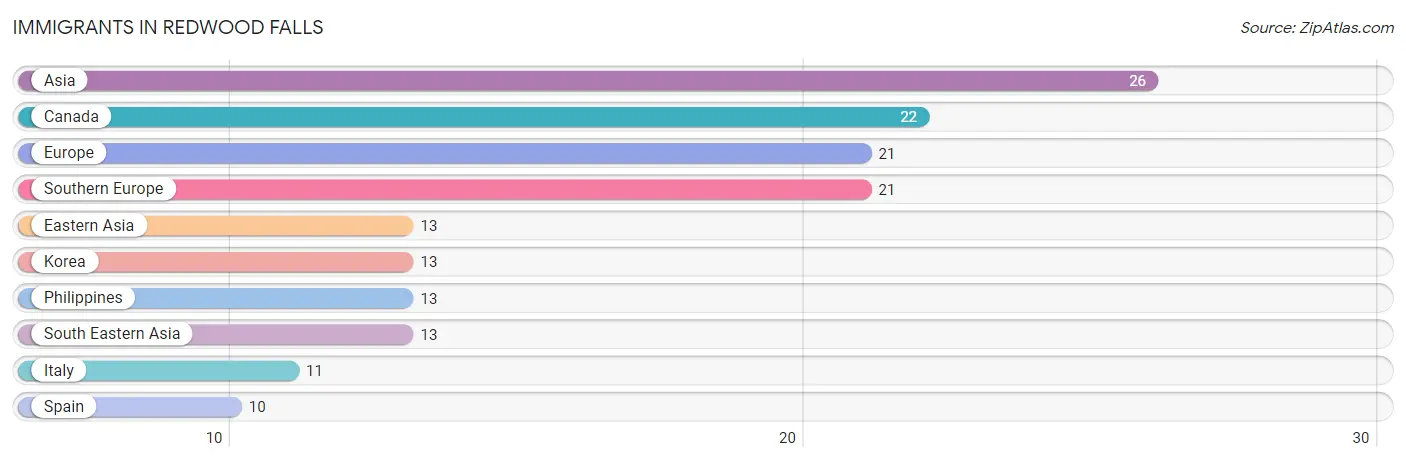
| Immigration Origin | # Population | % Population |
| Asia | 26 | 0.5% |
| Canada | 22 | 0.4% |
| Eastern Asia | 13 | 0.3% |
| Europe | 21 | 0.4% |
| Italy | 11 | 0.2% |
| Korea | 13 | 0.3% |
| Philippines | 13 | 0.3% |
| South Eastern Asia | 13 | 0.3% |
| Southern Europe | 21 | 0.4% |
| Spain | 10 | 0.2% | View All 10 Rows |
Sex and Age in Redwood Falls
Sex and Age in Redwood Falls
The most populous age groups in Redwood Falls are 10 to 14 Years (267 | 10.7%) for men and 70 to 74 Years (224 | 8.7%) for women.
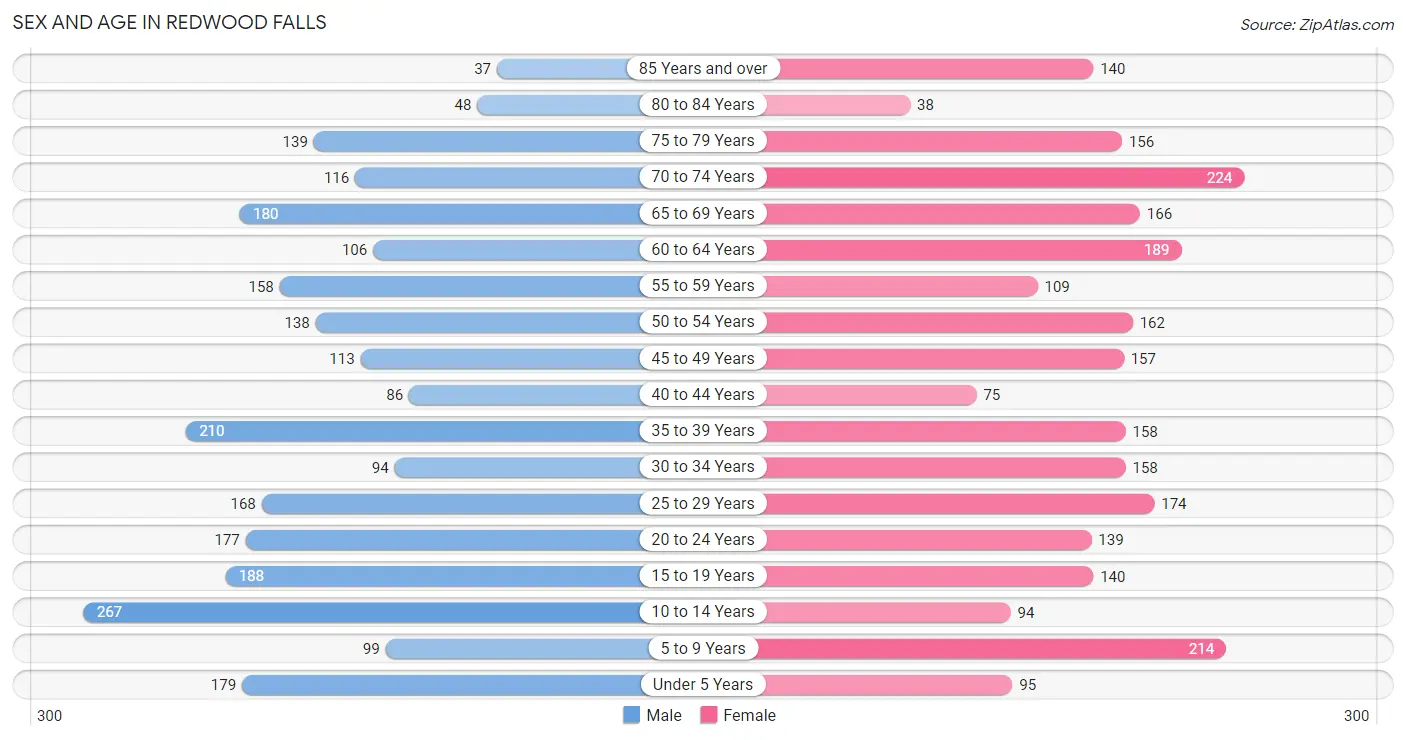
| Age Bracket | Male | Female |
| Under 5 Years | 179 (7.1%) | 95 (3.7%) |
| 5 to 9 Years | 99 (4.0%) | 214 (8.3%) |
| 10 to 14 Years | 267 (10.7%) | 94 (3.6%) |
| 15 to 19 Years | 188 (7.5%) | 140 (5.4%) |
| 20 to 24 Years | 177 (7.1%) | 139 (5.4%) |
| 25 to 29 Years | 168 (6.7%) | 174 (6.7%) |
| 30 to 34 Years | 94 (3.8%) | 158 (6.1%) |
| 35 to 39 Years | 210 (8.4%) | 158 (6.1%) |
| 40 to 44 Years | 86 (3.4%) | 75 (2.9%) |
| 45 to 49 Years | 113 (4.5%) | 157 (6.1%) |
| 50 to 54 Years | 138 (5.5%) | 162 (6.3%) |
| 55 to 59 Years | 158 (6.3%) | 109 (4.2%) |
| 60 to 64 Years | 106 (4.2%) | 189 (7.3%) |
| 65 to 69 Years | 180 (7.2%) | 166 (6.4%) |
| 70 to 74 Years | 116 (4.6%) | 224 (8.7%) |
| 75 to 79 Years | 139 (5.6%) | 156 (6.0%) |
| 80 to 84 Years | 48 (1.9%) | 38 (1.5%) |
| 85 Years and over | 37 (1.5%) | 140 (5.4%) |
| Total | 2,503 (100.0%) | 2,588 (100.0%) |
Families and Households in Redwood Falls
Median Family Size in Redwood Falls
The median family size in Redwood Falls is 2.99 persons per family, with married-couple families (1,033 | 80.9%) accounting for the largest median family size of 3 persons per family. On the other hand, single female/mother families (154 | 12.1%) represent the smallest median family size with 2.92 persons per family.
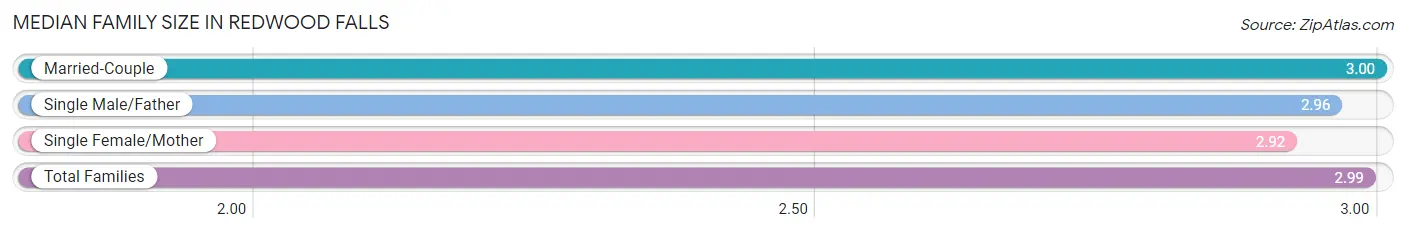
| Family Type | # Families | Family Size |
| Married-Couple | 1,033 (80.9%) | 3.00 |
| Single Male/Father | 90 (7.0%) | 2.96 |
| Single Female/Mother | 154 (12.1%) | 2.92 |
| Total Families | 1,277 (100.0%) | 2.99 |
Median Household Size in Redwood Falls
The median household size in Redwood Falls is 2.36 persons per household, with single female/mother households (154 | 7.4%) accounting for the largest median household size of 3.4 persons per household. non-family households (795 | 38.4%) represent the smallest median household size with 1.21 persons per household.
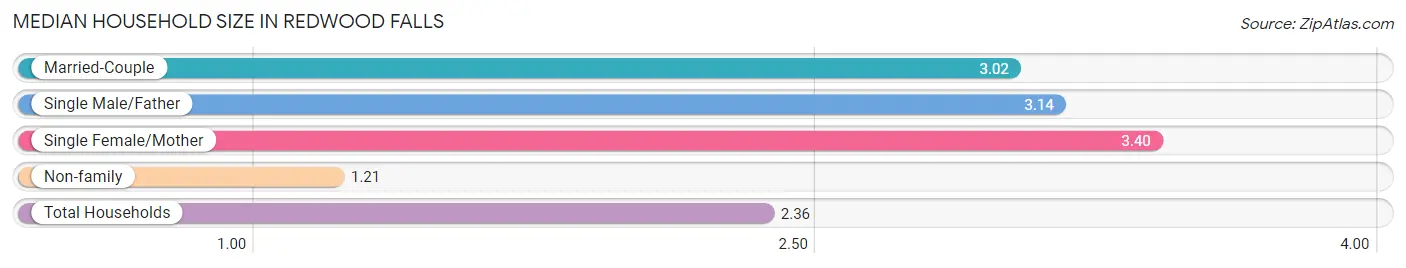
| Household Type | # Households | Household Size |
| Married-Couple | 1,033 (49.9%) | 3.02 |
| Single Male/Father | 90 (4.3%) | 3.14 |
| Single Female/Mother | 154 (7.4%) | 3.40 |
| Non-family | 795 (38.4%) | 1.21 |
| Total Households | 2,072 (100.0%) | 2.36 |
Household Size by Marriage Status in Redwood Falls
Out of a total of 2,072 households in Redwood Falls, 1,277 (61.6%) are family households, while 795 (38.4%) are nonfamily households. The most numerous type of family households are 2-person households, comprising 748, and the most common type of nonfamily households are 1-person households, comprising 663.
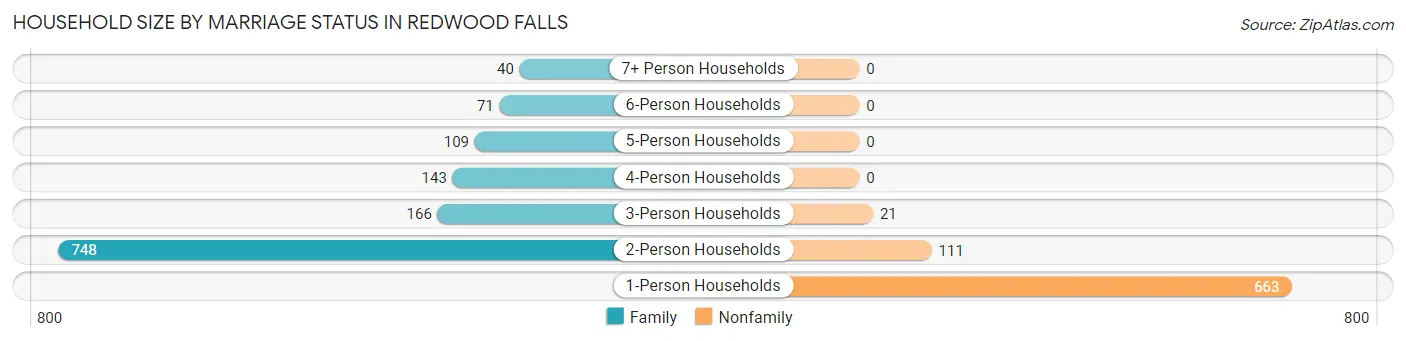
| Household Size | Family Households | Nonfamily Households |
| 1-Person Households | - | 663 (32.0%) |
| 2-Person Households | 748 (36.1%) | 111 (5.4%) |
| 3-Person Households | 166 (8.0%) | 21 (1.0%) |
| 4-Person Households | 143 (6.9%) | 0 (0.0%) |
| 5-Person Households | 109 (5.3%) | 0 (0.0%) |
| 6-Person Households | 71 (3.4%) | 0 (0.0%) |
| 7+ Person Households | 40 (1.9%) | 0 (0.0%) |
| Total | 1,277 (61.6%) | 795 (38.4%) |
Female Fertility in Redwood Falls
Fertility by Age in Redwood Falls
Average fertility rate in Redwood Falls is 32.0 births per 1,000 women. Women in the age bracket of 20 to 34 years have the highest fertility rate with 47.0 births per 1,000 women. Women in the age bracket of 20 to 34 years acount for 66.7% of all women with births.
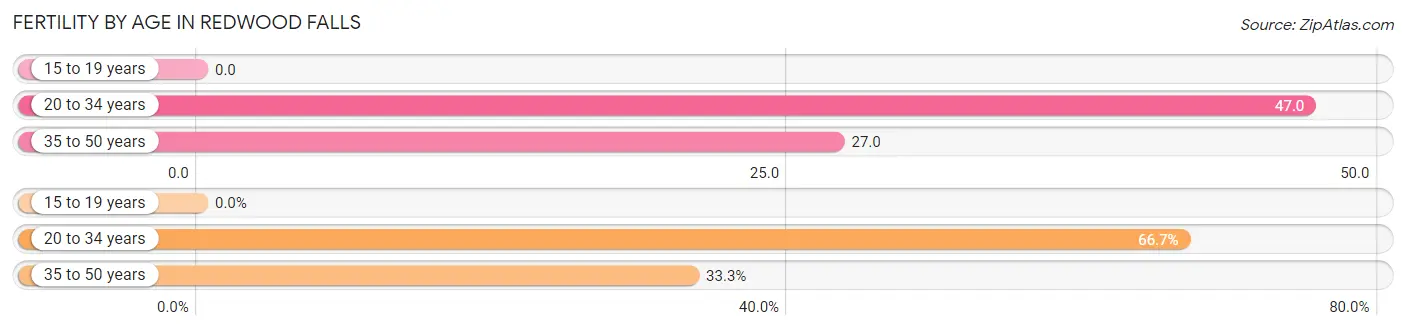
| Age Bracket | Women with Births | Births / 1,000 Women |
| 15 to 19 years | 0 (0.0%) | 0.0 |
| 20 to 34 years | 22 (66.7%) | 47.0 |
| 35 to 50 years | 11 (33.3%) | 27.0 |
| Total | 33 (100.0%) | 32.0 |
Fertility by Age by Marriage Status in Redwood Falls
87.9% of women with births (33) in Redwood Falls are married. The highest percentage of unmarried women with births falls into 20 to 34 years age bracket with 18.2% of them unmarried at the time of birth, while the lowest percentage of unmarried women with births belong to 35 to 50 years age bracket with 0.0% of them unmarried.
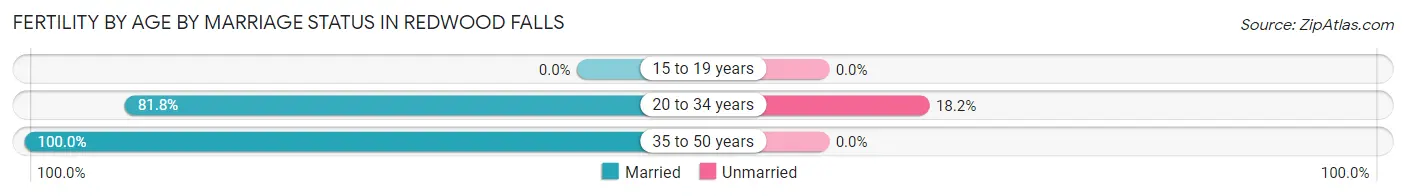
| Age Bracket | Married | Unmarried |
| 15 to 19 years | 0 (0.0%) | 0 (0.0%) |
| 20 to 34 years | 18 (81.8%) | 4 (18.2%) |
| 35 to 50 years | 11 (100.0%) | 0 (0.0%) |
| Total | 29 (87.9%) | 4 (12.1%) |
Fertility by Education in Redwood Falls
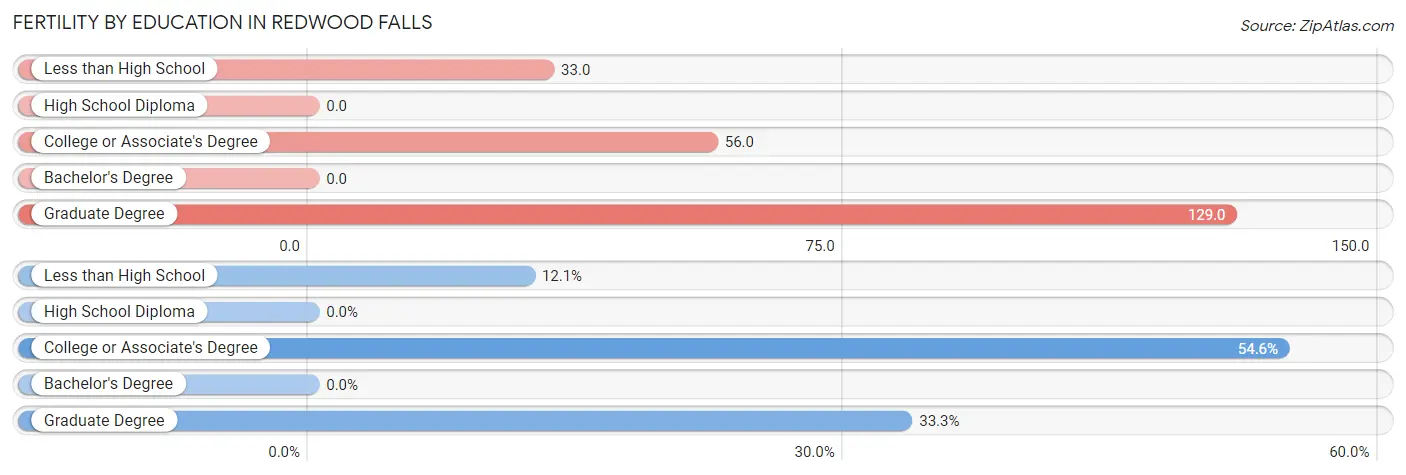
| Educational Attainment | Women with Births | Births / 1,000 Women |
| Less than High School | 4 (12.1%) | 33.0 |
| High School Diploma | 0 (0.0%) | 0.0 |
| College or Associate's Degree | 18 (54.5%) | 56.0 |
| Bachelor's Degree | 0 (0.0%) | 0.0 |
| Graduate Degree | 11 (33.3%) | 129.0 |
| Total | 33 (100.0%) | 32.0 |
Fertility by Education by Marriage Status in Redwood Falls
12.1% of women with births in Redwood Falls are unmarried. Women with the educational attainment of college or associate's degree are most likely to be married with 100.0% of them married at childbirth, while women with the educational attainment of less than high school are least likely to be married with 100.0% of them unmarried at childbirth.
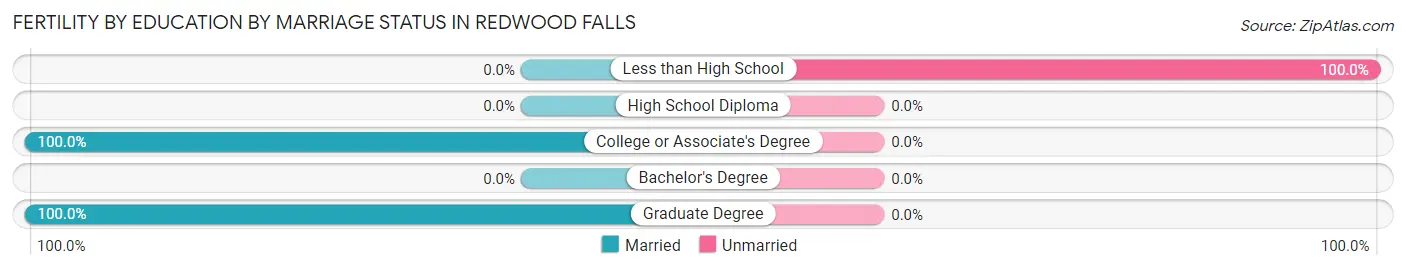
| Educational Attainment | Married | Unmarried |
| Less than High School | 0 (0.0%) | 4 (100.0%) |
| High School Diploma | 0 (0.0%) | 0 (0.0%) |
| College or Associate's Degree | 18 (100.0%) | 0 (0.0%) |
| Bachelor's Degree | 0 (0.0%) | 0 (0.0%) |
| Graduate Degree | 11 (100.0%) | 0 (0.0%) |
| Total | 29 (87.9%) | 4 (12.1%) |
Employment Characteristics in Redwood Falls
Employment by Class of Employer in Redwood Falls
Among the 2,374 employed individuals in Redwood Falls, private company employees (1,488 | 62.7%), local government employees (264 | 11.1%), and not-for-profit organizations (242 | 10.2%) make up the most common classes of employment.
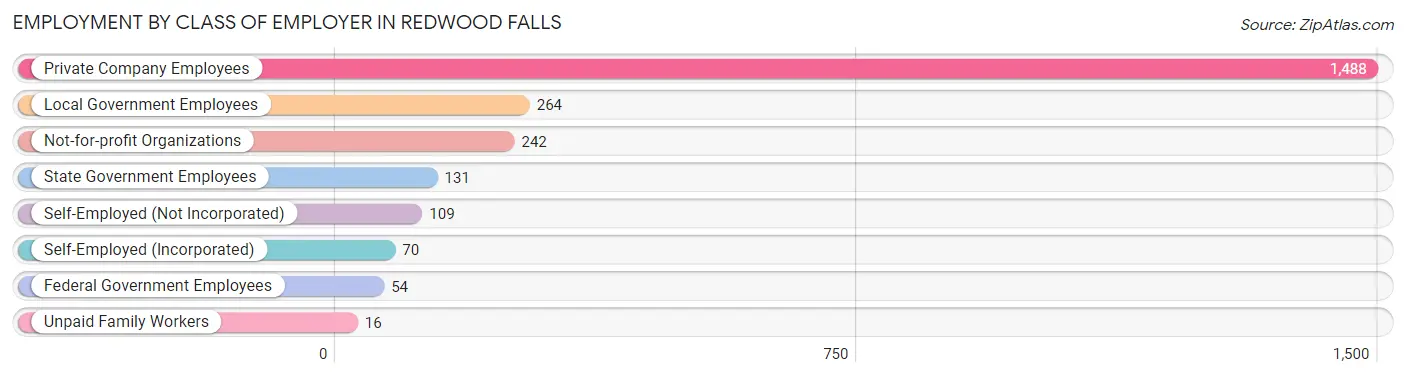
| Employer Class | # Employees | % Employees |
| Private Company Employees | 1,488 | 62.7% |
| Self-Employed (Incorporated) | 70 | 2.9% |
| Self-Employed (Not Incorporated) | 109 | 4.6% |
| Not-for-profit Organizations | 242 | 10.2% |
| Local Government Employees | 264 | 11.1% |
| State Government Employees | 131 | 5.5% |
| Federal Government Employees | 54 | 2.3% |
| Unpaid Family Workers | 16 | 0.7% |
| Total | 2,374 | 100.0% |
Employment Status by Age in Redwood Falls
According to the labor force statistics for Redwood Falls, out of the total population over 16 years of age (4,108), 60.1% or 2,469 individuals are in the labor force, with 1.0% or 25 of them unemployed. The age group with the highest labor force participation rate is 20 to 24 years, with 89.6% or 283 individuals in the labor force. Within the labor force, the 45 to 54 years age range has the highest percentage of unemployed individuals, with 3.9% or 19 of them being unemployed.
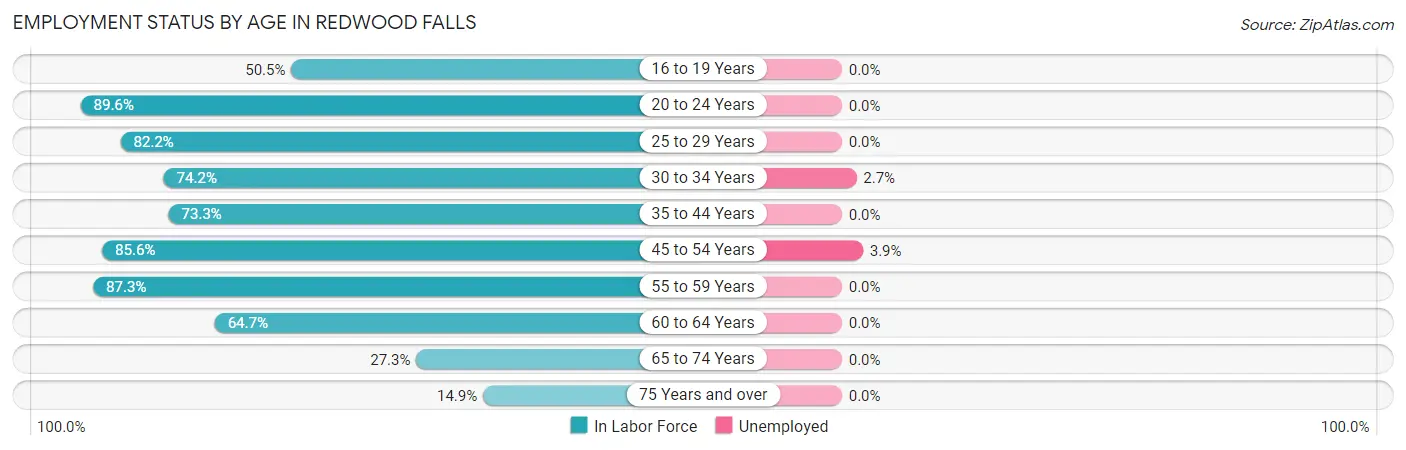
| Age Bracket | In Labor Force | Unemployed |
| 16 to 19 Years | 148 (50.5%) | 0 (0.0%) |
| 20 to 24 Years | 283 (89.6%) | 0 (0.0%) |
| 25 to 29 Years | 281 (82.2%) | 0 (0.0%) |
| 30 to 34 Years | 187 (74.2%) | 5 (2.7%) |
| 35 to 44 Years | 388 (73.3%) | 0 (0.0%) |
| 45 to 54 Years | 488 (85.6%) | 19 (3.9%) |
| 55 to 59 Years | 233 (87.3%) | 0 (0.0%) |
| 60 to 64 Years | 191 (64.7%) | 0 (0.0%) |
| 65 to 74 Years | 187 (27.3%) | 0 (0.0%) |
| 75 Years and over | 83 (14.9%) | 0 (0.0%) |
| Total | 2,469 (60.1%) | 25 (1.0%) |
Employment Status by Educational Attainment in Redwood Falls
According to labor force statistics for Redwood Falls, 78.4% of individuals (1,768) out of the total population between 25 and 64 years of age (2,255) are in the labor force, with 1.4% or 25 of them being unemployed. The group with the highest labor force participation rate are those with the educational attainment of bachelor's degree or higher, with 90.0% or 467 individuals in the labor force. Within the labor force, individuals with college / associate degree education have the highest percentage of unemployment, with 1.7% or 11 of them being unemployed.
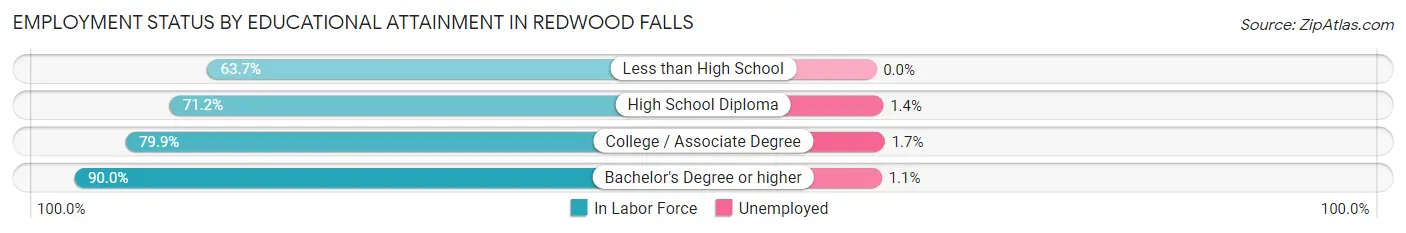
| Educational Attainment | In Labor Force | Unemployed |
| Less than High School | 65 (63.7%) | 0 (0.0%) |
| High School Diploma | 572 (71.2%) | 11 (1.4%) |
| College / Associate Degree | 664 (79.9%) | 14 (1.7%) |
| Bachelor's Degree or higher | 467 (90.0%) | 6 (1.1%) |
| Total | 1,768 (78.4%) | 32 (1.4%) |
Employment Occupations by Sex in Redwood Falls
Management, Business, Science and Arts Occupations
The most common Management, Business, Science and Arts occupations in Redwood Falls are Community & Social Service (361 | 14.8%), Education Instruction & Library (189 | 7.7%), Management (176 | 7.2%), Health Diagnosing & Treating (136 | 5.6%), and Education, Arts & Media (115 | 4.7%).
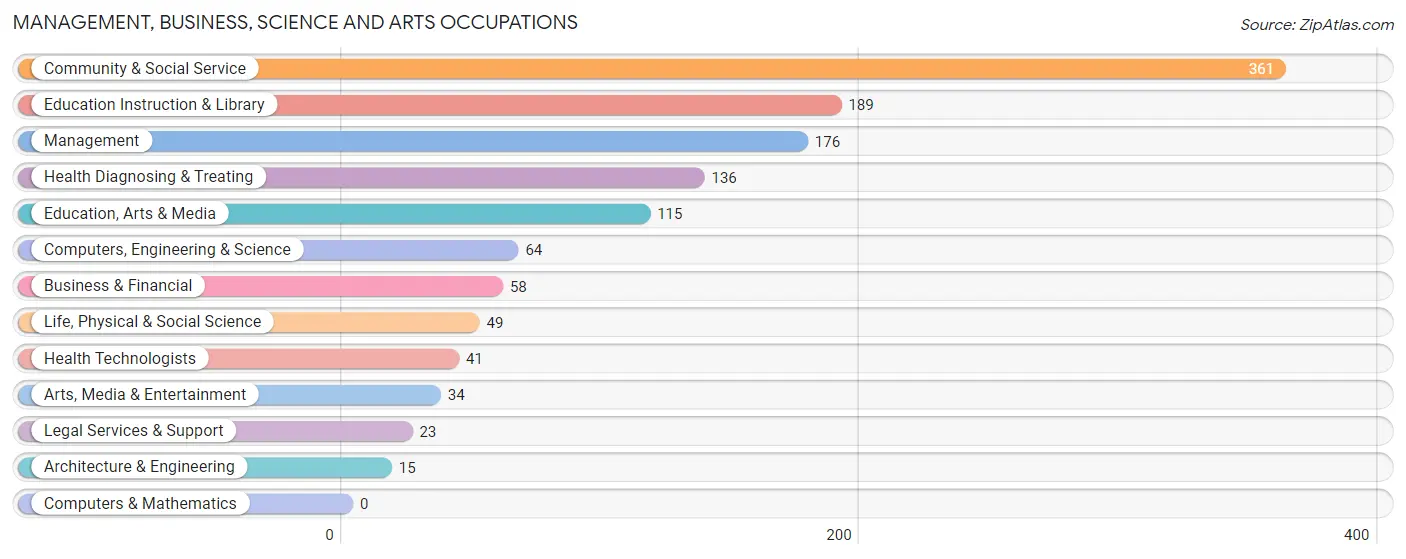
Management, Business, Science and Arts Occupations by Sex
Within the Management, Business, Science and Arts occupations in Redwood Falls, the most male-oriented occupations are Computers, Engineering & Science (100.0%), Architecture & Engineering (100.0%), and Life, Physical & Social Science (100.0%), while the most female-oriented occupations are Arts, Media & Entertainment (100.0%), Health Diagnosing & Treating (99.3%), and Health Technologists (97.6%).
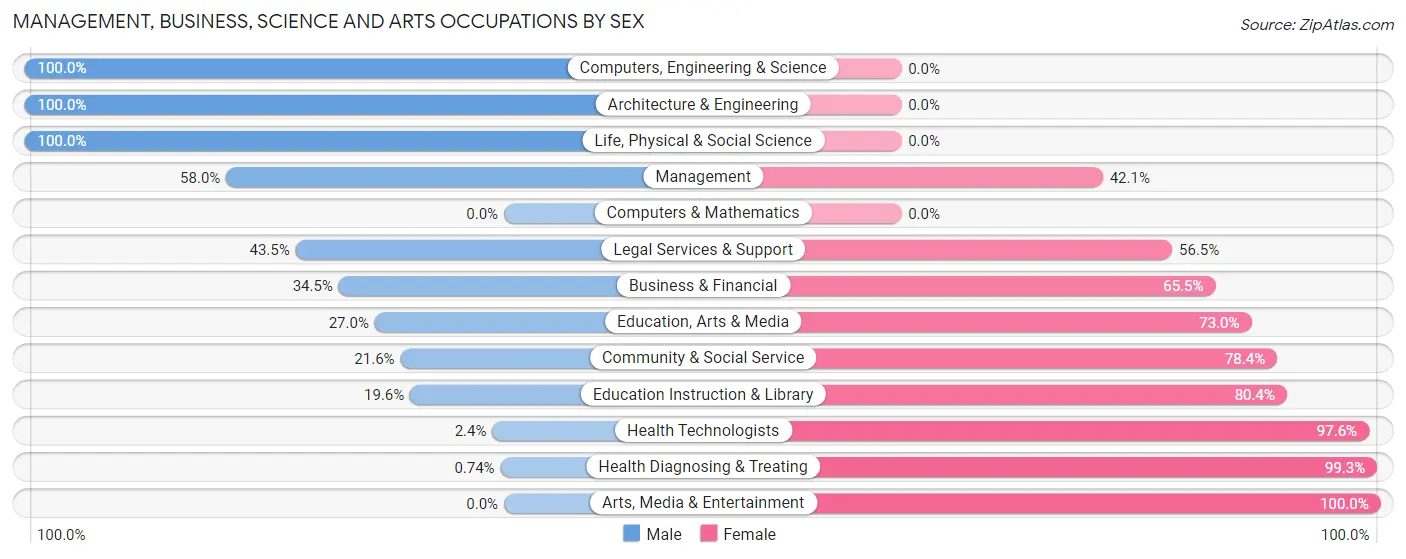
| Occupation | Male | Female |
| Management | 102 (58.0%) | 74 (42.0%) |
| Business & Financial | 20 (34.5%) | 38 (65.5%) |
| Computers, Engineering & Science | 64 (100.0%) | 0 (0.0%) |
| Computers & Mathematics | 0 (0.0%) | 0 (0.0%) |
| Architecture & Engineering | 15 (100.0%) | 0 (0.0%) |
| Life, Physical & Social Science | 49 (100.0%) | 0 (0.0%) |
| Community & Social Service | 78 (21.6%) | 283 (78.4%) |
| Education, Arts & Media | 31 (27.0%) | 84 (73.0%) |
| Legal Services & Support | 10 (43.5%) | 13 (56.5%) |
| Education Instruction & Library | 37 (19.6%) | 152 (80.4%) |
| Arts, Media & Entertainment | 0 (0.0%) | 34 (100.0%) |
| Health Diagnosing & Treating | 1 (0.7%) | 135 (99.3%) |
| Health Technologists | 1 (2.4%) | 40 (97.6%) |
| Total (Category) | 265 (33.3%) | 530 (66.7%) |
| Total (Overall) | 1,272 (52.0%) | 1,173 (48.0%) |
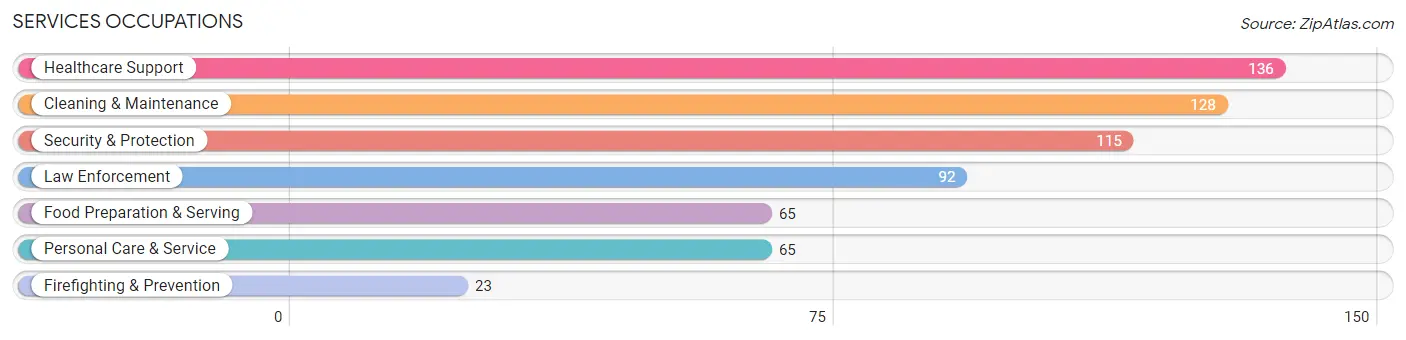
Services Occupations
The most common Services occupations in Redwood Falls are Healthcare Support (136 | 5.6%), Cleaning & Maintenance (128 | 5.2%), Security & Protection (115 | 4.7%), Law Enforcement (92 | 3.8%), and Food Preparation & Serving (65 | 2.7%).
Services Occupations by Sex
Within the Services occupations in Redwood Falls, the most male-oriented occupations are Law Enforcement (100.0%), Security & Protection (81.7%), and Cleaning & Maintenance (53.1%), while the most female-oriented occupations are Personal Care & Service (100.0%), Firefighting & Prevention (91.3%), and Food Preparation & Serving (72.3%).
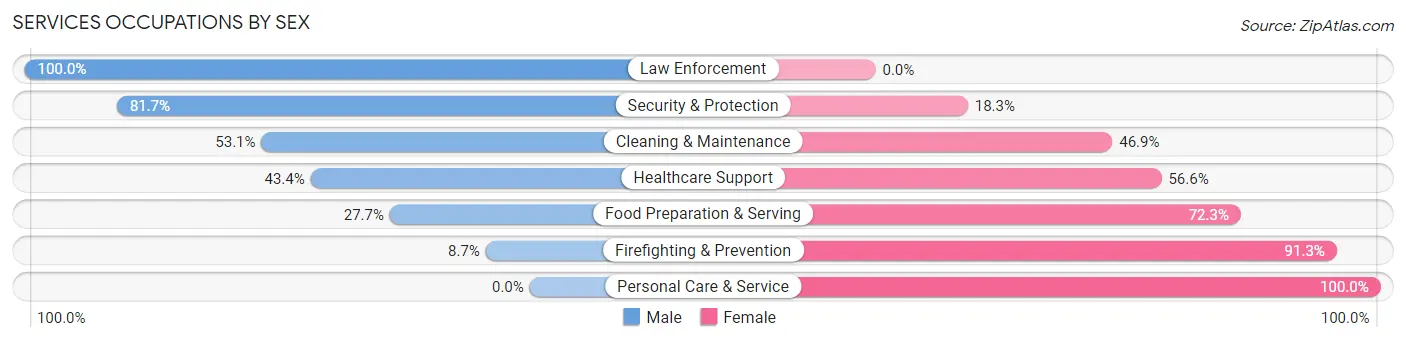
| Occupation | Male | Female |
| Healthcare Support | 59 (43.4%) | 77 (56.6%) |
| Security & Protection | 94 (81.7%) | 21 (18.3%) |
| Firefighting & Prevention | 2 (8.7%) | 21 (91.3%) |
| Law Enforcement | 92 (100.0%) | 0 (0.0%) |
| Food Preparation & Serving | 18 (27.7%) | 47 (72.3%) |
| Cleaning & Maintenance | 68 (53.1%) | 60 (46.9%) |
| Personal Care & Service | 0 (0.0%) | 65 (100.0%) |
| Total (Category) | 239 (46.9%) | 270 (53.0%) |
| Total (Overall) | 1,272 (52.0%) | 1,173 (48.0%) |
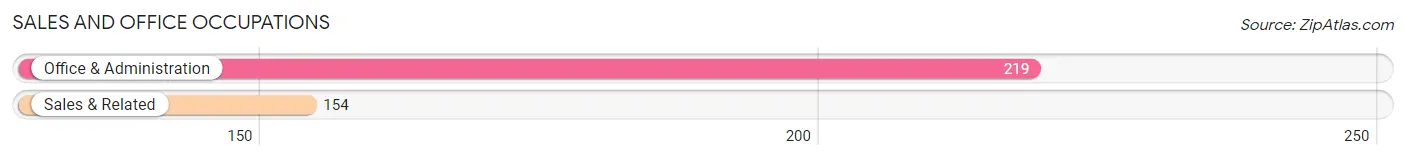
Sales and Office Occupations
The most common Sales and Office occupations in Redwood Falls are Office & Administration (219 | 9.0%), and Sales & Related (154 | 6.3%).
Sales and Office Occupations by Sex
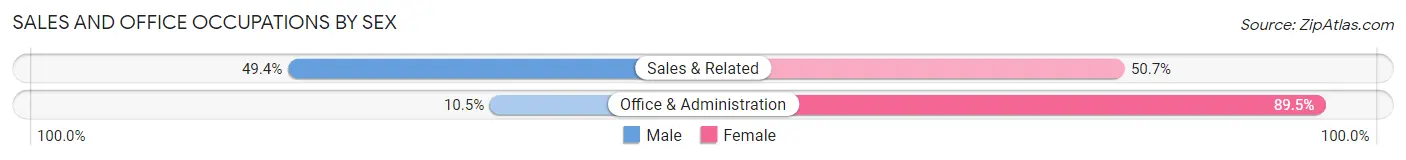
| Occupation | Male | Female |
| Sales & Related | 76 (49.3%) | 78 (50.6%) |
| Office & Administration | 23 (10.5%) | 196 (89.5%) |
| Total (Category) | 99 (26.5%) | 274 (73.5%) |
| Total (Overall) | 1,272 (52.0%) | 1,173 (48.0%) |
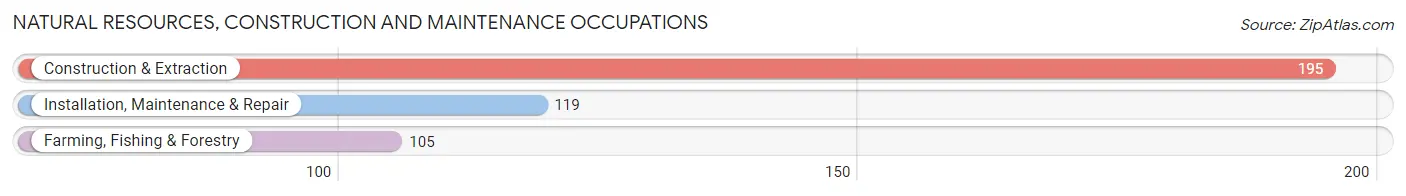
Natural Resources, Construction and Maintenance Occupations
The most common Natural Resources, Construction and Maintenance occupations in Redwood Falls are Construction & Extraction (195 | 8.0%), Installation, Maintenance & Repair (119 | 4.9%), and Farming, Fishing & Forestry (105 | 4.3%).
Natural Resources, Construction and Maintenance Occupations by Sex
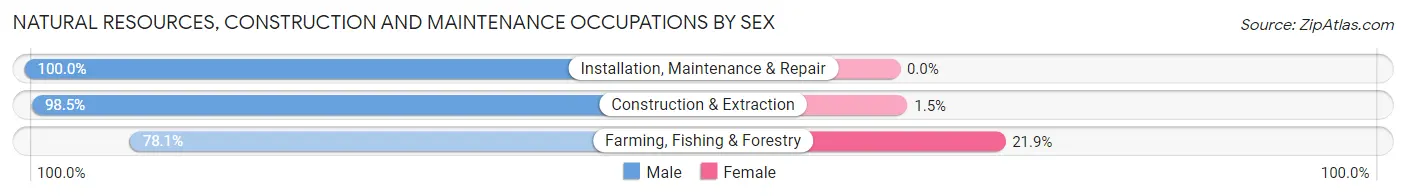
| Occupation | Male | Female |
| Farming, Fishing & Forestry | 82 (78.1%) | 23 (21.9%) |
| Construction & Extraction | 192 (98.5%) | 3 (1.5%) |
| Installation, Maintenance & Repair | 119 (100.0%) | 0 (0.0%) |
| Total (Category) | 393 (93.8%) | 26 (6.2%) |
| Total (Overall) | 1,272 (52.0%) | 1,173 (48.0%) |
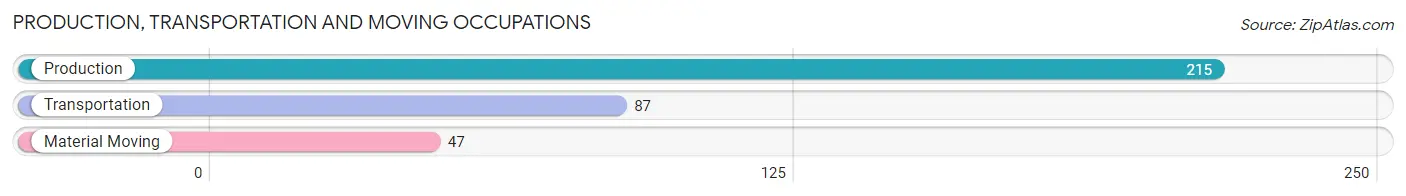
Production, Transportation and Moving Occupations
The most common Production, Transportation and Moving occupations in Redwood Falls are Production (215 | 8.8%), Transportation (87 | 3.6%), and Material Moving (47 | 1.9%).
Production, Transportation and Moving Occupations by Sex
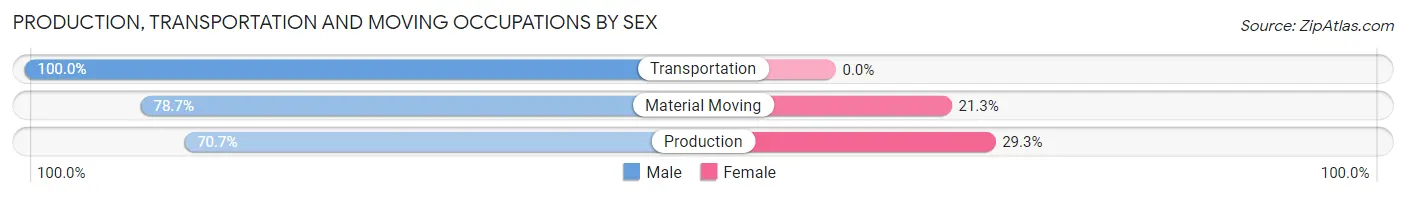
| Occupation | Male | Female |
| Production | 152 (70.7%) | 63 (29.3%) |
| Transportation | 87 (100.0%) | 0 (0.0%) |
| Material Moving | 37 (78.7%) | 10 (21.3%) |
| Total (Category) | 276 (79.1%) | 73 (20.9%) |
| Total (Overall) | 1,272 (52.0%) | 1,173 (48.0%) |
Employment Industries by Sex in Redwood Falls
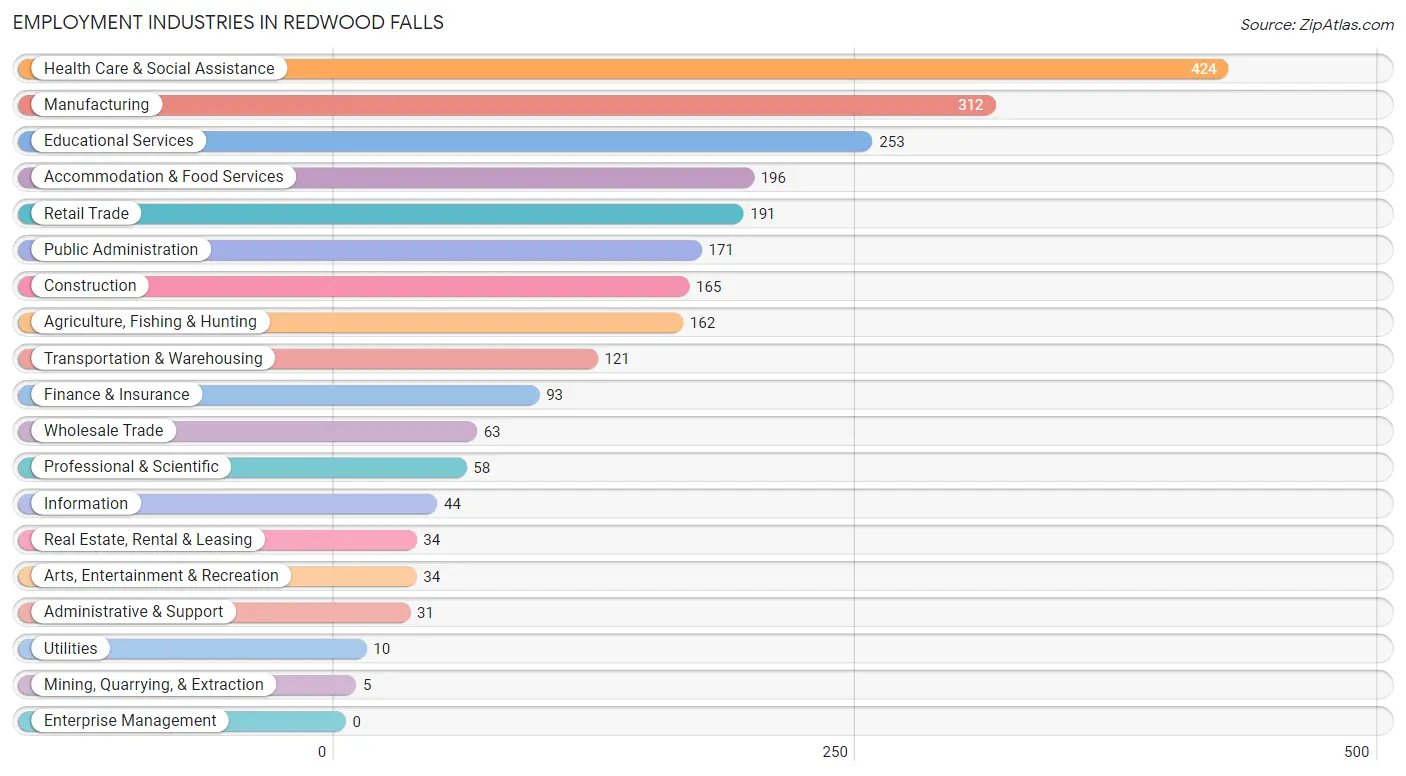
Employment Industries in Redwood Falls
The major employment industries in Redwood Falls include Health Care & Social Assistance (424 | 17.3%), Manufacturing (312 | 12.8%), Educational Services (253 | 10.3%), Accommodation & Food Services (196 | 8.0%), and Retail Trade (191 | 7.8%).
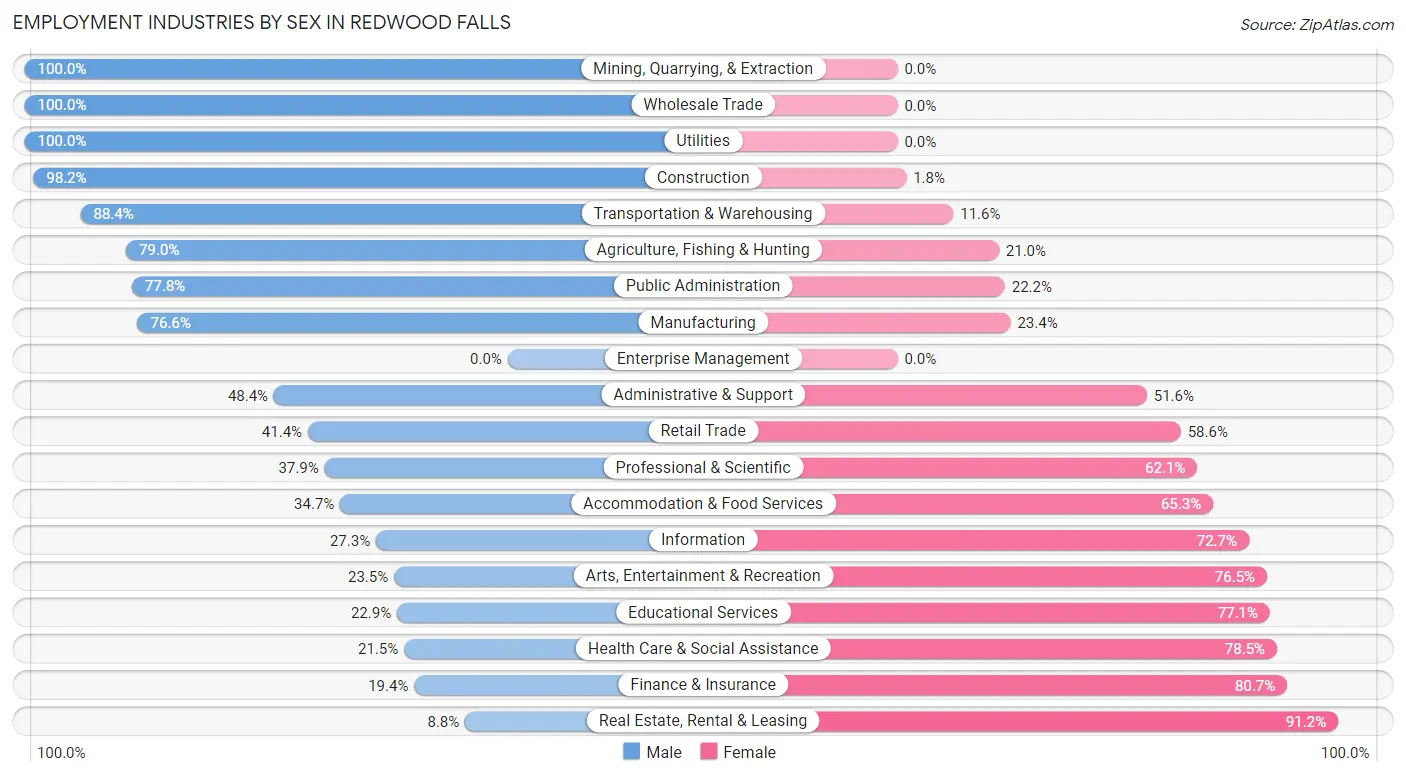
Employment Industries by Sex in Redwood Falls
The Redwood Falls industries that see more men than women are Mining, Quarrying, & Extraction (100.0%), Wholesale Trade (100.0%), and Utilities (100.0%), whereas the industries that tend to have a higher number of women are Real Estate, Rental & Leasing (91.2%), Finance & Insurance (80.6%), and Health Care & Social Assistance (78.5%).
| Industry | Male | Female |
| Agriculture, Fishing & Hunting | 128 (79.0%) | 34 (21.0%) |
| Mining, Quarrying, & Extraction | 5 (100.0%) | 0 (0.0%) |
| Construction | 162 (98.2%) | 3 (1.8%) |
| Manufacturing | 239 (76.6%) | 73 (23.4%) |
| Wholesale Trade | 63 (100.0%) | 0 (0.0%) |
| Retail Trade | 79 (41.4%) | 112 (58.6%) |
| Transportation & Warehousing | 107 (88.4%) | 14 (11.6%) |
| Utilities | 10 (100.0%) | 0 (0.0%) |
| Information | 12 (27.3%) | 32 (72.7%) |
| Finance & Insurance | 18 (19.4%) | 75 (80.6%) |
| Real Estate, Rental & Leasing | 3 (8.8%) | 31 (91.2%) |
| Professional & Scientific | 22 (37.9%) | 36 (62.1%) |
| Enterprise Management | 0 (0.0%) | 0 (0.0%) |
| Administrative & Support | 15 (48.4%) | 16 (51.6%) |
| Educational Services | 58 (22.9%) | 195 (77.1%) |
| Health Care & Social Assistance | 91 (21.5%) | 333 (78.5%) |
| Arts, Entertainment & Recreation | 8 (23.5%) | 26 (76.5%) |
| Accommodation & Food Services | 68 (34.7%) | 128 (65.3%) |
| Public Administration | 133 (77.8%) | 38 (22.2%) |
| Total | 1,272 (52.0%) | 1,173 (48.0%) |
Education in Redwood Falls
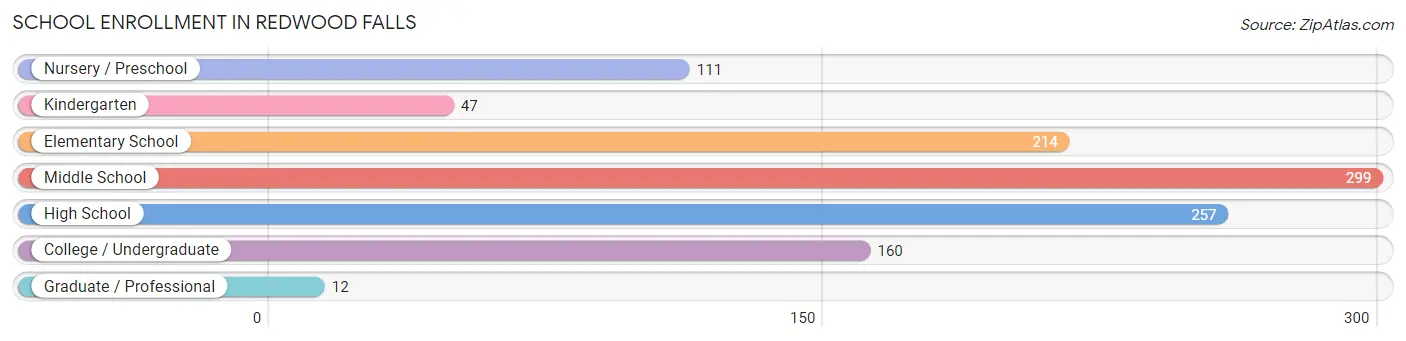
School Enrollment in Redwood Falls
The most common levels of schooling among the 1,100 students in Redwood Falls are middle school (299 | 27.2%), high school (257 | 23.4%), and elementary school (214 | 19.5%).
| School Level | # Students | % Students |
| Nursery / Preschool | 111 | 10.1% |
| Kindergarten | 47 | 4.3% |
| Elementary School | 214 | 19.5% |
| Middle School | 299 | 27.2% |
| High School | 257 | 23.4% |
| College / Undergraduate | 160 | 14.5% |
| Graduate / Professional | 12 | 1.1% |
| Total | 1,100 | 100.0% |
School Enrollment by Age by Funding Source in Redwood Falls
Out of a total of 1,100 students who are enrolled in schools in Redwood Falls, 163 (14.8%) attend a private institution, while the remaining 937 (85.2%) are enrolled in public schools. The age group of 3 to 4 year olds has the highest likelihood of being enrolled in private schools, with 35 (58.3% in the age bracket) enrolled. Conversely, the age group of 25 to 34 year olds has the lowest likelihood of being enrolled in a private school, with 36 (100.0% in the age bracket) attending a public institution.
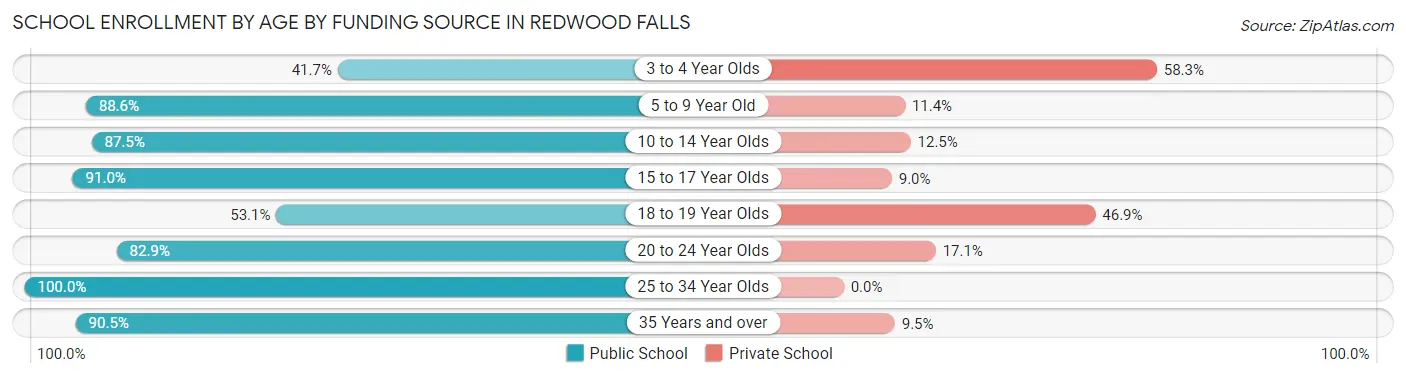
| Age Bracket | Public School | Private School |
| 3 to 4 Year Olds | 25 (41.7%) | 35 (58.3%) |
| 5 to 9 Year Old | 264 (88.6%) | 34 (11.4%) |
| 10 to 14 Year Olds | 316 (87.5%) | 45 (12.5%) |
| 15 to 17 Year Olds | 183 (91.0%) | 18 (9.0%) |
| 18 to 19 Year Olds | 17 (53.1%) | 15 (46.9%) |
| 20 to 24 Year Olds | 58 (82.9%) | 12 (17.1%) |
| 25 to 34 Year Olds | 36 (100.0%) | 0 (0.0%) |
| 35 Years and over | 38 (90.5%) | 4 (9.5%) |
| Total | 937 (85.2%) | 163 (14.8%) |
Educational Attainment by Field of Study in Redwood Falls
Education (223 | 28.1%), arts & humanities (102 | 12.9%), bio, nature & agricultural (98 | 12.4%), science & technology (79 | 10.0%), and business (71 | 8.9%) are the most common fields of study among 793 individuals in Redwood Falls who have obtained a bachelor's degree or higher.
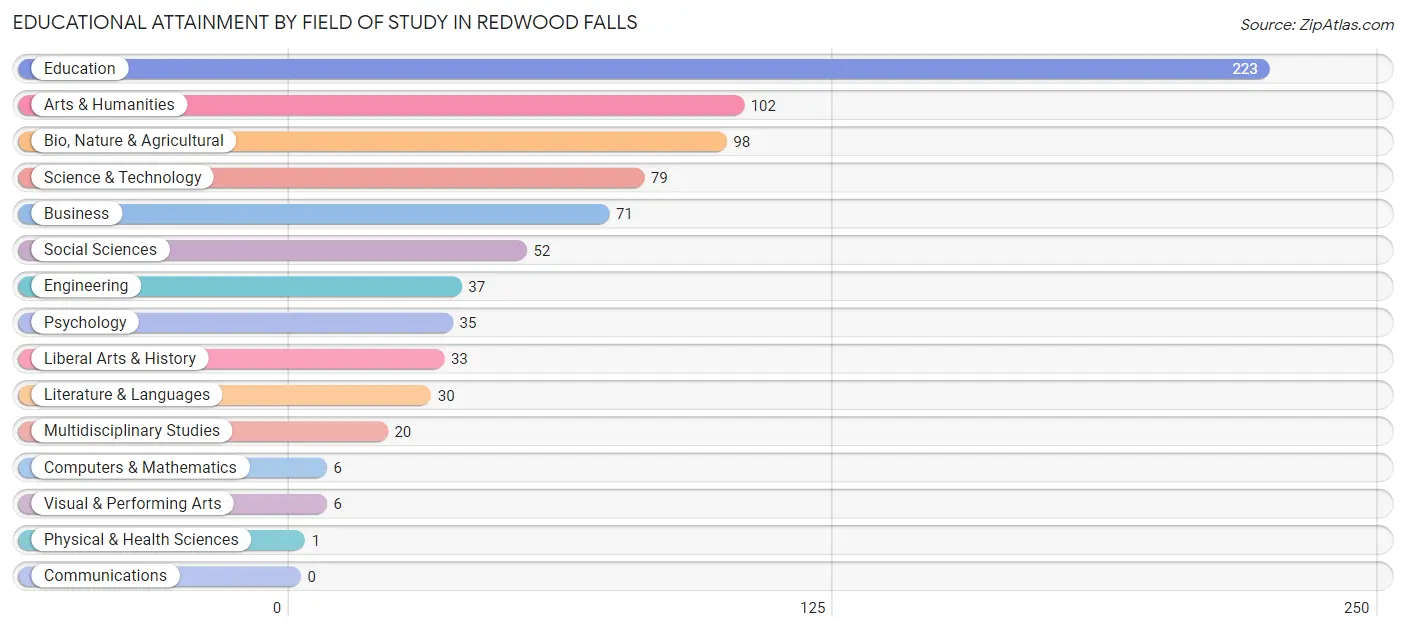
| Field of Study | # Graduates | % Graduates |
| Computers & Mathematics | 6 | 0.8% |
| Bio, Nature & Agricultural | 98 | 12.4% |
| Physical & Health Sciences | 1 | 0.1% |
| Psychology | 35 | 4.4% |
| Social Sciences | 52 | 6.6% |
| Engineering | 37 | 4.7% |
| Multidisciplinary Studies | 20 | 2.5% |
| Science & Technology | 79 | 10.0% |
| Business | 71 | 8.9% |
| Education | 223 | 28.1% |
| Literature & Languages | 30 | 3.8% |
| Liberal Arts & History | 33 | 4.2% |
| Visual & Performing Arts | 6 | 0.8% |
| Communications | 0 | 0.0% |
| Arts & Humanities | 102 | 12.9% |
| Total | 793 | 100.0% |
Transportation & Commute in Redwood Falls
Vehicle Availability by Sex in Redwood Falls
The most prevalent vehicle ownership categories in Redwood Falls are males with 2 vehicles (637, accounting for 52.0%) and females with 2 vehicles (523, making up 57.6%).
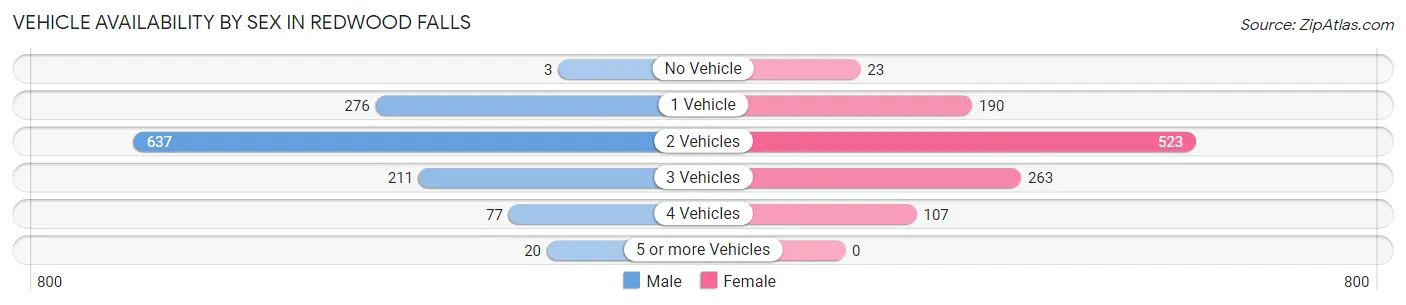
| Vehicles Available | Male | Female |
| No Vehicle | 3 (0.3%) | 23 (2.1%) |
| 1 Vehicle | 276 (22.6%) | 190 (17.2%) |
| 2 Vehicles | 637 (52.0%) | 523 (47.3%) |
| 3 Vehicles | 211 (17.2%) | 263 (23.8%) |
| 4 Vehicles | 77 (6.3%) | 107 (9.7%) |
| 5 or more Vehicles | 20 (1.6%) | 0 (0.0%) |
| Total | 1,224 (100.0%) | 1,106 (100.0%) |
Commute Time in Redwood Falls
The most frequently occuring commute durations in Redwood Falls are 5 to 9 minutes (983 commuters, 43.8%), less than 5 minutes (354 commuters, 15.8%), and 10 to 14 minutes (317 commuters, 14.1%).
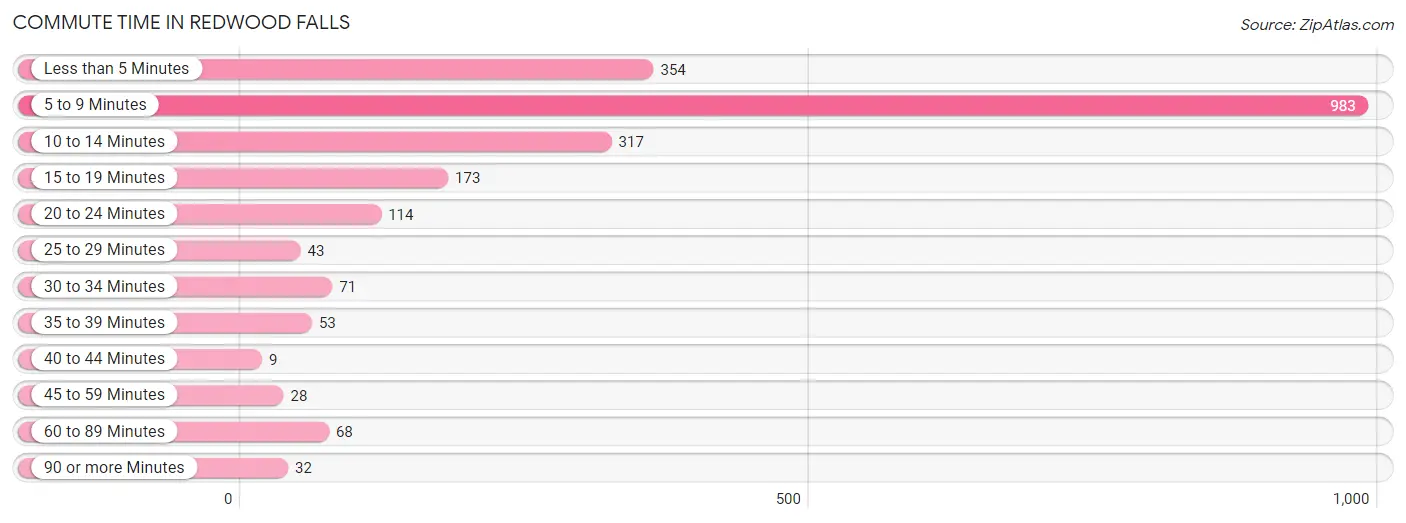
| Commute Time | # Commuters | % Commuters |
| Less than 5 Minutes | 354 | 15.8% |
| 5 to 9 Minutes | 983 | 43.8% |
| 10 to 14 Minutes | 317 | 14.1% |
| 15 to 19 Minutes | 173 | 7.7% |
| 20 to 24 Minutes | 114 | 5.1% |
| 25 to 29 Minutes | 43 | 1.9% |
| 30 to 34 Minutes | 71 | 3.2% |
| 35 to 39 Minutes | 53 | 2.4% |
| 40 to 44 Minutes | 9 | 0.4% |
| 45 to 59 Minutes | 28 | 1.3% |
| 60 to 89 Minutes | 68 | 3.0% |
| 90 or more Minutes | 32 | 1.4% |
Commute Time by Sex in Redwood Falls
The most common commute times in Redwood Falls are 5 to 9 minutes (494 commuters, 41.3%) for males and 5 to 9 minutes (489 commuters, 46.6%) for females.
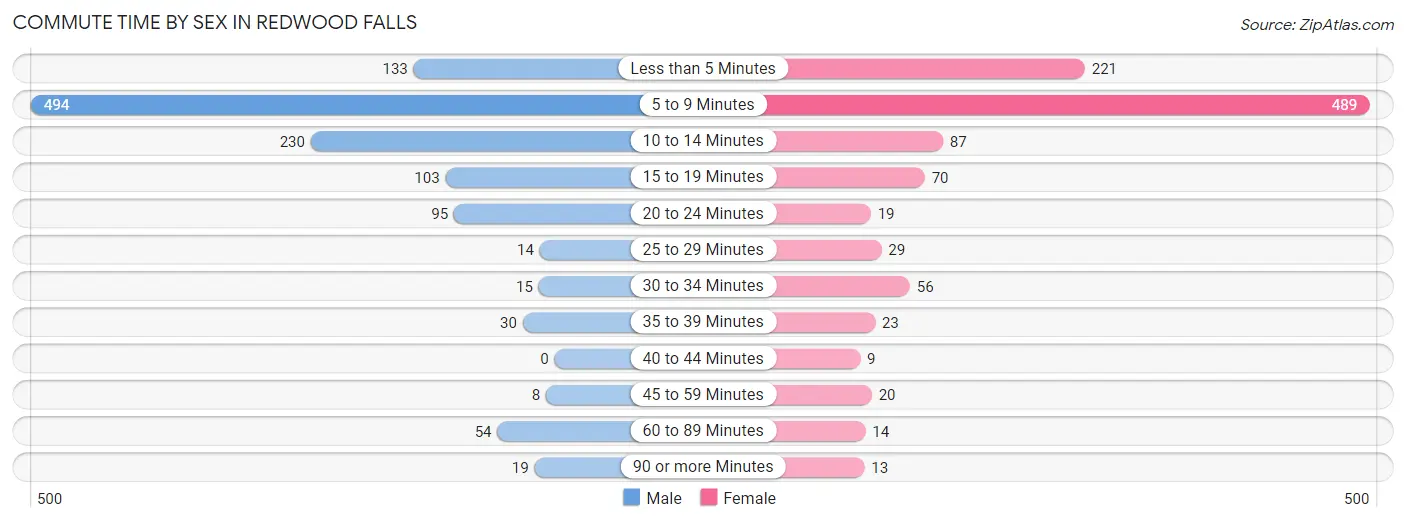
| Commute Time | Male | Female |
| Less than 5 Minutes | 133 (11.1%) | 221 (21.0%) |
| 5 to 9 Minutes | 494 (41.3%) | 489 (46.6%) |
| 10 to 14 Minutes | 230 (19.3%) | 87 (8.3%) |
| 15 to 19 Minutes | 103 (8.6%) | 70 (6.7%) |
| 20 to 24 Minutes | 95 (8.0%) | 19 (1.8%) |
| 25 to 29 Minutes | 14 (1.2%) | 29 (2.8%) |
| 30 to 34 Minutes | 15 (1.3%) | 56 (5.3%) |
| 35 to 39 Minutes | 30 (2.5%) | 23 (2.2%) |
| 40 to 44 Minutes | 0 (0.0%) | 9 (0.9%) |
| 45 to 59 Minutes | 8 (0.7%) | 20 (1.9%) |
| 60 to 89 Minutes | 54 (4.5%) | 14 (1.3%) |
| 90 or more Minutes | 19 (1.6%) | 13 (1.2%) |
Time of Departure to Work by Sex in Redwood Falls
The most frequent times of departure to work in Redwood Falls are 6:30 AM to 6:59 AM (302, 25.3%) for males and 7:30 AM to 7:59 AM (258, 24.6%) for females.
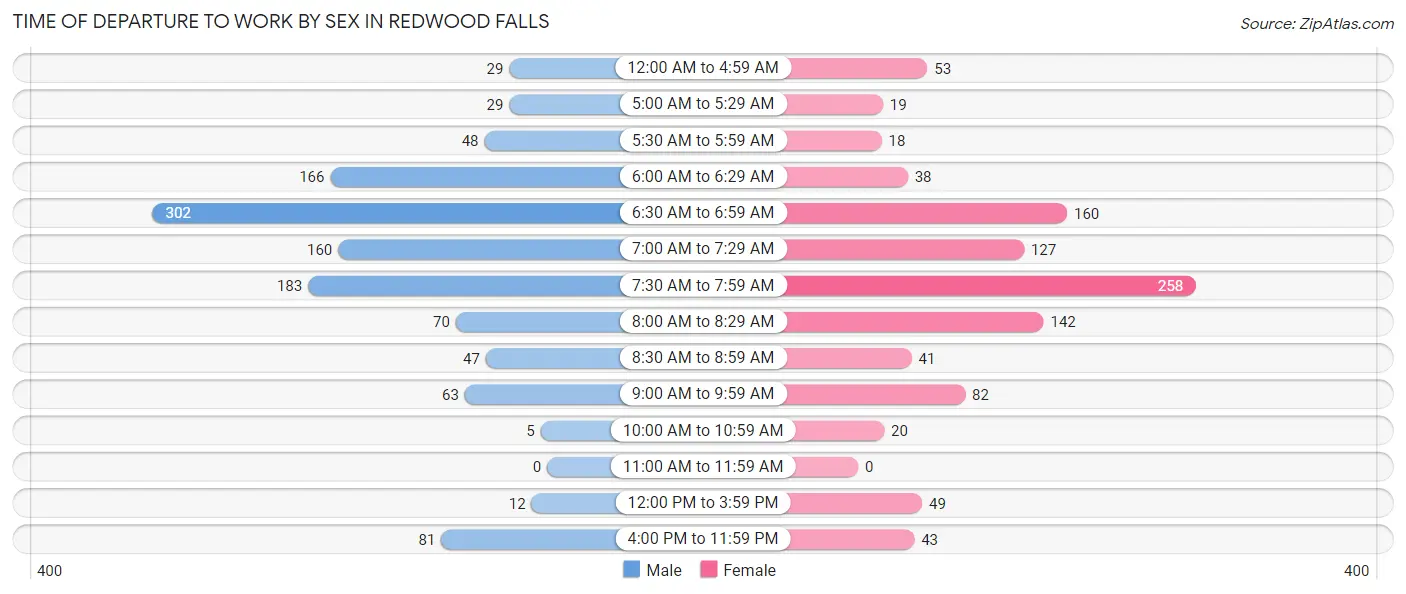
| Time of Departure | Male | Female |
| 12:00 AM to 4:59 AM | 29 (2.4%) | 53 (5.1%) |
| 5:00 AM to 5:29 AM | 29 (2.4%) | 19 (1.8%) |
| 5:30 AM to 5:59 AM | 48 (4.0%) | 18 (1.7%) |
| 6:00 AM to 6:29 AM | 166 (13.9%) | 38 (3.6%) |
| 6:30 AM to 6:59 AM | 302 (25.3%) | 160 (15.2%) |
| 7:00 AM to 7:29 AM | 160 (13.4%) | 127 (12.1%) |
| 7:30 AM to 7:59 AM | 183 (15.3%) | 258 (24.6%) |
| 8:00 AM to 8:29 AM | 70 (5.9%) | 142 (13.5%) |
| 8:30 AM to 8:59 AM | 47 (3.9%) | 41 (3.9%) |
| 9:00 AM to 9:59 AM | 63 (5.3%) | 82 (7.8%) |
| 10:00 AM to 10:59 AM | 5 (0.4%) | 20 (1.9%) |
| 11:00 AM to 11:59 AM | 0 (0.0%) | 0 (0.0%) |
| 12:00 PM to 3:59 PM | 12 (1.0%) | 49 (4.7%) |
| 4:00 PM to 11:59 PM | 81 (6.8%) | 43 (4.1%) |
| Total | 1,195 (100.0%) | 1,050 (100.0%) |
Housing Occupancy in Redwood Falls
Occupancy by Ownership in Redwood Falls
Of the total 2,072 dwellings in Redwood Falls, owner-occupied units account for 1,451 (70.0%), while renter-occupied units make up 621 (30.0%).
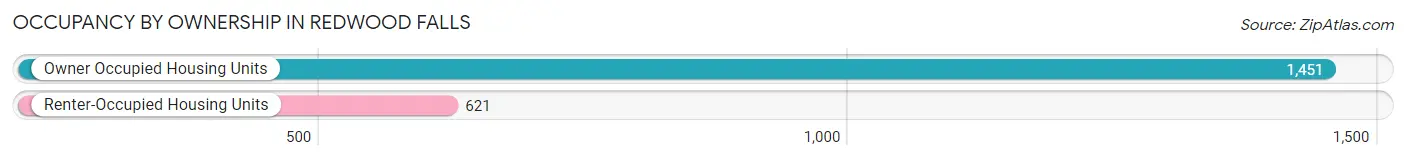
| Occupancy | # Housing Units | % Housing Units |
| Owner Occupied Housing Units | 1,451 | 70.0% |
| Renter-Occupied Housing Units | 621 | 30.0% |
| Total Occupied Housing Units | 2,072 | 100.0% |
Occupancy by Household Size in Redwood Falls
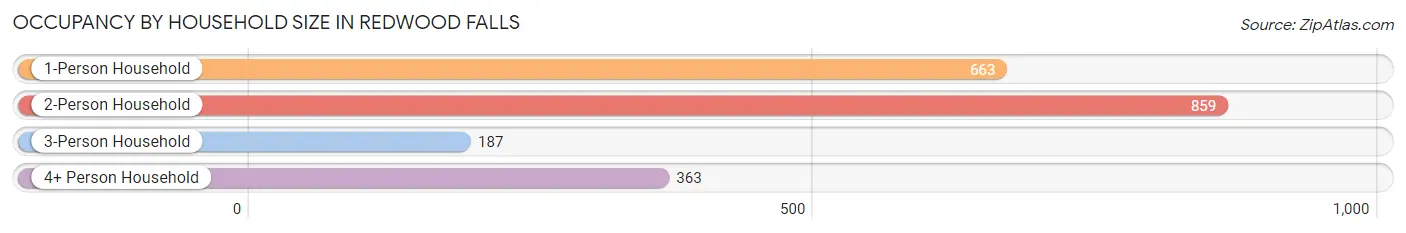
| Household Size | # Housing Units | % Housing Units |
| 1-Person Household | 663 | 32.0% |
| 2-Person Household | 859 | 41.5% |
| 3-Person Household | 187 | 9.0% |
| 4+ Person Household | 363 | 17.5% |
| Total Housing Units | 2,072 | 100.0% |
Occupancy by Ownership by Household Size in Redwood Falls
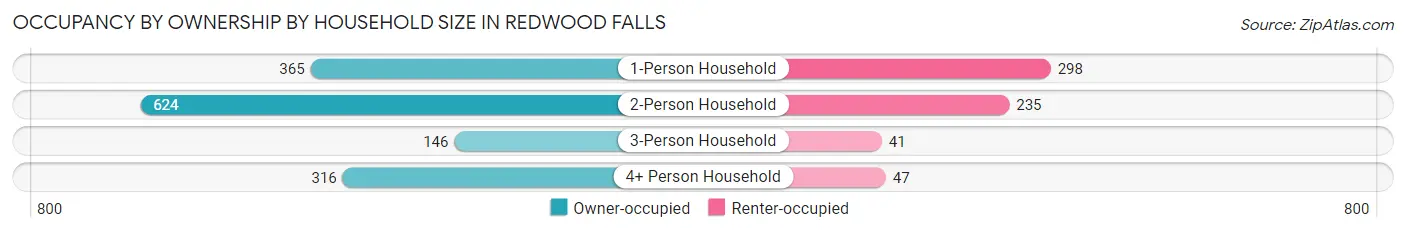
| Household Size | Owner-occupied | Renter-occupied |
| 1-Person Household | 365 (55.0%) | 298 (45.0%) |
| 2-Person Household | 624 (72.6%) | 235 (27.4%) |
| 3-Person Household | 146 (78.1%) | 41 (21.9%) |
| 4+ Person Household | 316 (87.1%) | 47 (13.0%) |
| Total Housing Units | 1,451 (70.0%) | 621 (30.0%) |
Occupancy by Educational Attainment in Redwood Falls
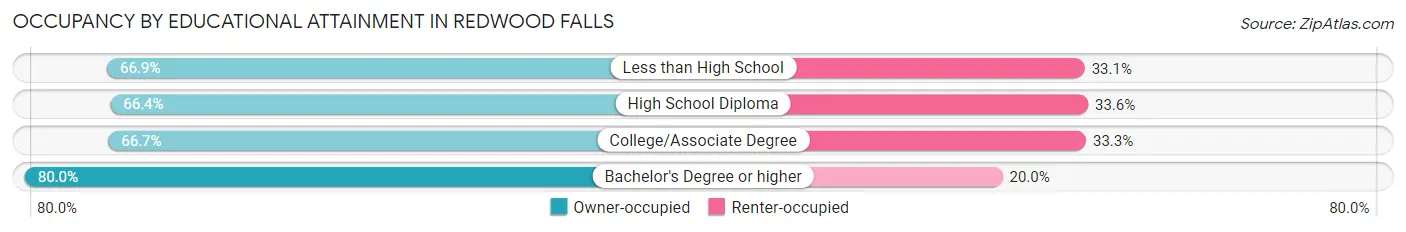
| Household Size | Owner-occupied | Renter-occupied |
| Less than High School | 87 (66.9%) | 43 (33.1%) |
| High School Diploma | 476 (66.4%) | 241 (33.6%) |
| College/Associate Degree | 461 (66.7%) | 230 (33.3%) |
| Bachelor's Degree or higher | 427 (80.0%) | 107 (20.0%) |
Occupancy by Age of Householder in Redwood Falls
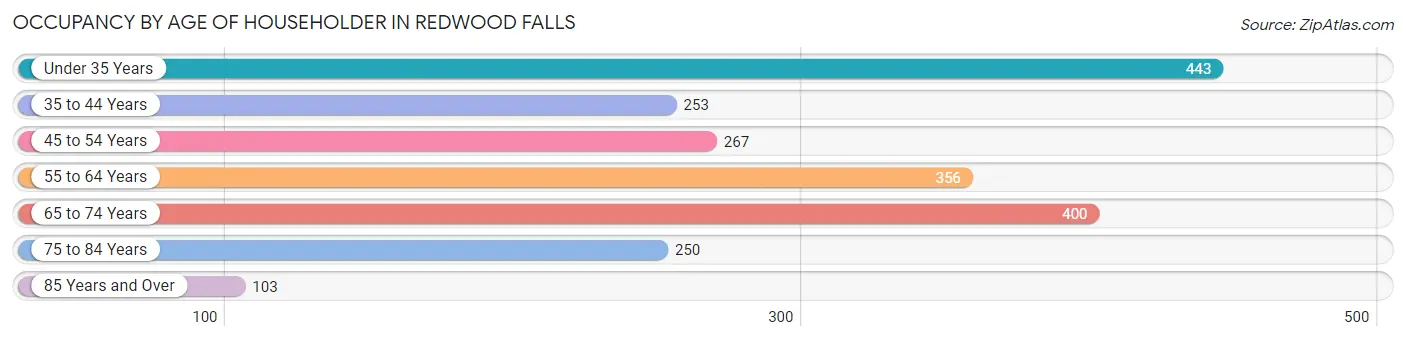
| Age Bracket | # Households | % Households |
| Under 35 Years | 443 | 21.4% |
| 35 to 44 Years | 253 | 12.2% |
| 45 to 54 Years | 267 | 12.9% |
| 55 to 64 Years | 356 | 17.2% |
| 65 to 74 Years | 400 | 19.3% |
| 75 to 84 Years | 250 | 12.1% |
| 85 Years and Over | 103 | 5.0% |
| Total | 2,072 | 100.0% |
Housing Finances in Redwood Falls
Median Income by Occupancy in Redwood Falls
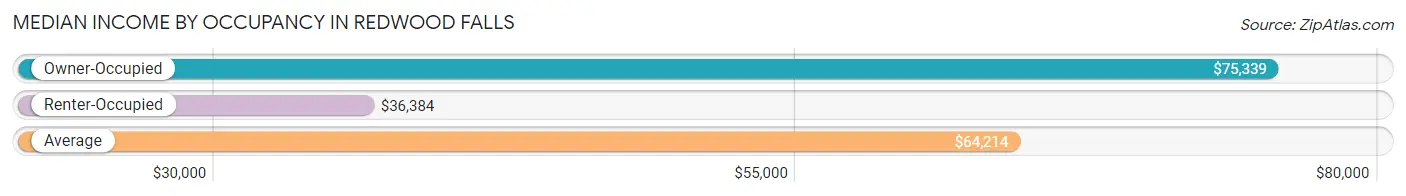
| Occupancy Type | # Households | Median Income |
| Owner-Occupied | 1,451 (70.0%) | $75,339 |
| Renter-Occupied | 621 (30.0%) | $36,384 |
| Average | 2,072 (100.0%) | $64,214 |
Occupancy by Householder Income Bracket in Redwood Falls
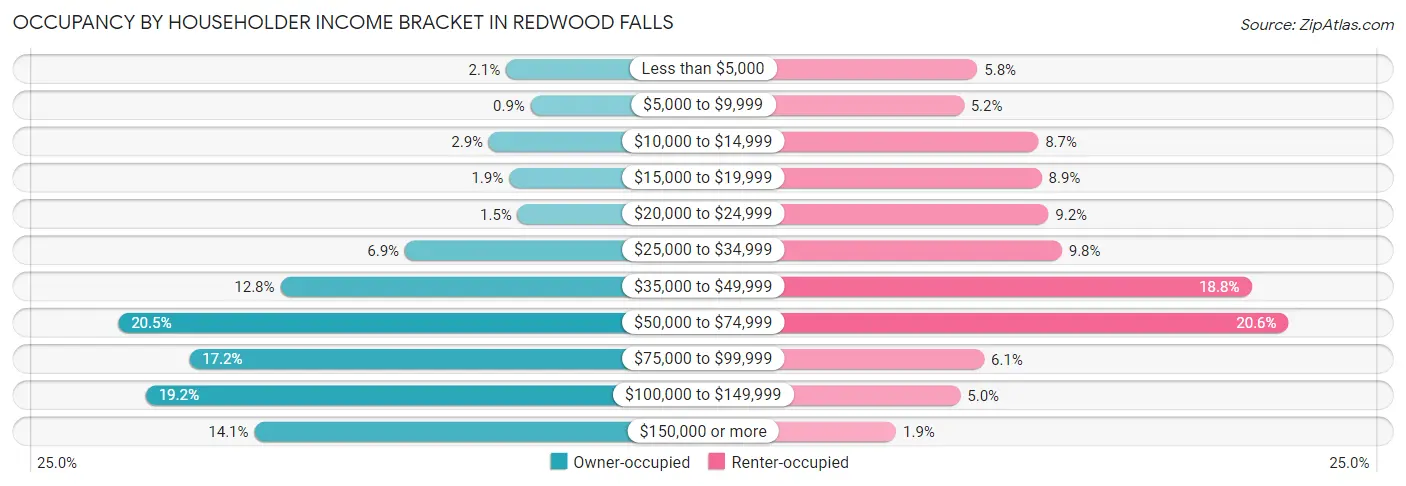
| Income Bracket | Owner-occupied | Renter-occupied |
| Less than $5,000 | 30 (2.1%) | 36 (5.8%) |
| $5,000 to $9,999 | 13 (0.9%) | 32 (5.1%) |
| $10,000 to $14,999 | 42 (2.9%) | 54 (8.7%) |
| $15,000 to $19,999 | 28 (1.9%) | 55 (8.9%) |
| $20,000 to $24,999 | 22 (1.5%) | 57 (9.2%) |
| $25,000 to $34,999 | 100 (6.9%) | 61 (9.8%) |
| $35,000 to $49,999 | 186 (12.8%) | 117 (18.8%) |
| $50,000 to $74,999 | 298 (20.5%) | 128 (20.6%) |
| $75,000 to $99,999 | 249 (17.2%) | 38 (6.1%) |
| $100,000 to $149,999 | 279 (19.2%) | 31 (5.0%) |
| $150,000 or more | 204 (14.1%) | 12 (1.9%) |
| Total | 1,451 (100.0%) | 621 (100.0%) |
Monthly Housing Cost Tiers in Redwood Falls
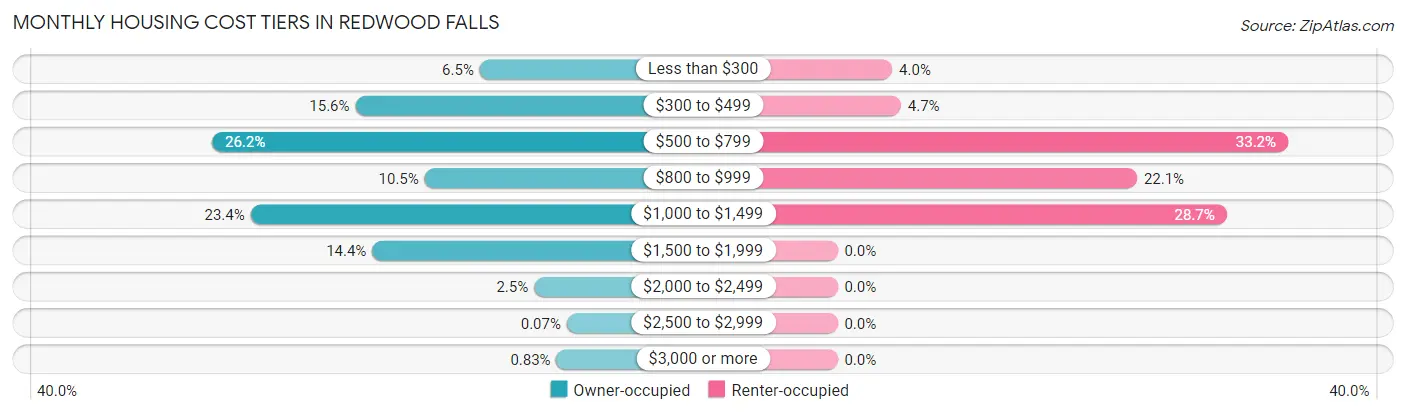
| Monthly Cost | Owner-occupied | Renter-occupied |
| Less than $300 | 94 (6.5%) | 25 (4.0%) |
| $300 to $499 | 227 (15.6%) | 29 (4.7%) |
| $500 to $799 | 380 (26.2%) | 206 (33.2%) |
| $800 to $999 | 153 (10.5%) | 137 (22.1%) |
| $1,000 to $1,499 | 339 (23.4%) | 178 (28.7%) |
| $1,500 to $1,999 | 209 (14.4%) | 0 (0.0%) |
| $2,000 to $2,499 | 36 (2.5%) | 0 (0.0%) |
| $2,500 to $2,999 | 1 (0.1%) | 0 (0.0%) |
| $3,000 or more | 12 (0.8%) | 0 (0.0%) |
| Total | 1,451 (100.0%) | 621 (100.0%) |
Physical Housing Characteristics in Redwood Falls
Housing Structures in Redwood Falls
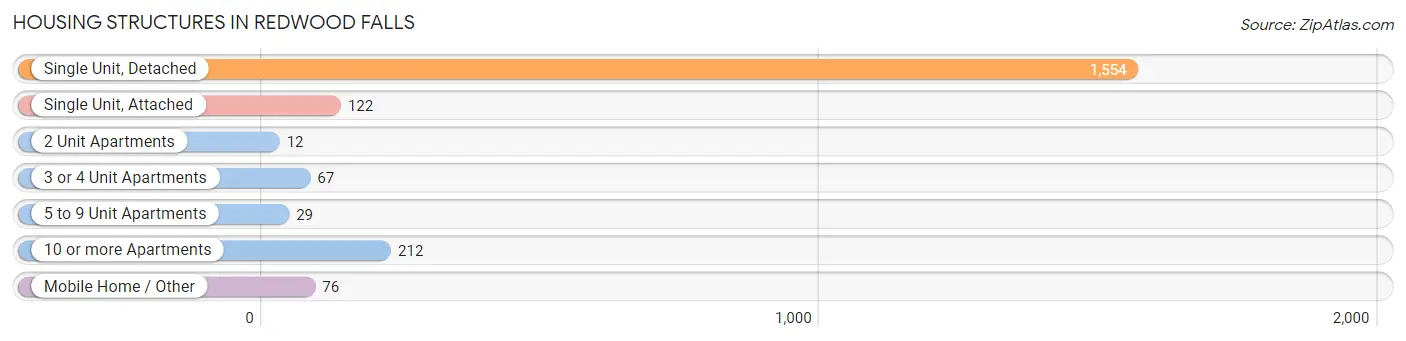
| Structure Type | # Housing Units | % Housing Units |
| Single Unit, Detached | 1,554 | 75.0% |
| Single Unit, Attached | 122 | 5.9% |
| 2 Unit Apartments | 12 | 0.6% |
| 3 or 4 Unit Apartments | 67 | 3.2% |
| 5 to 9 Unit Apartments | 29 | 1.4% |
| 10 or more Apartments | 212 | 10.2% |
| Mobile Home / Other | 76 | 3.7% |
| Total | 2,072 | 100.0% |
Housing Structures by Occupancy in Redwood Falls
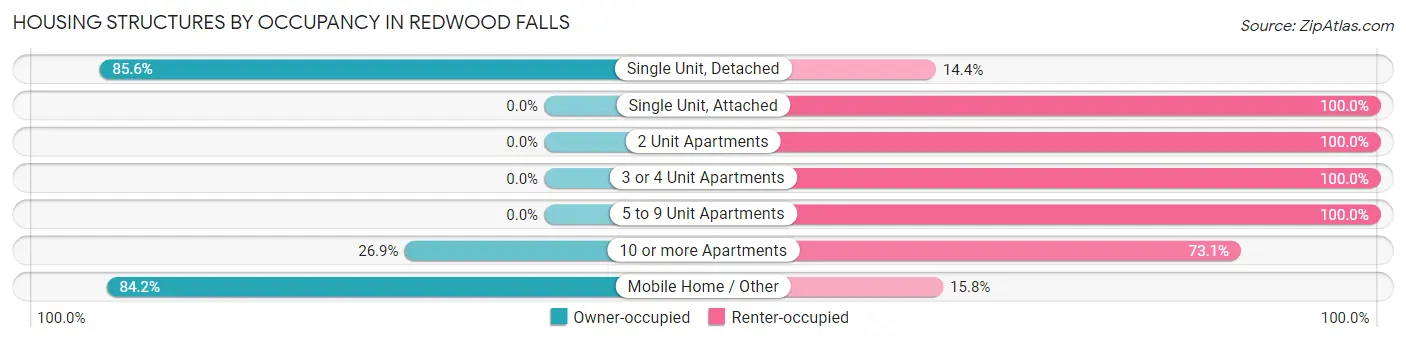
| Structure Type | Owner-occupied | Renter-occupied |
| Single Unit, Detached | 1,330 (85.6%) | 224 (14.4%) |
| Single Unit, Attached | 0 (0.0%) | 122 (100.0%) |
| 2 Unit Apartments | 0 (0.0%) | 12 (100.0%) |
| 3 or 4 Unit Apartments | 0 (0.0%) | 67 (100.0%) |
| 5 to 9 Unit Apartments | 0 (0.0%) | 29 (100.0%) |
| 10 or more Apartments | 57 (26.9%) | 155 (73.1%) |
| Mobile Home / Other | 64 (84.2%) | 12 (15.8%) |
| Total | 1,451 (70.0%) | 621 (30.0%) |
Housing Structures by Number of Rooms in Redwood Falls
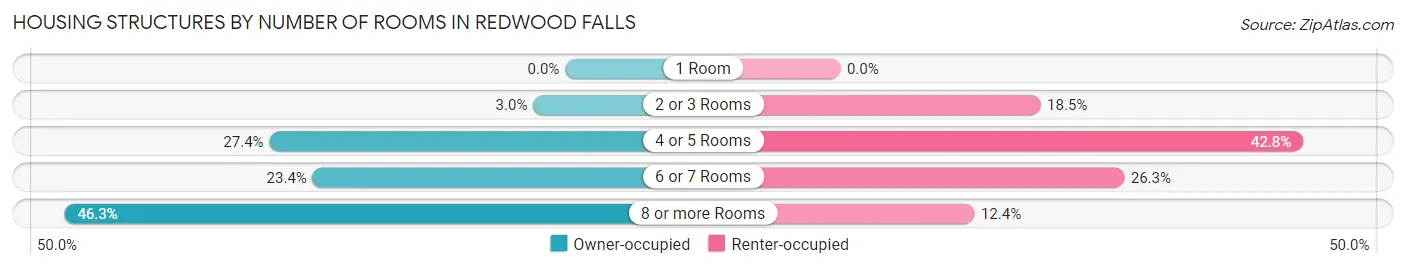
| Number of Rooms | Owner-occupied | Renter-occupied |
| 1 Room | 0 (0.0%) | 0 (0.0%) |
| 2 or 3 Rooms | 43 (3.0%) | 115 (18.5%) |
| 4 or 5 Rooms | 397 (27.4%) | 266 (42.8%) |
| 6 or 7 Rooms | 339 (23.4%) | 163 (26.3%) |
| 8 or more Rooms | 672 (46.3%) | 77 (12.4%) |
| Total | 1,451 (100.0%) | 621 (100.0%) |
Housing Structure by Heating Type in Redwood Falls
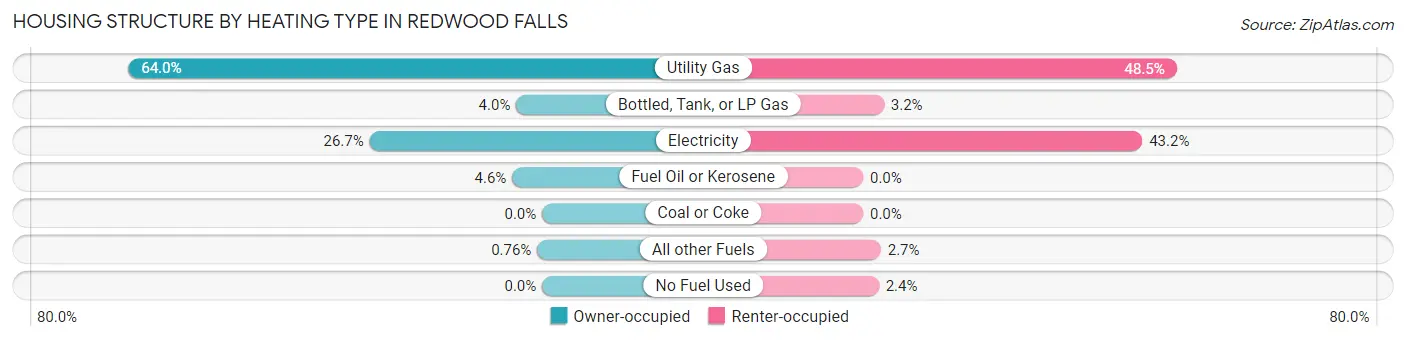
| Heating Type | Owner-occupied | Renter-occupied |
| Utility Gas | 928 (64.0%) | 301 (48.5%) |
| Bottled, Tank, or LP Gas | 58 (4.0%) | 20 (3.2%) |
| Electricity | 387 (26.7%) | 268 (43.2%) |
| Fuel Oil or Kerosene | 67 (4.6%) | 0 (0.0%) |
| Coal or Coke | 0 (0.0%) | 0 (0.0%) |
| All other Fuels | 11 (0.8%) | 17 (2.7%) |
| No Fuel Used | 0 (0.0%) | 15 (2.4%) |
| Total | 1,451 (100.0%) | 621 (100.0%) |
Household Vehicle Usage in Redwood Falls
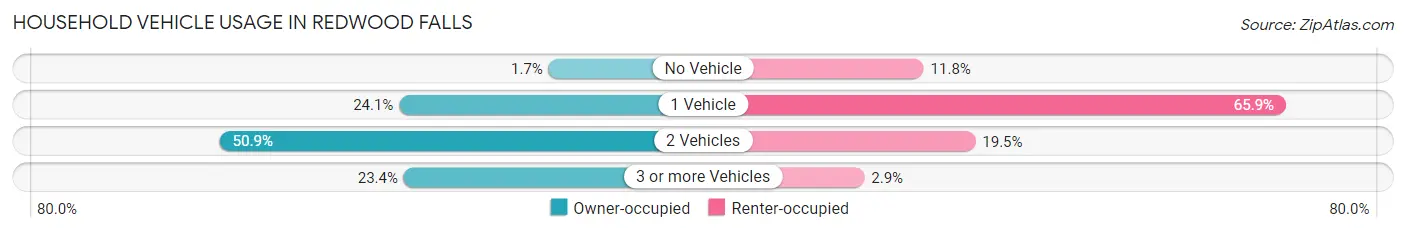
| Vehicles per Household | Owner-occupied | Renter-occupied |
| No Vehicle | 25 (1.7%) | 73 (11.8%) |
| 1 Vehicle | 349 (24.0%) | 409 (65.9%) |
| 2 Vehicles | 738 (50.9%) | 121 (19.5%) |
| 3 or more Vehicles | 339 (23.4%) | 18 (2.9%) |
| Total | 1,451 (100.0%) | 621 (100.0%) |
Real Estate & Mortgages in Redwood Falls
Real Estate and Mortgage Overview in Redwood Falls
| Characteristic | Without Mortgage | With Mortgage |
| Housing Units | 662 | 789 |
| Median Property Value | $164,400 | $151,000 |
| Median Household Income | $66,786 | $155 |
| Monthly Housing Costs | $515 | $12 |
| Real Estate Taxes | $1,703 | $34 |
Property Value by Mortgage Status in Redwood Falls
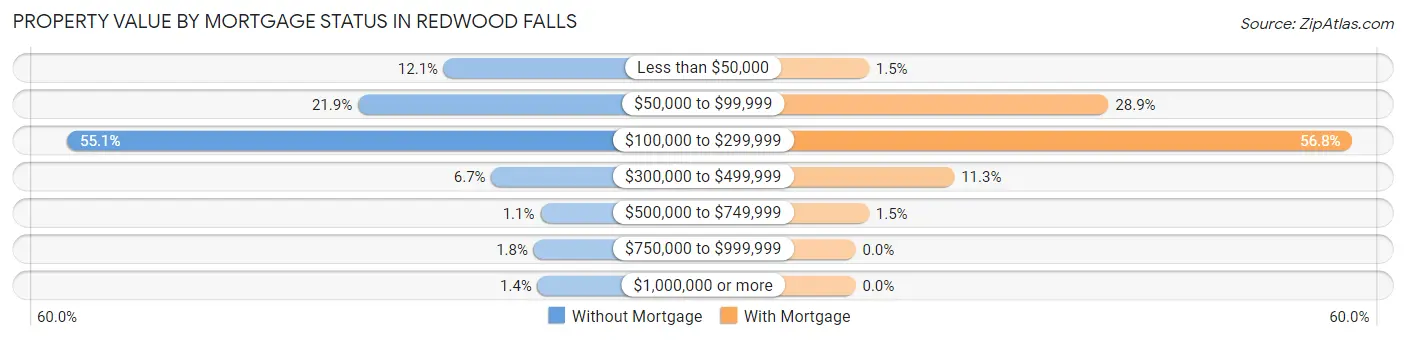
| Property Value | Without Mortgage | With Mortgage |
| Less than $50,000 | 80 (12.1%) | 12 (1.5%) |
| $50,000 to $99,999 | 145 (21.9%) | 228 (28.9%) |
| $100,000 to $299,999 | 365 (55.1%) | 448 (56.8%) |
| $300,000 to $499,999 | 44 (6.7%) | 89 (11.3%) |
| $500,000 to $749,999 | 7 (1.1%) | 12 (1.5%) |
| $750,000 to $999,999 | 12 (1.8%) | 0 (0.0%) |
| $1,000,000 or more | 9 (1.4%) | 0 (0.0%) |
| Total | 662 (100.0%) | 789 (100.0%) |
Household Income by Mortgage Status in Redwood Falls
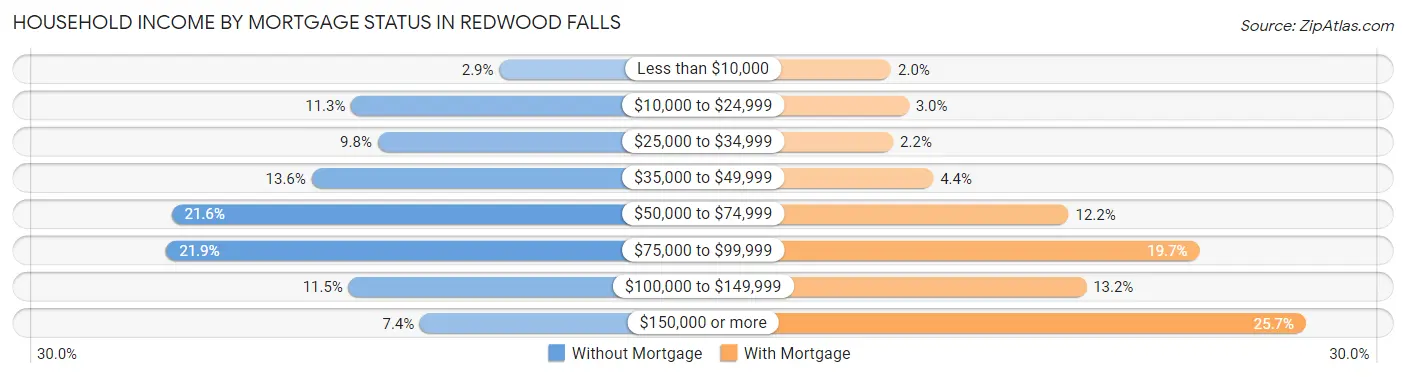
| Household Income | Without Mortgage | With Mortgage |
| Less than $10,000 | 19 (2.9%) | 16 (2.0%) |
| $10,000 to $24,999 | 75 (11.3%) | 24 (3.0%) |
| $25,000 to $34,999 | 65 (9.8%) | 17 (2.1%) |
| $35,000 to $49,999 | 90 (13.6%) | 35 (4.4%) |
| $50,000 to $74,999 | 143 (21.6%) | 96 (12.2%) |
| $75,000 to $99,999 | 145 (21.9%) | 155 (19.7%) |
| $100,000 to $149,999 | 76 (11.5%) | 104 (13.2%) |
| $150,000 or more | 49 (7.4%) | 203 (25.7%) |
| Total | 662 (100.0%) | 789 (100.0%) |
Property Value to Household Income Ratio in Redwood Falls
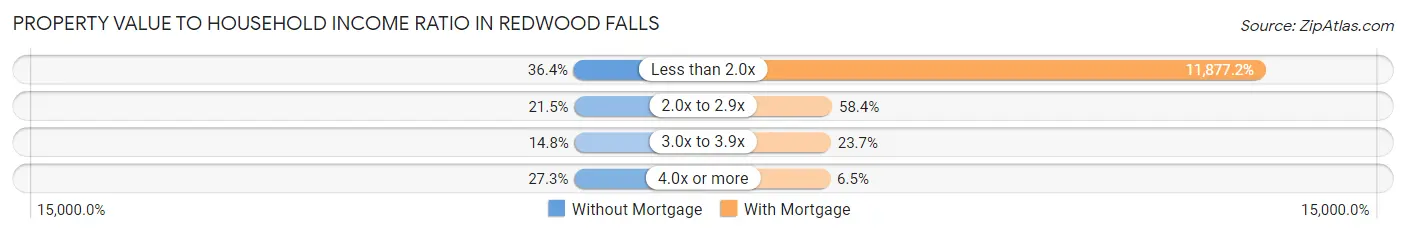
| Value-to-Income Ratio | Without Mortgage | With Mortgage |
| Less than 2.0x | 241 (36.4%) | 93,711 (11,877.2%) |
| 2.0x to 2.9x | 142 (21.4%) | 461 (58.4%) |
| 3.0x to 3.9x | 98 (14.8%) | 187 (23.7%) |
| 4.0x or more | 181 (27.3%) | 51 (6.5%) |
| Total | 662 (100.0%) | 789 (100.0%) |
Real Estate Taxes by Mortgage Status in Redwood Falls
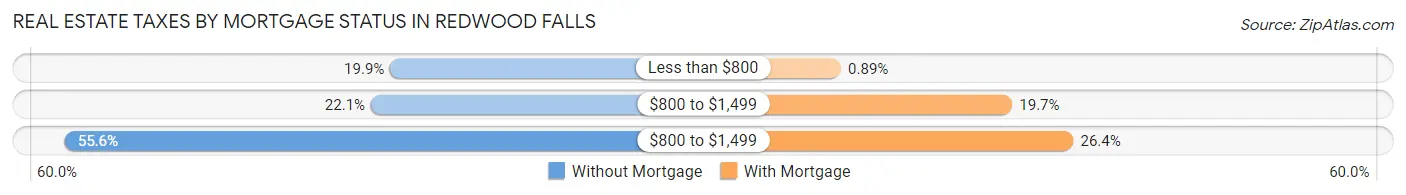
| Property Taxes | Without Mortgage | With Mortgage |
| Less than $800 | 132 (19.9%) | 7 (0.9%) |
| $800 to $1,499 | 146 (22.1%) | 155 (19.7%) |
| $800 to $1,499 | 368 (55.6%) | 208 (26.4%) |
| Total | 662 (100.0%) | 789 (100.0%) |
Health & Disability in Redwood Falls
Health Insurance Coverage by Age in Redwood Falls
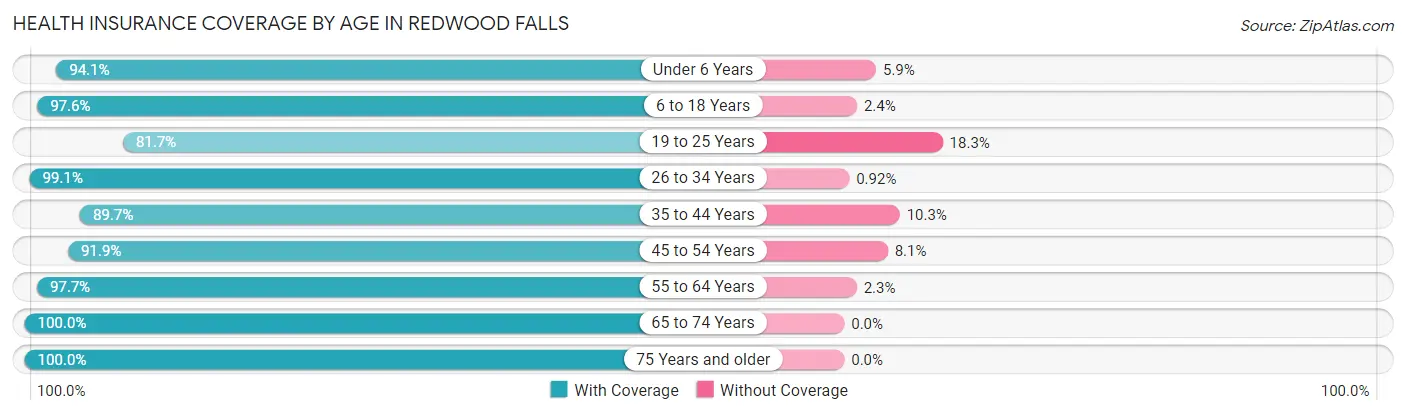
| Age Bracket | With Coverage | Without Coverage |
| Under 6 Years | 318 (94.1%) | 20 (5.9%) |
| 6 to 18 Years | 826 (97.6%) | 20 (2.4%) |
| 19 to 25 Years | 365 (81.7%) | 82 (18.3%) |
| 26 to 34 Years | 539 (99.1%) | 5 (0.9%) |
| 35 to 44 Years | 460 (89.7%) | 53 (10.3%) |
| 45 to 54 Years | 522 (91.9%) | 46 (8.1%) |
| 55 to 64 Years | 549 (97.7%) | 13 (2.3%) |
| 65 to 74 Years | 667 (100.0%) | 0 (0.0%) |
| 75 Years and older | 498 (100.0%) | 0 (0.0%) |
| Total | 4,744 (95.2%) | 239 (4.8%) |
Health Insurance Coverage by Citizenship Status in Redwood Falls
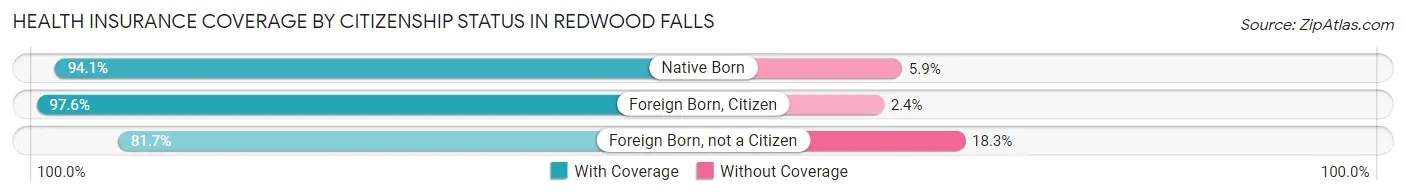
| Citizenship Status | With Coverage | Without Coverage |
| Native Born | 318 (94.1%) | 20 (5.9%) |
| Foreign Born, Citizen | 826 (97.6%) | 20 (2.4%) |
| Foreign Born, not a Citizen | 365 (81.7%) | 82 (18.3%) |
Health Insurance Coverage by Household Income in Redwood Falls
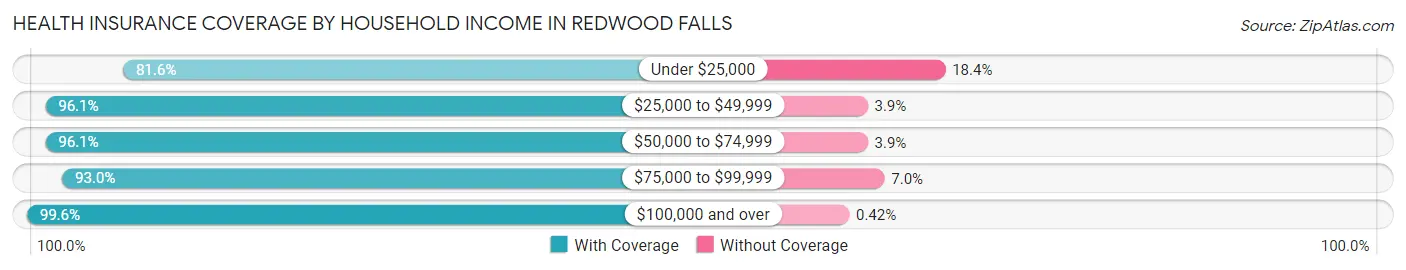
| Household Income | With Coverage | Without Coverage |
| Under $25,000 | 460 (81.6%) | 104 (18.4%) |
| $25,000 to $49,999 | 842 (96.1%) | 34 (3.9%) |
| $50,000 to $74,999 | 940 (96.1%) | 38 (3.9%) |
| $75,000 to $99,999 | 741 (93.0%) | 56 (7.0%) |
| $100,000 and over | 1,662 (99.6%) | 7 (0.4%) |
Public vs Private Health Insurance Coverage by Age in Redwood Falls
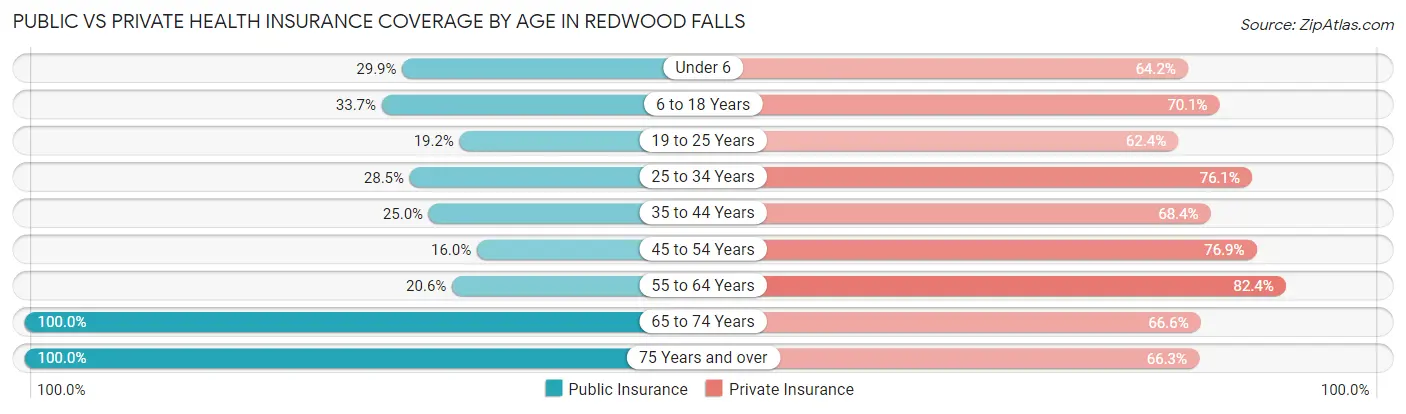
| Age Bracket | Public Insurance | Private Insurance |
| Under 6 | 101 (29.9%) | 217 (64.2%) |
| 6 to 18 Years | 285 (33.7%) | 593 (70.1%) |
| 19 to 25 Years | 86 (19.2%) | 279 (62.4%) |
| 25 to 34 Years | 155 (28.5%) | 414 (76.1%) |
| 35 to 44 Years | 128 (24.9%) | 351 (68.4%) |
| 45 to 54 Years | 91 (16.0%) | 437 (76.9%) |
| 55 to 64 Years | 116 (20.6%) | 463 (82.4%) |
| 65 to 74 Years | 667 (100.0%) | 444 (66.6%) |
| 75 Years and over | 498 (100.0%) | 330 (66.3%) |
| Total | 2,127 (42.7%) | 3,528 (70.8%) |
Disability Status by Sex by Age in Redwood Falls
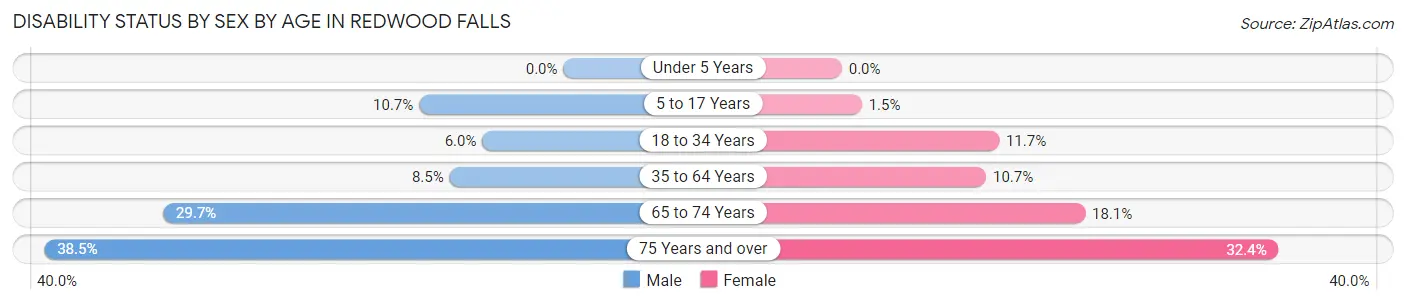
| Age Bracket | Male | Female |
| Under 5 Years | 0 (0.0%) | 0 (0.0%) |
| 5 to 17 Years | 50 (10.7%) | 6 (1.5%) |
| 18 to 34 Years | 31 (6.0%) | 60 (11.7%) |
| 35 to 64 Years | 67 (8.5%) | 91 (10.7%) |
| 65 to 74 Years | 88 (29.7%) | 67 (18.1%) |
| 75 Years and over | 79 (38.5%) | 95 (32.4%) |
Disability Class by Sex by Age in Redwood Falls
Disability Class: Hearing Difficulty
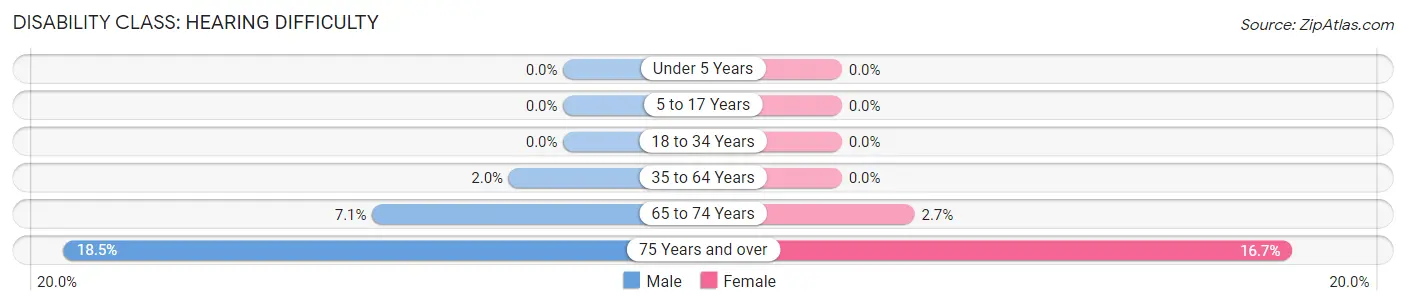
| Age Bracket | Male | Female |
| Under 5 Years | 0 (0.0%) | 0 (0.0%) |
| 5 to 17 Years | 0 (0.0%) | 0 (0.0%) |
| 18 to 34 Years | 0 (0.0%) | 0 (0.0%) |
| 35 to 64 Years | 16 (2.0%) | 0 (0.0%) |
| 65 to 74 Years | 21 (7.1%) | 10 (2.7%) |
| 75 Years and over | 38 (18.5%) | 49 (16.7%) |
Disability Class: Vision Difficulty
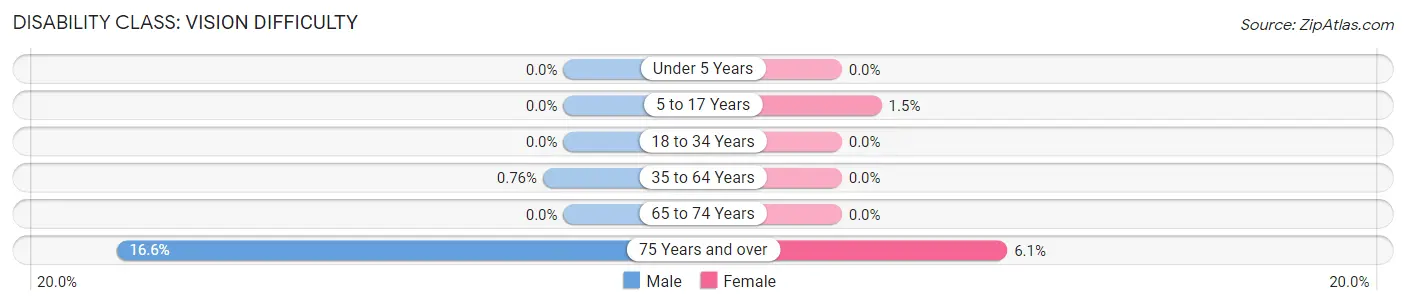
| Age Bracket | Male | Female |
| Under 5 Years | 0 (0.0%) | 0 (0.0%) |
| 5 to 17 Years | 0 (0.0%) | 6 (1.5%) |
| 18 to 34 Years | 0 (0.0%) | 0 (0.0%) |
| 35 to 64 Years | 6 (0.8%) | 0 (0.0%) |
| 65 to 74 Years | 0 (0.0%) | 0 (0.0%) |
| 75 Years and over | 34 (16.6%) | 18 (6.1%) |
Disability Class: Cognitive Difficulty
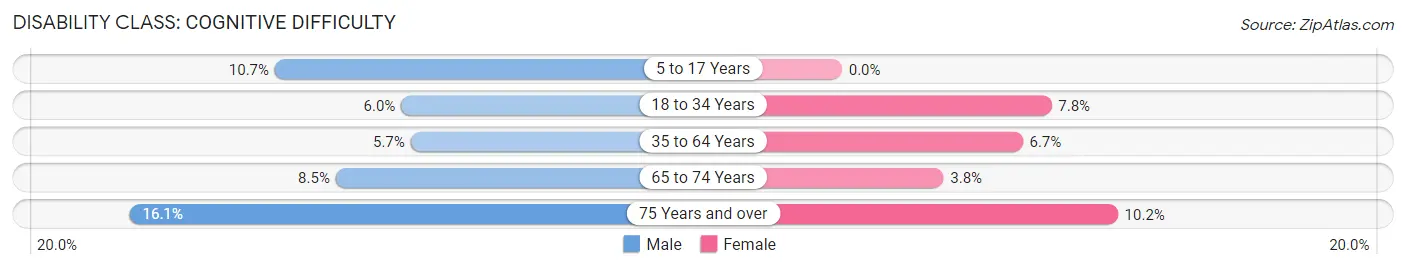
| Age Bracket | Male | Female |
| 5 to 17 Years | 50 (10.7%) | 0 (0.0%) |
| 18 to 34 Years | 31 (6.0%) | 40 (7.8%) |
| 35 to 64 Years | 45 (5.7%) | 57 (6.7%) |
| 65 to 74 Years | 25 (8.5%) | 14 (3.8%) |
| 75 Years and over | 33 (16.1%) | 30 (10.2%) |
Disability Class: Ambulatory Difficulty
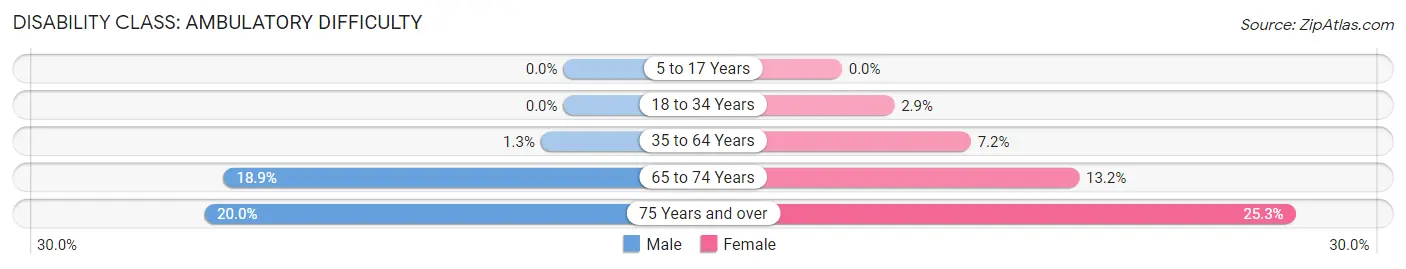
| Age Bracket | Male | Female |
| 5 to 17 Years | 0 (0.0%) | 0 (0.0%) |
| 18 to 34 Years | 0 (0.0%) | 15 (2.9%) |
| 35 to 64 Years | 10 (1.3%) | 61 (7.2%) |
| 65 to 74 Years | 56 (18.9%) | 49 (13.2%) |
| 75 Years and over | 41 (20.0%) | 74 (25.3%) |
Disability Class: Self-Care Difficulty
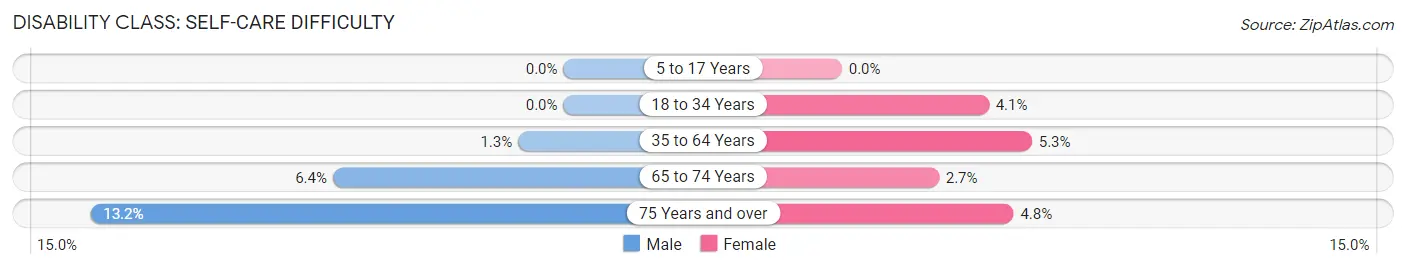
| Age Bracket | Male | Female |
| 5 to 17 Years | 0 (0.0%) | 0 (0.0%) |
| 18 to 34 Years | 0 (0.0%) | 21 (4.1%) |
| 35 to 64 Years | 10 (1.3%) | 45 (5.3%) |
| 65 to 74 Years | 19 (6.4%) | 10 (2.7%) |
| 75 Years and over | 27 (13.2%) | 14 (4.8%) |
Technology Access in Redwood Falls
Computing Device Access in Redwood Falls
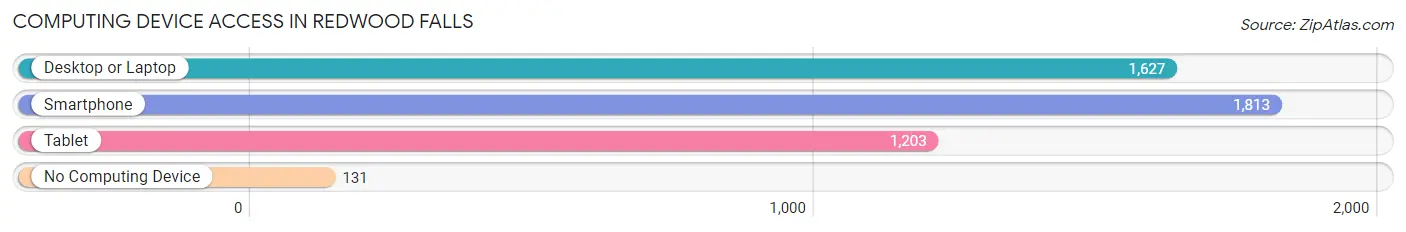
| Device Type | # Households | % Households |
| Desktop or Laptop | 1,627 | 78.5% |
| Smartphone | 1,813 | 87.5% |
| Tablet | 1,203 | 58.1% |
| No Computing Device | 131 | 6.3% |
| Total | 2,072 | 100.0% |
Internet Access in Redwood Falls
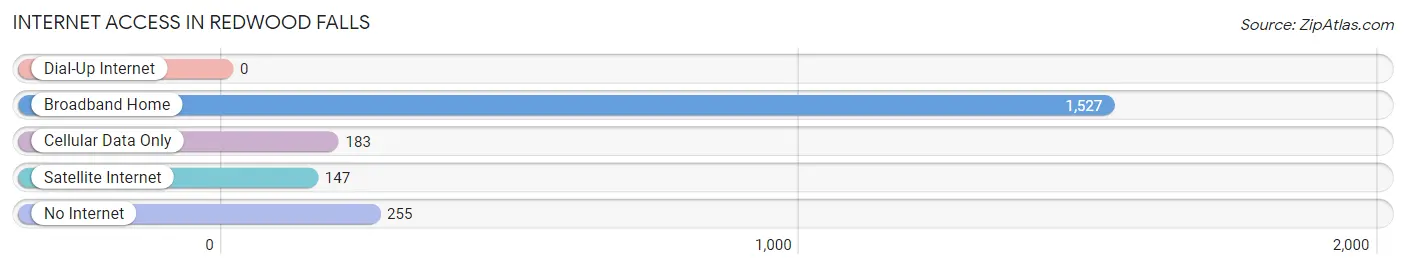
| Internet Type | # Households | % Households |
| Dial-Up Internet | 0 | 0.0% |
| Broadband Home | 1,527 | 73.7% |
| Cellular Data Only | 183 | 8.8% |
| Satellite Internet | 147 | 7.1% |
| No Internet | 255 | 12.3% |
| Total | 2,072 | 100.0% |
Redwood Falls Summary
Redwood Falls, Minnesota is a small city located in Redwood County in the southwestern part of the state. It is situated along the Minnesota River and is the county seat of Redwood County. The city has a population of 5,254 as of the 2020 census, making it the largest city in the county.
History
Redwood Falls was founded in 1868 by settlers from the Redwood River Valley. The city was named after the nearby Redwood River, which was named for the redwood trees that grew along its banks. The city was incorporated in 1872 and was the first city in the state to be incorporated under the Minnesota State Constitution.
The city was an important trading center for the area, and the first railroad line in the county was built in 1872. The railroad connected Redwood Falls to St. Paul and Minneapolis, and it was instrumental in the growth of the city.
The city was also home to a number of industries, including a flour mill, a sawmill, a brickyard, and a creamery. The city was also home to a number of churches, including the First Presbyterian Church, which was founded in 1872.
Geography
Redwood Falls is located in the southwestern part of Minnesota, in Redwood County. It is situated along the Minnesota River, and is the county seat of Redwood County. The city has a total area of 4.2 square miles, all of which is land.
The city is located in a region of rolling hills and prairies, and is surrounded by farmland. The city is located in the Redwood River Valley, and is home to a number of parks and recreational areas.
Economy
Redwood Falls is home to a number of businesses and industries, including manufacturing, retail, and healthcare. The city is home to a number of manufacturing companies, including a flour mill, a sawmill, a brickyard, and a creamery. The city is also home to a number of retail stores, including a grocery store, a hardware store, and a variety of other stores.
The city is also home to a number of healthcare facilities, including a hospital, a clinic, and a number of nursing homes. The city is also home to a number of educational institutions, including a public school district, a community college, and a technical college.
Demographics
As of the 2020 census, the population of Redwood Falls was 5,254. The city has a population that is predominantly white, with a small percentage of African Americans, Hispanics, and Asians. The median household income in the city is $45,845, and the median home value is $133,400. The city has a poverty rate of 11.3%, and the unemployment rate is 3.7%.
Redwood Falls is a small city with a rich history and a vibrant economy. The city is home to a number of businesses and industries, and is home to a number of educational institutions. The city is also home to a number of parks and recreational areas, and is a great place to live and work.
Common Questions
What is Per Capita Income in Redwood Falls?
Per Capita income in Redwood Falls is $32,061.
What is the Median Family Income in Redwood Falls?
Median Family Income in Redwood Falls is $82,011.
What is the Median Household income in Redwood Falls?
Median Household Income in Redwood Falls is $64,214.
What is Income or Wage Gap in Redwood Falls?
Income or Wage Gap in Redwood Falls is 29.6%.
Women in Redwood Falls earn 70.4 cents for every dollar earned by a man.
What is Inequality or Gini Index in Redwood Falls?
Inequality or Gini Index in Redwood Falls is 0.40.
What is the Total Population of Redwood Falls?
Total Population of Redwood Falls is 5,091.
What is the Total Male Population of Redwood Falls?
Total Male Population of Redwood Falls is 2,503.
What is the Total Female Population of Redwood Falls?
Total Female Population of Redwood Falls is 2,588.
What is the Ratio of Males per 100 Females in Redwood Falls?
There are 96.72 Males per 100 Females in Redwood Falls.
What is the Ratio of Females per 100 Males in Redwood Falls?
There are 103.40 Females per 100 Males in Redwood Falls.
What is the Median Population Age in Redwood Falls?
Median Population Age in Redwood Falls is 39.9 Years.
What is the Average Family Size in Redwood Falls
Average Family Size in Redwood Falls is 3.0 People.
What is the Average Household Size in Redwood Falls
Average Household Size in Redwood Falls is 2.4 People.
How Large is the Labor Force in Redwood Falls?
There are 2,469 People in the Labor Forcein in Redwood Falls.
What is the Percentage of People in the Labor Force in Redwood Falls?
60.1% of People are in the Labor Force in Redwood Falls.
What is the Unemployment Rate in Redwood Falls?
Unemployment Rate in Redwood Falls is 1.0%.