Wheaton, MN Map & Demographics
Wheaton Map
Wheaton Overview
$31,931
PER CAPITA INCOME
$79,333
AVG FAMILY INCOME
$49,727
AVG HOUSEHOLD INCOME
42.2%
WAGE / INCOME GAP [ % ]
57.8¢/ $1
WAGE / INCOME GAP [ $ ]
0.44
INEQUALITY / GINI INDEX
1,341
TOTAL POPULATION
610
MALE POPULATION
731
FEMALE POPULATION
83.45
MALES / 100 FEMALES
119.84
FEMALES / 100 MALES
45.2
MEDIAN AGE
3.0
AVG FAMILY SIZE
1.9
AVG HOUSEHOLD SIZE
547
LABOR FORCE [ PEOPLE ]
51.0%
PERCENT IN LABOR FORCE
3.5%
UNEMPLOYMENT RATE
Wheaton Zip Codes
Wheaton Area Codes
Income in Wheaton
Income Overview in Wheaton
Per Capita Income in Wheaton is $31,931, while median incomes of families and households are $79,333 and $49,727 respectively.
| Characteristic | Number | Measure |
| Per Capita Income | 1,341 | $31,931 |
| Median Family Income | 294 | $79,333 |
| Mean Family Income | 294 | $89,763 |
| Median Household Income | 655 | $49,727 |
| Mean Household Income | 655 | $63,293 |
| Income Deficit | 294 | $0 |
| Wage / Income Gap (%) | 1,341 | 42.19% |
| Wage / Income Gap ($) | 1,341 | 57.81¢ per $1 |
| Gini / Inequality Index | 1,341 | 0.44 |
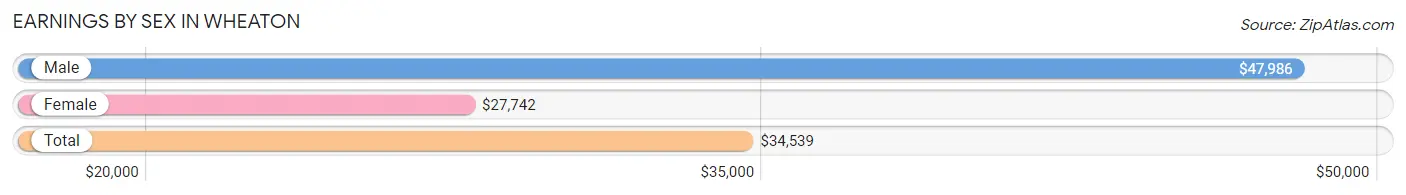
Earnings by Sex in Wheaton
Average Earnings in Wheaton are $34,539, $47,986 for men and $27,742 for women, a difference of 42.2%.
| Sex | Number | Average Earnings |
| Male | 311 (54.3%) | $47,986 |
| Female | 262 (45.7%) | $27,742 |
| Total | 573 (100.0%) | $34,539 |
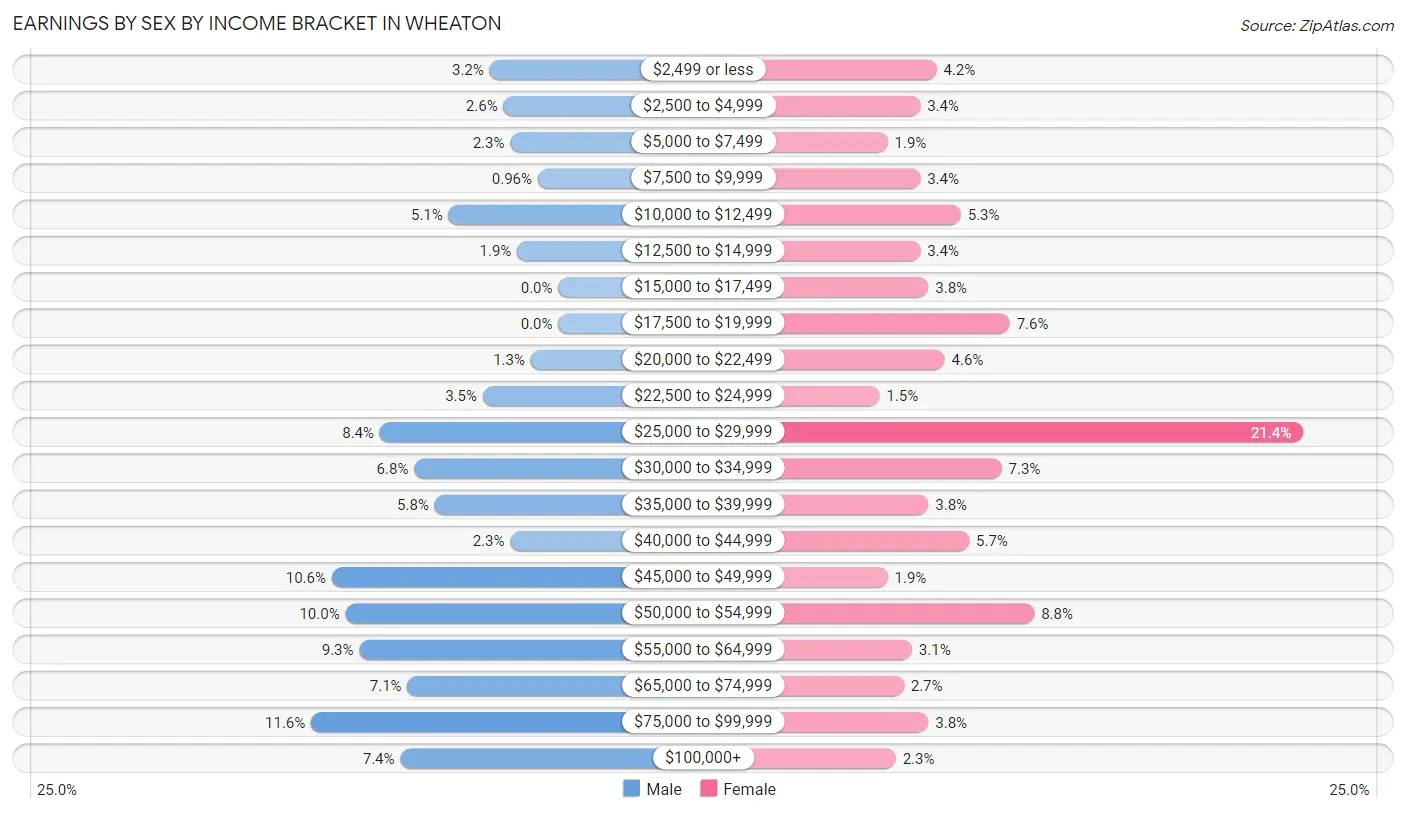
Earnings by Sex by Income Bracket in Wheaton
The most common earnings brackets in Wheaton are $75,000 to $99,999 for men (36 | 11.6%) and $25,000 to $29,999 for women (56 | 21.4%).
| Income | Male | Female |
| $2,499 or less | 10 (3.2%) | 11 (4.2%) |
| $2,500 to $4,999 | 8 (2.6%) | 9 (3.4%) |
| $5,000 to $7,499 | 7 (2.2%) | 5 (1.9%) |
| $7,500 to $9,999 | 3 (1.0%) | 9 (3.4%) |
| $10,000 to $12,499 | 16 (5.1%) | 14 (5.3%) |
| $12,500 to $14,999 | 6 (1.9%) | 9 (3.4%) |
| $15,000 to $17,499 | 0 (0.0%) | 10 (3.8%) |
| $17,500 to $19,999 | 0 (0.0%) | 20 (7.6%) |
| $20,000 to $22,499 | 4 (1.3%) | 12 (4.6%) |
| $22,500 to $24,999 | 11 (3.5%) | 4 (1.5%) |
| $25,000 to $29,999 | 26 (8.4%) | 56 (21.4%) |
| $30,000 to $34,999 | 21 (6.8%) | 19 (7.2%) |
| $35,000 to $39,999 | 18 (5.8%) | 10 (3.8%) |
| $40,000 to $44,999 | 7 (2.2%) | 15 (5.7%) |
| $45,000 to $49,999 | 33 (10.6%) | 5 (1.9%) |
| $50,000 to $54,999 | 31 (10.0%) | 23 (8.8%) |
| $55,000 to $64,999 | 29 (9.3%) | 8 (3.0%) |
| $65,000 to $74,999 | 22 (7.1%) | 7 (2.7%) |
| $75,000 to $99,999 | 36 (11.6%) | 10 (3.8%) |
| $100,000+ | 23 (7.4%) | 6 (2.3%) |
| Total | 311 (100.0%) | 262 (100.0%) |
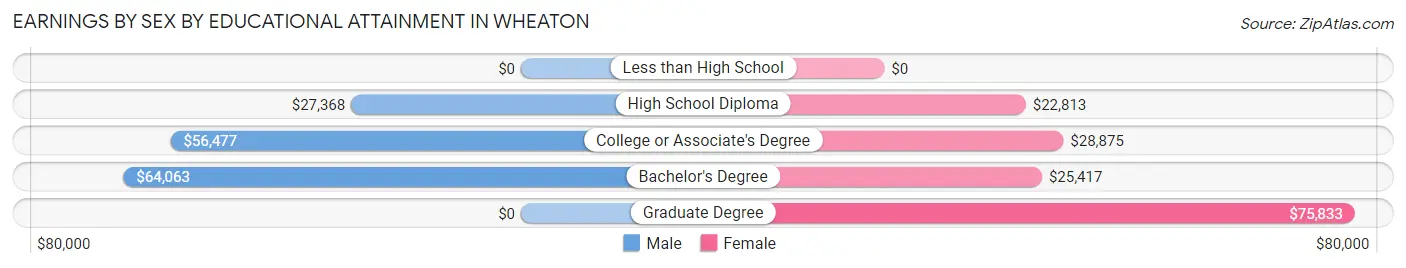
Earnings by Sex by Educational Attainment in Wheaton
Average earnings in Wheaton are $47,778 for men and $28,226 for women, a difference of 40.9%. Men with an educational attainment of bachelor's degree enjoy the highest average annual earnings of $64,063, while those with high school diploma education earn the least with $27,368. Women with an educational attainment of graduate degree earn the most with the average annual earnings of $75,833, while those with high school diploma education have the smallest earnings of $22,813.
| Educational Attainment | Male Income | Female Income |
| Less than High School | - | - |
| High School Diploma | $27,368 | $22,813 |
| College or Associate's Degree | $56,477 | $28,875 |
| Bachelor's Degree | $64,063 | $25,417 |
| Graduate Degree | - | - |
| Total | $47,778 | $28,226 |
Family Income in Wheaton
Family Income Brackets in Wheaton
According to the Wheaton family income data, there are 71 families falling into the $75,000 to $99,999 income range, which is the most common income bracket and makes up 24.1% of all families.
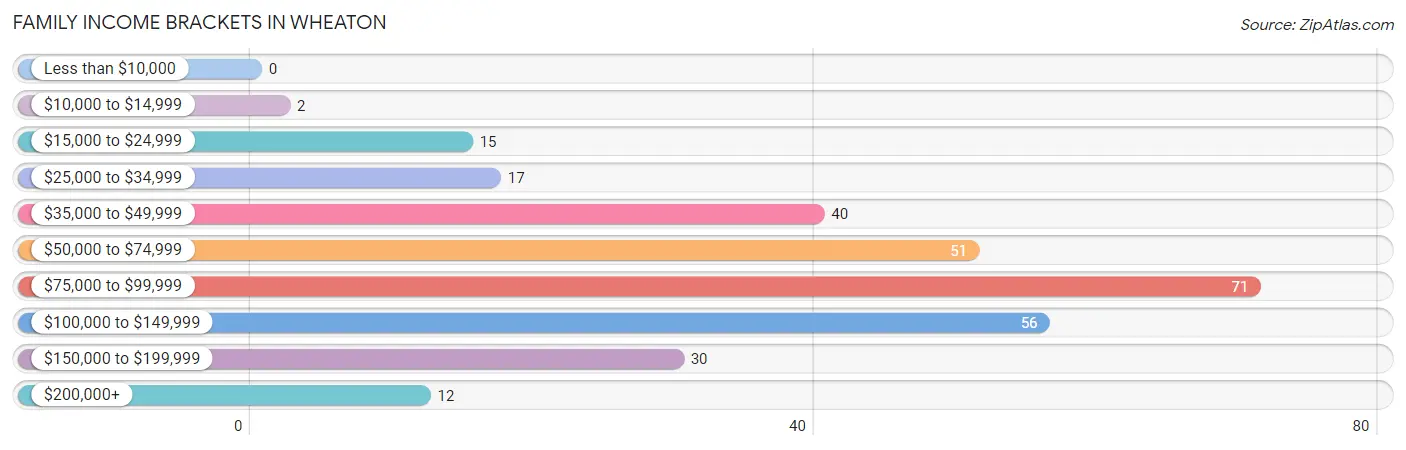
| Income Bracket | # Families | % Families |
| Less than $10,000 | 0 | 0.0% |
| $10,000 to $14,999 | 2 | 0.7% |
| $15,000 to $24,999 | 15 | 5.1% |
| $25,000 to $34,999 | 17 | 5.8% |
| $35,000 to $49,999 | 40 | 13.6% |
| $50,000 to $74,999 | 51 | 17.3% |
| $75,000 to $99,999 | 71 | 24.1% |
| $100,000 to $149,999 | 56 | 19.0% |
| $150,000 to $199,999 | 30 | 10.2% |
| $200,000+ | 12 | 4.1% |
Family Income by Famaliy Size in Wheaton
5-person families (14 | 4.8%) account for the highest median family income in Wheaton with $81,875 per family, while 2-person families (158 | 53.7%) have the highest median income of $39,886 per family member.
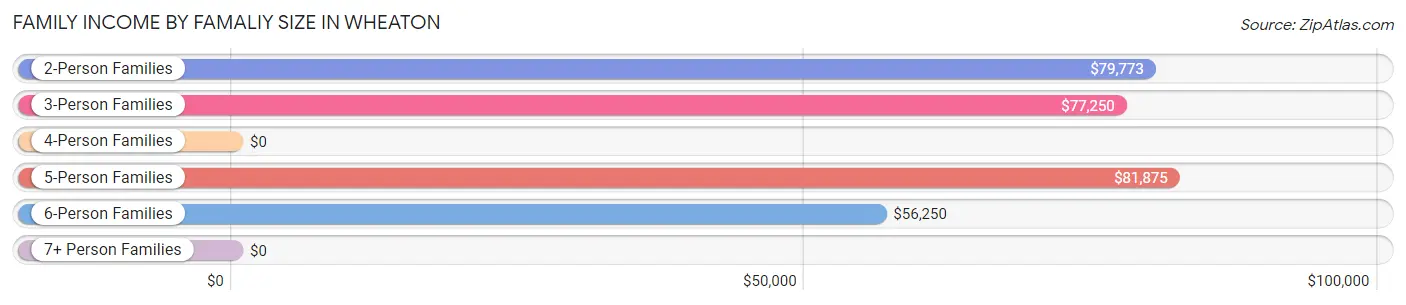
| Income Bracket | # Families | Median Income |
| 2-Person Families | 158 (53.7%) | $79,773 |
| 3-Person Families | 40 (13.6%) | $77,250 |
| 4-Person Families | 65 (22.1%) | $0 |
| 5-Person Families | 14 (4.8%) | $81,875 |
| 6-Person Families | 17 (5.8%) | $56,250 |
| 7+ Person Families | 0 (0.0%) | $0 |
| Total | 294 (100.0%) | $79,333 |
Family Income by Number of Earners in Wheaton
The median family income in Wheaton is $79,333, with families comprising 3+ earners (22) having the highest median family income of $113,750, while families with 1 earner (93) have the lowest median family income of $58,958, accounting for 7.5% and 31.6% of families, respectively.
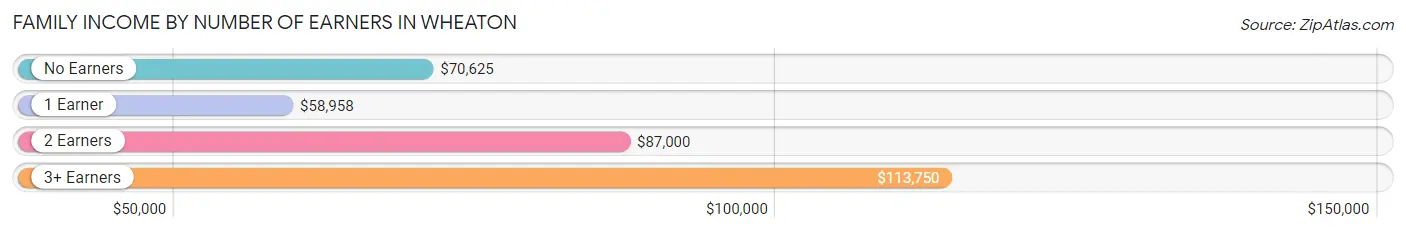
| Number of Earners | # Families | Median Income |
| No Earners | 61 (20.7%) | $70,625 |
| 1 Earner | 93 (31.6%) | $58,958 |
| 2 Earners | 118 (40.1%) | $87,000 |
| 3+ Earners | 22 (7.5%) | $113,750 |
| Total | 294 (100.0%) | $79,333 |
Household Income in Wheaton
Household Income Brackets in Wheaton
With 113 households falling in the category, the $50,000 to $74,999 income range is the most frequent in Wheaton, accounting for 17.2% of all households. In contrast, only 20 households (3.0%) fall into the $200,000+ income bracket, making it the least populous group.
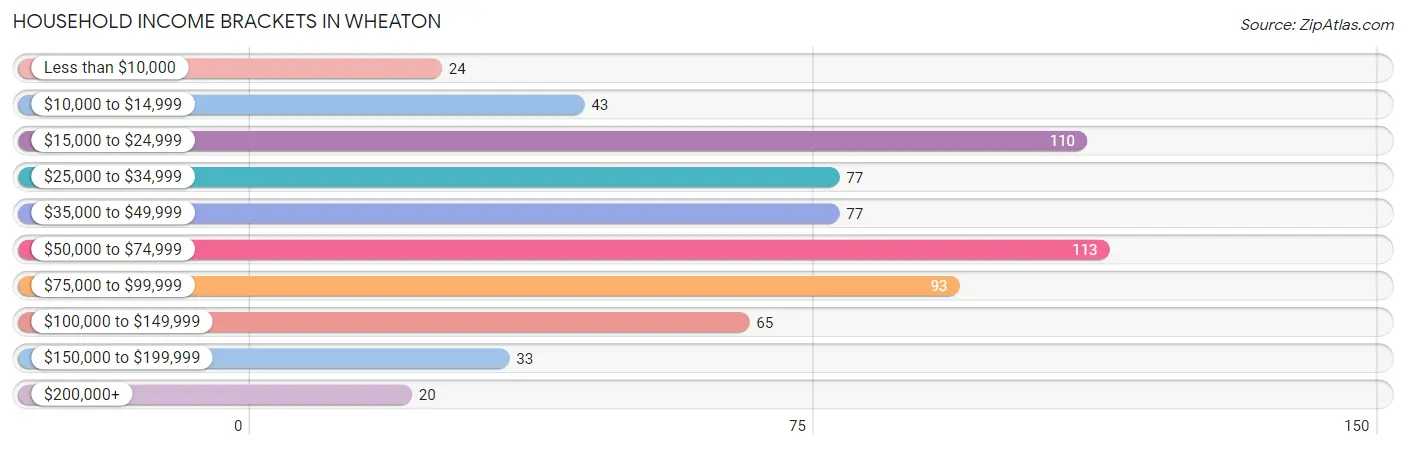
| Income Bracket | # Households | % Households |
| Less than $10,000 | 24 | 3.7% |
| $10,000 to $14,999 | 43 | 6.6% |
| $15,000 to $24,999 | 110 | 16.8% |
| $25,000 to $34,999 | 77 | 11.8% |
| $35,000 to $49,999 | 77 | 11.8% |
| $50,000 to $74,999 | 113 | 17.3% |
| $75,000 to $99,999 | 93 | 14.2% |
| $100,000 to $149,999 | 65 | 9.9% |
| $150,000 to $199,999 | 33 | 5.0% |
| $200,000+ | 20 | 3.1% |
Household Income by Householder Age in Wheaton
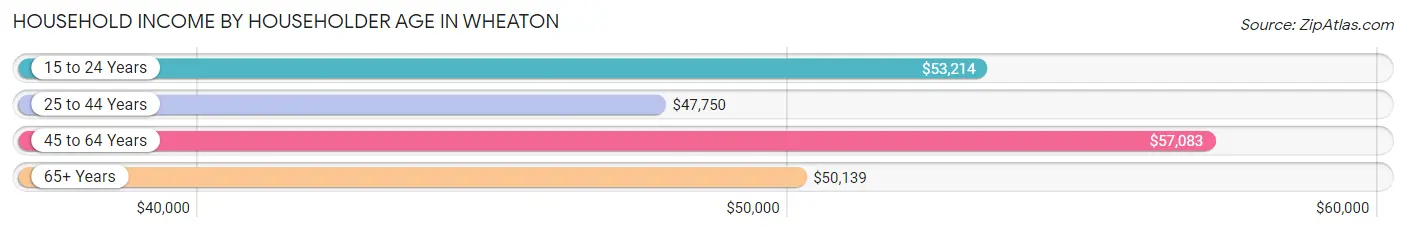
The median household income in Wheaton is $49,727, with the highest median household income of $57,083 found in the 45 to 64 years age bracket for the primary householder. A total of 142 households (21.7%) fall into this category. Meanwhile, the 25 to 44 years age bracket for the primary householder has the lowest median household income of $47,750, with 186 households (28.4%) in this group.
| Income Bracket | # Households | Median Income |
| 15 to 24 Years | 36 (5.5%) | $53,214 |
| 25 to 44 Years | 186 (28.4%) | $47,750 |
| 45 to 64 Years | 142 (21.7%) | $57,083 |
| 65+ Years | 291 (44.4%) | $50,139 |
| Total | 655 (100.0%) | $49,727 |
Poverty in Wheaton
Income Below Poverty by Sex and Age in Wheaton
With 9.8% poverty level for males and 11.6% for females among the residents of Wheaton, 18 to 24 year old males and 18 to 24 year old females are the most vulnerable to poverty, with 12 males (30.8%) and 12 females (30.0%) in their respective age groups living below the poverty level.
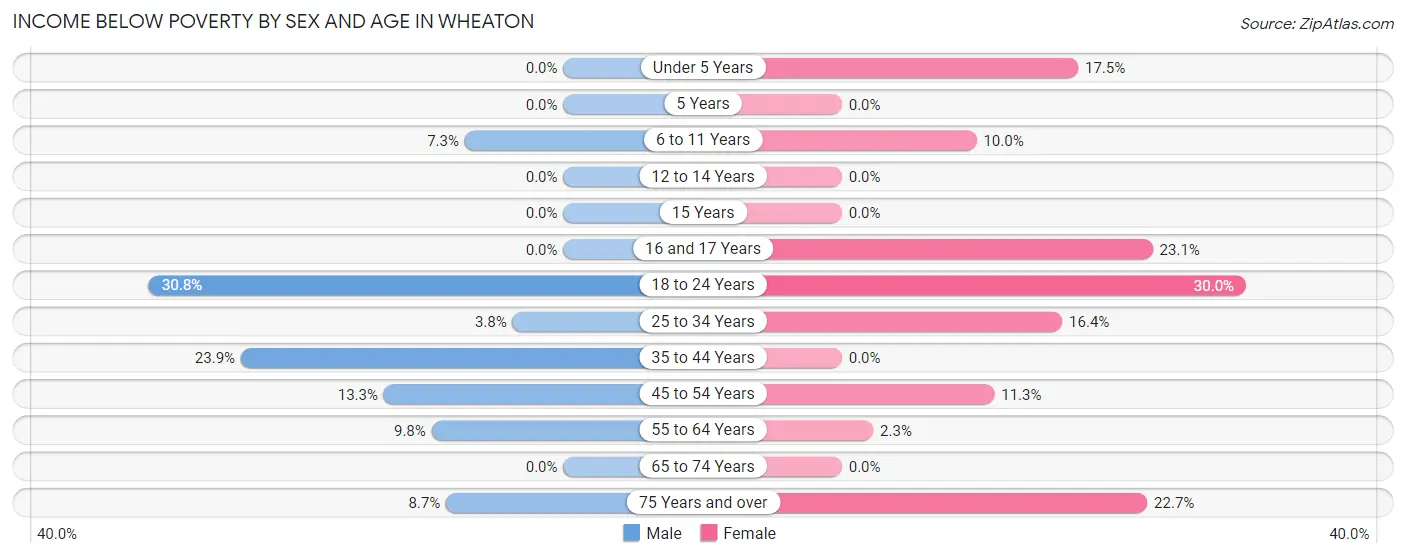
| Age Bracket | Male | Female |
| Under 5 Years | 0 (0.0%) | 10 (17.5%) |
| 5 Years | 0 (0.0%) | 0 (0.0%) |
| 6 to 11 Years | 3 (7.3%) | 6 (10.0%) |
| 12 to 14 Years | 0 (0.0%) | 0 (0.0%) |
| 15 Years | 0 (0.0%) | 0 (0.0%) |
| 16 and 17 Years | 0 (0.0%) | 3 (23.1%) |
| 18 to 24 Years | 12 (30.8%) | 12 (30.0%) |
| 25 to 34 Years | 2 (3.8%) | 9 (16.4%) |
| 35 to 44 Years | 17 (23.9%) | 0 (0.0%) |
| 45 to 54 Years | 8 (13.3%) | 6 (11.3%) |
| 55 to 64 Years | 9 (9.8%) | 1 (2.3%) |
| 65 to 74 Years | 0 (0.0%) | 0 (0.0%) |
| 75 Years and over | 6 (8.7%) | 34 (22.7%) |
| Total | 57 (9.8%) | 81 (11.6%) |
Income Above Poverty by Sex and Age in Wheaton
According to the poverty statistics in Wheaton, males aged under 5 years and females aged 5 years are the age groups that are most secure financially, with 100.0% of males and 100.0% of females in these age groups living above the poverty line.
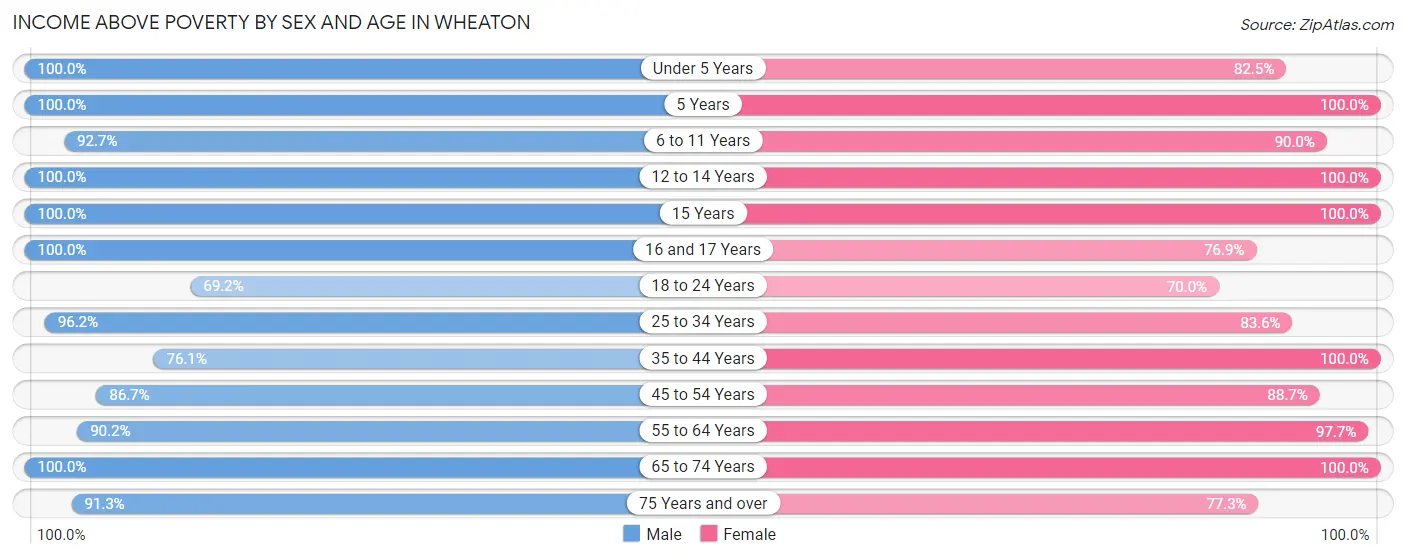
| Age Bracket | Male | Female |
| Under 5 Years | 25 (100.0%) | 47 (82.5%) |
| 5 Years | 5 (100.0%) | 5 (100.0%) |
| 6 to 11 Years | 38 (92.7%) | 54 (90.0%) |
| 12 to 14 Years | 38 (100.0%) | 19 (100.0%) |
| 15 Years | 10 (100.0%) | 9 (100.0%) |
| 16 and 17 Years | 9 (100.0%) | 10 (76.9%) |
| 18 to 24 Years | 27 (69.2%) | 28 (70.0%) |
| 25 to 34 Years | 51 (96.2%) | 46 (83.6%) |
| 35 to 44 Years | 54 (76.1%) | 106 (100.0%) |
| 45 to 54 Years | 52 (86.7%) | 47 (88.7%) |
| 55 to 64 Years | 83 (90.2%) | 42 (97.7%) |
| 65 to 74 Years | 67 (100.0%) | 89 (100.0%) |
| 75 Years and over | 63 (91.3%) | 116 (77.3%) |
| Total | 522 (90.2%) | 618 (88.4%) |
Income Below Poverty Among Married-Couple Families in Wheaton
The poverty statistics for married-couple families in Wheaton show that 2.5% or 6 of the total 243 families live below the poverty line. Families with 1 or 2 children have the highest poverty rate of 7.5%, comprising of 6 families. On the other hand, families with no children have the lowest poverty rate of 0.0%, which includes 0 families.
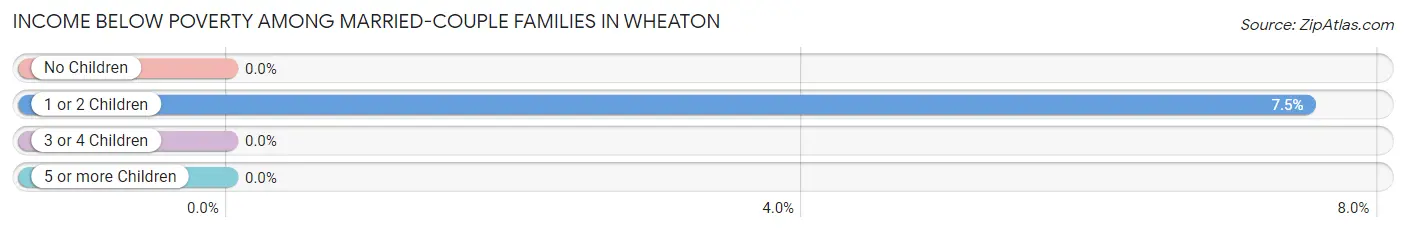
| Children | Above Poverty | Below Poverty |
| No Children | 132 (100.0%) | 0 (0.0%) |
| 1 or 2 Children | 74 (92.5%) | 6 (7.5%) |
| 3 or 4 Children | 31 (100.0%) | 0 (0.0%) |
| 5 or more Children | 0 (0.0%) | 0 (0.0%) |
| Total | 237 (97.5%) | 6 (2.5%) |
Income Below Poverty Among Single-Parent Households in Wheaton
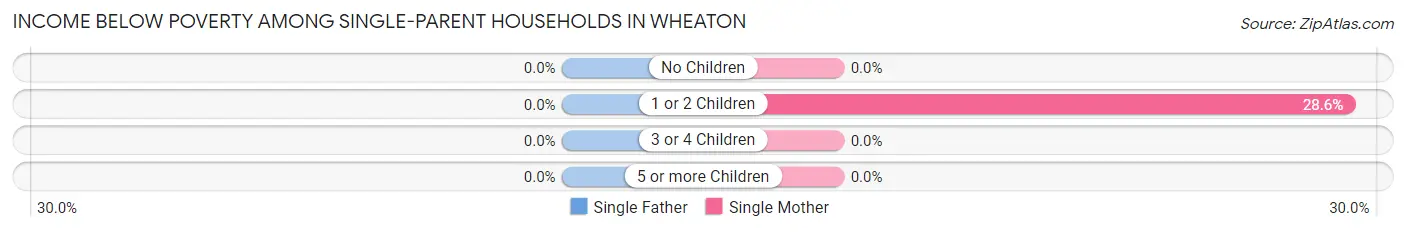
| Children | Single Father | Single Mother |
| No Children | 0 (0.0%) | 0 (0.0%) |
| 1 or 2 Children | 0 (0.0%) | 6 (28.6%) |
| 3 or 4 Children | 0 (0.0%) | 0 (0.0%) |
| 5 or more Children | 0 (0.0%) | 0 (0.0%) |
| Total | 0 (0.0%) | 6 (19.4%) |
Income Below Poverty Among Married-Couple vs Single-Parent Households in Wheaton
The poverty data for Wheaton shows that 6 of the married-couple family households (2.5%) and 6 of the single-parent households (11.8%) are living below the poverty level. Within the married-couple family households, those with 1 or 2 children have the highest poverty rate, with 6 households (7.5%) falling below the poverty line. Among the single-parent households, those with 1 or 2 children have the highest poverty rate, with 6 household (15.8%) living below poverty.
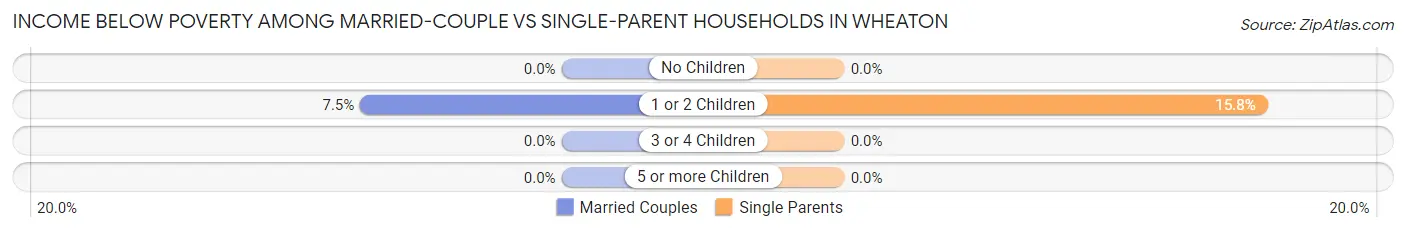
| Children | Married-Couple Families | Single-Parent Households |
| No Children | 0 (0.0%) | 0 (0.0%) |
| 1 or 2 Children | 6 (7.5%) | 6 (15.8%) |
| 3 or 4 Children | 0 (0.0%) | 0 (0.0%) |
| 5 or more Children | 0 (0.0%) | 0 (0.0%) |
| Total | 6 (2.5%) | 6 (11.8%) |
Race in Wheaton
The most populous races in Wheaton are White / Caucasian (1,225 | 91.3%), Hispanic or Latino (89 | 6.6%), and Two or more Races (58 | 4.3%).
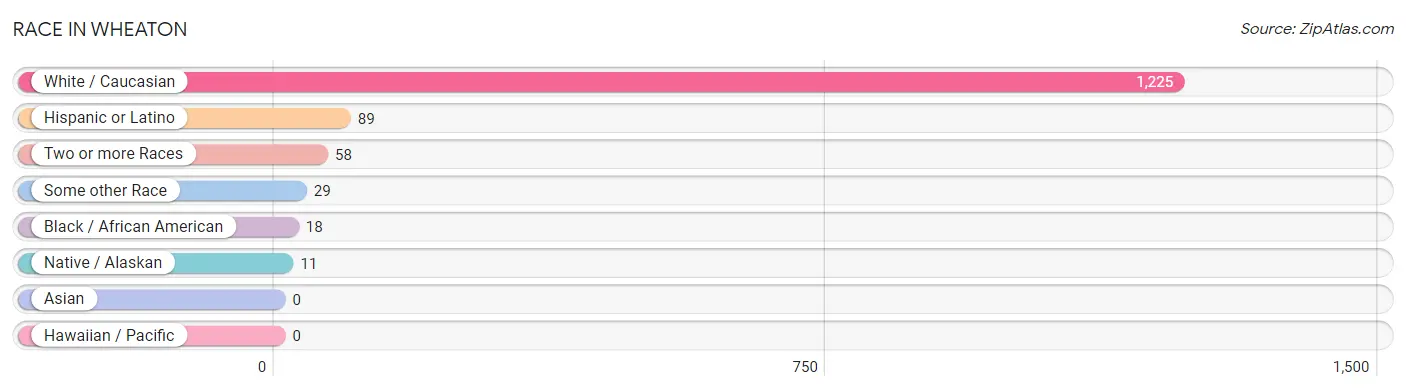
| Race | # Population | % Population |
| Asian | 0 | 0.0% |
| Black / African American | 18 | 1.3% |
| Hawaiian / Pacific | 0 | 0.0% |
| Hispanic or Latino | 89 | 6.6% |
| Native / Alaskan | 11 | 0.8% |
| White / Caucasian | 1,225 | 91.3% |
| Two or more Races | 58 | 4.3% |
| Some other Race | 29 | 2.2% |
| Total | 1,341 | 100.0% |
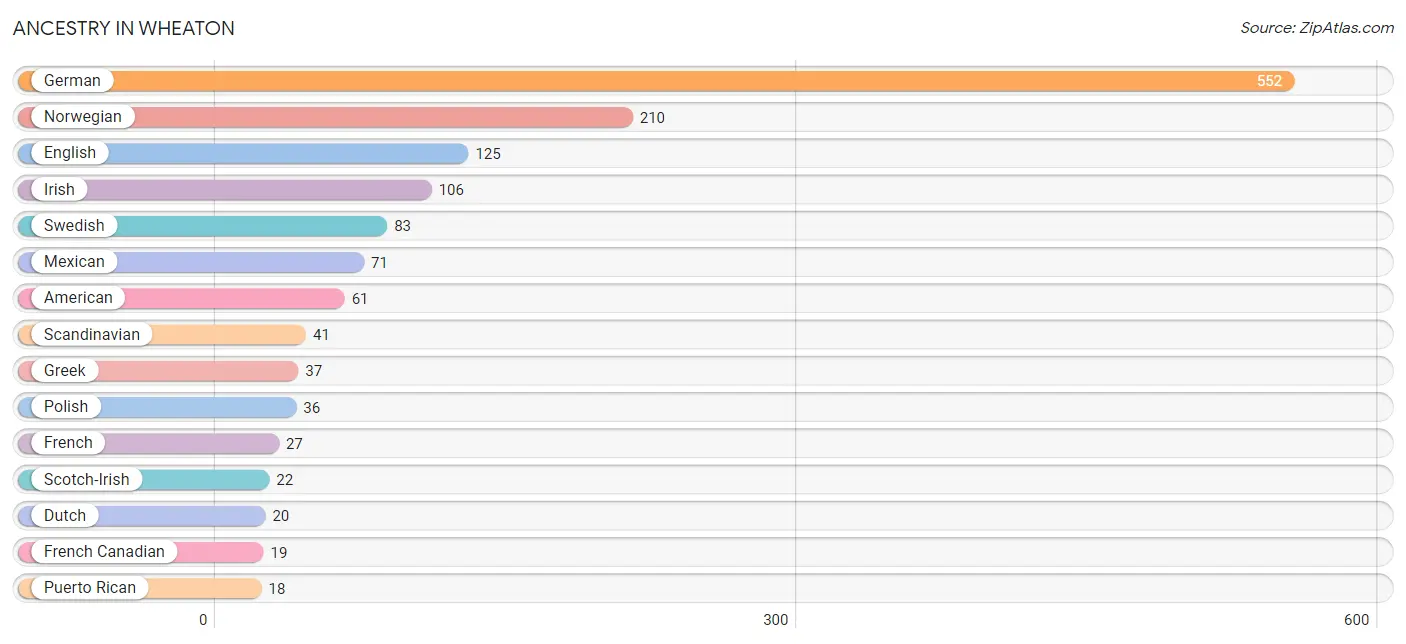
Ancestry in Wheaton
The most populous ancestries reported in Wheaton are German (552 | 41.2%), Norwegian (210 | 15.7%), English (125 | 9.3%), Irish (106 | 7.9%), and Swedish (83 | 6.2%), together accounting for 80.2% of all Wheaton residents.
| Ancestry | # Population | % Population |
| African | 8 | 0.6% |
| American | 61 | 4.5% |
| Austrian | 8 | 0.6% |
| Basque | 2 | 0.2% |
| Belgian | 3 | 0.2% |
| Bhutanese | 7 | 0.5% |
| British | 3 | 0.2% |
| Cherokee | 10 | 0.7% |
| Chippewa | 13 | 1.0% |
| Comanche | 6 | 0.4% |
| Czech | 4 | 0.3% |
| Czechoslovakian | 8 | 0.6% |
| Danish | 14 | 1.0% |
| Dutch | 20 | 1.5% |
| English | 125 | 9.3% |
| French | 27 | 2.0% |
| French Canadian | 19 | 1.4% |
| German | 552 | 41.2% |
| Greek | 37 | 2.8% |
| Indian (Asian) | 2 | 0.2% |
| Irish | 106 | 7.9% |
| Italian | 15 | 1.1% |
| Mexican | 71 | 5.3% |
| Norwegian | 210 | 15.7% |
| Polish | 36 | 2.7% |
| Portuguese | 5 | 0.4% |
| Puerto Rican | 18 | 1.3% |
| Russian | 13 | 1.0% |
| Scandinavian | 41 | 3.1% |
| Scotch-Irish | 22 | 1.6% |
| Scottish | 5 | 0.4% |
| Sioux | 7 | 0.5% |
| Sri Lankan | 2 | 0.2% |
| Subsaharan African | 8 | 0.6% |
| Swedish | 83 | 6.2% |
| Swiss | 3 | 0.2% | View All 36 Rows |
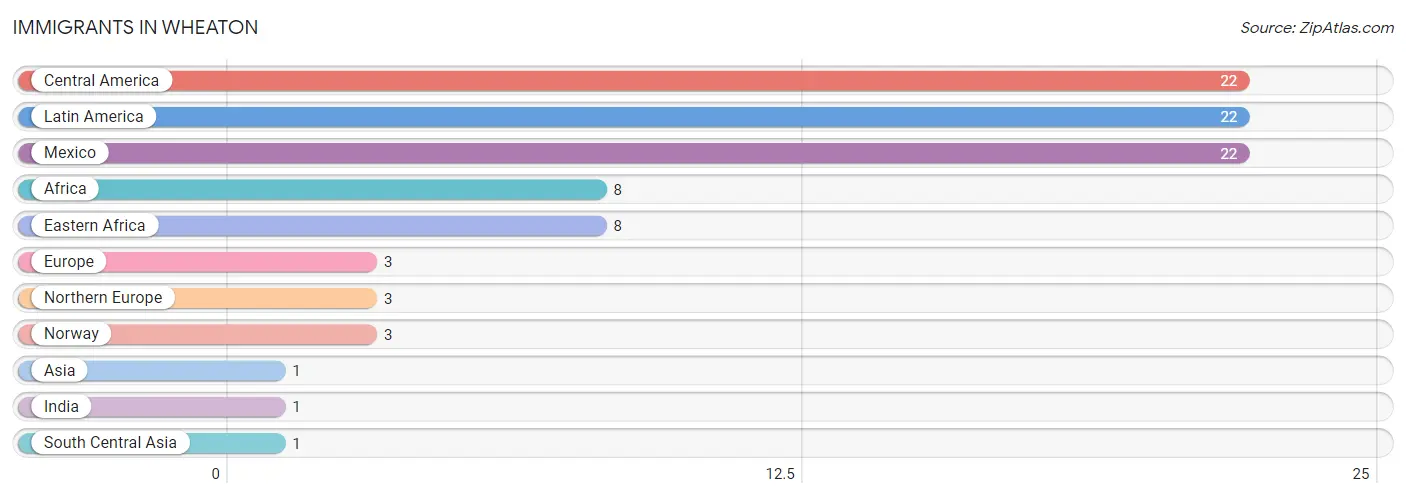
Immigrants in Wheaton
The most numerous immigrant groups reported in Wheaton came from Central America (22 | 1.6%), Latin America (22 | 1.6%), Mexico (22 | 1.6%), Africa (8 | 0.6%), and Eastern Africa (8 | 0.6%), together accounting for 6.1% of all Wheaton residents.
| Immigration Origin | # Population | % Population |
| Africa | 8 | 0.6% |
| Asia | 1 | 0.1% |
| Central America | 22 | 1.6% |
| Eastern Africa | 8 | 0.6% |
| Europe | 3 | 0.2% |
| India | 1 | 0.1% |
| Latin America | 22 | 1.6% |
| Mexico | 22 | 1.6% |
| Northern Europe | 3 | 0.2% |
| Norway | 3 | 0.2% |
| South Central Asia | 1 | 0.1% | View All 11 Rows |
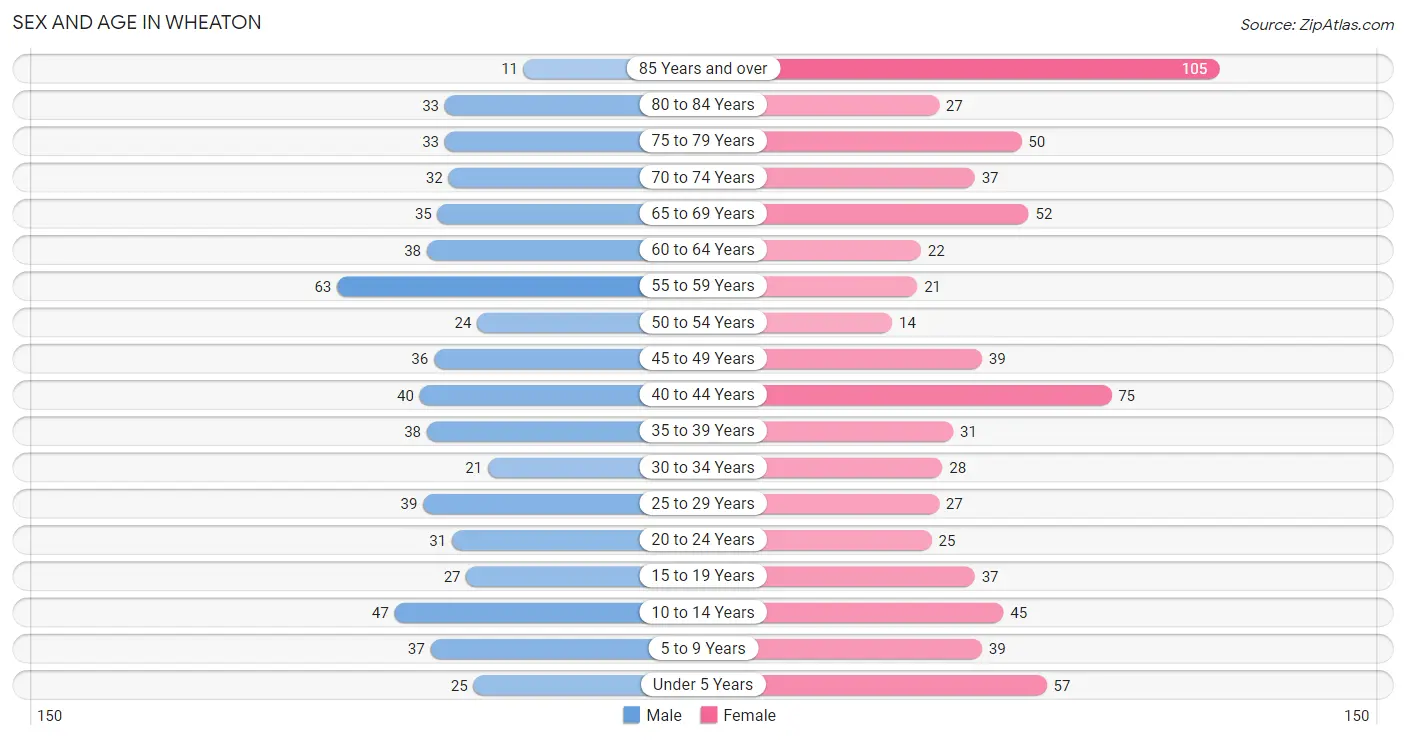
Sex and Age in Wheaton
Sex and Age in Wheaton
The most populous age groups in Wheaton are 55 to 59 Years (63 | 10.3%) for men and 85 Years and over (105 | 14.4%) for women.
| Age Bracket | Male | Female |
| Under 5 Years | 25 (4.1%) | 57 (7.8%) |
| 5 to 9 Years | 37 (6.1%) | 39 (5.3%) |
| 10 to 14 Years | 47 (7.7%) | 45 (6.2%) |
| 15 to 19 Years | 27 (4.4%) | 37 (5.1%) |
| 20 to 24 Years | 31 (5.1%) | 25 (3.4%) |
| 25 to 29 Years | 39 (6.4%) | 27 (3.7%) |
| 30 to 34 Years | 21 (3.4%) | 28 (3.8%) |
| 35 to 39 Years | 38 (6.2%) | 31 (4.2%) |
| 40 to 44 Years | 40 (6.6%) | 75 (10.3%) |
| 45 to 49 Years | 36 (5.9%) | 39 (5.3%) |
| 50 to 54 Years | 24 (3.9%) | 14 (1.9%) |
| 55 to 59 Years | 63 (10.3%) | 21 (2.9%) |
| 60 to 64 Years | 38 (6.2%) | 22 (3.0%) |
| 65 to 69 Years | 35 (5.7%) | 52 (7.1%) |
| 70 to 74 Years | 32 (5.2%) | 37 (5.1%) |
| 75 to 79 Years | 33 (5.4%) | 50 (6.8%) |
| 80 to 84 Years | 33 (5.4%) | 27 (3.7%) |
| 85 Years and over | 11 (1.8%) | 105 (14.4%) |
| Total | 610 (100.0%) | 731 (100.0%) |
Families and Households in Wheaton
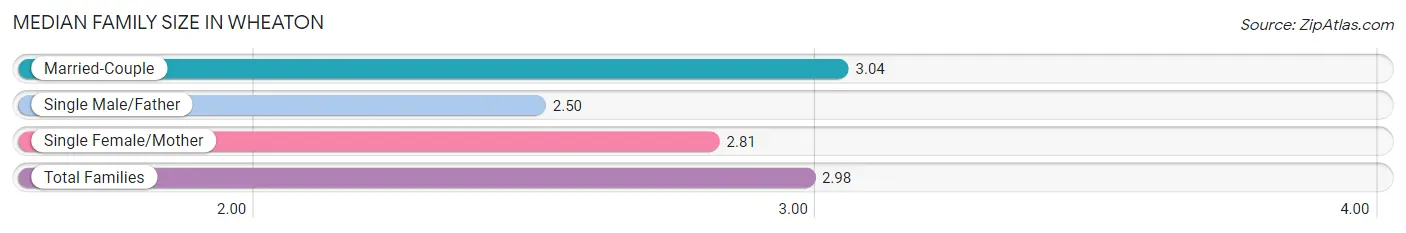
Median Family Size in Wheaton
The median family size in Wheaton is 2.98 persons per family, with married-couple families (243 | 82.7%) accounting for the largest median family size of 3.04 persons per family. On the other hand, single male/father families (20 | 6.8%) represent the smallest median family size with 2.50 persons per family.
| Family Type | # Families | Family Size |
| Married-Couple | 243 (82.7%) | 3.04 |
| Single Male/Father | 20 (6.8%) | 2.50 |
| Single Female/Mother | 31 (10.5%) | 2.81 |
| Total Families | 294 (100.0%) | 2.98 |
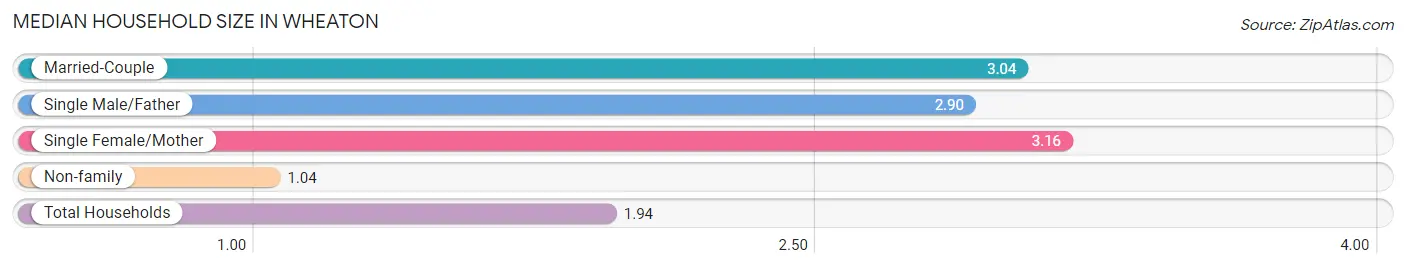
Median Household Size in Wheaton
The median household size in Wheaton is 1.94 persons per household, with single female/mother households (31 | 4.7%) accounting for the largest median household size of 3.16 persons per household. non-family households (361 | 55.1%) represent the smallest median household size with 1.04 persons per household.
| Household Type | # Households | Household Size |
| Married-Couple | 243 (37.1%) | 3.04 |
| Single Male/Father | 20 (3.0%) | 2.90 |
| Single Female/Mother | 31 (4.7%) | 3.16 |
| Non-family | 361 (55.1%) | 1.04 |
| Total Households | 655 (100.0%) | 1.94 |
Household Size by Marriage Status in Wheaton
Out of a total of 655 households in Wheaton, 294 (44.9%) are family households, while 361 (55.1%) are nonfamily households. The most numerous type of family households are 2-person households, comprising 155, and the most common type of nonfamily households are 1-person households, comprising 344.
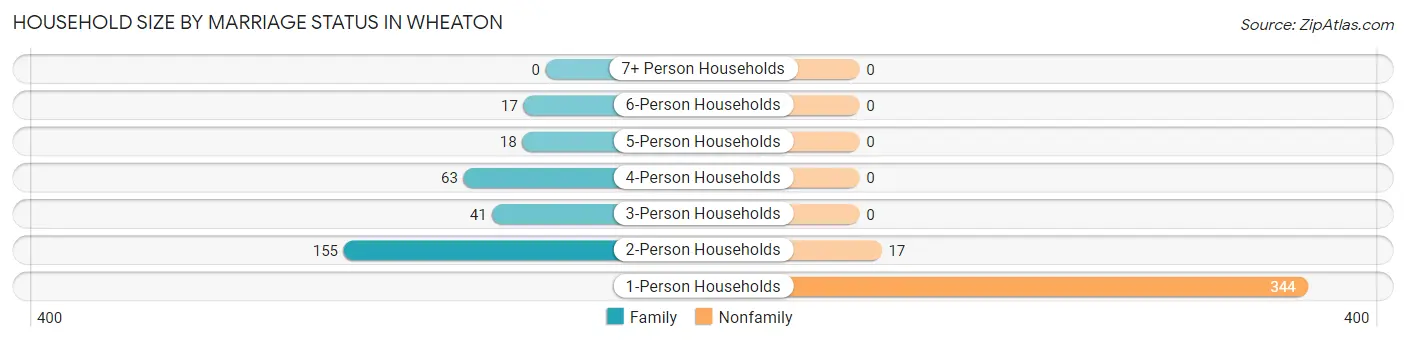
| Household Size | Family Households | Nonfamily Households |
| 1-Person Households | - | 344 (52.5%) |
| 2-Person Households | 155 (23.7%) | 17 (2.6%) |
| 3-Person Households | 41 (6.3%) | 0 (0.0%) |
| 4-Person Households | 63 (9.6%) | 0 (0.0%) |
| 5-Person Households | 18 (2.8%) | 0 (0.0%) |
| 6-Person Households | 17 (2.6%) | 0 (0.0%) |
| 7+ Person Households | 0 (0.0%) | 0 (0.0%) |
| Total | 294 (44.9%) | 361 (55.1%) |
Female Fertility in Wheaton
Fertility by Age in Wheaton
Average fertility rate in Wheaton is 78.0 births per 1,000 women. Women in the age bracket of 20 to 34 years have the highest fertility rate with 200.0 births per 1,000 women. Women in the age bracket of 20 to 34 years acount for 76.2% of all women with births.
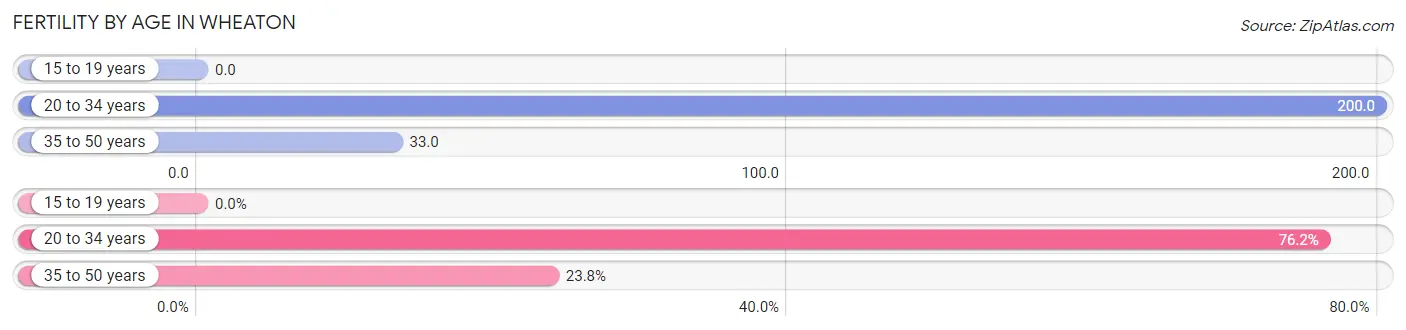
| Age Bracket | Women with Births | Births / 1,000 Women |
| 15 to 19 years | 0 (0.0%) | 0.0 |
| 20 to 34 years | 16 (76.2%) | 200.0 |
| 35 to 50 years | 5 (23.8%) | 33.0 |
| Total | 21 (100.0%) | 78.0 |
Fertility by Age by Marriage Status in Wheaton
52.4% of women with births (21) in Wheaton are married. The highest percentage of unmarried women with births falls into 20 to 34 years age bracket with 62.5% of them unmarried at the time of birth, while the lowest percentage of unmarried women with births belong to 35 to 50 years age bracket with 0.0% of them unmarried.
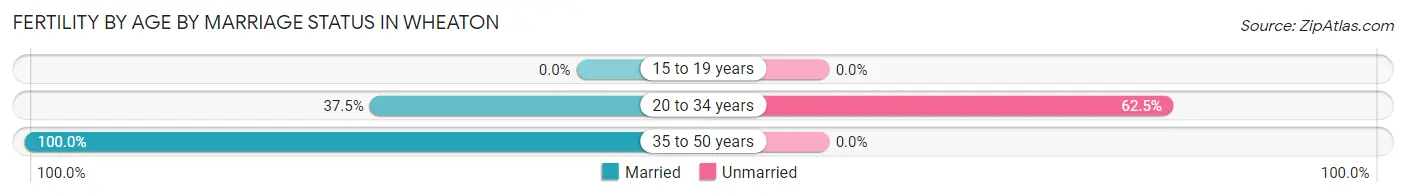
| Age Bracket | Married | Unmarried |
| 15 to 19 years | 0 (0.0%) | 0 (0.0%) |
| 20 to 34 years | 6 (37.5%) | 10 (62.5%) |
| 35 to 50 years | 5 (100.0%) | 0 (0.0%) |
| Total | 11 (52.4%) | 10 (47.6%) |
Fertility by Education in Wheaton
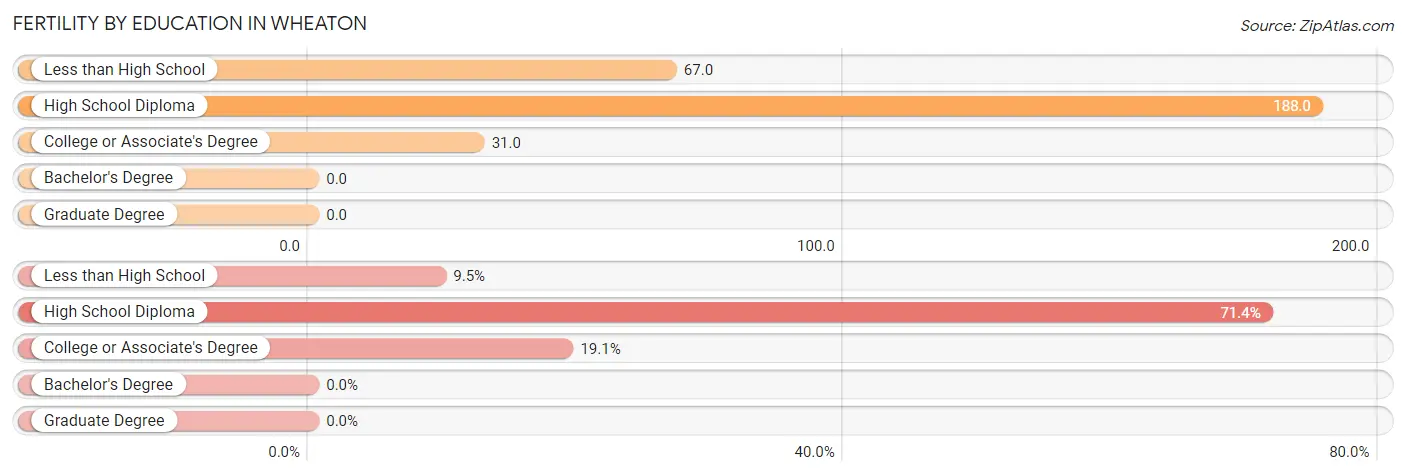
| Educational Attainment | Women with Births | Births / 1,000 Women |
| Less than High School | 2 (9.5%) | 67.0 |
| High School Diploma | 15 (71.4%) | 188.0 |
| College or Associate's Degree | 4 (19.1%) | 31.0 |
| Bachelor's Degree | 0 (0.0%) | 0.0 |
| Graduate Degree | 0 (0.0%) | 0.0 |
| Total | 21 (100.0%) | 78.0 |
Fertility by Education by Marriage Status in Wheaton
47.6% of women with births in Wheaton are unmarried. Women with the educational attainment of less than high school are most likely to be married with 100.0% of them married at childbirth, while women with the educational attainment of high school diploma are least likely to be married with 66.7% of them unmarried at childbirth.
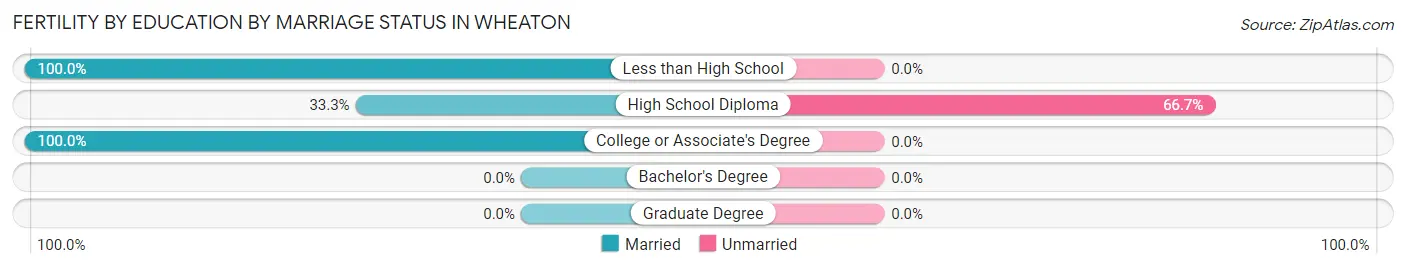
| Educational Attainment | Married | Unmarried |
| Less than High School | 2 (100.0%) | 0 (0.0%) |
| High School Diploma | 5 (33.3%) | 10 (66.7%) |
| College or Associate's Degree | 4 (100.0%) | 0 (0.0%) |
| Bachelor's Degree | 0 (0.0%) | 0 (0.0%) |
| Graduate Degree | 0 (0.0%) | 0 (0.0%) |
| Total | 11 (52.4%) | 10 (47.6%) |
Employment Characteristics in Wheaton
Employment by Class of Employer in Wheaton
Among the 506 employed individuals in Wheaton, private company employees (303 | 59.9%), local government employees (58 | 11.5%), and self-employed (not incorporated) (55 | 10.9%) make up the most common classes of employment.
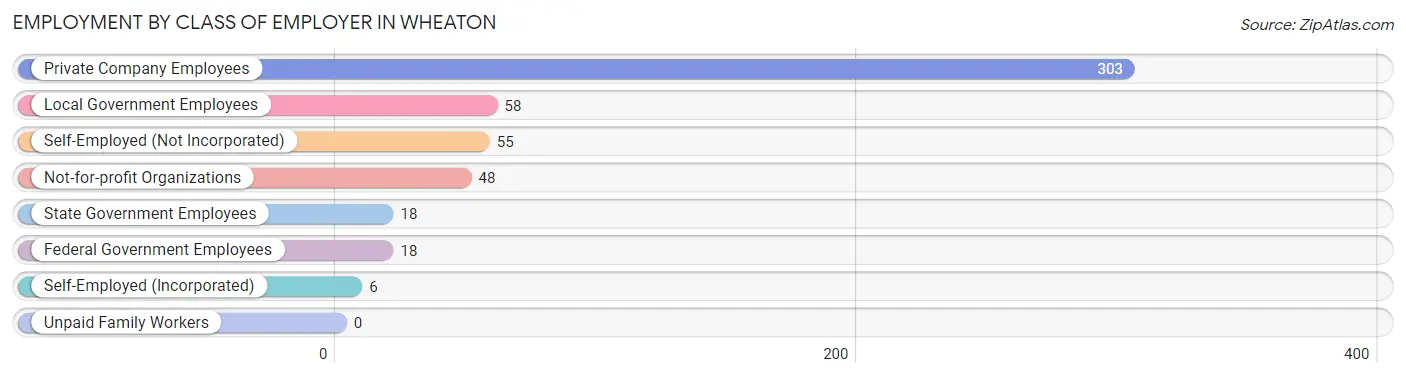
| Employer Class | # Employees | % Employees |
| Private Company Employees | 303 | 59.9% |
| Self-Employed (Incorporated) | 6 | 1.2% |
| Self-Employed (Not Incorporated) | 55 | 10.9% |
| Not-for-profit Organizations | 48 | 9.5% |
| Local Government Employees | 58 | 11.5% |
| State Government Employees | 18 | 3.6% |
| Federal Government Employees | 18 | 3.6% |
| Unpaid Family Workers | 0 | 0.0% |
| Total | 506 | 100.0% |
Employment Status by Age in Wheaton
According to the labor force statistics for Wheaton, out of the total population over 16 years of age (1,072), 51.0% or 547 individuals are in the labor force, with 3.5% or 19 of them unemployed. The age group with the highest labor force participation rate is 20 to 24 years, with 100.0% or 56 individuals in the labor force. Within the labor force, the 25 to 29 years age range has the highest percentage of unemployed individuals, with 21.0% or 13 of them being unemployed.
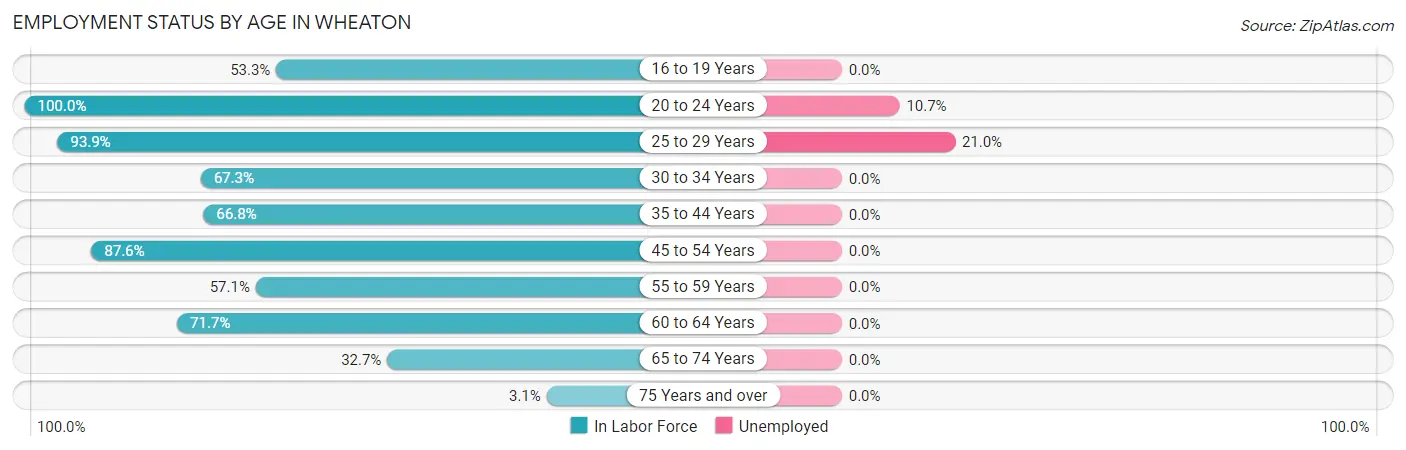
| Age Bracket | In Labor Force | Unemployed |
| 16 to 19 Years | 24 (53.3%) | 0 (0.0%) |
| 20 to 24 Years | 56 (100.0%) | 6 (10.7%) |
| 25 to 29 Years | 62 (93.9%) | 13 (21.0%) |
| 30 to 34 Years | 33 (67.3%) | 0 (0.0%) |
| 35 to 44 Years | 123 (66.8%) | 0 (0.0%) |
| 45 to 54 Years | 99 (87.6%) | 0 (0.0%) |
| 55 to 59 Years | 48 (57.1%) | 0 (0.0%) |
| 60 to 64 Years | 43 (71.7%) | 0 (0.0%) |
| 65 to 74 Years | 51 (32.7%) | 0 (0.0%) |
| 75 Years and over | 8 (3.1%) | 0 (0.0%) |
| Total | 547 (51.0%) | 19 (3.5%) |
Employment Status by Educational Attainment in Wheaton
According to labor force statistics for Wheaton, 73.4% of individuals (408) out of the total population between 25 and 64 years of age (556) are in the labor force, with 3.2% or 13 of them being unemployed. The group with the highest labor force participation rate are those with the educational attainment of bachelor's degree or higher, with 86.1% or 87 individuals in the labor force. Within the labor force, individuals with high school diploma education have the highest percentage of unemployment, with 7.5% or 10 of them being unemployed.
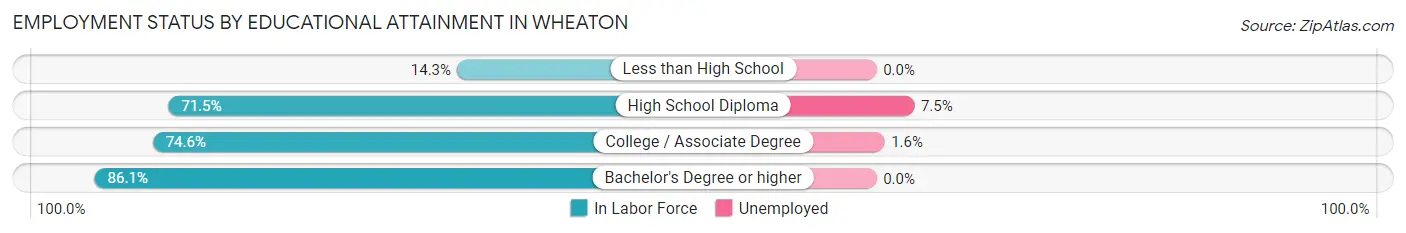
| Educational Attainment | In Labor Force | Unemployed |
| Less than High School | 3 (14.3%) | 0 (0.0%) |
| High School Diploma | 133 (71.5%) | 14 (7.5%) |
| College / Associate Degree | 185 (74.6%) | 4 (1.6%) |
| Bachelor's Degree or higher | 87 (86.1%) | 0 (0.0%) |
| Total | 408 (73.4%) | 18 (3.2%) |
Employment Occupations by Sex in Wheaton
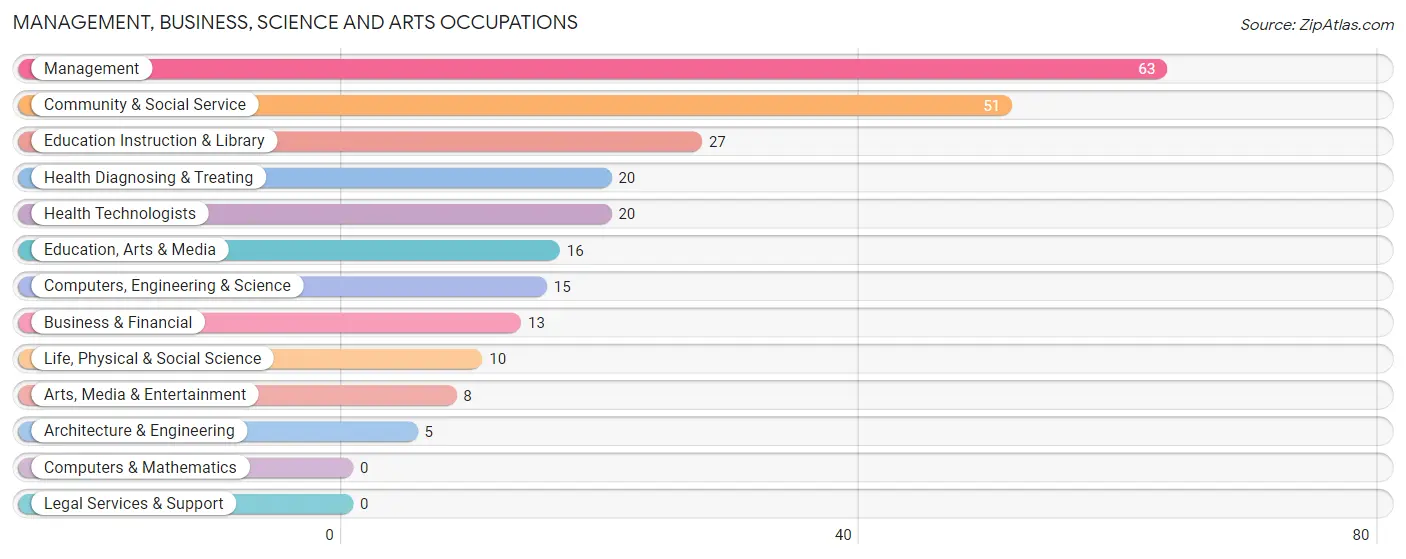
Management, Business, Science and Arts Occupations
The most common Management, Business, Science and Arts occupations in Wheaton are Management (63 | 11.9%), Community & Social Service (51 | 9.7%), Education Instruction & Library (27 | 5.1%), Health Diagnosing & Treating (20 | 3.8%), and Health Technologists (20 | 3.8%).
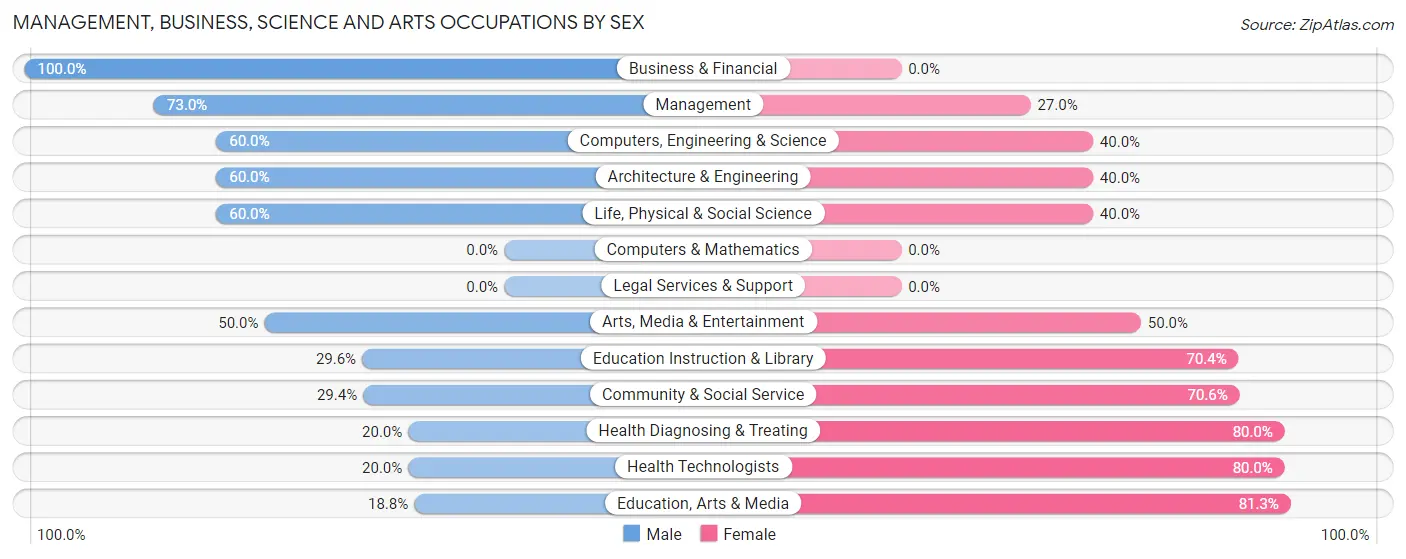
Management, Business, Science and Arts Occupations by Sex
Within the Management, Business, Science and Arts occupations in Wheaton, the most male-oriented occupations are Business & Financial (100.0%), Management (73.0%), and Computers, Engineering & Science (60.0%), while the most female-oriented occupations are Education, Arts & Media (81.2%), Health Diagnosing & Treating (80.0%), and Health Technologists (80.0%).
| Occupation | Male | Female |
| Management | 46 (73.0%) | 17 (27.0%) |
| Business & Financial | 13 (100.0%) | 0 (0.0%) |
| Computers, Engineering & Science | 9 (60.0%) | 6 (40.0%) |
| Computers & Mathematics | 0 (0.0%) | 0 (0.0%) |
| Architecture & Engineering | 3 (60.0%) | 2 (40.0%) |
| Life, Physical & Social Science | 6 (60.0%) | 4 (40.0%) |
| Community & Social Service | 15 (29.4%) | 36 (70.6%) |
| Education, Arts & Media | 3 (18.8%) | 13 (81.2%) |
| Legal Services & Support | 0 (0.0%) | 0 (0.0%) |
| Education Instruction & Library | 8 (29.6%) | 19 (70.4%) |
| Arts, Media & Entertainment | 4 (50.0%) | 4 (50.0%) |
| Health Diagnosing & Treating | 4 (20.0%) | 16 (80.0%) |
| Health Technologists | 4 (20.0%) | 16 (80.0%) |
| Total (Category) | 87 (53.7%) | 75 (46.3%) |
| Total (Overall) | 276 (52.3%) | 252 (47.7%) |
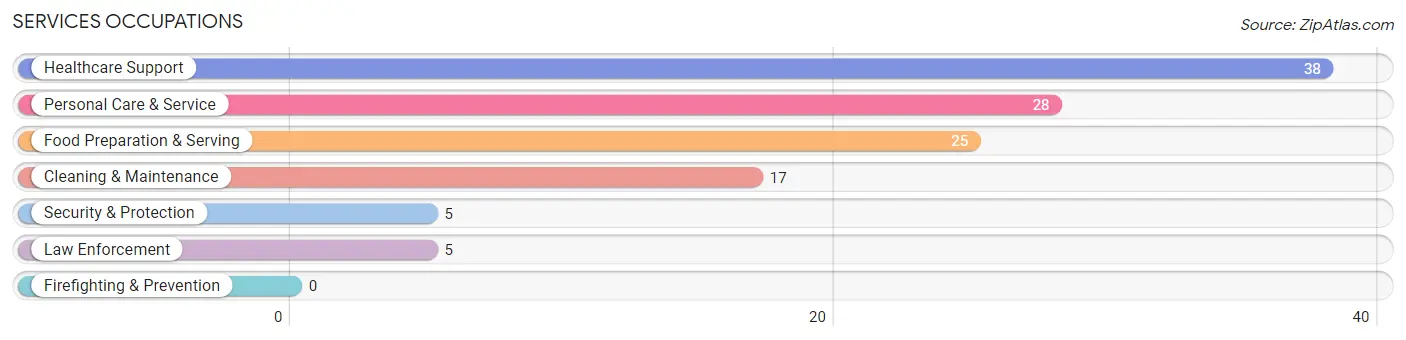
Services Occupations
The most common Services occupations in Wheaton are Healthcare Support (38 | 7.2%), Personal Care & Service (28 | 5.3%), Food Preparation & Serving (25 | 4.7%), Cleaning & Maintenance (17 | 3.2%), and Security & Protection (5 | 0.9%).
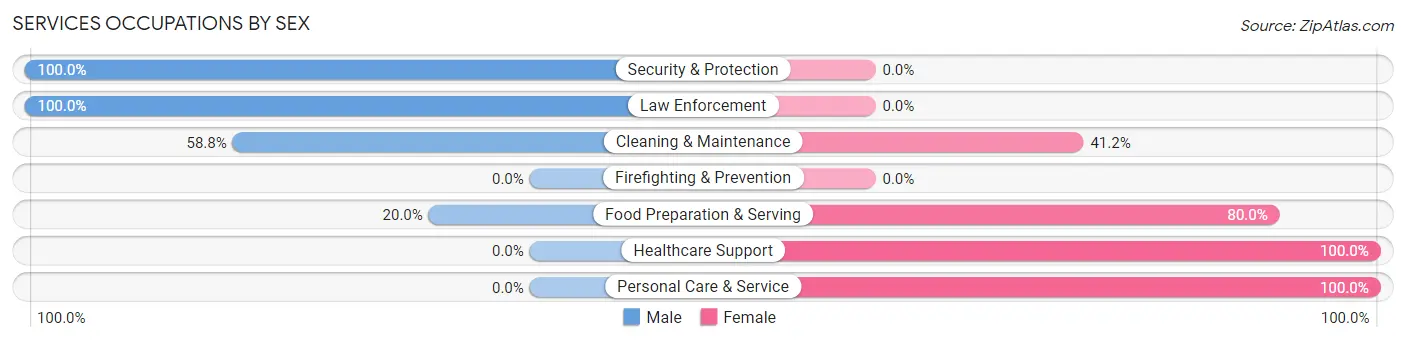
Services Occupations by Sex
Within the Services occupations in Wheaton, the most male-oriented occupations are Security & Protection (100.0%), Law Enforcement (100.0%), and Cleaning & Maintenance (58.8%), while the most female-oriented occupations are Healthcare Support (100.0%), Personal Care & Service (100.0%), and Food Preparation & Serving (80.0%).
| Occupation | Male | Female |
| Healthcare Support | 0 (0.0%) | 38 (100.0%) |
| Security & Protection | 5 (100.0%) | 0 (0.0%) |
| Firefighting & Prevention | 0 (0.0%) | 0 (0.0%) |
| Law Enforcement | 5 (100.0%) | 0 (0.0%) |
| Food Preparation & Serving | 5 (20.0%) | 20 (80.0%) |
| Cleaning & Maintenance | 10 (58.8%) | 7 (41.2%) |
| Personal Care & Service | 0 (0.0%) | 28 (100.0%) |
| Total (Category) | 20 (17.7%) | 93 (82.3%) |
| Total (Overall) | 276 (52.3%) | 252 (47.7%) |
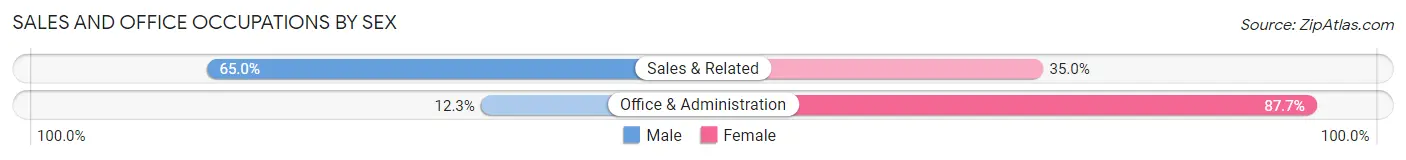
Sales and Office Occupations
The most common Sales and Office occupations in Wheaton are Office & Administration (65 | 12.3%), and Sales & Related (60 | 11.4%).

Sales and Office Occupations by Sex
| Occupation | Male | Female |
| Sales & Related | 39 (65.0%) | 21 (35.0%) |
| Office & Administration | 8 (12.3%) | 57 (87.7%) |
| Total (Category) | 47 (37.6%) | 78 (62.4%) |
| Total (Overall) | 276 (52.3%) | 252 (47.7%) |
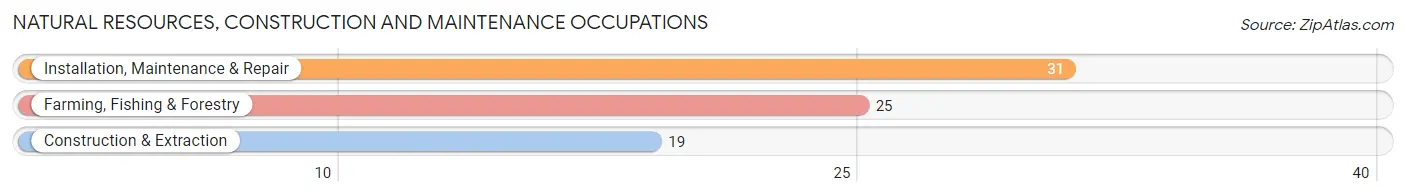
Natural Resources, Construction and Maintenance Occupations
The most common Natural Resources, Construction and Maintenance occupations in Wheaton are Installation, Maintenance & Repair (31 | 5.9%), Farming, Fishing & Forestry (25 | 4.7%), and Construction & Extraction (19 | 3.6%).
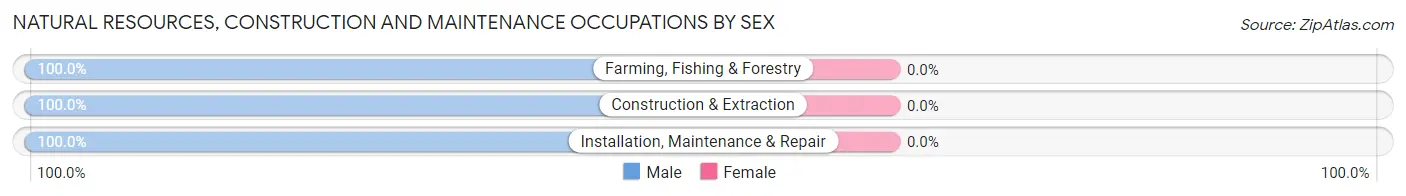
Natural Resources, Construction and Maintenance Occupations by Sex
| Occupation | Male | Female |
| Farming, Fishing & Forestry | 25 (100.0%) | 0 (0.0%) |
| Construction & Extraction | 19 (100.0%) | 0 (0.0%) |
| Installation, Maintenance & Repair | 31 (100.0%) | 0 (0.0%) |
| Total (Category) | 75 (100.0%) | 0 (0.0%) |
| Total (Overall) | 276 (52.3%) | 252 (47.7%) |
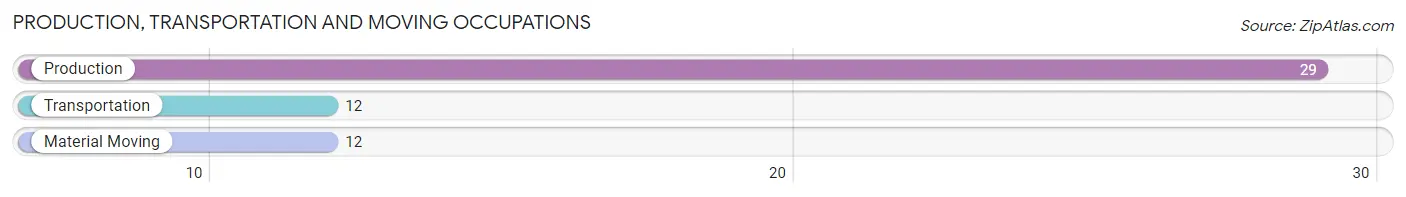
Production, Transportation and Moving Occupations
The most common Production, Transportation and Moving occupations in Wheaton are Production (29 | 5.5%), Transportation (12 | 2.3%), and Material Moving (12 | 2.3%).
Production, Transportation and Moving Occupations by Sex
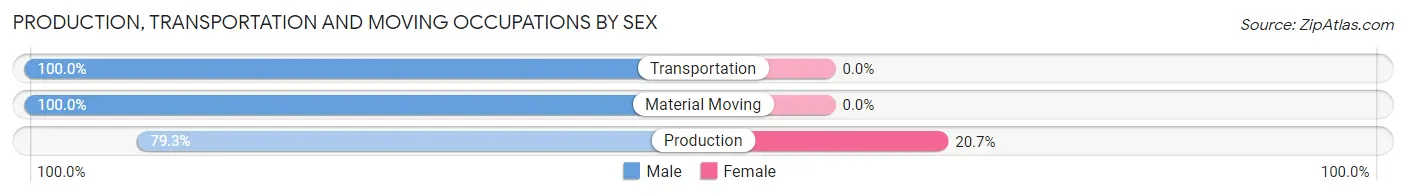
| Occupation | Male | Female |
| Production | 23 (79.3%) | 6 (20.7%) |
| Transportation | 12 (100.0%) | 0 (0.0%) |
| Material Moving | 12 (100.0%) | 0 (0.0%) |
| Total (Category) | 47 (88.7%) | 6 (11.3%) |
| Total (Overall) | 276 (52.3%) | 252 (47.7%) |
Employment Industries by Sex in Wheaton
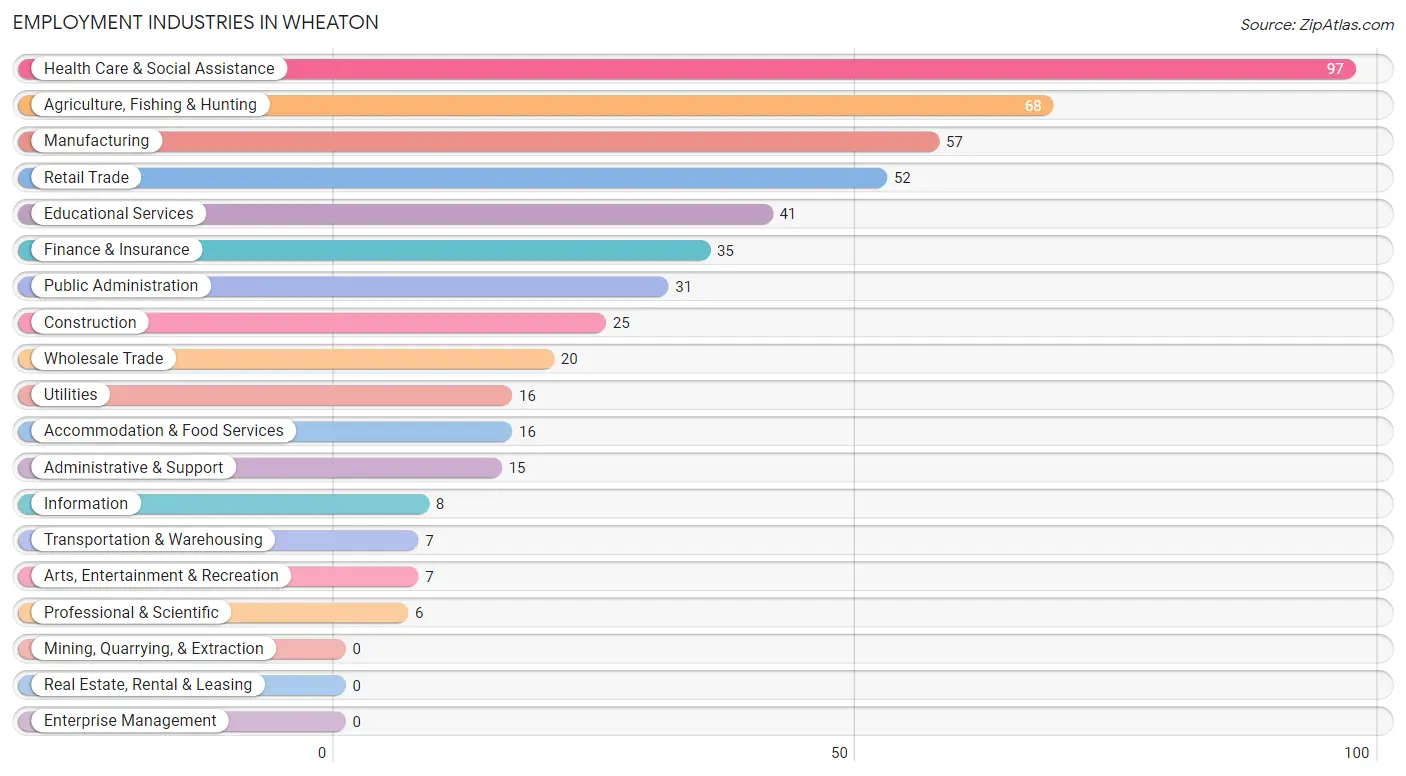
Employment Industries in Wheaton
The major employment industries in Wheaton include Health Care & Social Assistance (97 | 18.4%), Agriculture, Fishing & Hunting (68 | 12.9%), Manufacturing (57 | 10.8%), Retail Trade (52 | 9.9%), and Educational Services (41 | 7.8%).
Employment Industries by Sex in Wheaton
The Wheaton industries that see more men than women are Wholesale Trade (100.0%), Transportation & Warehousing (100.0%), and Utilities (100.0%), whereas the industries that tend to have a higher number of women are Arts, Entertainment & Recreation (100.0%), Accommodation & Food Services (100.0%), and Health Care & Social Assistance (83.5%).
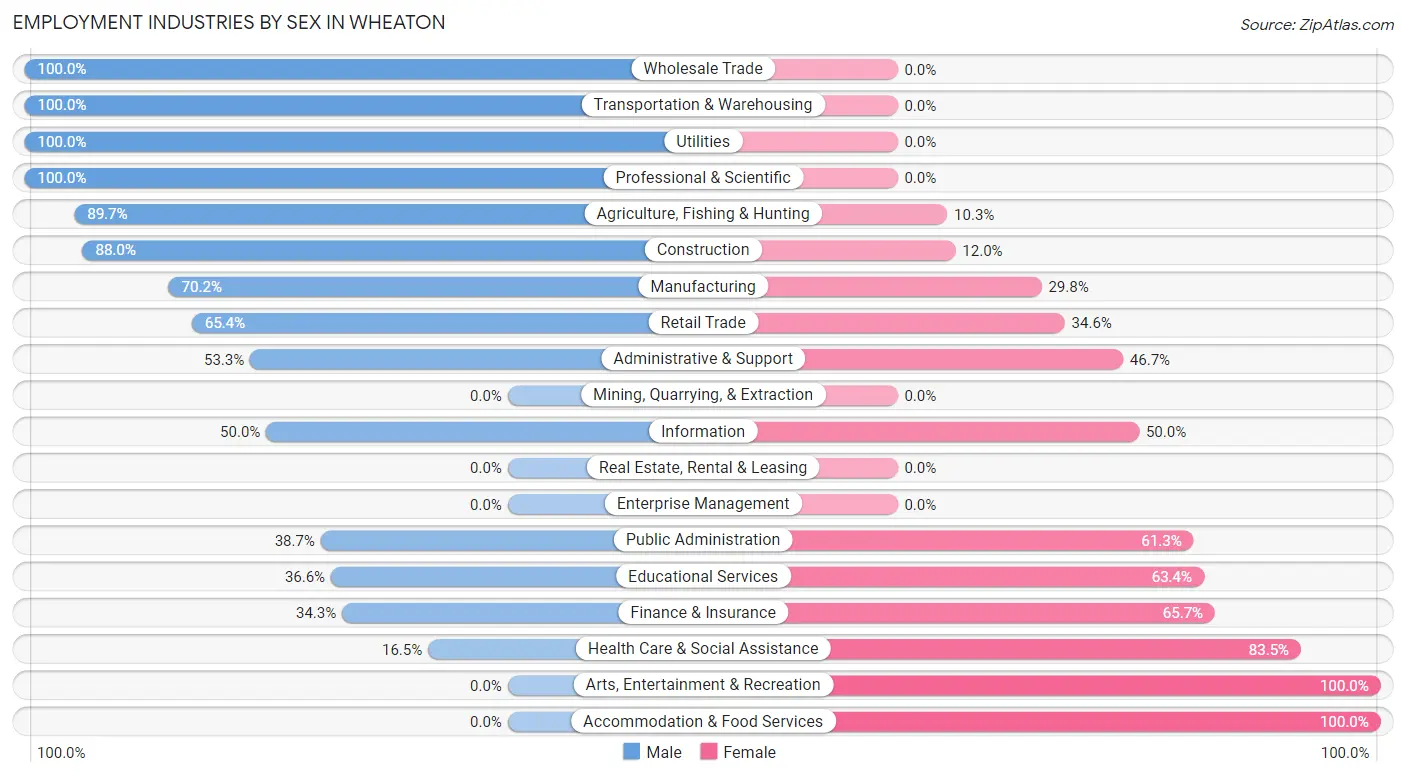
| Industry | Male | Female |
| Agriculture, Fishing & Hunting | 61 (89.7%) | 7 (10.3%) |
| Mining, Quarrying, & Extraction | 0 (0.0%) | 0 (0.0%) |
| Construction | 22 (88.0%) | 3 (12.0%) |
| Manufacturing | 40 (70.2%) | 17 (29.8%) |
| Wholesale Trade | 20 (100.0%) | 0 (0.0%) |
| Retail Trade | 34 (65.4%) | 18 (34.6%) |
| Transportation & Warehousing | 7 (100.0%) | 0 (0.0%) |
| Utilities | 16 (100.0%) | 0 (0.0%) |
| Information | 4 (50.0%) | 4 (50.0%) |
| Finance & Insurance | 12 (34.3%) | 23 (65.7%) |
| Real Estate, Rental & Leasing | 0 (0.0%) | 0 (0.0%) |
| Professional & Scientific | 6 (100.0%) | 0 (0.0%) |
| Enterprise Management | 0 (0.0%) | 0 (0.0%) |
| Administrative & Support | 8 (53.3%) | 7 (46.7%) |
| Educational Services | 15 (36.6%) | 26 (63.4%) |
| Health Care & Social Assistance | 16 (16.5%) | 81 (83.5%) |
| Arts, Entertainment & Recreation | 0 (0.0%) | 7 (100.0%) |
| Accommodation & Food Services | 0 (0.0%) | 16 (100.0%) |
| Public Administration | 12 (38.7%) | 19 (61.3%) |
| Total | 276 (52.3%) | 252 (47.7%) |
Education in Wheaton
School Enrollment in Wheaton
The most common levels of schooling among the 235 students in Wheaton are middle school (77 | 32.8%), high school (59 | 25.1%), and elementary school (57 | 24.3%).
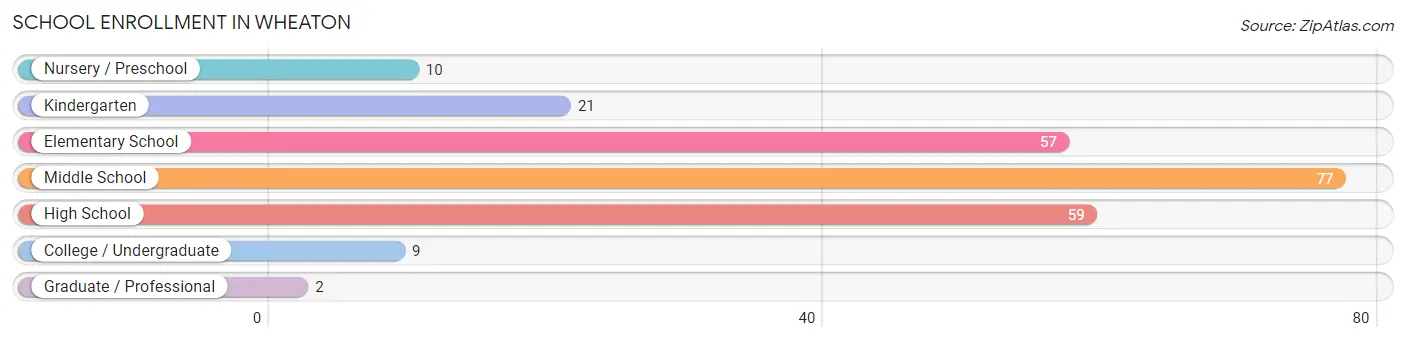
| School Level | # Students | % Students |
| Nursery / Preschool | 10 | 4.3% |
| Kindergarten | 21 | 8.9% |
| Elementary School | 57 | 24.3% |
| Middle School | 77 | 32.8% |
| High School | 59 | 25.1% |
| College / Undergraduate | 9 | 3.8% |
| Graduate / Professional | 2 | 0.9% |
| Total | 235 | 100.0% |
School Enrollment by Age by Funding Source in Wheaton
Out of a total of 235 students who are enrolled in schools in Wheaton, 2 (0.9%) attend a private institution, while the remaining 233 (99.1%) are enrolled in public schools. The age group of 3 to 4 year olds has the highest likelihood of being enrolled in private schools, with 2 (28.6% in the age bracket) enrolled. Conversely, the age group of 5 to 9 year old has the lowest likelihood of being enrolled in a private school, with 73 (100.0% in the age bracket) attending a public institution.
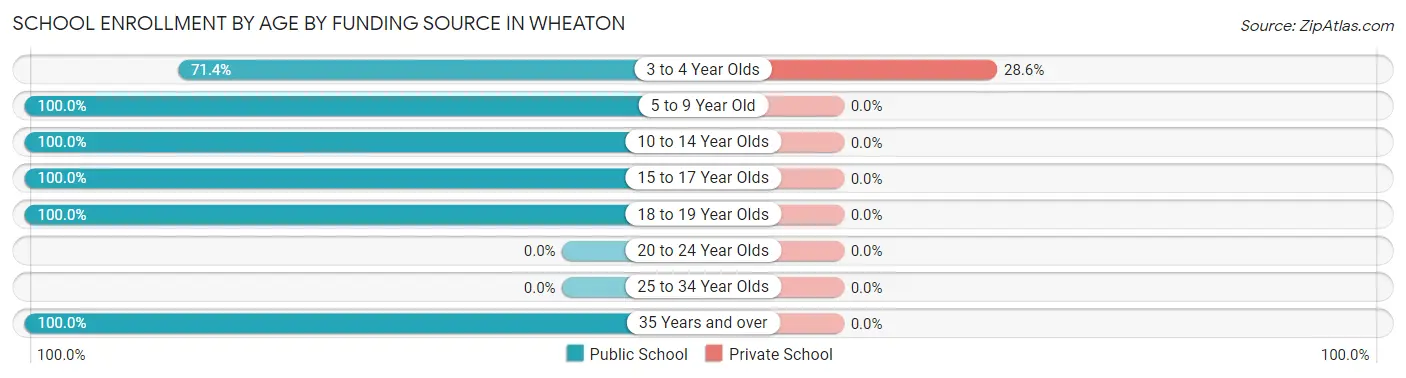
| Age Bracket | Public School | Private School |
| 3 to 4 Year Olds | 5 (71.4%) | 2 (28.6%) |
| 5 to 9 Year Old | 73 (100.0%) | 0 (0.0%) |
| 10 to 14 Year Olds | 89 (100.0%) | 0 (0.0%) |
| 15 to 17 Year Olds | 41 (100.0%) | 0 (0.0%) |
| 18 to 19 Year Olds | 19 (100.0%) | 0 (0.0%) |
| 20 to 24 Year Olds | 0 (0.0%) | 0 (0.0%) |
| 25 to 34 Year Olds | 0 (0.0%) | 0 (0.0%) |
| 35 Years and over | 6 (100.0%) | 0 (0.0%) |
| Total | 233 (99.1%) | 2 (0.9%) |
Educational Attainment by Field of Study in Wheaton
Education (44 | 25.4%), business (34 | 19.7%), science & technology (20 | 11.6%), bio, nature & agricultural (16 | 9.2%), and liberal arts & history (16 | 9.2%) are the most common fields of study among 173 individuals in Wheaton who have obtained a bachelor's degree or higher.
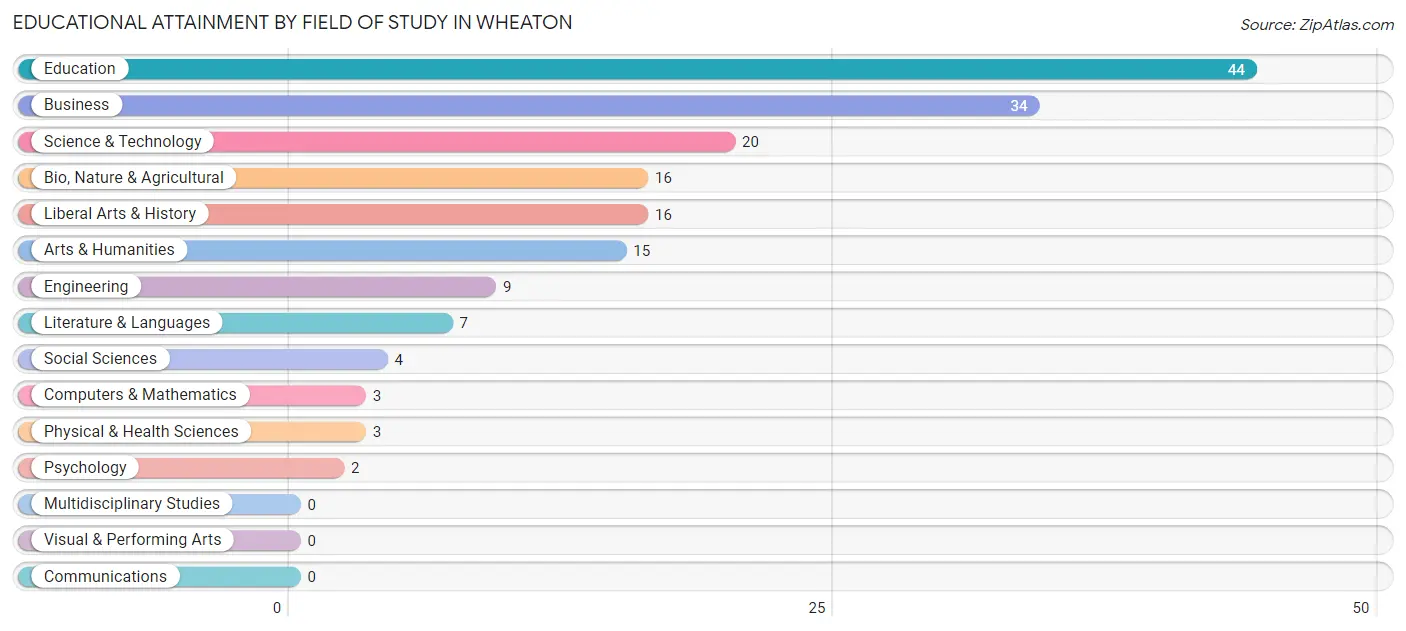
| Field of Study | # Graduates | % Graduates |
| Computers & Mathematics | 3 | 1.7% |
| Bio, Nature & Agricultural | 16 | 9.2% |
| Physical & Health Sciences | 3 | 1.7% |
| Psychology | 2 | 1.2% |
| Social Sciences | 4 | 2.3% |
| Engineering | 9 | 5.2% |
| Multidisciplinary Studies | 0 | 0.0% |
| Science & Technology | 20 | 11.6% |
| Business | 34 | 19.7% |
| Education | 44 | 25.4% |
| Literature & Languages | 7 | 4.1% |
| Liberal Arts & History | 16 | 9.2% |
| Visual & Performing Arts | 0 | 0.0% |
| Communications | 0 | 0.0% |
| Arts & Humanities | 15 | 8.7% |
| Total | 173 | 100.0% |
Transportation & Commute in Wheaton
Vehicle Availability by Sex in Wheaton
The most prevalent vehicle ownership categories in Wheaton are males with 2 vehicles (106, accounting for 41.2%) and females with 2 vehicles (94, making up 43.6%).
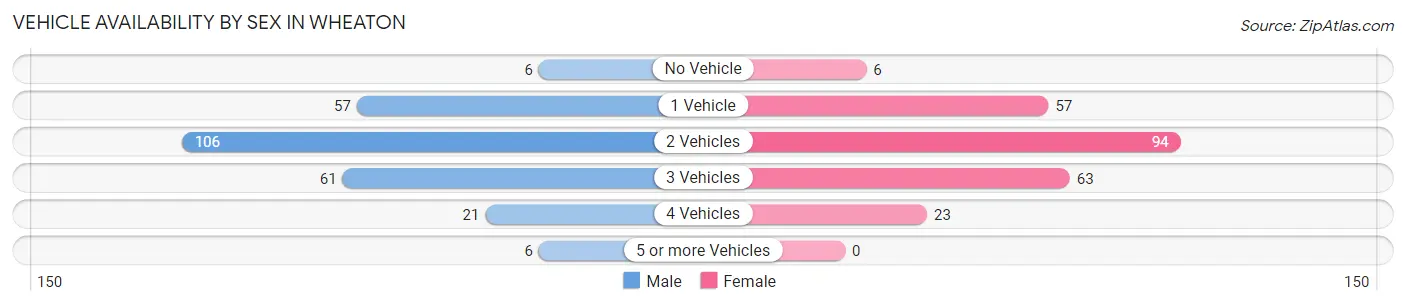
| Vehicles Available | Male | Female |
| No Vehicle | 6 (2.3%) | 6 (2.5%) |
| 1 Vehicle | 57 (22.2%) | 57 (23.5%) |
| 2 Vehicles | 106 (41.2%) | 94 (38.7%) |
| 3 Vehicles | 61 (23.7%) | 63 (25.9%) |
| 4 Vehicles | 21 (8.2%) | 23 (9.5%) |
| 5 or more Vehicles | 6 (2.3%) | 0 (0.0%) |
| Total | 257 (100.0%) | 243 (100.0%) |
Commute Time in Wheaton
The most frequently occuring commute durations in Wheaton are less than 5 minutes (158 commuters, 33.1%), 5 to 9 minutes (128 commuters, 26.8%), and 20 to 24 minutes (56 commuters, 11.7%).
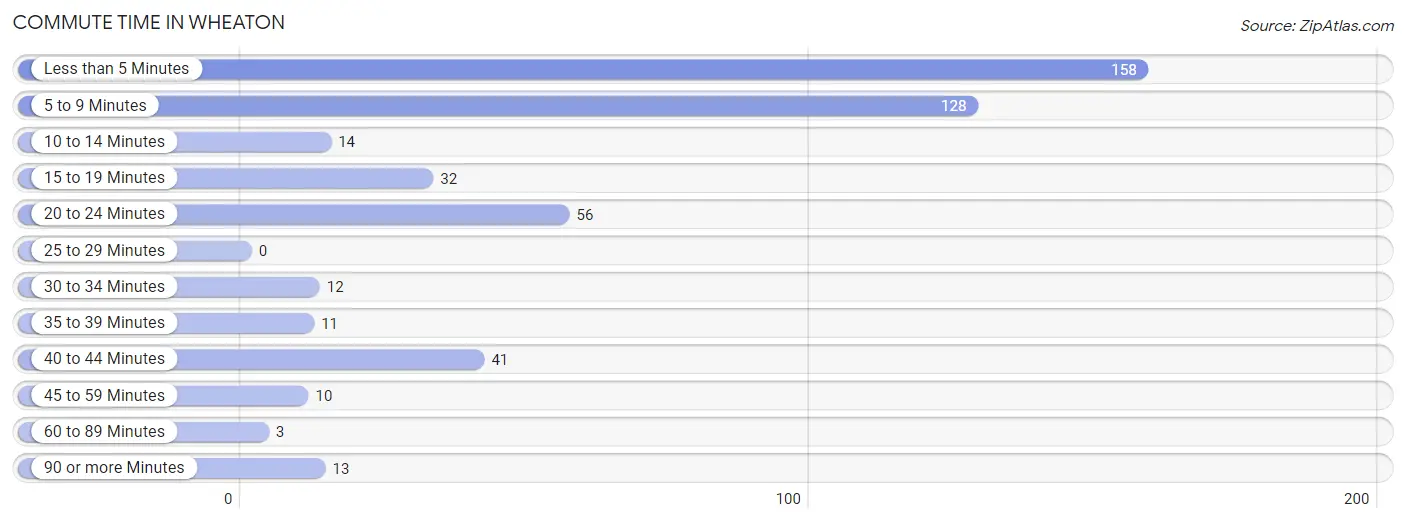
| Commute Time | # Commuters | % Commuters |
| Less than 5 Minutes | 158 | 33.1% |
| 5 to 9 Minutes | 128 | 26.8% |
| 10 to 14 Minutes | 14 | 2.9% |
| 15 to 19 Minutes | 32 | 6.7% |
| 20 to 24 Minutes | 56 | 11.7% |
| 25 to 29 Minutes | 0 | 0.0% |
| 30 to 34 Minutes | 12 | 2.5% |
| 35 to 39 Minutes | 11 | 2.3% |
| 40 to 44 Minutes | 41 | 8.6% |
| 45 to 59 Minutes | 10 | 2.1% |
| 60 to 89 Minutes | 3 | 0.6% |
| 90 or more Minutes | 13 | 2.7% |
Commute Time by Sex in Wheaton
The most common commute times in Wheaton are 5 to 9 minutes (65 commuters, 26.5%) for males and less than 5 minutes (94 commuters, 40.3%) for females.
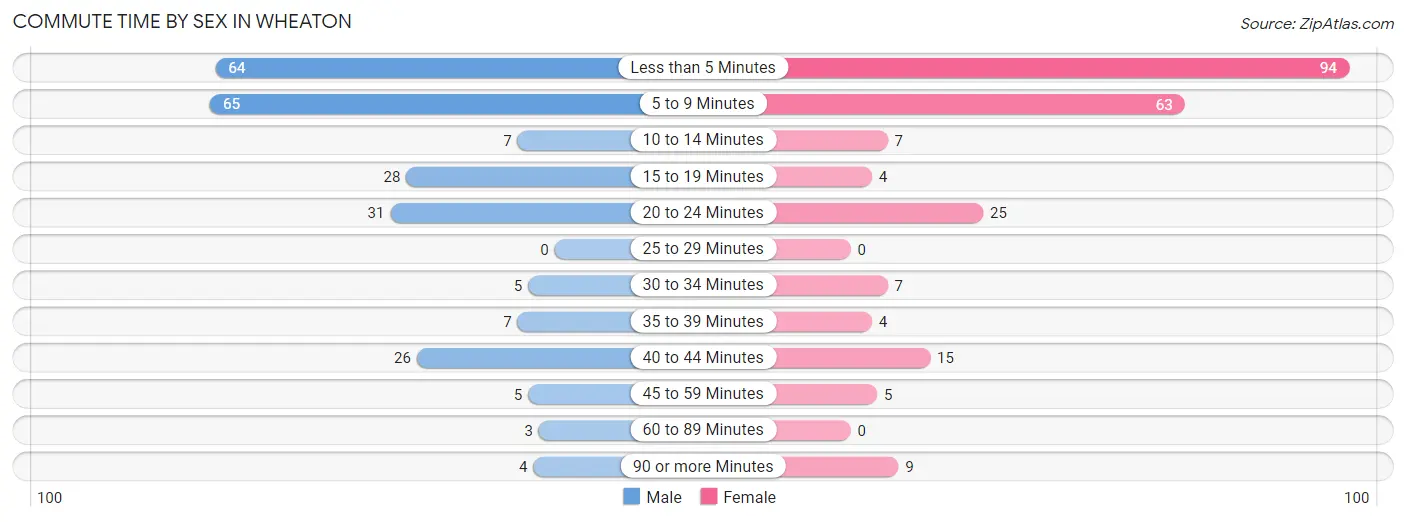
| Commute Time | Male | Female |
| Less than 5 Minutes | 64 (26.1%) | 94 (40.3%) |
| 5 to 9 Minutes | 65 (26.5%) | 63 (27.0%) |
| 10 to 14 Minutes | 7 (2.9%) | 7 (3.0%) |
| 15 to 19 Minutes | 28 (11.4%) | 4 (1.7%) |
| 20 to 24 Minutes | 31 (12.7%) | 25 (10.7%) |
| 25 to 29 Minutes | 0 (0.0%) | 0 (0.0%) |
| 30 to 34 Minutes | 5 (2.0%) | 7 (3.0%) |
| 35 to 39 Minutes | 7 (2.9%) | 4 (1.7%) |
| 40 to 44 Minutes | 26 (10.6%) | 15 (6.4%) |
| 45 to 59 Minutes | 5 (2.0%) | 5 (2.1%) |
| 60 to 89 Minutes | 3 (1.2%) | 0 (0.0%) |
| 90 or more Minutes | 4 (1.6%) | 9 (3.9%) |
Time of Departure to Work by Sex in Wheaton
The most frequent times of departure to work in Wheaton are 7:30 AM to 7:59 AM (60, 24.5%) for males and 7:30 AM to 7:59 AM (56, 24.0%) for females.
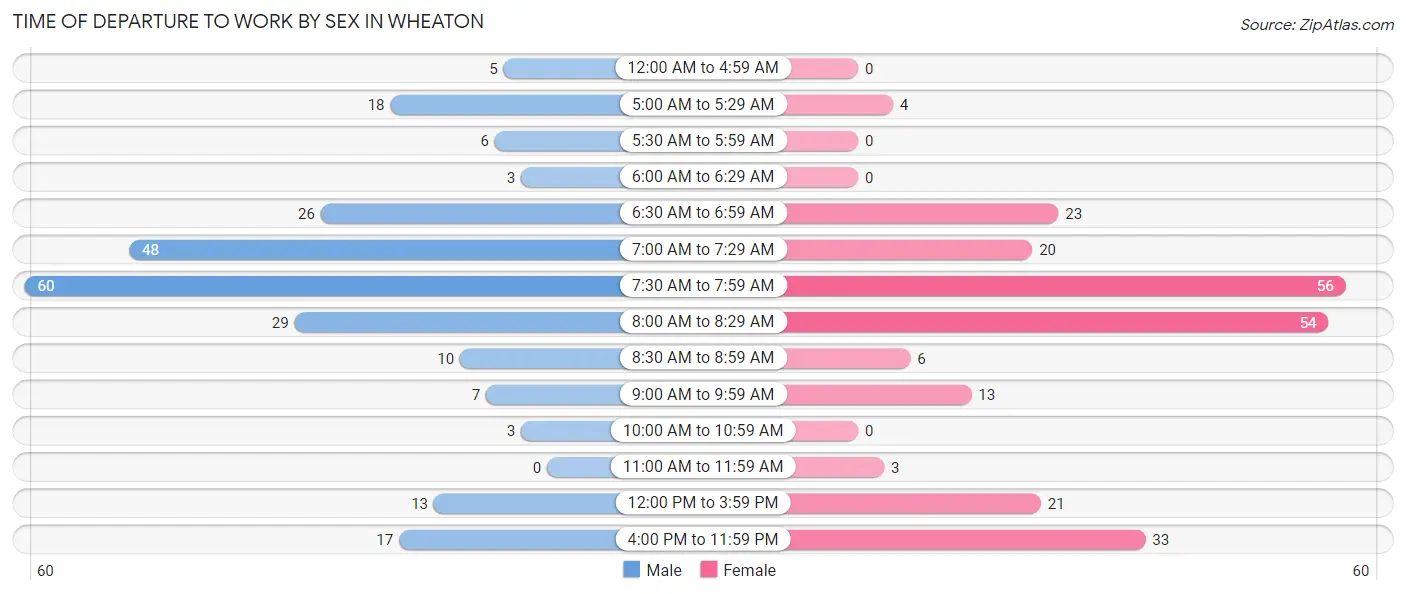
| Time of Departure | Male | Female |
| 12:00 AM to 4:59 AM | 5 (2.0%) | 0 (0.0%) |
| 5:00 AM to 5:29 AM | 18 (7.3%) | 4 (1.7%) |
| 5:30 AM to 5:59 AM | 6 (2.5%) | 0 (0.0%) |
| 6:00 AM to 6:29 AM | 3 (1.2%) | 0 (0.0%) |
| 6:30 AM to 6:59 AM | 26 (10.6%) | 23 (9.9%) |
| 7:00 AM to 7:29 AM | 48 (19.6%) | 20 (8.6%) |
| 7:30 AM to 7:59 AM | 60 (24.5%) | 56 (24.0%) |
| 8:00 AM to 8:29 AM | 29 (11.8%) | 54 (23.2%) |
| 8:30 AM to 8:59 AM | 10 (4.1%) | 6 (2.6%) |
| 9:00 AM to 9:59 AM | 7 (2.9%) | 13 (5.6%) |
| 10:00 AM to 10:59 AM | 3 (1.2%) | 0 (0.0%) |
| 11:00 AM to 11:59 AM | 0 (0.0%) | 3 (1.3%) |
| 12:00 PM to 3:59 PM | 13 (5.3%) | 21 (9.0%) |
| 4:00 PM to 11:59 PM | 17 (6.9%) | 33 (14.2%) |
| Total | 245 (100.0%) | 233 (100.0%) |
Housing Occupancy in Wheaton
Occupancy by Ownership in Wheaton
Of the total 655 dwellings in Wheaton, owner-occupied units account for 505 (77.1%), while renter-occupied units make up 150 (22.9%).
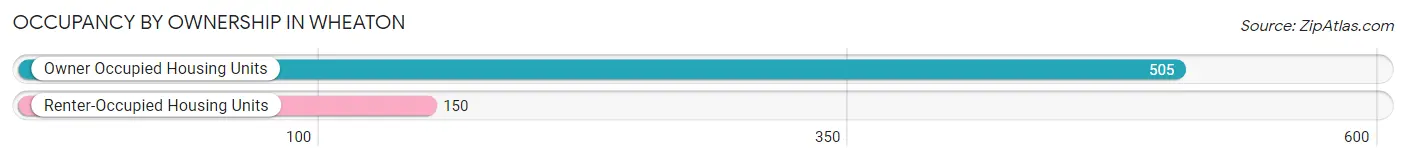
| Occupancy | # Housing Units | % Housing Units |
| Owner Occupied Housing Units | 505 | 77.1% |
| Renter-Occupied Housing Units | 150 | 22.9% |
| Total Occupied Housing Units | 655 | 100.0% |
Occupancy by Household Size in Wheaton
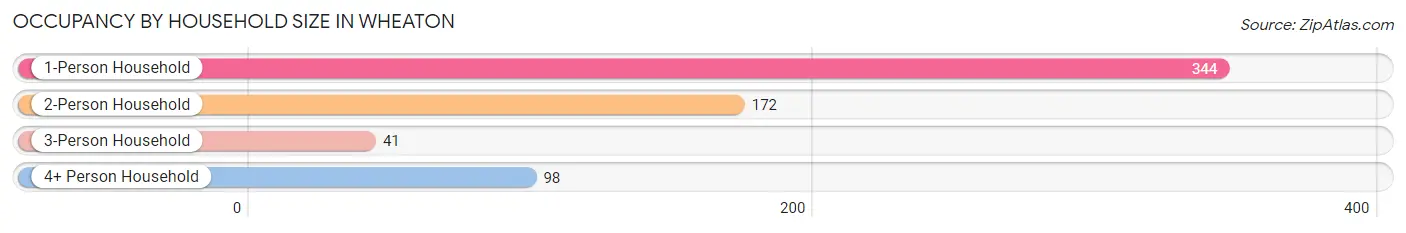
| Household Size | # Housing Units | % Housing Units |
| 1-Person Household | 344 | 52.5% |
| 2-Person Household | 172 | 26.3% |
| 3-Person Household | 41 | 6.3% |
| 4+ Person Household | 98 | 15.0% |
| Total Housing Units | 655 | 100.0% |
Occupancy by Ownership by Household Size in Wheaton
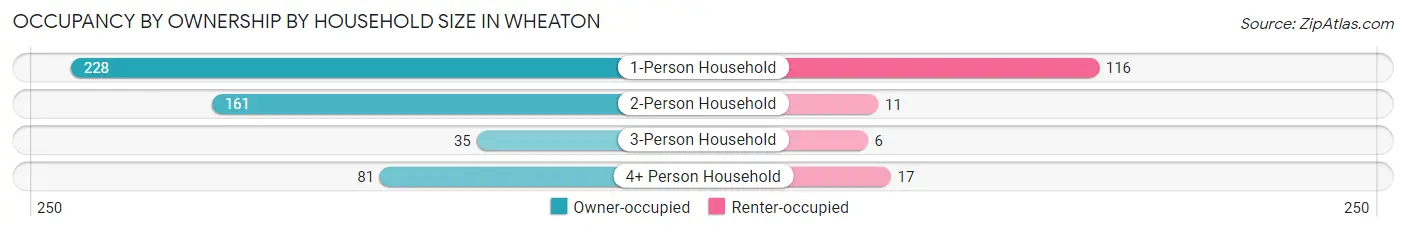
| Household Size | Owner-occupied | Renter-occupied |
| 1-Person Household | 228 (66.3%) | 116 (33.7%) |
| 2-Person Household | 161 (93.6%) | 11 (6.4%) |
| 3-Person Household | 35 (85.4%) | 6 (14.6%) |
| 4+ Person Household | 81 (82.7%) | 17 (17.3%) |
| Total Housing Units | 505 (77.1%) | 150 (22.9%) |
Occupancy by Educational Attainment in Wheaton
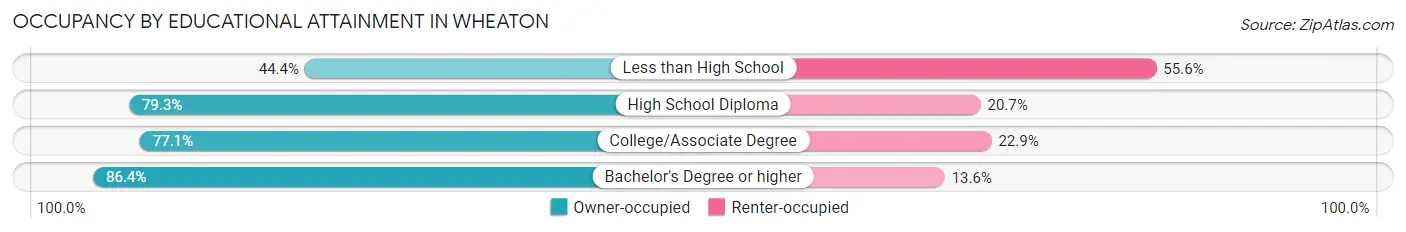
| Household Size | Owner-occupied | Renter-occupied |
| Less than High School | 20 (44.4%) | 25 (55.6%) |
| High School Diploma | 180 (79.3%) | 47 (20.7%) |
| College/Associate Degree | 216 (77.1%) | 64 (22.9%) |
| Bachelor's Degree or higher | 89 (86.4%) | 14 (13.6%) |
Occupancy by Age of Householder in Wheaton
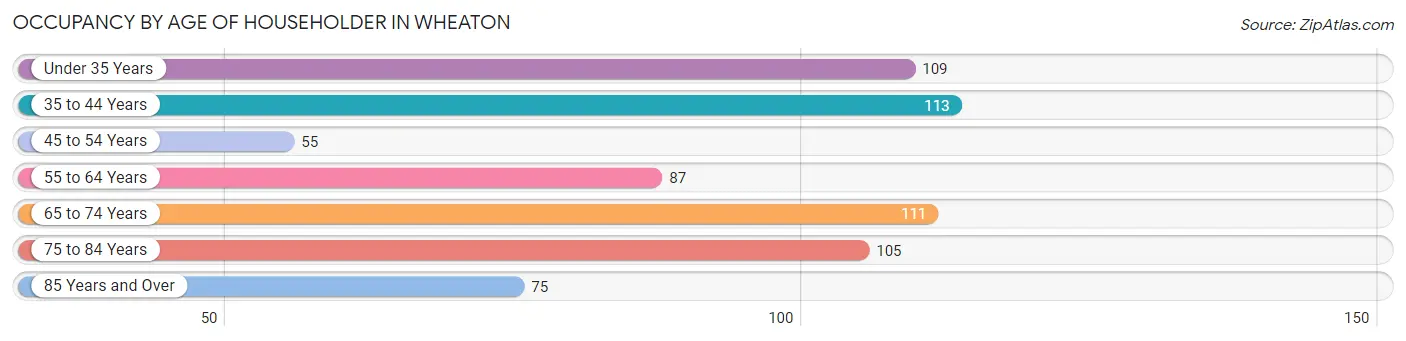
| Age Bracket | # Households | % Households |
| Under 35 Years | 109 | 16.6% |
| 35 to 44 Years | 113 | 17.2% |
| 45 to 54 Years | 55 | 8.4% |
| 55 to 64 Years | 87 | 13.3% |
| 65 to 74 Years | 111 | 17.0% |
| 75 to 84 Years | 105 | 16.0% |
| 85 Years and Over | 75 | 11.5% |
| Total | 655 | 100.0% |
Housing Finances in Wheaton
Median Income by Occupancy in Wheaton
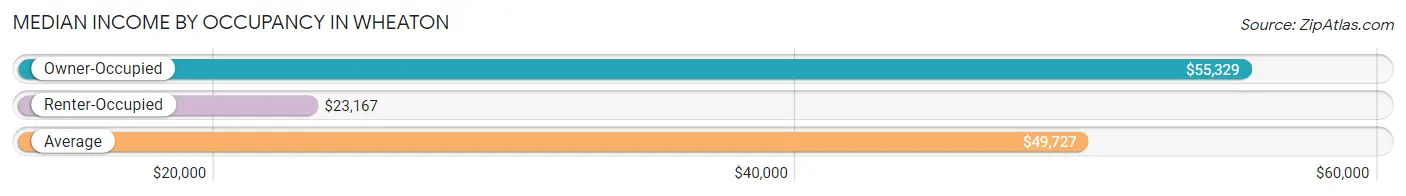
| Occupancy Type | # Households | Median Income |
| Owner-Occupied | 505 (77.1%) | $55,329 |
| Renter-Occupied | 150 (22.9%) | $23,167 |
| Average | 655 (100.0%) | $49,727 |
Occupancy by Householder Income Bracket in Wheaton
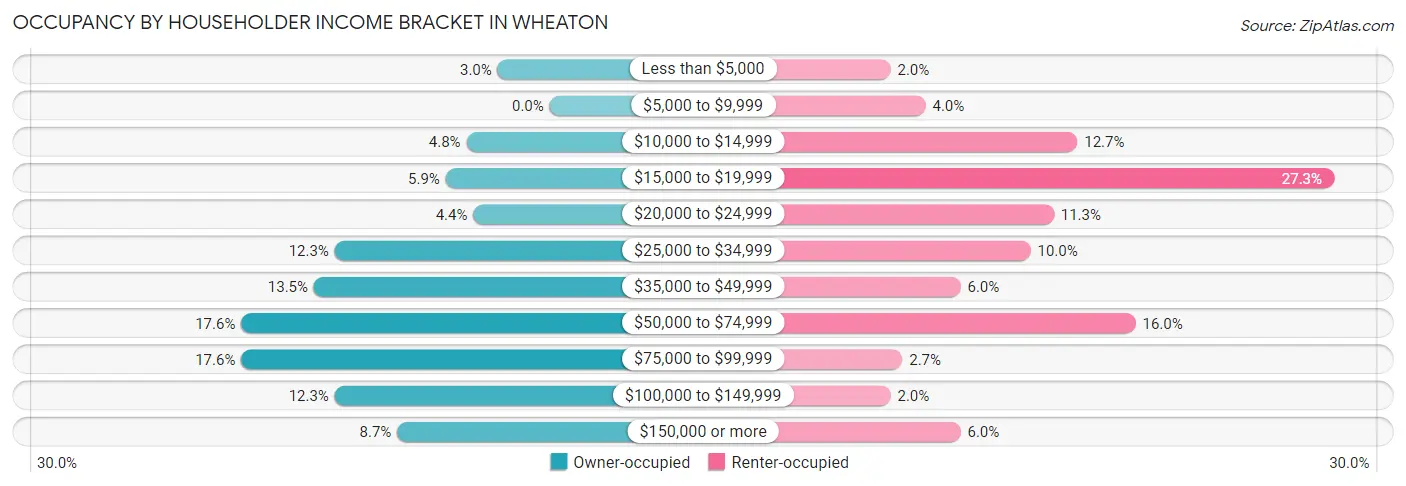
| Income Bracket | Owner-occupied | Renter-occupied |
| Less than $5,000 | 15 (3.0%) | 3 (2.0%) |
| $5,000 to $9,999 | 0 (0.0%) | 6 (4.0%) |
| $10,000 to $14,999 | 24 (4.8%) | 19 (12.7%) |
| $15,000 to $19,999 | 30 (5.9%) | 41 (27.3%) |
| $20,000 to $24,999 | 22 (4.4%) | 17 (11.3%) |
| $25,000 to $34,999 | 62 (12.3%) | 15 (10.0%) |
| $35,000 to $49,999 | 68 (13.5%) | 9 (6.0%) |
| $50,000 to $74,999 | 89 (17.6%) | 24 (16.0%) |
| $75,000 to $99,999 | 89 (17.6%) | 4 (2.7%) |
| $100,000 to $149,999 | 62 (12.3%) | 3 (2.0%) |
| $150,000 or more | 44 (8.7%) | 9 (6.0%) |
| Total | 505 (100.0%) | 150 (100.0%) |
Monthly Housing Cost Tiers in Wheaton
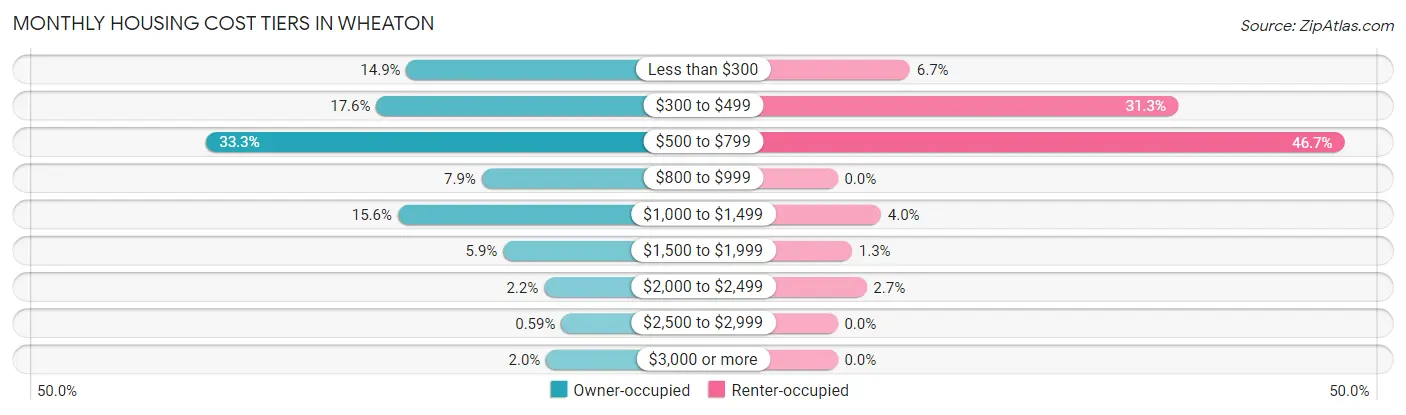
| Monthly Cost | Owner-occupied | Renter-occupied |
| Less than $300 | 75 (14.8%) | 10 (6.7%) |
| $300 to $499 | 89 (17.6%) | 47 (31.3%) |
| $500 to $799 | 168 (33.3%) | 70 (46.7%) |
| $800 to $999 | 40 (7.9%) | 0 (0.0%) |
| $1,000 to $1,499 | 79 (15.6%) | 6 (4.0%) |
| $1,500 to $1,999 | 30 (5.9%) | 2 (1.3%) |
| $2,000 to $2,499 | 11 (2.2%) | 4 (2.7%) |
| $2,500 to $2,999 | 3 (0.6%) | 0 (0.0%) |
| $3,000 or more | 10 (2.0%) | 0 (0.0%) |
| Total | 505 (100.0%) | 150 (100.0%) |
Physical Housing Characteristics in Wheaton
Housing Structures in Wheaton
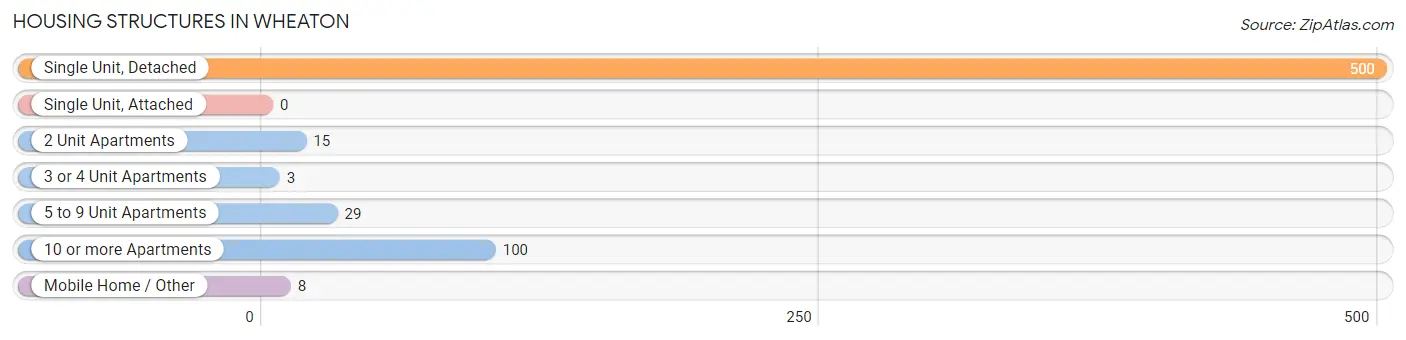
| Structure Type | # Housing Units | % Housing Units |
| Single Unit, Detached | 500 | 76.3% |
| Single Unit, Attached | 0 | 0.0% |
| 2 Unit Apartments | 15 | 2.3% |
| 3 or 4 Unit Apartments | 3 | 0.5% |
| 5 to 9 Unit Apartments | 29 | 4.4% |
| 10 or more Apartments | 100 | 15.3% |
| Mobile Home / Other | 8 | 1.2% |
| Total | 655 | 100.0% |
Housing Structures by Occupancy in Wheaton
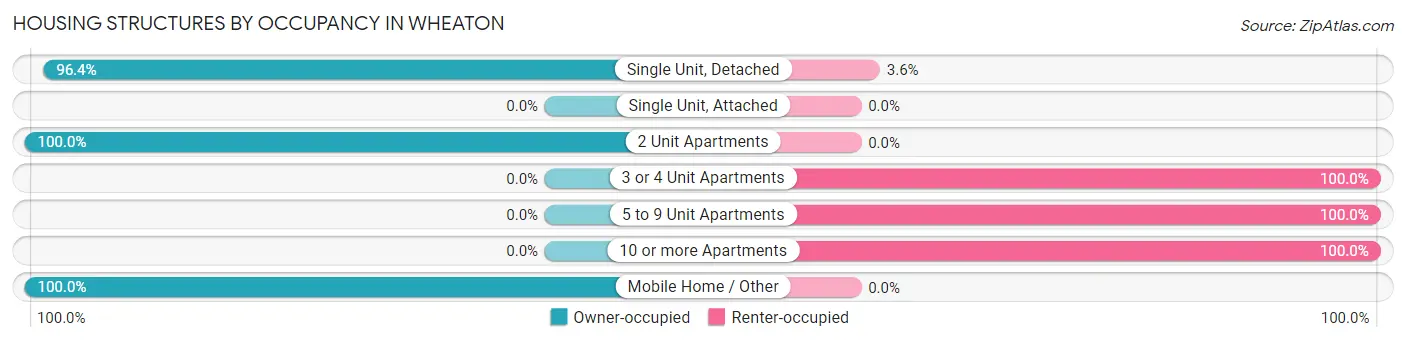
| Structure Type | Owner-occupied | Renter-occupied |
| Single Unit, Detached | 482 (96.4%) | 18 (3.6%) |
| Single Unit, Attached | 0 (0.0%) | 0 (0.0%) |
| 2 Unit Apartments | 15 (100.0%) | 0 (0.0%) |
| 3 or 4 Unit Apartments | 0 (0.0%) | 3 (100.0%) |
| 5 to 9 Unit Apartments | 0 (0.0%) | 29 (100.0%) |
| 10 or more Apartments | 0 (0.0%) | 100 (100.0%) |
| Mobile Home / Other | 8 (100.0%) | 0 (0.0%) |
| Total | 505 (77.1%) | 150 (22.9%) |
Housing Structures by Number of Rooms in Wheaton
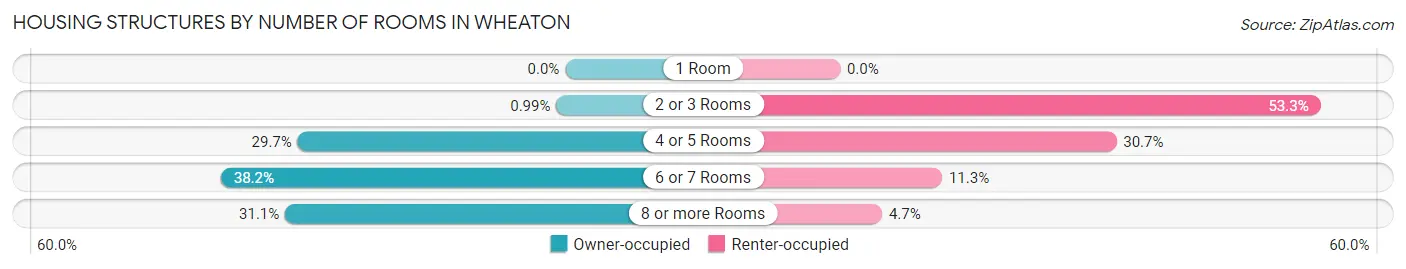
| Number of Rooms | Owner-occupied | Renter-occupied |
| 1 Room | 0 (0.0%) | 0 (0.0%) |
| 2 or 3 Rooms | 5 (1.0%) | 80 (53.3%) |
| 4 or 5 Rooms | 150 (29.7%) | 46 (30.7%) |
| 6 or 7 Rooms | 193 (38.2%) | 17 (11.3%) |
| 8 or more Rooms | 157 (31.1%) | 7 (4.7%) |
| Total | 505 (100.0%) | 150 (100.0%) |
Housing Structure by Heating Type in Wheaton
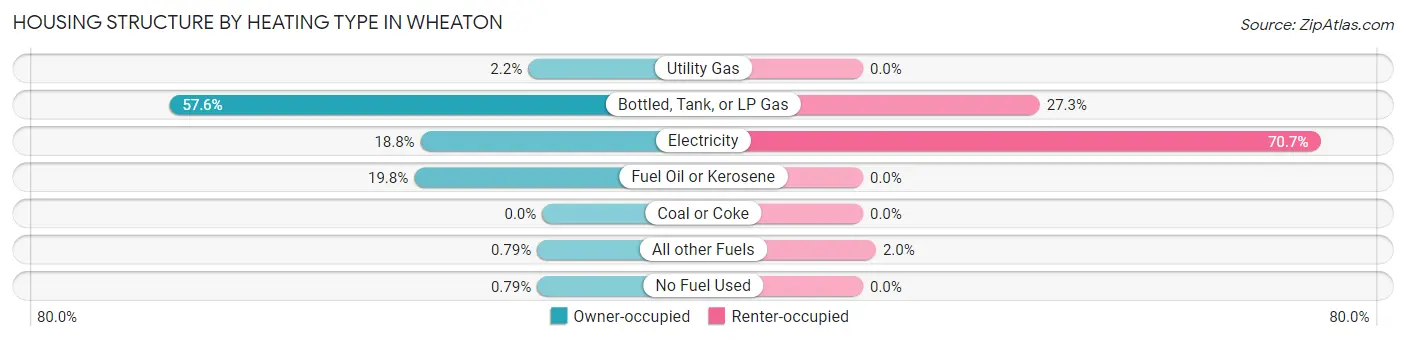
| Heating Type | Owner-occupied | Renter-occupied |
| Utility Gas | 11 (2.2%) | 0 (0.0%) |
| Bottled, Tank, or LP Gas | 291 (57.6%) | 41 (27.3%) |
| Electricity | 95 (18.8%) | 106 (70.7%) |
| Fuel Oil or Kerosene | 100 (19.8%) | 0 (0.0%) |
| Coal or Coke | 0 (0.0%) | 0 (0.0%) |
| All other Fuels | 4 (0.8%) | 3 (2.0%) |
| No Fuel Used | 4 (0.8%) | 0 (0.0%) |
| Total | 505 (100.0%) | 150 (100.0%) |
Household Vehicle Usage in Wheaton
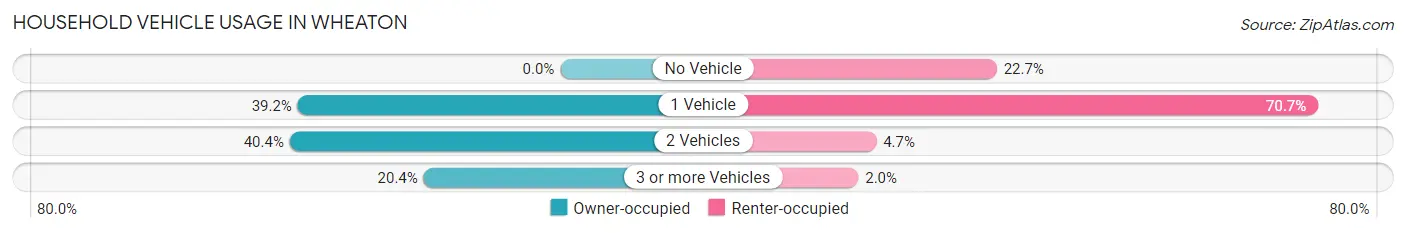
| Vehicles per Household | Owner-occupied | Renter-occupied |
| No Vehicle | 0 (0.0%) | 34 (22.7%) |
| 1 Vehicle | 198 (39.2%) | 106 (70.7%) |
| 2 Vehicles | 204 (40.4%) | 7 (4.7%) |
| 3 or more Vehicles | 103 (20.4%) | 3 (2.0%) |
| Total | 505 (100.0%) | 150 (100.0%) |
Real Estate & Mortgages in Wheaton
Real Estate and Mortgage Overview in Wheaton
| Characteristic | Without Mortgage | With Mortgage |
| Housing Units | 293 | 212 |
| Median Property Value | $80,900 | $80,900 |
| Median Household Income | $53,542 | $15 |
| Monthly Housing Costs | $458 | $10 |
| Real Estate Taxes | $875 | $2 |
Property Value by Mortgage Status in Wheaton
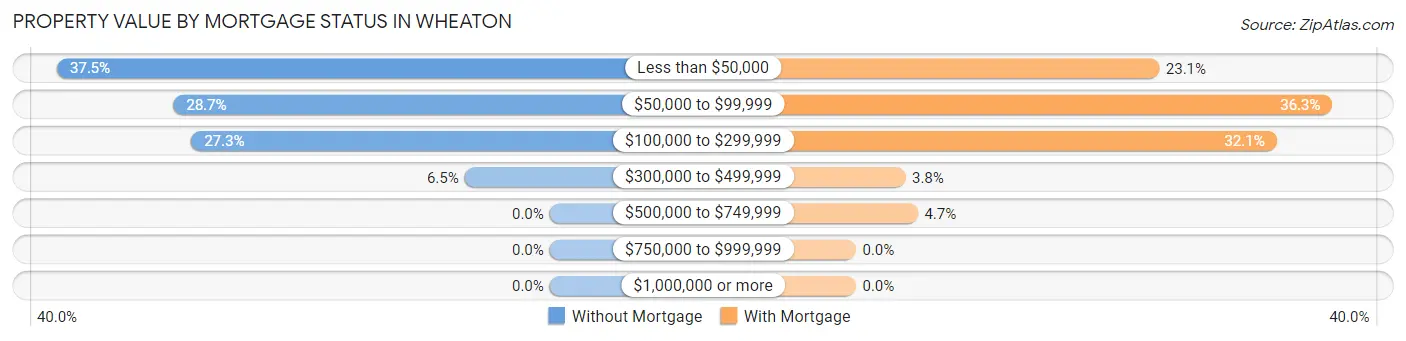
| Property Value | Without Mortgage | With Mortgage |
| Less than $50,000 | 110 (37.5%) | 49 (23.1%) |
| $50,000 to $99,999 | 84 (28.7%) | 77 (36.3%) |
| $100,000 to $299,999 | 80 (27.3%) | 68 (32.1%) |
| $300,000 to $499,999 | 19 (6.5%) | 8 (3.8%) |
| $500,000 to $749,999 | 0 (0.0%) | 10 (4.7%) |
| $750,000 to $999,999 | 0 (0.0%) | 0 (0.0%) |
| $1,000,000 or more | 0 (0.0%) | 0 (0.0%) |
| Total | 293 (100.0%) | 212 (100.0%) |
Household Income by Mortgage Status in Wheaton
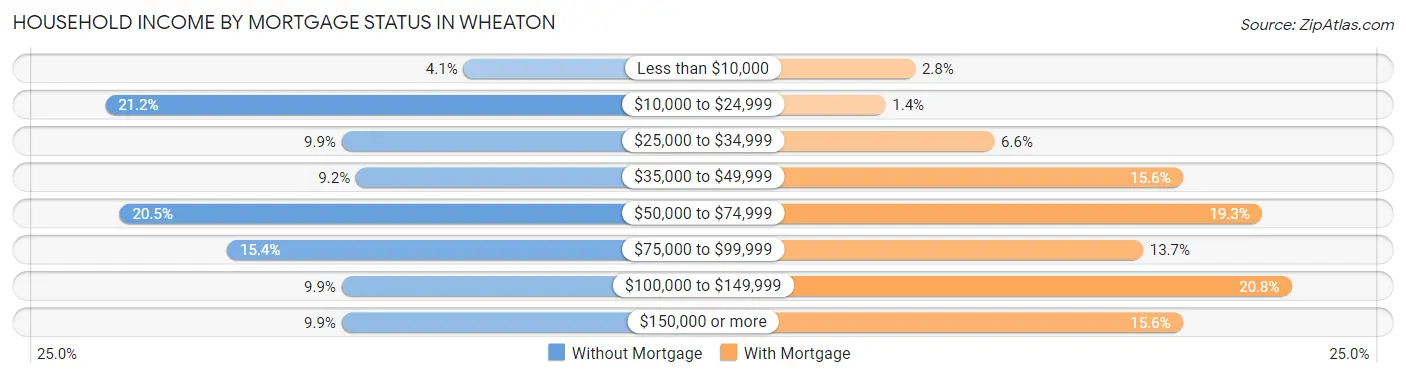
| Household Income | Without Mortgage | With Mortgage |
| Less than $10,000 | 12 (4.1%) | 6 (2.8%) |
| $10,000 to $24,999 | 62 (21.2%) | 3 (1.4%) |
| $25,000 to $34,999 | 29 (9.9%) | 14 (6.6%) |
| $35,000 to $49,999 | 27 (9.2%) | 33 (15.6%) |
| $50,000 to $74,999 | 60 (20.5%) | 41 (19.3%) |
| $75,000 to $99,999 | 45 (15.4%) | 29 (13.7%) |
| $100,000 to $149,999 | 29 (9.9%) | 44 (20.7%) |
| $150,000 or more | 29 (9.9%) | 33 (15.6%) |
| Total | 293 (100.0%) | 212 (100.0%) |
Property Value to Household Income Ratio in Wheaton
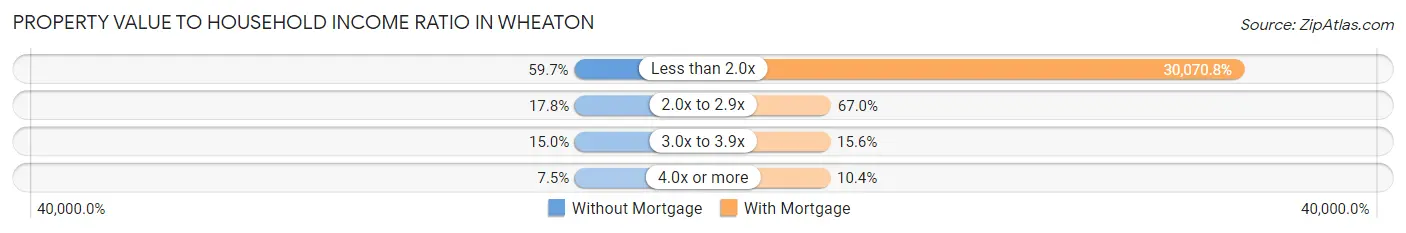
| Value-to-Income Ratio | Without Mortgage | With Mortgage |
| Less than 2.0x | 175 (59.7%) | 63,750 (30,070.7%) |
| 2.0x to 2.9x | 52 (17.7%) | 142 (67.0%) |
| 3.0x to 3.9x | 44 (15.0%) | 33 (15.6%) |
| 4.0x or more | 22 (7.5%) | 22 (10.4%) |
| Total | 293 (100.0%) | 212 (100.0%) |
Real Estate Taxes by Mortgage Status in Wheaton
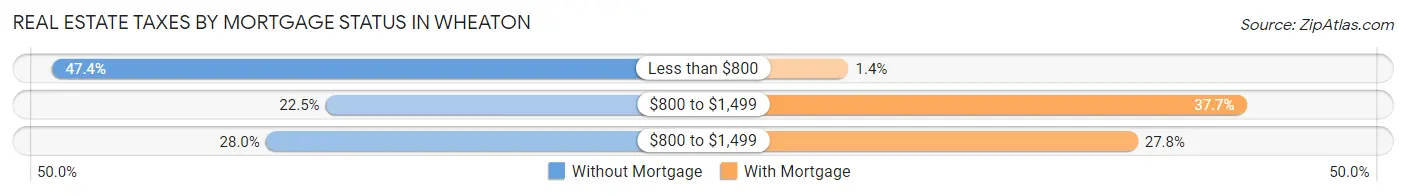
| Property Taxes | Without Mortgage | With Mortgage |
| Less than $800 | 139 (47.4%) | 3 (1.4%) |
| $800 to $1,499 | 66 (22.5%) | 80 (37.7%) |
| $800 to $1,499 | 82 (28.0%) | 59 (27.8%) |
| Total | 293 (100.0%) | 212 (100.0%) |
Health & Disability in Wheaton
Health Insurance Coverage by Age in Wheaton
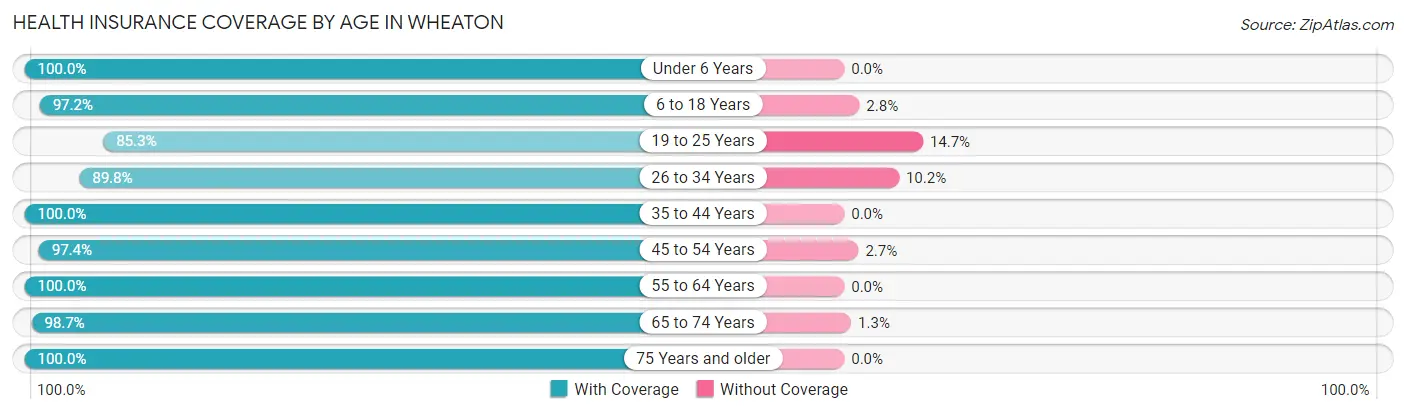
| Age Bracket | With Coverage | Without Coverage |
| Under 6 Years | 92 (100.0%) | 0 (0.0%) |
| 6 to 18 Years | 207 (97.2%) | 6 (2.8%) |
| 19 to 25 Years | 64 (85.3%) | 11 (14.7%) |
| 26 to 34 Years | 88 (89.8%) | 10 (10.2%) |
| 35 to 44 Years | 177 (100.0%) | 0 (0.0%) |
| 45 to 54 Years | 110 (97.4%) | 3 (2.6%) |
| 55 to 64 Years | 135 (100.0%) | 0 (0.0%) |
| 65 to 74 Years | 154 (98.7%) | 2 (1.3%) |
| 75 Years and older | 219 (100.0%) | 0 (0.0%) |
| Total | 1,246 (97.5%) | 32 (2.5%) |
Health Insurance Coverage by Citizenship Status in Wheaton
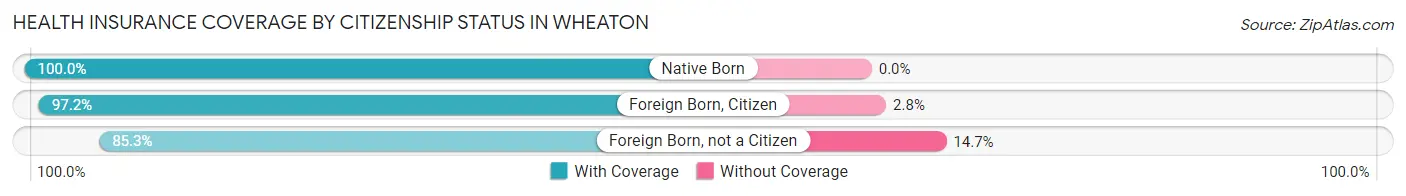
| Citizenship Status | With Coverage | Without Coverage |
| Native Born | 92 (100.0%) | 0 (0.0%) |
| Foreign Born, Citizen | 207 (97.2%) | 6 (2.8%) |
| Foreign Born, not a Citizen | 64 (85.3%) | 11 (14.7%) |
Health Insurance Coverage by Household Income in Wheaton
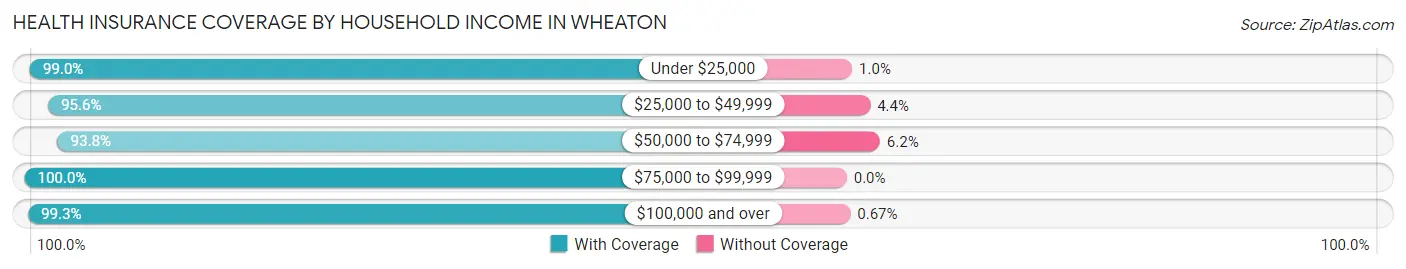
| Household Income | With Coverage | Without Coverage |
| Under $25,000 | 198 (99.0%) | 2 (1.0%) |
| $25,000 to $49,999 | 283 (95.6%) | 13 (4.4%) |
| $50,000 to $74,999 | 227 (93.8%) | 15 (6.2%) |
| $75,000 to $99,999 | 233 (100.0%) | 0 (0.0%) |
| $100,000 and over | 296 (99.3%) | 2 (0.7%) |
Public vs Private Health Insurance Coverage by Age in Wheaton
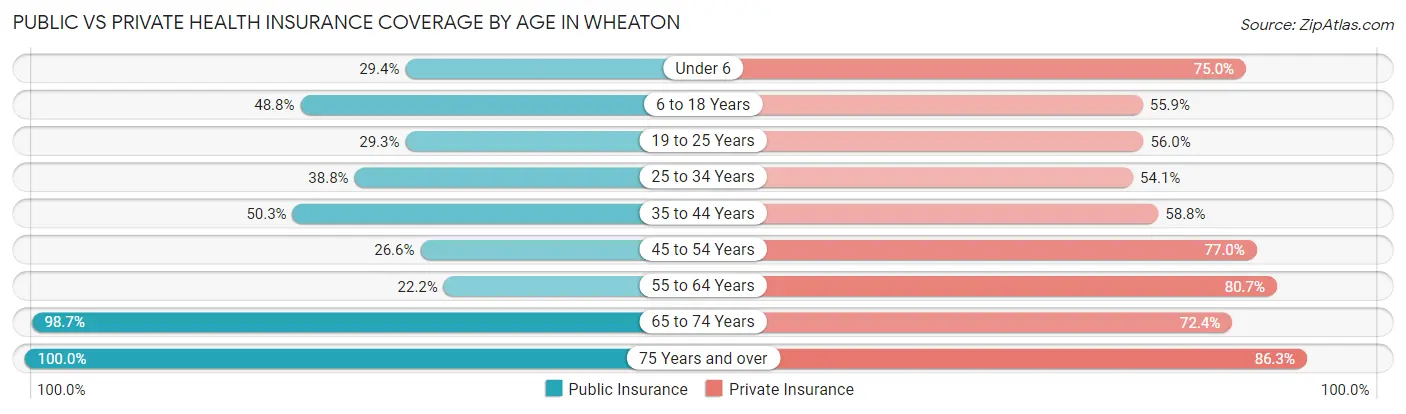
| Age Bracket | Public Insurance | Private Insurance |
| Under 6 | 27 (29.3%) | 69 (75.0%) |
| 6 to 18 Years | 104 (48.8%) | 119 (55.9%) |
| 19 to 25 Years | 22 (29.3%) | 42 (56.0%) |
| 25 to 34 Years | 38 (38.8%) | 53 (54.1%) |
| 35 to 44 Years | 89 (50.3%) | 104 (58.8%) |
| 45 to 54 Years | 30 (26.6%) | 87 (77.0%) |
| 55 to 64 Years | 30 (22.2%) | 109 (80.7%) |
| 65 to 74 Years | 154 (98.7%) | 113 (72.4%) |
| 75 Years and over | 219 (100.0%) | 189 (86.3%) |
| Total | 713 (55.8%) | 885 (69.3%) |
Disability Status by Sex by Age in Wheaton
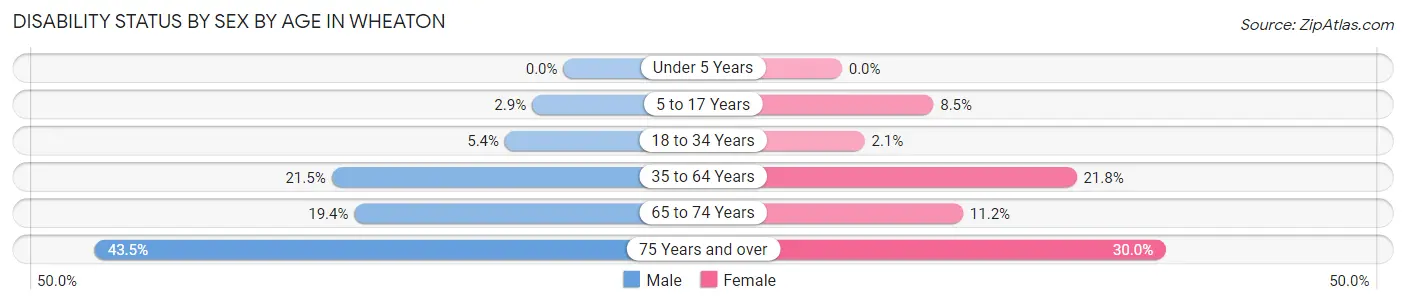
| Age Bracket | Male | Female |
| Under 5 Years | 0 (0.0%) | 0 (0.0%) |
| 5 to 17 Years | 3 (2.9%) | 9 (8.5%) |
| 18 to 34 Years | 5 (5.4%) | 2 (2.1%) |
| 35 to 64 Years | 48 (21.5%) | 44 (21.8%) |
| 65 to 74 Years | 13 (19.4%) | 10 (11.2%) |
| 75 Years and over | 30 (43.5%) | 45 (30.0%) |
Disability Class by Sex by Age in Wheaton
Disability Class: Hearing Difficulty
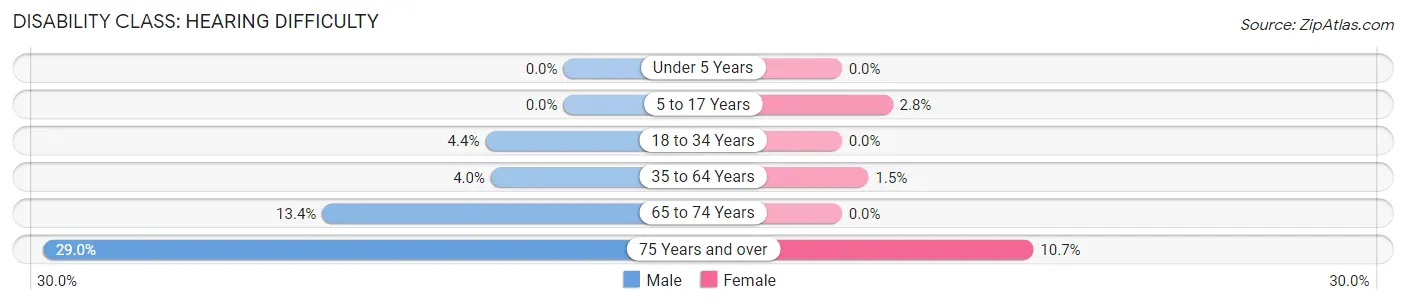
| Age Bracket | Male | Female |
| Under 5 Years | 0 (0.0%) | 0 (0.0%) |
| 5 to 17 Years | 0 (0.0%) | 3 (2.8%) |
| 18 to 34 Years | 4 (4.3%) | 0 (0.0%) |
| 35 to 64 Years | 9 (4.0%) | 3 (1.5%) |
| 65 to 74 Years | 9 (13.4%) | 0 (0.0%) |
| 75 Years and over | 20 (29.0%) | 16 (10.7%) |
Disability Class: Vision Difficulty
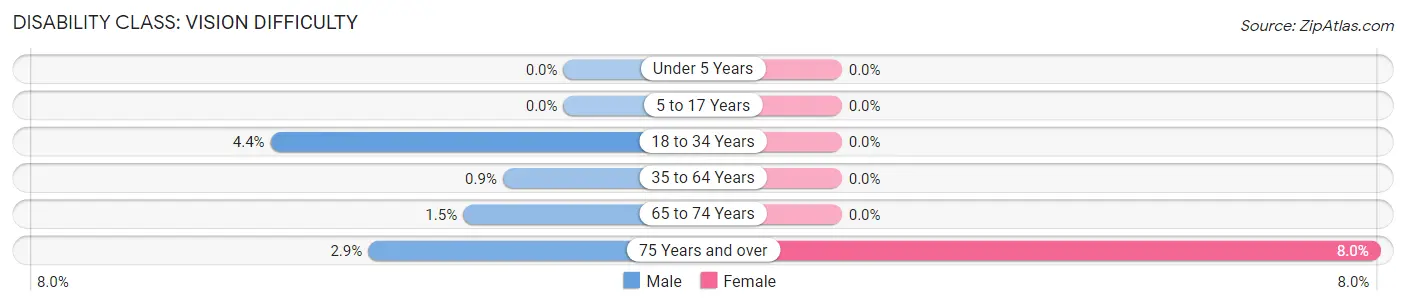
| Age Bracket | Male | Female |
| Under 5 Years | 0 (0.0%) | 0 (0.0%) |
| 5 to 17 Years | 0 (0.0%) | 0 (0.0%) |
| 18 to 34 Years | 4 (4.3%) | 0 (0.0%) |
| 35 to 64 Years | 2 (0.9%) | 0 (0.0%) |
| 65 to 74 Years | 1 (1.5%) | 0 (0.0%) |
| 75 Years and over | 2 (2.9%) | 12 (8.0%) |
Disability Class: Cognitive Difficulty
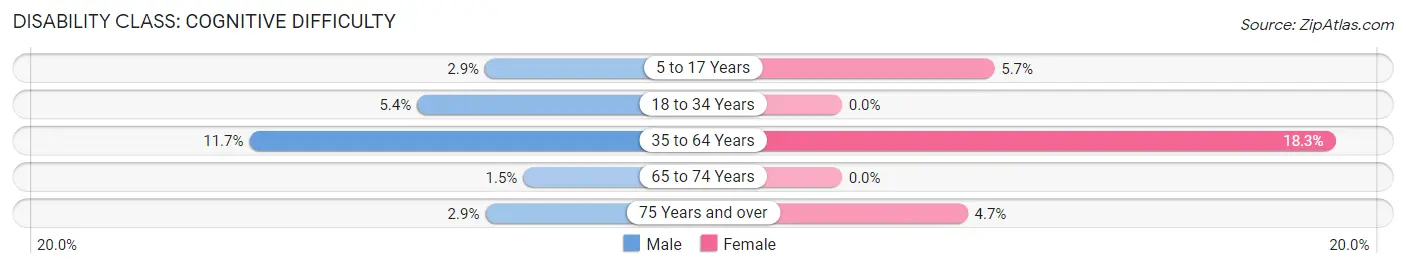
| Age Bracket | Male | Female |
| 5 to 17 Years | 3 (2.9%) | 6 (5.7%) |
| 18 to 34 Years | 5 (5.4%) | 0 (0.0%) |
| 35 to 64 Years | 26 (11.7%) | 37 (18.3%) |
| 65 to 74 Years | 1 (1.5%) | 0 (0.0%) |
| 75 Years and over | 2 (2.9%) | 7 (4.7%) |
Disability Class: Ambulatory Difficulty
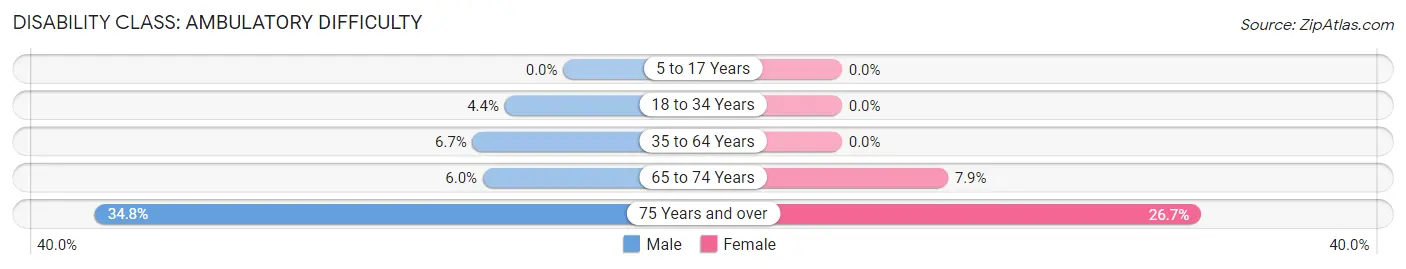
| Age Bracket | Male | Female |
| 5 to 17 Years | 0 (0.0%) | 0 (0.0%) |
| 18 to 34 Years | 4 (4.3%) | 0 (0.0%) |
| 35 to 64 Years | 15 (6.7%) | 0 (0.0%) |
| 65 to 74 Years | 4 (6.0%) | 7 (7.9%) |
| 75 Years and over | 24 (34.8%) | 40 (26.7%) |
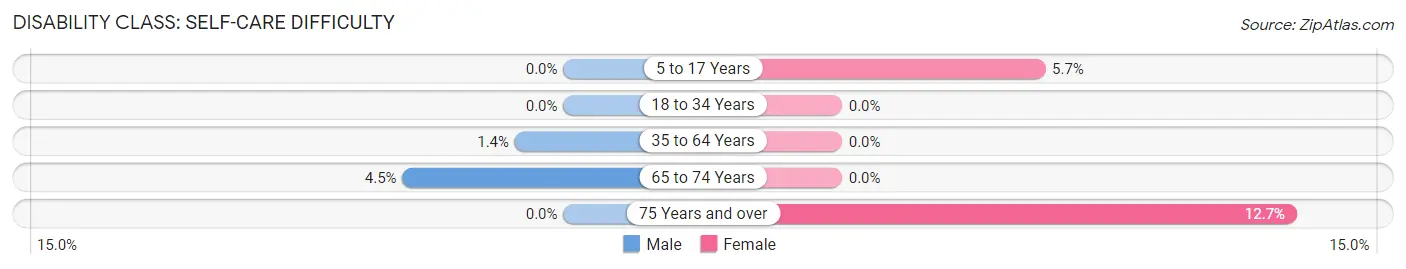
Disability Class: Self-Care Difficulty
| Age Bracket | Male | Female |
| 5 to 17 Years | 0 (0.0%) | 6 (5.7%) |
| 18 to 34 Years | 0 (0.0%) | 0 (0.0%) |
| 35 to 64 Years | 3 (1.3%) | 0 (0.0%) |
| 65 to 74 Years | 3 (4.5%) | 0 (0.0%) |
| 75 Years and over | 0 (0.0%) | 19 (12.7%) |
Technology Access in Wheaton
Computing Device Access in Wheaton
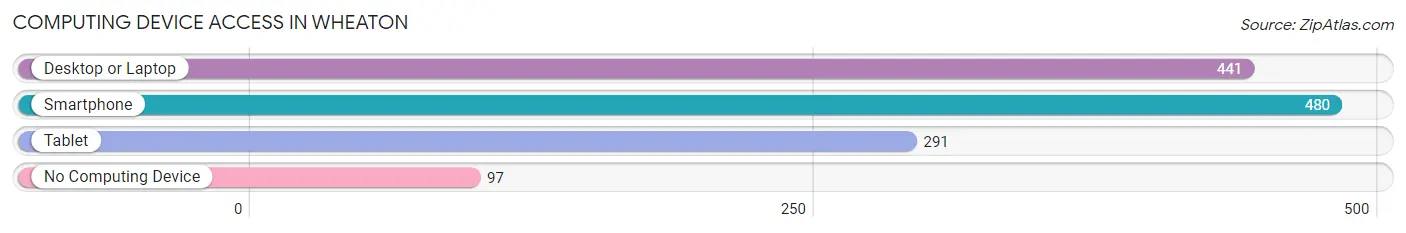
| Device Type | # Households | % Households |
| Desktop or Laptop | 441 | 67.3% |
| Smartphone | 480 | 73.3% |
| Tablet | 291 | 44.4% |
| No Computing Device | 97 | 14.8% |
| Total | 655 | 100.0% |
Internet Access in Wheaton
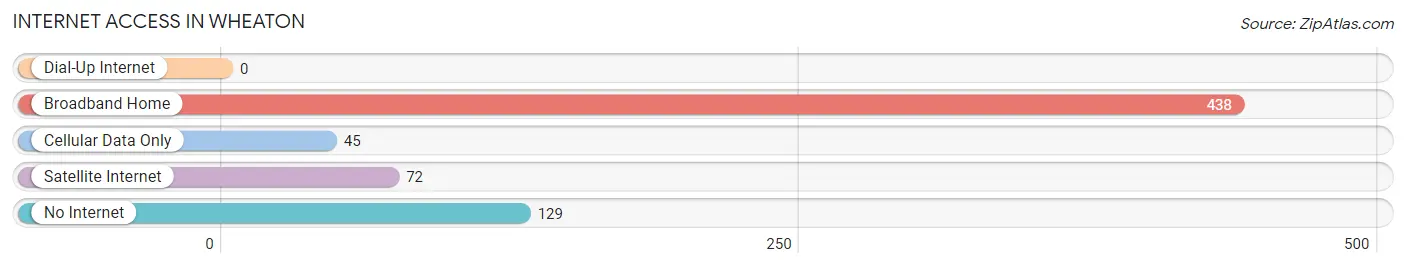
| Internet Type | # Households | % Households |
| Dial-Up Internet | 0 | 0.0% |
| Broadband Home | 438 | 66.9% |
| Cellular Data Only | 45 | 6.9% |
| Satellite Internet | 72 | 11.0% |
| No Internet | 129 | 19.7% |
| Total | 655 | 100.0% |
Wheaton Summary
History
Wheaton, Minnesota is a small city located in Traverse County in the western part of the state. It is situated on the banks of the Red River, which forms the border between Minnesota and North Dakota. The city was founded in 1881 by a group of settlers from Wheaton, Illinois, who were looking for a new home in the Midwest. The city was named after the Illinois town, and the first post office was established in 1882.
Wheaton has a rich history of industry and agriculture. In the late 19th century, the city was a major producer of wheat, and the surrounding area was home to many farms. The city also had a thriving lumber industry, and the first sawmill was built in 1883. In the early 20th century, the city was home to a number of factories, including a flour mill, a creamery, and a canning factory.
Wheaton was also home to a number of businesses, including a bank, a hotel, a newspaper, and a movie theater. The city was also home to a number of churches, including the First Presbyterian Church, which was founded in 1883.
Geography
Wheaton is located in Traverse County in the western part of Minnesota. It is situated on the banks of the Red River, which forms the border between Minnesota and North Dakota. The city is located about 40 miles west of Fargo, North Dakota, and about 90 miles east of Bismarck, North Dakota.
The city has a total area of 1.3 square miles, all of which is land. The terrain is mostly flat, with some rolling hills in the area. The climate is humid continental, with cold winters and hot summers.
Economy
Wheaton’s economy is largely based on agriculture and manufacturing. The city is home to a number of farms, which produce a variety of crops, including wheat, corn, soybeans, and hay. The city also has a number of manufacturing businesses, including a flour mill, a creamery, and a canning factory.
The city is also home to a number of retail businesses, including a grocery store, a hardware store, and a number of restaurants. The city also has a number of service businesses, including a bank, a hotel, and a newspaper.
Demographics
As of the 2010 census, the population of Wheaton was 1,845. The racial makeup of the city was 97.2% White, 0.7% African American, 0.3% Native American, 0.2% Asian, 0.1% Pacific Islander, 0.5% from other races, and 0.9% from two or more races. Hispanic or Latino of any race were 1.2% of the population.
The median household income in Wheaton was $41,250, and the median family income was $48,750. The per capita income was $19,945. About 11.2% of families and 14.2% of the population were below the poverty line, including 18.2% of those under age 18 and 8.3% of those age 65 or over.
Common Questions
What is Per Capita Income in Wheaton?
Per Capita income in Wheaton is $31,931.
What is the Median Family Income in Wheaton?
Median Family Income in Wheaton is $79,333.
What is the Median Household income in Wheaton?
Median Household Income in Wheaton is $49,727.
What is Income or Wage Gap in Wheaton?
Income or Wage Gap in Wheaton is 42.2%.
Women in Wheaton earn 57.8 cents for every dollar earned by a man.
What is Inequality or Gini Index in Wheaton?
Inequality or Gini Index in Wheaton is 0.44.
What is the Total Population of Wheaton?
Total Population of Wheaton is 1,341.
What is the Total Male Population of Wheaton?
Total Male Population of Wheaton is 610.
What is the Total Female Population of Wheaton?
Total Female Population of Wheaton is 731.
What is the Ratio of Males per 100 Females in Wheaton?
There are 83.45 Males per 100 Females in Wheaton.
What is the Ratio of Females per 100 Males in Wheaton?
There are 119.84 Females per 100 Males in Wheaton.
What is the Median Population Age in Wheaton?
Median Population Age in Wheaton is 45.2 Years.
What is the Average Family Size in Wheaton
Average Family Size in Wheaton is 3.0 People.
What is the Average Household Size in Wheaton
Average Household Size in Wheaton is 1.9 People.
How Large is the Labor Force in Wheaton?
There are 547 People in the Labor Forcein in Wheaton.
What is the Percentage of People in the Labor Force in Wheaton?
51.0% of People are in the Labor Force in Wheaton.
What is the Unemployment Rate in Wheaton?
Unemployment Rate in Wheaton is 3.5%.