Red Lake, MN Map & Demographics
Red Lake Map
Red Lake Overview
$16,934
PER CAPITA INCOME
$43,068
AVG FAMILY INCOME
$52,929
AVG HOUSEHOLD INCOME
2.4%
WAGE / INCOME GAP [ % ]
97.6¢/ $1
WAGE / INCOME GAP [ $ ]
0.38
INEQUALITY / GINI INDEX
1,435
TOTAL POPULATION
740
MALE POPULATION
695
FEMALE POPULATION
106.47
MALES / 100 FEMALES
93.92
FEMALES / 100 MALES
31.1
MEDIAN AGE
3.5
AVG FAMILY SIZE
2.8
AVG HOUSEHOLD SIZE
590
LABOR FORCE [ PEOPLE ]
60.5%
PERCENT IN LABOR FORCE
19.2%
UNEMPLOYMENT RATE
Income in Red Lake
Income Overview in Red Lake
Per Capita Income in Red Lake is $16,934, while median incomes of families and households are $43,068 and $52,929 respectively.
| Characteristic | Number | Measure |
| Per Capita Income | 1,435 | $16,934 |
| Median Family Income | 303 | $43,068 |
| Mean Family Income | 303 | $49,049 |
| Median Household Income | 484 | $52,929 |
| Mean Household Income | 484 | $49,336 |
| Income Deficit | 303 | $0 |
| Wage / Income Gap (%) | 1,435 | 2.40% |
| Wage / Income Gap ($) | 1,435 | 97.60¢ per $1 |
| Gini / Inequality Index | 1,435 | 0.38 |
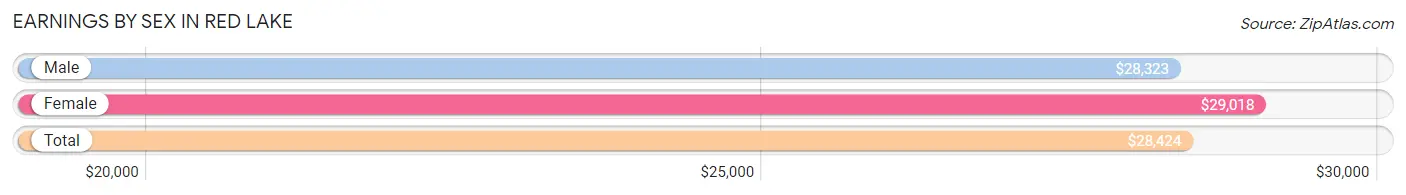
Earnings by Sex in Red Lake
Average Earnings in Red Lake are $28,424, $28,323 for men and $29,018 for women, a difference of 2.4%.
| Sex | Number | Average Earnings |
| Male | 344 (57.8%) | $28,323 |
| Female | 251 (42.2%) | $29,018 |
| Total | 595 (100.0%) | $28,424 |
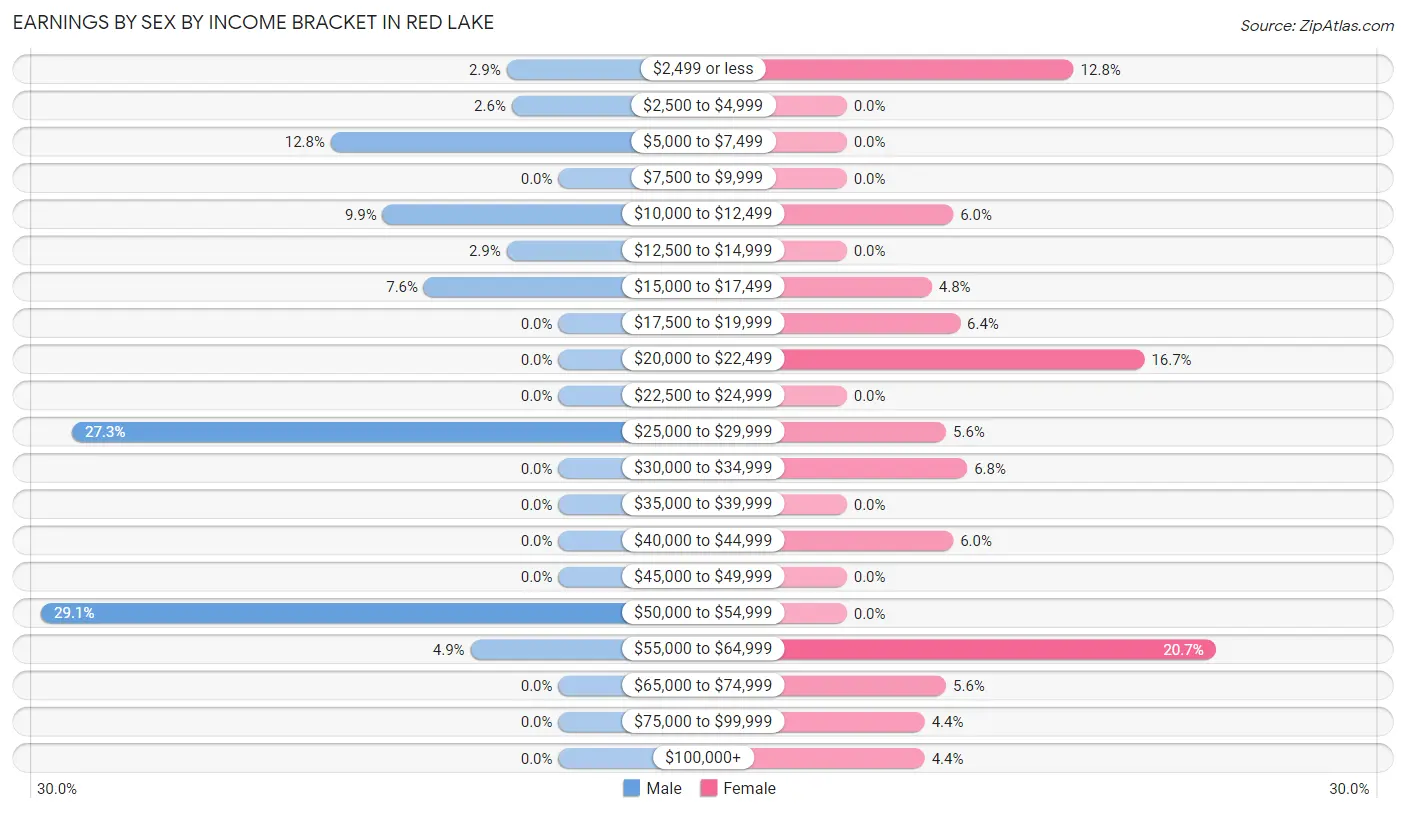
Earnings by Sex by Income Bracket in Red Lake
The most common earnings brackets in Red Lake are $50,000 to $54,999 for men (100 | 29.1%) and $55,000 to $64,999 for women (52 | 20.7%).
| Income | Male | Female |
| $2,499 or less | 10 (2.9%) | 32 (12.8%) |
| $2,500 to $4,999 | 9 (2.6%) | 0 (0.0%) |
| $5,000 to $7,499 | 44 (12.8%) | 0 (0.0%) |
| $7,500 to $9,999 | 0 (0.0%) | 0 (0.0%) |
| $10,000 to $12,499 | 34 (9.9%) | 15 (6.0%) |
| $12,500 to $14,999 | 10 (2.9%) | 0 (0.0%) |
| $15,000 to $17,499 | 26 (7.6%) | 12 (4.8%) |
| $17,500 to $19,999 | 0 (0.0%) | 16 (6.4%) |
| $20,000 to $22,499 | 0 (0.0%) | 42 (16.7%) |
| $22,500 to $24,999 | 0 (0.0%) | 0 (0.0%) |
| $25,000 to $29,999 | 94 (27.3%) | 14 (5.6%) |
| $30,000 to $34,999 | 0 (0.0%) | 17 (6.8%) |
| $35,000 to $39,999 | 0 (0.0%) | 0 (0.0%) |
| $40,000 to $44,999 | 0 (0.0%) | 15 (6.0%) |
| $45,000 to $49,999 | 0 (0.0%) | 0 (0.0%) |
| $50,000 to $54,999 | 100 (29.1%) | 0 (0.0%) |
| $55,000 to $64,999 | 17 (4.9%) | 52 (20.7%) |
| $65,000 to $74,999 | 0 (0.0%) | 14 (5.6%) |
| $75,000 to $99,999 | 0 (0.0%) | 11 (4.4%) |
| $100,000+ | 0 (0.0%) | 11 (4.4%) |
| Total | 344 (100.0%) | 251 (100.0%) |
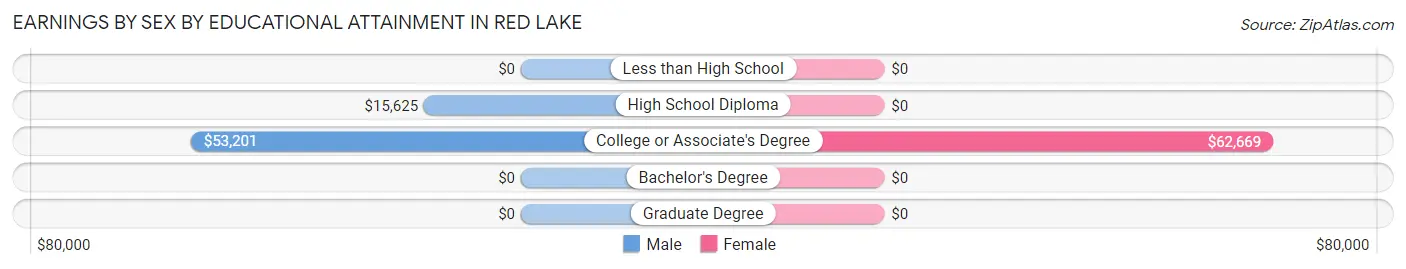
Earnings by Sex by Educational Attainment in Red Lake
Average earnings in Red Lake are $29,284 for men and $32,868 for women, a difference of 10.9%. Men with an educational attainment of college or associate's degree enjoy the highest average annual earnings of $53,201, while those with high school diploma education earn the least with $15,625. Women with an educational attainment of college or associate's degree earn the most with the average annual earnings of $62,669, while those with college or associate's degree education have the smallest earnings of $62,669.
| Educational Attainment | Male Income | Female Income |
| Less than High School | - | - |
| High School Diploma | $15,625 | $0 |
| College or Associate's Degree | $53,201 | $62,669 |
| Bachelor's Degree | - | - |
| Graduate Degree | - | - |
| Total | $29,284 | $32,868 |
Family Income in Red Lake
Family Income Brackets in Red Lake
According to the Red Lake family income data, there are 68 families falling into the $50,000 to $74,999 income range, which is the most common income bracket and makes up 22.4% of all families.
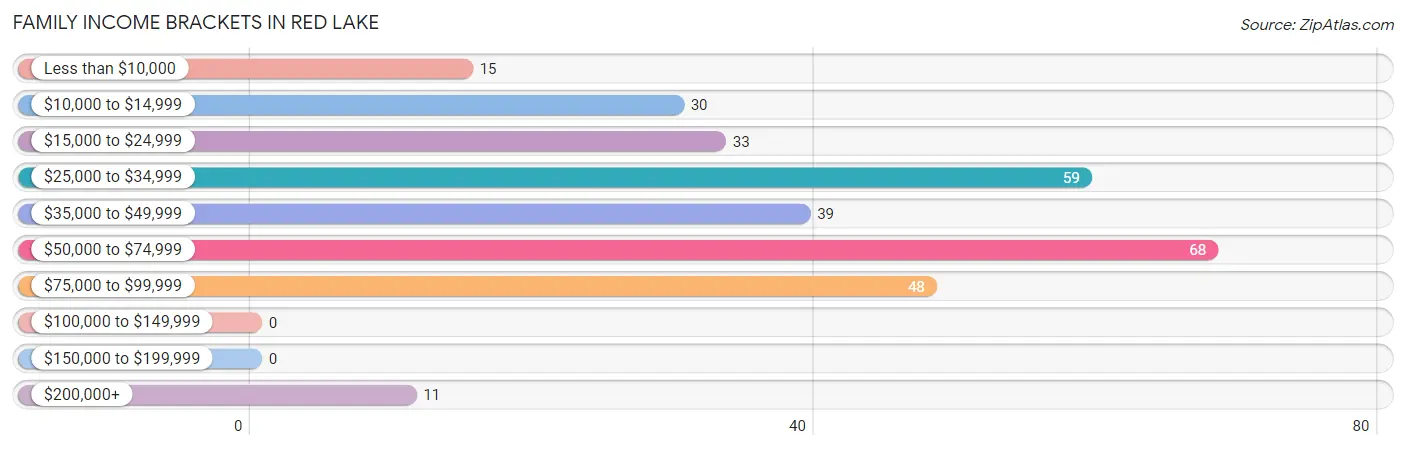
| Income Bracket | # Families | % Families |
| Less than $10,000 | 15 | 5.0% |
| $10,000 to $14,999 | 30 | 9.9% |
| $15,000 to $24,999 | 33 | 10.9% |
| $25,000 to $34,999 | 59 | 19.5% |
| $35,000 to $49,999 | 39 | 12.9% |
| $50,000 to $74,999 | 68 | 22.4% |
| $75,000 to $99,999 | 48 | 15.8% |
| $100,000 to $149,999 | 0 | 0.0% |
| $150,000 to $199,999 | 0 | 0.0% |
| $200,000+ | 11 | 3.6% |
Family Income by Famaliy Size in Red Lake
5-person families (62 | 20.5%) account for the highest median family income in Red Lake with $75,938 per family, while 5-person families (62 | 20.5%) have the highest median income of $15,188 per family member.
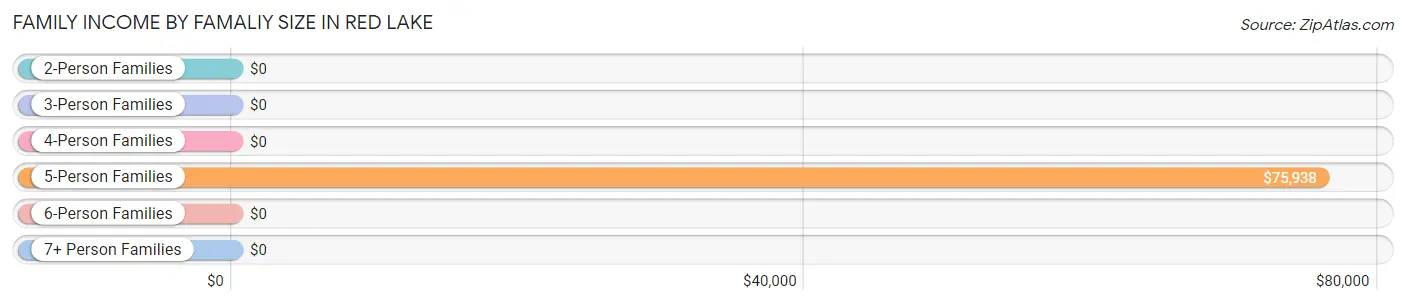
| Income Bracket | # Families | Median Income |
| 2-Person Families | 105 (34.6%) | $0 |
| 3-Person Families | 79 (26.1%) | $0 |
| 4-Person Families | 25 (8.3%) | $0 |
| 5-Person Families | 62 (20.5%) | $75,938 |
| 6-Person Families | 15 (5.0%) | $0 |
| 7+ Person Families | 17 (5.6%) | $0 |
| Total | 303 (100.0%) | $43,068 |
Family Income by Number of Earners in Red Lake
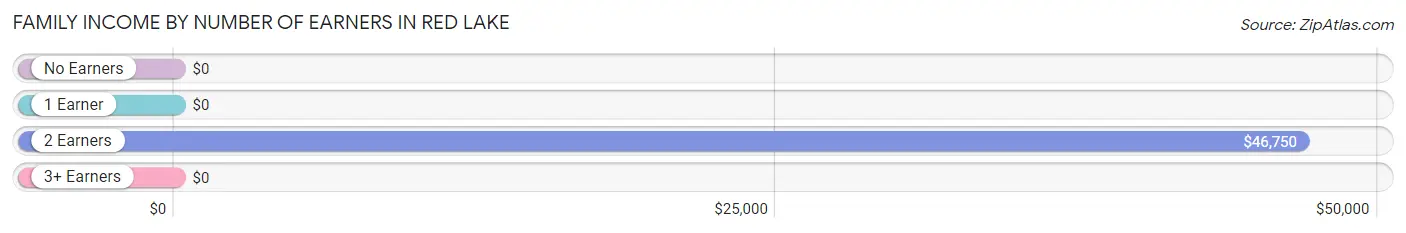
| Number of Earners | # Families | Median Income |
| No Earners | 22 (7.3%) | $0 |
| 1 Earner | 166 (54.8%) | $0 |
| 2 Earners | 101 (33.3%) | $46,750 |
| 3+ Earners | 14 (4.6%) | $0 |
| Total | 303 (100.0%) | $43,068 |
Household Income in Red Lake
Household Income Brackets in Red Lake
With 187 households falling in the category, the $50,000 to $74,999 income range is the most frequent in Red Lake, accounting for 38.6% of all households.
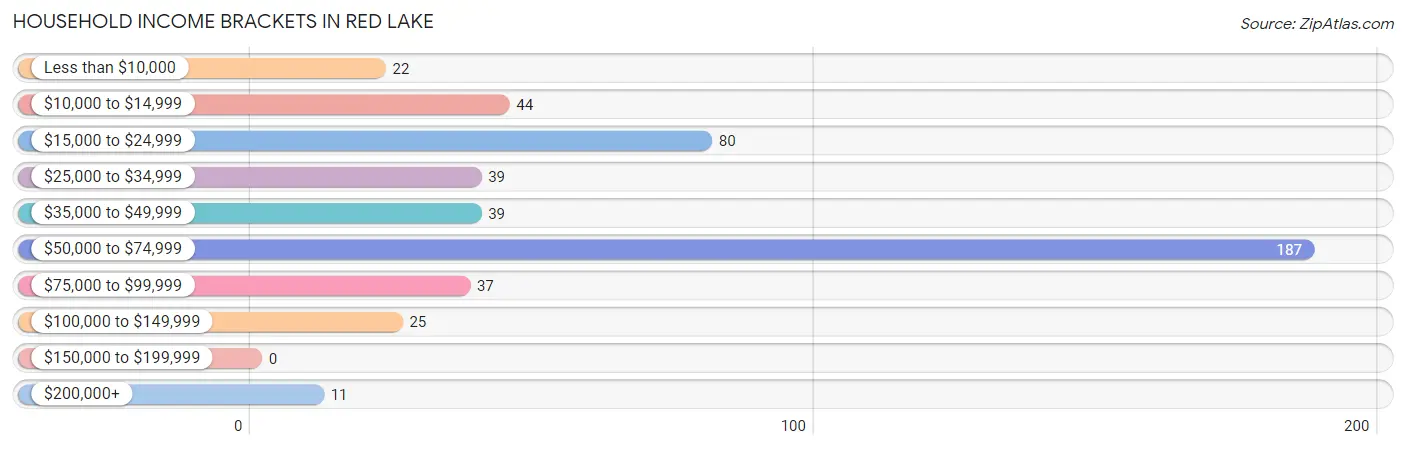
| Income Bracket | # Households | % Households |
| Less than $10,000 | 22 | 4.5% |
| $10,000 to $14,999 | 44 | 9.1% |
| $15,000 to $24,999 | 80 | 16.5% |
| $25,000 to $34,999 | 39 | 8.1% |
| $35,000 to $49,999 | 39 | 8.1% |
| $50,000 to $74,999 | 187 | 38.6% |
| $75,000 to $99,999 | 37 | 7.6% |
| $100,000 to $149,999 | 25 | 5.2% |
| $150,000 to $199,999 | 0 | 0.0% |
| $200,000+ | 11 | 2.3% |
Household Income by Householder Age in Red Lake
The median household income in Red Lake is $52,929, with the highest median household income of $53,286 found in the 25 to 44 years age bracket for the primary householder. A total of 260 households (53.7%) fall into this category.
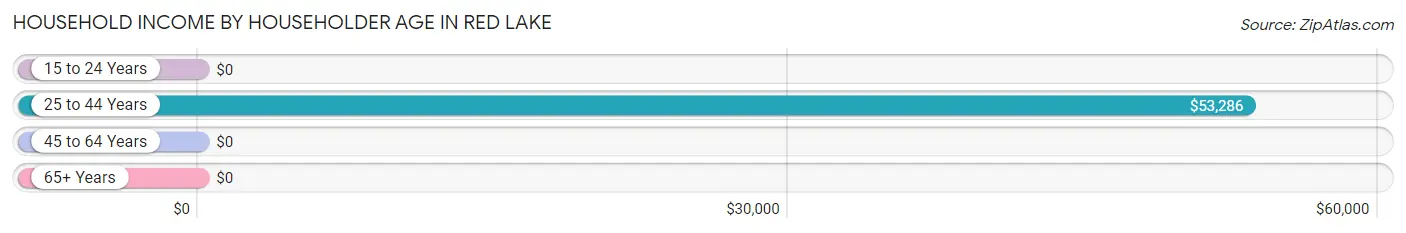
| Income Bracket | # Households | Median Income |
| 15 to 24 Years | 0 (0.0%) | $0 |
| 25 to 44 Years | 260 (53.7%) | $53,286 |
| 45 to 64 Years | 191 (39.5%) | $0 |
| 65+ Years | 33 (6.8%) | $0 |
| Total | 484 (100.0%) | $52,929 |
Poverty in Red Lake
Income Below Poverty by Sex and Age in Red Lake
With 23.7% poverty level for males and 32.0% for females among the residents of Red Lake, 12 to 14 year old males and 15 year old females are the most vulnerable to poverty, with 13 males (100.0%) and 23 females (100.0%) in their respective age groups living below the poverty level.
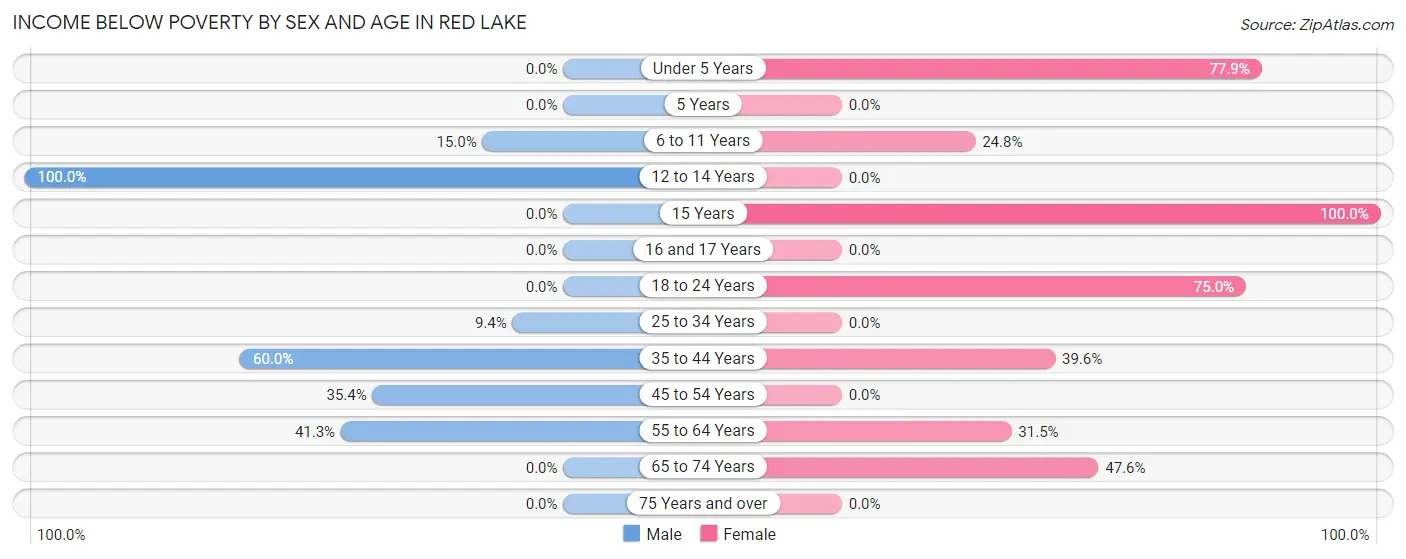
| Age Bracket | Male | Female |
| Under 5 Years | 0 (0.0%) | 60 (77.9%) |
| 5 Years | 0 (0.0%) | 0 (0.0%) |
| 6 to 11 Years | 18 (15.0%) | 27 (24.8%) |
| 12 to 14 Years | 13 (100.0%) | 0 (0.0%) |
| 15 Years | 0 (0.0%) | 23 (100.0%) |
| 16 and 17 Years | 0 (0.0%) | 0 (0.0%) |
| 18 to 24 Years | 0 (0.0%) | 12 (75.0%) |
| 25 to 34 Years | 13 (9.4%) | 0 (0.0%) |
| 35 to 44 Years | 51 (60.0%) | 57 (39.6%) |
| 45 to 54 Years | 34 (35.4%) | 0 (0.0%) |
| 55 to 64 Years | 45 (41.3%) | 17 (31.5%) |
| 65 to 74 Years | 0 (0.0%) | 10 (47.6%) |
| 75 Years and over | 0 (0.0%) | 0 (0.0%) |
| Total | 174 (23.7%) | 206 (32.0%) |
Income Above Poverty by Sex and Age in Red Lake
According to the poverty statistics in Red Lake, males aged under 5 years and females aged 12 to 14 years are the age groups that are most secure financially, with 100.0% of males and 100.0% of females in these age groups living above the poverty line.
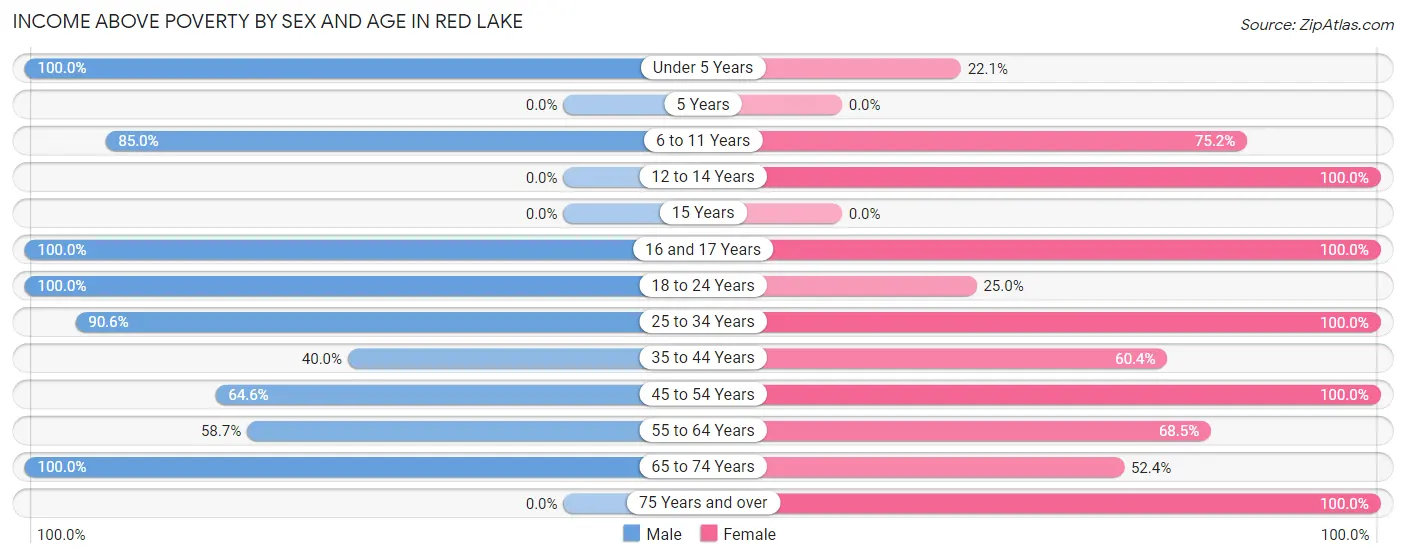
| Age Bracket | Male | Female |
| Under 5 Years | 58 (100.0%) | 17 (22.1%) |
| 5 Years | 0 (0.0%) | 0 (0.0%) |
| 6 to 11 Years | 102 (85.0%) | 82 (75.2%) |
| 12 to 14 Years | 0 (0.0%) | 58 (100.0%) |
| 15 Years | 0 (0.0%) | 0 (0.0%) |
| 16 and 17 Years | 41 (100.0%) | 58 (100.0%) |
| 18 to 24 Years | 64 (100.0%) | 4 (25.0%) |
| 25 to 34 Years | 125 (90.6%) | 42 (100.0%) |
| 35 to 44 Years | 34 (40.0%) | 87 (60.4%) |
| 45 to 54 Years | 62 (64.6%) | 40 (100.0%) |
| 55 to 64 Years | 64 (58.7%) | 37 (68.5%) |
| 65 to 74 Years | 11 (100.0%) | 11 (52.4%) |
| 75 Years and over | 0 (0.0%) | 1 (100.0%) |
| Total | 561 (76.3%) | 437 (68.0%) |
Income Below Poverty Among Married-Couple Families in Red Lake

| Children | Above Poverty | Below Poverty |
| No Children | 0 (0.0%) | 0 (0.0%) |
| 1 or 2 Children | 0 (0.0%) | 0 (0.0%) |
| 3 or 4 Children | 21 (100.0%) | 0 (0.0%) |
| 5 or more Children | 0 (0.0%) | 0 (0.0%) |
| Total | 21 (100.0%) | 0 (0.0%) |
Income Below Poverty Among Single-Parent Households in Red Lake
According to the poverty data in Red Lake, 43.9% or 25 single-father households and 23.6% or 53 single-mother households are living below the poverty line. Among single-father households, those with 3 or 4 children have the highest poverty rate, with 9 households (100.0%) experiencing poverty. Likewise, among single-mother households, those with 3 or 4 children have the highest poverty rate, with 17 households (38.6%) falling below the poverty line.
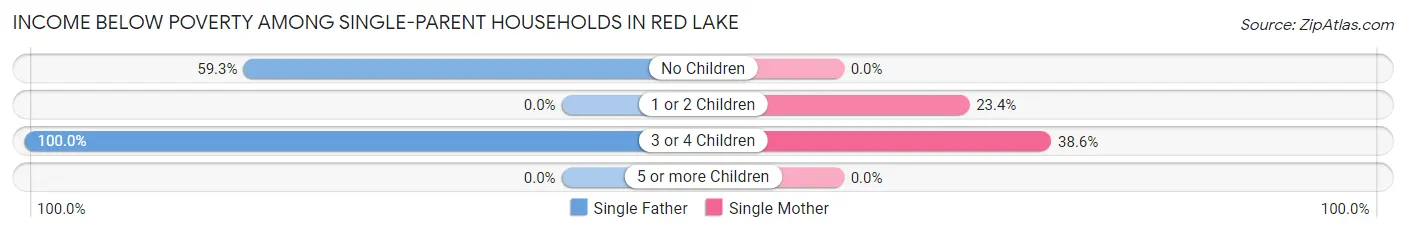
| Children | Single Father | Single Mother |
| No Children | 16 (59.3%) | 0 (0.0%) |
| 1 or 2 Children | 0 (0.0%) | 36 (23.4%) |
| 3 or 4 Children | 9 (100.0%) | 17 (38.6%) |
| 5 or more Children | 0 (0.0%) | 0 (0.0%) |
| Total | 25 (43.9%) | 53 (23.6%) |
Income Below Poverty Among Married-Couple vs Single-Parent Households in Red Lake
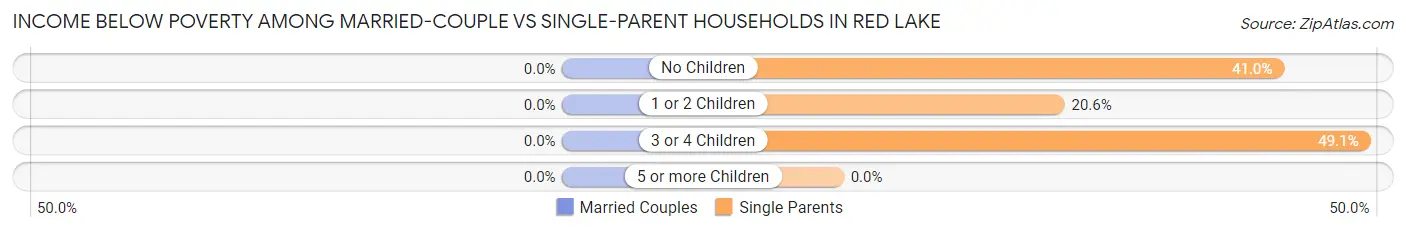
| Children | Married-Couple Families | Single-Parent Households |
| No Children | 0 (0.0%) | 16 (41.0%) |
| 1 or 2 Children | 0 (0.0%) | 36 (20.6%) |
| 3 or 4 Children | 0 (0.0%) | 26 (49.1%) |
| 5 or more Children | 0 (0.0%) | 0 (0.0%) |
| Total | 0 (0.0%) | 78 (27.7%) |
Race in Red Lake
The most populous races in Red Lake are Native / Alaskan (1,282 | 89.3%), Two or more Races (87 | 6.1%), and White / Caucasian (56 | 3.9%).
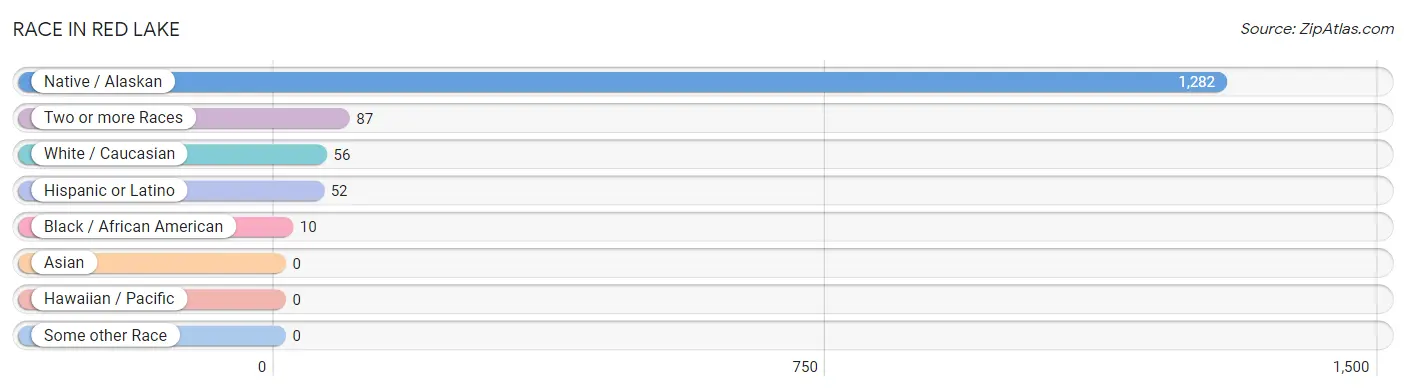
| Race | # Population | % Population |
| Asian | 0 | 0.0% |
| Black / African American | 10 | 0.7% |
| Hawaiian / Pacific | 0 | 0.0% |
| Hispanic or Latino | 52 | 3.6% |
| Native / Alaskan | 1,282 | 89.3% |
| White / Caucasian | 56 | 3.9% |
| Two or more Races | 87 | 6.1% |
| Some other Race | 0 | 0.0% |
| Total | 1,435 | 100.0% |
Ancestry in Red Lake
The most populous ancestries reported in Red Lake are Chippewa (1,328 | 92.5%), Mexican (52 | 3.6%), German (48 | 3.3%), Sioux (10 | 0.7%), and French (9 | 0.6%), together accounting for 100.8% of all Red Lake residents.
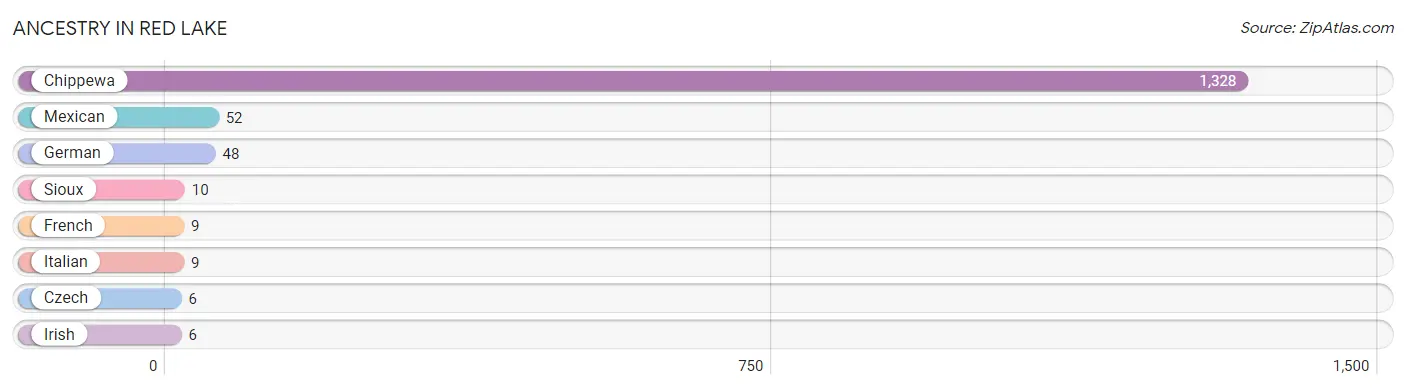
| Ancestry | # Population | % Population |
| Chippewa | 1,328 | 92.5% |
| Czech | 6 | 0.4% |
| French | 9 | 0.6% |
| German | 48 | 3.3% |
| Irish | 6 | 0.4% |
| Italian | 9 | 0.6% |
| Mexican | 52 | 3.6% |
| Sioux | 10 | 0.7% | View All 8 Rows |
Immigrants in Red Lake

| Immigration Origin | # Population | % Population | View All 0 Rows |
Sex and Age in Red Lake
Sex and Age in Red Lake
The most populous age groups in Red Lake are 30 to 34 Years (125 | 16.9%) for men and 10 to 14 Years (96 | 13.8%) for women.
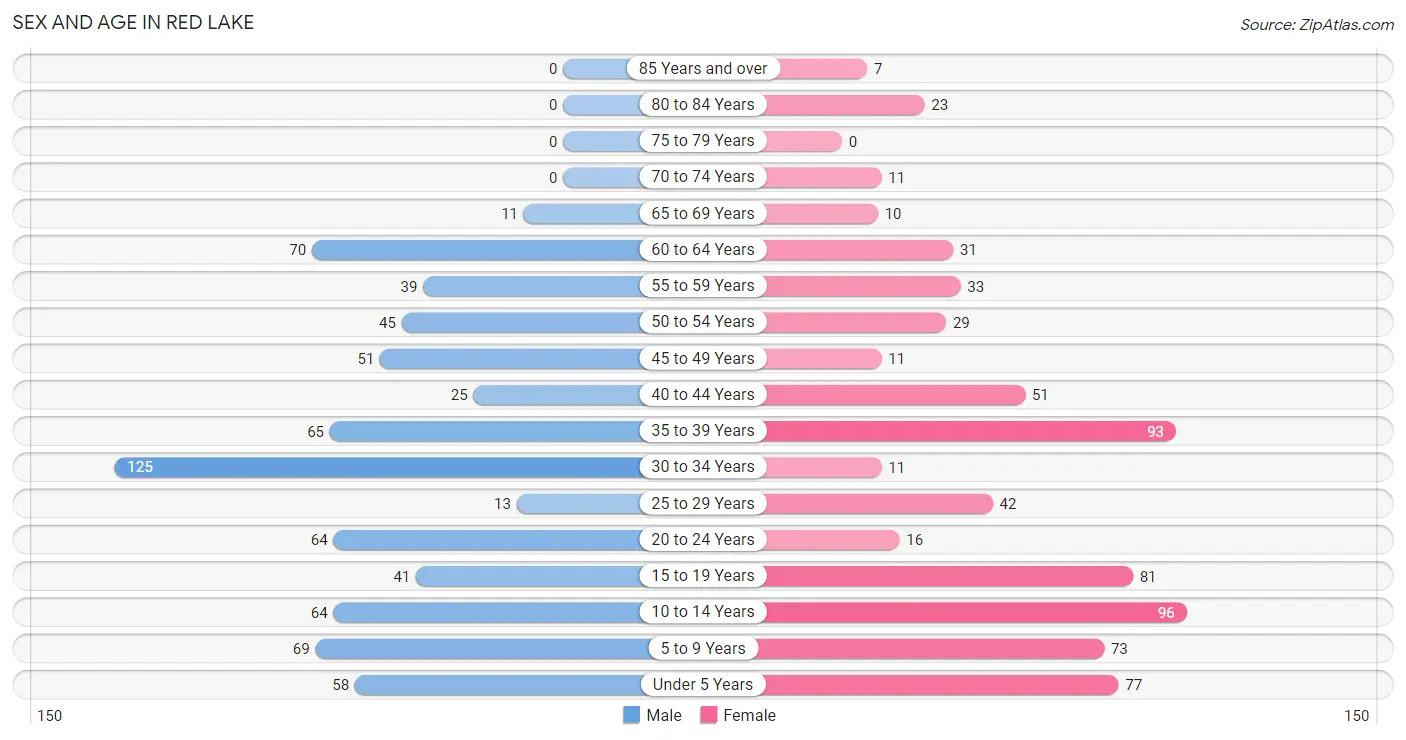
| Age Bracket | Male | Female |
| Under 5 Years | 58 (7.8%) | 77 (11.1%) |
| 5 to 9 Years | 69 (9.3%) | 73 (10.5%) |
| 10 to 14 Years | 64 (8.6%) | 96 (13.8%) |
| 15 to 19 Years | 41 (5.5%) | 81 (11.7%) |
| 20 to 24 Years | 64 (8.6%) | 16 (2.3%) |
| 25 to 29 Years | 13 (1.8%) | 42 (6.0%) |
| 30 to 34 Years | 125 (16.9%) | 11 (1.6%) |
| 35 to 39 Years | 65 (8.8%) | 93 (13.4%) |
| 40 to 44 Years | 25 (3.4%) | 51 (7.3%) |
| 45 to 49 Years | 51 (6.9%) | 11 (1.6%) |
| 50 to 54 Years | 45 (6.1%) | 29 (4.2%) |
| 55 to 59 Years | 39 (5.3%) | 33 (4.8%) |
| 60 to 64 Years | 70 (9.5%) | 31 (4.5%) |
| 65 to 69 Years | 11 (1.5%) | 10 (1.4%) |
| 70 to 74 Years | 0 (0.0%) | 11 (1.6%) |
| 75 to 79 Years | 0 (0.0%) | 0 (0.0%) |
| 80 to 84 Years | 0 (0.0%) | 23 (3.3%) |
| 85 Years and over | 0 (0.0%) | 7 (1.0%) |
| Total | 740 (100.0%) | 695 (100.0%) |
Families and Households in Red Lake
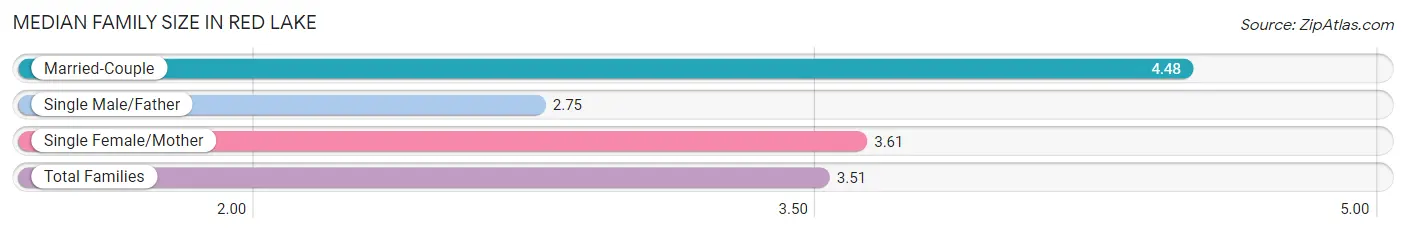
Median Family Size in Red Lake
The median family size in Red Lake is 3.51 persons per family, with married-couple families (21 | 6.9%) accounting for the largest median family size of 4.48 persons per family. On the other hand, single male/father families (57 | 18.8%) represent the smallest median family size with 2.75 persons per family.
| Family Type | # Families | Family Size |
| Married-Couple | 21 (6.9%) | 4.48 |
| Single Male/Father | 57 (18.8%) | 2.75 |
| Single Female/Mother | 225 (74.3%) | 3.61 |
| Total Families | 303 (100.0%) | 3.51 |
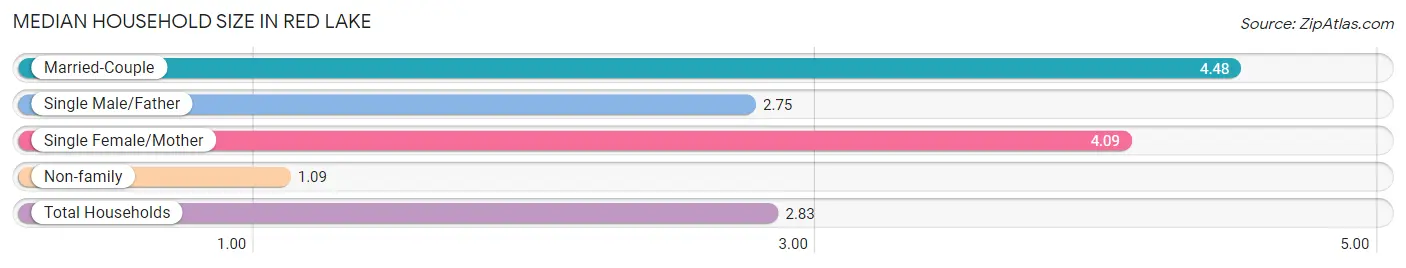
Median Household Size in Red Lake
The median household size in Red Lake is 2.83 persons per household, with married-couple households (21 | 4.3%) accounting for the largest median household size of 4.48 persons per household. non-family households (181 | 37.4%) represent the smallest median household size with 1.09 persons per household.
| Household Type | # Households | Household Size |
| Married-Couple | 21 (4.3%) | 4.48 |
| Single Male/Father | 57 (11.8%) | 2.75 |
| Single Female/Mother | 225 (46.5%) | 4.09 |
| Non-family | 181 (37.4%) | 1.09 |
| Total Households | 484 (100.0%) | 2.83 |
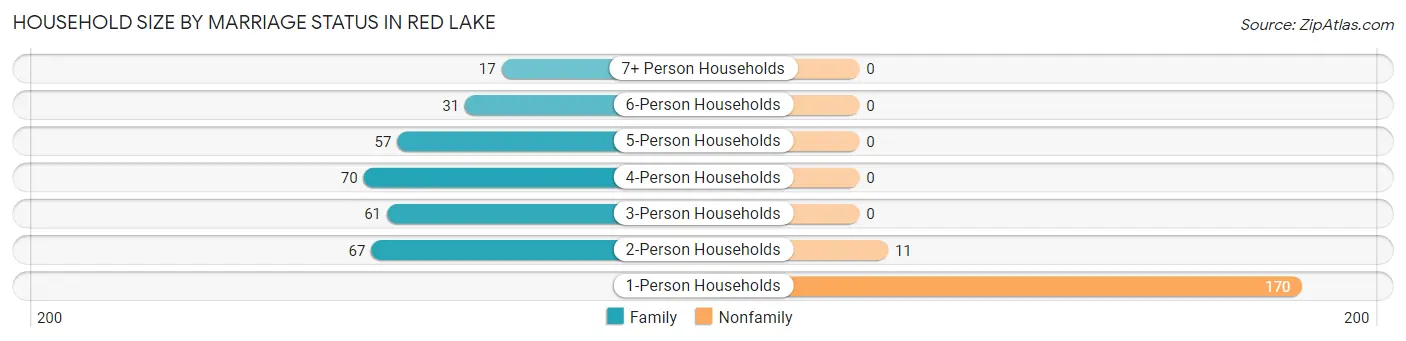
Household Size by Marriage Status in Red Lake
Out of a total of 484 households in Red Lake, 303 (62.6%) are family households, while 181 (37.4%) are nonfamily households. The most numerous type of family households are 4-person households, comprising 70, and the most common type of nonfamily households are 1-person households, comprising 170.
| Household Size | Family Households | Nonfamily Households |
| 1-Person Households | - | 170 (35.1%) |
| 2-Person Households | 67 (13.8%) | 11 (2.3%) |
| 3-Person Households | 61 (12.6%) | 0 (0.0%) |
| 4-Person Households | 70 (14.5%) | 0 (0.0%) |
| 5-Person Households | 57 (11.8%) | 0 (0.0%) |
| 6-Person Households | 31 (6.4%) | 0 (0.0%) |
| 7+ Person Households | 17 (3.5%) | 0 (0.0%) |
| Total | 303 (62.6%) | 181 (37.4%) |
Female Fertility in Red Lake
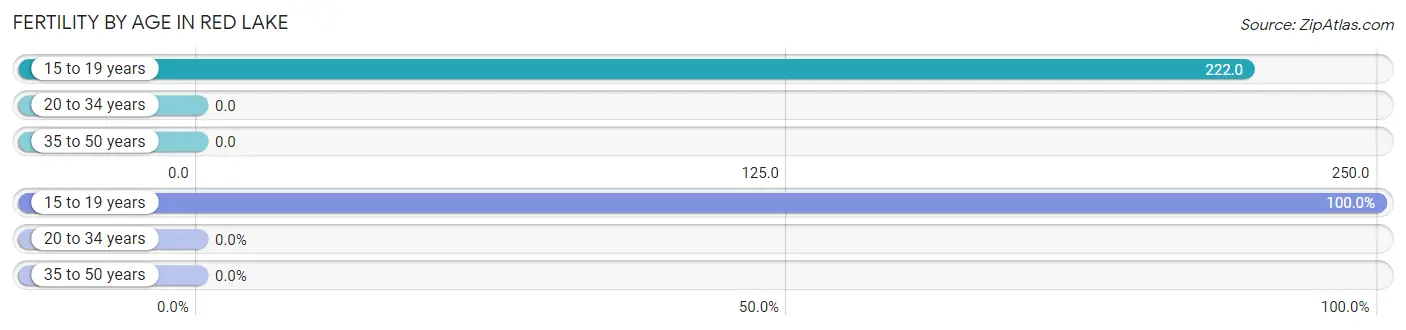
Fertility by Age in Red Lake
Average fertility rate in Red Lake is 59.0 births per 1,000 women. Women in the age bracket of 15 to 19 years have the highest fertility rate with 222.0 births per 1,000 women. Women in the age bracket of 15 to 19 years acount for 100.0% of all women with births.
| Age Bracket | Women with Births | Births / 1,000 Women |
| 15 to 19 years | 18 (100.0%) | 222.0 |
| 20 to 34 years | 0 (0.0%) | 0.0 |
| 35 to 50 years | 0 (0.0%) | 0.0 |
| Total | 18 (100.0%) | 59.0 |
Fertility by Age by Marriage Status in Red Lake
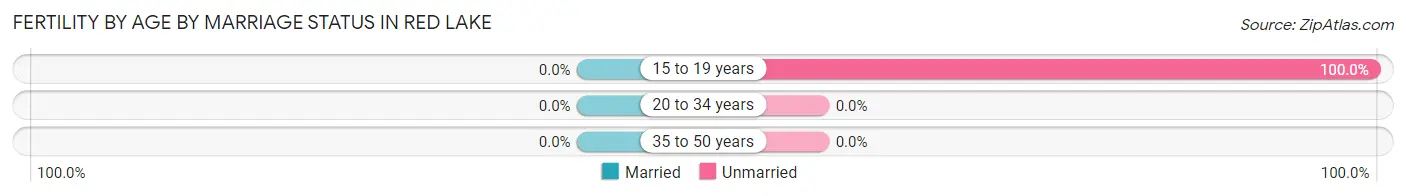
| Age Bracket | Married | Unmarried |
| 15 to 19 years | 0 (0.0%) | 18 (100.0%) |
| 20 to 34 years | 0 (0.0%) | 0 (0.0%) |
| 35 to 50 years | 0 (0.0%) | 0 (0.0%) |
| Total | 0 (0.0%) | 18 (100.0%) |
Fertility by Education in Red Lake
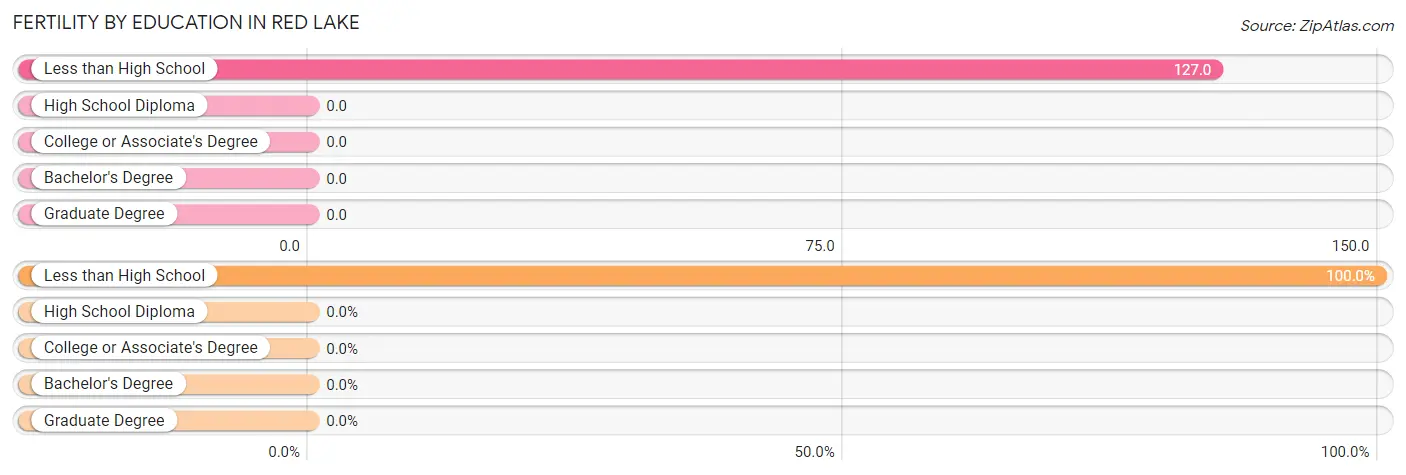
| Educational Attainment | Women with Births | Births / 1,000 Women |
| Less than High School | 18 (100.0%) | 127.0 |
| High School Diploma | 0 (0.0%) | 0.0 |
| College or Associate's Degree | 0 (0.0%) | 0.0 |
| Bachelor's Degree | 0 (0.0%) | 0.0 |
| Graduate Degree | 0 (0.0%) | 0.0 |
| Total | 18 (100.0%) | 59.0 |
Fertility by Education by Marriage Status in Red Lake
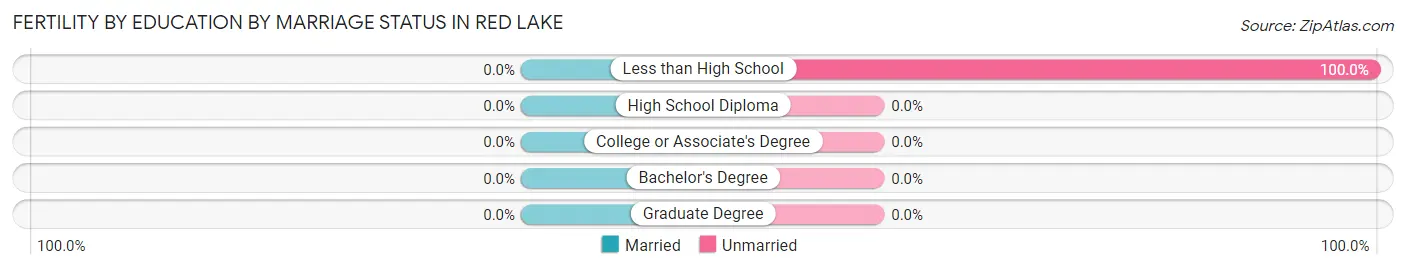
| Educational Attainment | Married | Unmarried |
| Less than High School | 0 (0.0%) | 18 (100.0%) |
| High School Diploma | 0 (0.0%) | 0 (0.0%) |
| College or Associate's Degree | 0 (0.0%) | 0 (0.0%) |
| Bachelor's Degree | 0 (0.0%) | 0 (0.0%) |
| Graduate Degree | 0 (0.0%) | 0 (0.0%) |
| Total | 0 (0.0%) | 18 (100.0%) |
Employment Characteristics in Red Lake
Employment by Class of Employer in Red Lake
Among the 461 employed individuals in Red Lake, local government employees (248 | 53.8%), private company employees (116 | 25.2%), and federal government employees (32 | 6.9%) make up the most common classes of employment.
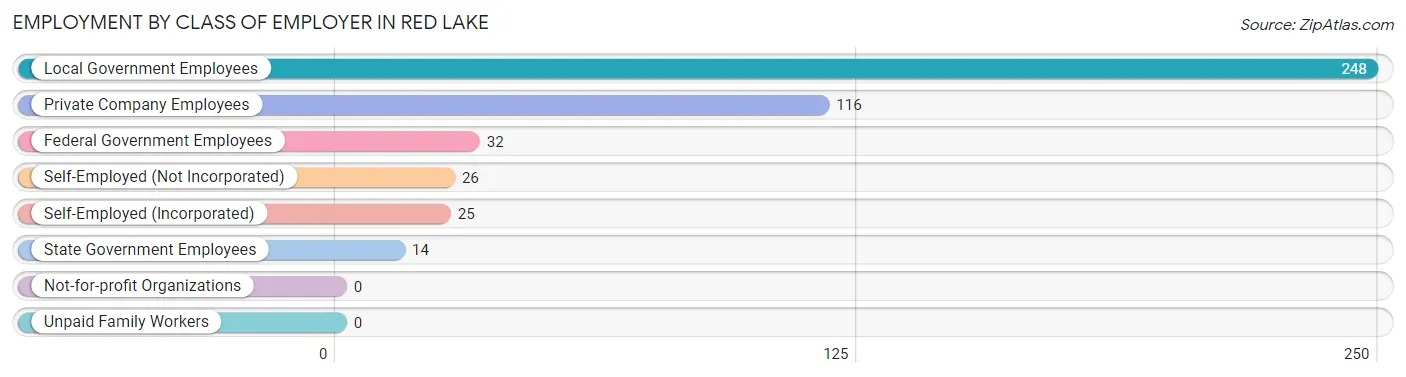
| Employer Class | # Employees | % Employees |
| Private Company Employees | 116 | 25.2% |
| Self-Employed (Incorporated) | 25 | 5.4% |
| Self-Employed (Not Incorporated) | 26 | 5.6% |
| Not-for-profit Organizations | 0 | 0.0% |
| Local Government Employees | 248 | 53.8% |
| State Government Employees | 14 | 3.0% |
| Federal Government Employees | 32 | 6.9% |
| Unpaid Family Workers | 0 | 0.0% |
| Total | 461 | 100.0% |
Employment Status by Age in Red Lake
According to the labor force statistics for Red Lake, out of the total population over 16 years of age (975), 60.5% or 590 individuals are in the labor force, with 19.2% or 113 of them unemployed. The age group with the highest labor force participation rate is 45 to 54 years, with 86.8% or 118 individuals in the labor force. Within the labor force, the 20 to 24 years age range has the highest percentage of unemployed individuals, with 74.6% or 47 of them being unemployed.
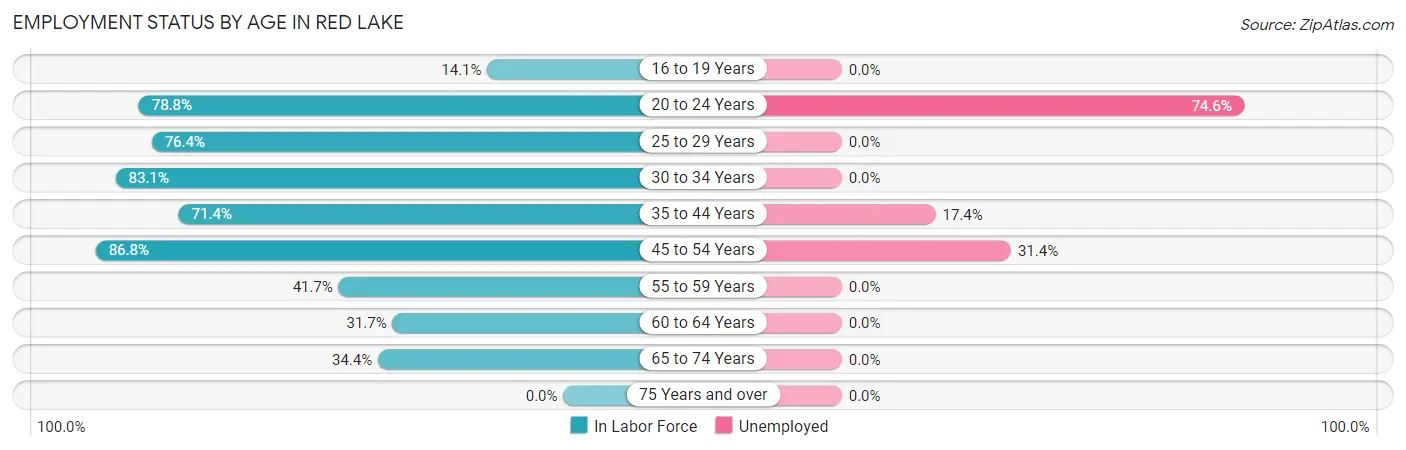
| Age Bracket | In Labor Force | Unemployed |
| 16 to 19 Years | 14 (14.1%) | 0 (0.0%) |
| 20 to 24 Years | 63 (78.8%) | 47 (74.6%) |
| 25 to 29 Years | 42 (76.4%) | 0 (0.0%) |
| 30 to 34 Years | 113 (83.1%) | 0 (0.0%) |
| 35 to 44 Years | 167 (71.4%) | 29 (17.4%) |
| 45 to 54 Years | 118 (86.8%) | 37 (31.4%) |
| 55 to 59 Years | 30 (41.7%) | 0 (0.0%) |
| 60 to 64 Years | 32 (31.7%) | 0 (0.0%) |
| 65 to 74 Years | 11 (34.4%) | 0 (0.0%) |
| 75 Years and over | 0 (0.0%) | 0 (0.0%) |
| Total | 590 (60.5%) | 113 (19.2%) |
Employment Status by Educational Attainment in Red Lake
According to labor force statistics for Red Lake, 68.4% of individuals (502) out of the total population between 25 and 64 years of age (734) are in the labor force, with 13.1% or 66 of them being unemployed. The group with the highest labor force participation rate are those with the educational attainment of college / associate degree, with 73.7% or 277 individuals in the labor force. Within the labor force, individuals with less than high school education have the highest percentage of unemployment, with 26.0% or 20 of them being unemployed.
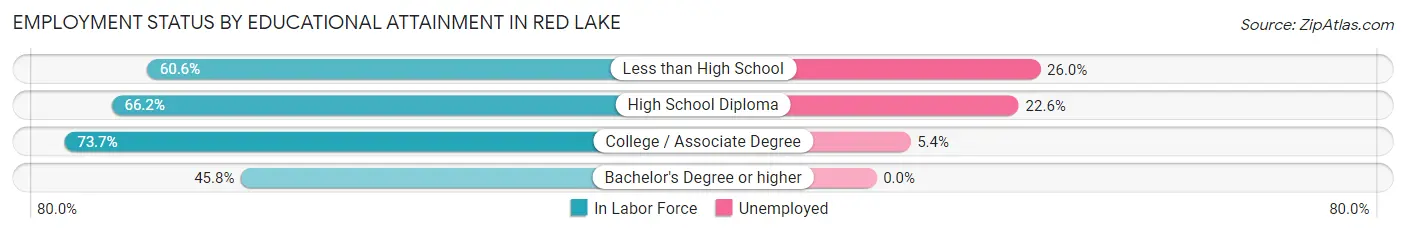
| Educational Attainment | In Labor Force | Unemployed |
| Less than High School | 77 (60.6%) | 33 (26.0%) |
| High School Diploma | 137 (66.2%) | 47 (22.6%) |
| College / Associate Degree | 277 (73.7%) | 20 (5.4%) |
| Bachelor's Degree or higher | 11 (45.8%) | 0 (0.0%) |
| Total | 502 (68.4%) | 96 (13.1%) |
Employment Occupations by Sex in Red Lake
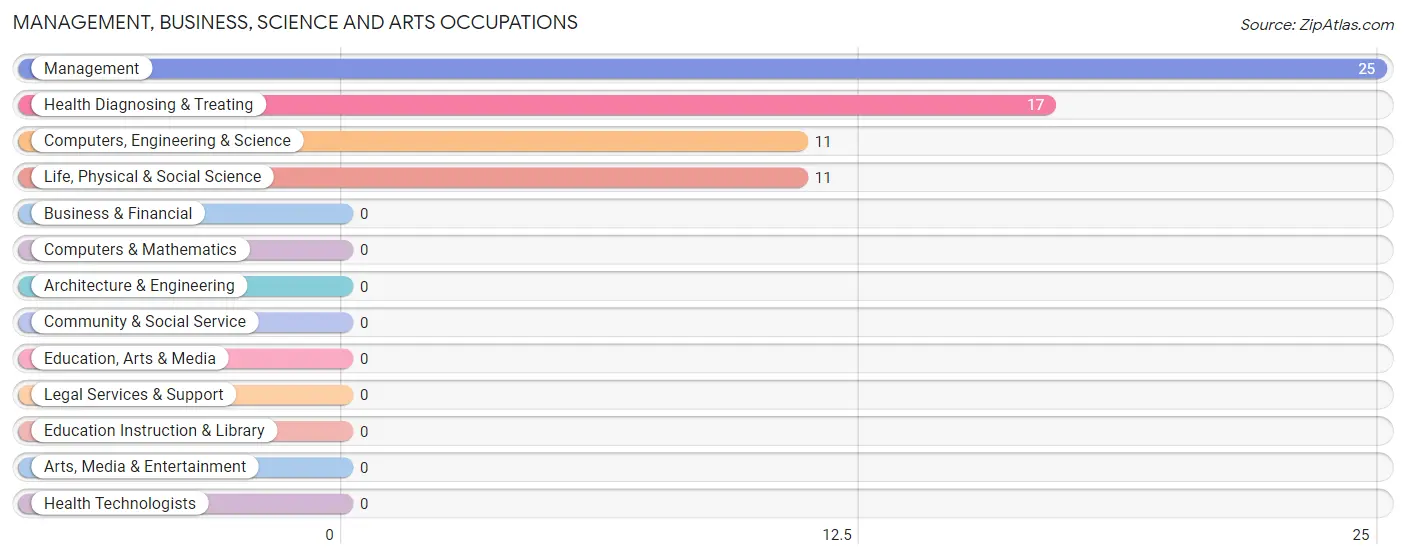
Management, Business, Science and Arts Occupations
The most common Management, Business, Science and Arts occupations in Red Lake are Management (25 | 5.2%), Health Diagnosing & Treating (17 | 3.6%), Computers, Engineering & Science (11 | 2.3%), and Life, Physical & Social Science (11 | 2.3%).
Management, Business, Science and Arts Occupations by Sex
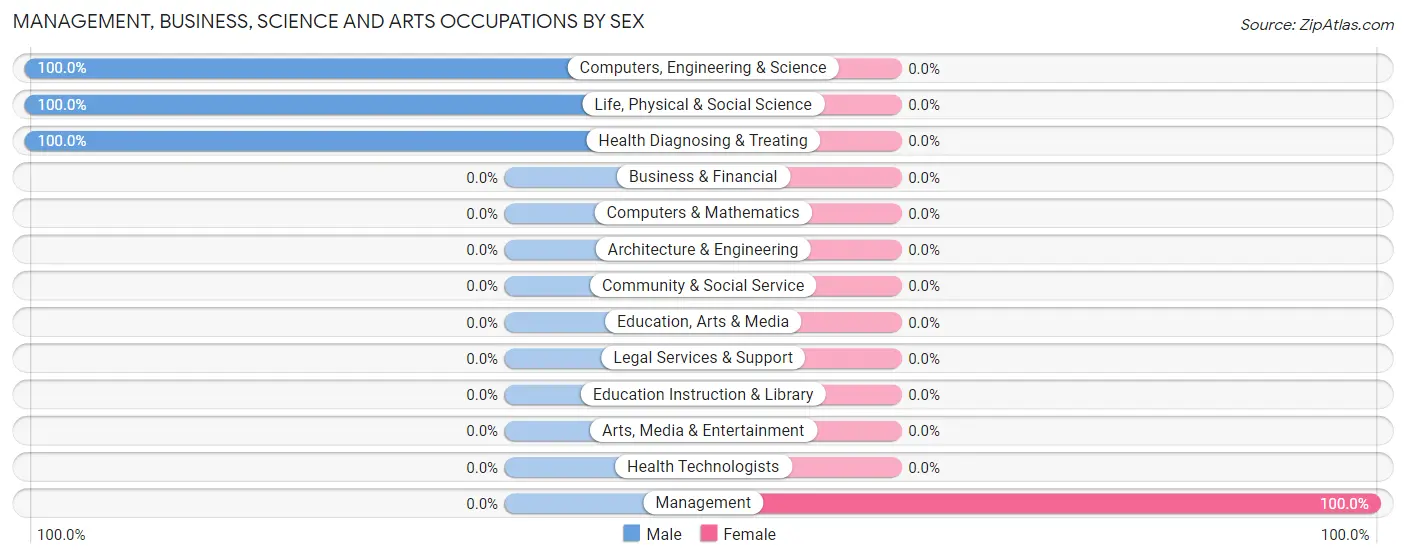
| Occupation | Male | Female |
| Management | 0 (0.0%) | 25 (100.0%) |
| Business & Financial | 0 (0.0%) | 0 (0.0%) |
| Computers, Engineering & Science | 11 (100.0%) | 0 (0.0%) |
| Computers & Mathematics | 0 (0.0%) | 0 (0.0%) |
| Architecture & Engineering | 0 (0.0%) | 0 (0.0%) |
| Life, Physical & Social Science | 11 (100.0%) | 0 (0.0%) |
| Community & Social Service | 0 (0.0%) | 0 (0.0%) |
| Education, Arts & Media | 0 (0.0%) | 0 (0.0%) |
| Legal Services & Support | 0 (0.0%) | 0 (0.0%) |
| Education Instruction & Library | 0 (0.0%) | 0 (0.0%) |
| Arts, Media & Entertainment | 0 (0.0%) | 0 (0.0%) |
| Health Diagnosing & Treating | 17 (100.0%) | 0 (0.0%) |
| Health Technologists | 0 (0.0%) | 0 (0.0%) |
| Total (Category) | 28 (52.8%) | 25 (47.2%) |
| Total (Overall) | 252 (52.8%) | 225 (47.2%) |
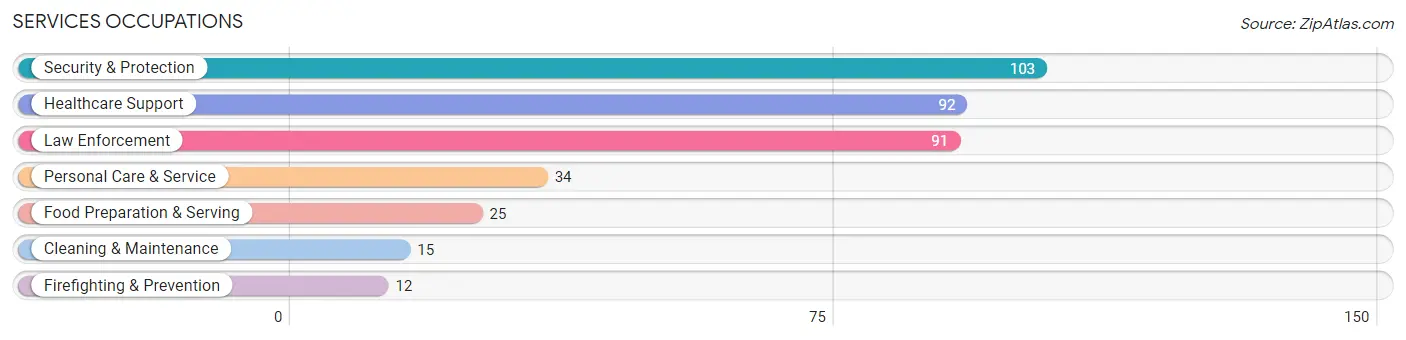
Services Occupations
The most common Services occupations in Red Lake are Security & Protection (103 | 21.6%), Healthcare Support (92 | 19.3%), Law Enforcement (91 | 19.1%), Personal Care & Service (34 | 7.1%), and Food Preparation & Serving (25 | 5.2%).
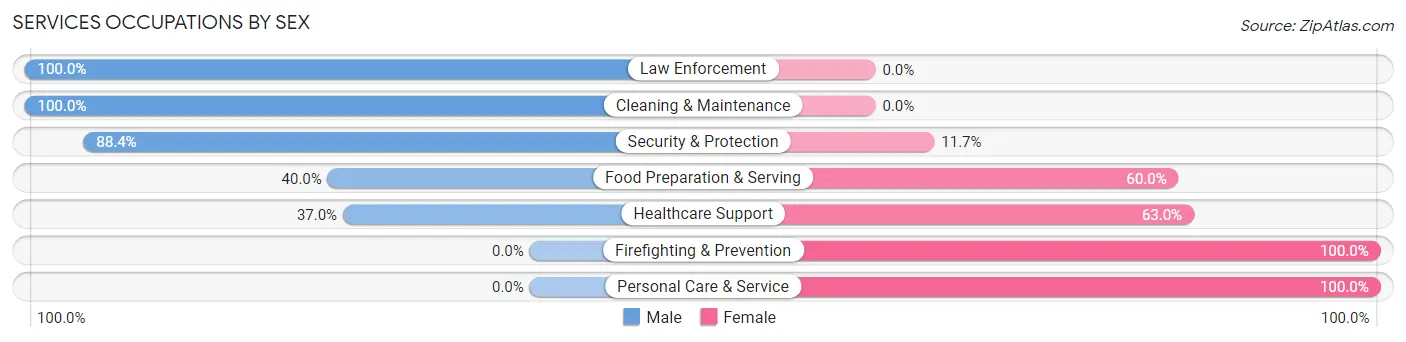
Services Occupations by Sex
Within the Services occupations in Red Lake, the most male-oriented occupations are Law Enforcement (100.0%), Cleaning & Maintenance (100.0%), and Security & Protection (88.3%), while the most female-oriented occupations are Firefighting & Prevention (100.0%), Personal Care & Service (100.0%), and Healthcare Support (63.0%).
| Occupation | Male | Female |
| Healthcare Support | 34 (37.0%) | 58 (63.0%) |
| Security & Protection | 91 (88.3%) | 12 (11.7%) |
| Firefighting & Prevention | 0 (0.0%) | 12 (100.0%) |
| Law Enforcement | 91 (100.0%) | 0 (0.0%) |
| Food Preparation & Serving | 10 (40.0%) | 15 (60.0%) |
| Cleaning & Maintenance | 15 (100.0%) | 0 (0.0%) |
| Personal Care & Service | 0 (0.0%) | 34 (100.0%) |
| Total (Category) | 150 (55.8%) | 119 (44.2%) |
| Total (Overall) | 252 (52.8%) | 225 (47.2%) |
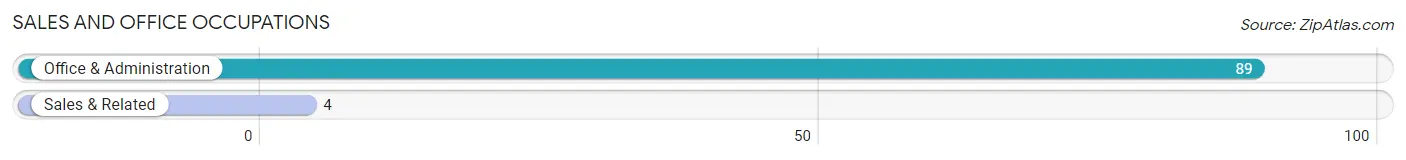
Sales and Office Occupations
The most common Sales and Office occupations in Red Lake are Office & Administration (89 | 18.7%), and Sales & Related (4 | 0.8%).
Sales and Office Occupations by Sex
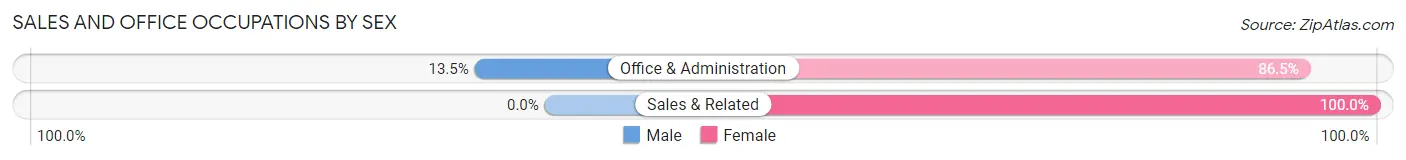
| Occupation | Male | Female |
| Sales & Related | 0 (0.0%) | 4 (100.0%) |
| Office & Administration | 12 (13.5%) | 77 (86.5%) |
| Total (Category) | 12 (12.9%) | 81 (87.1%) |
| Total (Overall) | 252 (52.8%) | 225 (47.2%) |
Natural Resources, Construction and Maintenance Occupations
The most common Natural Resources, Construction and Maintenance occupations in Red Lake are , and Construction & Extraction (48 | 10.1%).
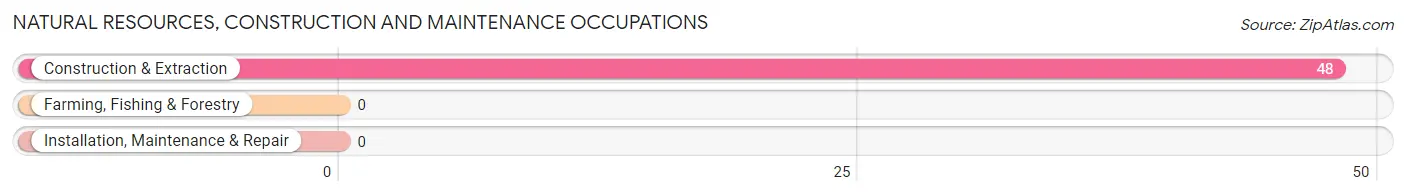
Natural Resources, Construction and Maintenance Occupations by Sex
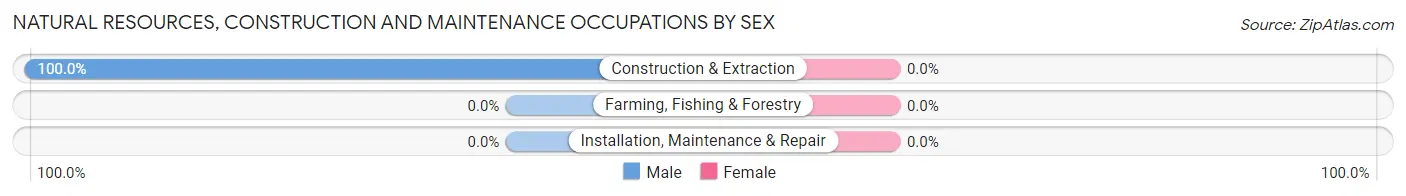
| Occupation | Male | Female |
| Farming, Fishing & Forestry | 0 (0.0%) | 0 (0.0%) |
| Construction & Extraction | 48 (100.0%) | 0 (0.0%) |
| Installation, Maintenance & Repair | 0 (0.0%) | 0 (0.0%) |
| Total (Category) | 48 (100.0%) | 0 (0.0%) |
| Total (Overall) | 252 (52.8%) | 225 (47.2%) |
Production, Transportation and Moving Occupations
The most common Production, Transportation and Moving occupations in Red Lake are , and Material Moving (14 | 2.9%).
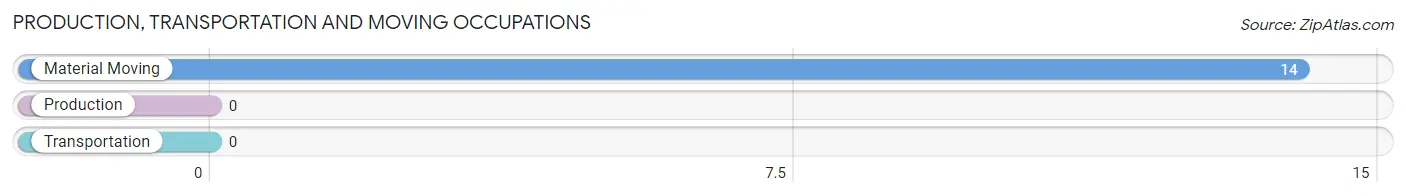
Production, Transportation and Moving Occupations by Sex
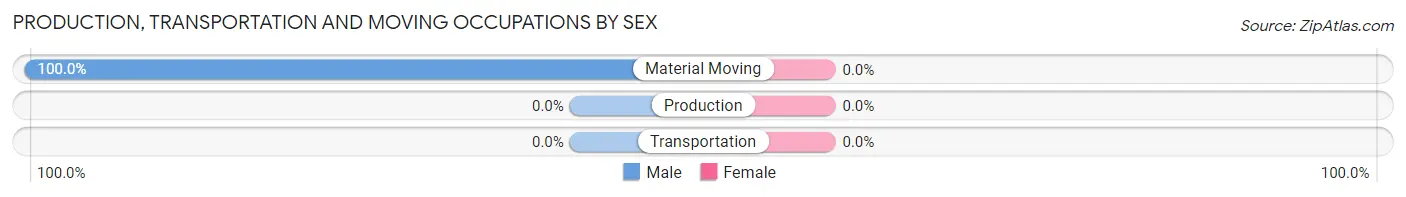
| Occupation | Male | Female |
| Production | 0 (0.0%) | 0 (0.0%) |
| Transportation | 0 (0.0%) | 0 (0.0%) |
| Material Moving | 14 (100.0%) | 0 (0.0%) |
| Total (Category) | 14 (100.0%) | 0 (0.0%) |
| Total (Overall) | 252 (52.8%) | 225 (47.2%) |
Employment Industries by Sex in Red Lake
Employment Industries in Red Lake
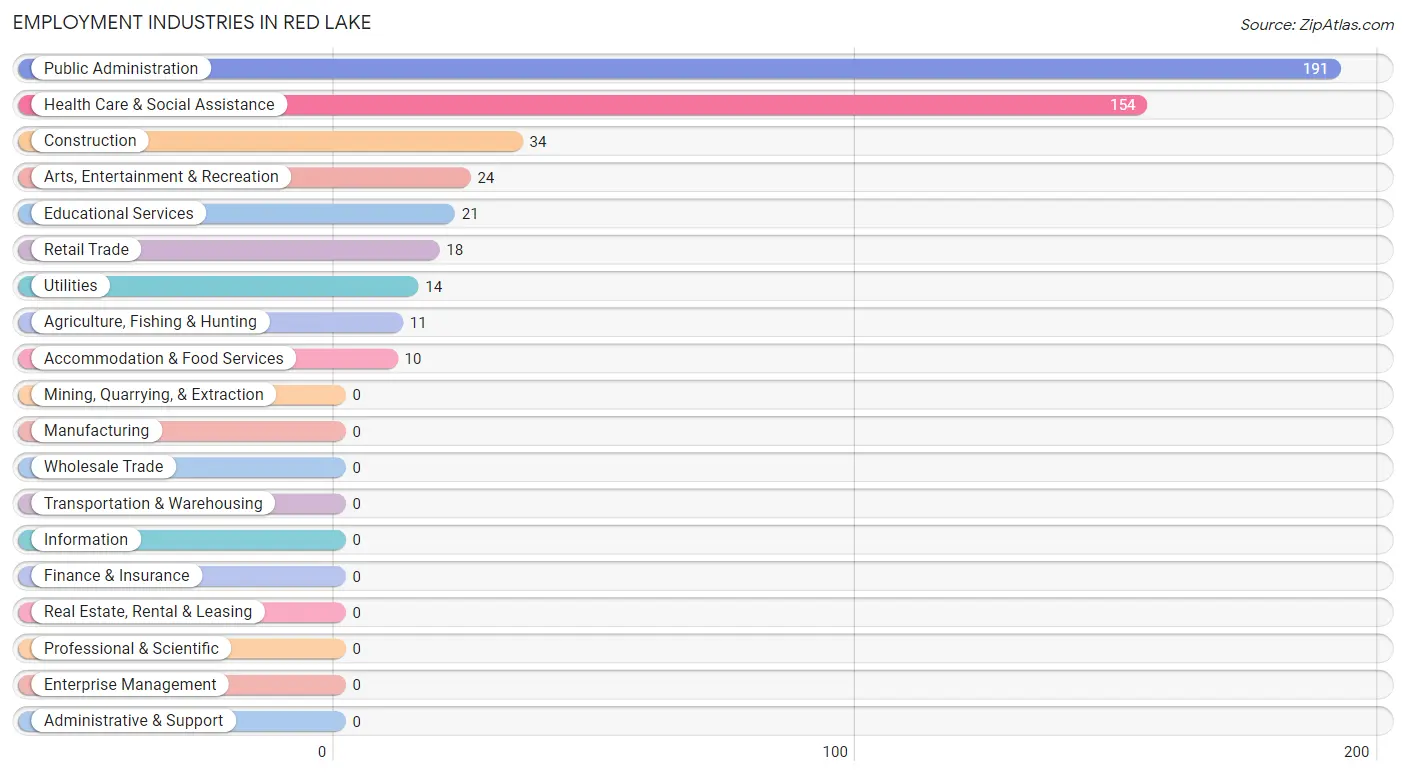
The major employment industries in Red Lake include Public Administration (191 | 40.0%), Health Care & Social Assistance (154 | 32.3%), Construction (34 | 7.1%), Arts, Entertainment & Recreation (24 | 5.0%), and Educational Services (21 | 4.4%).
Employment Industries by Sex in Red Lake
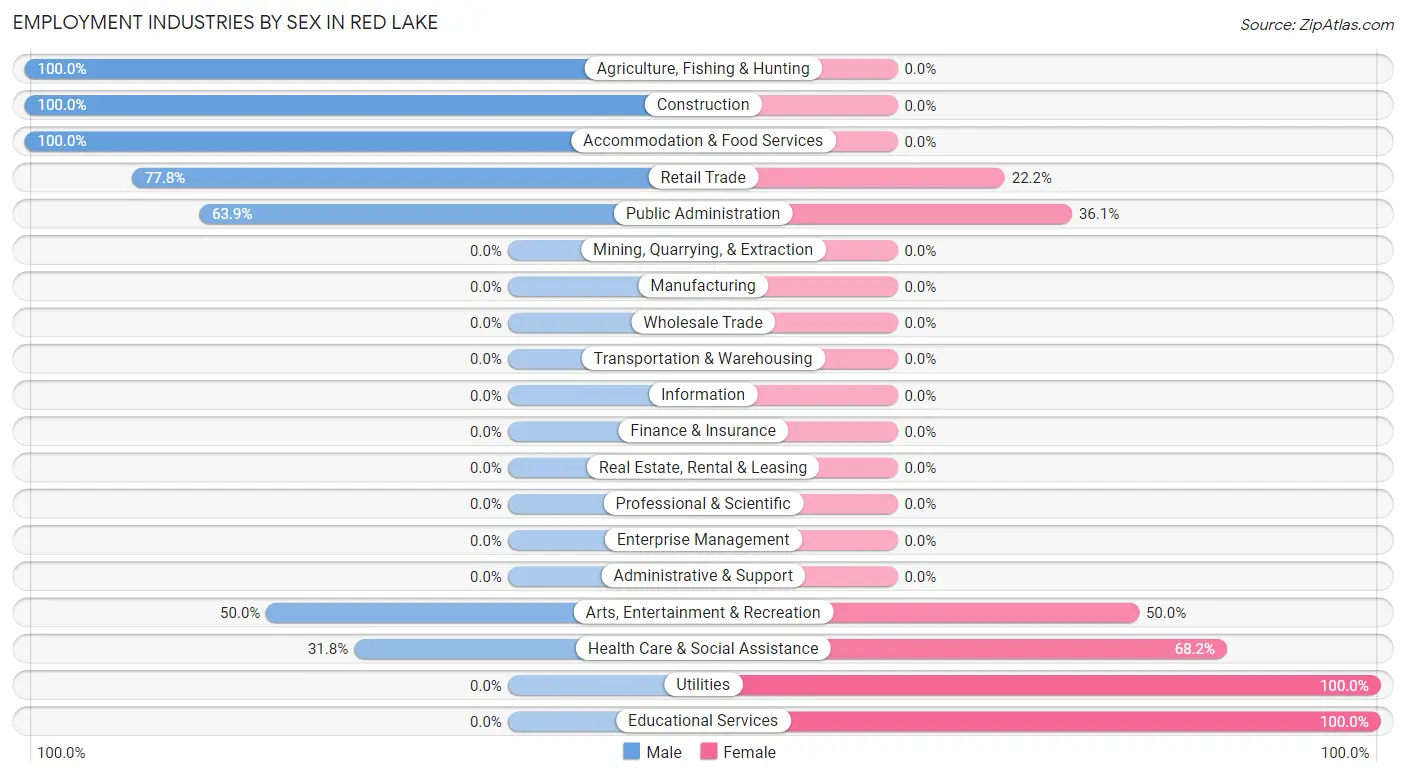
The Red Lake industries that see more men than women are Agriculture, Fishing & Hunting (100.0%), Construction (100.0%), and Accommodation & Food Services (100.0%), whereas the industries that tend to have a higher number of women are Utilities (100.0%), Educational Services (100.0%), and Health Care & Social Assistance (68.2%).
| Industry | Male | Female |
| Agriculture, Fishing & Hunting | 11 (100.0%) | 0 (0.0%) |
| Mining, Quarrying, & Extraction | 0 (0.0%) | 0 (0.0%) |
| Construction | 34 (100.0%) | 0 (0.0%) |
| Manufacturing | 0 (0.0%) | 0 (0.0%) |
| Wholesale Trade | 0 (0.0%) | 0 (0.0%) |
| Retail Trade | 14 (77.8%) | 4 (22.2%) |
| Transportation & Warehousing | 0 (0.0%) | 0 (0.0%) |
| Utilities | 0 (0.0%) | 14 (100.0%) |
| Information | 0 (0.0%) | 0 (0.0%) |
| Finance & Insurance | 0 (0.0%) | 0 (0.0%) |
| Real Estate, Rental & Leasing | 0 (0.0%) | 0 (0.0%) |
| Professional & Scientific | 0 (0.0%) | 0 (0.0%) |
| Enterprise Management | 0 (0.0%) | 0 (0.0%) |
| Administrative & Support | 0 (0.0%) | 0 (0.0%) |
| Educational Services | 0 (0.0%) | 21 (100.0%) |
| Health Care & Social Assistance | 49 (31.8%) | 105 (68.2%) |
| Arts, Entertainment & Recreation | 12 (50.0%) | 12 (50.0%) |
| Accommodation & Food Services | 10 (100.0%) | 0 (0.0%) |
| Public Administration | 122 (63.9%) | 69 (36.1%) |
| Total | 252 (52.8%) | 225 (47.2%) |
Education in Red Lake
School Enrollment in Red Lake
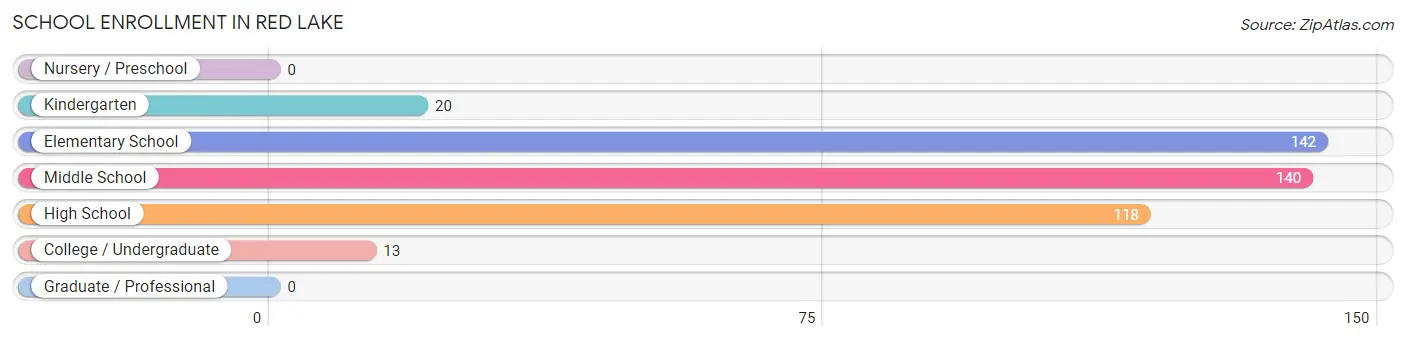
The most common levels of schooling among the 433 students in Red Lake are elementary school (142 | 32.8%), middle school (140 | 32.3%), and high school (118 | 27.3%).
| School Level | # Students | % Students |
| Nursery / Preschool | 0 | 0.0% |
| Kindergarten | 20 | 4.6% |
| Elementary School | 142 | 32.8% |
| Middle School | 140 | 32.3% |
| High School | 118 | 27.3% |
| College / Undergraduate | 13 | 3.0% |
| Graduate / Professional | 0 | 0.0% |
| Total | 433 | 100.0% |
School Enrollment by Age by Funding Source in Red Lake
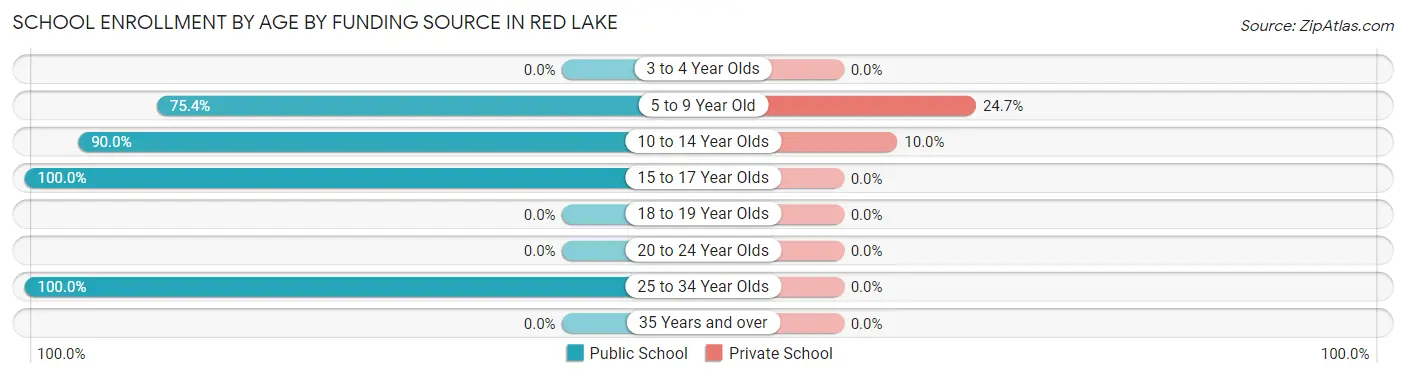
Out of a total of 433 students who are enrolled in schools in Red Lake, 51 (11.8%) attend a private institution, while the remaining 382 (88.2%) are enrolled in public schools. The age group of 5 to 9 year old has the highest likelihood of being enrolled in private schools, with 35 (24.6% in the age bracket) enrolled. Conversely, the age group of 15 to 17 year olds has the lowest likelihood of being enrolled in a private school, with 118 (100.0% in the age bracket) attending a public institution.
| Age Bracket | Public School | Private School |
| 3 to 4 Year Olds | 0 (0.0%) | 0 (0.0%) |
| 5 to 9 Year Old | 107 (75.3%) | 35 (24.6%) |
| 10 to 14 Year Olds | 144 (90.0%) | 16 (10.0%) |
| 15 to 17 Year Olds | 118 (100.0%) | 0 (0.0%) |
| 18 to 19 Year Olds | 0 (0.0%) | 0 (0.0%) |
| 20 to 24 Year Olds | 0 (0.0%) | 0 (0.0%) |
| 25 to 34 Year Olds | 13 (100.0%) | 0 (0.0%) |
| 35 Years and over | 0 (0.0%) | 0 (0.0%) |
| Total | 382 (88.2%) | 51 (11.8%) |
Educational Attainment by Field of Study in Red Lake
Communications (13 | 54.2%), and business (11 | 45.8%) are the most common fields of study among 24 individuals in Red Lake who have obtained a bachelor's degree or higher.
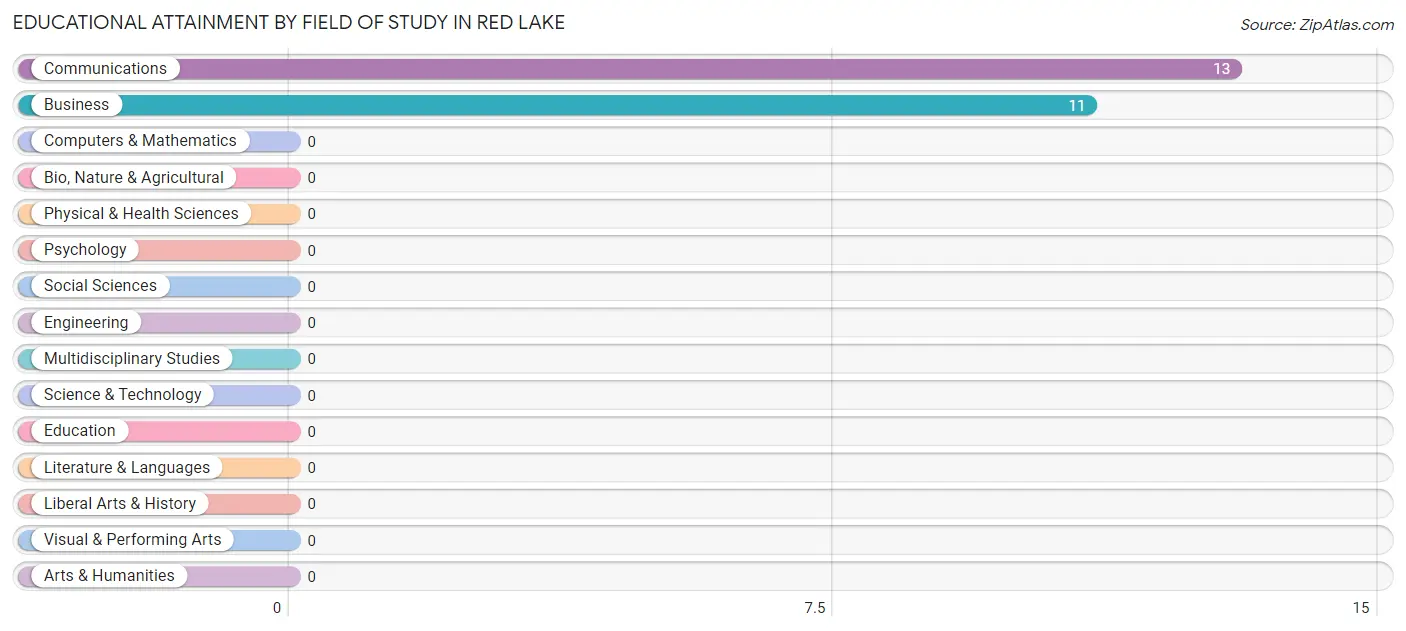
| Field of Study | # Graduates | % Graduates |
| Computers & Mathematics | 0 | 0.0% |
| Bio, Nature & Agricultural | 0 | 0.0% |
| Physical & Health Sciences | 0 | 0.0% |
| Psychology | 0 | 0.0% |
| Social Sciences | 0 | 0.0% |
| Engineering | 0 | 0.0% |
| Multidisciplinary Studies | 0 | 0.0% |
| Science & Technology | 0 | 0.0% |
| Business | 11 | 45.8% |
| Education | 0 | 0.0% |
| Literature & Languages | 0 | 0.0% |
| Liberal Arts & History | 0 | 0.0% |
| Visual & Performing Arts | 0 | 0.0% |
| Communications | 13 | 54.2% |
| Arts & Humanities | 0 | 0.0% |
| Total | 24 | 100.0% |
Transportation & Commute in Red Lake
Vehicle Availability by Sex in Red Lake
The most prevalent vehicle ownership categories in Red Lake are males with 1 vehicle (91, accounting for 37.9%) and females with 1 vehicle (29, making up 41.2%).
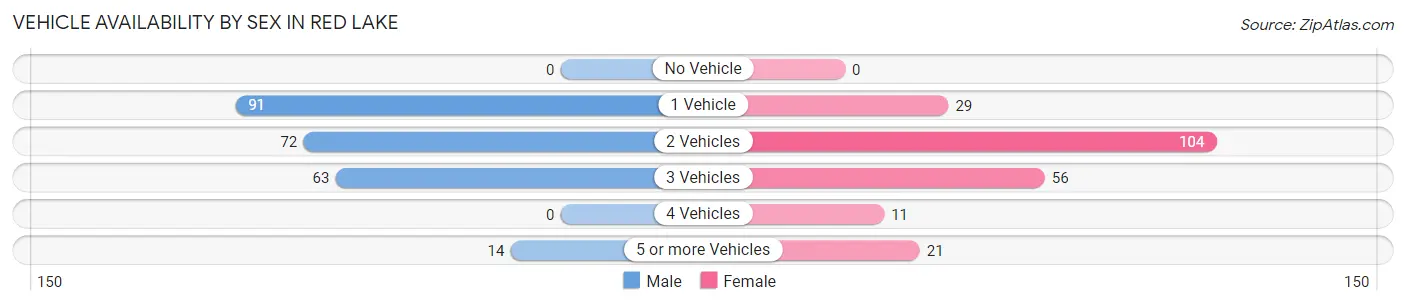
| Vehicles Available | Male | Female |
| No Vehicle | 0 (0.0%) | 0 (0.0%) |
| 1 Vehicle | 91 (37.9%) | 29 (13.1%) |
| 2 Vehicles | 72 (30.0%) | 104 (47.1%) |
| 3 Vehicles | 63 (26.3%) | 56 (25.3%) |
| 4 Vehicles | 0 (0.0%) | 11 (5.0%) |
| 5 or more Vehicles | 14 (5.8%) | 21 (9.5%) |
| Total | 240 (100.0%) | 221 (100.0%) |
Commute Time in Red Lake
The most frequently occuring commute durations in Red Lake are less than 5 minutes (220 commuters, 51.4%), 5 to 9 minutes (93 commuters, 21.7%), and 10 to 14 minutes (64 commuters, 14.9%).
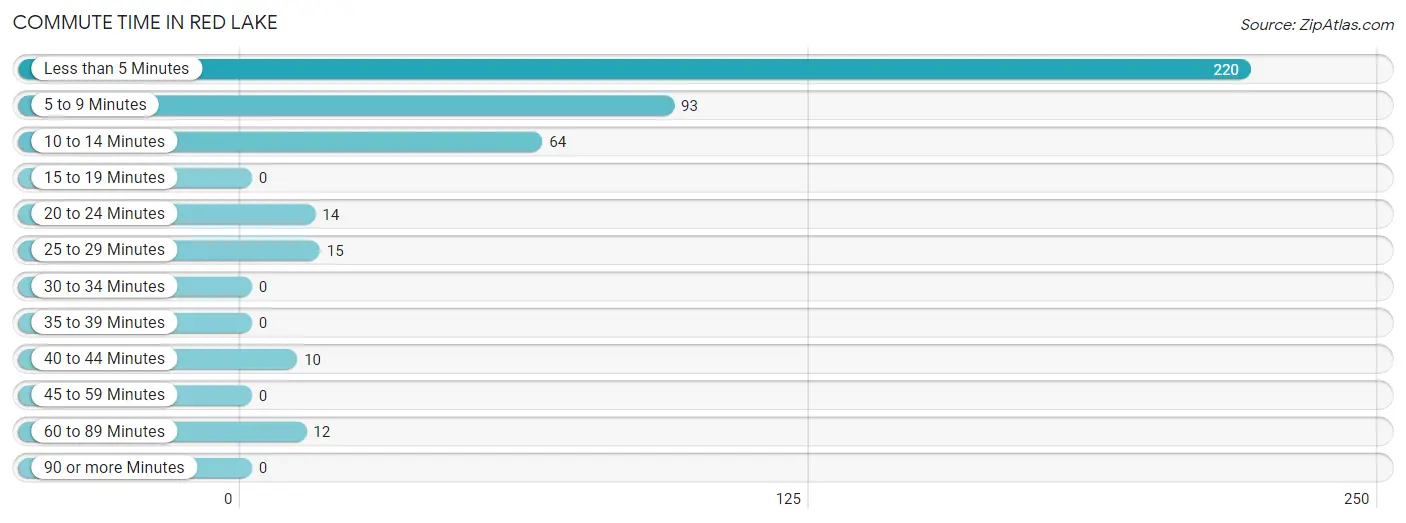
| Commute Time | # Commuters | % Commuters |
| Less than 5 Minutes | 220 | 51.4% |
| 5 to 9 Minutes | 93 | 21.7% |
| 10 to 14 Minutes | 64 | 14.9% |
| 15 to 19 Minutes | 0 | 0.0% |
| 20 to 24 Minutes | 14 | 3.3% |
| 25 to 29 Minutes | 15 | 3.5% |
| 30 to 34 Minutes | 0 | 0.0% |
| 35 to 39 Minutes | 0 | 0.0% |
| 40 to 44 Minutes | 10 | 2.3% |
| 45 to 59 Minutes | 0 | 0.0% |
| 60 to 89 Minutes | 12 | 2.8% |
| 90 or more Minutes | 0 | 0.0% |
Commute Time by Sex in Red Lake
The most common commute times in Red Lake are less than 5 minutes (148 commuters, 61.7%) for males and less than 5 minutes (72 commuters, 38.3%) for females.
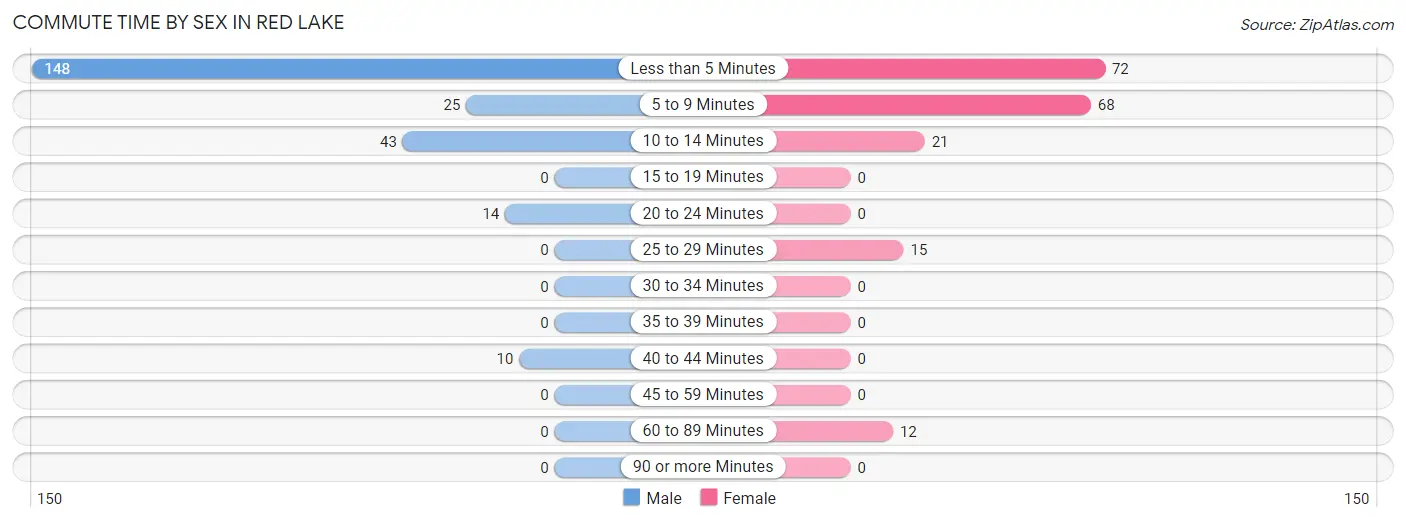
| Commute Time | Male | Female |
| Less than 5 Minutes | 148 (61.7%) | 72 (38.3%) |
| 5 to 9 Minutes | 25 (10.4%) | 68 (36.2%) |
| 10 to 14 Minutes | 43 (17.9%) | 21 (11.2%) |
| 15 to 19 Minutes | 0 (0.0%) | 0 (0.0%) |
| 20 to 24 Minutes | 14 (5.8%) | 0 (0.0%) |
| 25 to 29 Minutes | 0 (0.0%) | 15 (8.0%) |
| 30 to 34 Minutes | 0 (0.0%) | 0 (0.0%) |
| 35 to 39 Minutes | 0 (0.0%) | 0 (0.0%) |
| 40 to 44 Minutes | 10 (4.2%) | 0 (0.0%) |
| 45 to 59 Minutes | 0 (0.0%) | 0 (0.0%) |
| 60 to 89 Minutes | 0 (0.0%) | 12 (6.4%) |
| 90 or more Minutes | 0 (0.0%) | 0 (0.0%) |
Time of Departure to Work by Sex in Red Lake
The most frequent times of departure to work in Red Lake are 4:00 PM to 11:59 PM (91, 37.9%) for males and 7:30 AM to 7:59 AM (84, 44.7%) for females.
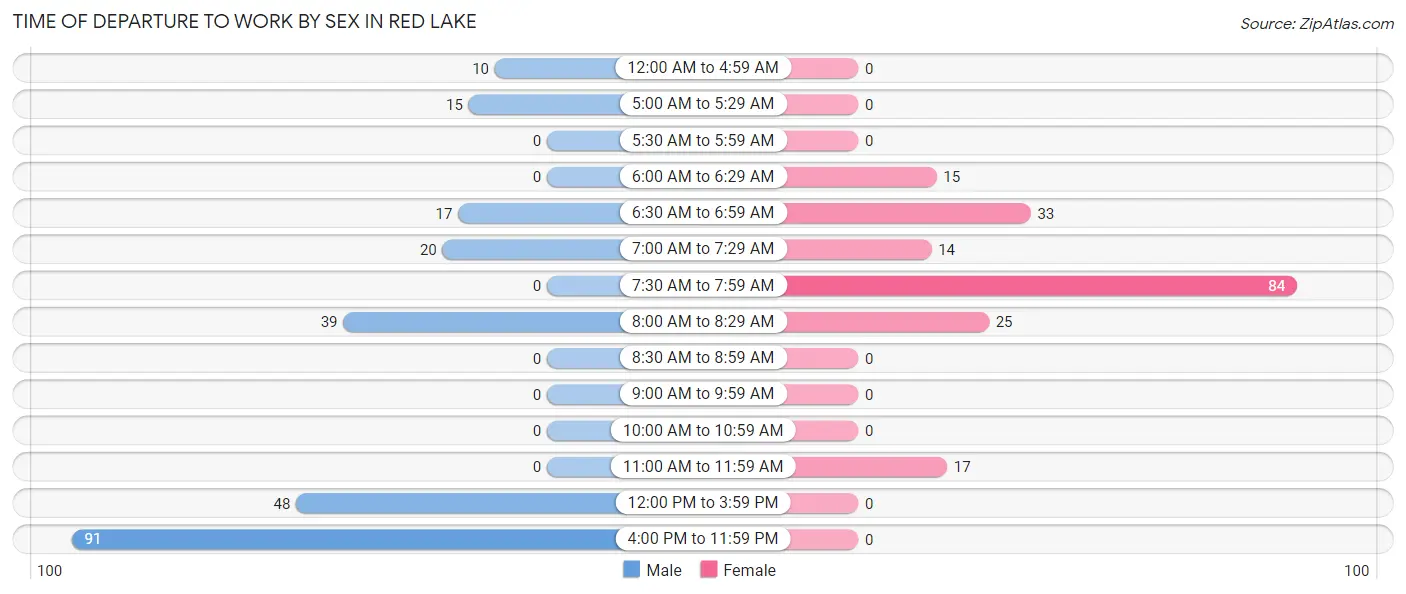
| Time of Departure | Male | Female |
| 12:00 AM to 4:59 AM | 10 (4.2%) | 0 (0.0%) |
| 5:00 AM to 5:29 AM | 15 (6.2%) | 0 (0.0%) |
| 5:30 AM to 5:59 AM | 0 (0.0%) | 0 (0.0%) |
| 6:00 AM to 6:29 AM | 0 (0.0%) | 15 (8.0%) |
| 6:30 AM to 6:59 AM | 17 (7.1%) | 33 (17.5%) |
| 7:00 AM to 7:29 AM | 20 (8.3%) | 14 (7.4%) |
| 7:30 AM to 7:59 AM | 0 (0.0%) | 84 (44.7%) |
| 8:00 AM to 8:29 AM | 39 (16.3%) | 25 (13.3%) |
| 8:30 AM to 8:59 AM | 0 (0.0%) | 0 (0.0%) |
| 9:00 AM to 9:59 AM | 0 (0.0%) | 0 (0.0%) |
| 10:00 AM to 10:59 AM | 0 (0.0%) | 0 (0.0%) |
| 11:00 AM to 11:59 AM | 0 (0.0%) | 17 (9.0%) |
| 12:00 PM to 3:59 PM | 48 (20.0%) | 0 (0.0%) |
| 4:00 PM to 11:59 PM | 91 (37.9%) | 0 (0.0%) |
| Total | 240 (100.0%) | 188 (100.0%) |
Housing Occupancy in Red Lake
Occupancy by Ownership in Red Lake
Of the total 484 dwellings in Red Lake, owner-occupied units account for 248 (51.2%), while renter-occupied units make up 236 (48.8%).
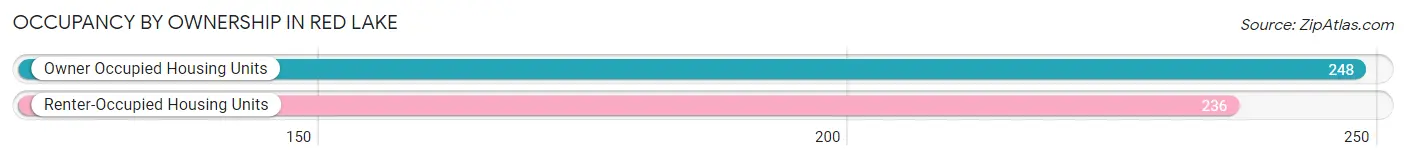
| Occupancy | # Housing Units | % Housing Units |
| Owner Occupied Housing Units | 248 | 51.2% |
| Renter-Occupied Housing Units | 236 | 48.8% |
| Total Occupied Housing Units | 484 | 100.0% |
Occupancy by Household Size in Red Lake
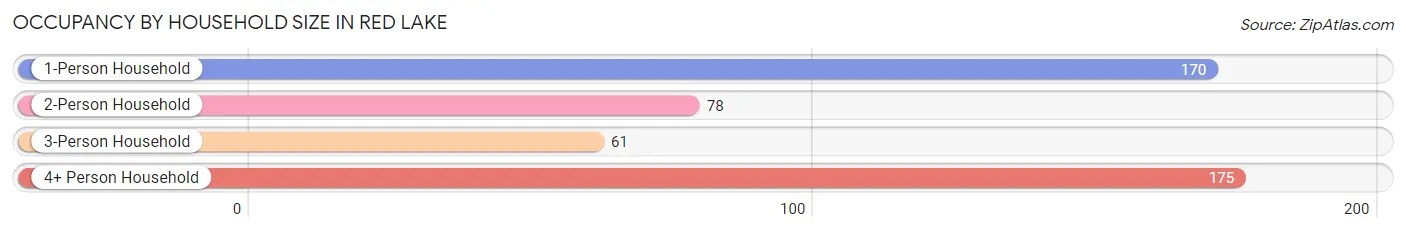
| Household Size | # Housing Units | % Housing Units |
| 1-Person Household | 170 | 35.1% |
| 2-Person Household | 78 | 16.1% |
| 3-Person Household | 61 | 12.6% |
| 4+ Person Household | 175 | 36.2% |
| Total Housing Units | 484 | 100.0% |
Occupancy by Ownership by Household Size in Red Lake
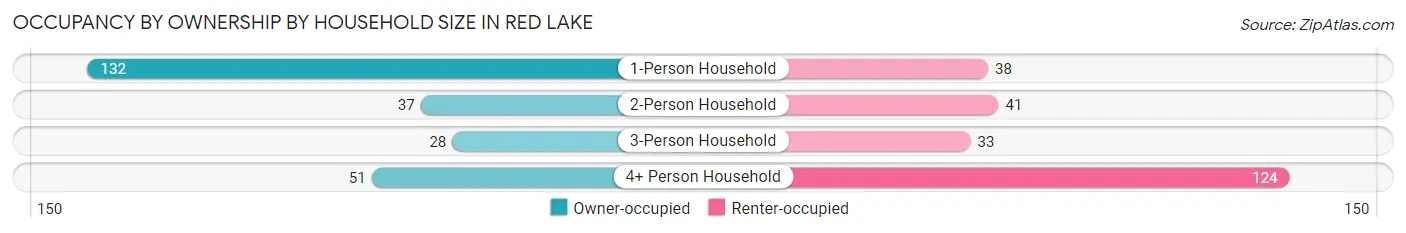
| Household Size | Owner-occupied | Renter-occupied |
| 1-Person Household | 132 (77.6%) | 38 (22.4%) |
| 2-Person Household | 37 (47.4%) | 41 (52.6%) |
| 3-Person Household | 28 (45.9%) | 33 (54.1%) |
| 4+ Person Household | 51 (29.1%) | 124 (70.9%) |
| Total Housing Units | 248 (51.2%) | 236 (48.8%) |
Occupancy by Educational Attainment in Red Lake
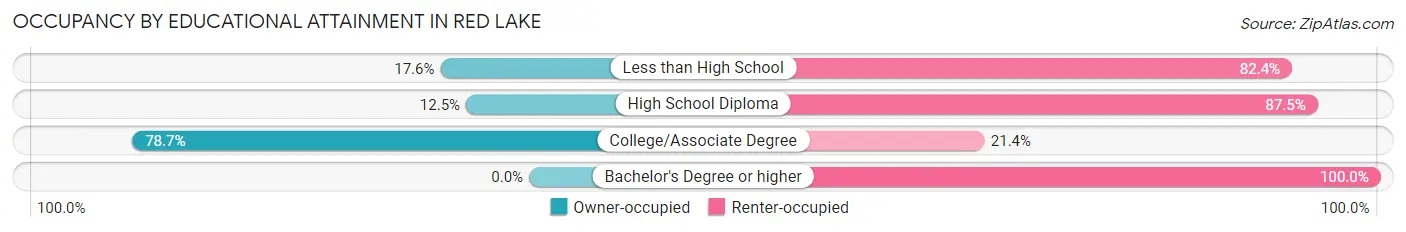
| Household Size | Owner-occupied | Renter-occupied |
| Less than High School | 16 (17.6%) | 75 (82.4%) |
| High School Diploma | 11 (12.5%) | 77 (87.5%) |
| College/Associate Degree | 221 (78.6%) | 60 (21.3%) |
| Bachelor's Degree or higher | 0 (0.0%) | 24 (100.0%) |
Occupancy by Age of Householder in Red Lake
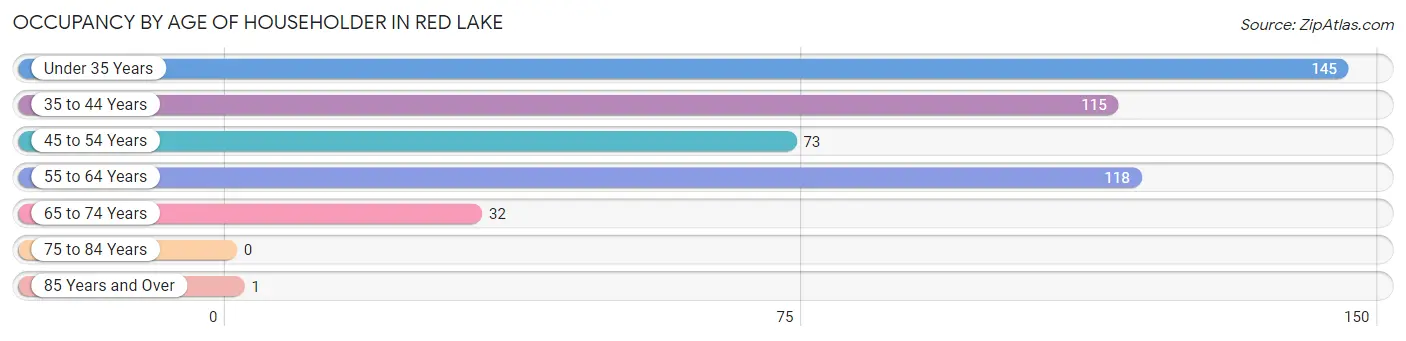
| Age Bracket | # Households | % Households |
| Under 35 Years | 145 | 30.0% |
| 35 to 44 Years | 115 | 23.8% |
| 45 to 54 Years | 73 | 15.1% |
| 55 to 64 Years | 118 | 24.4% |
| 65 to 74 Years | 32 | 6.6% |
| 75 to 84 Years | 0 | 0.0% |
| 85 Years and Over | 1 | 0.2% |
| Total | 484 | 100.0% |
Housing Finances in Red Lake
Median Income by Occupancy in Red Lake
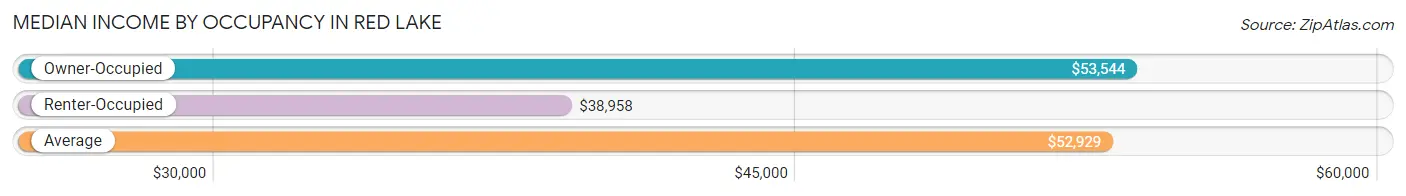
| Occupancy Type | # Households | Median Income |
| Owner-Occupied | 248 (51.2%) | $53,544 |
| Renter-Occupied | 236 (48.8%) | $38,958 |
| Average | 484 (100.0%) | $52,929 |
Occupancy by Householder Income Bracket in Red Lake
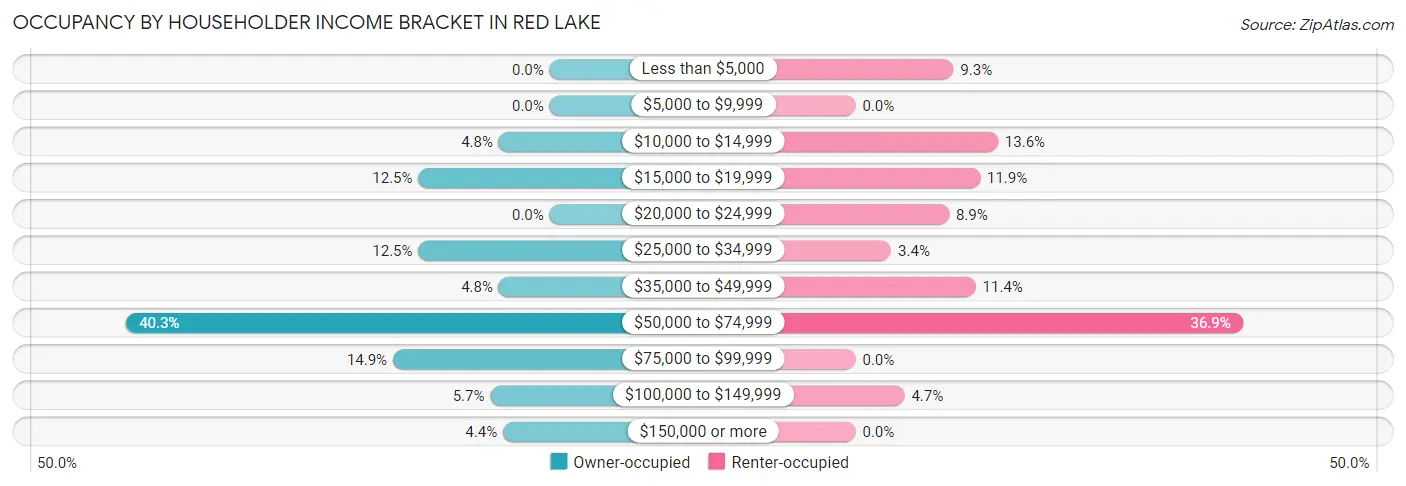
| Income Bracket | Owner-occupied | Renter-occupied |
| Less than $5,000 | 0 (0.0%) | 22 (9.3%) |
| $5,000 to $9,999 | 0 (0.0%) | 0 (0.0%) |
| $10,000 to $14,999 | 12 (4.8%) | 32 (13.6%) |
| $15,000 to $19,999 | 31 (12.5%) | 28 (11.9%) |
| $20,000 to $24,999 | 0 (0.0%) | 21 (8.9%) |
| $25,000 to $34,999 | 31 (12.5%) | 8 (3.4%) |
| $35,000 to $49,999 | 12 (4.8%) | 27 (11.4%) |
| $50,000 to $74,999 | 100 (40.3%) | 87 (36.9%) |
| $75,000 to $99,999 | 37 (14.9%) | 0 (0.0%) |
| $100,000 to $149,999 | 14 (5.7%) | 11 (4.7%) |
| $150,000 or more | 11 (4.4%) | 0 (0.0%) |
| Total | 248 (100.0%) | 236 (100.0%) |
Monthly Housing Cost Tiers in Red Lake
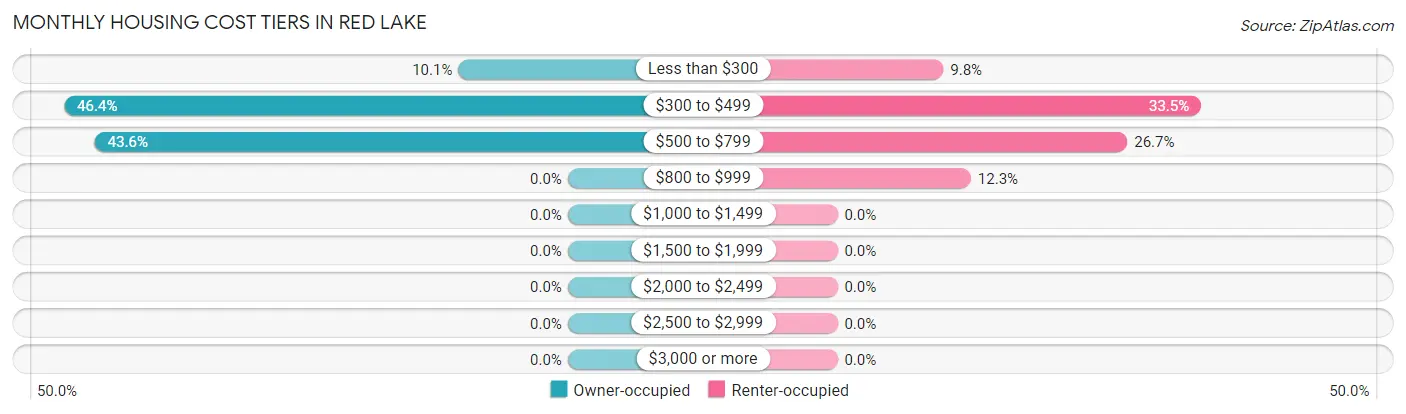
| Monthly Cost | Owner-occupied | Renter-occupied |
| Less than $300 | 25 (10.1%) | 23 (9.8%) |
| $300 to $499 | 115 (46.4%) | 79 (33.5%) |
| $500 to $799 | 108 (43.5%) | 63 (26.7%) |
| $800 to $999 | 0 (0.0%) | 29 (12.3%) |
| $1,000 to $1,499 | 0 (0.0%) | 0 (0.0%) |
| $1,500 to $1,999 | 0 (0.0%) | 0 (0.0%) |
| $2,000 to $2,499 | 0 (0.0%) | 0 (0.0%) |
| $2,500 to $2,999 | 0 (0.0%) | 0 (0.0%) |
| $3,000 or more | 0 (0.0%) | 0 (0.0%) |
| Total | 248 (100.0%) | 236 (100.0%) |
Physical Housing Characteristics in Red Lake
Housing Structures in Red Lake
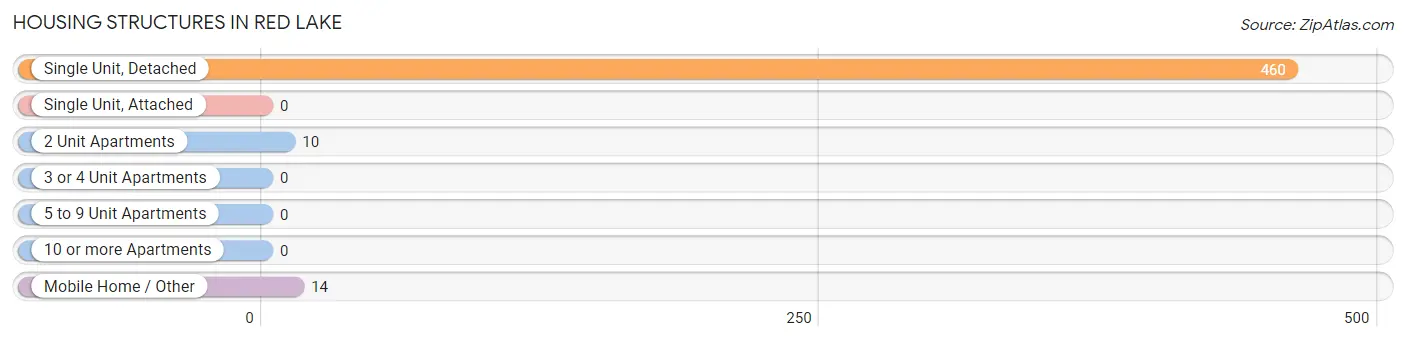
| Structure Type | # Housing Units | % Housing Units |
| Single Unit, Detached | 460 | 95.0% |
| Single Unit, Attached | 0 | 0.0% |
| 2 Unit Apartments | 10 | 2.1% |
| 3 or 4 Unit Apartments | 0 | 0.0% |
| 5 to 9 Unit Apartments | 0 | 0.0% |
| 10 or more Apartments | 0 | 0.0% |
| Mobile Home / Other | 14 | 2.9% |
| Total | 484 | 100.0% |
Housing Structures by Occupancy in Red Lake
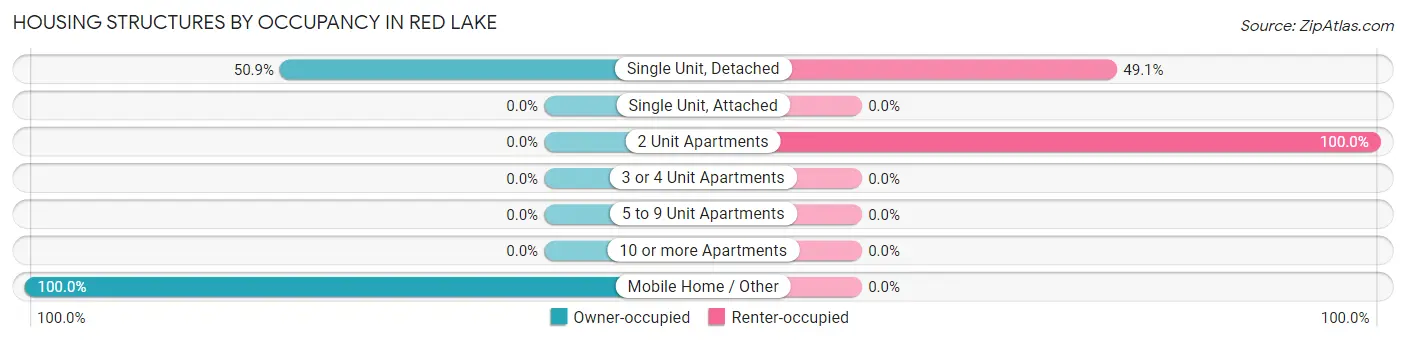
| Structure Type | Owner-occupied | Renter-occupied |
| Single Unit, Detached | 234 (50.9%) | 226 (49.1%) |
| Single Unit, Attached | 0 (0.0%) | 0 (0.0%) |
| 2 Unit Apartments | 0 (0.0%) | 10 (100.0%) |
| 3 or 4 Unit Apartments | 0 (0.0%) | 0 (0.0%) |
| 5 to 9 Unit Apartments | 0 (0.0%) | 0 (0.0%) |
| 10 or more Apartments | 0 (0.0%) | 0 (0.0%) |
| Mobile Home / Other | 14 (100.0%) | 0 (0.0%) |
| Total | 248 (51.2%) | 236 (48.8%) |
Housing Structures by Number of Rooms in Red Lake
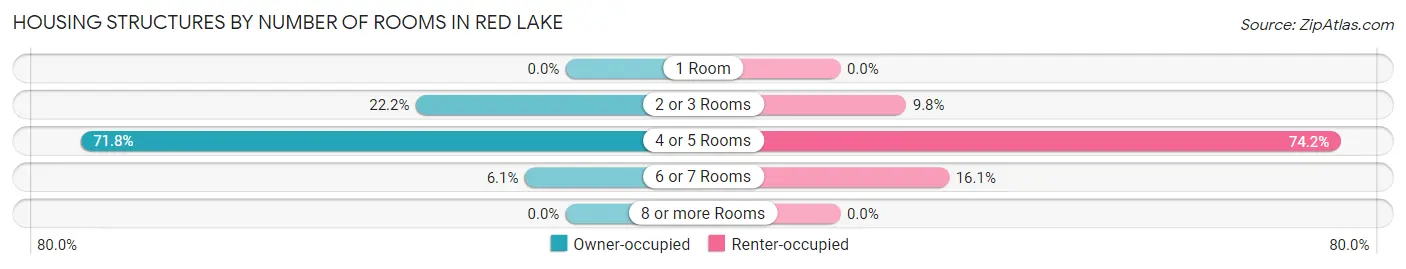
| Number of Rooms | Owner-occupied | Renter-occupied |
| 1 Room | 0 (0.0%) | 0 (0.0%) |
| 2 or 3 Rooms | 55 (22.2%) | 23 (9.8%) |
| 4 or 5 Rooms | 178 (71.8%) | 175 (74.2%) |
| 6 or 7 Rooms | 15 (6.0%) | 38 (16.1%) |
| 8 or more Rooms | 0 (0.0%) | 0 (0.0%) |
| Total | 248 (100.0%) | 236 (100.0%) |
Housing Structure by Heating Type in Red Lake
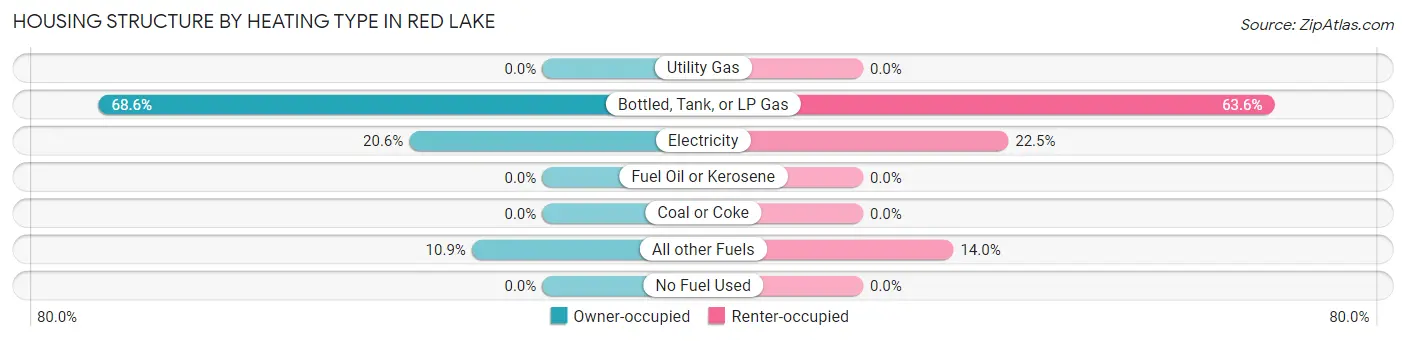
| Heating Type | Owner-occupied | Renter-occupied |
| Utility Gas | 0 (0.0%) | 0 (0.0%) |
| Bottled, Tank, or LP Gas | 170 (68.5%) | 150 (63.6%) |
| Electricity | 51 (20.6%) | 53 (22.5%) |
| Fuel Oil or Kerosene | 0 (0.0%) | 0 (0.0%) |
| Coal or Coke | 0 (0.0%) | 0 (0.0%) |
| All other Fuels | 27 (10.9%) | 33 (14.0%) |
| No Fuel Used | 0 (0.0%) | 0 (0.0%) |
| Total | 248 (100.0%) | 236 (100.0%) |
Household Vehicle Usage in Red Lake
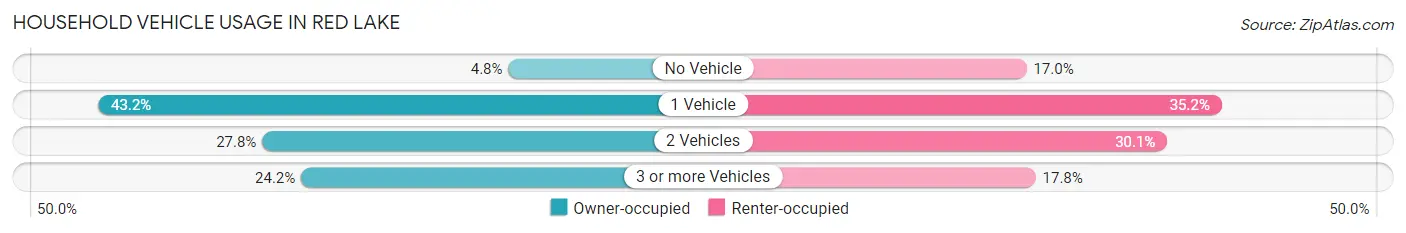
| Vehicles per Household | Owner-occupied | Renter-occupied |
| No Vehicle | 12 (4.8%) | 40 (17.0%) |
| 1 Vehicle | 107 (43.1%) | 83 (35.2%) |
| 2 Vehicles | 69 (27.8%) | 71 (30.1%) |
| 3 or more Vehicles | 60 (24.2%) | 42 (17.8%) |
| Total | 248 (100.0%) | 236 (100.0%) |
Real Estate & Mortgages in Red Lake
Real Estate and Mortgage Overview in Red Lake
| Characteristic | Without Mortgage | With Mortgage |
| Housing Units | 128 | 120 |
| Median Property Value | $110,700 | $334,100 |
| Median Household Income | $59,444 | $0 |
| Monthly Housing Costs | $398 | $0 |
| Real Estate Taxes | - | - |
Property Value by Mortgage Status in Red Lake
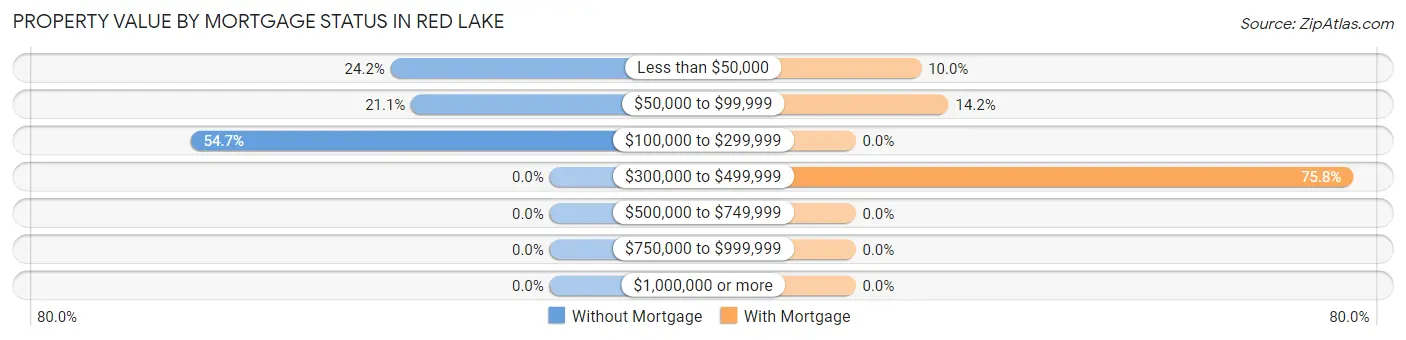
| Property Value | Without Mortgage | With Mortgage |
| Less than $50,000 | 31 (24.2%) | 12 (10.0%) |
| $50,000 to $99,999 | 27 (21.1%) | 17 (14.2%) |
| $100,000 to $299,999 | 70 (54.7%) | 0 (0.0%) |
| $300,000 to $499,999 | 0 (0.0%) | 91 (75.8%) |
| $500,000 to $749,999 | 0 (0.0%) | 0 (0.0%) |
| $750,000 to $999,999 | 0 (0.0%) | 0 (0.0%) |
| $1,000,000 or more | 0 (0.0%) | 0 (0.0%) |
| Total | 128 (100.0%) | 120 (100.0%) |
Household Income by Mortgage Status in Red Lake
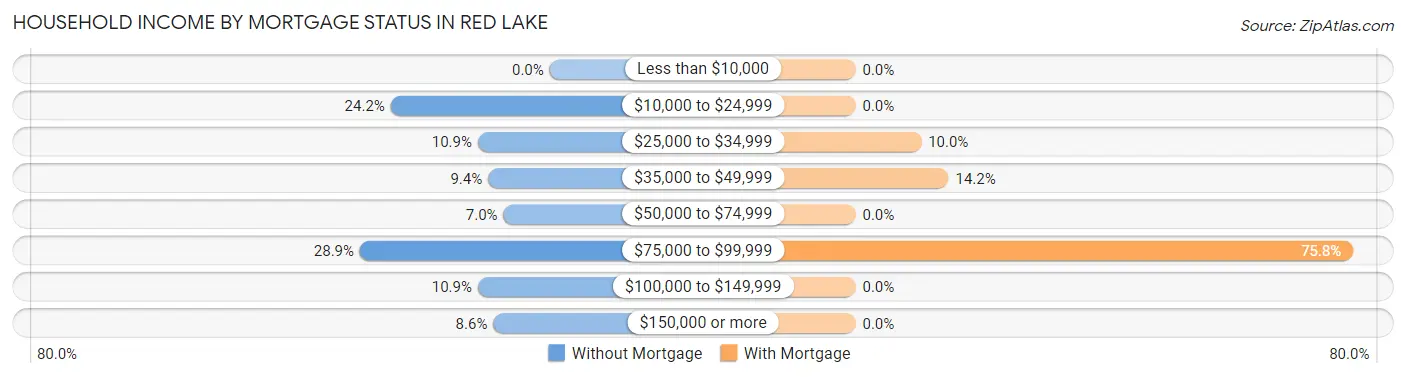
| Household Income | Without Mortgage | With Mortgage |
| Less than $10,000 | 0 (0.0%) | 0 (0.0%) |
| $10,000 to $24,999 | 31 (24.2%) | 0 (0.0%) |
| $25,000 to $34,999 | 14 (10.9%) | 12 (10.0%) |
| $35,000 to $49,999 | 12 (9.4%) | 17 (14.2%) |
| $50,000 to $74,999 | 9 (7.0%) | 0 (0.0%) |
| $75,000 to $99,999 | 37 (28.9%) | 91 (75.8%) |
| $100,000 to $149,999 | 14 (10.9%) | 0 (0.0%) |
| $150,000 or more | 11 (8.6%) | 0 (0.0%) |
| Total | 128 (100.0%) | 120 (100.0%) |
Property Value to Household Income Ratio in Red Lake
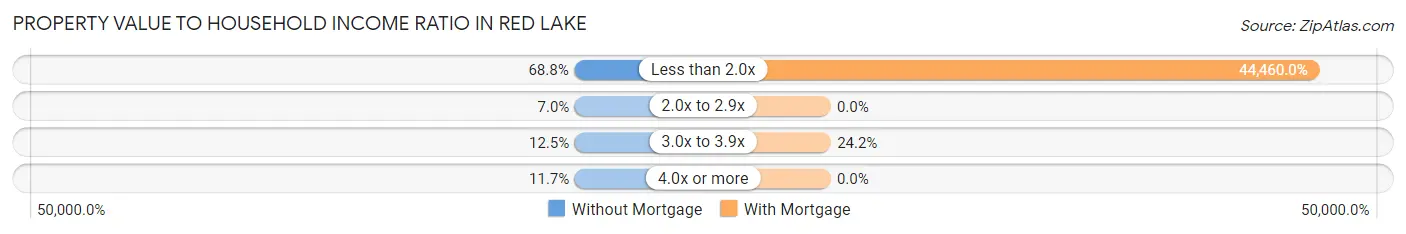
| Value-to-Income Ratio | Without Mortgage | With Mortgage |
| Less than 2.0x | 88 (68.8%) | 53,352 (44,460.0%) |
| 2.0x to 2.9x | 9 (7.0%) | 0 (0.0%) |
| 3.0x to 3.9x | 16 (12.5%) | 29 (24.2%) |
| 4.0x or more | 15 (11.7%) | 0 (0.0%) |
| Total | 128 (100.0%) | 120 (100.0%) |
Real Estate Taxes by Mortgage Status in Red Lake
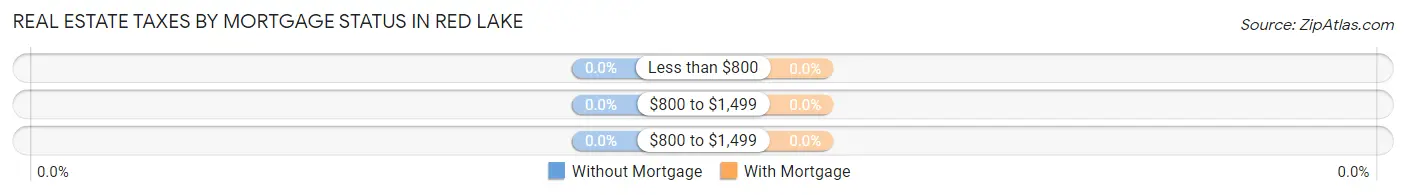
| Property Taxes | Without Mortgage | With Mortgage |
| Less than $800 | 0 (0.0%) | 0 (0.0%) |
| $800 to $1,499 | 0 (0.0%) | 0 (0.0%) |
| $800 to $1,499 | 0 (0.0%) | 0 (0.0%) |
| Total | 128 (100.0%) | 120 (100.0%) |
Health & Disability in Red Lake
Health Insurance Coverage by Age in Red Lake
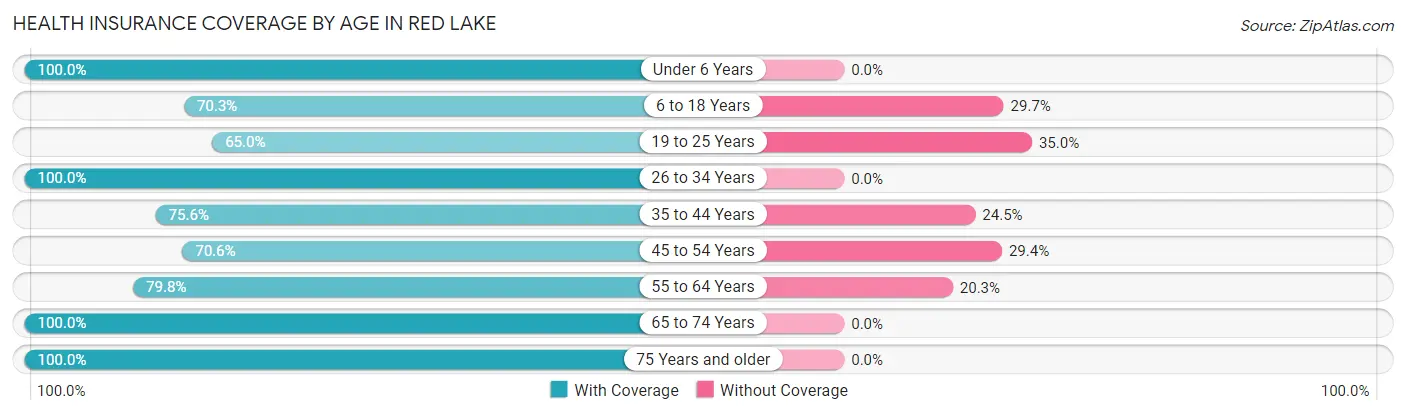
| Age Bracket | With Coverage | Without Coverage |
| Under 6 Years | 135 (100.0%) | 0 (0.0%) |
| 6 to 18 Years | 298 (70.3%) | 126 (29.7%) |
| 19 to 25 Years | 52 (65.0%) | 28 (35.0%) |
| 26 to 34 Years | 180 (100.0%) | 0 (0.0%) |
| 35 to 44 Years | 173 (75.5%) | 56 (24.4%) |
| 45 to 54 Years | 96 (70.6%) | 40 (29.4%) |
| 55 to 64 Years | 130 (79.7%) | 33 (20.3%) |
| 65 to 74 Years | 32 (100.0%) | 0 (0.0%) |
| 75 Years and older | 1 (100.0%) | 0 (0.0%) |
| Total | 1,097 (79.5%) | 283 (20.5%) |
Health Insurance Coverage by Citizenship Status in Red Lake
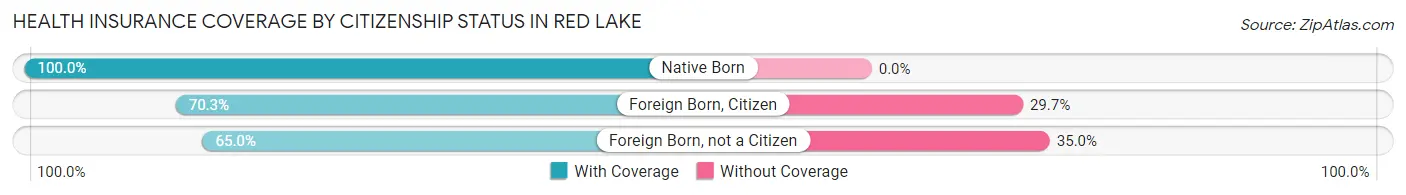
| Citizenship Status | With Coverage | Without Coverage |
| Native Born | 135 (100.0%) | 0 (0.0%) |
| Foreign Born, Citizen | 298 (70.3%) | 126 (29.7%) |
| Foreign Born, not a Citizen | 52 (65.0%) | 28 (35.0%) |
Health Insurance Coverage by Household Income in Red Lake
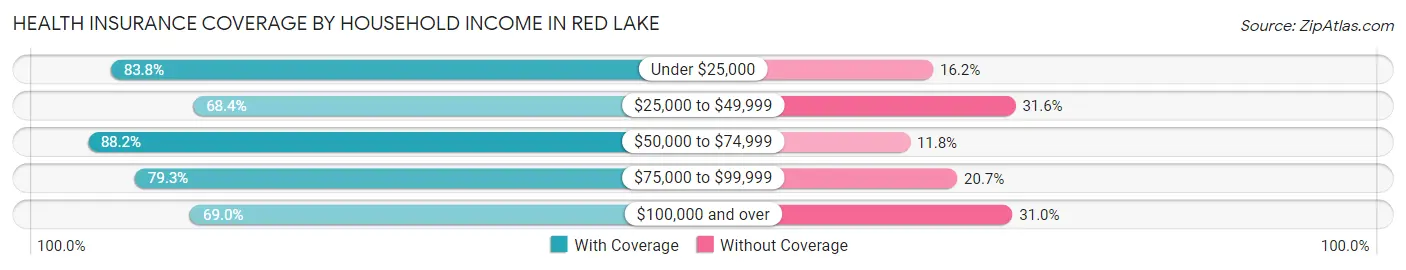
| Household Income | With Coverage | Without Coverage |
| Under $25,000 | 306 (83.8%) | 59 (16.2%) |
| $25,000 to $49,999 | 171 (68.4%) | 79 (31.6%) |
| $50,000 to $74,999 | 343 (88.2%) | 46 (11.8%) |
| $75,000 to $99,999 | 142 (79.3%) | 37 (20.7%) |
| $100,000 and over | 129 (69.0%) | 58 (31.0%) |
Public vs Private Health Insurance Coverage by Age in Red Lake
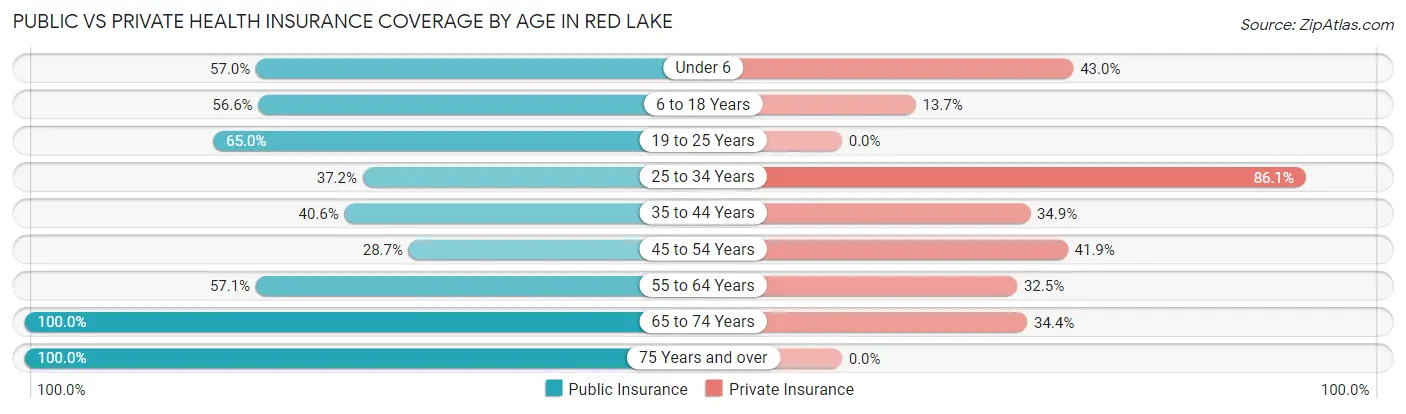
| Age Bracket | Public Insurance | Private Insurance |
| Under 6 | 77 (57.0%) | 58 (43.0%) |
| 6 to 18 Years | 240 (56.6%) | 58 (13.7%) |
| 19 to 25 Years | 52 (65.0%) | 0 (0.0%) |
| 25 to 34 Years | 67 (37.2%) | 155 (86.1%) |
| 35 to 44 Years | 93 (40.6%) | 80 (34.9%) |
| 45 to 54 Years | 39 (28.7%) | 57 (41.9%) |
| 55 to 64 Years | 93 (57.1%) | 53 (32.5%) |
| 65 to 74 Years | 32 (100.0%) | 11 (34.4%) |
| 75 Years and over | 1 (100.0%) | 0 (0.0%) |
| Total | 694 (50.3%) | 472 (34.2%) |
Disability Status by Sex by Age in Red Lake
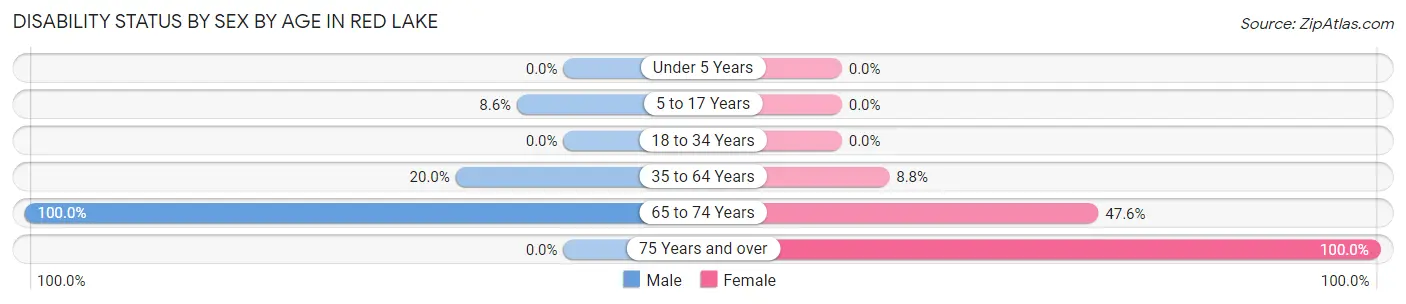
| Age Bracket | Male | Female |
| Under 5 Years | 0 (0.0%) | 0 (0.0%) |
| 5 to 17 Years | 15 (8.6%) | 0 (0.0%) |
| 18 to 34 Years | 0 (0.0%) | 0 (0.0%) |
| 35 to 64 Years | 58 (20.0%) | 21 (8.8%) |
| 65 to 74 Years | 11 (100.0%) | 10 (47.6%) |
| 75 Years and over | 0 (0.0%) | 1 (100.0%) |
Disability Class by Sex by Age in Red Lake
Disability Class: Hearing Difficulty
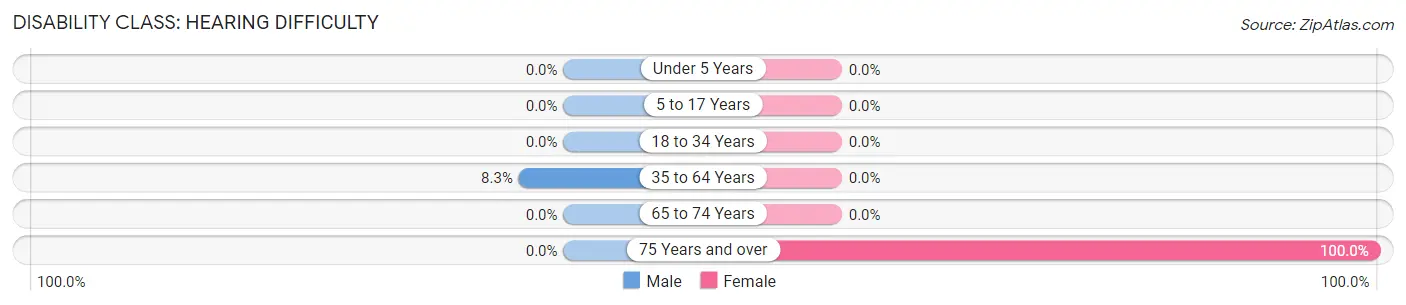
| Age Bracket | Male | Female |
| Under 5 Years | 0 (0.0%) | 0 (0.0%) |
| 5 to 17 Years | 0 (0.0%) | 0 (0.0%) |
| 18 to 34 Years | 0 (0.0%) | 0 (0.0%) |
| 35 to 64 Years | 24 (8.3%) | 0 (0.0%) |
| 65 to 74 Years | 0 (0.0%) | 0 (0.0%) |
| 75 Years and over | 0 (0.0%) | 1 (100.0%) |
Disability Class: Vision Difficulty
| Age Bracket | Male | Female |
| Under 5 Years | 0 (0.0%) | 0 (0.0%) |
| 5 to 17 Years | 0 (0.0%) | 0 (0.0%) |
| 18 to 34 Years | 0 (0.0%) | 0 (0.0%) |
| 35 to 64 Years | 0 (0.0%) | 0 (0.0%) |
| 65 to 74 Years | 0 (0.0%) | 0 (0.0%) |
| 75 Years and over | 0 (0.0%) | 0 (0.0%) |
Disability Class: Cognitive Difficulty
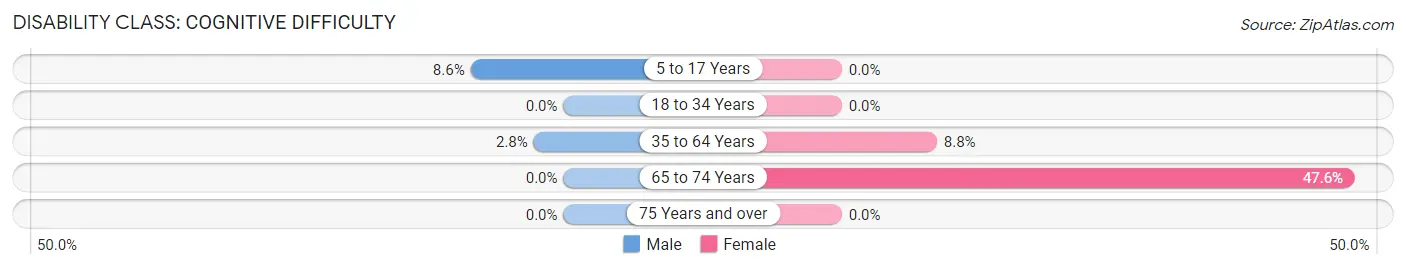
| Age Bracket | Male | Female |
| 5 to 17 Years | 15 (8.6%) | 0 (0.0%) |
| 18 to 34 Years | 0 (0.0%) | 0 (0.0%) |
| 35 to 64 Years | 8 (2.8%) | 21 (8.8%) |
| 65 to 74 Years | 0 (0.0%) | 10 (47.6%) |
| 75 Years and over | 0 (0.0%) | 0 (0.0%) |
Disability Class: Ambulatory Difficulty
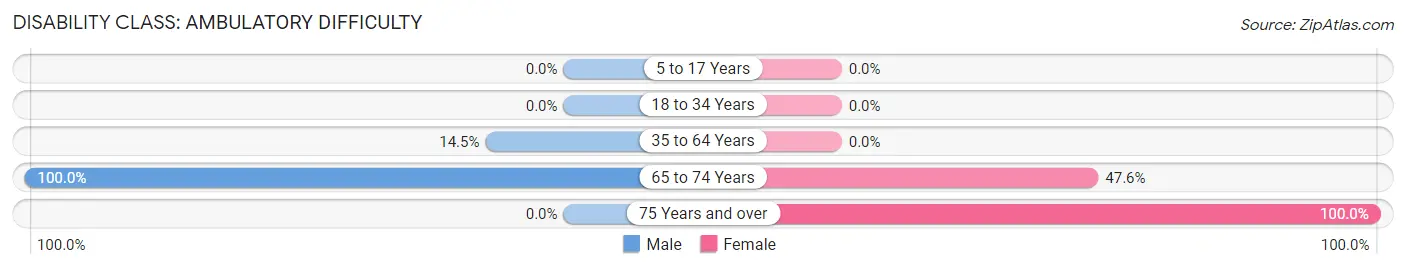
| Age Bracket | Male | Female |
| 5 to 17 Years | 0 (0.0%) | 0 (0.0%) |
| 18 to 34 Years | 0 (0.0%) | 0 (0.0%) |
| 35 to 64 Years | 42 (14.5%) | 0 (0.0%) |
| 65 to 74 Years | 11 (100.0%) | 10 (47.6%) |
| 75 Years and over | 0 (0.0%) | 1 (100.0%) |
Disability Class: Self-Care Difficulty
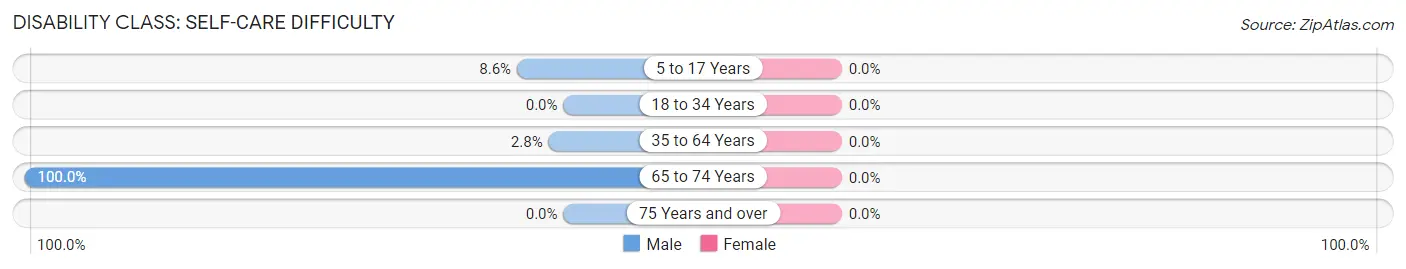
| Age Bracket | Male | Female |
| 5 to 17 Years | 15 (8.6%) | 0 (0.0%) |
| 18 to 34 Years | 0 (0.0%) | 0 (0.0%) |
| 35 to 64 Years | 8 (2.8%) | 0 (0.0%) |
| 65 to 74 Years | 11 (100.0%) | 0 (0.0%) |
| 75 Years and over | 0 (0.0%) | 0 (0.0%) |
Technology Access in Red Lake
Computing Device Access in Red Lake
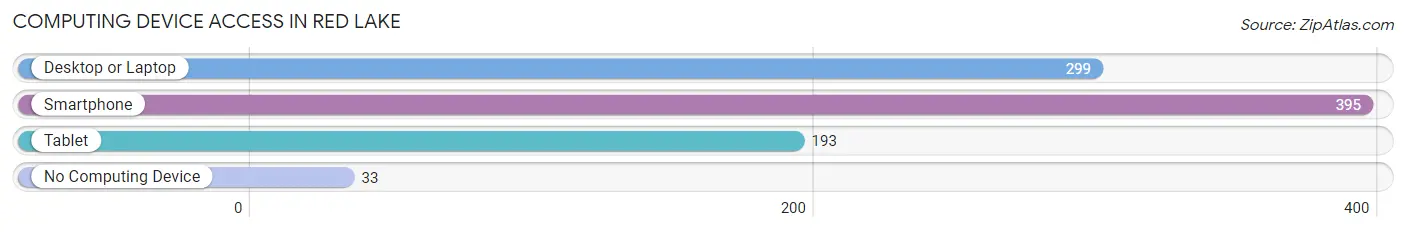
| Device Type | # Households | % Households |
| Desktop or Laptop | 299 | 61.8% |
| Smartphone | 395 | 81.6% |
| Tablet | 193 | 39.9% |
| No Computing Device | 33 | 6.8% |
| Total | 484 | 100.0% |
Internet Access in Red Lake
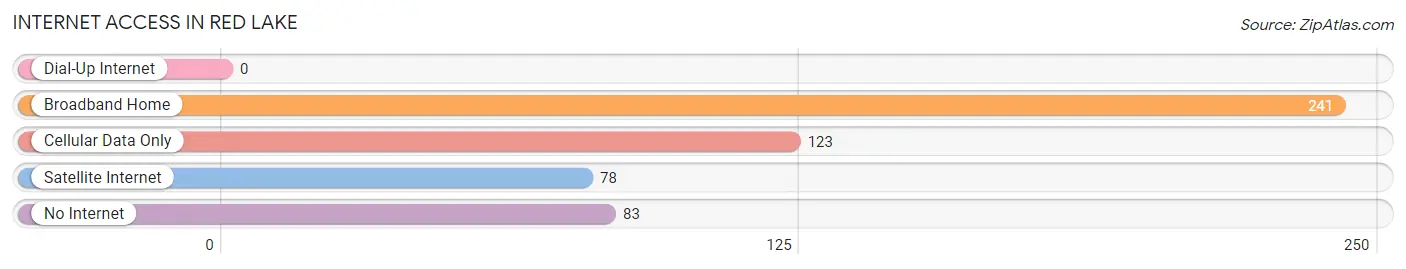
| Internet Type | # Households | % Households |
| Dial-Up Internet | 0 | 0.0% |
| Broadband Home | 241 | 49.8% |
| Cellular Data Only | 123 | 25.4% |
| Satellite Internet | 78 | 16.1% |
| No Internet | 83 | 17.2% |
| Total | 484 | 100.0% |
Red Lake Summary
Red Lake, Minnesota is a small town located in the northwest corner of the state, near the Canadian border. It is the only town in the Red Lake Indian Reservation, which is home to the Red Lake Band of Chippewa Indians. The town has a population of just over 1,000 people, and is the largest community in the reservation.
Geography
Red Lake is located in the northwest corner of Minnesota, near the Canadian border. It is situated on the Red Lake Indian Reservation, which is home to the Red Lake Band of Chippewa Indians. The town is located on the shores of Red Lake, which is the largest lake in the state. The lake is approximately 25 miles long and 10 miles wide, and is known for its excellent fishing. The town is surrounded by forests and wetlands, and is home to a variety of wildlife, including deer, bear, and moose.
History
The Red Lake Indian Reservation was established in 1889, and the town of Red Lake was founded in the early 1900s. The town was originally a trading post for the Chippewa Indians, and was later used as a base for the logging industry. The town was also home to a number of sawmills, which provided employment for many of the town’s residents.
In the 1950s, the town began to experience a decline in population as many of the residents moved away in search of better economic opportunities. The town’s population continued to decline until the late 1990s, when it began to experience a resurgence. Today, the town is home to a variety of businesses, including a casino, a hotel, and a number of restaurants.
Economy
The economy of Red Lake is largely based on tourism and the gaming industry. The town is home to the Red Lake Casino, which is the largest casino in the state. The casino attracts visitors from all over the region, and provides employment for many of the town’s residents. The town is also home to a number of restaurants, hotels, and other businesses, which provide additional employment opportunities.
In addition to the gaming industry, the town is also home to a number of small businesses, including a grocery store, a hardware store, and a number of other retail outlets. The town is also home to a number of manufacturing businesses, which produce a variety of products, including furniture, clothing, and other items.
Demographics
As of the 2010 census, the population of Red Lake was 1,073. The town is predominantly Native American, with the majority of the population being of Chippewa descent. The town also has a small population of African Americans, Hispanics, and other ethnicities. The median household income in the town is $25,000, and the median age is 33.
Red Lake is a small town with a rich history and a vibrant economy. The town is home to a variety of businesses, and provides employment opportunities for many of its residents. The town is also home to a number of cultural attractions, including the Red Lake Casino, which attracts visitors from all over the region. Red Lake is a great place to live, work, and play, and is a great example of a small town with a big heart.
Common Questions
What is Per Capita Income in Red Lake?
Per Capita income in Red Lake is $16,934.
What is the Median Family Income in Red Lake?
Median Family Income in Red Lake is $43,068.
What is the Median Household income in Red Lake?
Median Household Income in Red Lake is $52,929.
What is Income or Wage Gap in Red Lake?
Income or Wage Gap in Red Lake is 2.4%.
Women in Red Lake earn 97.6 cents for every dollar earned by a man.
What is Inequality or Gini Index in Red Lake?
Inequality or Gini Index in Red Lake is 0.38.
What is the Total Population of Red Lake?
Total Population of Red Lake is 1,435.
What is the Total Male Population of Red Lake?
Total Male Population of Red Lake is 740.
What is the Total Female Population of Red Lake?
Total Female Population of Red Lake is 695.
What is the Ratio of Males per 100 Females in Red Lake?
There are 106.47 Males per 100 Females in Red Lake.
What is the Ratio of Females per 100 Males in Red Lake?
There are 93.92 Females per 100 Males in Red Lake.
What is the Median Population Age in Red Lake?
Median Population Age in Red Lake is 31.1 Years.
What is the Average Family Size in Red Lake
Average Family Size in Red Lake is 3.5 People.
What is the Average Household Size in Red Lake
Average Household Size in Red Lake is 2.8 People.
How Large is the Labor Force in Red Lake?
There are 590 People in the Labor Forcein in Red Lake.
What is the Percentage of People in the Labor Force in Red Lake?
60.5% of People are in the Labor Force in Red Lake.
What is the Unemployment Rate in Red Lake?
Unemployment Rate in Red Lake is 19.2%.