Ely, MN Map & Demographics
Ely Map
Ely Overview
$31,318
PER CAPITA INCOME
$98,029
AVG FAMILY INCOME
$47,095
AVG HOUSEHOLD INCOME
19.2%
WAGE / INCOME GAP [ % ]
80.8¢/ $1
WAGE / INCOME GAP [ $ ]
0.45
INEQUALITY / GINI INDEX
3,265
TOTAL POPULATION
1,608
MALE POPULATION
1,657
FEMALE POPULATION
97.04
MALES / 100 FEMALES
103.05
FEMALES / 100 MALES
46.3
MEDIAN AGE
2.9
AVG FAMILY SIZE
1.8
AVG HOUSEHOLD SIZE
1,728
LABOR FORCE [ PEOPLE ]
57.4%
PERCENT IN LABOR FORCE
2.8%
UNEMPLOYMENT RATE
Ely Zip Codes
Ely Area Codes
Income in Ely
Income Overview in Ely
Per Capita Income in Ely is $31,318, while median incomes of families and households are $98,029 and $47,095 respectively.
| Characteristic | Number | Measure |
| Per Capita Income | 3,265 | $31,318 |
| Median Family Income | 591 | $98,029 |
| Mean Family Income | 591 | $99,083 |
| Median Household Income | 1,644 | $47,095 |
| Mean Household Income | 1,644 | $60,423 |
| Income Deficit | 591 | $0 |
| Wage / Income Gap (%) | 3,265 | 19.24% |
| Wage / Income Gap ($) | 3,265 | 80.76¢ per $1 |
| Gini / Inequality Index | 3,265 | 0.45 |
Earnings by Sex in Ely
Average Earnings in Ely are $30,479, $35,655 for men and $28,795 for women, a difference of 19.2%.
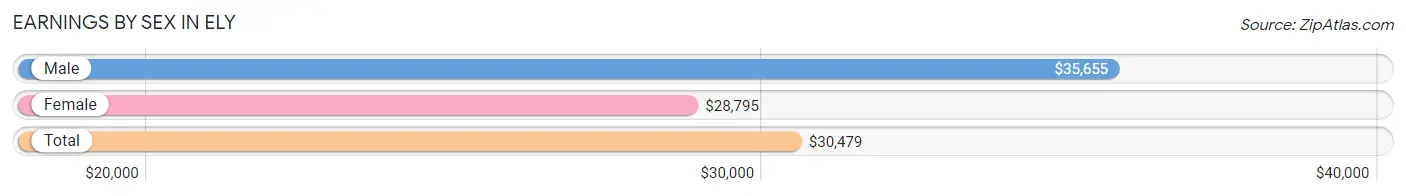
| Sex | Number | Average Earnings |
| Male | 1,121 (53.7%) | $35,655 |
| Female | 965 (46.3%) | $28,795 |
| Total | 2,086 (100.0%) | $30,479 |
Earnings by Sex by Income Bracket in Ely
The most common earnings brackets in Ely are $2,499 or less for men (201 | 17.9%) and $25,000 to $29,999 for women (147 | 15.2%).
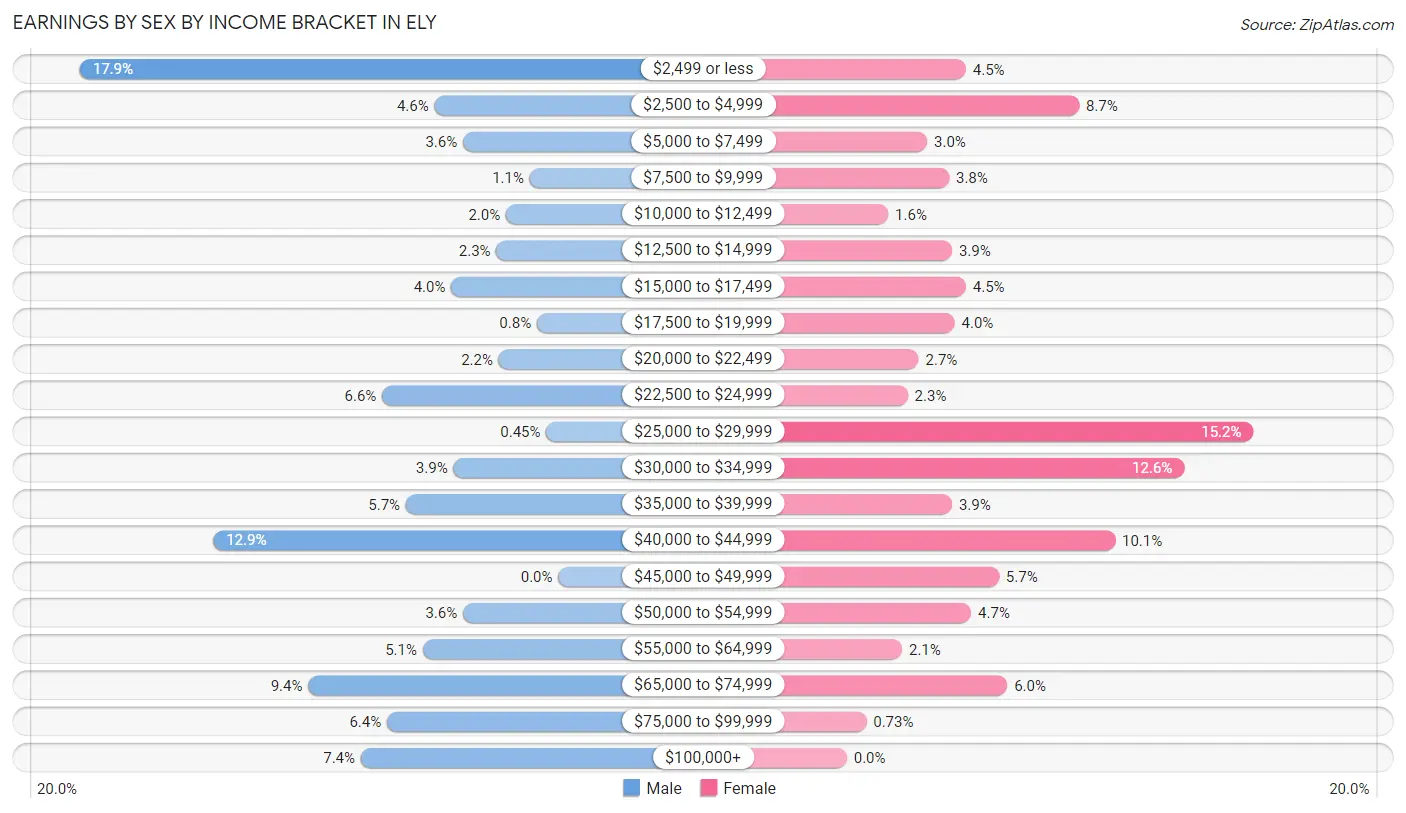
| Income | Male | Female |
| $2,499 or less | 201 (17.9%) | 43 (4.5%) |
| $2,500 to $4,999 | 52 (4.6%) | 84 (8.7%) |
| $5,000 to $7,499 | 40 (3.6%) | 29 (3.0%) |
| $7,500 to $9,999 | 12 (1.1%) | 37 (3.8%) |
| $10,000 to $12,499 | 22 (2.0%) | 15 (1.5%) |
| $12,500 to $14,999 | 26 (2.3%) | 38 (3.9%) |
| $15,000 to $17,499 | 45 (4.0%) | 43 (4.5%) |
| $17,500 to $19,999 | 9 (0.8%) | 39 (4.0%) |
| $20,000 to $22,499 | 25 (2.2%) | 26 (2.7%) |
| $22,500 to $24,999 | 74 (6.6%) | 22 (2.3%) |
| $25,000 to $29,999 | 5 (0.4%) | 147 (15.2%) |
| $30,000 to $34,999 | 44 (3.9%) | 122 (12.6%) |
| $35,000 to $39,999 | 64 (5.7%) | 38 (3.9%) |
| $40,000 to $44,999 | 145 (12.9%) | 97 (10.1%) |
| $45,000 to $49,999 | 0 (0.0%) | 55 (5.7%) |
| $50,000 to $54,999 | 40 (3.6%) | 45 (4.7%) |
| $55,000 to $64,999 | 57 (5.1%) | 20 (2.1%) |
| $65,000 to $74,999 | 105 (9.4%) | 58 (6.0%) |
| $75,000 to $99,999 | 72 (6.4%) | 7 (0.7%) |
| $100,000+ | 83 (7.4%) | 0 (0.0%) |
| Total | 1,121 (100.0%) | 965 (100.0%) |
Earnings by Sex by Educational Attainment in Ely
Average earnings in Ely are $41,557 for men and $32,461 for women, a difference of 21.9%. Men with an educational attainment of bachelor's degree enjoy the highest average annual earnings of $71,333, while those with less than high school education earn the least with $2,499. Women with an educational attainment of graduate degree earn the most with the average annual earnings of $43,889, while those with high school diploma education have the smallest earnings of $28,782.
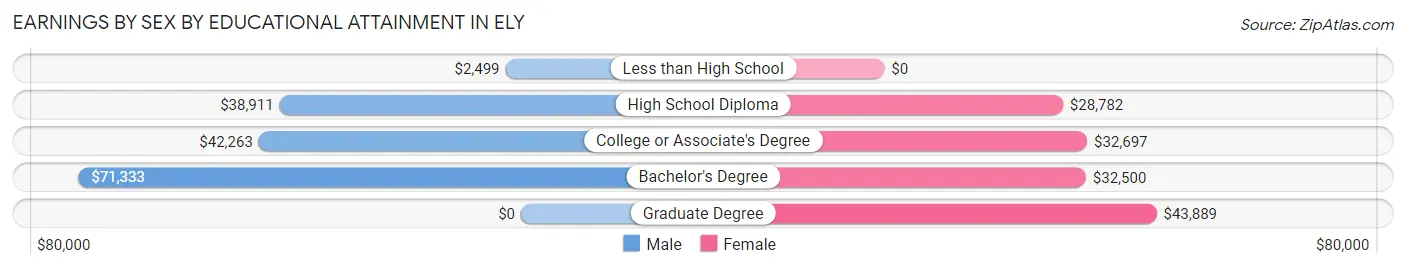
| Educational Attainment | Male Income | Female Income |
| Less than High School | $2,499 | $0 |
| High School Diploma | $38,911 | $28,782 |
| College or Associate's Degree | $42,263 | $32,697 |
| Bachelor's Degree | $71,333 | $32,500 |
| Graduate Degree | - | - |
| Total | $41,557 | $32,461 |
Family Income in Ely
Family Income Brackets in Ely
According to the Ely family income data, there are 200 families falling into the $100,000 to $149,999 income range, which is the most common income bracket and makes up 33.8% of all families.
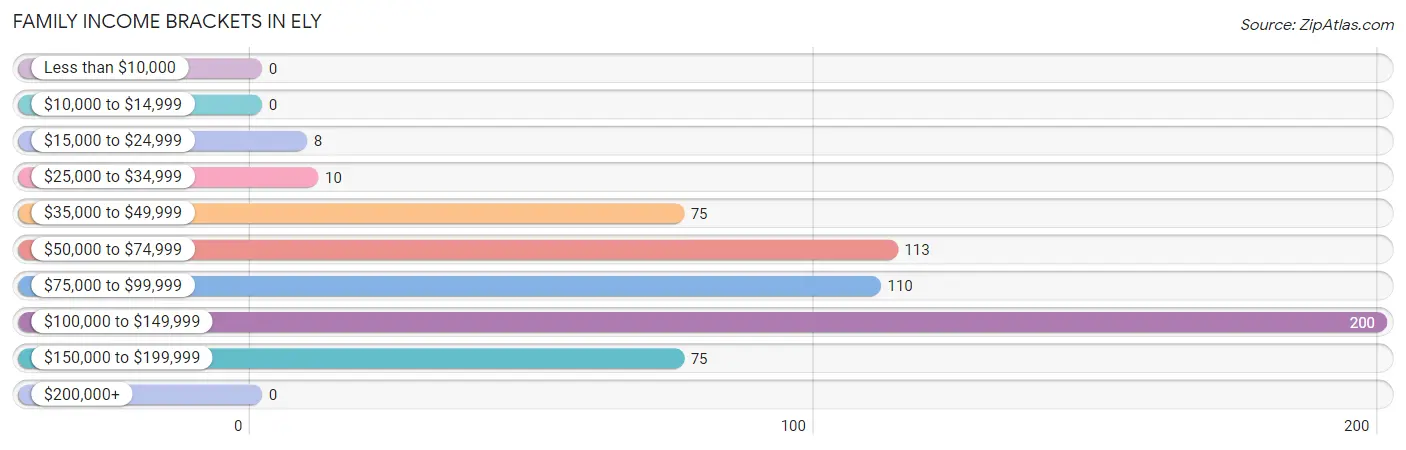
| Income Bracket | # Families | % Families |
| Less than $10,000 | 0 | 0.0% |
| $10,000 to $14,999 | 0 | 0.0% |
| $15,000 to $24,999 | 8 | 1.4% |
| $25,000 to $34,999 | 10 | 1.7% |
| $35,000 to $49,999 | 75 | 12.7% |
| $50,000 to $74,999 | 113 | 19.1% |
| $75,000 to $99,999 | 110 | 18.6% |
| $100,000 to $149,999 | 200 | 33.8% |
| $150,000 to $199,999 | 75 | 12.7% |
| $200,000+ | 0 | 0.0% |
Family Income by Famaliy Size in Ely
4-person families (135 | 22.8%) account for the highest median family income in Ely with $113,935 per family, while 2-person families (312 | 52.8%) have the highest median income of $36,250 per family member.
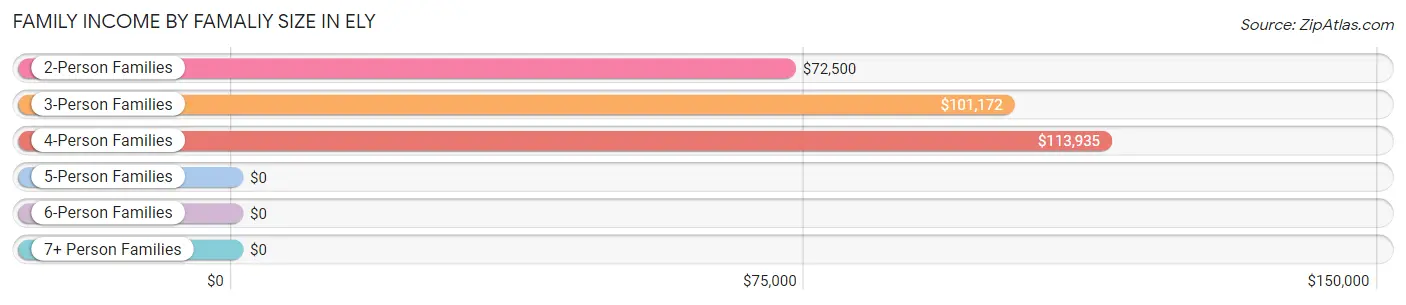
| Income Bracket | # Families | Median Income |
| 2-Person Families | 312 (52.8%) | $72,500 |
| 3-Person Families | 109 (18.4%) | $101,172 |
| 4-Person Families | 135 (22.8%) | $113,935 |
| 5-Person Families | 35 (5.9%) | $0 |
| 6-Person Families | 0 (0.0%) | $0 |
| 7+ Person Families | 0 (0.0%) | $0 |
| Total | 591 (100.0%) | $98,029 |
Family Income by Number of Earners in Ely
The median family income in Ely is $98,029, with families comprising 3+ earners (115) having the highest median family income of $145,893, while families with no earners (86) have the lowest median family income of $58,056, accounting for 19.5% and 14.5% of families, respectively.
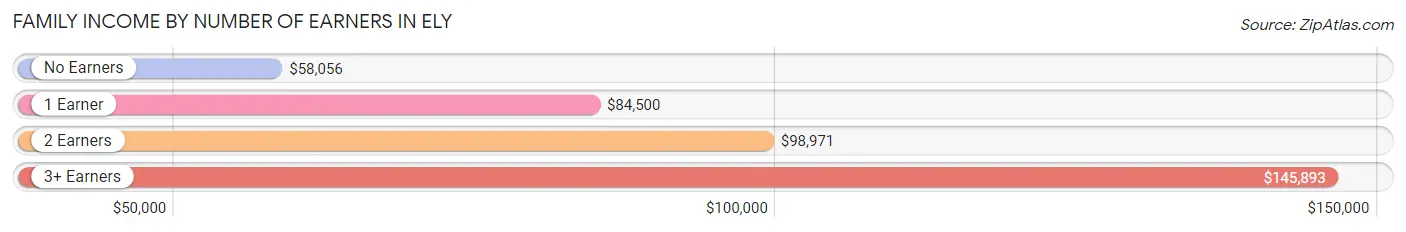
| Number of Earners | # Families | Median Income |
| No Earners | 86 (14.5%) | $58,056 |
| 1 Earner | 134 (22.7%) | $84,500 |
| 2 Earners | 256 (43.3%) | $98,971 |
| 3+ Earners | 115 (19.5%) | $145,893 |
| Total | 591 (100.0%) | $98,029 |
Household Income in Ely
Household Income Brackets in Ely
With 255 households falling in the category, the $35,000 to $49,999 income range is the most frequent in Ely, accounting for 15.5% of all households.
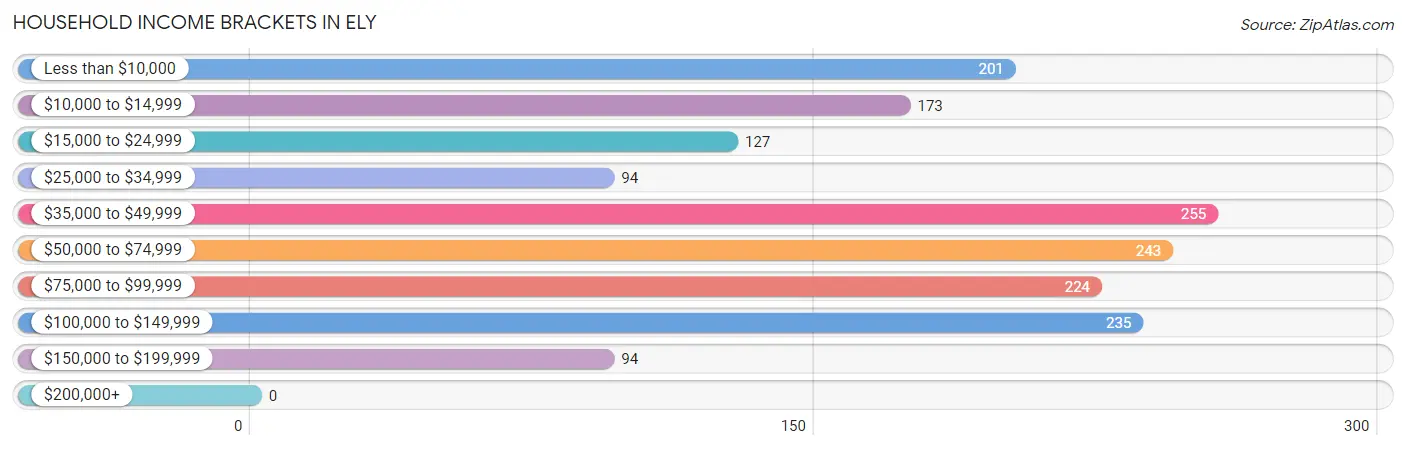
| Income Bracket | # Households | % Households |
| Less than $10,000 | 201 | 12.2% |
| $10,000 to $14,999 | 173 | 10.5% |
| $15,000 to $24,999 | 127 | 7.7% |
| $25,000 to $34,999 | 94 | 5.7% |
| $35,000 to $49,999 | 255 | 15.5% |
| $50,000 to $74,999 | 243 | 14.8% |
| $75,000 to $99,999 | 224 | 13.6% |
| $100,000 to $149,999 | 235 | 14.3% |
| $150,000 to $199,999 | 94 | 5.7% |
| $200,000+ | 0 | 0.0% |
Household Income by Householder Age in Ely
The median household income in Ely is $47,095, with the highest median household income of $58,750 found in the 45 to 64 years age bracket for the primary householder. A total of 652 households (39.7%) fall into this category. Meanwhile, the 15 to 24 years age bracket for the primary householder has the lowest median household income of $0, with 64 households (3.9%) in this group.
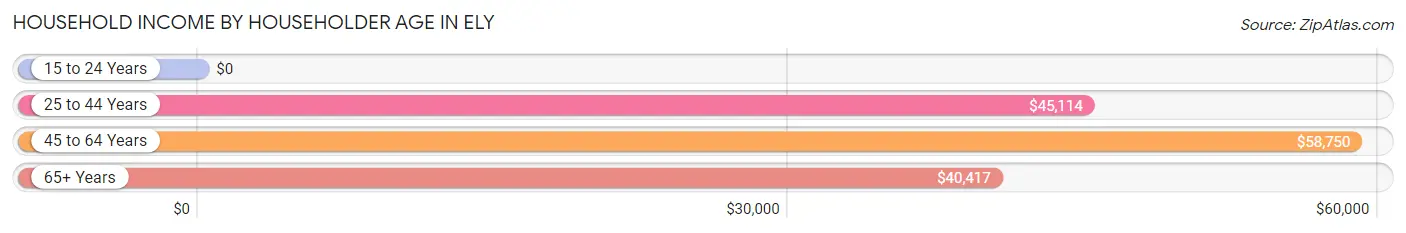
| Income Bracket | # Households | Median Income |
| 15 to 24 Years | 64 (3.9%) | $0 |
| 25 to 44 Years | 377 (22.9%) | $45,114 |
| 45 to 64 Years | 652 (39.7%) | $58,750 |
| 65+ Years | 551 (33.5%) | $40,417 |
| Total | 1,644 (100.0%) | $47,095 |
Poverty in Ely
Income Below Poverty by Sex and Age in Ely
With 13.7% poverty level for males and 13.4% for females among the residents of Ely, 55 to 64 year old males and 65 to 74 year old females are the most vulnerable to poverty, with 129 males (33.8%) and 102 females (37.6%) in their respective age groups living below the poverty level.
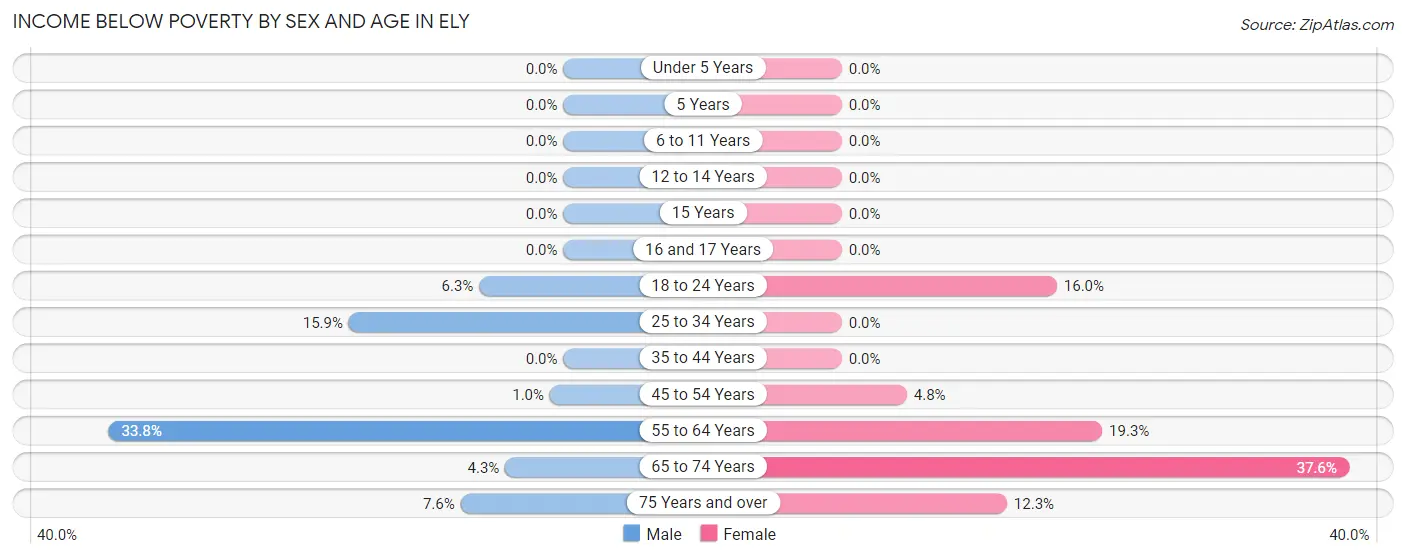
| Age Bracket | Male | Female |
| Under 5 Years | 0 (0.0%) | 0 (0.0%) |
| 5 Years | 0 (0.0%) | 0 (0.0%) |
| 6 to 11 Years | 0 (0.0%) | 0 (0.0%) |
| 12 to 14 Years | 0 (0.0%) | 0 (0.0%) |
| 15 Years | 0 (0.0%) | 0 (0.0%) |
| 16 and 17 Years | 0 (0.0%) | 0 (0.0%) |
| 18 to 24 Years | 12 (6.2%) | 19 (16.0%) |
| 25 to 34 Years | 43 (15.9%) | 0 (0.0%) |
| 35 to 44 Years | 0 (0.0%) | 0 (0.0%) |
| 45 to 54 Years | 1 (1.0%) | 10 (4.8%) |
| 55 to 64 Years | 129 (33.8%) | 52 (19.3%) |
| 65 to 74 Years | 8 (4.3%) | 102 (37.6%) |
| 75 Years and over | 9 (7.6%) | 19 (12.3%) |
| Total | 202 (13.7%) | 202 (13.4%) |
Income Above Poverty by Sex and Age in Ely
According to the poverty statistics in Ely, males aged under 5 years and females aged under 5 years are the age groups that are most secure financially, with 100.0% of males and 100.0% of females in these age groups living above the poverty line.
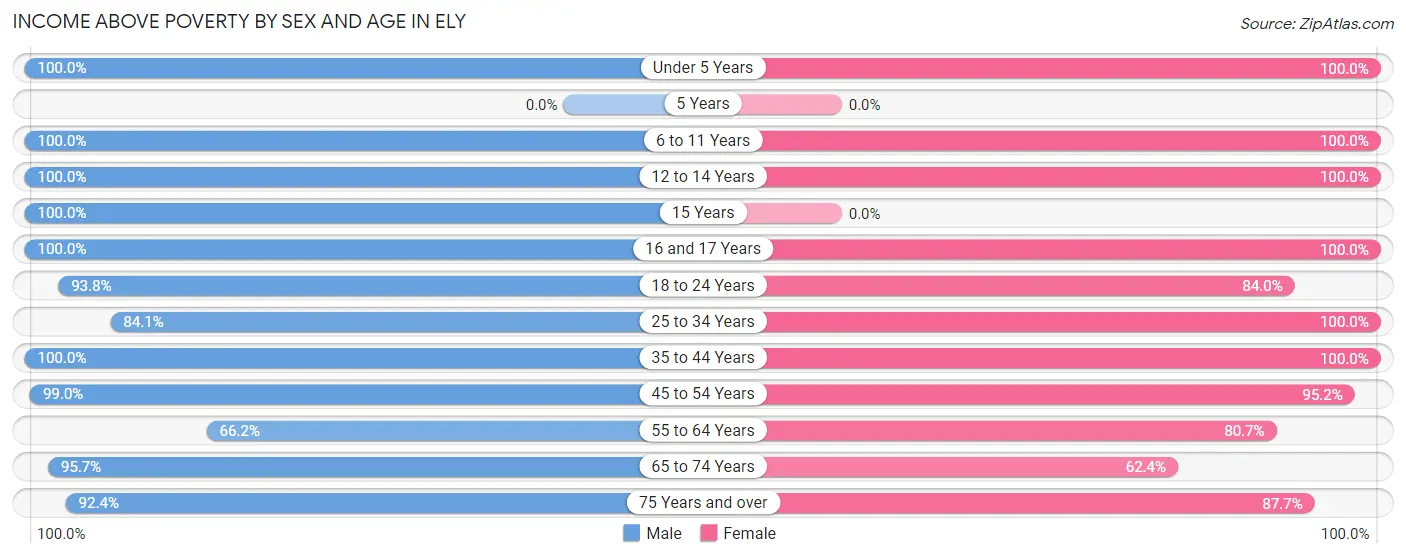
| Age Bracket | Male | Female |
| Under 5 Years | 14 (100.0%) | 24 (100.0%) |
| 5 Years | 0 (0.0%) | 0 (0.0%) |
| 6 to 11 Years | 25 (100.0%) | 93 (100.0%) |
| 12 to 14 Years | 26 (100.0%) | 64 (100.0%) |
| 15 Years | 9 (100.0%) | 0 (0.0%) |
| 16 and 17 Years | 36 (100.0%) | 76 (100.0%) |
| 18 to 24 Years | 180 (93.8%) | 100 (84.0%) |
| 25 to 34 Years | 227 (84.1%) | 121 (100.0%) |
| 35 to 44 Years | 115 (100.0%) | 105 (100.0%) |
| 45 to 54 Years | 99 (99.0%) | 197 (95.2%) |
| 55 to 64 Years | 253 (66.2%) | 217 (80.7%) |
| 65 to 74 Years | 177 (95.7%) | 169 (62.4%) |
| 75 Years and over | 109 (92.4%) | 136 (87.7%) |
| Total | 1,270 (86.3%) | 1,302 (86.6%) |
Income Below Poverty Among Married-Couple Families in Ely
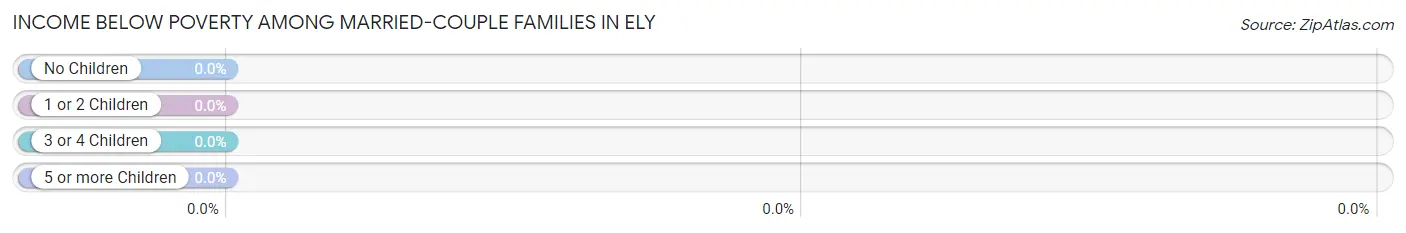
| Children | Above Poverty | Below Poverty |
| No Children | 310 (100.0%) | 0 (0.0%) |
| 1 or 2 Children | 158 (100.0%) | 0 (0.0%) |
| 3 or 4 Children | 0 (0.0%) | 0 (0.0%) |
| 5 or more Children | 0 (0.0%) | 0 (0.0%) |
| Total | 468 (100.0%) | 0 (0.0%) |
Income Below Poverty Among Single-Parent Households in Ely
| Children | Single Father | Single Mother |
| No Children | 0 (0.0%) | 0 (0.0%) |
| 1 or 2 Children | 0 (0.0%) | 0 (0.0%) |
| 3 or 4 Children | 0 (0.0%) | 0 (0.0%) |
| 5 or more Children | 0 (0.0%) | 0 (0.0%) |
| Total | 0 (0.0%) | 0 (0.0%) |
Income Below Poverty Among Married-Couple vs Single-Parent Households in Ely
| Children | Married-Couple Families | Single-Parent Households |
| No Children | 0 (0.0%) | 0 (0.0%) |
| 1 or 2 Children | 0 (0.0%) | 0 (0.0%) |
| 3 or 4 Children | 0 (0.0%) | 0 (0.0%) |
| 5 or more Children | 0 (0.0%) | 0 (0.0%) |
| Total | 0 (0.0%) | 0 (0.0%) |
Race in Ely
The most populous races in Ely are White / Caucasian (3,049 | 93.4%), Two or more Races (99 | 3.0%), and Hispanic or Latino (73 | 2.2%).
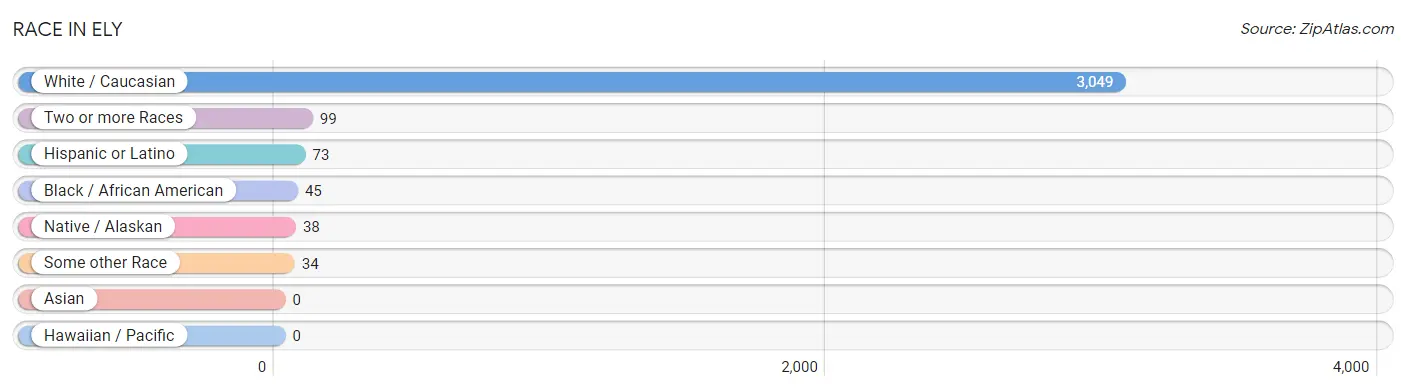
| Race | # Population | % Population |
| Asian | 0 | 0.0% |
| Black / African American | 45 | 1.4% |
| Hawaiian / Pacific | 0 | 0.0% |
| Hispanic or Latino | 73 | 2.2% |
| Native / Alaskan | 38 | 1.2% |
| White / Caucasian | 3,049 | 93.4% |
| Two or more Races | 99 | 3.0% |
| Some other Race | 34 | 1.0% |
| Total | 3,265 | 100.0% |
Ancestry in Ely
The most populous ancestries reported in Ely are German (733 | 22.5%), Finnish (413 | 12.7%), Slovene (411 | 12.6%), Irish (362 | 11.1%), and Norwegian (289 | 8.8%), together accounting for 67.6% of all Ely residents.
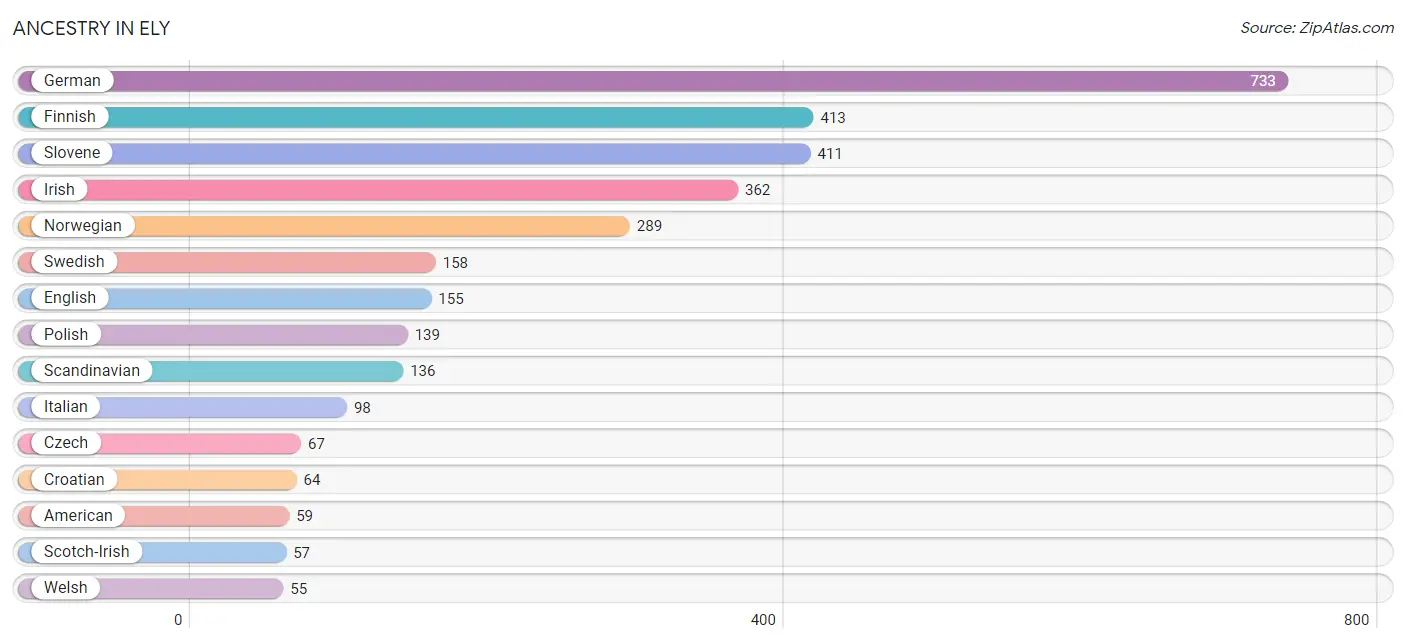
| Ancestry | # Population | % Population |
| American | 59 | 1.8% |
| Austrian | 52 | 1.6% |
| Central American | 39 | 1.2% |
| Chippewa | 45 | 1.4% |
| Choctaw | 12 | 0.4% |
| Croatian | 64 | 2.0% |
| Czech | 67 | 2.1% |
| Danish | 21 | 0.6% |
| Dutch | 50 | 1.5% |
| English | 155 | 4.8% |
| European | 43 | 1.3% |
| Finnish | 413 | 12.7% |
| French | 27 | 0.8% |
| French Canadian | 46 | 1.4% |
| German | 733 | 22.5% |
| Greek | 30 | 0.9% |
| Guatemalan | 39 | 1.2% |
| Haitian | 20 | 0.6% |
| Hungarian | 22 | 0.7% |
| Irish | 362 | 11.1% |
| Italian | 98 | 3.0% |
| Korean | 14 | 0.4% |
| Lithuanian | 38 | 1.2% |
| Mexican | 34 | 1.0% |
| Norwegian | 289 | 8.8% |
| Pennsylvania German | 9 | 0.3% |
| Polish | 139 | 4.3% |
| Russian | 16 | 0.5% |
| Samoan | 3 | 0.1% |
| Scandinavian | 136 | 4.2% |
| Scotch-Irish | 57 | 1.8% |
| Scottish | 36 | 1.1% |
| Seminole | 3 | 0.1% |
| Slavic | 34 | 1.0% |
| Slovak | 5 | 0.2% |
| Slovene | 411 | 12.6% |
| Swedish | 158 | 4.8% |
| Swiss | 27 | 0.8% |
| Ukrainian | 7 | 0.2% |
| Welsh | 55 | 1.7% |
| Yugoslavian | 25 | 0.8% | View All 41 Rows |
Immigrants in Ely
The most numerous immigrant groups reported in Ely came from Canada (28 | 0.9%), Europe (20 | 0.6%), Central America (11 | 0.3%), Latin America (11 | 0.3%), and Mexico (11 | 0.3%), together accounting for 2.5% of all Ely residents.
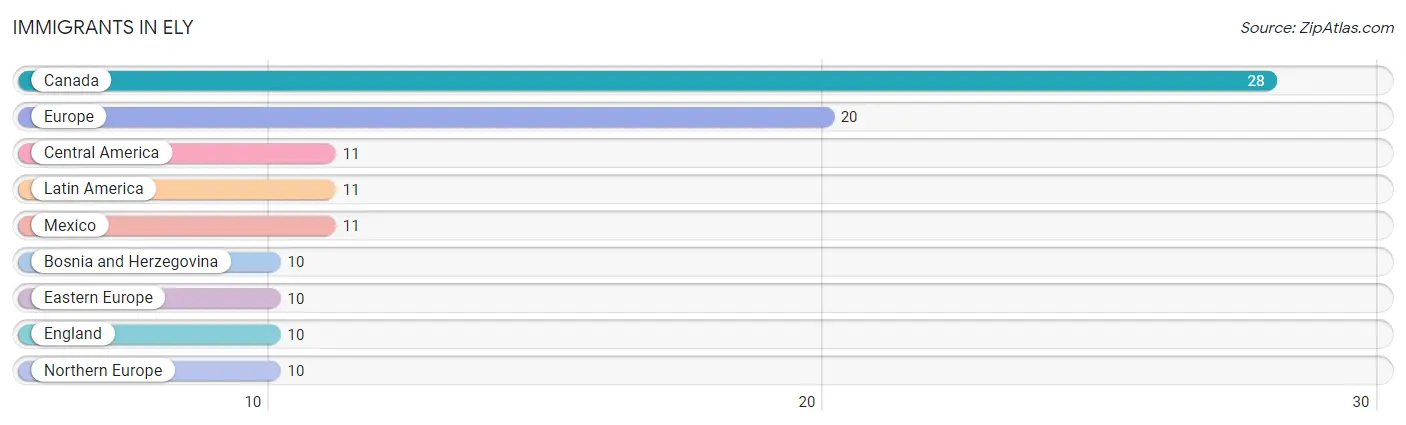
| Immigration Origin | # Population | % Population |
| Bosnia and Herzegovina | 10 | 0.3% |
| Canada | 28 | 0.9% |
| Central America | 11 | 0.3% |
| Eastern Europe | 10 | 0.3% |
| England | 10 | 0.3% |
| Europe | 20 | 0.6% |
| Latin America | 11 | 0.3% |
| Mexico | 11 | 0.3% |
| Northern Europe | 10 | 0.3% | View All 9 Rows |
Sex and Age in Ely
Sex and Age in Ely
The most populous age groups in Ely are 15 to 19 Years (220 | 13.7%) for men and 15 to 19 Years (225 | 13.6%) for women.
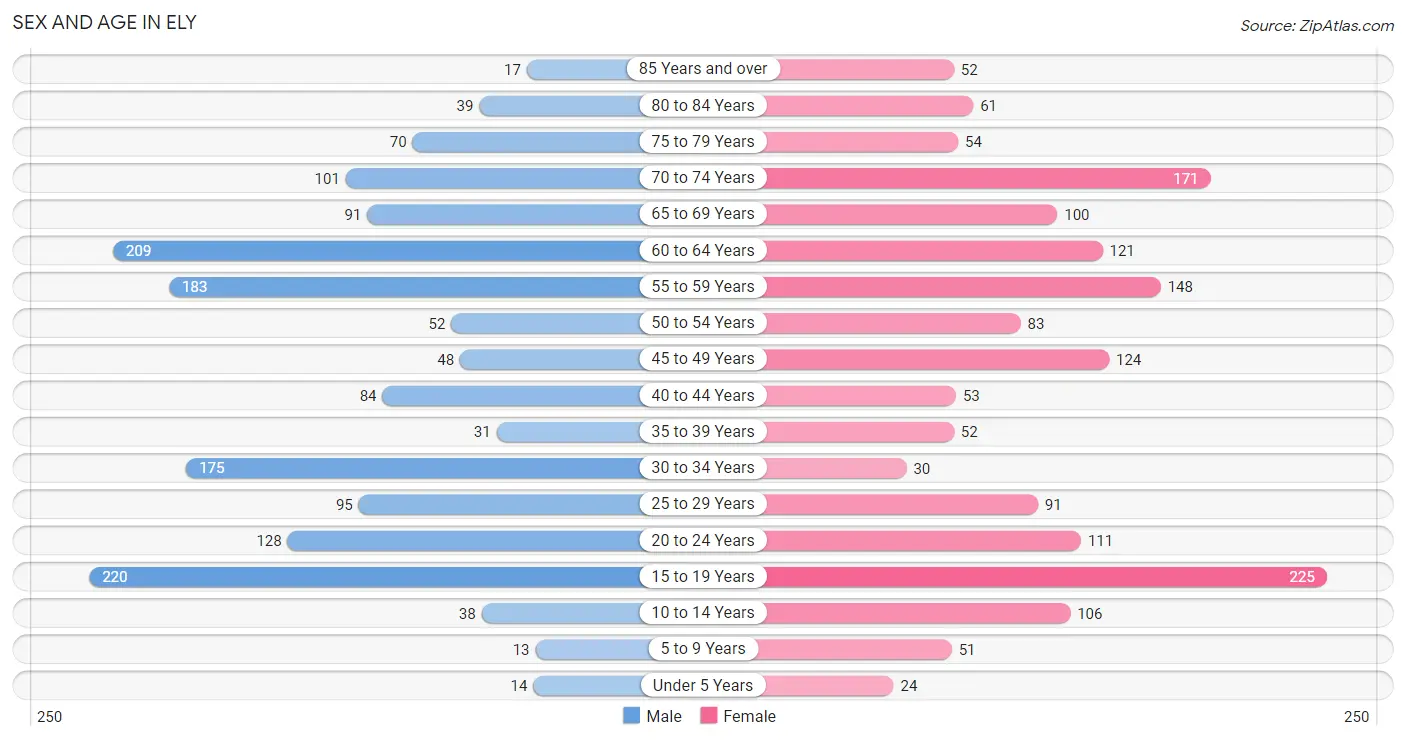
| Age Bracket | Male | Female |
| Under 5 Years | 14 (0.9%) | 24 (1.5%) |
| 5 to 9 Years | 13 (0.8%) | 51 (3.1%) |
| 10 to 14 Years | 38 (2.4%) | 106 (6.4%) |
| 15 to 19 Years | 220 (13.7%) | 225 (13.6%) |
| 20 to 24 Years | 128 (8.0%) | 111 (6.7%) |
| 25 to 29 Years | 95 (5.9%) | 91 (5.5%) |
| 30 to 34 Years | 175 (10.9%) | 30 (1.8%) |
| 35 to 39 Years | 31 (1.9%) | 52 (3.1%) |
| 40 to 44 Years | 84 (5.2%) | 53 (3.2%) |
| 45 to 49 Years | 48 (3.0%) | 124 (7.5%) |
| 50 to 54 Years | 52 (3.2%) | 83 (5.0%) |
| 55 to 59 Years | 183 (11.4%) | 148 (8.9%) |
| 60 to 64 Years | 209 (13.0%) | 121 (7.3%) |
| 65 to 69 Years | 91 (5.7%) | 100 (6.0%) |
| 70 to 74 Years | 101 (6.3%) | 171 (10.3%) |
| 75 to 79 Years | 70 (4.3%) | 54 (3.3%) |
| 80 to 84 Years | 39 (2.4%) | 61 (3.7%) |
| 85 Years and over | 17 (1.1%) | 52 (3.1%) |
| Total | 1,608 (100.0%) | 1,657 (100.0%) |
Families and Households in Ely
Median Family Size in Ely
The median family size in Ely is 2.85 persons per family, with single female/mother families (67 | 11.3%) accounting for the largest median family size of 3.01 persons per family. On the other hand, single male/father families (56 | 9.5%) represent the smallest median family size with 2.73 persons per family.
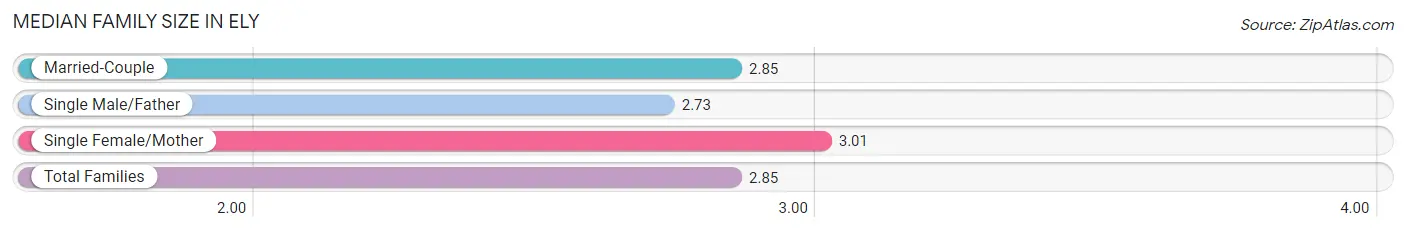
| Family Type | # Families | Family Size |
| Married-Couple | 468 (79.2%) | 2.85 |
| Single Male/Father | 56 (9.5%) | 2.73 |
| Single Female/Mother | 67 (11.3%) | 3.01 |
| Total Families | 591 (100.0%) | 2.85 |
Median Household Size in Ely
The median household size in Ely is 1.81 persons per household, with single female/mother households (67 | 4.1%) accounting for the largest median household size of 3.3 persons per household. non-family households (1,053 | 64.0%) represent the smallest median household size with 1.19 persons per household.
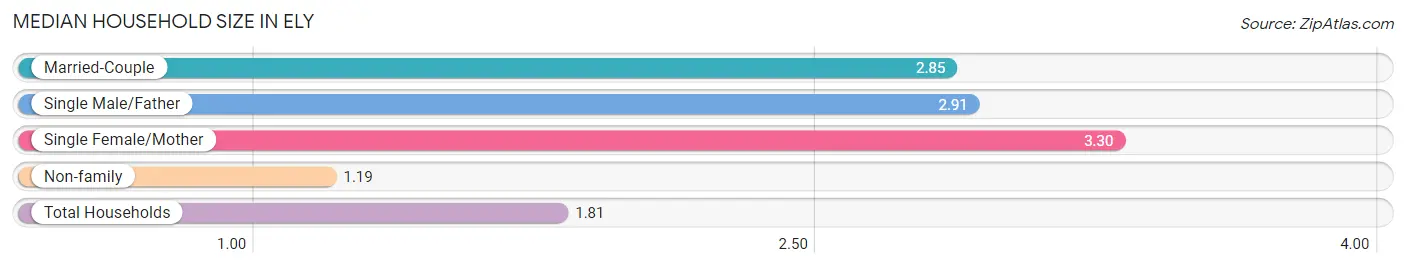
| Household Type | # Households | Household Size |
| Married-Couple | 468 (28.5%) | 2.85 |
| Single Male/Father | 56 (3.4%) | 2.91 |
| Single Female/Mother | 67 (4.1%) | 3.30 |
| Non-family | 1,053 (64.0%) | 1.19 |
| Total Households | 1,644 (100.0%) | 1.81 |
Household Size by Marriage Status in Ely
Out of a total of 1,644 households in Ely, 591 (35.9%) are family households, while 1,053 (64.0%) are nonfamily households. The most numerous type of family households are 2-person households, comprising 297, and the most common type of nonfamily households are 1-person households, comprising 899.
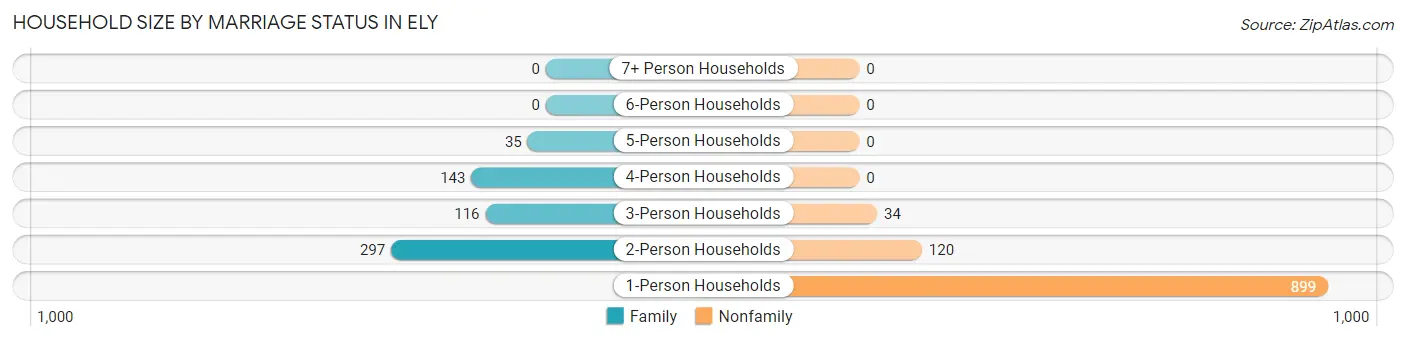
| Household Size | Family Households | Nonfamily Households |
| 1-Person Households | - | 899 (54.7%) |
| 2-Person Households | 297 (18.1%) | 120 (7.3%) |
| 3-Person Households | 116 (7.1%) | 34 (2.1%) |
| 4-Person Households | 143 (8.7%) | 0 (0.0%) |
| 5-Person Households | 35 (2.1%) | 0 (0.0%) |
| 6-Person Households | 0 (0.0%) | 0 (0.0%) |
| 7+ Person Households | 0 (0.0%) | 0 (0.0%) |
| Total | 591 (35.9%) | 1,053 (64.0%) |
Female Fertility in Ely
Fertility by Age in Ely
Average fertility rate in Ely is 13.0 births per 1,000 women. Women in the age bracket of 35 to 50 years have the highest fertility rate with 23.0 births per 1,000 women. Women in the age bracket of 35 to 50 years acount for 66.7% of all women with births.
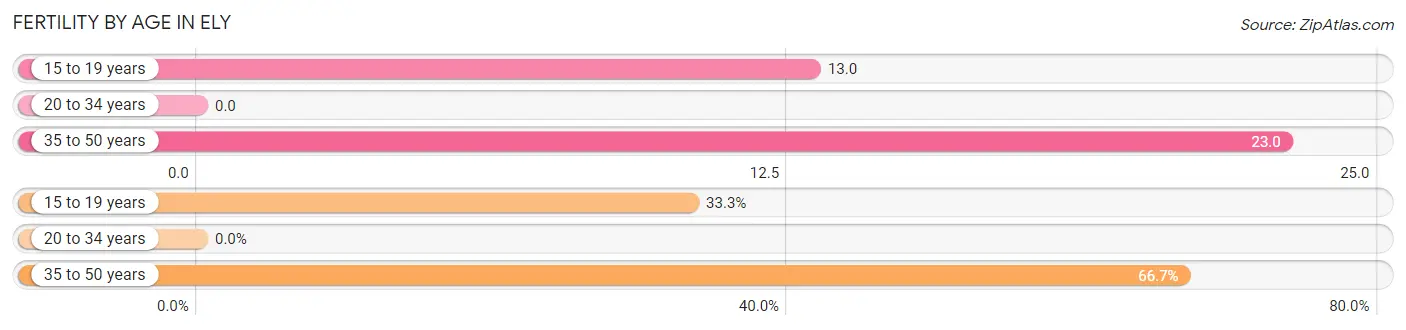
| Age Bracket | Women with Births | Births / 1,000 Women |
| 15 to 19 years | 3 (33.3%) | 13.0 |
| 20 to 34 years | 0 (0.0%) | 0.0 |
| 35 to 50 years | 6 (66.7%) | 23.0 |
| Total | 9 (100.0%) | 13.0 |
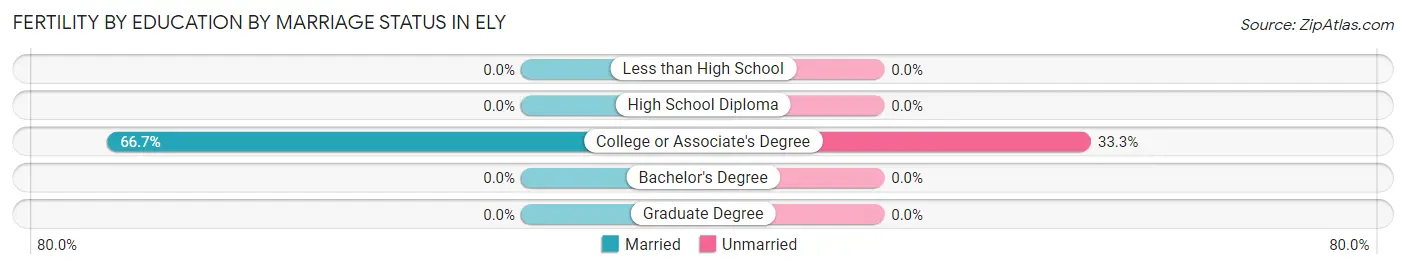
Fertility by Age by Marriage Status in Ely
66.7% of women with births (9) in Ely are married. The highest percentage of unmarried women with births falls into 15 to 19 years age bracket with 100.0% of them unmarried at the time of birth, while the lowest percentage of unmarried women with births belong to 35 to 50 years age bracket with 0.0% of them unmarried.
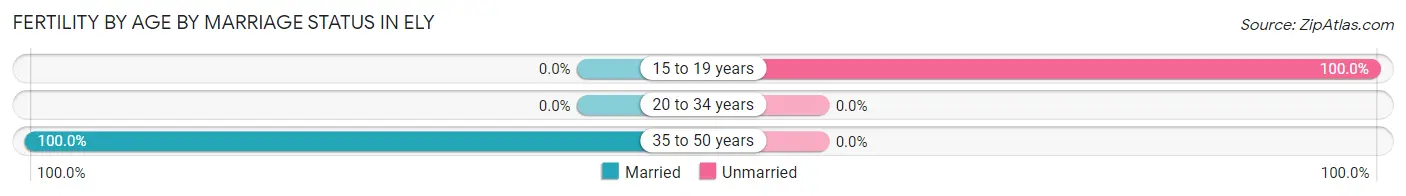
| Age Bracket | Married | Unmarried |
| 15 to 19 years | 0 (0.0%) | 3 (100.0%) |
| 20 to 34 years | 0 (0.0%) | 0 (0.0%) |
| 35 to 50 years | 6 (100.0%) | 0 (0.0%) |
| Total | 6 (66.7%) | 3 (33.3%) |
Fertility by Education in Ely
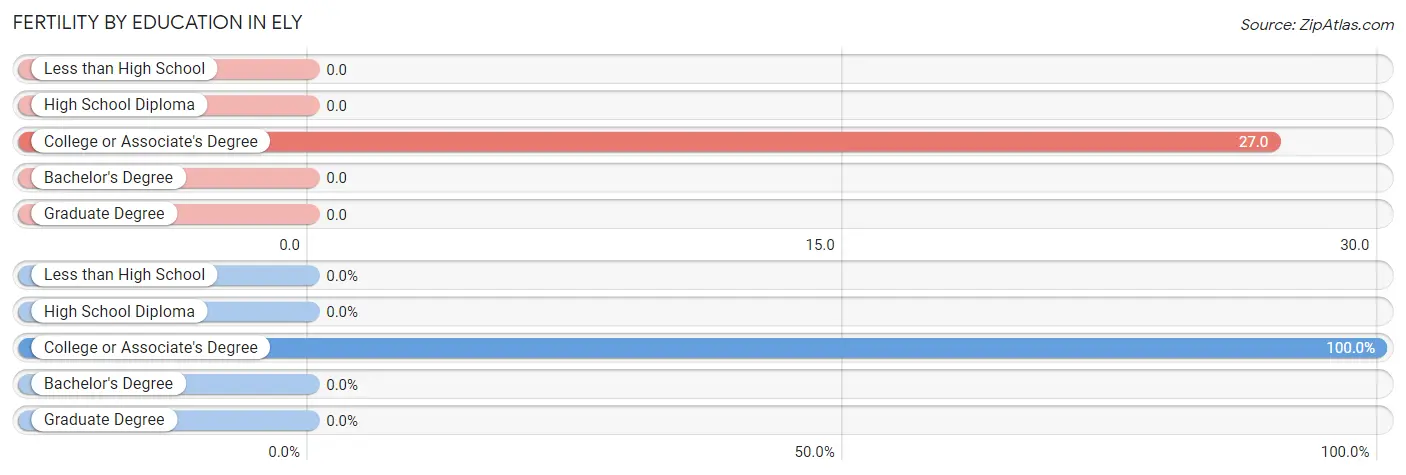
| Educational Attainment | Women with Births | Births / 1,000 Women |
| Less than High School | 0 (0.0%) | 0.0 |
| High School Diploma | 0 (0.0%) | 0.0 |
| College or Associate's Degree | 9 (100.0%) | 27.0 |
| Bachelor's Degree | 0 (0.0%) | 0.0 |
| Graduate Degree | 0 (0.0%) | 0.0 |
| Total | 9 (100.0%) | 13.0 |
Fertility by Education by Marriage Status in Ely
33.3% of women with births in Ely are unmarried. Women with the educational attainment of college or associate's degree are most likely to be married with 66.7% of them married at childbirth, while women with the educational attainment of college or associate's degree are least likely to be married with 33.3% of them unmarried at childbirth.
| Educational Attainment | Married | Unmarried |
| Less than High School | 0 (0.0%) | 0 (0.0%) |
| High School Diploma | 0 (0.0%) | 0 (0.0%) |
| College or Associate's Degree | 6 (66.7%) | 3 (33.3%) |
| Bachelor's Degree | 0 (0.0%) | 0 (0.0%) |
| Graduate Degree | 0 (0.0%) | 0 (0.0%) |
| Total | 6 (66.7%) | 3 (33.3%) |
Employment Characteristics in Ely
Employment by Class of Employer in Ely
Among the 1,651 employed individuals in Ely, private company employees (859 | 52.0%), not-for-profit organizations (314 | 19.0%), and local government employees (209 | 12.7%) make up the most common classes of employment.
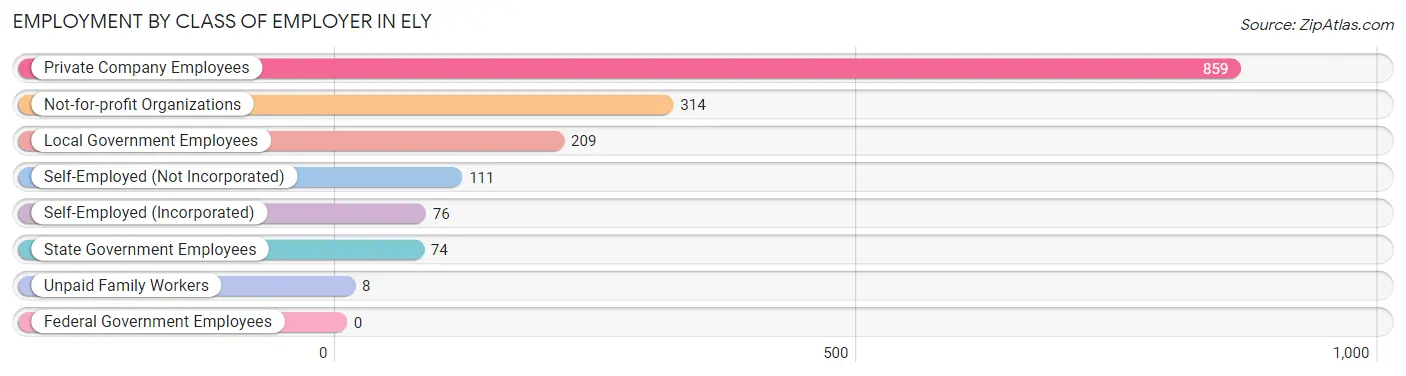
| Employer Class | # Employees | % Employees |
| Private Company Employees | 859 | 52.0% |
| Self-Employed (Incorporated) | 76 | 4.6% |
| Self-Employed (Not Incorporated) | 111 | 6.7% |
| Not-for-profit Organizations | 314 | 19.0% |
| Local Government Employees | 209 | 12.7% |
| State Government Employees | 74 | 4.5% |
| Federal Government Employees | 0 | 0.0% |
| Unpaid Family Workers | 8 | 0.5% |
| Total | 1,651 | 100.0% |
Employment Status by Age in Ely
According to the labor force statistics for Ely, out of the total population over 16 years of age (3,010), 57.4% or 1,728 individuals are in the labor force, with 2.8% or 48 of them unemployed. The age group with the highest labor force participation rate is 35 to 44 years, with 100.0% or 220 individuals in the labor force. Within the labor force, the 16 to 19 years age range has the highest percentage of unemployed individuals, with 14.0% or 24 of them being unemployed.
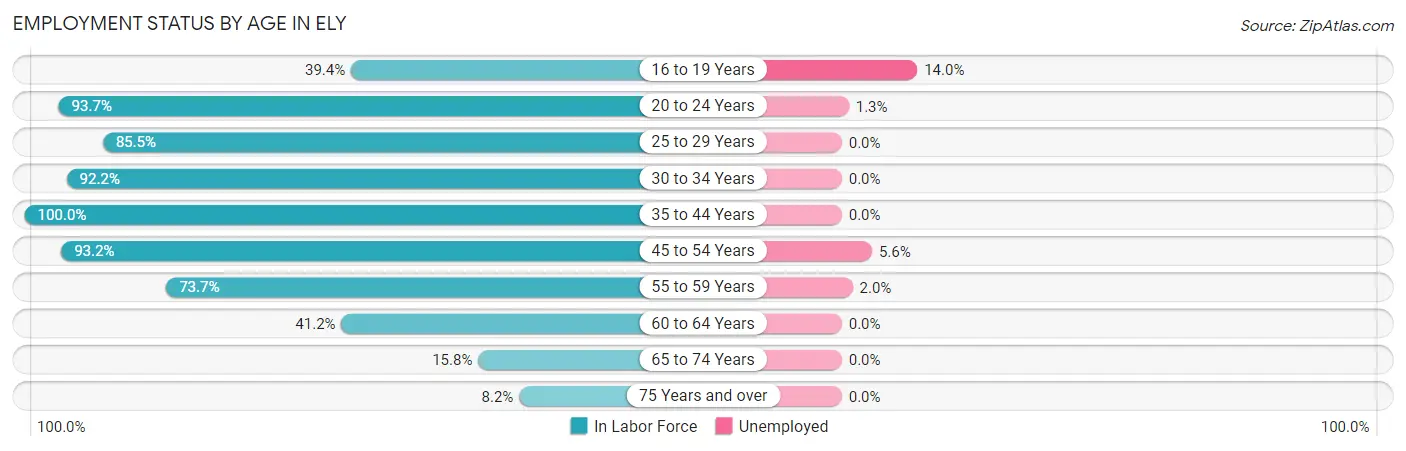
| Age Bracket | In Labor Force | Unemployed |
| 16 to 19 Years | 172 (39.4%) | 24 (14.0%) |
| 20 to 24 Years | 224 (93.7%) | 3 (1.3%) |
| 25 to 29 Years | 159 (85.5%) | 0 (0.0%) |
| 30 to 34 Years | 189 (92.2%) | 0 (0.0%) |
| 35 to 44 Years | 220 (100.0%) | 0 (0.0%) |
| 45 to 54 Years | 286 (93.2%) | 16 (5.6%) |
| 55 to 59 Years | 244 (73.7%) | 5 (2.0%) |
| 60 to 64 Years | 136 (41.2%) | 0 (0.0%) |
| 65 to 74 Years | 73 (15.8%) | 0 (0.0%) |
| 75 Years and over | 24 (8.2%) | 0 (0.0%) |
| Total | 1,728 (57.4%) | 48 (2.8%) |
Employment Status by Educational Attainment in Ely
According to labor force statistics for Ely, 78.2% of individuals (1,235) out of the total population between 25 and 64 years of age (1,579) are in the labor force, with 1.7% or 21 of them being unemployed. The group with the highest labor force participation rate are those with the educational attainment of bachelor's degree or higher, with 92.7% or 470 individuals in the labor force. Within the labor force, individuals with high school diploma education have the highest percentage of unemployment, with 4.7% or 10 of them being unemployed.
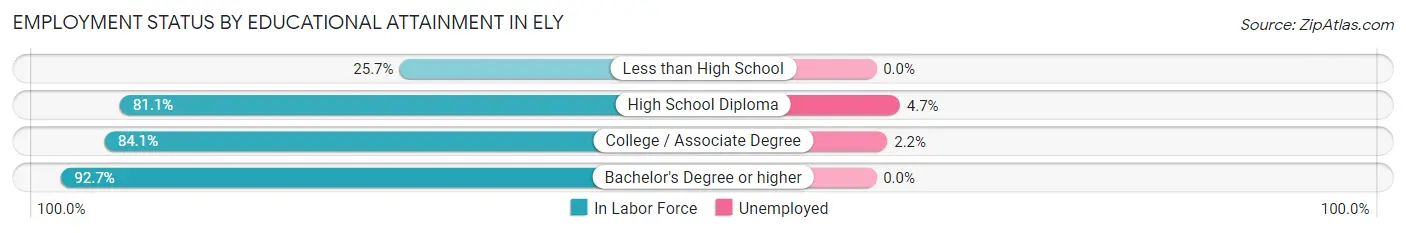
| Educational Attainment | In Labor Force | Unemployed |
| Less than High School | 57 (25.7%) | 0 (0.0%) |
| High School Diploma | 214 (81.1%) | 12 (4.7%) |
| College / Associate Degree | 493 (84.1%) | 13 (2.2%) |
| Bachelor's Degree or higher | 470 (92.7%) | 0 (0.0%) |
| Total | 1,235 (78.2%) | 27 (1.7%) |
Employment Occupations by Sex in Ely
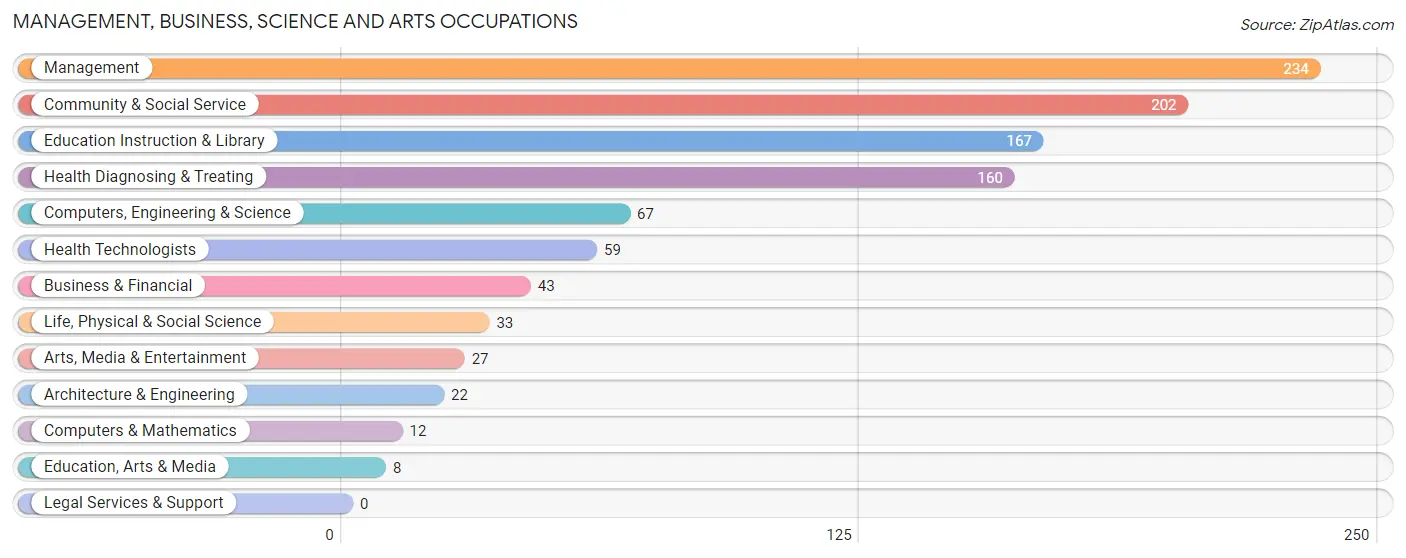
Management, Business, Science and Arts Occupations
The most common Management, Business, Science and Arts occupations in Ely are Management (234 | 13.9%), Community & Social Service (202 | 12.0%), Education Instruction & Library (167 | 10.0%), Health Diagnosing & Treating (160 | 9.5%), and Computers, Engineering & Science (67 | 4.0%).
Management, Business, Science and Arts Occupations by Sex
Within the Management, Business, Science and Arts occupations in Ely, the most male-oriented occupations are Computers & Mathematics (75.0%), Management (69.7%), and Life, Physical & Social Science (66.7%), while the most female-oriented occupations are Education, Arts & Media (100.0%), Health Technologists (100.0%), and Health Diagnosing & Treating (90.6%).
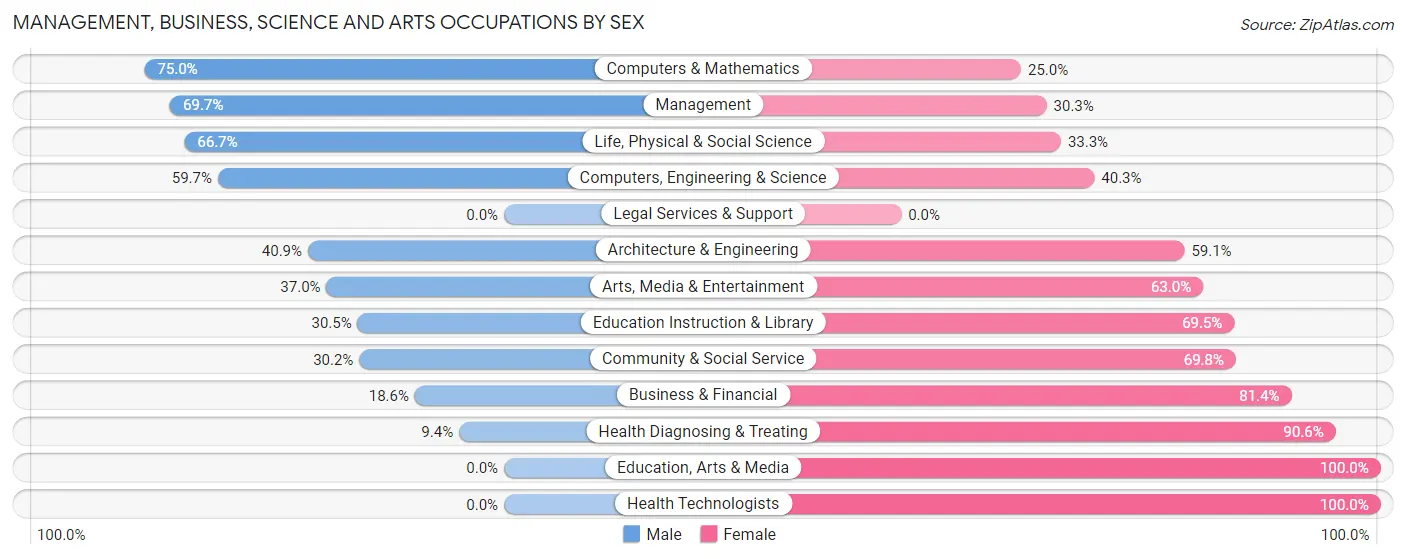
| Occupation | Male | Female |
| Management | 163 (69.7%) | 71 (30.3%) |
| Business & Financial | 8 (18.6%) | 35 (81.4%) |
| Computers, Engineering & Science | 40 (59.7%) | 27 (40.3%) |
| Computers & Mathematics | 9 (75.0%) | 3 (25.0%) |
| Architecture & Engineering | 9 (40.9%) | 13 (59.1%) |
| Life, Physical & Social Science | 22 (66.7%) | 11 (33.3%) |
| Community & Social Service | 61 (30.2%) | 141 (69.8%) |
| Education, Arts & Media | 0 (0.0%) | 8 (100.0%) |
| Legal Services & Support | 0 (0.0%) | 0 (0.0%) |
| Education Instruction & Library | 51 (30.5%) | 116 (69.5%) |
| Arts, Media & Entertainment | 10 (37.0%) | 17 (63.0%) |
| Health Diagnosing & Treating | 15 (9.4%) | 145 (90.6%) |
| Health Technologists | 0 (0.0%) | 59 (100.0%) |
| Total (Category) | 287 (40.6%) | 419 (59.4%) |
| Total (Overall) | 899 (53.5%) | 780 (46.5%) |
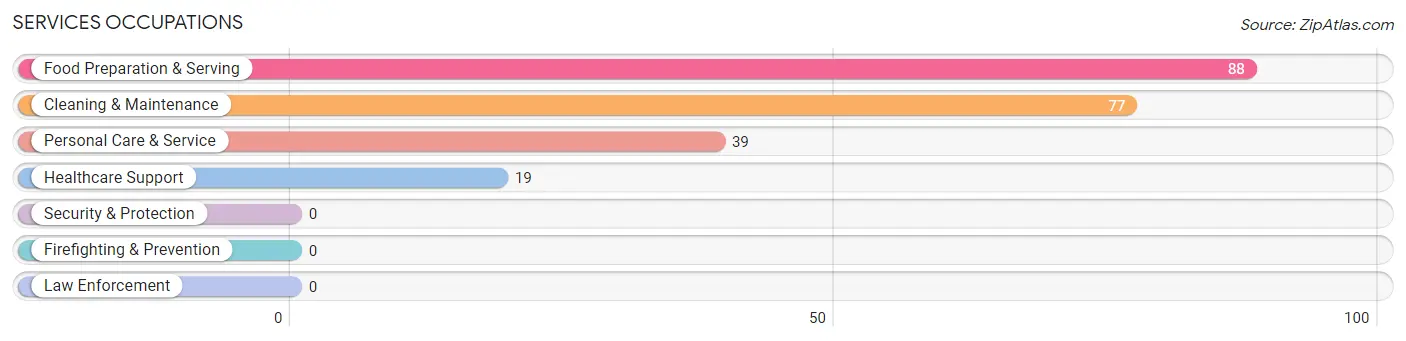
Services Occupations
The most common Services occupations in Ely are Food Preparation & Serving (88 | 5.2%), Cleaning & Maintenance (77 | 4.6%), Personal Care & Service (39 | 2.3%), and Healthcare Support (19 | 1.1%).
Services Occupations by Sex
Within the Services occupations in Ely, the most male-oriented occupations are Healthcare Support (100.0%), Cleaning & Maintenance (85.7%), and Food Preparation & Serving (70.5%), while the most female-oriented occupations are Personal Care & Service (71.8%), Food Preparation & Serving (29.5%), and Cleaning & Maintenance (14.3%).
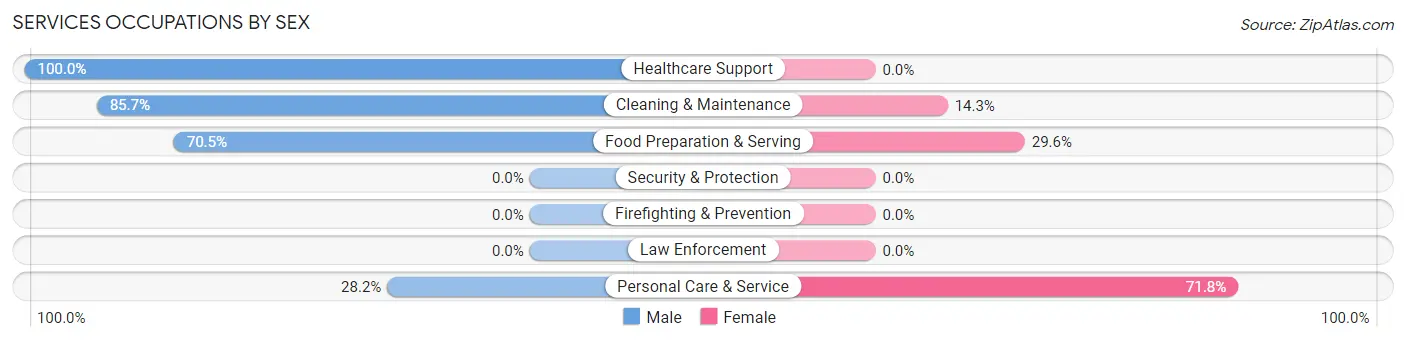
| Occupation | Male | Female |
| Healthcare Support | 19 (100.0%) | 0 (0.0%) |
| Security & Protection | 0 (0.0%) | 0 (0.0%) |
| Firefighting & Prevention | 0 (0.0%) | 0 (0.0%) |
| Law Enforcement | 0 (0.0%) | 0 (0.0%) |
| Food Preparation & Serving | 62 (70.5%) | 26 (29.5%) |
| Cleaning & Maintenance | 66 (85.7%) | 11 (14.3%) |
| Personal Care & Service | 11 (28.2%) | 28 (71.8%) |
| Total (Category) | 158 (70.9%) | 65 (29.1%) |
| Total (Overall) | 899 (53.5%) | 780 (46.5%) |
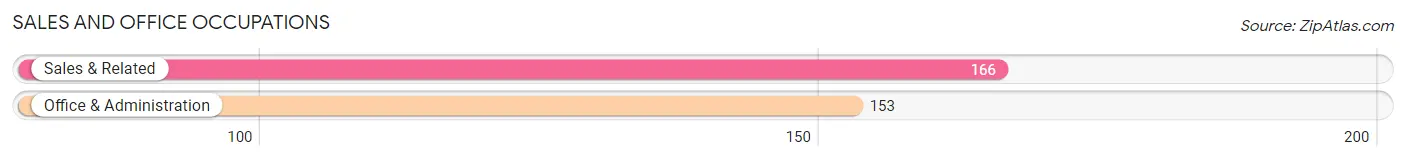
Sales and Office Occupations
The most common Sales and Office occupations in Ely are Sales & Related (166 | 9.9%), and Office & Administration (153 | 9.1%).
Sales and Office Occupations by Sex
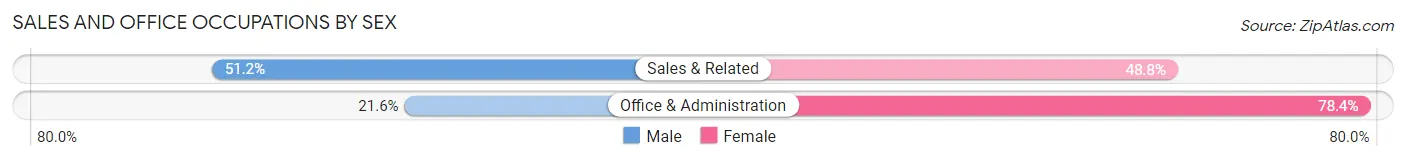
| Occupation | Male | Female |
| Sales & Related | 85 (51.2%) | 81 (48.8%) |
| Office & Administration | 33 (21.6%) | 120 (78.4%) |
| Total (Category) | 118 (37.0%) | 201 (63.0%) |
| Total (Overall) | 899 (53.5%) | 780 (46.5%) |
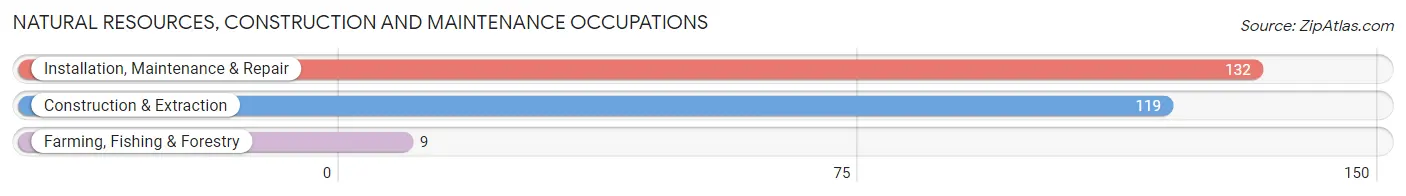
Natural Resources, Construction and Maintenance Occupations
The most common Natural Resources, Construction and Maintenance occupations in Ely are Installation, Maintenance & Repair (132 | 7.9%), Construction & Extraction (119 | 7.1%), and Farming, Fishing & Forestry (9 | 0.5%).
Natural Resources, Construction and Maintenance Occupations by Sex
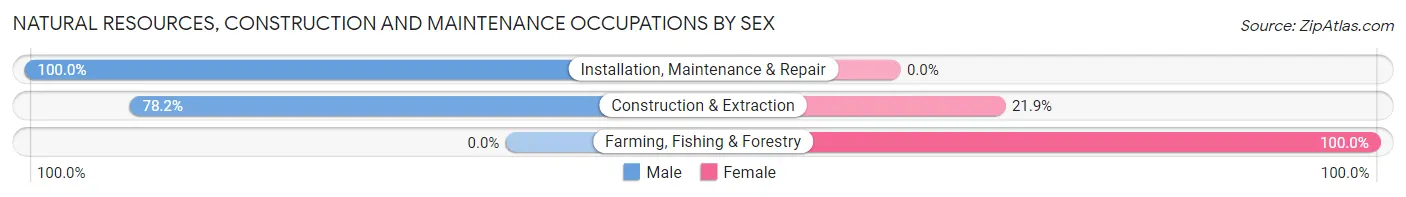
| Occupation | Male | Female |
| Farming, Fishing & Forestry | 0 (0.0%) | 9 (100.0%) |
| Construction & Extraction | 93 (78.1%) | 26 (21.8%) |
| Installation, Maintenance & Repair | 132 (100.0%) | 0 (0.0%) |
| Total (Category) | 225 (86.5%) | 35 (13.5%) |
| Total (Overall) | 899 (53.5%) | 780 (46.5%) |
Production, Transportation and Moving Occupations
The most common Production, Transportation and Moving occupations in Ely are Production (107 | 6.4%), Material Moving (42 | 2.5%), and Transportation (22 | 1.3%).
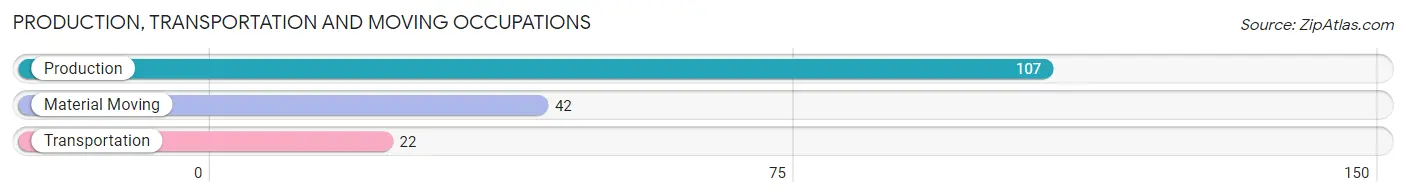
Production, Transportation and Moving Occupations by Sex
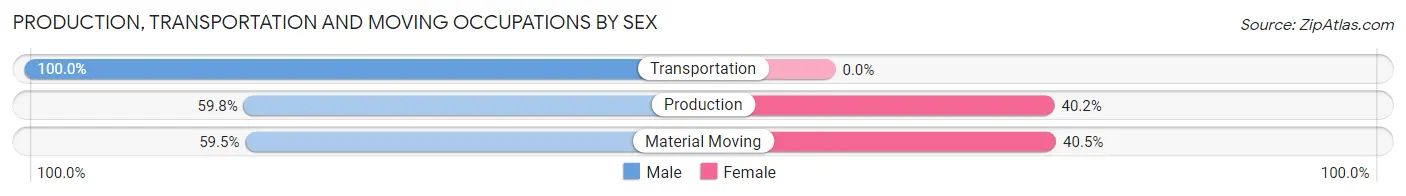
| Occupation | Male | Female |
| Production | 64 (59.8%) | 43 (40.2%) |
| Transportation | 22 (100.0%) | 0 (0.0%) |
| Material Moving | 25 (59.5%) | 17 (40.5%) |
| Total (Category) | 111 (64.9%) | 60 (35.1%) |
| Total (Overall) | 899 (53.5%) | 780 (46.5%) |
Employment Industries by Sex in Ely
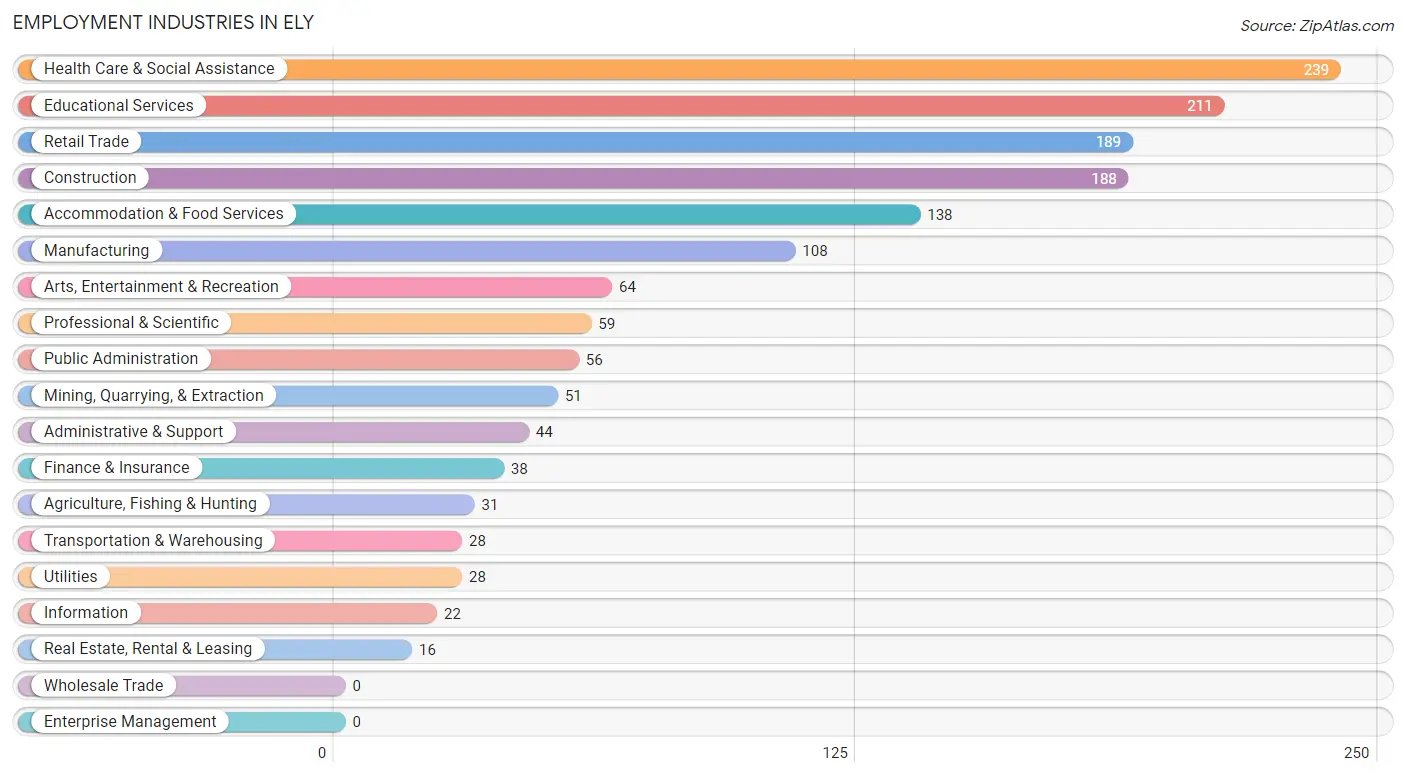
Employment Industries in Ely
The major employment industries in Ely include Health Care & Social Assistance (239 | 14.2%), Educational Services (211 | 12.6%), Retail Trade (189 | 11.3%), Construction (188 | 11.2%), and Accommodation & Food Services (138 | 8.2%).
Employment Industries by Sex in Ely
The Ely industries that see more men than women are Mining, Quarrying, & Extraction (100.0%), Information (100.0%), and Real Estate, Rental & Leasing (100.0%), whereas the industries that tend to have a higher number of women are Public Administration (83.9%), Health Care & Social Assistance (80.7%), and Professional & Scientific (71.2%).
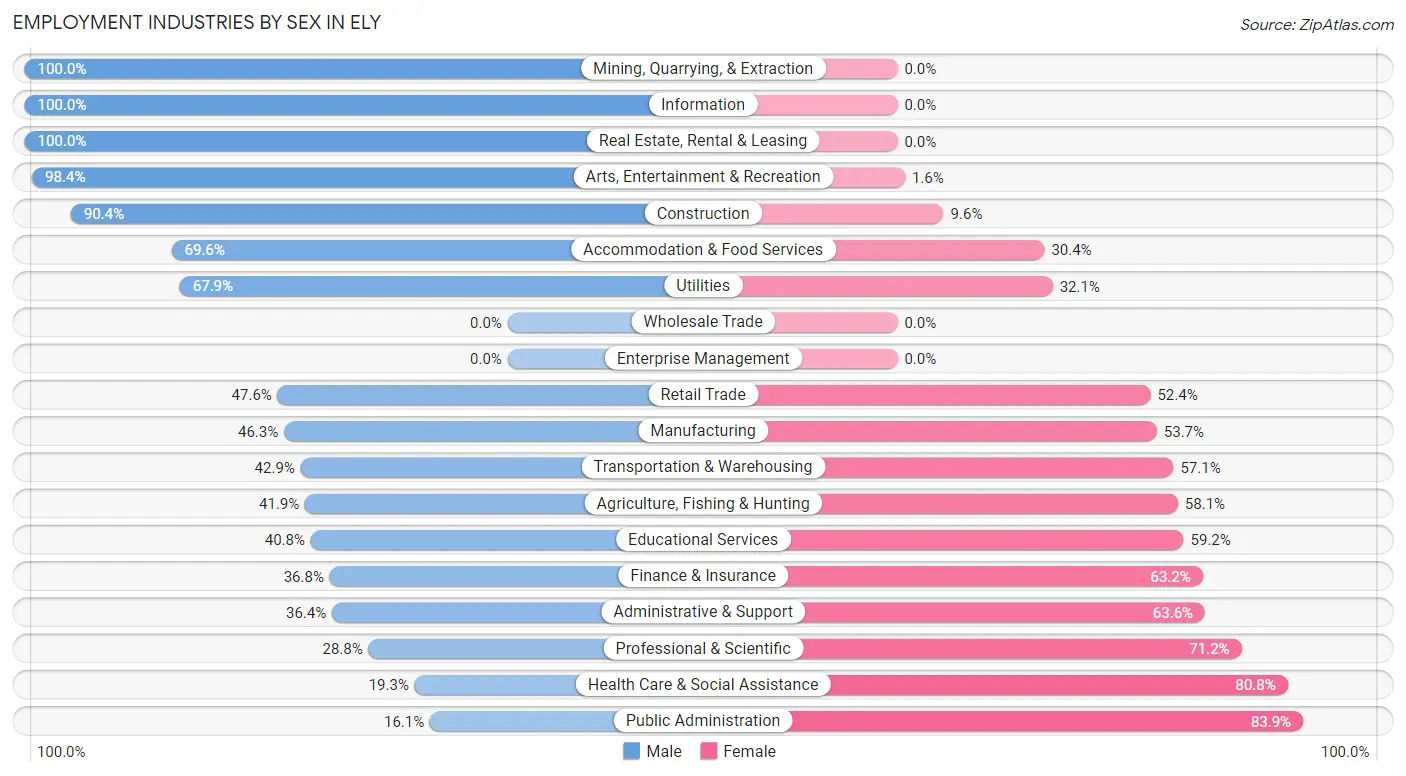
| Industry | Male | Female |
| Agriculture, Fishing & Hunting | 13 (41.9%) | 18 (58.1%) |
| Mining, Quarrying, & Extraction | 51 (100.0%) | 0 (0.0%) |
| Construction | 170 (90.4%) | 18 (9.6%) |
| Manufacturing | 50 (46.3%) | 58 (53.7%) |
| Wholesale Trade | 0 (0.0%) | 0 (0.0%) |
| Retail Trade | 90 (47.6%) | 99 (52.4%) |
| Transportation & Warehousing | 12 (42.9%) | 16 (57.1%) |
| Utilities | 19 (67.9%) | 9 (32.1%) |
| Information | 22 (100.0%) | 0 (0.0%) |
| Finance & Insurance | 14 (36.8%) | 24 (63.2%) |
| Real Estate, Rental & Leasing | 16 (100.0%) | 0 (0.0%) |
| Professional & Scientific | 17 (28.8%) | 42 (71.2%) |
| Enterprise Management | 0 (0.0%) | 0 (0.0%) |
| Administrative & Support | 16 (36.4%) | 28 (63.6%) |
| Educational Services | 86 (40.8%) | 125 (59.2%) |
| Health Care & Social Assistance | 46 (19.3%) | 193 (80.7%) |
| Arts, Entertainment & Recreation | 63 (98.4%) | 1 (1.6%) |
| Accommodation & Food Services | 96 (69.6%) | 42 (30.4%) |
| Public Administration | 9 (16.1%) | 47 (83.9%) |
| Total | 899 (53.5%) | 780 (46.5%) |
Education in Ely
School Enrollment in Ely
The most common levels of schooling among the 753 students in Ely are college / undergraduate (355 | 47.1%), high school (190 | 25.2%), and middle school (97 | 12.9%).
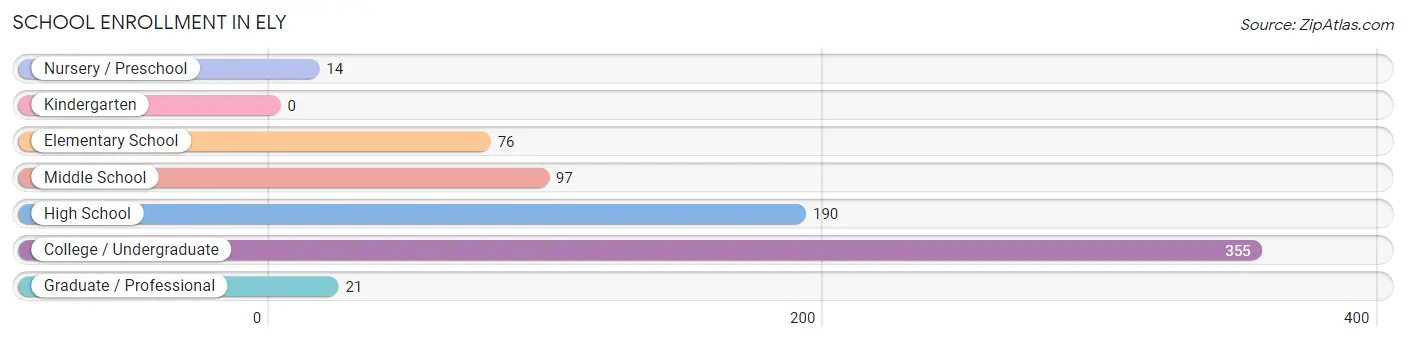
| School Level | # Students | % Students |
| Nursery / Preschool | 14 | 1.9% |
| Kindergarten | 0 | 0.0% |
| Elementary School | 76 | 10.1% |
| Middle School | 97 | 12.9% |
| High School | 190 | 25.2% |
| College / Undergraduate | 355 | 47.1% |
| Graduate / Professional | 21 | 2.8% |
| Total | 753 | 100.0% |
School Enrollment by Age by Funding Source in Ely
Out of a total of 753 students who are enrolled in schools in Ely, 125 (16.6%) attend a private institution, while the remaining 628 (83.4%) are enrolled in public schools. The age group of 35 years and over has the highest likelihood of being enrolled in private schools, with 21 (48.8% in the age bracket) enrolled. Conversely, the age group of 3 to 4 year olds has the lowest likelihood of being enrolled in a private school, with 14 (100.0% in the age bracket) attending a public institution.
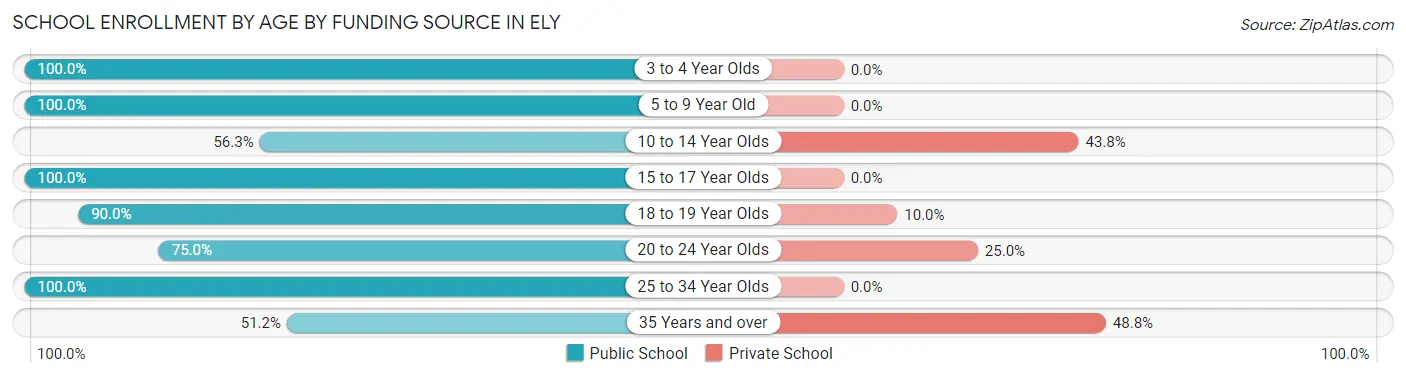
| Age Bracket | Public School | Private School |
| 3 to 4 Year Olds | 14 (100.0%) | 0 (0.0%) |
| 5 to 9 Year Old | 47 (100.0%) | 0 (0.0%) |
| 10 to 14 Year Olds | 81 (56.2%) | 63 (43.8%) |
| 15 to 17 Year Olds | 121 (100.0%) | 0 (0.0%) |
| 18 to 19 Year Olds | 279 (90.0%) | 31 (10.0%) |
| 20 to 24 Year Olds | 30 (75.0%) | 10 (25.0%) |
| 25 to 34 Year Olds | 34 (100.0%) | 0 (0.0%) |
| 35 Years and over | 22 (51.2%) | 21 (48.8%) |
| Total | 628 (83.4%) | 125 (16.6%) |
Educational Attainment by Field of Study in Ely
Business (166 | 20.2%), bio, nature & agricultural (101 | 12.3%), science & technology (84 | 10.2%), education (78 | 9.5%), and engineering (65 | 7.9%) are the most common fields of study among 823 individuals in Ely who have obtained a bachelor's degree or higher.
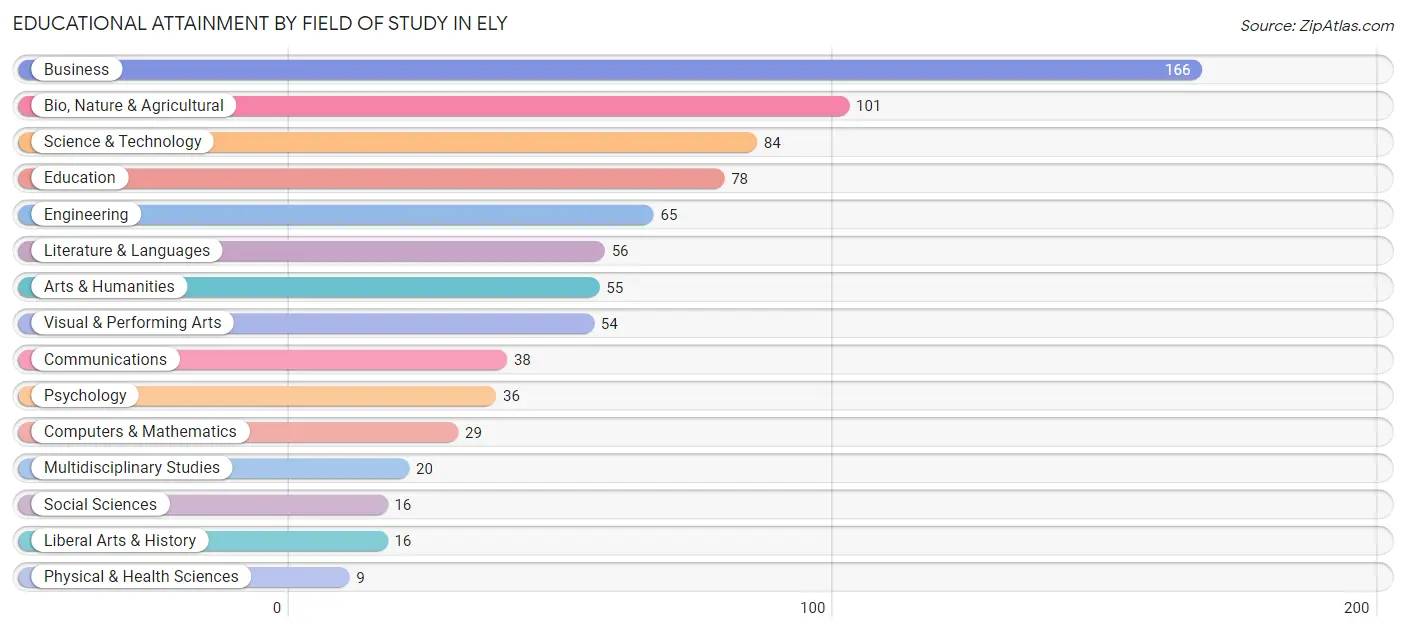
| Field of Study | # Graduates | % Graduates |
| Computers & Mathematics | 29 | 3.5% |
| Bio, Nature & Agricultural | 101 | 12.3% |
| Physical & Health Sciences | 9 | 1.1% |
| Psychology | 36 | 4.4% |
| Social Sciences | 16 | 1.9% |
| Engineering | 65 | 7.9% |
| Multidisciplinary Studies | 20 | 2.4% |
| Science & Technology | 84 | 10.2% |
| Business | 166 | 20.2% |
| Education | 78 | 9.5% |
| Literature & Languages | 56 | 6.8% |
| Liberal Arts & History | 16 | 1.9% |
| Visual & Performing Arts | 54 | 6.6% |
| Communications | 38 | 4.6% |
| Arts & Humanities | 55 | 6.7% |
| Total | 823 | 100.0% |
Transportation & Commute in Ely
Vehicle Availability by Sex in Ely
The most prevalent vehicle ownership categories in Ely are males with 3 vehicles (303, accounting for 37.1%) and females with 3 vehicles (168, making up 40.4%).
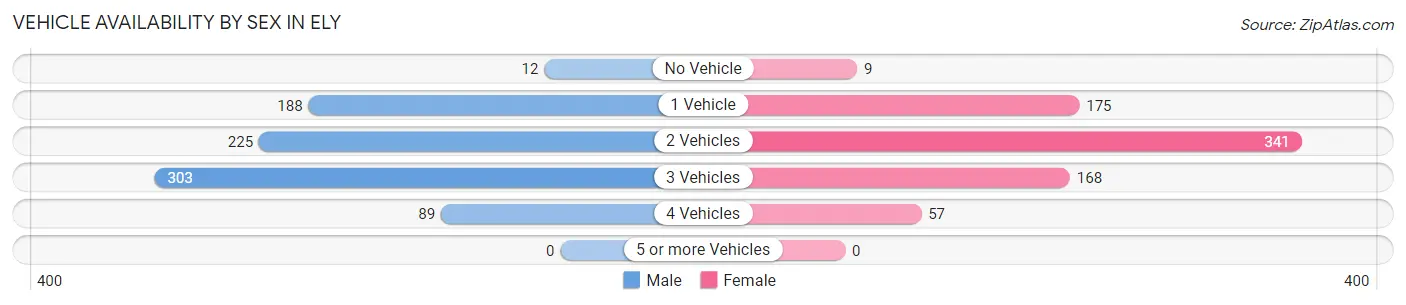
| Vehicles Available | Male | Female |
| No Vehicle | 12 (1.5%) | 9 (1.2%) |
| 1 Vehicle | 188 (23.0%) | 175 (23.3%) |
| 2 Vehicles | 225 (27.5%) | 341 (45.5%) |
| 3 Vehicles | 303 (37.1%) | 168 (22.4%) |
| 4 Vehicles | 89 (10.9%) | 57 (7.6%) |
| 5 or more Vehicles | 0 (0.0%) | 0 (0.0%) |
| Total | 817 (100.0%) | 750 (100.0%) |
Commute Time in Ely
The most frequently occuring commute durations in Ely are 5 to 9 minutes (540 commuters, 34.8%), less than 5 minutes (414 commuters, 26.7%), and 20 to 24 minutes (130 commuters, 8.4%).
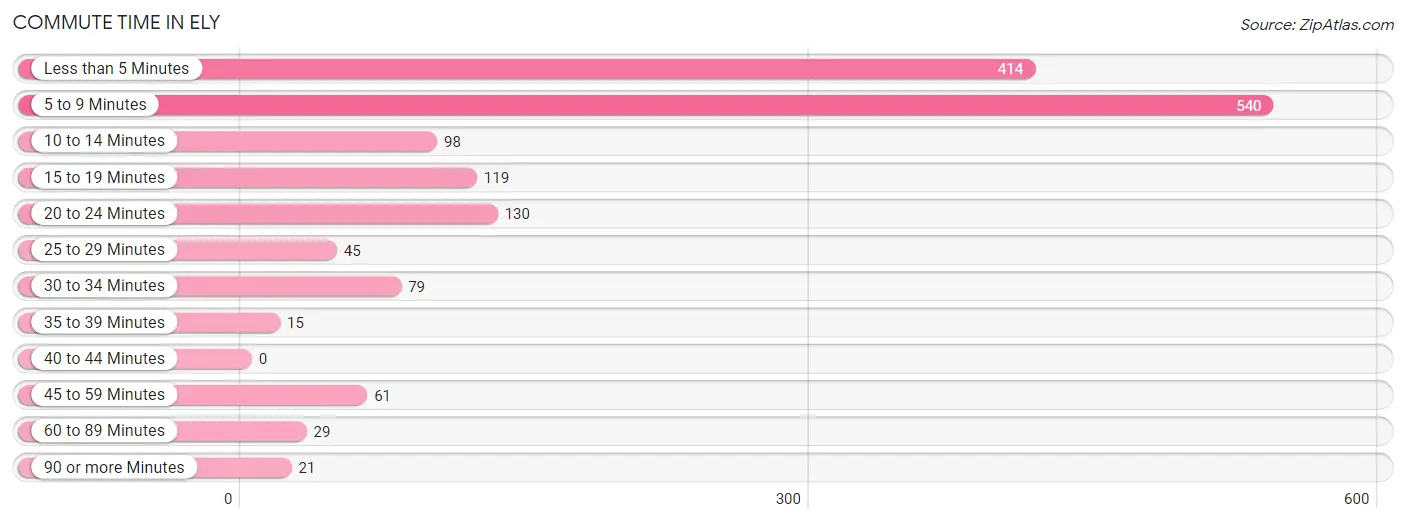
| Commute Time | # Commuters | % Commuters |
| Less than 5 Minutes | 414 | 26.7% |
| 5 to 9 Minutes | 540 | 34.8% |
| 10 to 14 Minutes | 98 | 6.3% |
| 15 to 19 Minutes | 119 | 7.7% |
| 20 to 24 Minutes | 130 | 8.4% |
| 25 to 29 Minutes | 45 | 2.9% |
| 30 to 34 Minutes | 79 | 5.1% |
| 35 to 39 Minutes | 15 | 1.0% |
| 40 to 44 Minutes | 0 | 0.0% |
| 45 to 59 Minutes | 61 | 3.9% |
| 60 to 89 Minutes | 29 | 1.9% |
| 90 or more Minutes | 21 | 1.3% |
Commute Time by Sex in Ely
The most common commute times in Ely are 5 to 9 minutes (217 commuters, 25.9%) for males and 5 to 9 minutes (323 commuters, 45.4%) for females.
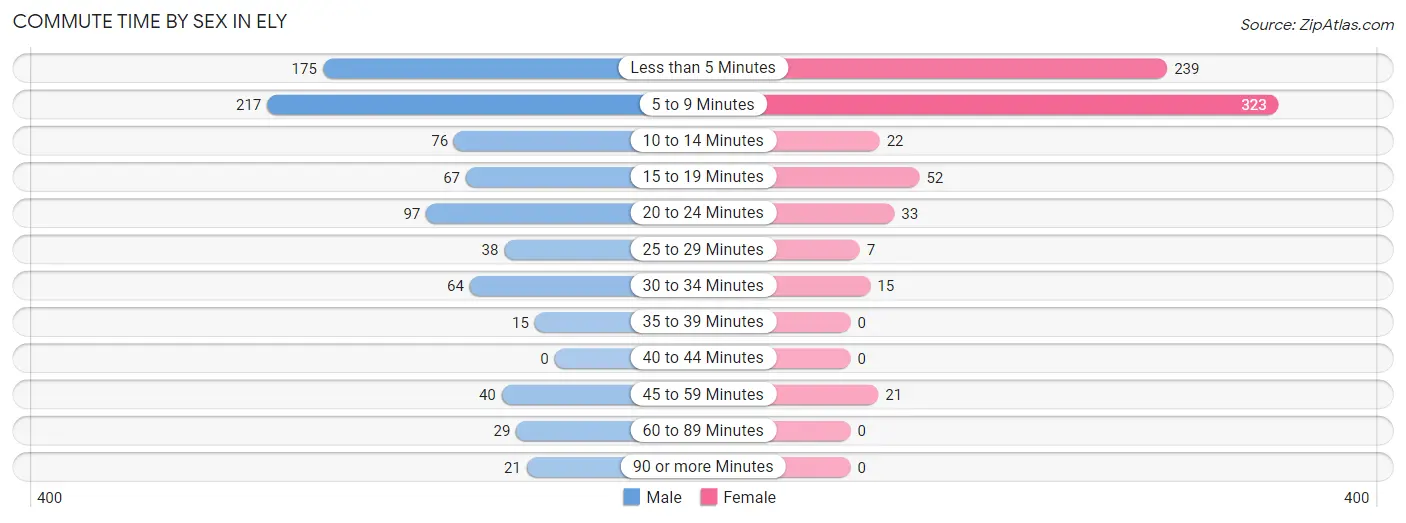
| Commute Time | Male | Female |
| Less than 5 Minutes | 175 (20.9%) | 239 (33.6%) |
| 5 to 9 Minutes | 217 (25.9%) | 323 (45.4%) |
| 10 to 14 Minutes | 76 (9.1%) | 22 (3.1%) |
| 15 to 19 Minutes | 67 (8.0%) | 52 (7.3%) |
| 20 to 24 Minutes | 97 (11.6%) | 33 (4.6%) |
| 25 to 29 Minutes | 38 (4.5%) | 7 (1.0%) |
| 30 to 34 Minutes | 64 (7.6%) | 15 (2.1%) |
| 35 to 39 Minutes | 15 (1.8%) | 0 (0.0%) |
| 40 to 44 Minutes | 0 (0.0%) | 0 (0.0%) |
| 45 to 59 Minutes | 40 (4.8%) | 21 (2.9%) |
| 60 to 89 Minutes | 29 (3.5%) | 0 (0.0%) |
| 90 or more Minutes | 21 (2.5%) | 0 (0.0%) |
Time of Departure to Work by Sex in Ely
The most frequent times of departure to work in Ely are 7:30 AM to 7:59 AM (177, 21.1%) for males and 7:30 AM to 7:59 AM (209, 29.3%) for females.
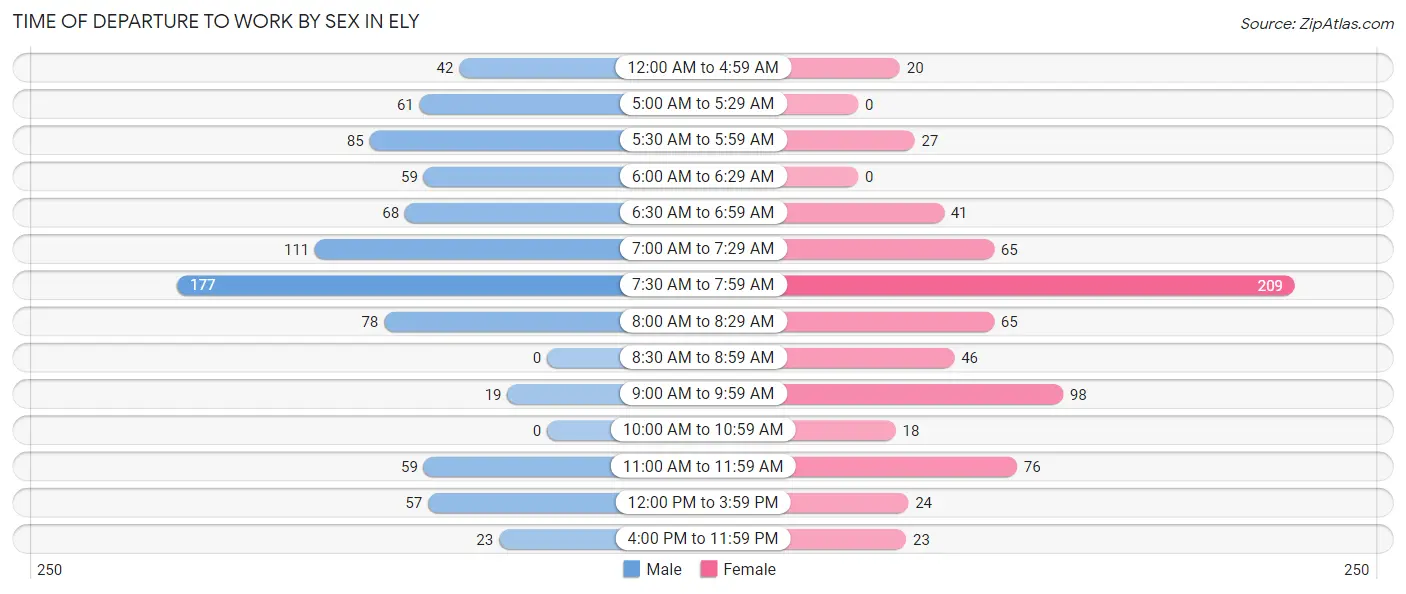
| Time of Departure | Male | Female |
| 12:00 AM to 4:59 AM | 42 (5.0%) | 20 (2.8%) |
| 5:00 AM to 5:29 AM | 61 (7.3%) | 0 (0.0%) |
| 5:30 AM to 5:59 AM | 85 (10.1%) | 27 (3.8%) |
| 6:00 AM to 6:29 AM | 59 (7.0%) | 0 (0.0%) |
| 6:30 AM to 6:59 AM | 68 (8.1%) | 41 (5.8%) |
| 7:00 AM to 7:29 AM | 111 (13.2%) | 65 (9.1%) |
| 7:30 AM to 7:59 AM | 177 (21.1%) | 209 (29.3%) |
| 8:00 AM to 8:29 AM | 78 (9.3%) | 65 (9.1%) |
| 8:30 AM to 8:59 AM | 0 (0.0%) | 46 (6.5%) |
| 9:00 AM to 9:59 AM | 19 (2.3%) | 98 (13.8%) |
| 10:00 AM to 10:59 AM | 0 (0.0%) | 18 (2.5%) |
| 11:00 AM to 11:59 AM | 59 (7.0%) | 76 (10.7%) |
| 12:00 PM to 3:59 PM | 57 (6.8%) | 24 (3.4%) |
| 4:00 PM to 11:59 PM | 23 (2.7%) | 23 (3.2%) |
| Total | 839 (100.0%) | 712 (100.0%) |
Housing Occupancy in Ely
Occupancy by Ownership in Ely
Of the total 1,644 dwellings in Ely, owner-occupied units account for 1,028 (62.5%), while renter-occupied units make up 616 (37.5%).
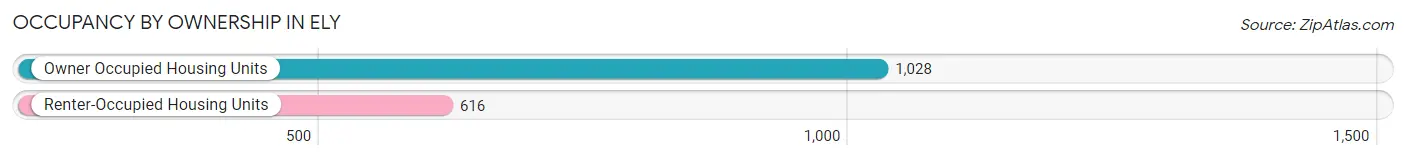
| Occupancy | # Housing Units | % Housing Units |
| Owner Occupied Housing Units | 1,028 | 62.5% |
| Renter-Occupied Housing Units | 616 | 37.5% |
| Total Occupied Housing Units | 1,644 | 100.0% |
Occupancy by Household Size in Ely
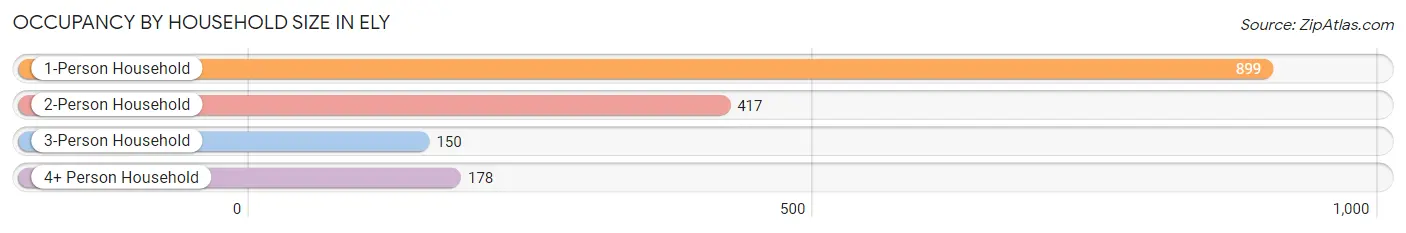
| Household Size | # Housing Units | % Housing Units |
| 1-Person Household | 899 | 54.7% |
| 2-Person Household | 417 | 25.4% |
| 3-Person Household | 150 | 9.1% |
| 4+ Person Household | 178 | 10.8% |
| Total Housing Units | 1,644 | 100.0% |
Occupancy by Ownership by Household Size in Ely
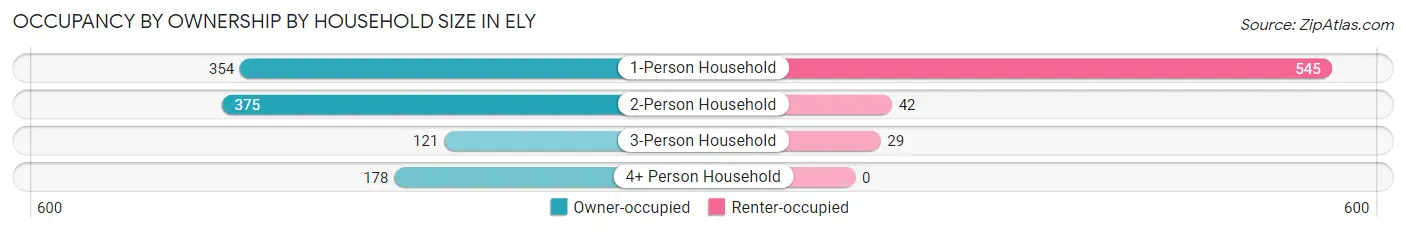
| Household Size | Owner-occupied | Renter-occupied |
| 1-Person Household | 354 (39.4%) | 545 (60.6%) |
| 2-Person Household | 375 (89.9%) | 42 (10.1%) |
| 3-Person Household | 121 (80.7%) | 29 (19.3%) |
| 4+ Person Household | 178 (100.0%) | 0 (0.0%) |
| Total Housing Units | 1,028 (62.5%) | 616 (37.5%) |
Occupancy by Educational Attainment in Ely
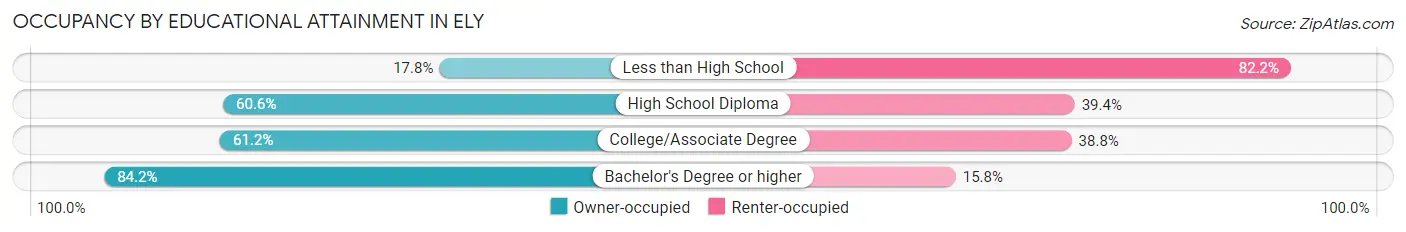
| Household Size | Owner-occupied | Renter-occupied |
| Less than High School | 37 (17.8%) | 171 (82.2%) |
| High School Diploma | 191 (60.6%) | 124 (39.4%) |
| College/Associate Degree | 384 (61.2%) | 243 (38.8%) |
| Bachelor's Degree or higher | 416 (84.2%) | 78 (15.8%) |
Occupancy by Age of Householder in Ely
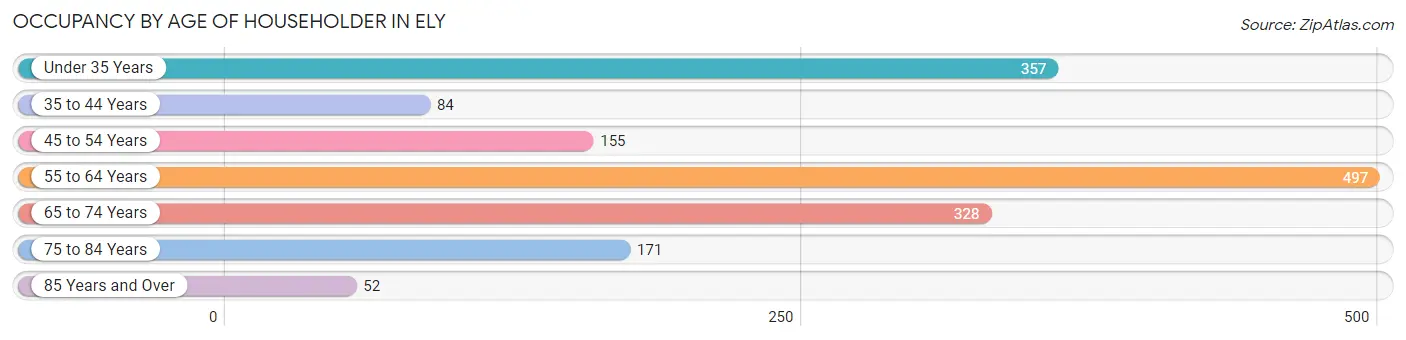
| Age Bracket | # Households | % Households |
| Under 35 Years | 357 | 21.7% |
| 35 to 44 Years | 84 | 5.1% |
| 45 to 54 Years | 155 | 9.4% |
| 55 to 64 Years | 497 | 30.2% |
| 65 to 74 Years | 328 | 20.0% |
| 75 to 84 Years | 171 | 10.4% |
| 85 Years and Over | 52 | 3.2% |
| Total | 1,644 | 100.0% |
Housing Finances in Ely
Median Income by Occupancy in Ely
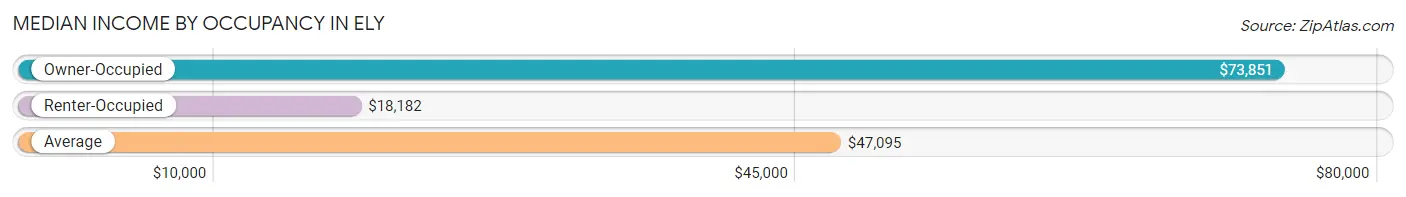
| Occupancy Type | # Households | Median Income |
| Owner-Occupied | 1,028 (62.5%) | $73,851 |
| Renter-Occupied | 616 (37.5%) | $18,182 |
| Average | 1,644 (100.0%) | $47,095 |
Occupancy by Householder Income Bracket in Ely
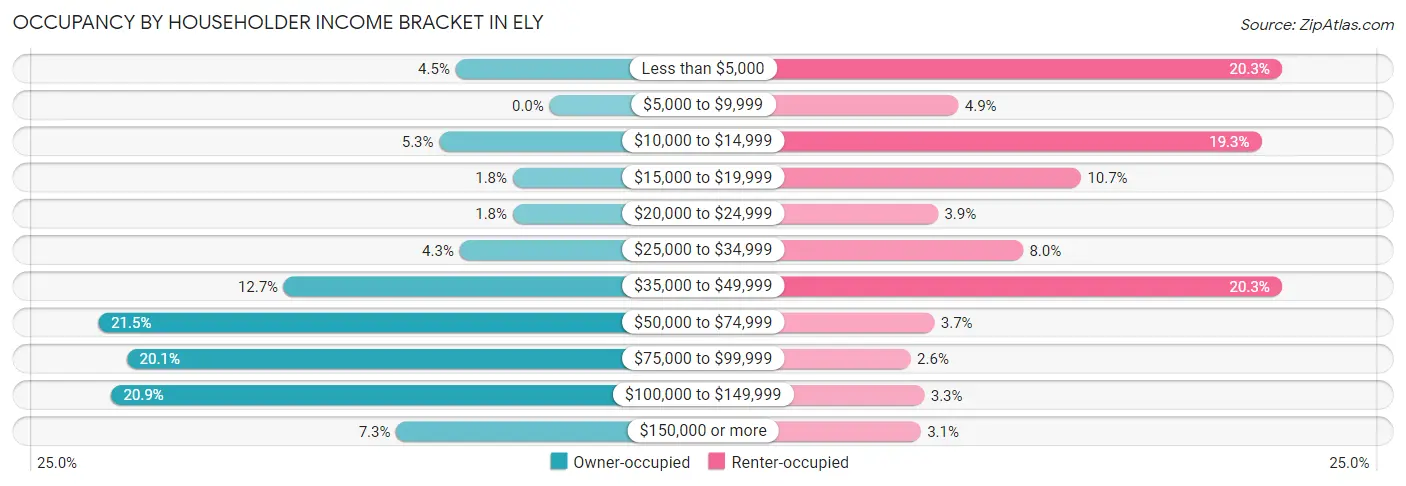
| Income Bracket | Owner-occupied | Renter-occupied |
| Less than $5,000 | 46 (4.5%) | 125 (20.3%) |
| $5,000 to $9,999 | 0 (0.0%) | 30 (4.9%) |
| $10,000 to $14,999 | 54 (5.2%) | 119 (19.3%) |
| $15,000 to $19,999 | 18 (1.8%) | 66 (10.7%) |
| $20,000 to $24,999 | 18 (1.8%) | 24 (3.9%) |
| $25,000 to $34,999 | 44 (4.3%) | 49 (8.0%) |
| $35,000 to $49,999 | 130 (12.7%) | 125 (20.3%) |
| $50,000 to $74,999 | 221 (21.5%) | 23 (3.7%) |
| $75,000 to $99,999 | 207 (20.1%) | 16 (2.6%) |
| $100,000 to $149,999 | 215 (20.9%) | 20 (3.3%) |
| $150,000 or more | 75 (7.3%) | 19 (3.1%) |
| Total | 1,028 (100.0%) | 616 (100.0%) |
Monthly Housing Cost Tiers in Ely
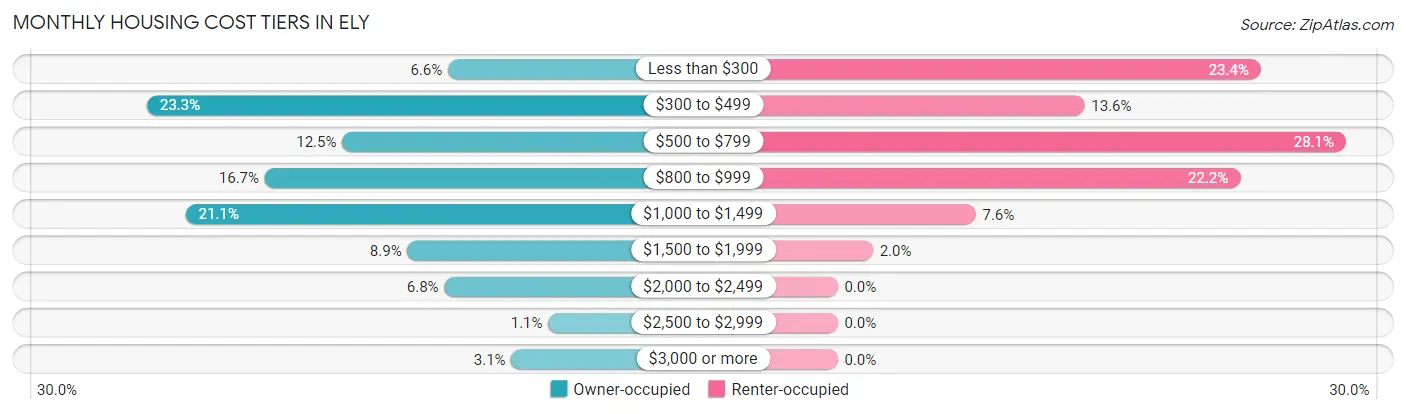
| Monthly Cost | Owner-occupied | Renter-occupied |
| Less than $300 | 68 (6.6%) | 144 (23.4%) |
| $300 to $499 | 239 (23.3%) | 84 (13.6%) |
| $500 to $799 | 128 (12.4%) | 173 (28.1%) |
| $800 to $999 | 172 (16.7%) | 137 (22.2%) |
| $1,000 to $1,499 | 217 (21.1%) | 47 (7.6%) |
| $1,500 to $1,999 | 91 (8.8%) | 12 (1.9%) |
| $2,000 to $2,499 | 70 (6.8%) | 0 (0.0%) |
| $2,500 to $2,999 | 11 (1.1%) | 0 (0.0%) |
| $3,000 or more | 32 (3.1%) | 0 (0.0%) |
| Total | 1,028 (100.0%) | 616 (100.0%) |
Physical Housing Characteristics in Ely
Housing Structures in Ely
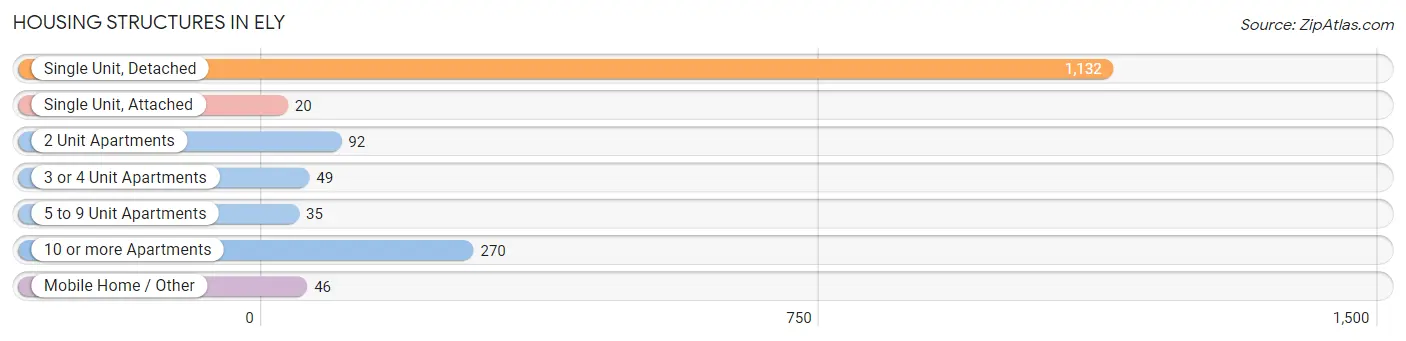
| Structure Type | # Housing Units | % Housing Units |
| Single Unit, Detached | 1,132 | 68.9% |
| Single Unit, Attached | 20 | 1.2% |
| 2 Unit Apartments | 92 | 5.6% |
| 3 or 4 Unit Apartments | 49 | 3.0% |
| 5 to 9 Unit Apartments | 35 | 2.1% |
| 10 or more Apartments | 270 | 16.4% |
| Mobile Home / Other | 46 | 2.8% |
| Total | 1,644 | 100.0% |
Housing Structures by Occupancy in Ely
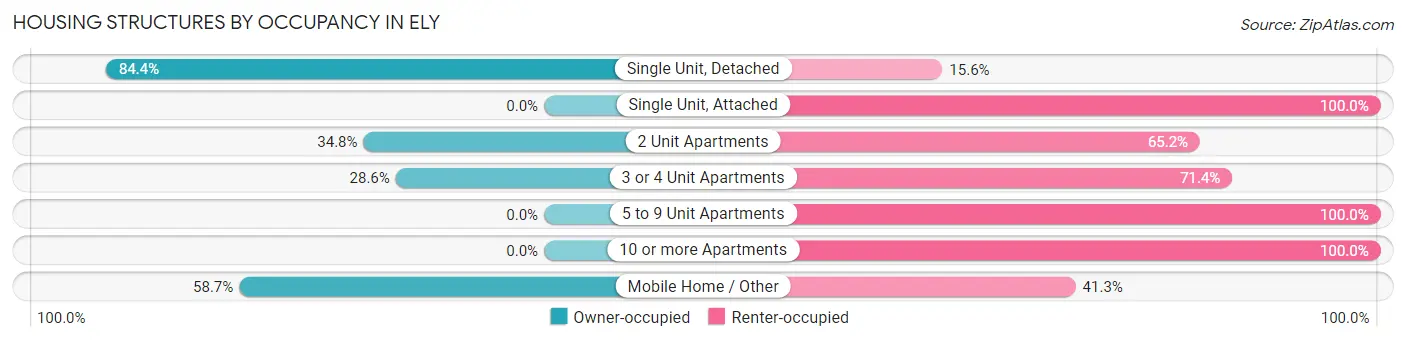
| Structure Type | Owner-occupied | Renter-occupied |
| Single Unit, Detached | 955 (84.4%) | 177 (15.6%) |
| Single Unit, Attached | 0 (0.0%) | 20 (100.0%) |
| 2 Unit Apartments | 32 (34.8%) | 60 (65.2%) |
| 3 or 4 Unit Apartments | 14 (28.6%) | 35 (71.4%) |
| 5 to 9 Unit Apartments | 0 (0.0%) | 35 (100.0%) |
| 10 or more Apartments | 0 (0.0%) | 270 (100.0%) |
| Mobile Home / Other | 27 (58.7%) | 19 (41.3%) |
| Total | 1,028 (62.5%) | 616 (37.5%) |
Housing Structures by Number of Rooms in Ely
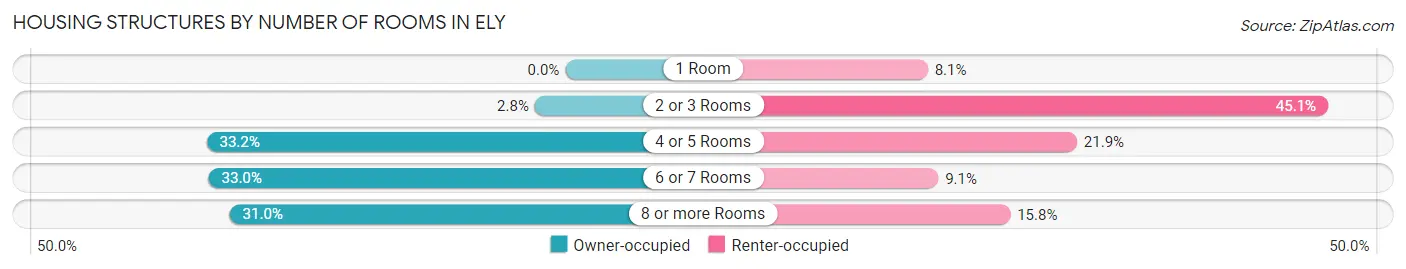
| Number of Rooms | Owner-occupied | Renter-occupied |
| 1 Room | 0 (0.0%) | 50 (8.1%) |
| 2 or 3 Rooms | 29 (2.8%) | 278 (45.1%) |
| 4 or 5 Rooms | 341 (33.2%) | 135 (21.9%) |
| 6 or 7 Rooms | 339 (33.0%) | 56 (9.1%) |
| 8 or more Rooms | 319 (31.0%) | 97 (15.8%) |
| Total | 1,028 (100.0%) | 616 (100.0%) |
Housing Structure by Heating Type in Ely
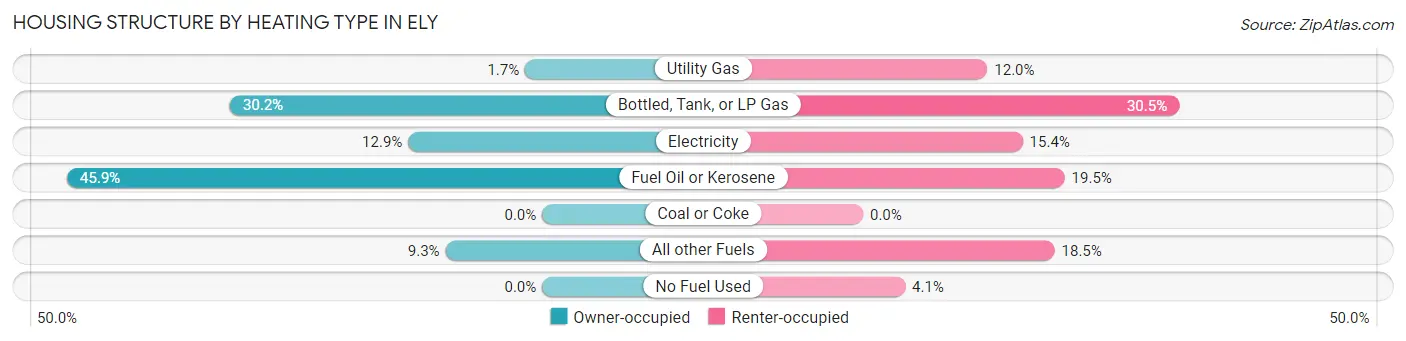
| Heating Type | Owner-occupied | Renter-occupied |
| Utility Gas | 17 (1.7%) | 74 (12.0%) |
| Bottled, Tank, or LP Gas | 310 (30.2%) | 188 (30.5%) |
| Electricity | 133 (12.9%) | 95 (15.4%) |
| Fuel Oil or Kerosene | 472 (45.9%) | 120 (19.5%) |
| Coal or Coke | 0 (0.0%) | 0 (0.0%) |
| All other Fuels | 96 (9.3%) | 114 (18.5%) |
| No Fuel Used | 0 (0.0%) | 25 (4.1%) |
| Total | 1,028 (100.0%) | 616 (100.0%) |
Household Vehicle Usage in Ely
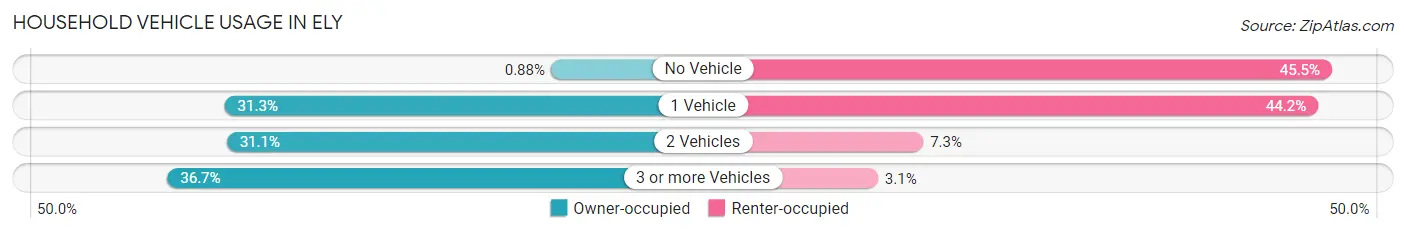
| Vehicles per Household | Owner-occupied | Renter-occupied |
| No Vehicle | 9 (0.9%) | 280 (45.5%) |
| 1 Vehicle | 322 (31.3%) | 272 (44.2%) |
| 2 Vehicles | 320 (31.1%) | 45 (7.3%) |
| 3 or more Vehicles | 377 (36.7%) | 19 (3.1%) |
| Total | 1,028 (100.0%) | 616 (100.0%) |
Real Estate & Mortgages in Ely
Real Estate and Mortgage Overview in Ely
| Characteristic | Without Mortgage | With Mortgage |
| Housing Units | 561 | 467 |
| Median Property Value | $138,400 | $165,700 |
| Median Household Income | $75,361 | $10 |
| Monthly Housing Costs | $484 | $23 |
| Real Estate Taxes | $1,058 | $9 |
Property Value by Mortgage Status in Ely
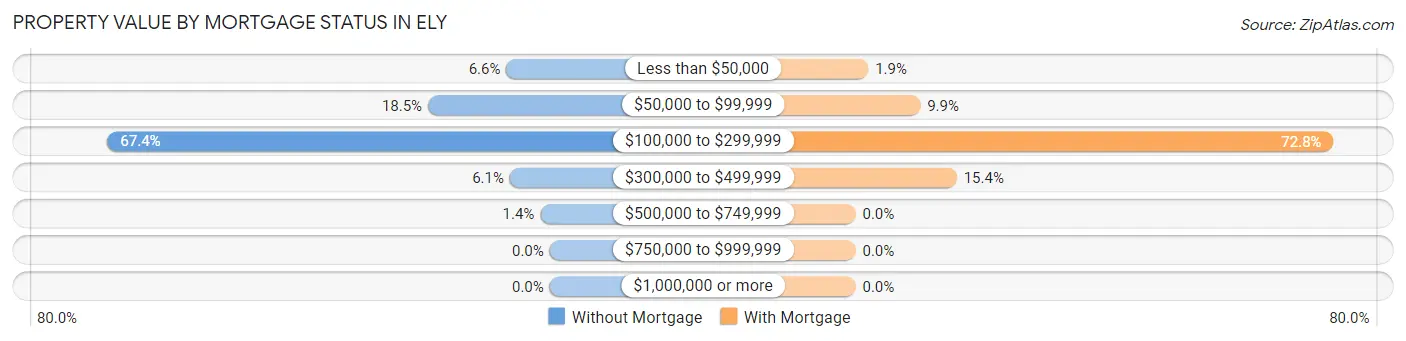
| Property Value | Without Mortgage | With Mortgage |
| Less than $50,000 | 37 (6.6%) | 9 (1.9%) |
| $50,000 to $99,999 | 104 (18.5%) | 46 (9.9%) |
| $100,000 to $299,999 | 378 (67.4%) | 340 (72.8%) |
| $300,000 to $499,999 | 34 (6.1%) | 72 (15.4%) |
| $500,000 to $749,999 | 8 (1.4%) | 0 (0.0%) |
| $750,000 to $999,999 | 0 (0.0%) | 0 (0.0%) |
| $1,000,000 or more | 0 (0.0%) | 0 (0.0%) |
| Total | 561 (100.0%) | 467 (100.0%) |
Household Income by Mortgage Status in Ely
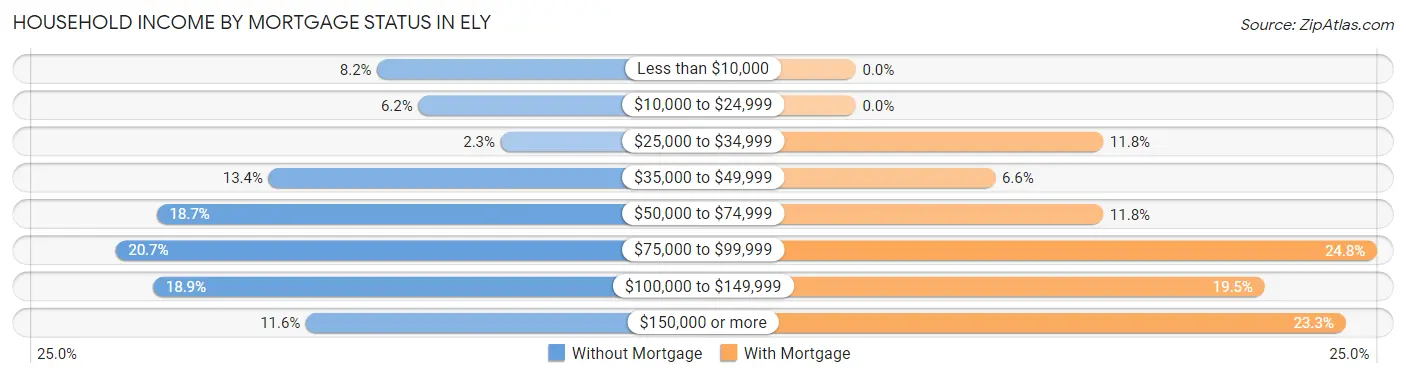
| Household Income | Without Mortgage | With Mortgage |
| Less than $10,000 | 46 (8.2%) | 0 (0.0%) |
| $10,000 to $24,999 | 35 (6.2%) | 0 (0.0%) |
| $25,000 to $34,999 | 13 (2.3%) | 55 (11.8%) |
| $35,000 to $49,999 | 75 (13.4%) | 31 (6.6%) |
| $50,000 to $74,999 | 105 (18.7%) | 55 (11.8%) |
| $75,000 to $99,999 | 116 (20.7%) | 116 (24.8%) |
| $100,000 to $149,999 | 106 (18.9%) | 91 (19.5%) |
| $150,000 or more | 65 (11.6%) | 109 (23.3%) |
| Total | 561 (100.0%) | 467 (100.0%) |
Property Value to Household Income Ratio in Ely
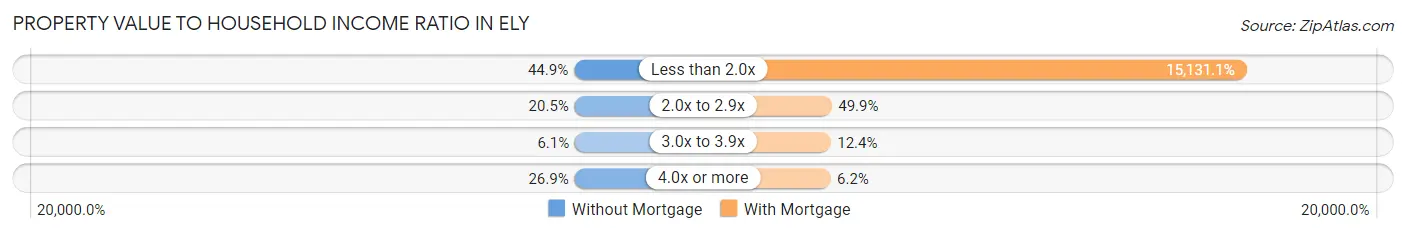
| Value-to-Income Ratio | Without Mortgage | With Mortgage |
| Less than 2.0x | 252 (44.9%) | 70,662 (15,131.0%) |
| 2.0x to 2.9x | 115 (20.5%) | 233 (49.9%) |
| 3.0x to 3.9x | 34 (6.1%) | 58 (12.4%) |
| 4.0x or more | 151 (26.9%) | 29 (6.2%) |
| Total | 561 (100.0%) | 467 (100.0%) |
Real Estate Taxes by Mortgage Status in Ely
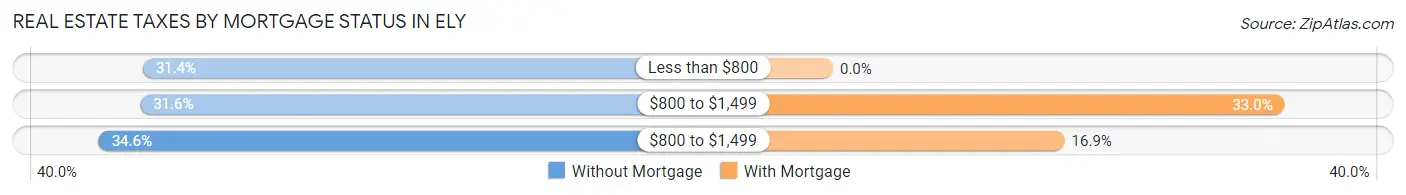
| Property Taxes | Without Mortgage | With Mortgage |
| Less than $800 | 176 (31.4%) | 0 (0.0%) |
| $800 to $1,499 | 177 (31.6%) | 154 (33.0%) |
| $800 to $1,499 | 194 (34.6%) | 79 (16.9%) |
| Total | 561 (100.0%) | 467 (100.0%) |
Health & Disability in Ely
Health Insurance Coverage by Age in Ely
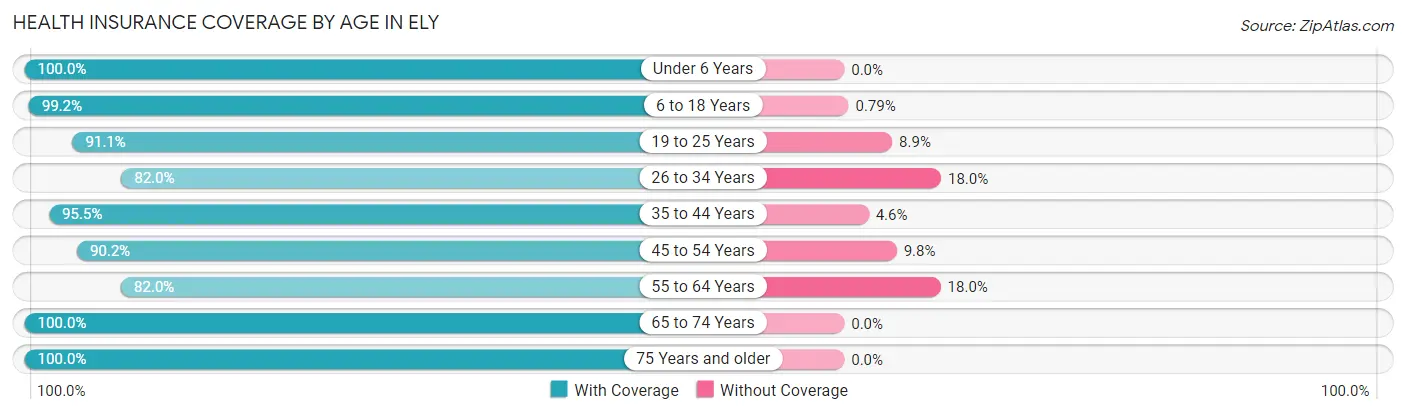
| Age Bracket | With Coverage | Without Coverage |
| Under 6 Years | 38 (100.0%) | 0 (0.0%) |
| 6 to 18 Years | 504 (99.2%) | 4 (0.8%) |
| 19 to 25 Years | 408 (91.1%) | 40 (8.9%) |
| 26 to 34 Years | 268 (82.0%) | 59 (18.0%) |
| 35 to 44 Years | 210 (95.5%) | 10 (4.5%) |
| 45 to 54 Years | 277 (90.2%) | 30 (9.8%) |
| 55 to 64 Years | 534 (82.0%) | 117 (18.0%) |
| 65 to 74 Years | 456 (100.0%) | 0 (0.0%) |
| 75 Years and older | 273 (100.0%) | 0 (0.0%) |
| Total | 2,968 (91.9%) | 260 (8.1%) |
Health Insurance Coverage by Citizenship Status in Ely
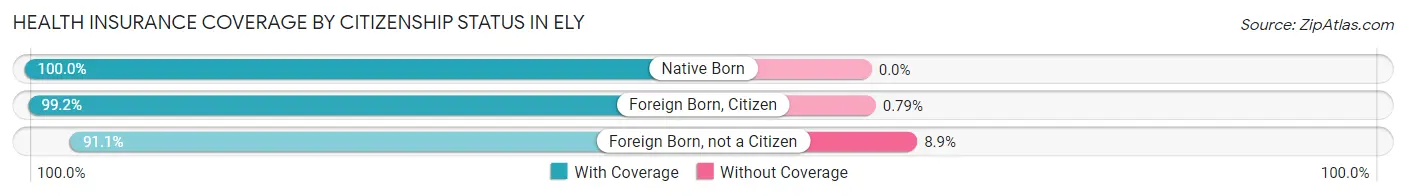
| Citizenship Status | With Coverage | Without Coverage |
| Native Born | 38 (100.0%) | 0 (0.0%) |
| Foreign Born, Citizen | 504 (99.2%) | 4 (0.8%) |
| Foreign Born, not a Citizen | 408 (91.1%) | 40 (8.9%) |
Health Insurance Coverage by Household Income in Ely
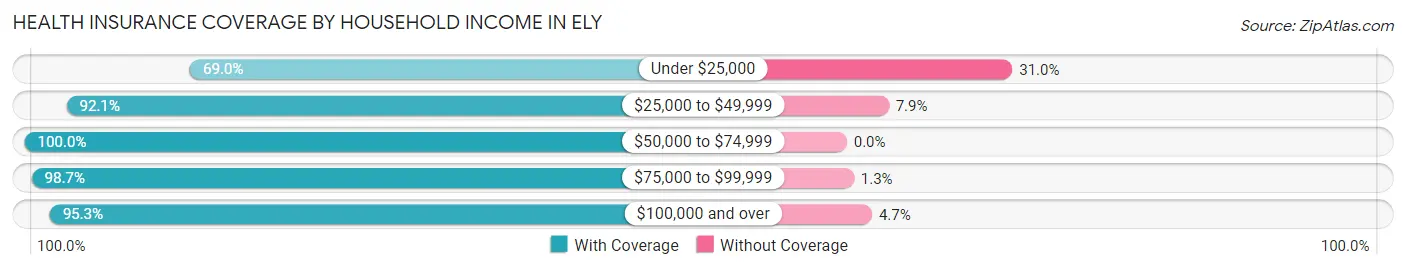
| Household Income | With Coverage | Without Coverage |
| Under $25,000 | 356 (69.0%) | 160 (31.0%) |
| $25,000 to $49,999 | 434 (92.1%) | 37 (7.9%) |
| $50,000 to $74,999 | 438 (100.0%) | 0 (0.0%) |
| $75,000 to $99,999 | 523 (98.7%) | 7 (1.3%) |
| $100,000 and over | 968 (95.3%) | 48 (4.7%) |
Public vs Private Health Insurance Coverage by Age in Ely
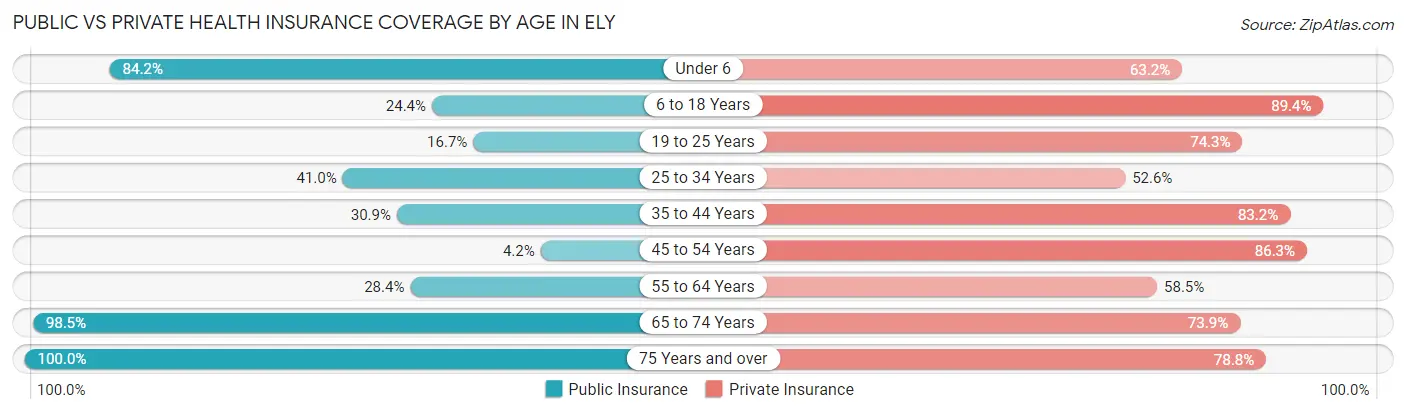
| Age Bracket | Public Insurance | Private Insurance |
| Under 6 | 32 (84.2%) | 24 (63.2%) |
| 6 to 18 Years | 124 (24.4%) | 454 (89.4%) |
| 19 to 25 Years | 75 (16.7%) | 333 (74.3%) |
| 25 to 34 Years | 134 (41.0%) | 172 (52.6%) |
| 35 to 44 Years | 68 (30.9%) | 183 (83.2%) |
| 45 to 54 Years | 13 (4.2%) | 265 (86.3%) |
| 55 to 64 Years | 185 (28.4%) | 381 (58.5%) |
| 65 to 74 Years | 449 (98.5%) | 337 (73.9%) |
| 75 Years and over | 273 (100.0%) | 215 (78.7%) |
| Total | 1,353 (41.9%) | 2,364 (73.2%) |
Disability Status by Sex by Age in Ely
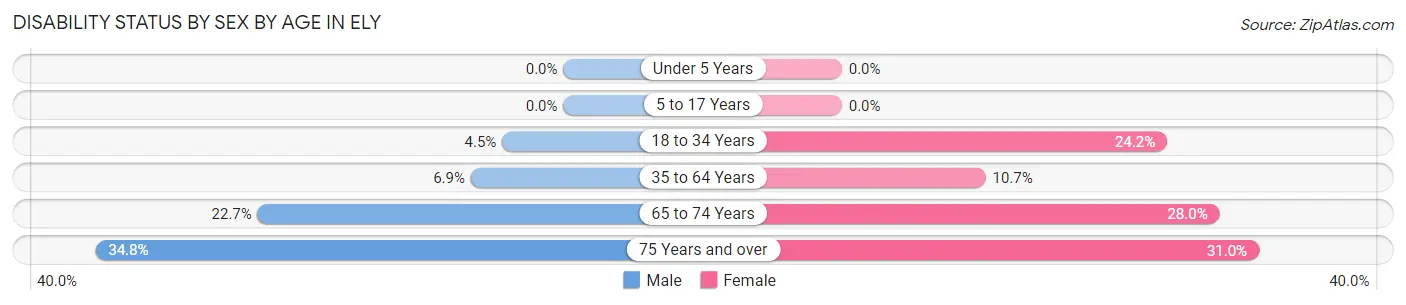
| Age Bracket | Male | Female |
| Under 5 Years | 0 (0.0%) | 0 (0.0%) |
| 5 to 17 Years | 0 (0.0%) | 0 (0.0%) |
| 18 to 34 Years | 26 (4.5%) | 92 (24.1%) |
| 35 to 64 Years | 41 (6.9%) | 62 (10.7%) |
| 65 to 74 Years | 42 (22.7%) | 76 (28.0%) |
| 75 Years and over | 41 (34.7%) | 48 (31.0%) |
Disability Class by Sex by Age in Ely
Disability Class: Hearing Difficulty
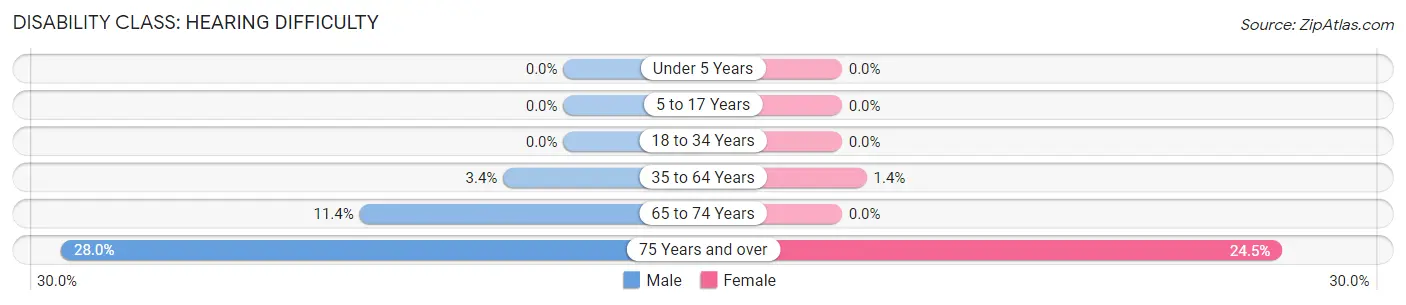
| Age Bracket | Male | Female |
| Under 5 Years | 0 (0.0%) | 0 (0.0%) |
| 5 to 17 Years | 0 (0.0%) | 0 (0.0%) |
| 18 to 34 Years | 0 (0.0%) | 0 (0.0%) |
| 35 to 64 Years | 20 (3.4%) | 8 (1.4%) |
| 65 to 74 Years | 21 (11.4%) | 0 (0.0%) |
| 75 Years and over | 33 (28.0%) | 38 (24.5%) |
Disability Class: Vision Difficulty
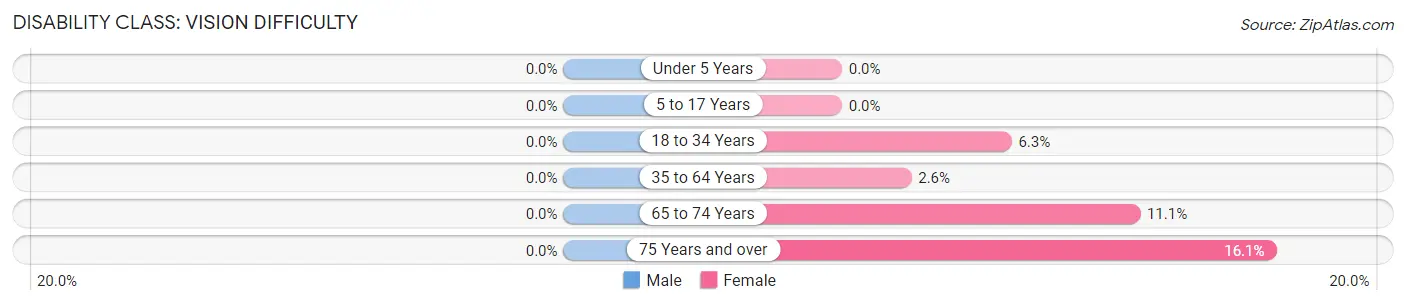
| Age Bracket | Male | Female |
| Under 5 Years | 0 (0.0%) | 0 (0.0%) |
| 5 to 17 Years | 0 (0.0%) | 0 (0.0%) |
| 18 to 34 Years | 0 (0.0%) | 24 (6.3%) |
| 35 to 64 Years | 0 (0.0%) | 15 (2.6%) |
| 65 to 74 Years | 0 (0.0%) | 30 (11.1%) |
| 75 Years and over | 0 (0.0%) | 25 (16.1%) |
Disability Class: Cognitive Difficulty
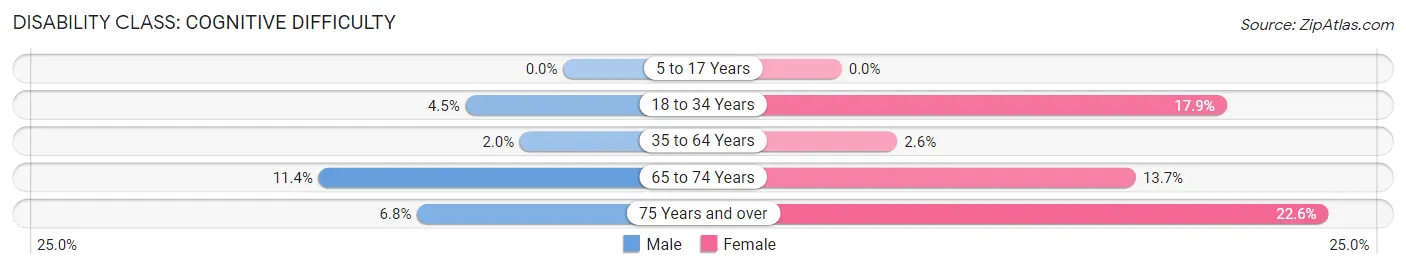
| Age Bracket | Male | Female |
| 5 to 17 Years | 0 (0.0%) | 0 (0.0%) |
| 18 to 34 Years | 26 (4.5%) | 68 (17.8%) |
| 35 to 64 Years | 12 (2.0%) | 15 (2.6%) |
| 65 to 74 Years | 21 (11.4%) | 37 (13.7%) |
| 75 Years and over | 8 (6.8%) | 35 (22.6%) |
Disability Class: Ambulatory Difficulty
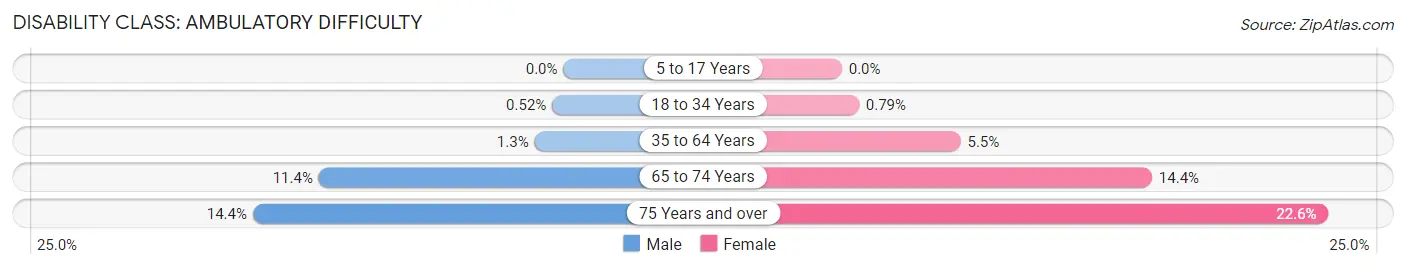
| Age Bracket | Male | Female |
| 5 to 17 Years | 0 (0.0%) | 0 (0.0%) |
| 18 to 34 Years | 3 (0.5%) | 3 (0.8%) |
| 35 to 64 Years | 8 (1.3%) | 32 (5.5%) |
| 65 to 74 Years | 21 (11.4%) | 39 (14.4%) |
| 75 Years and over | 17 (14.4%) | 35 (22.6%) |
Disability Class: Self-Care Difficulty
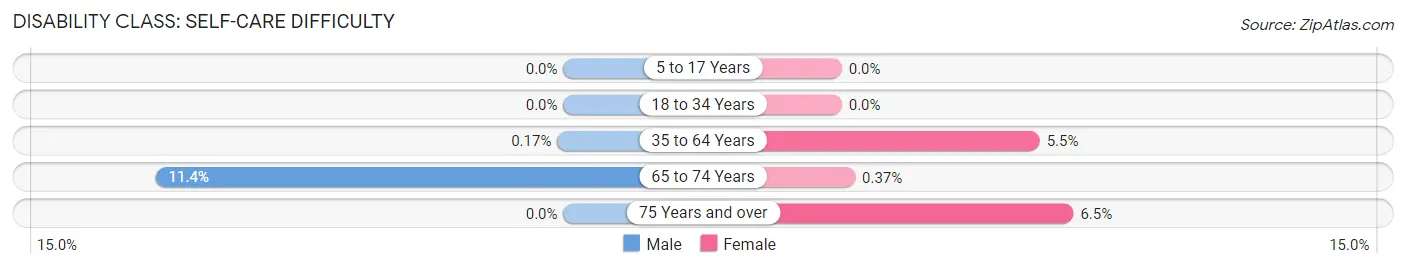
| Age Bracket | Male | Female |
| 5 to 17 Years | 0 (0.0%) | 0 (0.0%) |
| 18 to 34 Years | 0 (0.0%) | 0 (0.0%) |
| 35 to 64 Years | 1 (0.2%) | 32 (5.5%) |
| 65 to 74 Years | 21 (11.4%) | 1 (0.4%) |
| 75 Years and over | 0 (0.0%) | 10 (6.5%) |
Technology Access in Ely
Computing Device Access in Ely
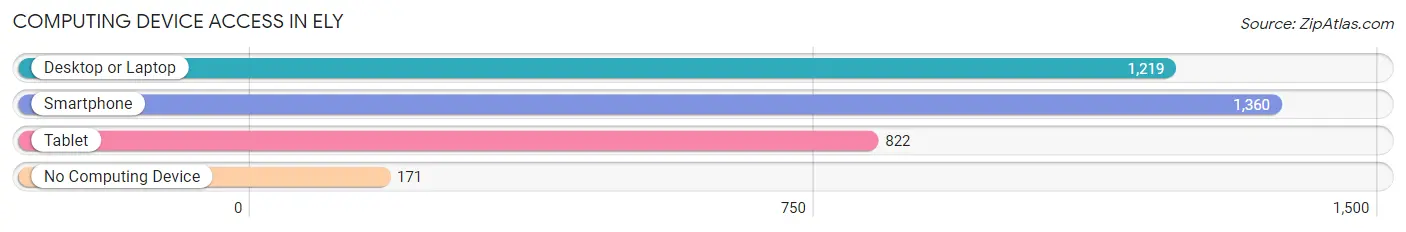
| Device Type | # Households | % Households |
| Desktop or Laptop | 1,219 | 74.2% |
| Smartphone | 1,360 | 82.7% |
| Tablet | 822 | 50.0% |
| No Computing Device | 171 | 10.4% |
| Total | 1,644 | 100.0% |
Internet Access in Ely
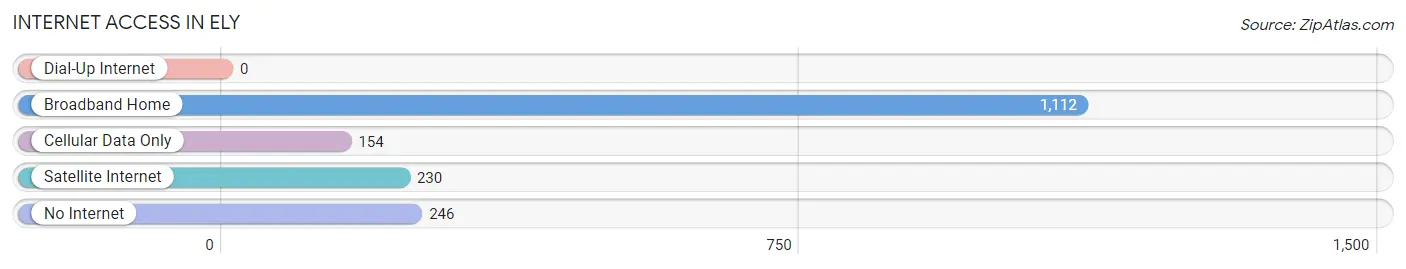
| Internet Type | # Households | % Households |
| Dial-Up Internet | 0 | 0.0% |
| Broadband Home | 1,112 | 67.6% |
| Cellular Data Only | 154 | 9.4% |
| Satellite Internet | 230 | 14.0% |
| No Internet | 246 | 15.0% |
| Total | 1,644 | 100.0% |
Ely Summary
Ely, Minnesota is a small city located in the northeastern corner of the state, near the Canadian border. It is the county seat of St. Louis County and is part of the Duluth, Minnesota-Superior, Wisconsin metropolitan area. The city has a population of 3,460 as of the 2010 census, and is the largest city in the Arrowhead Region of Minnesota.
History
The area that is now Ely was first inhabited by the Ojibwe people, who called the area “Gaa-waabaabiganikaag”, meaning “at the small rapid”. The first European settlers arrived in the area in the late 1800s, and the city was officially incorporated in 1892. The city was named after Samuel Ely, a local businessman and landowner.
In the early 1900s, Ely became a major logging center, and the city’s economy was largely based on the timber industry. The city was also home to several iron ore mines, which provided employment for many of the city’s residents. The city’s economy began to decline in the 1950s, as the timber industry began to decline and the iron ore mines closed.
Geography
Ely is located in the northeastern corner of Minnesota, near the Canadian border. The city is situated on the western shore of Shagawa Lake, and is surrounded by the Superior National Forest. The city is located approximately 25 miles south of the Boundary Waters Canoe Area Wilderness, and is a popular destination for outdoor recreation.
The city has a total area of 4.2 square miles, of which 4.1 square miles is land and 0.1 square miles is water. The city is located at an elevation of 1,541 feet above sea level.
Economy
Ely’s economy is largely based on tourism, as the city is a popular destination for outdoor recreation. The city is home to several resorts and lodges, as well as a variety of restaurants and shops. The city is also home to several manufacturing companies, including a paper mill and a wood products plant.
The city is also home to the International Wolf Center, which is dedicated to the preservation and protection of wolves. The center offers educational programs and tours, and is a popular tourist destination.
Demographics
As of the 2010 census, the city had a population of 3,460. The racial makeup of the city was 94.2% White, 0.7% African American, 0.7% Native American, 0.3% Asian, 0.1% Pacific Islander, 0.7% from other races, and 2.5% from two or more races. Hispanic or Latino of any race were 1.7% of the population.
The median income for a household in the city was $37,917, and the median income for a family was $45,938. The per capita income for the city was $20,945. About 11.2% of families and 14.2% of the population were below the poverty line, including 19.2% of those under age 18 and 8.2% of those age 65 or over.
Common Questions
What is Per Capita Income in Ely?
Per Capita income in Ely is $31,318.
What is the Median Family Income in Ely?
Median Family Income in Ely is $98,029.
What is the Median Household income in Ely?
Median Household Income in Ely is $47,095.
What is Income or Wage Gap in Ely?
Income or Wage Gap in Ely is 19.2%.
Women in Ely earn 80.8 cents for every dollar earned by a man.
What is Inequality or Gini Index in Ely?
Inequality or Gini Index in Ely is 0.45.
What is the Total Population of Ely?
Total Population of Ely is 3,265.
What is the Total Male Population of Ely?
Total Male Population of Ely is 1,608.
What is the Total Female Population of Ely?
Total Female Population of Ely is 1,657.
What is the Ratio of Males per 100 Females in Ely?
There are 97.04 Males per 100 Females in Ely.
What is the Ratio of Females per 100 Males in Ely?
There are 103.05 Females per 100 Males in Ely.
What is the Median Population Age in Ely?
Median Population Age in Ely is 46.3 Years.
What is the Average Family Size in Ely
Average Family Size in Ely is 2.9 People.
What is the Average Household Size in Ely
Average Household Size in Ely is 1.8 People.
How Large is the Labor Force in Ely?
There are 1,728 People in the Labor Forcein in Ely.
What is the Percentage of People in the Labor Force in Ely?
57.4% of People are in the Labor Force in Ely.
What is the Unemployment Rate in Ely?
Unemployment Rate in Ely is 2.8%.