Turtle River, MN Map & Demographics
Turtle River Map
Turtle River Overview
$42,375
PER CAPITA INCOME
$84,375
AVG FAMILY INCOME
$83,438
AVG HOUSEHOLD INCOME
0.32
INEQUALITY / GINI INDEX
67
TOTAL POPULATION
30
MALE POPULATION
37
FEMALE POPULATION
81.08
MALES / 100 FEMALES
123.33
FEMALES / 100 MALES
64.1
MEDIAN AGE
2.3
AVG FAMILY SIZE
2.2
AVG HOUSEHOLD SIZE
25
LABOR FORCE [ PEOPLE ]
44.6%
PERCENT IN LABOR FORCE
Turtle River Area Codes
Income in Turtle River
Income Overview in Turtle River
Per Capita Income in Turtle River is $42,375, while median incomes of families and households are $84,375 and $83,438 respectively.
| Characteristic | Number | Measure |
| Per Capita Income | 67 | $42,375 |
| Median Family Income | 24 | $84,375 |
| Mean Family Income | 24 | $91,338 |
| Median Household Income | 31 | $83,438 |
| Mean Household Income | 31 | $87,690 |
| Income Deficit | 24 | $0 |
| Wage / Income Gap (%) | 67 | 0.00% |
| Wage / Income Gap ($) | 67 | 100.00¢ per $1 |
| Gini / Inequality Index | 67 | 0.32 |
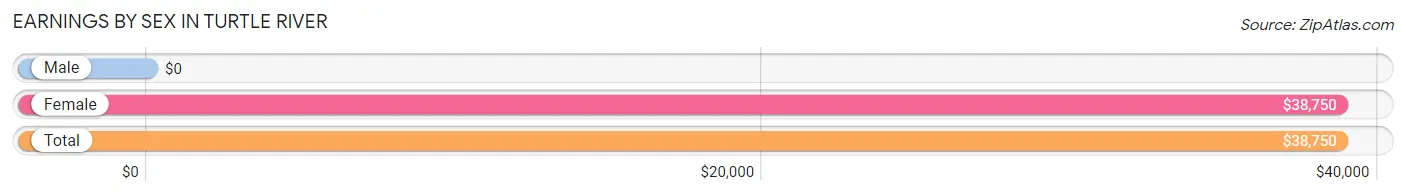
Earnings by Sex in Turtle River
| Sex | Number | Average Earnings |
| Male | 16 (42.1%) | $0 |
| Female | 22 (57.9%) | $38,750 |
| Total | 38 (100.0%) | $38,750 |
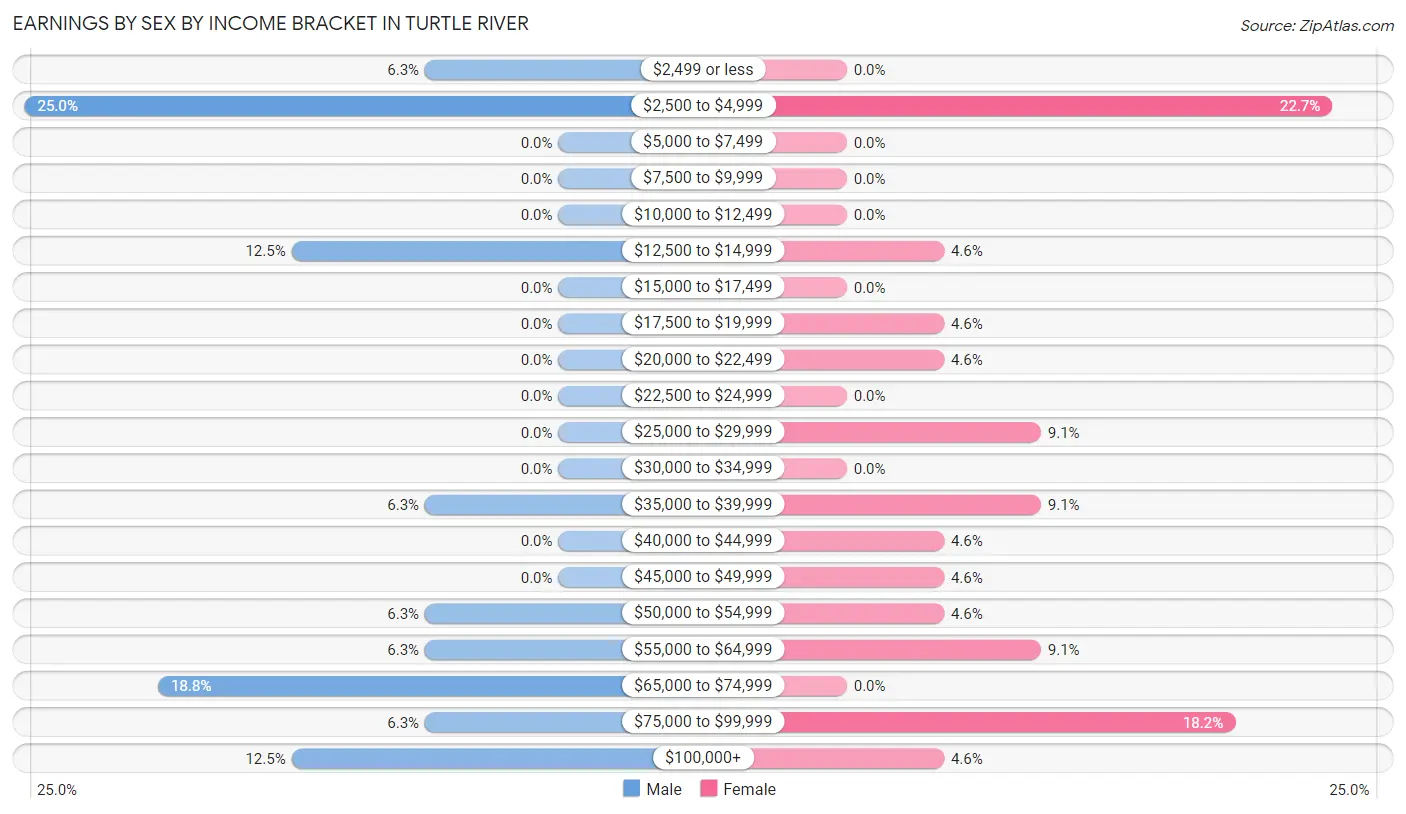
Earnings by Sex by Income Bracket in Turtle River
The most common earnings brackets in Turtle River are $2,500 to $4,999 for men (4 | 25.0%) and $2,500 to $4,999 for women (5 | 22.7%).
| Income | Male | Female |
| $2,499 or less | 1 (6.2%) | 0 (0.0%) |
| $2,500 to $4,999 | 4 (25.0%) | 5 (22.7%) |
| $5,000 to $7,499 | 0 (0.0%) | 0 (0.0%) |
| $7,500 to $9,999 | 0 (0.0%) | 0 (0.0%) |
| $10,000 to $12,499 | 0 (0.0%) | 0 (0.0%) |
| $12,500 to $14,999 | 2 (12.5%) | 1 (4.5%) |
| $15,000 to $17,499 | 0 (0.0%) | 0 (0.0%) |
| $17,500 to $19,999 | 0 (0.0%) | 1 (4.5%) |
| $20,000 to $22,499 | 0 (0.0%) | 1 (4.5%) |
| $22,500 to $24,999 | 0 (0.0%) | 0 (0.0%) |
| $25,000 to $29,999 | 0 (0.0%) | 2 (9.1%) |
| $30,000 to $34,999 | 0 (0.0%) | 0 (0.0%) |
| $35,000 to $39,999 | 1 (6.2%) | 2 (9.1%) |
| $40,000 to $44,999 | 0 (0.0%) | 1 (4.5%) |
| $45,000 to $49,999 | 0 (0.0%) | 1 (4.5%) |
| $50,000 to $54,999 | 1 (6.2%) | 1 (4.5%) |
| $55,000 to $64,999 | 1 (6.2%) | 2 (9.1%) |
| $65,000 to $74,999 | 3 (18.8%) | 0 (0.0%) |
| $75,000 to $99,999 | 1 (6.2%) | 4 (18.2%) |
| $100,000+ | 2 (12.5%) | 1 (4.5%) |
| Total | 16 (100.0%) | 22 (100.0%) |
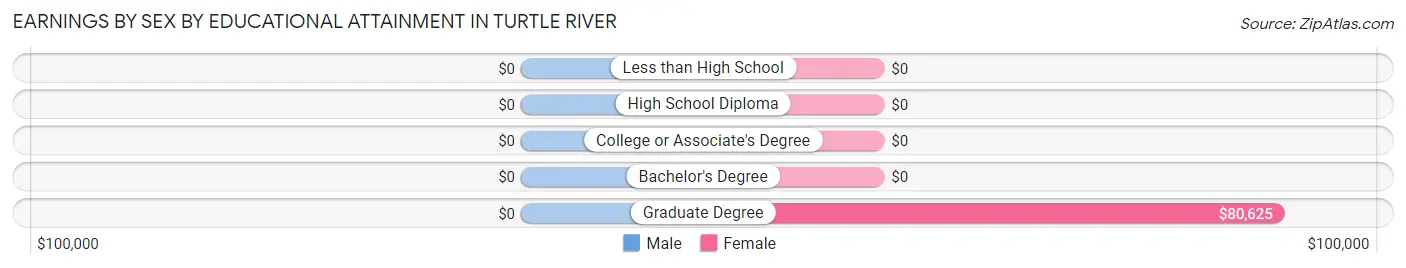
Earnings by Sex by Educational Attainment in Turtle River
| Educational Attainment | Male Income | Female Income |
| Less than High School | - | - |
| High School Diploma | - | - |
| College or Associate's Degree | - | - |
| Bachelor's Degree | - | - |
| Graduate Degree | - | - |
| Total | - | - |
Family Income in Turtle River
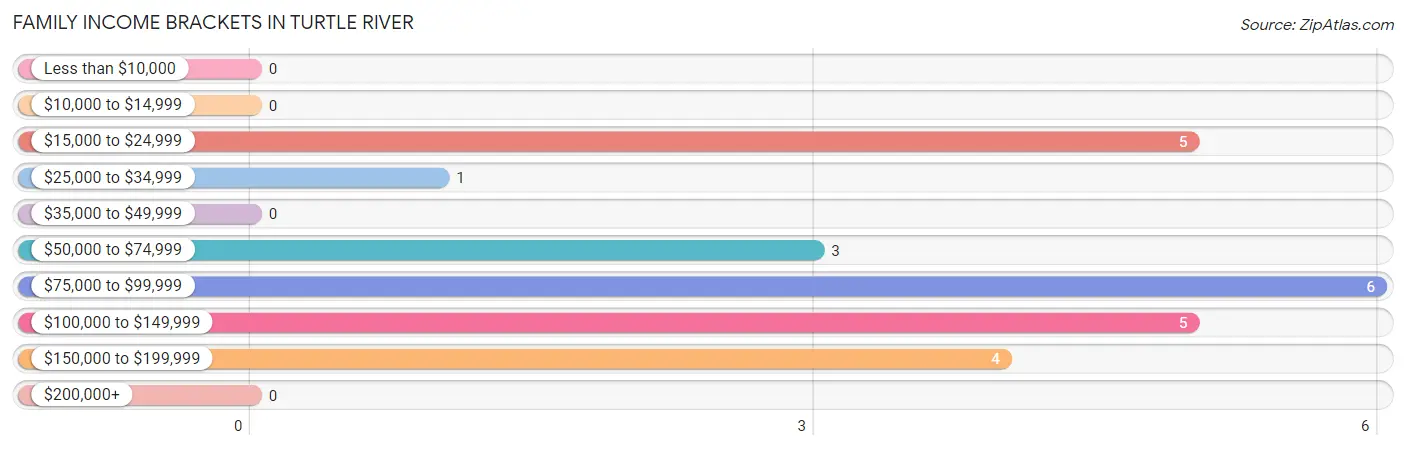
Family Income Brackets in Turtle River
According to the Turtle River family income data, there are 6 families falling into the $75,000 to $99,999 income range, which is the most common income bracket and makes up 25.0% of all families.
| Income Bracket | # Families | % Families |
| Less than $10,000 | 0 | 0.0% |
| $10,000 to $14,999 | 0 | 0.0% |
| $15,000 to $24,999 | 5 | 20.8% |
| $25,000 to $34,999 | 1 | 4.2% |
| $35,000 to $49,999 | 0 | 0.0% |
| $50,000 to $74,999 | 3 | 12.5% |
| $75,000 to $99,999 | 6 | 25.0% |
| $100,000 to $149,999 | 5 | 20.8% |
| $150,000 to $199,999 | 4 | 16.7% |
| $200,000+ | 0 | 0.0% |
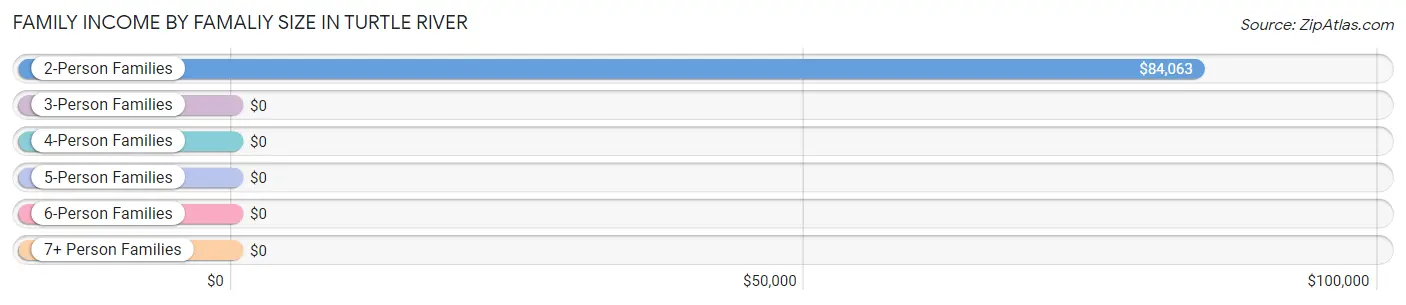
Family Income by Famaliy Size in Turtle River
2-person families (21 | 87.5%) account for the highest median family income in Turtle River with $84,063 per family, while 2-person families (21 | 87.5%) have the highest median income of $42,032 per family member.
| Income Bracket | # Families | Median Income |
| 2-Person Families | 21 (87.5%) | $84,063 |
| 3-Person Families | 0 (0.0%) | $0 |
| 4-Person Families | 3 (12.5%) | $0 |
| 5-Person Families | 0 (0.0%) | $0 |
| 6-Person Families | 0 (0.0%) | $0 |
| 7+ Person Families | 0 (0.0%) | $0 |
| Total | 24 (100.0%) | $84,375 |
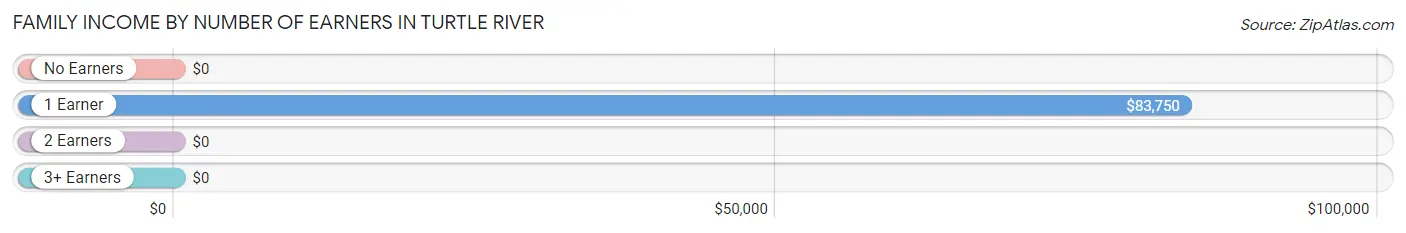
Family Income by Number of Earners in Turtle River
| Number of Earners | # Families | Median Income |
| No Earners | 5 (20.8%) | $0 |
| 1 Earner | 8 (33.3%) | $83,750 |
| 2 Earners | 11 (45.8%) | $0 |
| 3+ Earners | 0 (0.0%) | $0 |
| Total | 24 (100.0%) | $84,375 |
Household Income in Turtle River
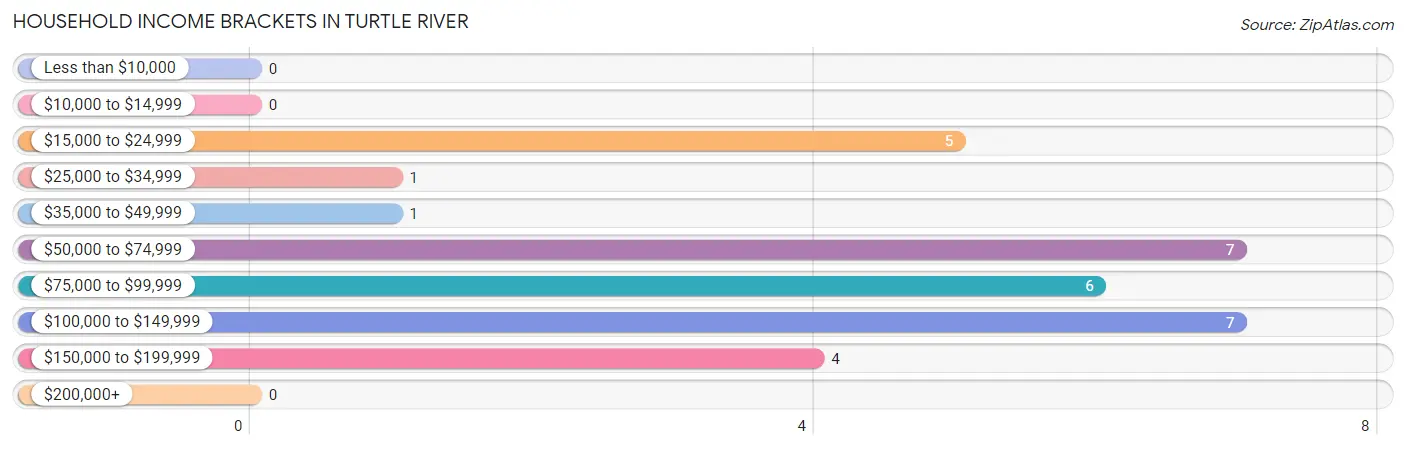
Household Income Brackets in Turtle River
With 7 households falling in the category, the $50,000 to $74,999 income range is the most frequent in Turtle River, accounting for 22.6% of all households.
| Income Bracket | # Households | % Households |
| Less than $10,000 | 0 | 0.0% |
| $10,000 to $14,999 | 0 | 0.0% |
| $15,000 to $24,999 | 5 | 16.1% |
| $25,000 to $34,999 | 1 | 3.2% |
| $35,000 to $49,999 | 1 | 3.2% |
| $50,000 to $74,999 | 7 | 22.6% |
| $75,000 to $99,999 | 6 | 19.4% |
| $100,000 to $149,999 | 7 | 22.6% |
| $150,000 to $199,999 | 4 | 12.9% |
| $200,000+ | 0 | 0.0% |
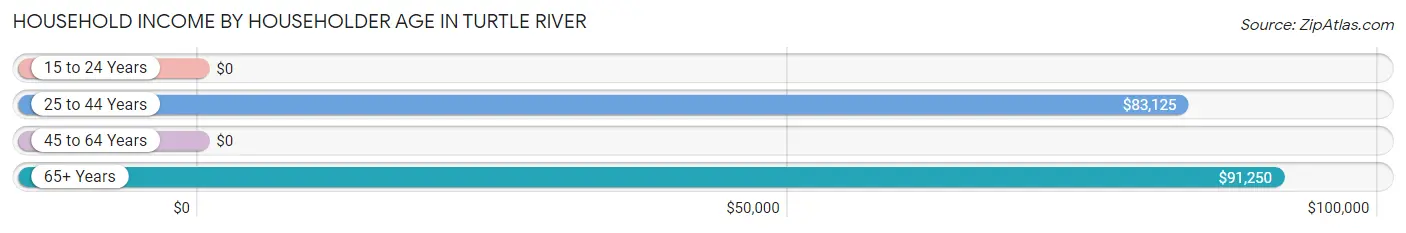
Household Income by Householder Age in Turtle River
The median household income in Turtle River is $83,438, with the highest median household income of $91,250 found in the 65+ years age bracket for the primary householder. A total of 10 households (32.3%) fall into this category.
| Income Bracket | # Households | Median Income |
| 15 to 24 Years | 0 (0.0%) | $0 |
| 25 to 44 Years | 6 (19.4%) | $83,125 |
| 45 to 64 Years | 15 (48.4%) | $0 |
| 65+ Years | 10 (32.3%) | $91,250 |
| Total | 31 (100.0%) | $83,438 |
Poverty in Turtle River
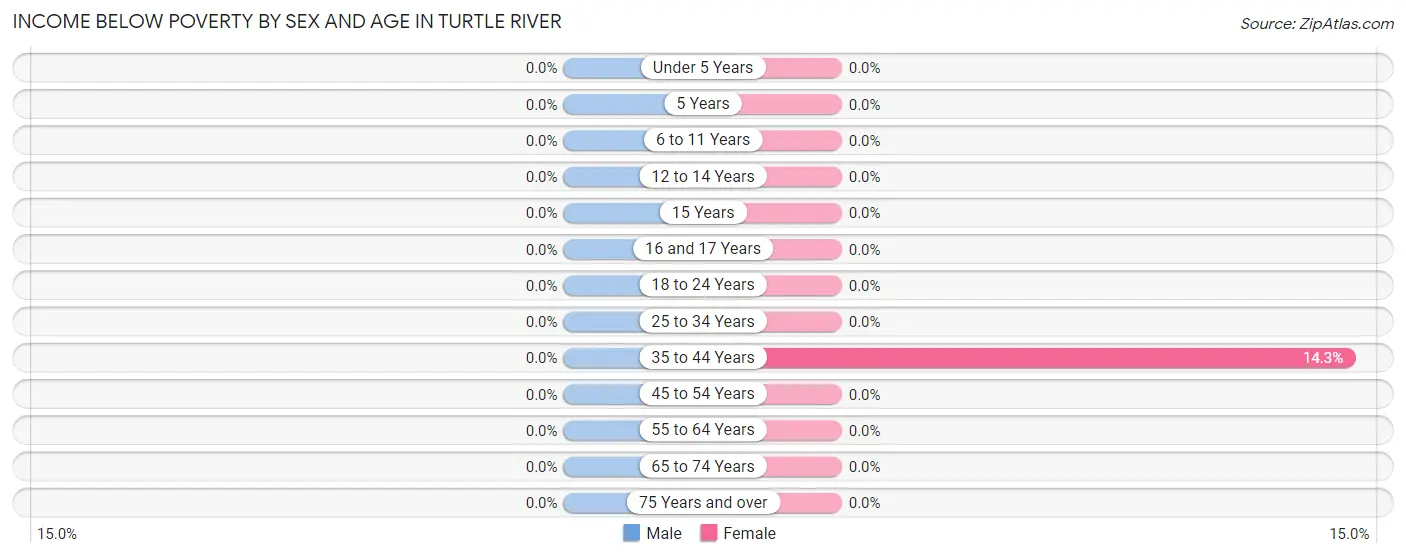
Income Below Poverty by Sex and Age in Turtle River
| Age Bracket | Male | Female |
| Under 5 Years | 0 (0.0%) | 0 (0.0%) |
| 5 Years | 0 (0.0%) | 0 (0.0%) |
| 6 to 11 Years | 0 (0.0%) | 0 (0.0%) |
| 12 to 14 Years | 0 (0.0%) | 0 (0.0%) |
| 15 Years | 0 (0.0%) | 0 (0.0%) |
| 16 and 17 Years | 0 (0.0%) | 0 (0.0%) |
| 18 to 24 Years | 0 (0.0%) | 0 (0.0%) |
| 25 to 34 Years | 0 (0.0%) | 0 (0.0%) |
| 35 to 44 Years | 0 (0.0%) | 1 (14.3%) |
| 45 to 54 Years | 0 (0.0%) | 0 (0.0%) |
| 55 to 64 Years | 0 (0.0%) | 0 (0.0%) |
| 65 to 74 Years | 0 (0.0%) | 0 (0.0%) |
| 75 Years and over | 0 (0.0%) | 0 (0.0%) |
| Total | 0 (0.0%) | 1 (2.7%) |
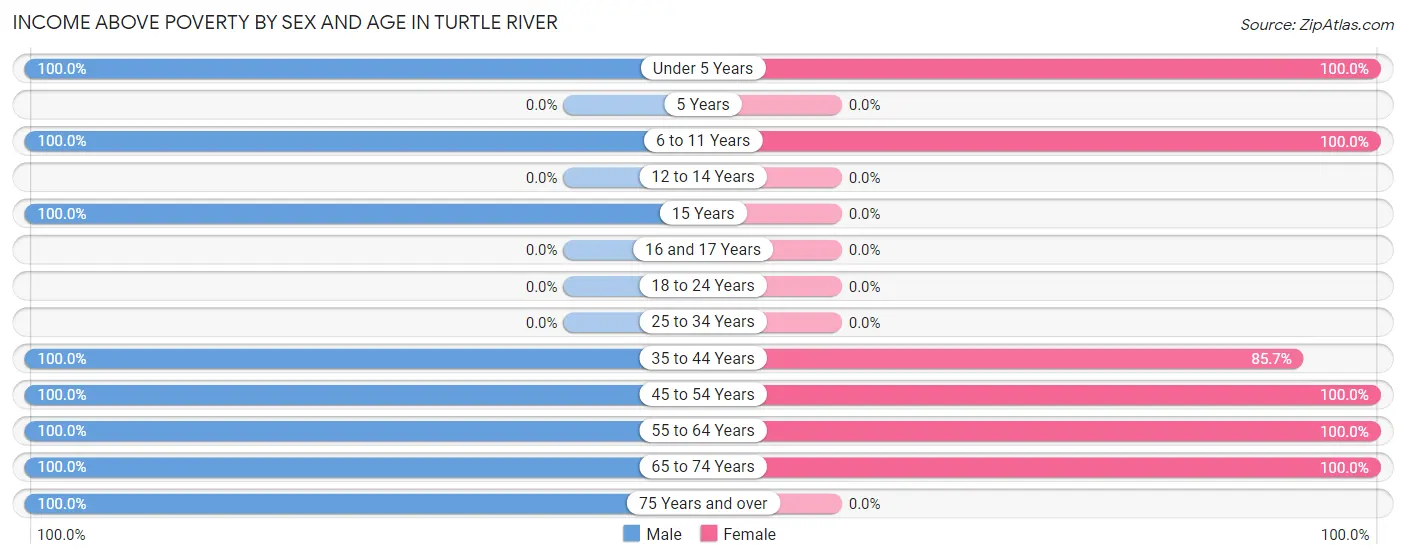
Income Above Poverty by Sex and Age in Turtle River
According to the poverty statistics in Turtle River, males aged under 5 years and females aged under 5 years are the age groups that are most secure financially, with 100.0% of males and 100.0% of females in these age groups living above the poverty line.
| Age Bracket | Male | Female |
| Under 5 Years | 1 (100.0%) | 4 (100.0%) |
| 5 Years | 0 (0.0%) | 0 (0.0%) |
| 6 to 11 Years | 3 (100.0%) | 1 (100.0%) |
| 12 to 14 Years | 0 (0.0%) | 0 (0.0%) |
| 15 Years | 2 (100.0%) | 0 (0.0%) |
| 16 and 17 Years | 0 (0.0%) | 0 (0.0%) |
| 18 to 24 Years | 0 (0.0%) | 0 (0.0%) |
| 25 to 34 Years | 0 (0.0%) | 0 (0.0%) |
| 35 to 44 Years | 1 (100.0%) | 6 (85.7%) |
| 45 to 54 Years | 1 (100.0%) | 5 (100.0%) |
| 55 to 64 Years | 5 (100.0%) | 11 (100.0%) |
| 65 to 74 Years | 15 (100.0%) | 9 (100.0%) |
| 75 Years and over | 2 (100.0%) | 0 (0.0%) |
| Total | 30 (100.0%) | 36 (97.3%) |
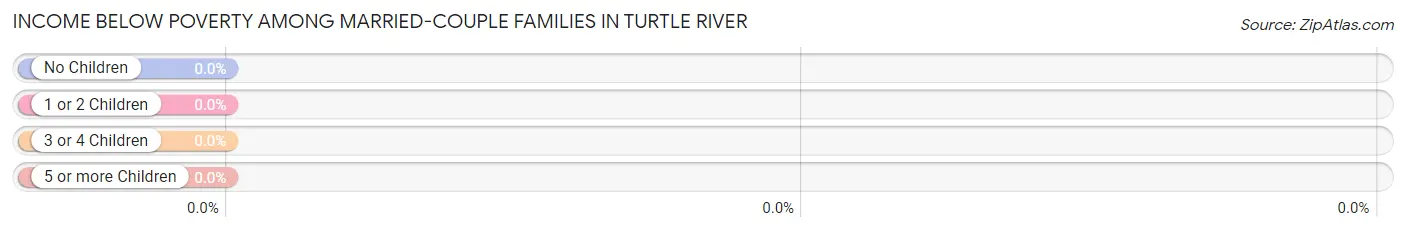
Income Below Poverty Among Married-Couple Families in Turtle River
| Children | Above Poverty | Below Poverty |
| No Children | 16 (100.0%) | 0 (0.0%) |
| 1 or 2 Children | 2 (100.0%) | 0 (0.0%) |
| 3 or 4 Children | 0 (0.0%) | 0 (0.0%) |
| 5 or more Children | 0 (0.0%) | 0 (0.0%) |
| Total | 18 (100.0%) | 0 (0.0%) |
Income Below Poverty Among Single-Parent Households in Turtle River
| Children | Single Father | Single Mother |
| No Children | 0 (0.0%) | 0 (0.0%) |
| 1 or 2 Children | 0 (0.0%) | 0 (0.0%) |
| 3 or 4 Children | 0 (0.0%) | 0 (0.0%) |
| 5 or more Children | 0 (0.0%) | 0 (0.0%) |
| Total | 0 (0.0%) | 0 (0.0%) |
Income Below Poverty Among Married-Couple vs Single-Parent Households in Turtle River
| Children | Married-Couple Families | Single-Parent Households |
| No Children | 0 (0.0%) | 0 (0.0%) |
| 1 or 2 Children | 0 (0.0%) | 0 (0.0%) |
| 3 or 4 Children | 0 (0.0%) | 0 (0.0%) |
| 5 or more Children | 0 (0.0%) | 0 (0.0%) |
| Total | 0 (0.0%) | 0 (0.0%) |
Race in Turtle River
The most populous races in Turtle River are White / Caucasian (64 | 95.5%), Two or more Races (2 | 3.0%), and Asian (1 | 1.5%).
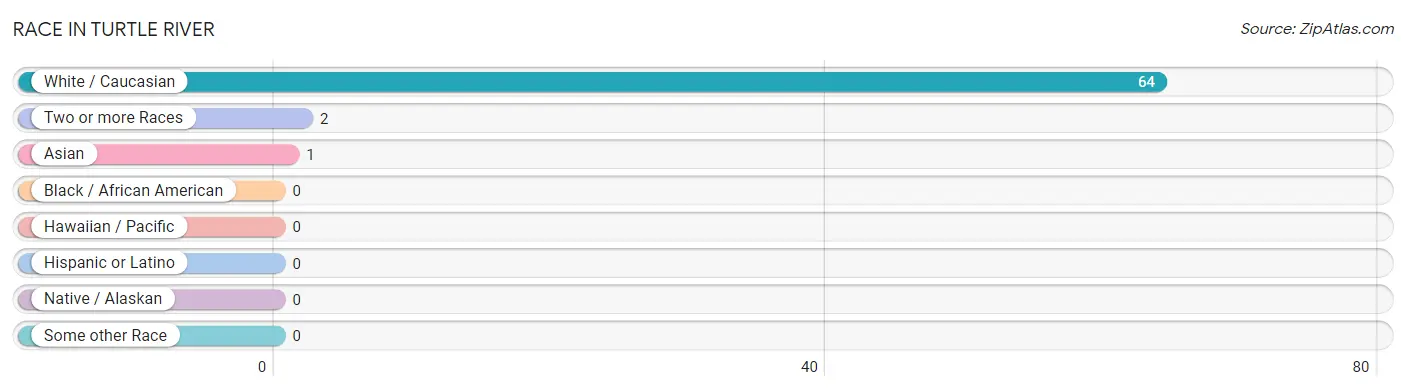
| Race | # Population | % Population |
| Asian | 1 | 1.5% |
| Black / African American | 0 | 0.0% |
| Hawaiian / Pacific | 0 | 0.0% |
| Hispanic or Latino | 0 | 0.0% |
| Native / Alaskan | 0 | 0.0% |
| White / Caucasian | 64 | 95.5% |
| Two or more Races | 2 | 3.0% |
| Some other Race | 0 | 0.0% |
| Total | 67 | 100.0% |
Ancestry in Turtle River
The most populous ancestries reported in Turtle River are Norwegian (28 | 41.8%), German (24 | 35.8%), Swedish (14 | 20.9%), American (6 | 9.0%), and Italian (5 | 7.5%), together accounting for 114.9% of all Turtle River residents.
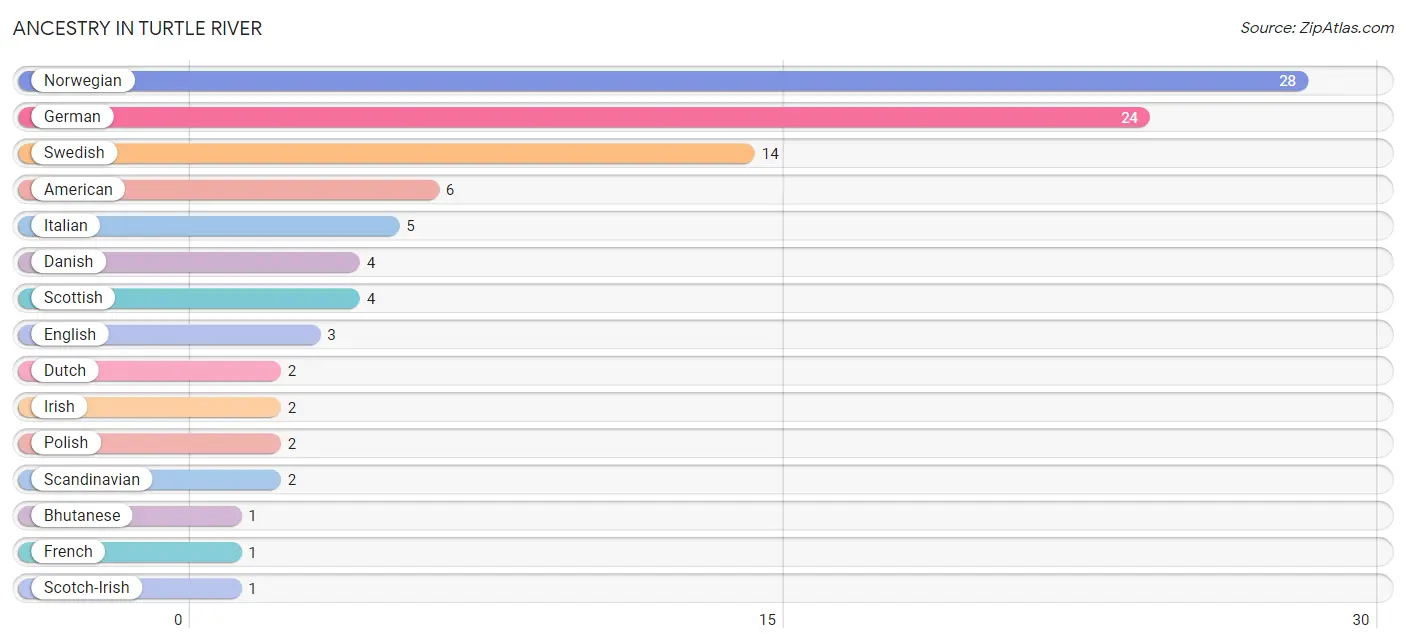
| Ancestry | # Population | % Population |
| American | 6 | 9.0% |
| Bhutanese | 1 | 1.5% |
| Danish | 4 | 6.0% |
| Dutch | 2 | 3.0% |
| English | 3 | 4.5% |
| French | 1 | 1.5% |
| German | 24 | 35.8% |
| Irish | 2 | 3.0% |
| Italian | 5 | 7.5% |
| Norwegian | 28 | 41.8% |
| Polish | 2 | 3.0% |
| Scandinavian | 2 | 3.0% |
| Scotch-Irish | 1 | 1.5% |
| Scottish | 4 | 6.0% |
| Swedish | 14 | 20.9% |
| Yugoslavian | 1 | 1.5% | View All 16 Rows |
Immigrants in Turtle River
The most numerous immigrant groups reported in Turtle River came from Asia (1 | 1.5%), Eastern Asia (1 | 1.5%), and Japan (1 | 1.5%), together accounting for 4.5% of all Turtle River residents.
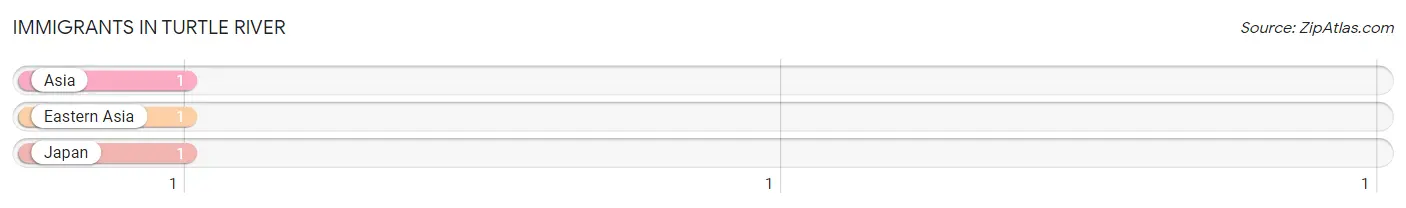
| Immigration Origin | # Population | % Population |
| Asia | 1 | 1.5% |
| Eastern Asia | 1 | 1.5% |
| Japan | 1 | 1.5% | View All 3 Rows |
Sex and Age in Turtle River
Sex and Age in Turtle River
The most populous age groups in Turtle River are 65 to 69 Years (11 | 36.7%) for men and 60 to 64 Years (9 | 24.3%) for women.
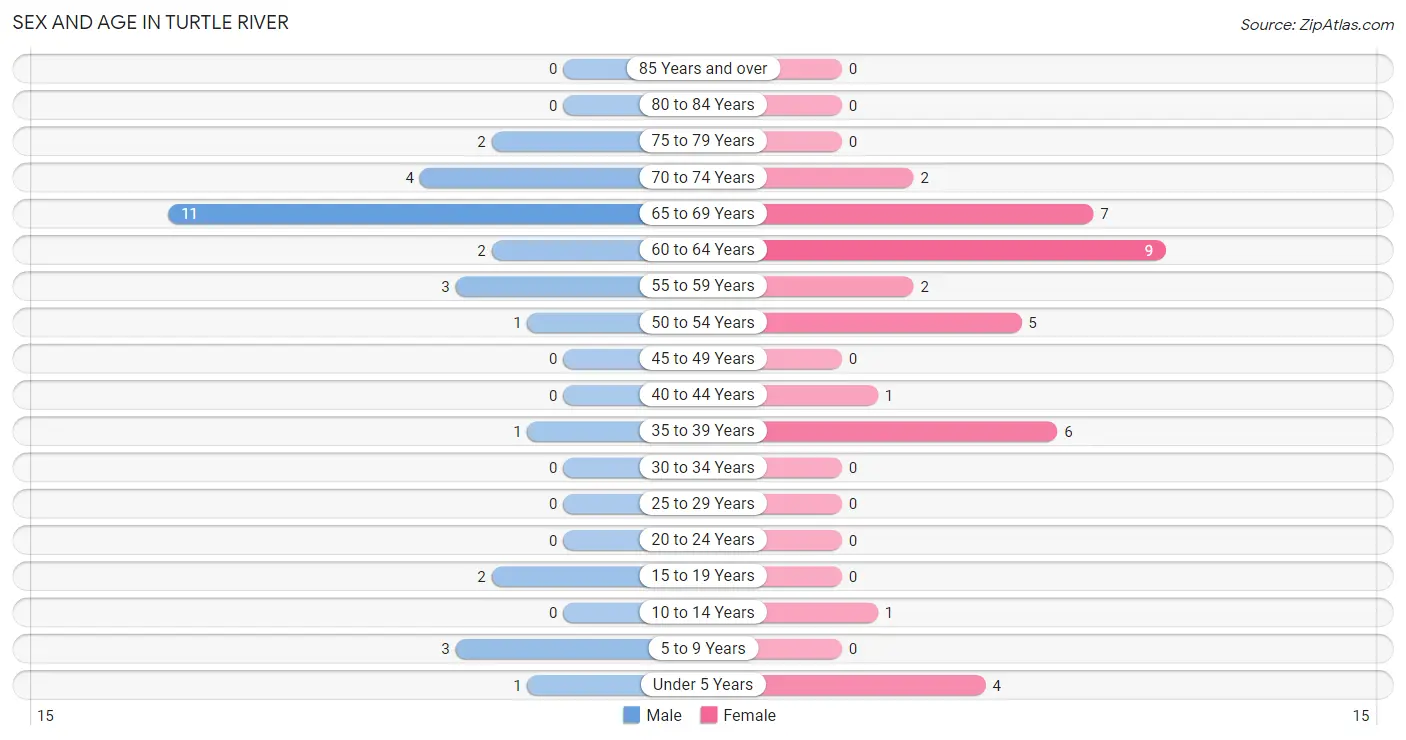
| Age Bracket | Male | Female |
| Under 5 Years | 1 (3.3%) | 4 (10.8%) |
| 5 to 9 Years | 3 (10.0%) | 0 (0.0%) |
| 10 to 14 Years | 0 (0.0%) | 1 (2.7%) |
| 15 to 19 Years | 2 (6.7%) | 0 (0.0%) |
| 20 to 24 Years | 0 (0.0%) | 0 (0.0%) |
| 25 to 29 Years | 0 (0.0%) | 0 (0.0%) |
| 30 to 34 Years | 0 (0.0%) | 0 (0.0%) |
| 35 to 39 Years | 1 (3.3%) | 6 (16.2%) |
| 40 to 44 Years | 0 (0.0%) | 1 (2.7%) |
| 45 to 49 Years | 0 (0.0%) | 0 (0.0%) |
| 50 to 54 Years | 1 (3.3%) | 5 (13.5%) |
| 55 to 59 Years | 3 (10.0%) | 2 (5.4%) |
| 60 to 64 Years | 2 (6.7%) | 9 (24.3%) |
| 65 to 69 Years | 11 (36.7%) | 7 (18.9%) |
| 70 to 74 Years | 4 (13.3%) | 2 (5.4%) |
| 75 to 79 Years | 2 (6.7%) | 0 (0.0%) |
| 80 to 84 Years | 0 (0.0%) | 0 (0.0%) |
| 85 Years and over | 0 (0.0%) | 0 (0.0%) |
| Total | 30 (100.0%) | 37 (100.0%) |
Families and Households in Turtle River
Median Family Size in Turtle River
The median family size in Turtle River is 2.29 persons per family, with single male/father families (1 | 4.2%) accounting for the largest median family size of 6 persons per family. On the other hand, single female/mother families (5 | 20.8%) represent the smallest median family size with 1.80 persons per family.
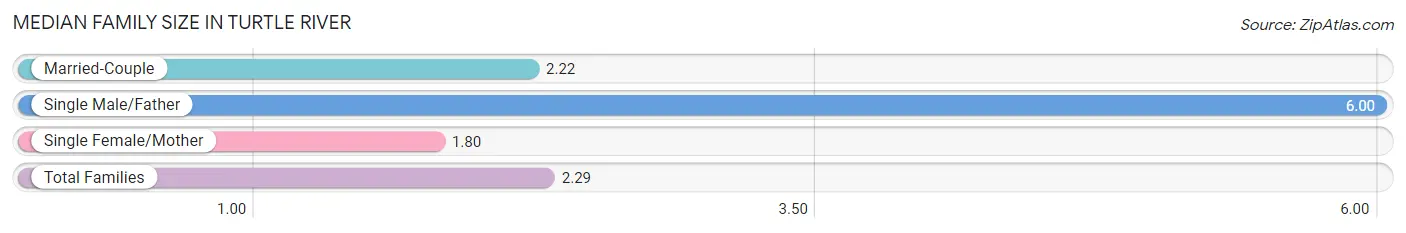
| Family Type | # Families | Family Size |
| Married-Couple | 18 (75.0%) | 2.22 |
| Single Male/Father | 1 (4.2%) | 6.00 |
| Single Female/Mother | 5 (20.8%) | 1.80 |
| Total Families | 24 (100.0%) | 2.29 |
Median Household Size in Turtle River
The median household size in Turtle River is 2.16 persons per household, with single male/father households (1 | 3.2%) accounting for the largest median household size of 7 persons per household. non-family households (7 | 22.6%) represent the smallest median household size with 1.57 persons per household.
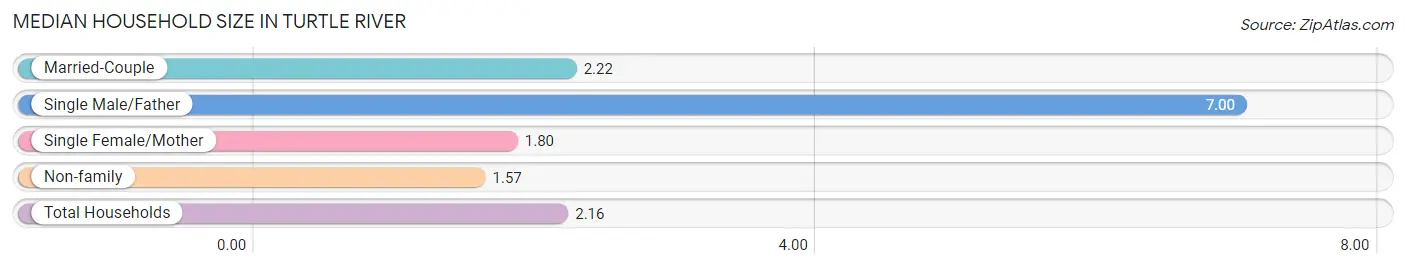
| Household Type | # Households | Household Size |
| Married-Couple | 18 (58.1%) | 2.22 |
| Single Male/Father | 1 (3.2%) | 7.00 |
| Single Female/Mother | 5 (16.1%) | 1.80 |
| Non-family | 7 (22.6%) | 1.57 |
| Total Households | 31 (100.0%) | 2.16 |
Household Size by Marriage Status in Turtle River
Out of a total of 31 households in Turtle River, 24 (77.4%) are family households, while 7 (22.6%) are nonfamily households. The most numerous type of family households are 2-person households, comprising 21, and the most common type of nonfamily households are 1-person households, comprising 4.
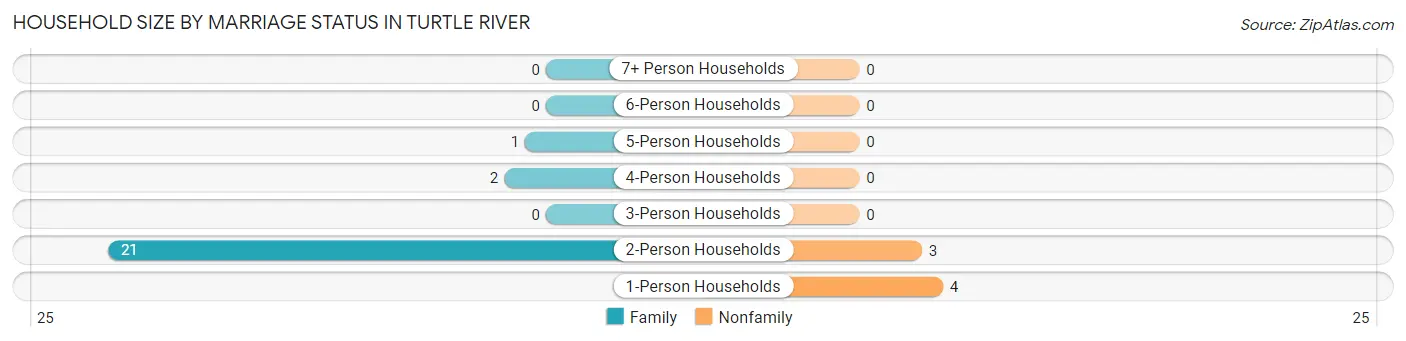
| Household Size | Family Households | Nonfamily Households |
| 1-Person Households | - | 4 (12.9%) |
| 2-Person Households | 21 (67.7%) | 3 (9.7%) |
| 3-Person Households | 0 (0.0%) | 0 (0.0%) |
| 4-Person Households | 2 (6.5%) | 0 (0.0%) |
| 5-Person Households | 1 (3.2%) | 0 (0.0%) |
| 6-Person Households | 0 (0.0%) | 0 (0.0%) |
| 7+ Person Households | 0 (0.0%) | 0 (0.0%) |
| Total | 24 (77.4%) | 7 (22.6%) |
Female Fertility in Turtle River
Fertility by Age in Turtle River
Average fertility rate in Turtle River is 111.0 births per 1,000 women. Women in the age bracket of 35 to 50 years have the highest fertility rate with 111.0 births per 1,000 women. Women in the age bracket of 35 to 50 years acount for 100.0% of all women with births.
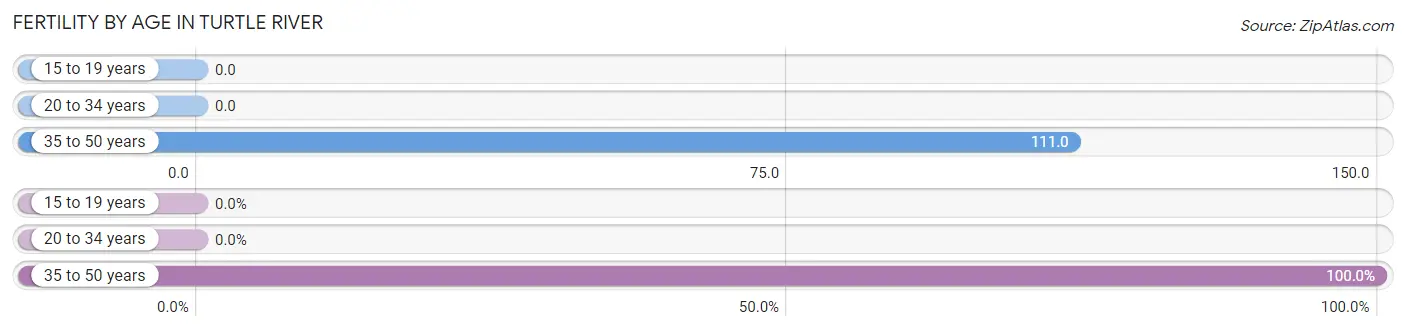
| Age Bracket | Women with Births | Births / 1,000 Women |
| 15 to 19 years | 0 (0.0%) | 0.0 |
| 20 to 34 years | 0 (0.0%) | 0.0 |
| 35 to 50 years | 1 (100.0%) | 111.0 |
| Total | 1 (100.0%) | 111.0 |
Fertility by Age by Marriage Status in Turtle River
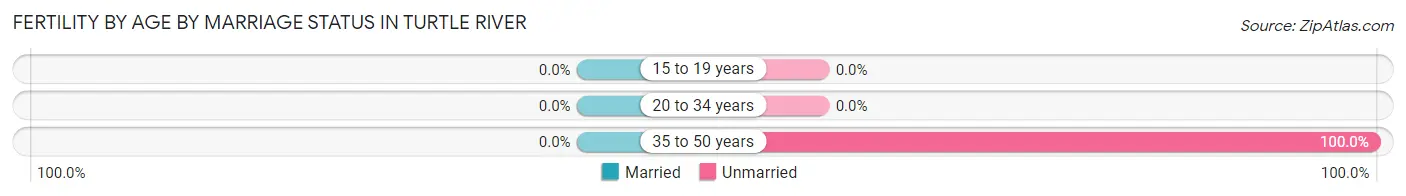
| Age Bracket | Married | Unmarried |
| 15 to 19 years | 0 (0.0%) | 0 (0.0%) |
| 20 to 34 years | 0 (0.0%) | 0 (0.0%) |
| 35 to 50 years | 0 (0.0%) | 1 (100.0%) |
| Total | 0 (0.0%) | 1 (100.0%) |
Fertility by Education in Turtle River
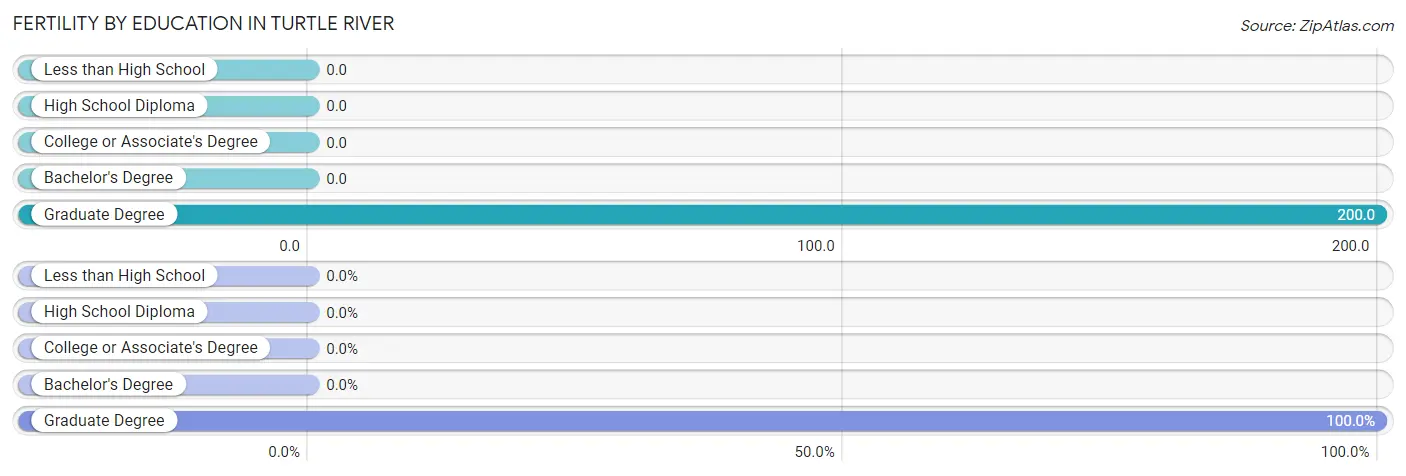
| Educational Attainment | Women with Births | Births / 1,000 Women |
| Less than High School | 0 (0.0%) | 0.0 |
| High School Diploma | 0 (0.0%) | 0.0 |
| College or Associate's Degree | 0 (0.0%) | 0.0 |
| Bachelor's Degree | 0 (0.0%) | 0.0 |
| Graduate Degree | 1 (100.0%) | 200.0 |
| Total | 1 (100.0%) | 111.0 |
Fertility by Education by Marriage Status in Turtle River
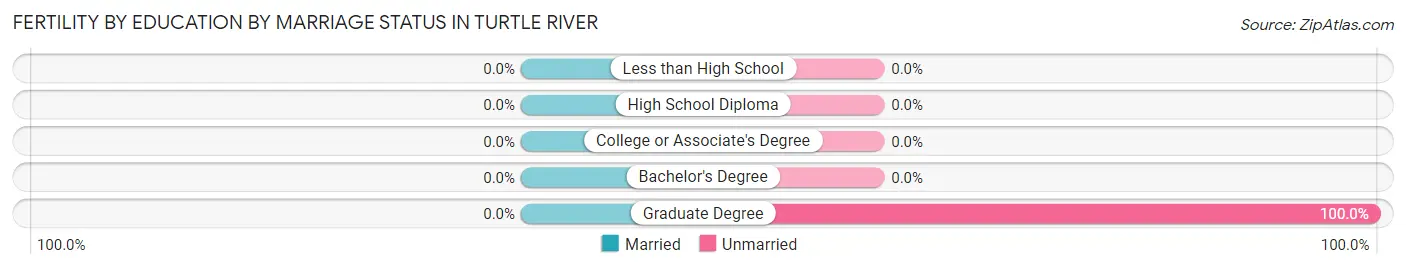
| Educational Attainment | Married | Unmarried |
| Less than High School | 0 (0.0%) | 0 (0.0%) |
| High School Diploma | 0 (0.0%) | 0 (0.0%) |
| College or Associate's Degree | 0 (0.0%) | 0 (0.0%) |
| Bachelor's Degree | 0 (0.0%) | 0 (0.0%) |
| Graduate Degree | 0 (0.0%) | 1 (100.0%) |
| Total | 0 (0.0%) | 1 (100.0%) |
Employment Characteristics in Turtle River
Employment by Class of Employer in Turtle River
Among the 25 employed individuals in Turtle River, private company employees (14 | 56.0%), local government employees (4 | 16.0%), and not-for-profit organizations (2 | 8.0%) make up the most common classes of employment.
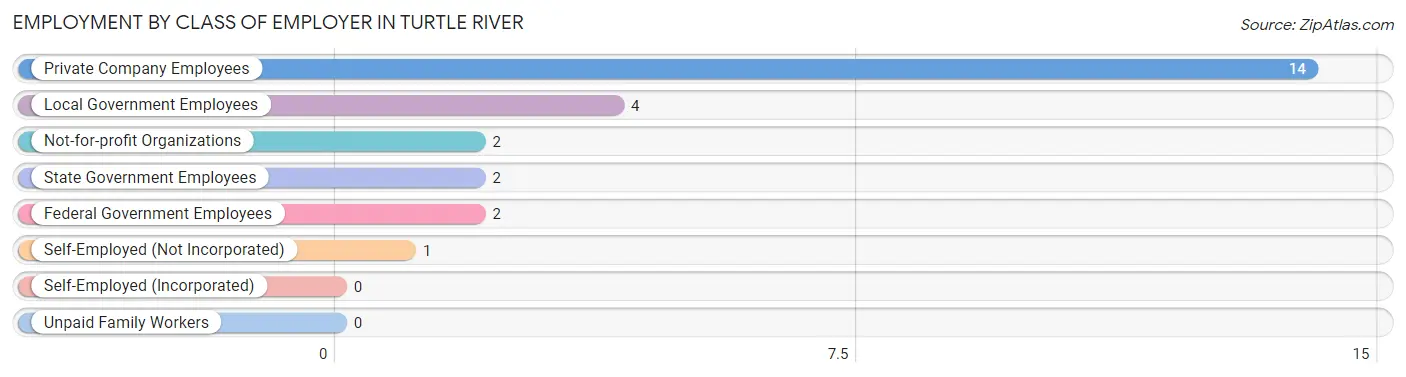
| Employer Class | # Employees | % Employees |
| Private Company Employees | 14 | 56.0% |
| Self-Employed (Incorporated) | 0 | 0.0% |
| Self-Employed (Not Incorporated) | 1 | 4.0% |
| Not-for-profit Organizations | 2 | 8.0% |
| Local Government Employees | 4 | 16.0% |
| State Government Employees | 2 | 8.0% |
| Federal Government Employees | 2 | 8.0% |
| Unpaid Family Workers | 0 | 0.0% |
| Total | 25 | 100.0% |
Employment Status by Age in Turtle River
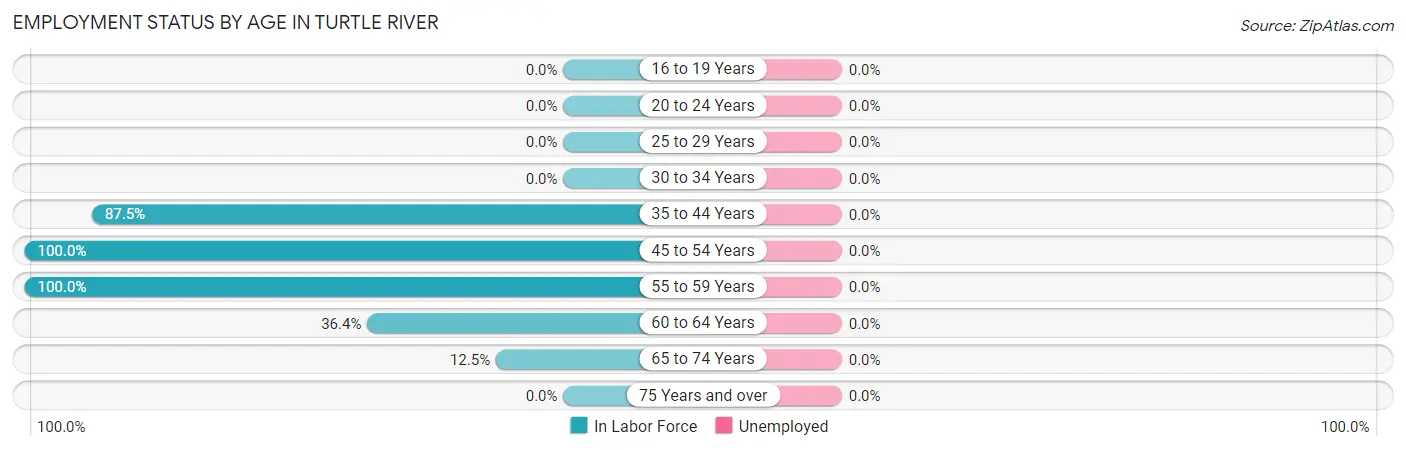
| Age Bracket | In Labor Force | Unemployed |
| 16 to 19 Years | 0 (0.0%) | 0 (0.0%) |
| 20 to 24 Years | 0 (0.0%) | 0 (0.0%) |
| 25 to 29 Years | 0 (0.0%) | 0 (0.0%) |
| 30 to 34 Years | 0 (0.0%) | 0 (0.0%) |
| 35 to 44 Years | 7 (87.5%) | 0 (0.0%) |
| 45 to 54 Years | 6 (100.0%) | 0 (0.0%) |
| 55 to 59 Years | 5 (100.0%) | 0 (0.0%) |
| 60 to 64 Years | 4 (36.4%) | 0 (0.0%) |
| 65 to 74 Years | 3 (12.5%) | 0 (0.0%) |
| 75 Years and over | 0 (0.0%) | 0 (0.0%) |
| Total | 25 (44.6%) | 0 (0.0%) |
Employment Status by Educational Attainment in Turtle River
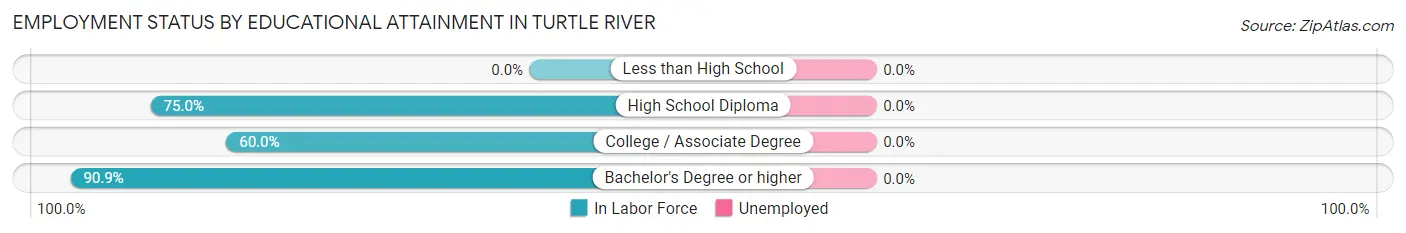
| Educational Attainment | In Labor Force | Unemployed |
| Less than High School | 0 (0.0%) | 0 (0.0%) |
| High School Diploma | 3 (75.0%) | 0 (0.0%) |
| College / Associate Degree | 9 (60.0%) | 0 (0.0%) |
| Bachelor's Degree or higher | 10 (90.9%) | 0 (0.0%) |
| Total | 22 (73.3%) | 0 (0.0%) |
Employment Occupations by Sex in Turtle River
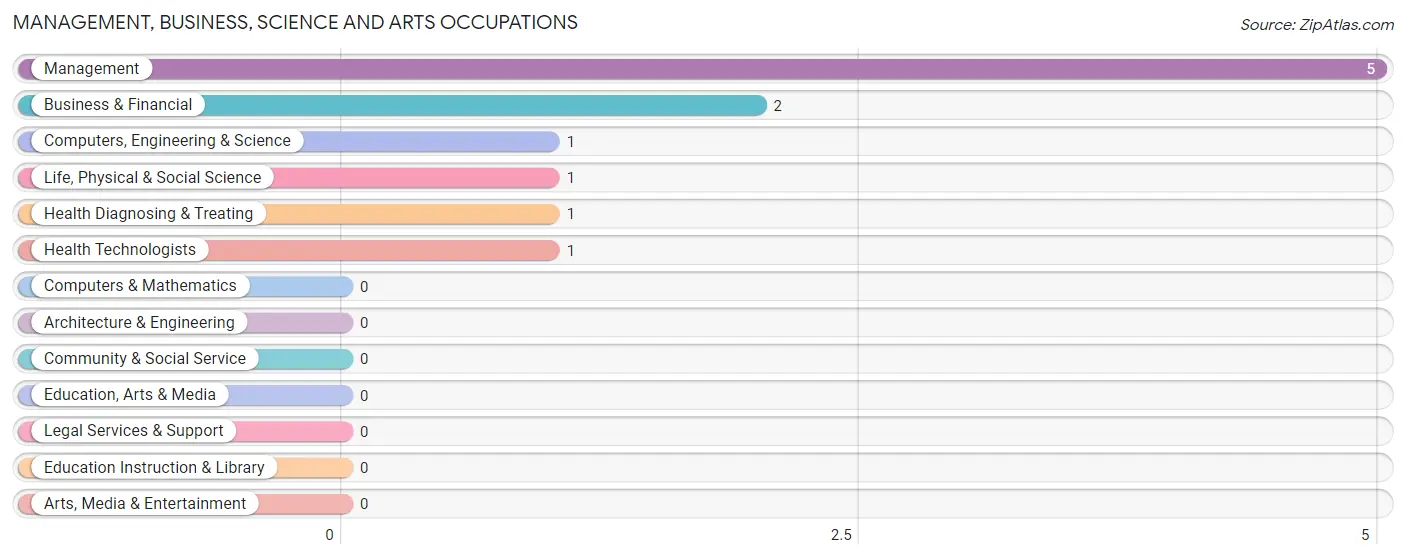
Management, Business, Science and Arts Occupations
The most common Management, Business, Science and Arts occupations in Turtle River are Management (5 | 20.0%), Business & Financial (2 | 8.0%), Computers, Engineering & Science (1 | 4.0%), Life, Physical & Social Science (1 | 4.0%), and Health Diagnosing & Treating (1 | 4.0%).
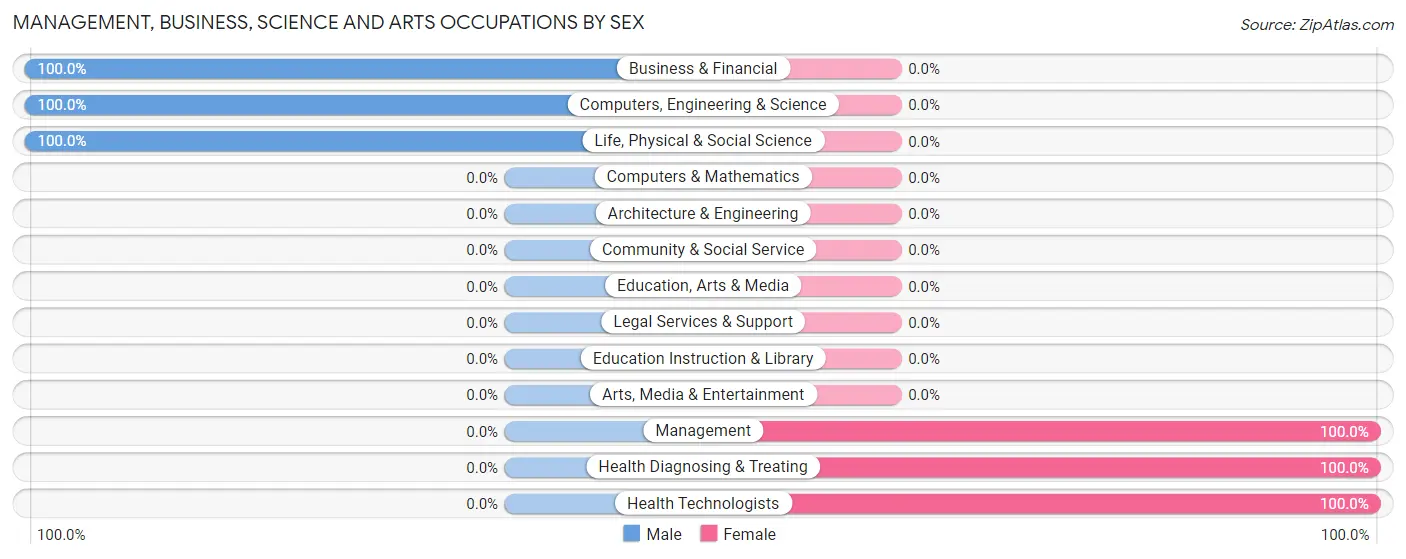
Management, Business, Science and Arts Occupations by Sex
Within the Management, Business, Science and Arts occupations in Turtle River, the most male-oriented occupations are Business & Financial (100.0%), Computers, Engineering & Science (100.0%), and Life, Physical & Social Science (100.0%), while the most female-oriented occupations are Management (100.0%), Health Diagnosing & Treating (100.0%), and Health Technologists (100.0%).
| Occupation | Male | Female |
| Management | 0 (0.0%) | 5 (100.0%) |
| Business & Financial | 2 (100.0%) | 0 (0.0%) |
| Computers, Engineering & Science | 1 (100.0%) | 0 (0.0%) |
| Computers & Mathematics | 0 (0.0%) | 0 (0.0%) |
| Architecture & Engineering | 0 (0.0%) | 0 (0.0%) |
| Life, Physical & Social Science | 1 (100.0%) | 0 (0.0%) |
| Community & Social Service | 0 (0.0%) | 0 (0.0%) |
| Education, Arts & Media | 0 (0.0%) | 0 (0.0%) |
| Legal Services & Support | 0 (0.0%) | 0 (0.0%) |
| Education Instruction & Library | 0 (0.0%) | 0 (0.0%) |
| Arts, Media & Entertainment | 0 (0.0%) | 0 (0.0%) |
| Health Diagnosing & Treating | 0 (0.0%) | 1 (100.0%) |
| Health Technologists | 0 (0.0%) | 1 (100.0%) |
| Total (Category) | 3 (33.3%) | 6 (66.7%) |
| Total (Overall) | 9 (36.0%) | 16 (64.0%) |
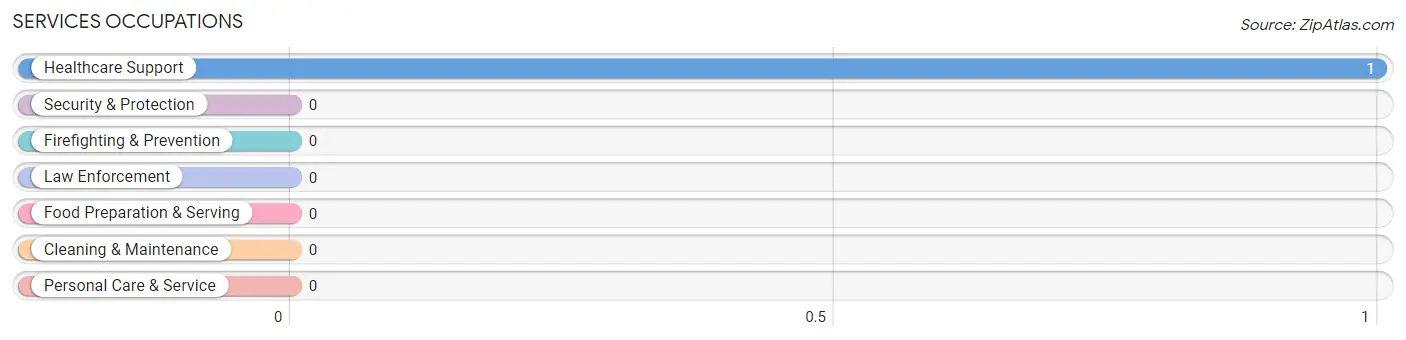
Services Occupations
The most common Services occupations in Turtle River are , and Healthcare Support (1 | 4.0%).
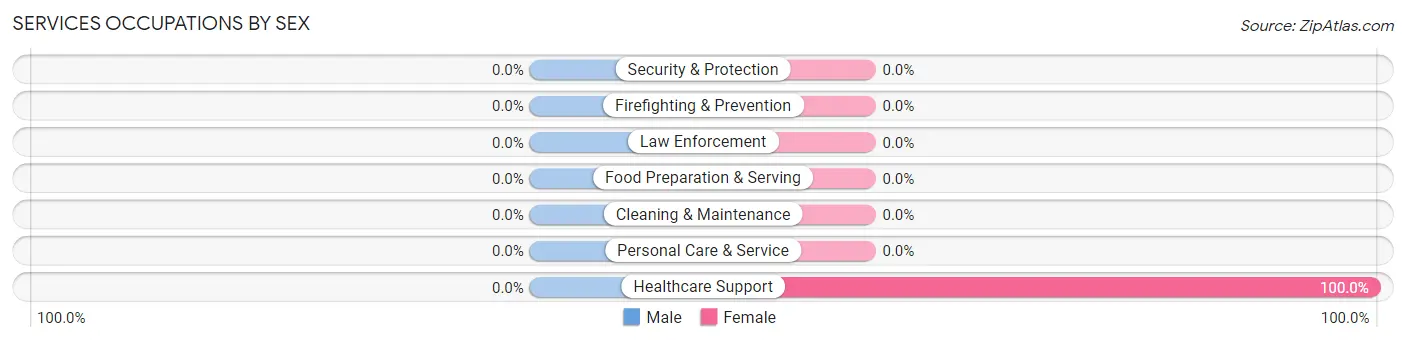
Services Occupations by Sex
| Occupation | Male | Female |
| Healthcare Support | 0 (0.0%) | 1 (100.0%) |
| Security & Protection | 0 (0.0%) | 0 (0.0%) |
| Firefighting & Prevention | 0 (0.0%) | 0 (0.0%) |
| Law Enforcement | 0 (0.0%) | 0 (0.0%) |
| Food Preparation & Serving | 0 (0.0%) | 0 (0.0%) |
| Cleaning & Maintenance | 0 (0.0%) | 0 (0.0%) |
| Personal Care & Service | 0 (0.0%) | 0 (0.0%) |
| Total (Category) | 0 (0.0%) | 1 (100.0%) |
| Total (Overall) | 9 (36.0%) | 16 (64.0%) |
Sales and Office Occupations
The most common Sales and Office occupations in Turtle River are Office & Administration (7 | 28.0%), and Sales & Related (1 | 4.0%).
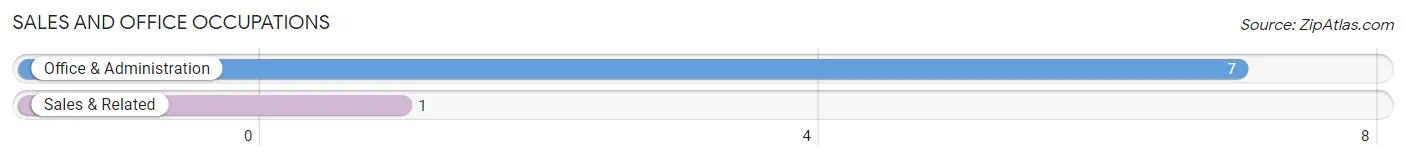
Sales and Office Occupations by Sex
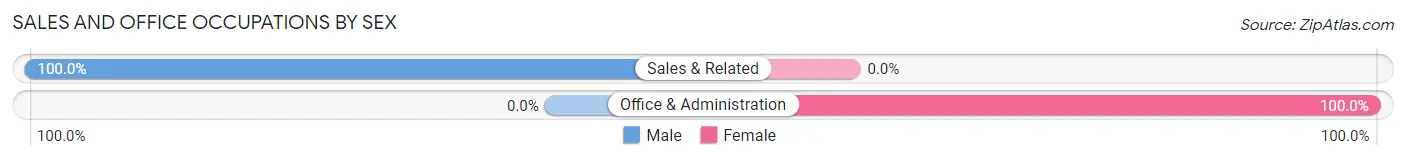
| Occupation | Male | Female |
| Sales & Related | 1 (100.0%) | 0 (0.0%) |
| Office & Administration | 0 (0.0%) | 7 (100.0%) |
| Total (Category) | 1 (12.5%) | 7 (87.5%) |
| Total (Overall) | 9 (36.0%) | 16 (64.0%) |
Natural Resources, Construction and Maintenance Occupations
The most common Natural Resources, Construction and Maintenance occupations in Turtle River are , and Installation, Maintenance & Repair (3 | 12.0%).
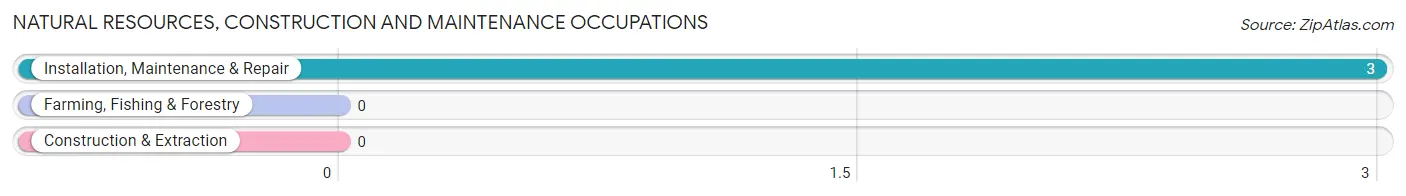
Natural Resources, Construction and Maintenance Occupations by Sex
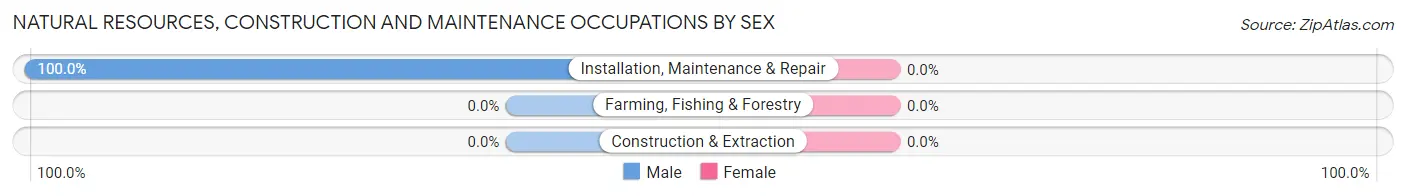
| Occupation | Male | Female |
| Farming, Fishing & Forestry | 0 (0.0%) | 0 (0.0%) |
| Construction & Extraction | 0 (0.0%) | 0 (0.0%) |
| Installation, Maintenance & Repair | 3 (100.0%) | 0 (0.0%) |
| Total (Category) | 3 (100.0%) | 0 (0.0%) |
| Total (Overall) | 9 (36.0%) | 16 (64.0%) |
Production, Transportation and Moving Occupations
The most common Production, Transportation and Moving occupations in Turtle River are Production (3 | 12.0%), and Material Moving (1 | 4.0%).
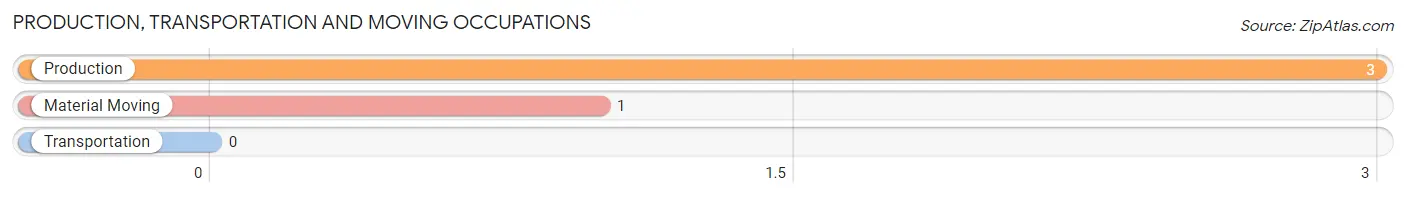
Production, Transportation and Moving Occupations by Sex
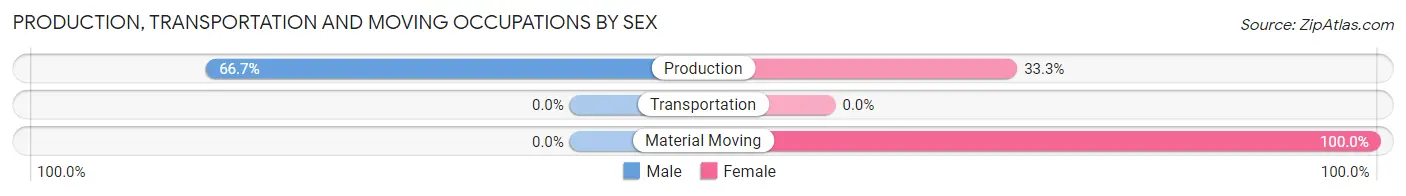
| Occupation | Male | Female |
| Production | 2 (66.7%) | 1 (33.3%) |
| Transportation | 0 (0.0%) | 0 (0.0%) |
| Material Moving | 0 (0.0%) | 1 (100.0%) |
| Total (Category) | 2 (50.0%) | 2 (50.0%) |
| Total (Overall) | 9 (36.0%) | 16 (64.0%) |
Employment Industries by Sex in Turtle River
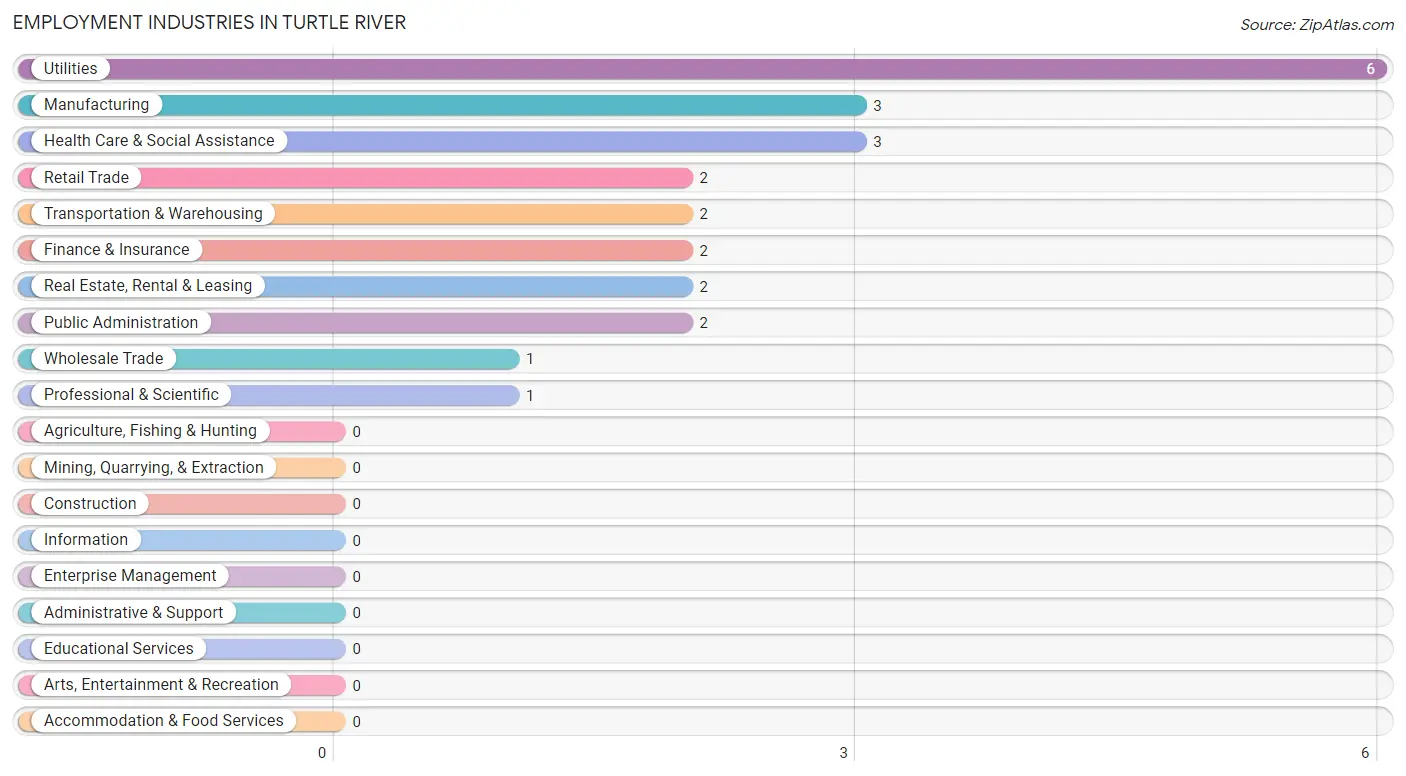
Employment Industries in Turtle River
The major employment industries in Turtle River include Utilities (6 | 24.0%), Manufacturing (3 | 12.0%), Health Care & Social Assistance (3 | 12.0%), Retail Trade (2 | 8.0%), and Transportation & Warehousing (2 | 8.0%).
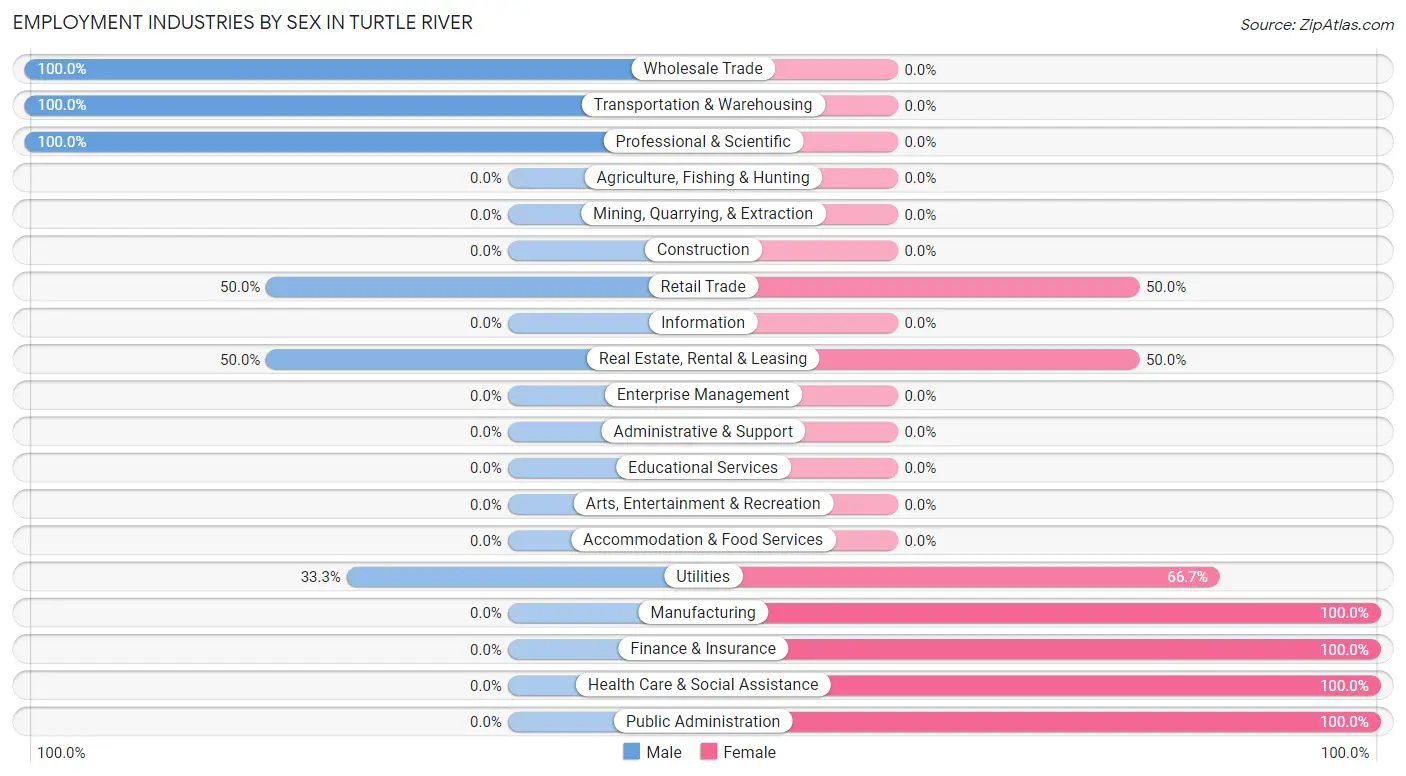
Employment Industries by Sex in Turtle River
The Turtle River industries that see more men than women are Wholesale Trade (100.0%), Transportation & Warehousing (100.0%), and Professional & Scientific (100.0%), whereas the industries that tend to have a higher number of women are Manufacturing (100.0%), Finance & Insurance (100.0%), and Health Care & Social Assistance (100.0%).
| Industry | Male | Female |
| Agriculture, Fishing & Hunting | 0 (0.0%) | 0 (0.0%) |
| Mining, Quarrying, & Extraction | 0 (0.0%) | 0 (0.0%) |
| Construction | 0 (0.0%) | 0 (0.0%) |
| Manufacturing | 0 (0.0%) | 3 (100.0%) |
| Wholesale Trade | 1 (100.0%) | 0 (0.0%) |
| Retail Trade | 1 (50.0%) | 1 (50.0%) |
| Transportation & Warehousing | 2 (100.0%) | 0 (0.0%) |
| Utilities | 2 (33.3%) | 4 (66.7%) |
| Information | 0 (0.0%) | 0 (0.0%) |
| Finance & Insurance | 0 (0.0%) | 2 (100.0%) |
| Real Estate, Rental & Leasing | 1 (50.0%) | 1 (50.0%) |
| Professional & Scientific | 1 (100.0%) | 0 (0.0%) |
| Enterprise Management | 0 (0.0%) | 0 (0.0%) |
| Administrative & Support | 0 (0.0%) | 0 (0.0%) |
| Educational Services | 0 (0.0%) | 0 (0.0%) |
| Health Care & Social Assistance | 0 (0.0%) | 3 (100.0%) |
| Arts, Entertainment & Recreation | 0 (0.0%) | 0 (0.0%) |
| Accommodation & Food Services | 0 (0.0%) | 0 (0.0%) |
| Public Administration | 0 (0.0%) | 2 (100.0%) |
| Total | 9 (36.0%) | 16 (64.0%) |
Education in Turtle River
School Enrollment in Turtle River
The most common levels of schooling among the 6 students in Turtle River are elementary school (3 | 50.0%), high school (2 | 33.3%), and middle school (1 | 16.7%).
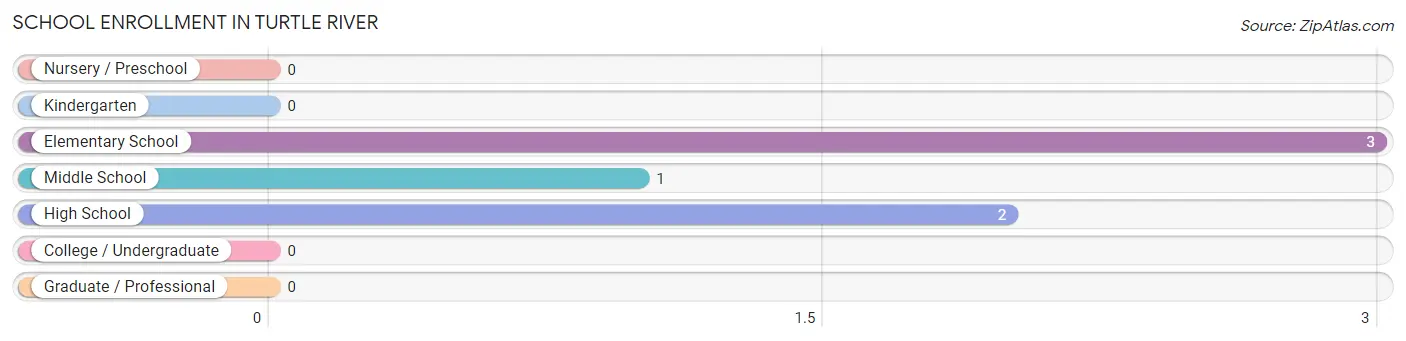
| School Level | # Students | % Students |
| Nursery / Preschool | 0 | 0.0% |
| Kindergarten | 0 | 0.0% |
| Elementary School | 3 | 50.0% |
| Middle School | 1 | 16.7% |
| High School | 2 | 33.3% |
| College / Undergraduate | 0 | 0.0% |
| Graduate / Professional | 0 | 0.0% |
| Total | 6 | 100.0% |
School Enrollment by Age by Funding Source in Turtle River
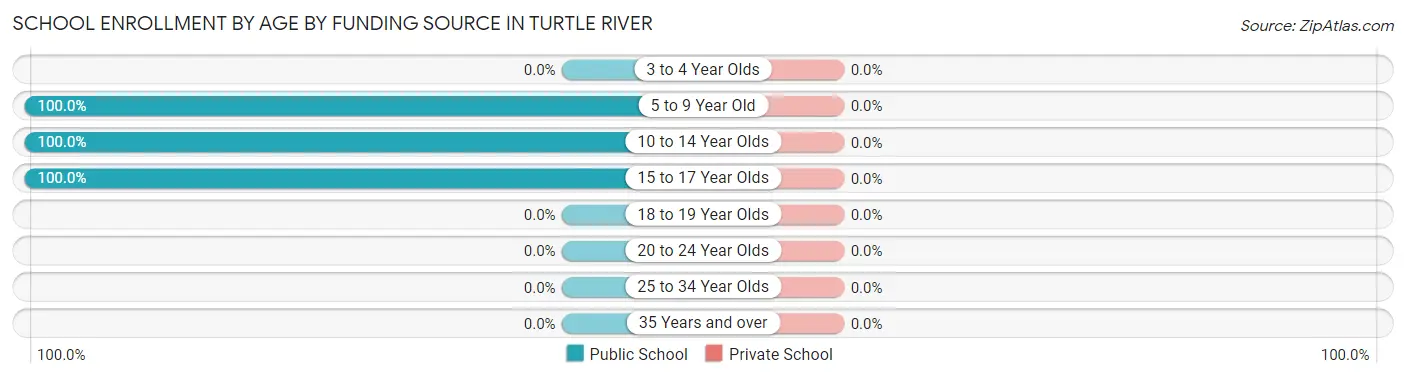
| Age Bracket | Public School | Private School |
| 3 to 4 Year Olds | 0 (0.0%) | 0 (0.0%) |
| 5 to 9 Year Old | 3 (100.0%) | 0 (0.0%) |
| 10 to 14 Year Olds | 1 (100.0%) | 0 (0.0%) |
| 15 to 17 Year Olds | 2 (100.0%) | 0 (0.0%) |
| 18 to 19 Year Olds | 0 (0.0%) | 0 (0.0%) |
| 20 to 24 Year Olds | 0 (0.0%) | 0 (0.0%) |
| 25 to 34 Year Olds | 0 (0.0%) | 0 (0.0%) |
| 35 Years and over | 0 (0.0%) | 0 (0.0%) |
| Total | 6 (100.0%) | 0 (0.0%) |
Educational Attainment by Field of Study in Turtle River
Physical & health sciences (6 | 19.4%), literature & languages (6 | 19.4%), science & technology (5 | 16.1%), social sciences (3 | 9.7%), and arts & humanities (3 | 9.7%) are the most common fields of study among 31 individuals in Turtle River who have obtained a bachelor's degree or higher.
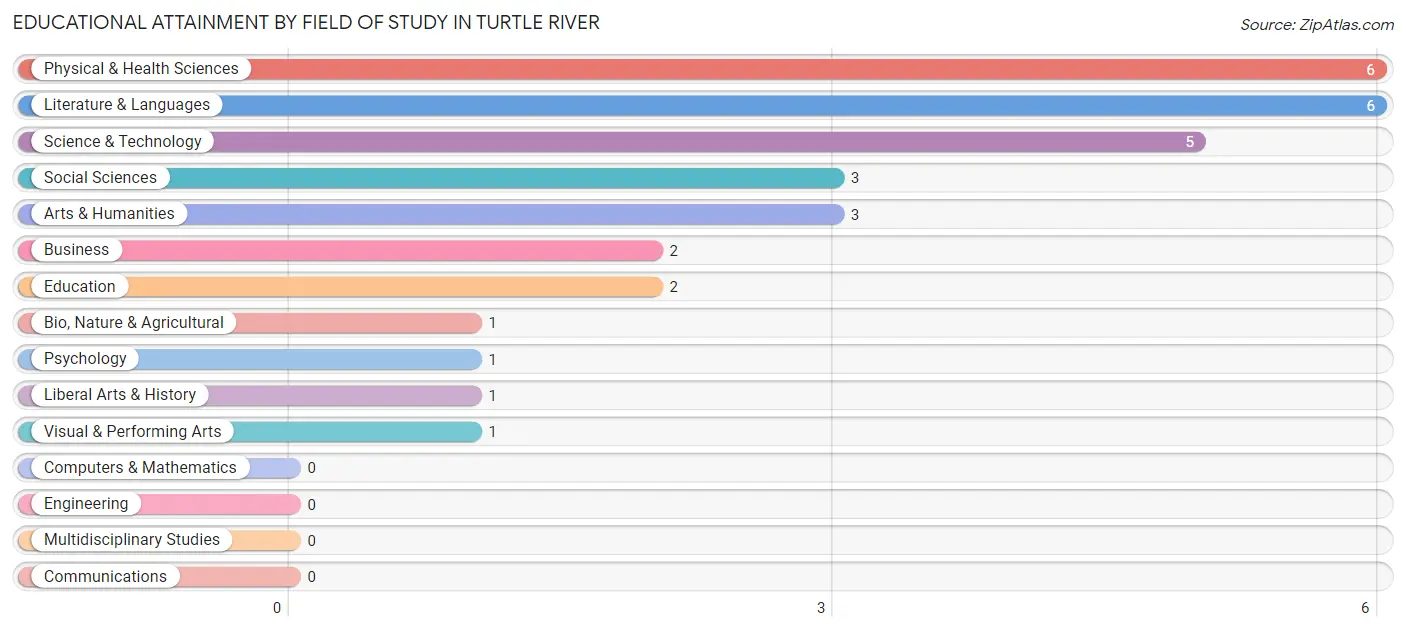
| Field of Study | # Graduates | % Graduates |
| Computers & Mathematics | 0 | 0.0% |
| Bio, Nature & Agricultural | 1 | 3.2% |
| Physical & Health Sciences | 6 | 19.4% |
| Psychology | 1 | 3.2% |
| Social Sciences | 3 | 9.7% |
| Engineering | 0 | 0.0% |
| Multidisciplinary Studies | 0 | 0.0% |
| Science & Technology | 5 | 16.1% |
| Business | 2 | 6.5% |
| Education | 2 | 6.5% |
| Literature & Languages | 6 | 19.4% |
| Liberal Arts & History | 1 | 3.2% |
| Visual & Performing Arts | 1 | 3.2% |
| Communications | 0 | 0.0% |
| Arts & Humanities | 3 | 9.7% |
| Total | 31 | 100.0% |
Transportation & Commute in Turtle River
Vehicle Availability by Sex in Turtle River
The most prevalent vehicle ownership categories in Turtle River are males with 3 vehicles (5, accounting for 55.6%) and females with 3 vehicles (4, making up 31.2%).
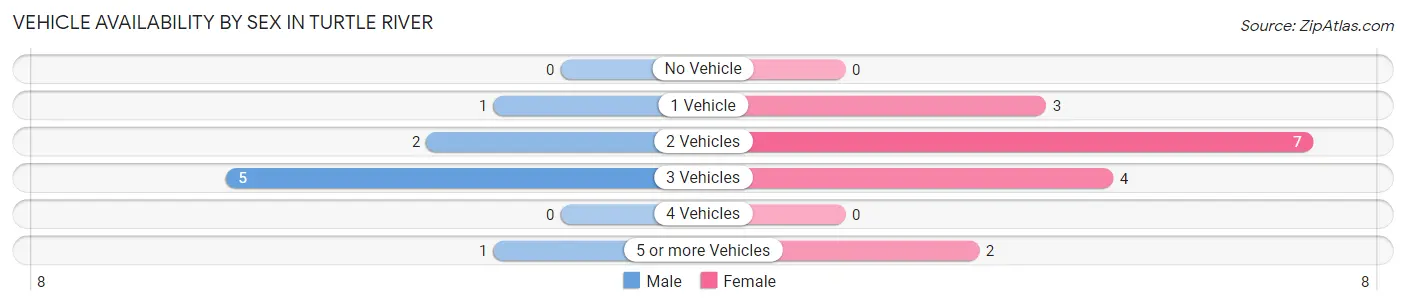
| Vehicles Available | Male | Female |
| No Vehicle | 0 (0.0%) | 0 (0.0%) |
| 1 Vehicle | 1 (11.1%) | 3 (18.8%) |
| 2 Vehicles | 2 (22.2%) | 7 (43.8%) |
| 3 Vehicles | 5 (55.6%) | 4 (25.0%) |
| 4 Vehicles | 0 (0.0%) | 0 (0.0%) |
| 5 or more Vehicles | 1 (11.1%) | 2 (12.5%) |
| Total | 9 (100.0%) | 16 (100.0%) |
Commute Time in Turtle River
The most frequently occuring commute durations in Turtle River are 20 to 24 minutes (5 commuters, 25.0%), 60 to 89 minutes (5 commuters, 25.0%), and 10 to 14 minutes (3 commuters, 15.0%).
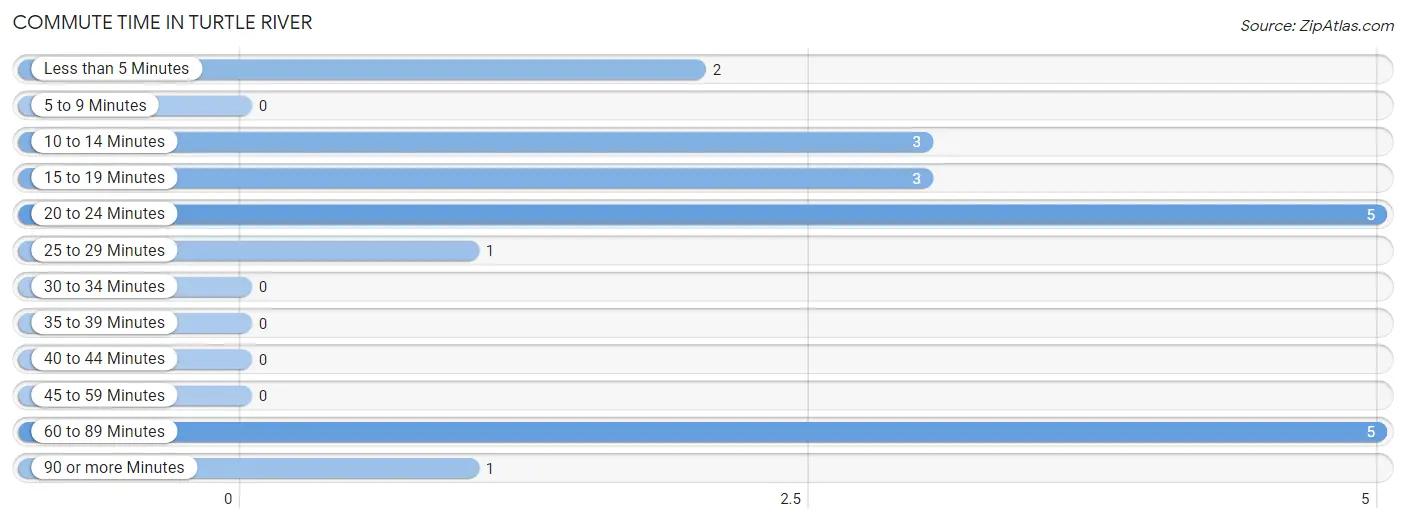
| Commute Time | # Commuters | % Commuters |
| Less than 5 Minutes | 2 | 10.0% |
| 5 to 9 Minutes | 0 | 0.0% |
| 10 to 14 Minutes | 3 | 15.0% |
| 15 to 19 Minutes | 3 | 15.0% |
| 20 to 24 Minutes | 5 | 25.0% |
| 25 to 29 Minutes | 1 | 5.0% |
| 30 to 34 Minutes | 0 | 0.0% |
| 35 to 39 Minutes | 0 | 0.0% |
| 40 to 44 Minutes | 0 | 0.0% |
| 45 to 59 Minutes | 0 | 0.0% |
| 60 to 89 Minutes | 5 | 25.0% |
| 90 or more Minutes | 1 | 5.0% |
Commute Time by Sex in Turtle River
The most common commute times in Turtle River are 15 to 19 minutes (3 commuters, 50.0%) for males and 60 to 89 minutes (5 commuters, 35.7%) for females.
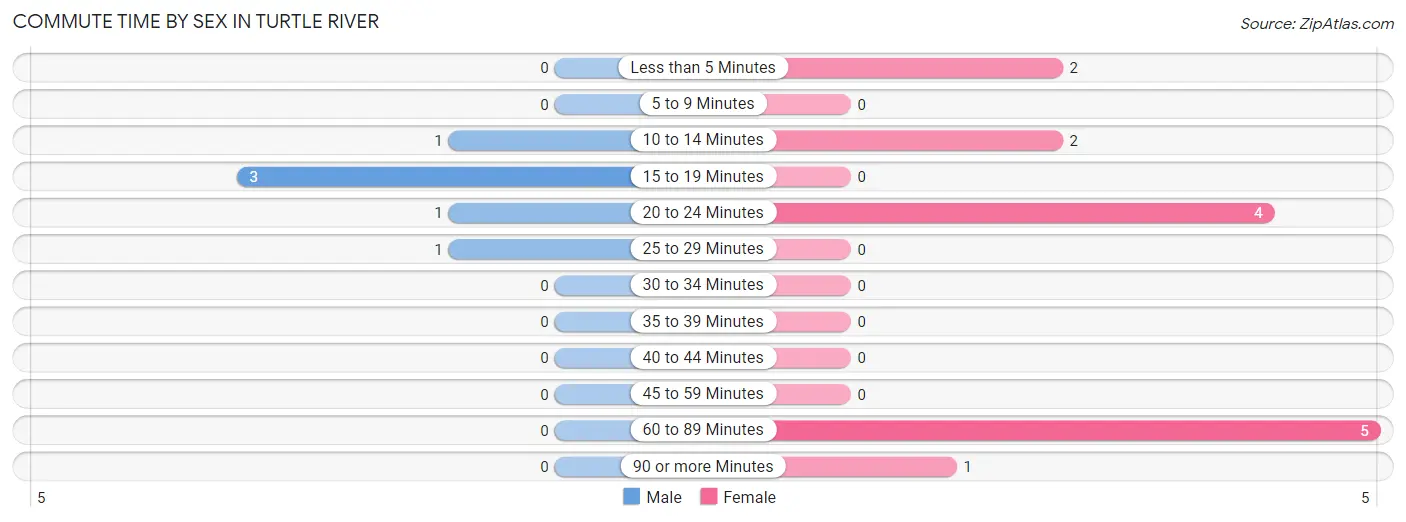
| Commute Time | Male | Female |
| Less than 5 Minutes | 0 (0.0%) | 2 (14.3%) |
| 5 to 9 Minutes | 0 (0.0%) | 0 (0.0%) |
| 10 to 14 Minutes | 1 (16.7%) | 2 (14.3%) |
| 15 to 19 Minutes | 3 (50.0%) | 0 (0.0%) |
| 20 to 24 Minutes | 1 (16.7%) | 4 (28.6%) |
| 25 to 29 Minutes | 1 (16.7%) | 0 (0.0%) |
| 30 to 34 Minutes | 0 (0.0%) | 0 (0.0%) |
| 35 to 39 Minutes | 0 (0.0%) | 0 (0.0%) |
| 40 to 44 Minutes | 0 (0.0%) | 0 (0.0%) |
| 45 to 59 Minutes | 0 (0.0%) | 0 (0.0%) |
| 60 to 89 Minutes | 0 (0.0%) | 5 (35.7%) |
| 90 or more Minutes | 0 (0.0%) | 1 (7.1%) |
Time of Departure to Work by Sex in Turtle River
The most frequent times of departure to work in Turtle River are 6:00 AM to 6:29 AM (2, 33.3%) for males and 7:00 AM to 7:29 AM (5, 35.7%) for females.
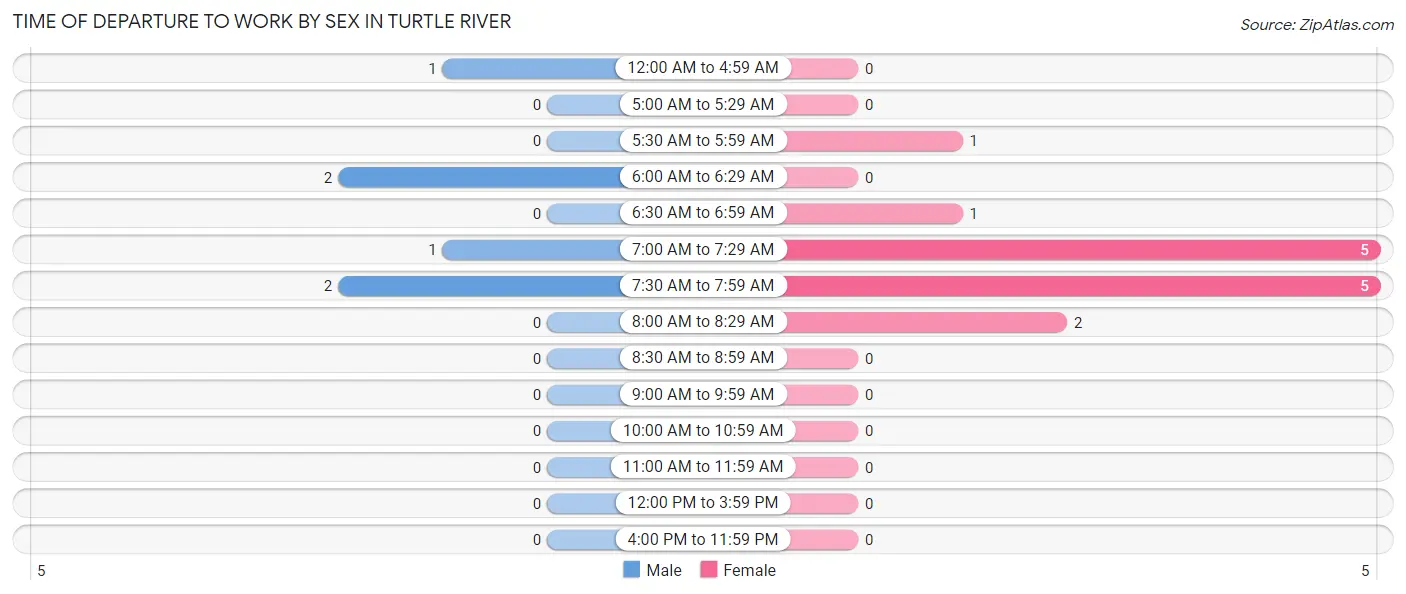
| Time of Departure | Male | Female |
| 12:00 AM to 4:59 AM | 1 (16.7%) | 0 (0.0%) |
| 5:00 AM to 5:29 AM | 0 (0.0%) | 0 (0.0%) |
| 5:30 AM to 5:59 AM | 0 (0.0%) | 1 (7.1%) |
| 6:00 AM to 6:29 AM | 2 (33.3%) | 0 (0.0%) |
| 6:30 AM to 6:59 AM | 0 (0.0%) | 1 (7.1%) |
| 7:00 AM to 7:29 AM | 1 (16.7%) | 5 (35.7%) |
| 7:30 AM to 7:59 AM | 2 (33.3%) | 5 (35.7%) |
| 8:00 AM to 8:29 AM | 0 (0.0%) | 2 (14.3%) |
| 8:30 AM to 8:59 AM | 0 (0.0%) | 0 (0.0%) |
| 9:00 AM to 9:59 AM | 0 (0.0%) | 0 (0.0%) |
| 10:00 AM to 10:59 AM | 0 (0.0%) | 0 (0.0%) |
| 11:00 AM to 11:59 AM | 0 (0.0%) | 0 (0.0%) |
| 12:00 PM to 3:59 PM | 0 (0.0%) | 0 (0.0%) |
| 4:00 PM to 11:59 PM | 0 (0.0%) | 0 (0.0%) |
| Total | 6 (100.0%) | 14 (100.0%) |
Housing Occupancy in Turtle River
Occupancy by Ownership in Turtle River
Of the total 31 dwellings in Turtle River, owner-occupied units account for 31 (100.0%), while renter-occupied units make up 0 (0.0%).
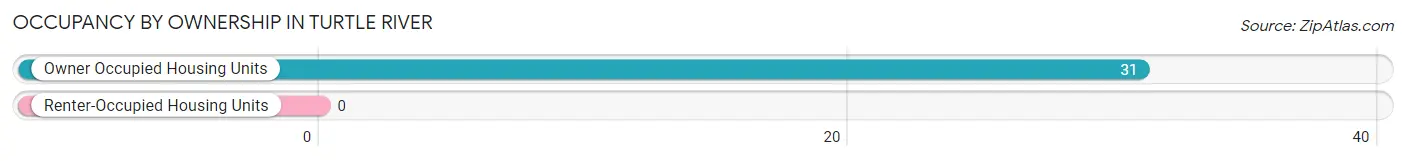
| Occupancy | # Housing Units | % Housing Units |
| Owner Occupied Housing Units | 31 | 100.0% |
| Renter-Occupied Housing Units | 0 | 0.0% |
| Total Occupied Housing Units | 31 | 100.0% |
Occupancy by Household Size in Turtle River
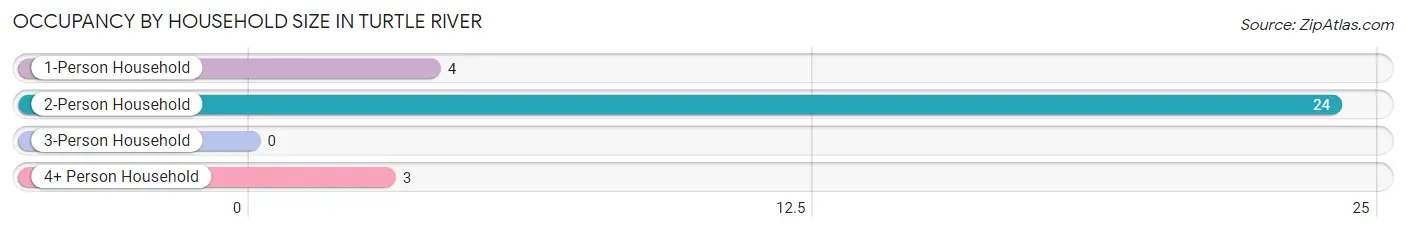
| Household Size | # Housing Units | % Housing Units |
| 1-Person Household | 4 | 12.9% |
| 2-Person Household | 24 | 77.4% |
| 3-Person Household | 0 | 0.0% |
| 4+ Person Household | 3 | 9.7% |
| Total Housing Units | 31 | 100.0% |
Occupancy by Ownership by Household Size in Turtle River
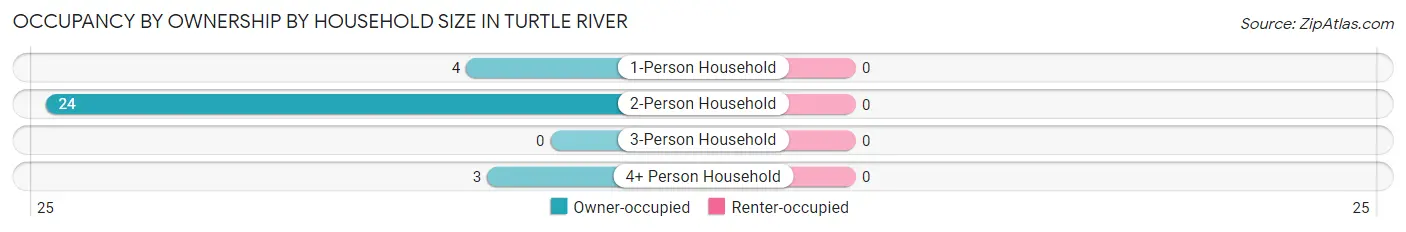
| Household Size | Owner-occupied | Renter-occupied |
| 1-Person Household | 4 (100.0%) | 0 (0.0%) |
| 2-Person Household | 24 (100.0%) | 0 (0.0%) |
| 3-Person Household | 0 (0.0%) | 0 (0.0%) |
| 4+ Person Household | 3 (100.0%) | 0 (0.0%) |
| Total Housing Units | 31 (100.0%) | 0 (0.0%) |
Occupancy by Educational Attainment in Turtle River
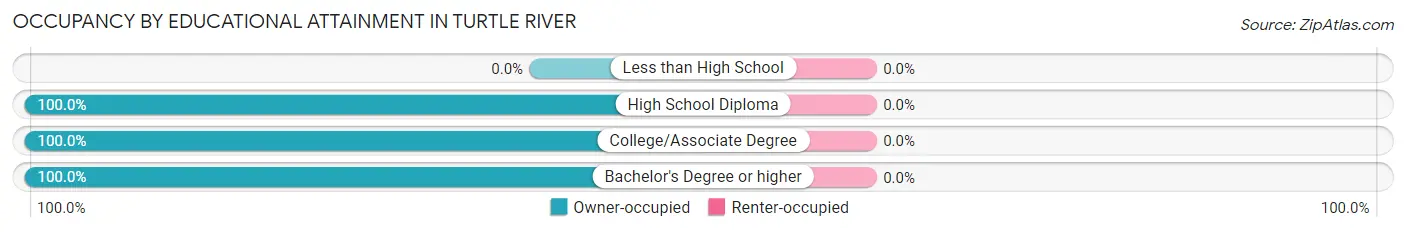
| Household Size | Owner-occupied | Renter-occupied |
| Less than High School | 0 (0.0%) | 0 (0.0%) |
| High School Diploma | 2 (100.0%) | 0 (0.0%) |
| College/Associate Degree | 13 (100.0%) | 0 (0.0%) |
| Bachelor's Degree or higher | 16 (100.0%) | 0 (0.0%) |
Occupancy by Age of Householder in Turtle River
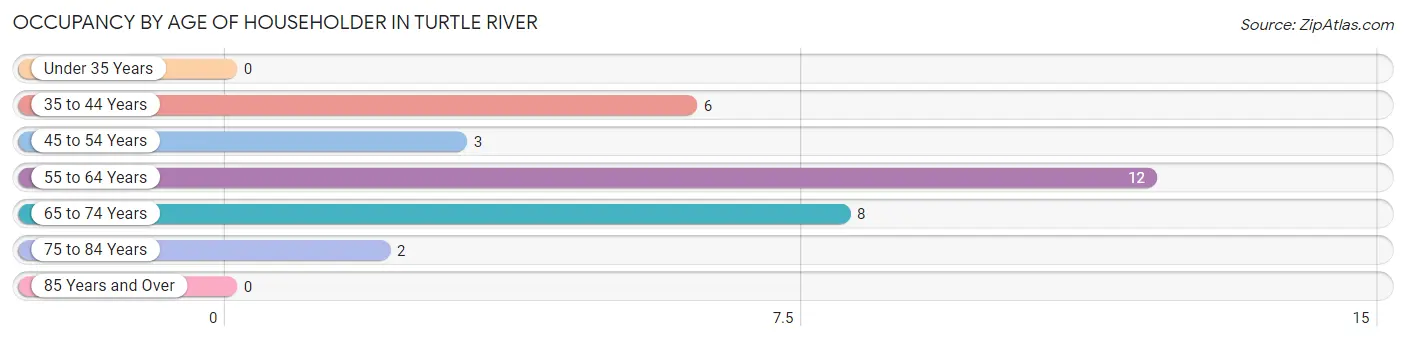
| Age Bracket | # Households | % Households |
| Under 35 Years | 0 | 0.0% |
| 35 to 44 Years | 6 | 19.4% |
| 45 to 54 Years | 3 | 9.7% |
| 55 to 64 Years | 12 | 38.7% |
| 65 to 74 Years | 8 | 25.8% |
| 75 to 84 Years | 2 | 6.5% |
| 85 Years and Over | 0 | 0.0% |
| Total | 31 | 100.0% |
Housing Finances in Turtle River
Median Income by Occupancy in Turtle River
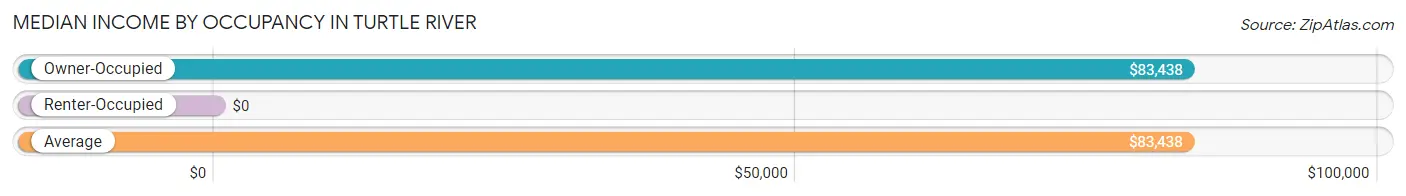
| Occupancy Type | # Households | Median Income |
| Owner-Occupied | 31 (100.0%) | $83,438 |
| Renter-Occupied | 0 (0.0%) | $0 |
| Average | 31 (100.0%) | $83,438 |
Occupancy by Householder Income Bracket in Turtle River
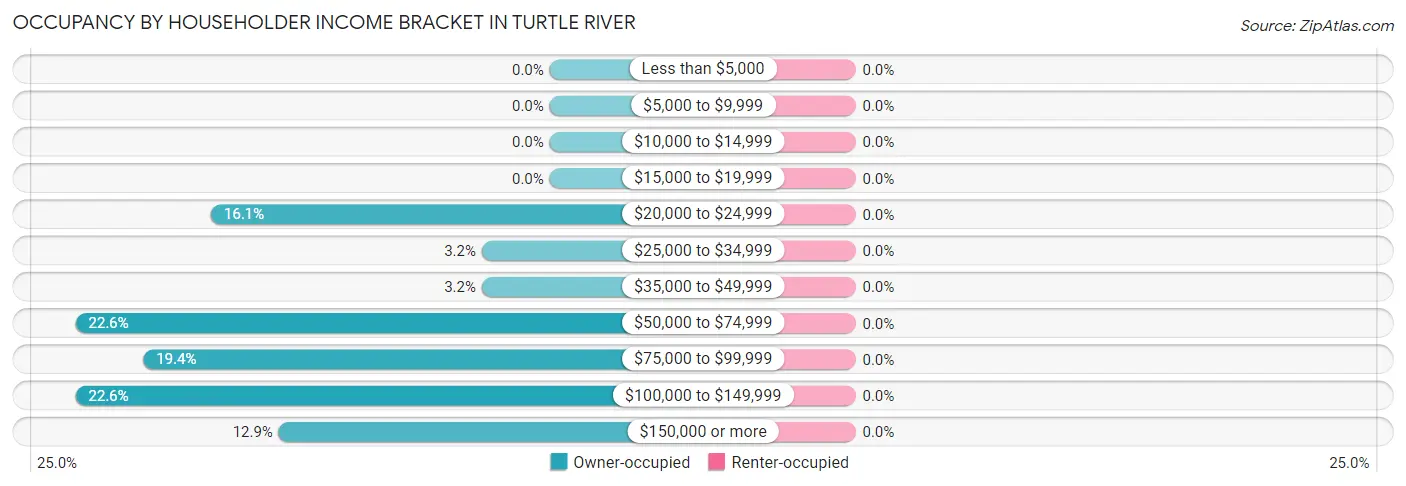
| Income Bracket | Owner-occupied | Renter-occupied |
| Less than $5,000 | 0 (0.0%) | 0 (0.0%) |
| $5,000 to $9,999 | 0 (0.0%) | 0 (0.0%) |
| $10,000 to $14,999 | 0 (0.0%) | 0 (0.0%) |
| $15,000 to $19,999 | 0 (0.0%) | 0 (0.0%) |
| $20,000 to $24,999 | 5 (16.1%) | 0 (0.0%) |
| $25,000 to $34,999 | 1 (3.2%) | 0 (0.0%) |
| $35,000 to $49,999 | 1 (3.2%) | 0 (0.0%) |
| $50,000 to $74,999 | 7 (22.6%) | 0 (0.0%) |
| $75,000 to $99,999 | 6 (19.4%) | 0 (0.0%) |
| $100,000 to $149,999 | 7 (22.6%) | 0 (0.0%) |
| $150,000 or more | 4 (12.9%) | 0 (0.0%) |
| Total | 31 (100.0%) | 0 (0.0%) |
Monthly Housing Cost Tiers in Turtle River
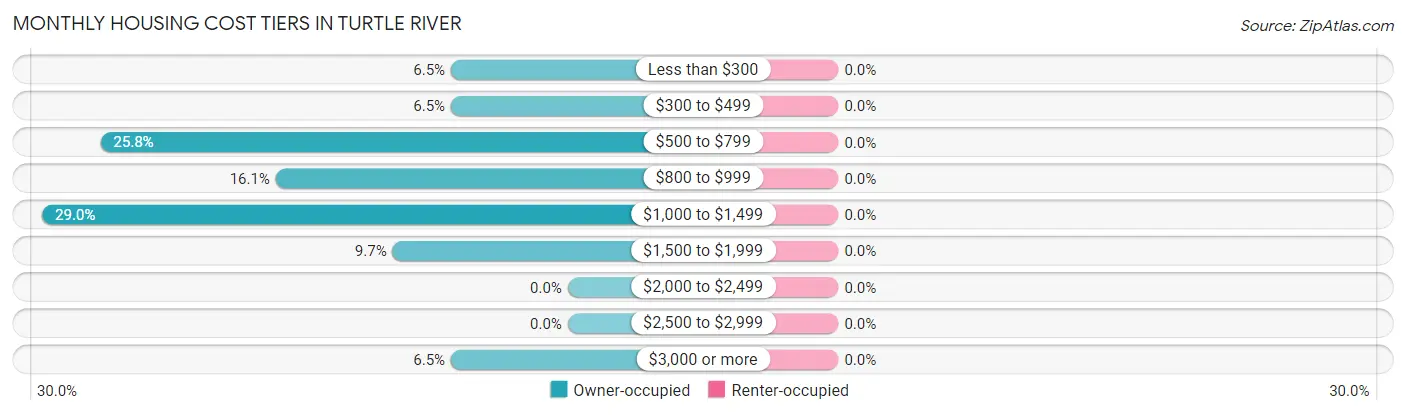
| Monthly Cost | Owner-occupied | Renter-occupied |
| Less than $300 | 2 (6.5%) | 0 (0.0%) |
| $300 to $499 | 2 (6.5%) | 0 (0.0%) |
| $500 to $799 | 8 (25.8%) | 0 (0.0%) |
| $800 to $999 | 5 (16.1%) | 0 (0.0%) |
| $1,000 to $1,499 | 9 (29.0%) | 0 (0.0%) |
| $1,500 to $1,999 | 3 (9.7%) | 0 (0.0%) |
| $2,000 to $2,499 | 0 (0.0%) | 0 (0.0%) |
| $2,500 to $2,999 | 0 (0.0%) | 0 (0.0%) |
| $3,000 or more | 2 (6.5%) | 0 (0.0%) |
| Total | 31 (100.0%) | 0 (0.0%) |
Physical Housing Characteristics in Turtle River
Housing Structures in Turtle River
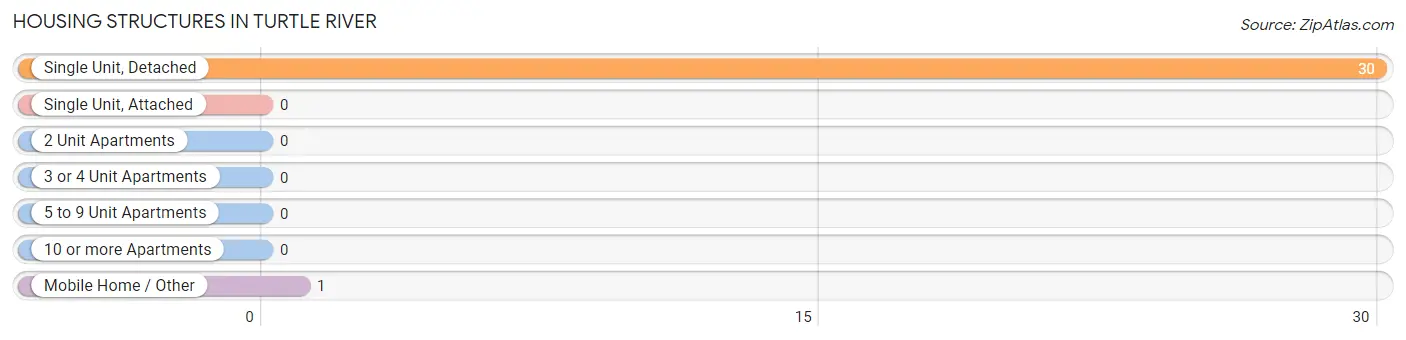
| Structure Type | # Housing Units | % Housing Units |
| Single Unit, Detached | 30 | 96.8% |
| Single Unit, Attached | 0 | 0.0% |
| 2 Unit Apartments | 0 | 0.0% |
| 3 or 4 Unit Apartments | 0 | 0.0% |
| 5 to 9 Unit Apartments | 0 | 0.0% |
| 10 or more Apartments | 0 | 0.0% |
| Mobile Home / Other | 1 | 3.2% |
| Total | 31 | 100.0% |
Housing Structures by Occupancy in Turtle River
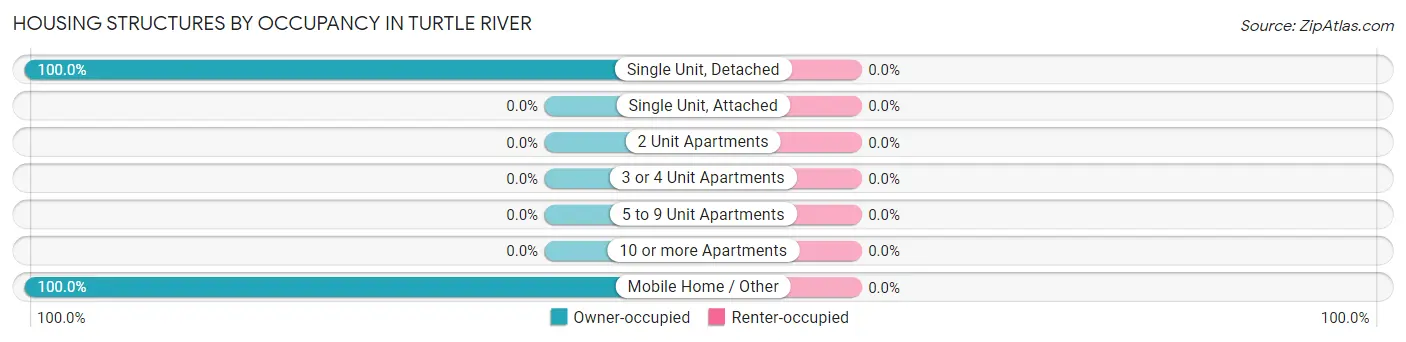
| Structure Type | Owner-occupied | Renter-occupied |
| Single Unit, Detached | 30 (100.0%) | 0 (0.0%) |
| Single Unit, Attached | 0 (0.0%) | 0 (0.0%) |
| 2 Unit Apartments | 0 (0.0%) | 0 (0.0%) |
| 3 or 4 Unit Apartments | 0 (0.0%) | 0 (0.0%) |
| 5 to 9 Unit Apartments | 0 (0.0%) | 0 (0.0%) |
| 10 or more Apartments | 0 (0.0%) | 0 (0.0%) |
| Mobile Home / Other | 1 (100.0%) | 0 (0.0%) |
| Total | 31 (100.0%) | 0 (0.0%) |
Housing Structures by Number of Rooms in Turtle River
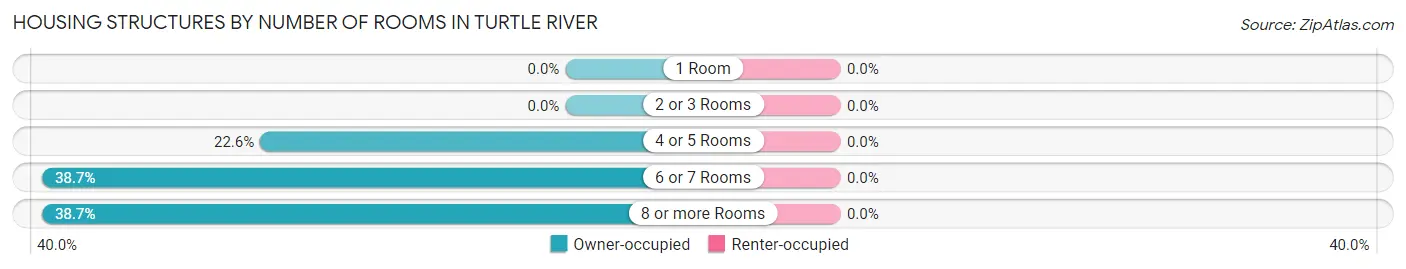
| Number of Rooms | Owner-occupied | Renter-occupied |
| 1 Room | 0 (0.0%) | 0 (0.0%) |
| 2 or 3 Rooms | 0 (0.0%) | 0 (0.0%) |
| 4 or 5 Rooms | 7 (22.6%) | 0 (0.0%) |
| 6 or 7 Rooms | 12 (38.7%) | 0 (0.0%) |
| 8 or more Rooms | 12 (38.7%) | 0 (0.0%) |
| Total | 31 (100.0%) | 0 (0.0%) |
Housing Structure by Heating Type in Turtle River
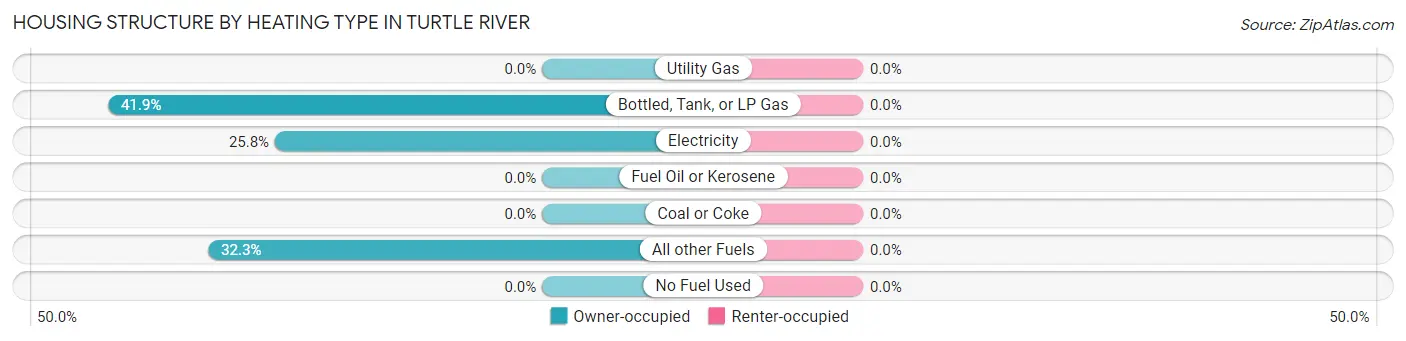
| Heating Type | Owner-occupied | Renter-occupied |
| Utility Gas | 0 (0.0%) | 0 (0.0%) |
| Bottled, Tank, or LP Gas | 13 (41.9%) | 0 (0.0%) |
| Electricity | 8 (25.8%) | 0 (0.0%) |
| Fuel Oil or Kerosene | 0 (0.0%) | 0 (0.0%) |
| Coal or Coke | 0 (0.0%) | 0 (0.0%) |
| All other Fuels | 10 (32.3%) | 0 (0.0%) |
| No Fuel Used | 0 (0.0%) | 0 (0.0%) |
| Total | 31 (100.0%) | 0 (0.0%) |
Household Vehicle Usage in Turtle River
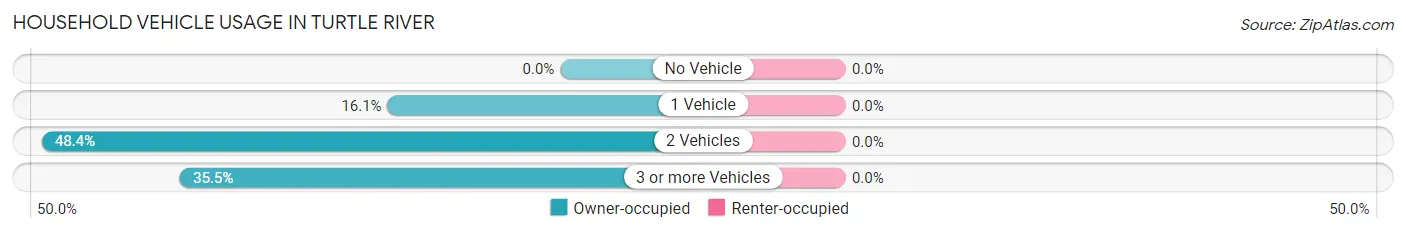
| Vehicles per Household | Owner-occupied | Renter-occupied |
| No Vehicle | 0 (0.0%) | 0 (0.0%) |
| 1 Vehicle | 5 (16.1%) | 0 (0.0%) |
| 2 Vehicles | 15 (48.4%) | 0 (0.0%) |
| 3 or more Vehicles | 11 (35.5%) | 0 (0.0%) |
| Total | 31 (100.0%) | 0 (0.0%) |
Real Estate & Mortgages in Turtle River
Real Estate and Mortgage Overview in Turtle River
| Characteristic | Without Mortgage | With Mortgage |
| Housing Units | 15 | 16 |
| Median Property Value | - | - |
| Median Household Income | $59,375 | $2 |
| Monthly Housing Costs | $550 | $2 |
| Real Estate Taxes | - | - |
Property Value by Mortgage Status in Turtle River
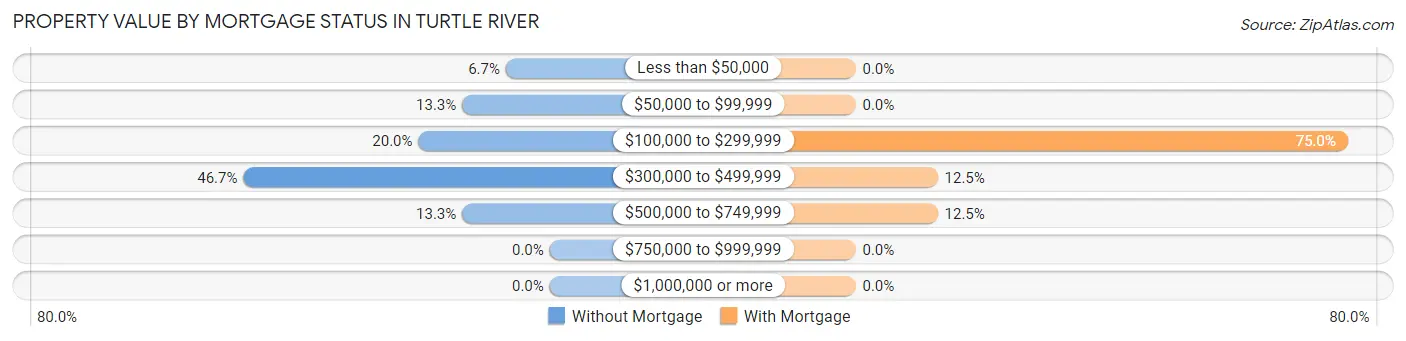
| Property Value | Without Mortgage | With Mortgage |
| Less than $50,000 | 1 (6.7%) | 0 (0.0%) |
| $50,000 to $99,999 | 2 (13.3%) | 0 (0.0%) |
| $100,000 to $299,999 | 3 (20.0%) | 12 (75.0%) |
| $300,000 to $499,999 | 7 (46.7%) | 2 (12.5%) |
| $500,000 to $749,999 | 2 (13.3%) | 2 (12.5%) |
| $750,000 to $999,999 | 0 (0.0%) | 0 (0.0%) |
| $1,000,000 or more | 0 (0.0%) | 0 (0.0%) |
| Total | 15 (100.0%) | 16 (100.0%) |
Household Income by Mortgage Status in Turtle River
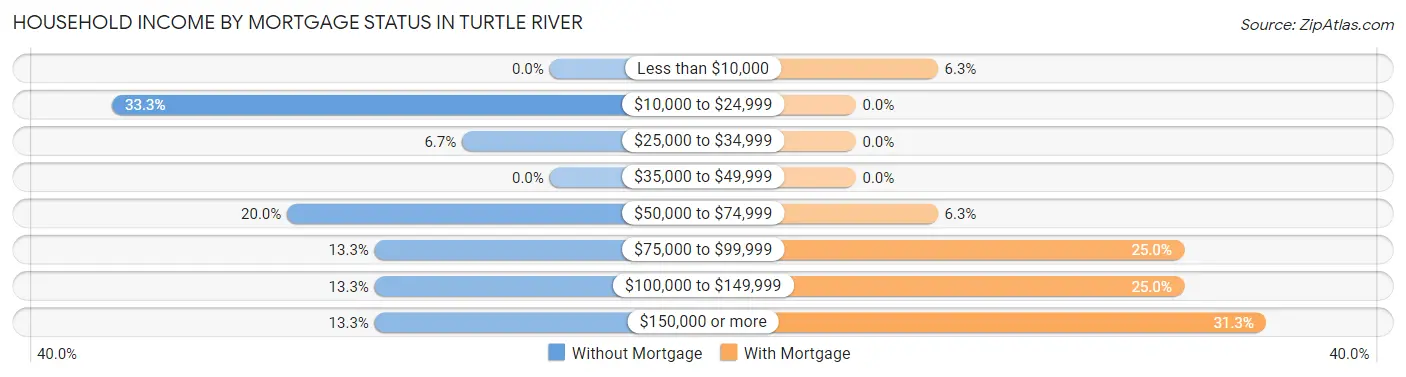
| Household Income | Without Mortgage | With Mortgage |
| Less than $10,000 | 0 (0.0%) | 1 (6.2%) |
| $10,000 to $24,999 | 5 (33.3%) | 0 (0.0%) |
| $25,000 to $34,999 | 1 (6.7%) | 0 (0.0%) |
| $35,000 to $49,999 | 0 (0.0%) | 0 (0.0%) |
| $50,000 to $74,999 | 3 (20.0%) | 1 (6.2%) |
| $75,000 to $99,999 | 2 (13.3%) | 4 (25.0%) |
| $100,000 to $149,999 | 2 (13.3%) | 4 (25.0%) |
| $150,000 or more | 2 (13.3%) | 5 (31.2%) |
| Total | 15 (100.0%) | 16 (100.0%) |
Property Value to Household Income Ratio in Turtle River
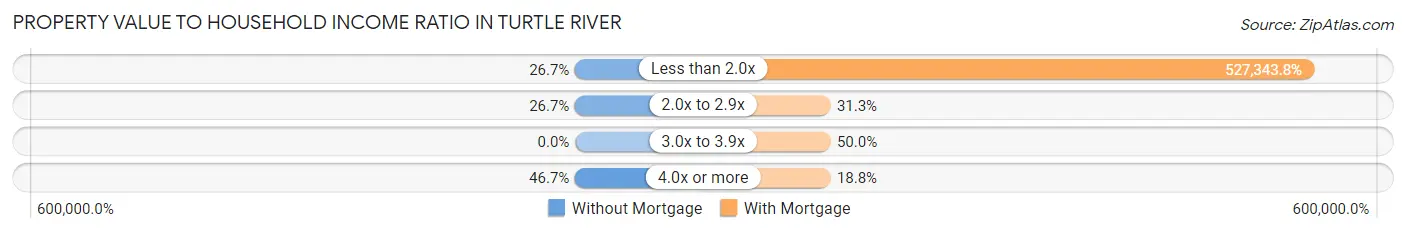
| Value-to-Income Ratio | Without Mortgage | With Mortgage |
| Less than 2.0x | 4 (26.7%) | 84,375 (527,343.8%) |
| 2.0x to 2.9x | 4 (26.7%) | 5 (31.2%) |
| 3.0x to 3.9x | 0 (0.0%) | 8 (50.0%) |
| 4.0x or more | 7 (46.7%) | 3 (18.8%) |
| Total | 15 (100.0%) | 16 (100.0%) |
Real Estate Taxes by Mortgage Status in Turtle River
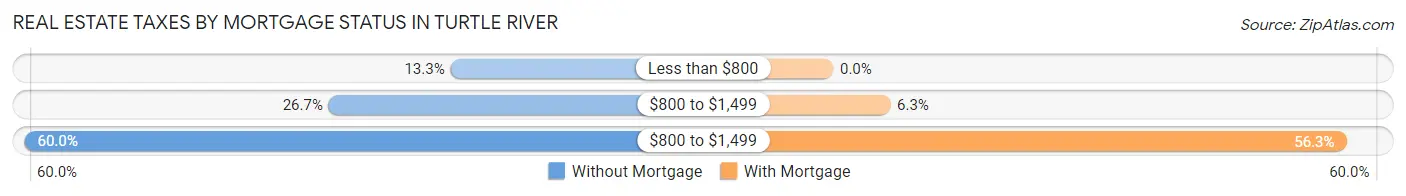
| Property Taxes | Without Mortgage | With Mortgage |
| Less than $800 | 2 (13.3%) | 0 (0.0%) |
| $800 to $1,499 | 4 (26.7%) | 1 (6.2%) |
| $800 to $1,499 | 9 (60.0%) | 9 (56.2%) |
| Total | 15 (100.0%) | 16 (100.0%) |
Health & Disability in Turtle River
Health Insurance Coverage by Age in Turtle River
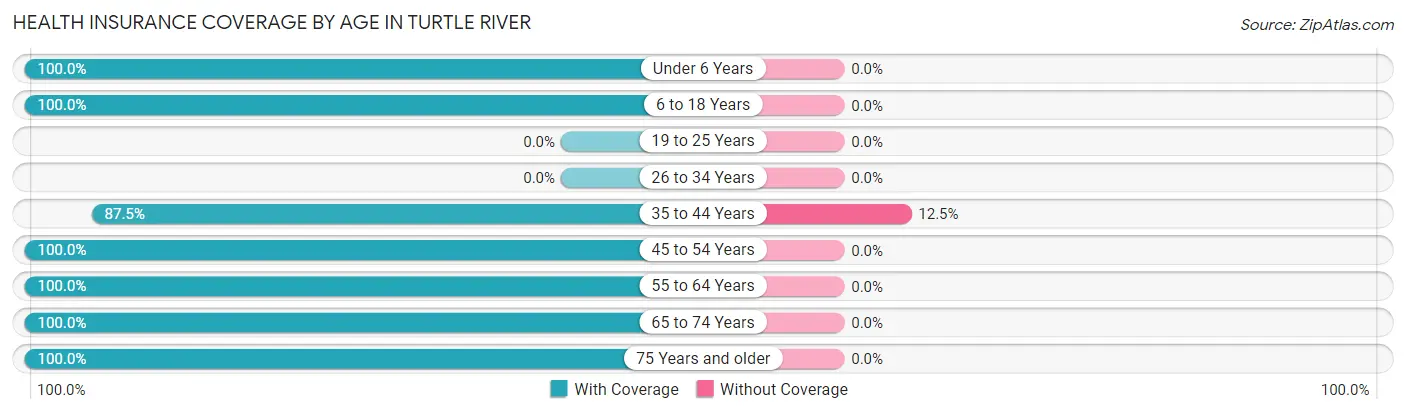
| Age Bracket | With Coverage | Without Coverage |
| Under 6 Years | 5 (100.0%) | 0 (0.0%) |
| 6 to 18 Years | 6 (100.0%) | 0 (0.0%) |
| 19 to 25 Years | 0 (0.0%) | 0 (0.0%) |
| 26 to 34 Years | 0 (0.0%) | 0 (0.0%) |
| 35 to 44 Years | 7 (87.5%) | 1 (12.5%) |
| 45 to 54 Years | 6 (100.0%) | 0 (0.0%) |
| 55 to 64 Years | 16 (100.0%) | 0 (0.0%) |
| 65 to 74 Years | 24 (100.0%) | 0 (0.0%) |
| 75 Years and older | 2 (100.0%) | 0 (0.0%) |
| Total | 66 (98.5%) | 1 (1.5%) |
Health Insurance Coverage by Citizenship Status in Turtle River
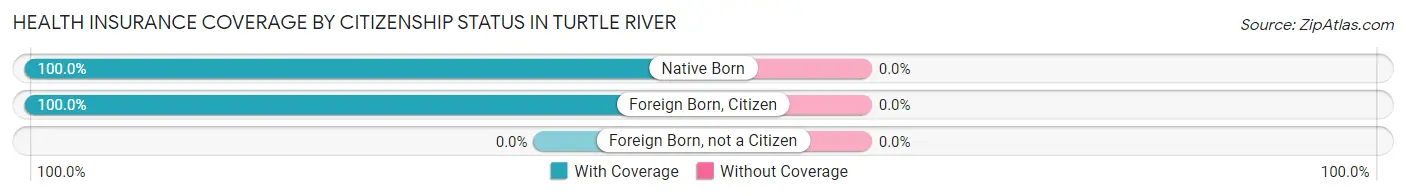
| Citizenship Status | With Coverage | Without Coverage |
| Native Born | 5 (100.0%) | 0 (0.0%) |
| Foreign Born, Citizen | 6 (100.0%) | 0 (0.0%) |
| Foreign Born, not a Citizen | 0 (0.0%) | 0 (0.0%) |
Health Insurance Coverage by Household Income in Turtle River
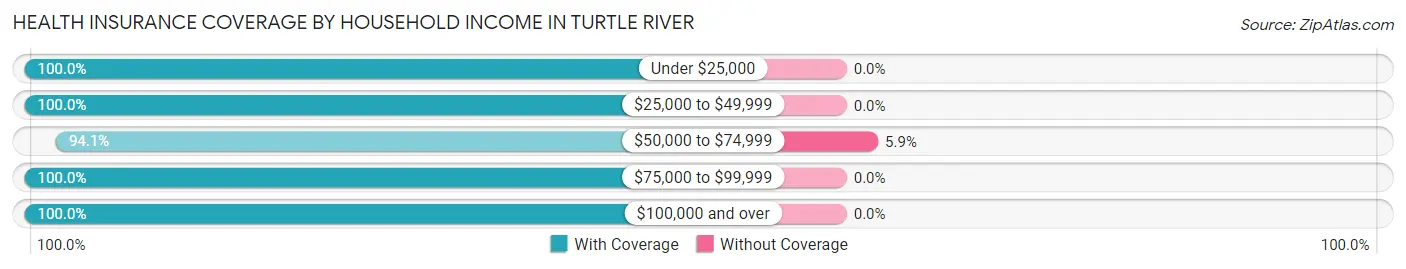
| Household Income | With Coverage | Without Coverage |
| Under $25,000 | 9 (100.0%) | 0 (0.0%) |
| $25,000 to $49,999 | 4 (100.0%) | 0 (0.0%) |
| $50,000 to $74,999 | 16 (94.1%) | 1 (5.9%) |
| $75,000 to $99,999 | 11 (100.0%) | 0 (0.0%) |
| $100,000 and over | 26 (100.0%) | 0 (0.0%) |
Public vs Private Health Insurance Coverage by Age in Turtle River
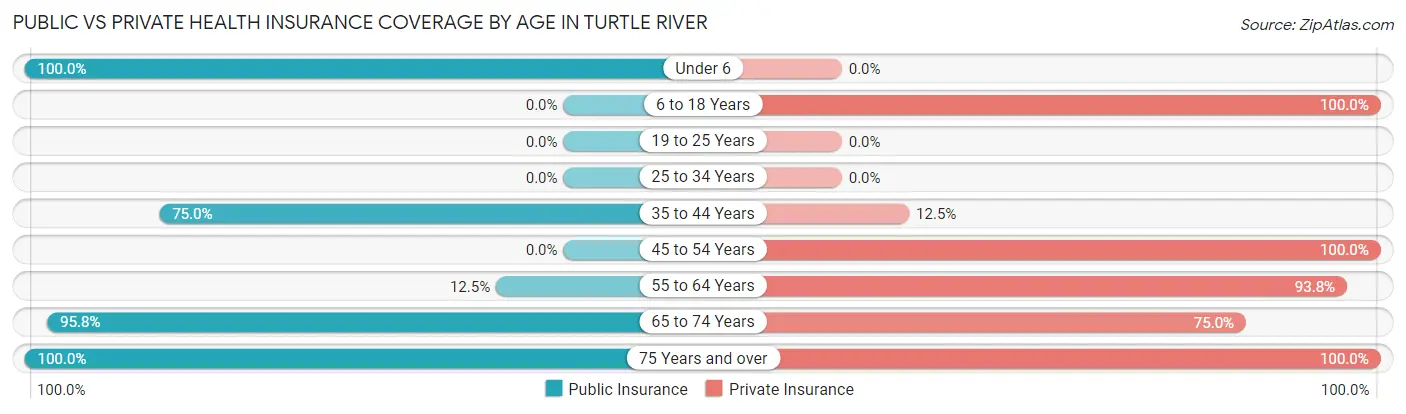
| Age Bracket | Public Insurance | Private Insurance |
| Under 6 | 5 (100.0%) | 0 (0.0%) |
| 6 to 18 Years | 0 (0.0%) | 6 (100.0%) |
| 19 to 25 Years | 0 (0.0%) | 0 (0.0%) |
| 25 to 34 Years | 0 (0.0%) | 0 (0.0%) |
| 35 to 44 Years | 6 (75.0%) | 1 (12.5%) |
| 45 to 54 Years | 0 (0.0%) | 6 (100.0%) |
| 55 to 64 Years | 2 (12.5%) | 15 (93.8%) |
| 65 to 74 Years | 23 (95.8%) | 18 (75.0%) |
| 75 Years and over | 2 (100.0%) | 2 (100.0%) |
| Total | 38 (56.7%) | 48 (71.6%) |
Disability Status by Sex by Age in Turtle River
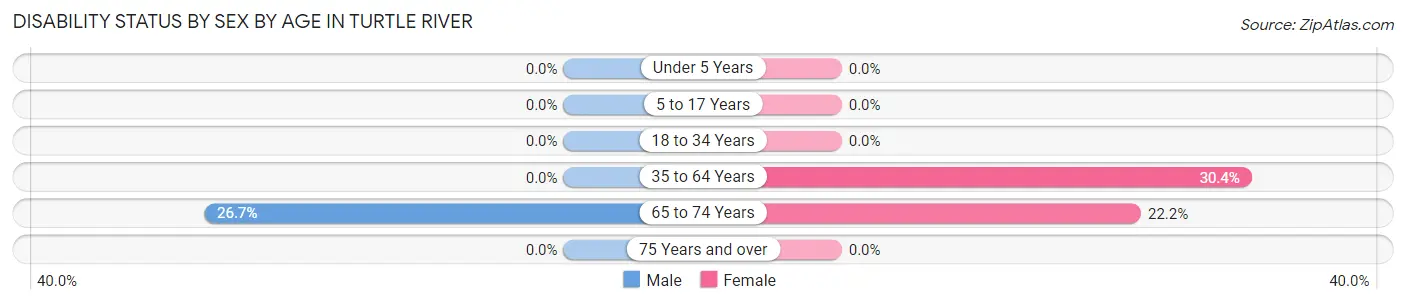
| Age Bracket | Male | Female |
| Under 5 Years | 0 (0.0%) | 0 (0.0%) |
| 5 to 17 Years | 0 (0.0%) | 0 (0.0%) |
| 18 to 34 Years | 0 (0.0%) | 0 (0.0%) |
| 35 to 64 Years | 0 (0.0%) | 7 (30.4%) |
| 65 to 74 Years | 4 (26.7%) | 2 (22.2%) |
| 75 Years and over | 0 (0.0%) | 0 (0.0%) |
Disability Class by Sex by Age in Turtle River
Disability Class: Hearing Difficulty
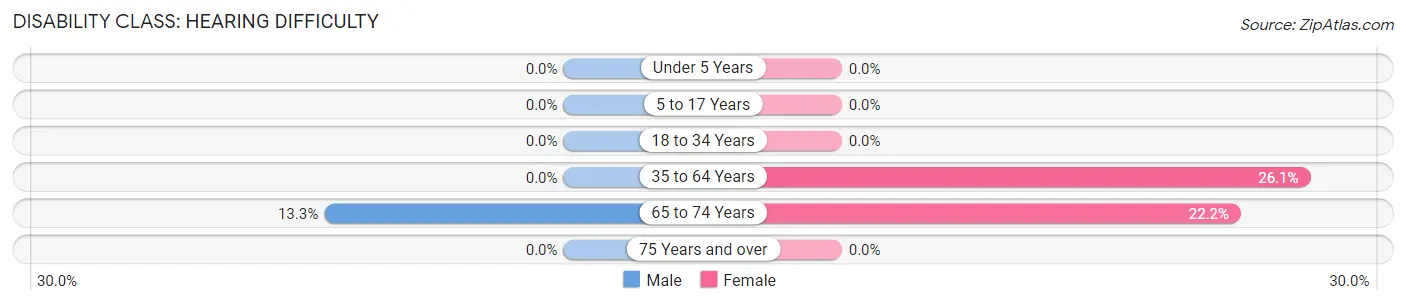
| Age Bracket | Male | Female |
| Under 5 Years | 0 (0.0%) | 0 (0.0%) |
| 5 to 17 Years | 0 (0.0%) | 0 (0.0%) |
| 18 to 34 Years | 0 (0.0%) | 0 (0.0%) |
| 35 to 64 Years | 0 (0.0%) | 6 (26.1%) |
| 65 to 74 Years | 2 (13.3%) | 2 (22.2%) |
| 75 Years and over | 0 (0.0%) | 0 (0.0%) |
Disability Class: Vision Difficulty
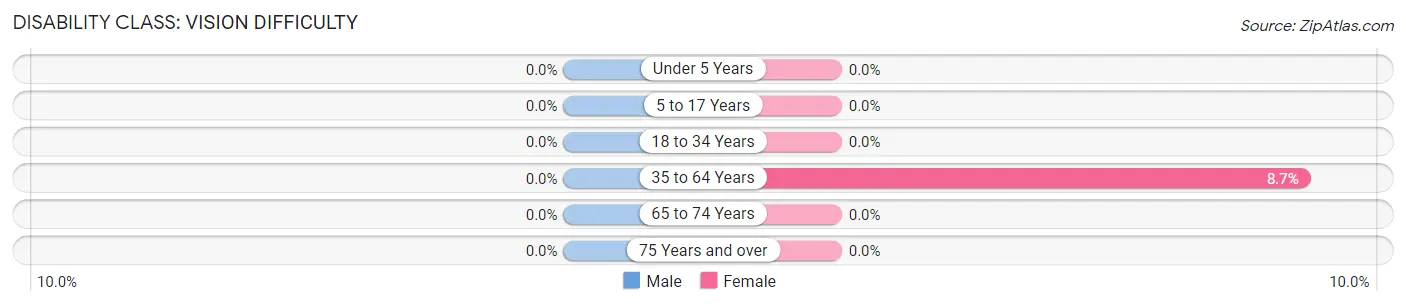
| Age Bracket | Male | Female |
| Under 5 Years | 0 (0.0%) | 0 (0.0%) |
| 5 to 17 Years | 0 (0.0%) | 0 (0.0%) |
| 18 to 34 Years | 0 (0.0%) | 0 (0.0%) |
| 35 to 64 Years | 0 (0.0%) | 2 (8.7%) |
| 65 to 74 Years | 0 (0.0%) | 0 (0.0%) |
| 75 Years and over | 0 (0.0%) | 0 (0.0%) |
Disability Class: Cognitive Difficulty
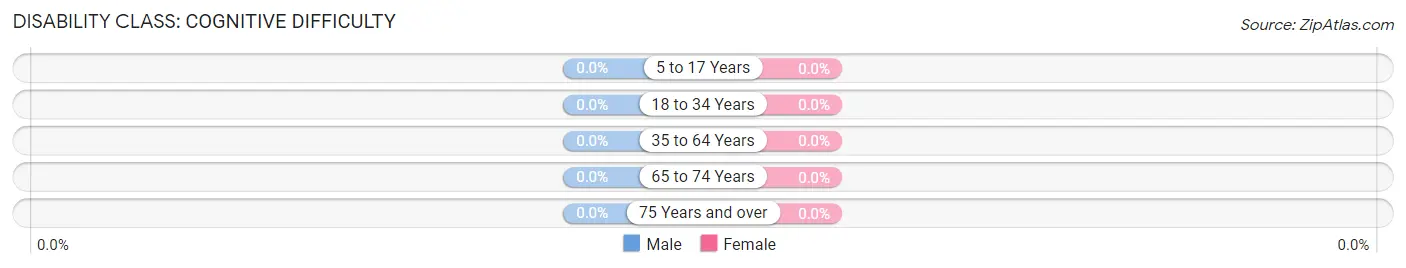
| Age Bracket | Male | Female |
| 5 to 17 Years | 0 (0.0%) | 0 (0.0%) |
| 18 to 34 Years | 0 (0.0%) | 0 (0.0%) |
| 35 to 64 Years | 0 (0.0%) | 0 (0.0%) |
| 65 to 74 Years | 0 (0.0%) | 0 (0.0%) |
| 75 Years and over | 0 (0.0%) | 0 (0.0%) |
Disability Class: Ambulatory Difficulty
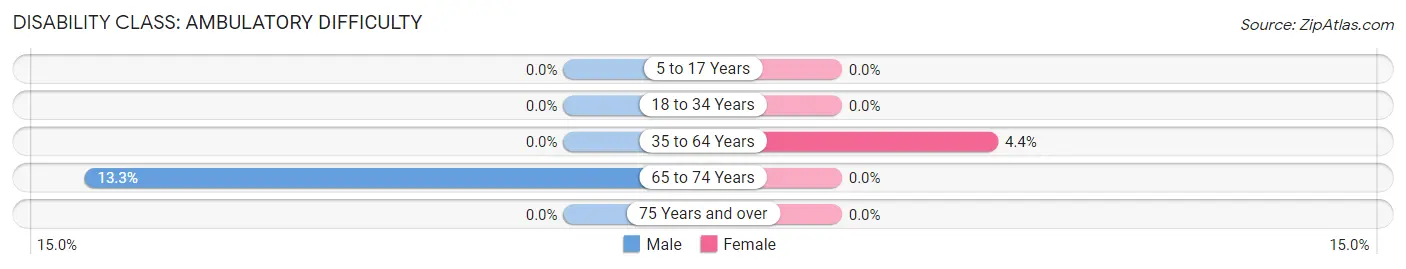
| Age Bracket | Male | Female |
| 5 to 17 Years | 0 (0.0%) | 0 (0.0%) |
| 18 to 34 Years | 0 (0.0%) | 0 (0.0%) |
| 35 to 64 Years | 0 (0.0%) | 1 (4.3%) |
| 65 to 74 Years | 2 (13.3%) | 0 (0.0%) |
| 75 Years and over | 0 (0.0%) | 0 (0.0%) |
Disability Class: Self-Care Difficulty
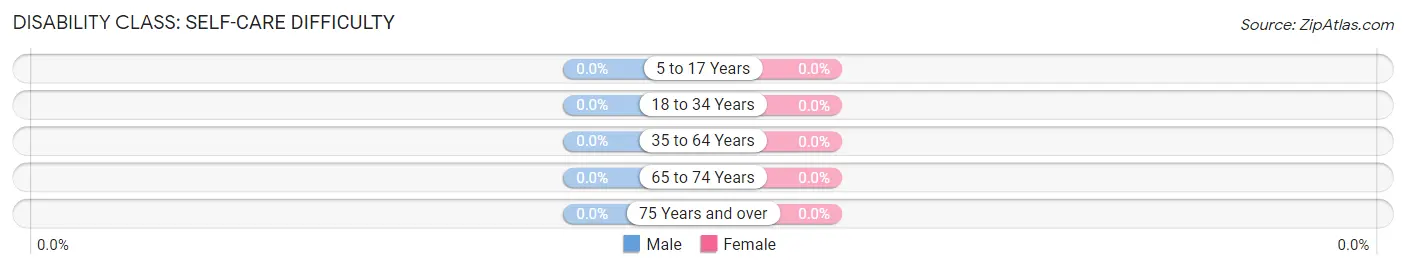
| Age Bracket | Male | Female |
| 5 to 17 Years | 0 (0.0%) | 0 (0.0%) |
| 18 to 34 Years | 0 (0.0%) | 0 (0.0%) |
| 35 to 64 Years | 0 (0.0%) | 0 (0.0%) |
| 65 to 74 Years | 0 (0.0%) | 0 (0.0%) |
| 75 Years and over | 0 (0.0%) | 0 (0.0%) |
Technology Access in Turtle River
Computing Device Access in Turtle River
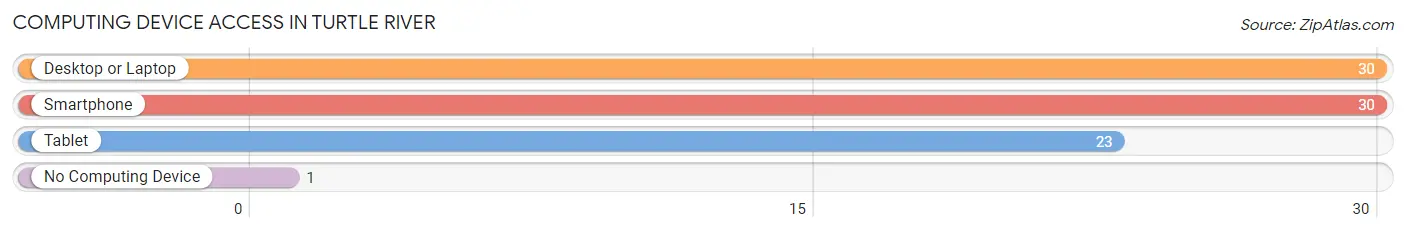
| Device Type | # Households | % Households |
| Desktop or Laptop | 30 | 96.8% |
| Smartphone | 30 | 96.8% |
| Tablet | 23 | 74.2% |
| No Computing Device | 1 | 3.2% |
| Total | 31 | 100.0% |
Internet Access in Turtle River
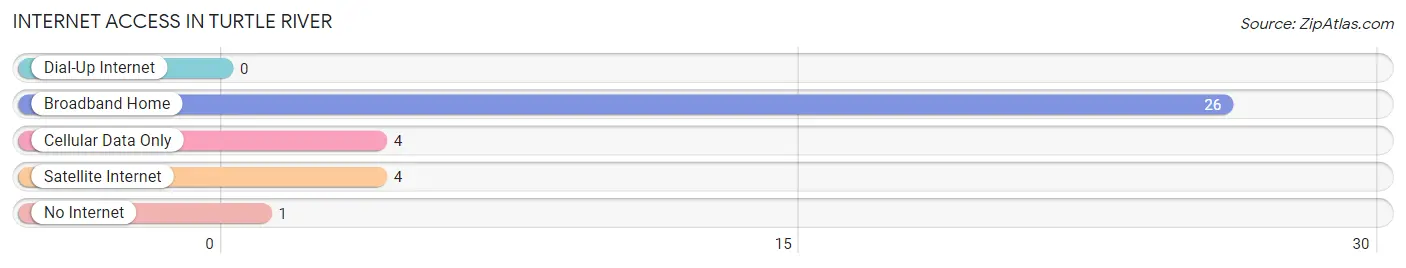
| Internet Type | # Households | % Households |
| Dial-Up Internet | 0 | 0.0% |
| Broadband Home | 26 | 83.9% |
| Cellular Data Only | 4 | 12.9% |
| Satellite Internet | 4 | 12.9% |
| No Internet | 1 | 3.2% |
| Total | 31 | 100.0% |
Turtle River Summary
Turtle River is a small unincorporated community located in Beltrami County, Minnesota, United States. It is situated along the Turtle River, a tributary of the Red Lake River. The community is located approximately 10 miles (16 km) northeast of Bemidji, the county seat.
History
The Turtle River area was first settled in the late 1800s by a group of Norwegian immigrants. The settlers were attracted to the area by the abundance of timber and the potential for farming. The first post office was established in 1887 and the community was officially platted in 1889. The town was named after the nearby Turtle River, which was named by the Ojibwe people who lived in the area.
The town grew slowly but steadily over the years, and by the early 1900s it had become a thriving community. The town had a general store, a blacksmith shop, a sawmill, a grist mill, a hotel, and several other businesses. The town also had a school, a church, and a post office.
Geography
Turtle River is located in northern Minnesota, approximately 10 miles (16 km) northeast of Bemidji. The town is situated along the Turtle River, a tributary of the Red Lake River. The area is mostly flat, with some rolling hills and small lakes. The climate is typical of northern Minnesota, with cold winters and warm summers.
Economy
The economy of Turtle River is largely based on agriculture and forestry. The town is home to several small farms, as well as a sawmill and a grist mill. The town also has a few small businesses, including a general store, a hotel, and a post office.
Demographics
As of the 2010 census, the population of Turtle River was 545. The racial makeup of the town was 97.3% White, 0.7% Native American, 0.2% Asian, and 1.8% from other races. The median household income was $37,500, and the median family income was $45,000. The per capita income was $18,000.
Conclusion
Turtle River is a small unincorporated community located in Beltrami County, Minnesota. It was first settled in the late 1800s by a group of Norwegian immigrants and has since grown into a thriving community. The economy of Turtle River is largely based on agriculture and forestry, and the town is home to several small farms, as well as a sawmill and a grist mill. The population of Turtle River was 545 as of the 2010 census, and the median household income was $37,500.
Common Questions
What is Per Capita Income in Turtle River?
Per Capita income in Turtle River is $42,375.
What is the Median Family Income in Turtle River?
Median Family Income in Turtle River is $84,375.
What is the Median Household income in Turtle River?
Median Household Income in Turtle River is $83,438.
What is Inequality or Gini Index in Turtle River?
Inequality or Gini Index in Turtle River is 0.32.
What is the Total Population of Turtle River?
Total Population of Turtle River is 67.
What is the Total Male Population of Turtle River?
Total Male Population of Turtle River is 30.
What is the Total Female Population of Turtle River?
Total Female Population of Turtle River is 37.
What is the Ratio of Males per 100 Females in Turtle River?
There are 81.08 Males per 100 Females in Turtle River.
What is the Ratio of Females per 100 Males in Turtle River?
There are 123.33 Females per 100 Males in Turtle River.
What is the Median Population Age in Turtle River?
Median Population Age in Turtle River is 64.1 Years.
What is the Average Family Size in Turtle River
Average Family Size in Turtle River is 2.3 People.
What is the Average Household Size in Turtle River
Average Household Size in Turtle River is 2.2 People.
How Large is the Labor Force in Turtle River?
There are 25 People in the Labor Forcein in Turtle River.
What is the Percentage of People in the Labor Force in Turtle River?
44.6% of People are in the Labor Force in Turtle River.