Zip Codes with the Highest Percentage of Population Employed in Life, Physical & Social Science in Burnsville, MN
RELATED REPORTS & OPTIONS
Life, Physical & Social Science
Burnsville
Compare Zip Codes
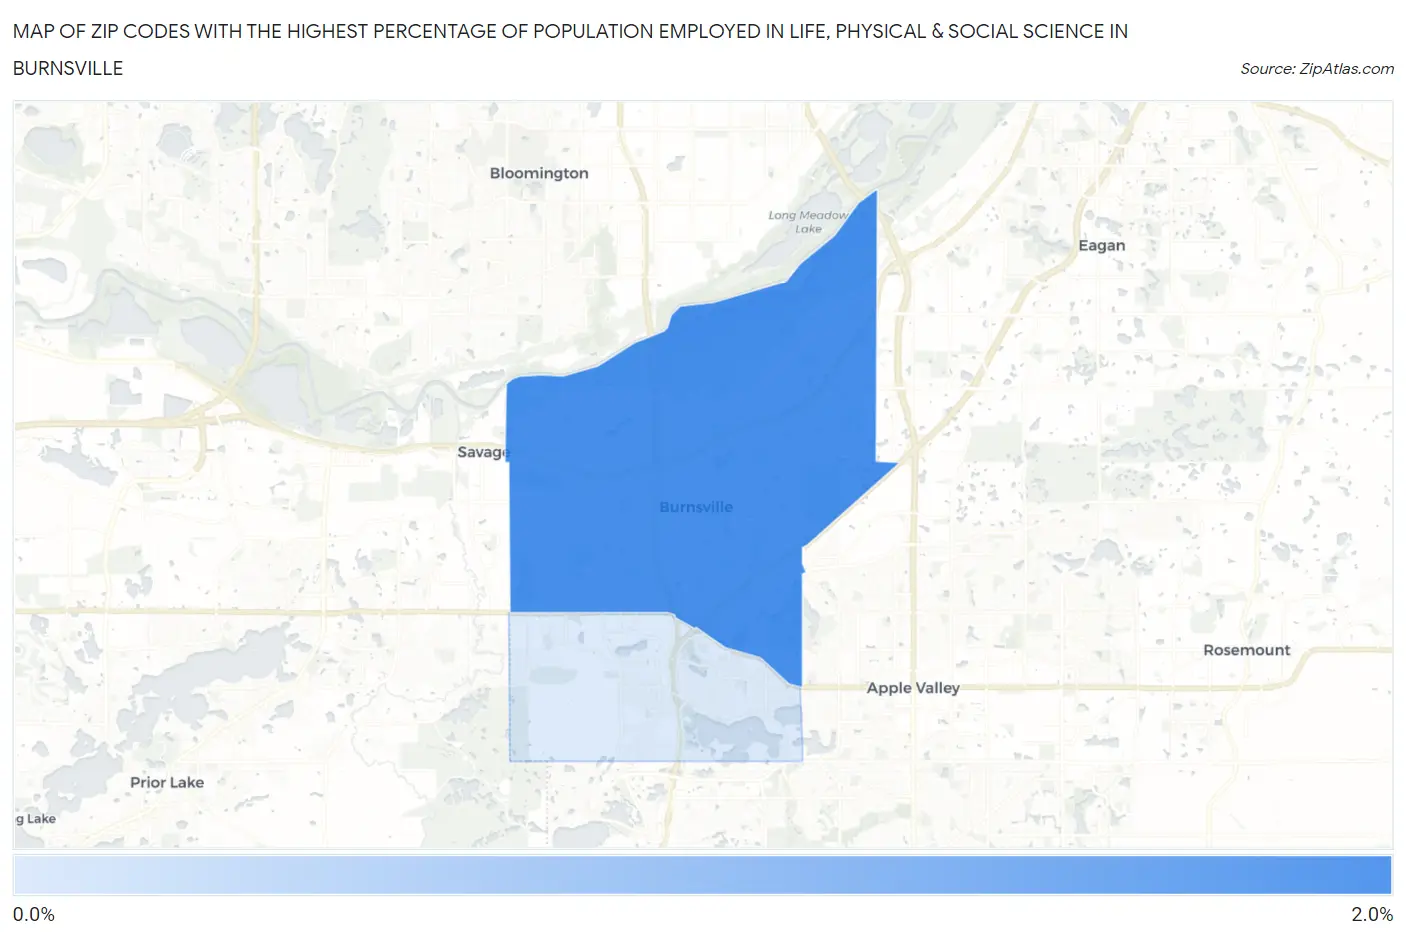
Map of Zip Codes with the Highest Percentage of Population Employed in Life, Physical & Social Science in Burnsville
0.37%
1.8%
Zip Codes with the Highest Percentage of Population Employed in Life, Physical & Social Science in Burnsville, MN
| Zip Code | % Employed | vs State | vs National | |
| 1. | 55337 | 1.8% | 1.2%(+0.564)#116 | 1.1%(+0.709)#4,325 |
| 2. | 55306 | 0.37% | 1.2%(-0.864)#560 | 1.1%(-0.719)#16,113 |
1
Common Questions
What are the Top Zip Codes with the Highest Percentage of Population Employed in Life, Physical & Social Science in Burnsville, MN?
Top Zip Codes with the Highest Percentage of Population Employed in Life, Physical & Social Science in Burnsville, MN are:
What zip code has the Highest Percentage of Population Employed in Life, Physical & Social Science in Burnsville, MN?
55337 has the Highest Percentage of Population Employed in Life, Physical & Social Science in Burnsville, MN with 1.8%.
What is the Percentage of Population Employed in Life, Physical & Social Science in Burnsville, MN?
Percentage of Population Employed in Life, Physical & Social Science in Burnsville is 1.4%.
What is the Percentage of Population Employed in Life, Physical & Social Science in Minnesota?
Percentage of Population Employed in Life, Physical & Social Science in Minnesota is 1.2%.
What is the Percentage of Population Employed in Life, Physical & Social Science in the United States?
Percentage of Population Employed in Life, Physical & Social Science in the United States is 1.1%.