Elba, MN Map & Demographics
Elba Map
Elba Overview
$42,673
PER CAPITA INCOME
$103,750
AVG FAMILY INCOME
$58,750
AVG HOUSEHOLD INCOME
41.8%
WAGE / INCOME GAP [ % ]
58.2¢/ $1
WAGE / INCOME GAP [ $ ]
0.37
INEQUALITY / GINI INDEX
79
TOTAL POPULATION
41
MALE POPULATION
38
FEMALE POPULATION
107.89
MALES / 100 FEMALES
92.68
FEMALES / 100 MALES
53.8
MEDIAN AGE
3.2
AVG FAMILY SIZE
2.1
AVG HOUSEHOLD SIZE
51
LABOR FORCE [ PEOPLE ]
71.8%
PERCENT IN LABOR FORCE
Income in Elba
Income Overview in Elba
Per Capita Income in Elba is $42,673, while median incomes of families and households are $103,750 and $58,750 respectively.
| Characteristic | Number | Measure |
| Per Capita Income | 79 | $42,673 |
| Median Family Income | 19 | $103,750 |
| Mean Family Income | 19 | $98,168 |
| Median Household Income | 37 | $58,750 |
| Mean Household Income | 37 | $84,241 |
| Income Deficit | 19 | $0 |
| Wage / Income Gap (%) | 79 | 41.77% |
| Wage / Income Gap ($) | 79 | 58.23¢ per $1 |
| Gini / Inequality Index | 79 | 0.37 |
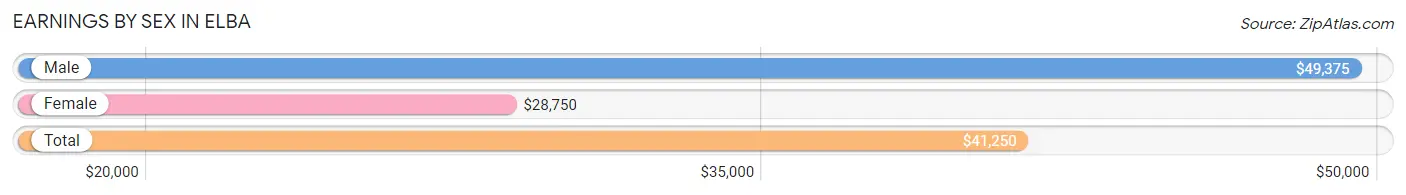
Earnings by Sex in Elba
Average Earnings in Elba are $41,250, $49,375 for men and $28,750 for women, a difference of 41.8%.
| Sex | Number | Average Earnings |
| Male | 31 (56.4%) | $49,375 |
| Female | 24 (43.6%) | $28,750 |
| Total | 55 (100.0%) | $41,250 |
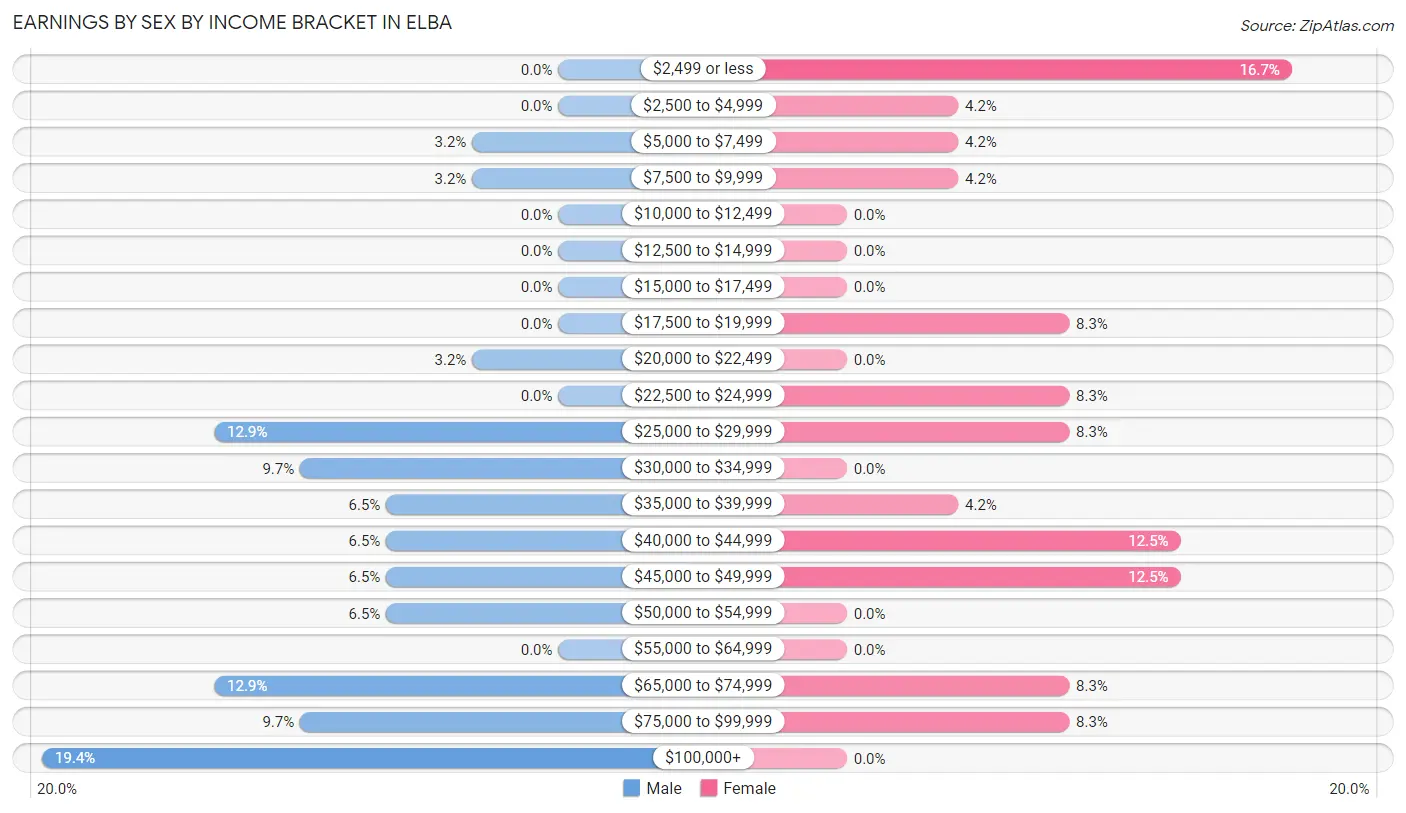
Earnings by Sex by Income Bracket in Elba
The most common earnings brackets in Elba are $100,000+ for men (6 | 19.4%) and $2,499 or less for women (4 | 16.7%).
| Income | Male | Female |
| $2,499 or less | 0 (0.0%) | 4 (16.7%) |
| $2,500 to $4,999 | 0 (0.0%) | 1 (4.2%) |
| $5,000 to $7,499 | 1 (3.2%) | 1 (4.2%) |
| $7,500 to $9,999 | 1 (3.2%) | 1 (4.2%) |
| $10,000 to $12,499 | 0 (0.0%) | 0 (0.0%) |
| $12,500 to $14,999 | 0 (0.0%) | 0 (0.0%) |
| $15,000 to $17,499 | 0 (0.0%) | 0 (0.0%) |
| $17,500 to $19,999 | 0 (0.0%) | 2 (8.3%) |
| $20,000 to $22,499 | 1 (3.2%) | 0 (0.0%) |
| $22,500 to $24,999 | 0 (0.0%) | 2 (8.3%) |
| $25,000 to $29,999 | 4 (12.9%) | 2 (8.3%) |
| $30,000 to $34,999 | 3 (9.7%) | 0 (0.0%) |
| $35,000 to $39,999 | 2 (6.5%) | 1 (4.2%) |
| $40,000 to $44,999 | 2 (6.5%) | 3 (12.5%) |
| $45,000 to $49,999 | 2 (6.5%) | 3 (12.5%) |
| $50,000 to $54,999 | 2 (6.5%) | 0 (0.0%) |
| $55,000 to $64,999 | 0 (0.0%) | 0 (0.0%) |
| $65,000 to $74,999 | 4 (12.9%) | 2 (8.3%) |
| $75,000 to $99,999 | 3 (9.7%) | 2 (8.3%) |
| $100,000+ | 6 (19.4%) | 0 (0.0%) |
| Total | 31 (100.0%) | 24 (100.0%) |
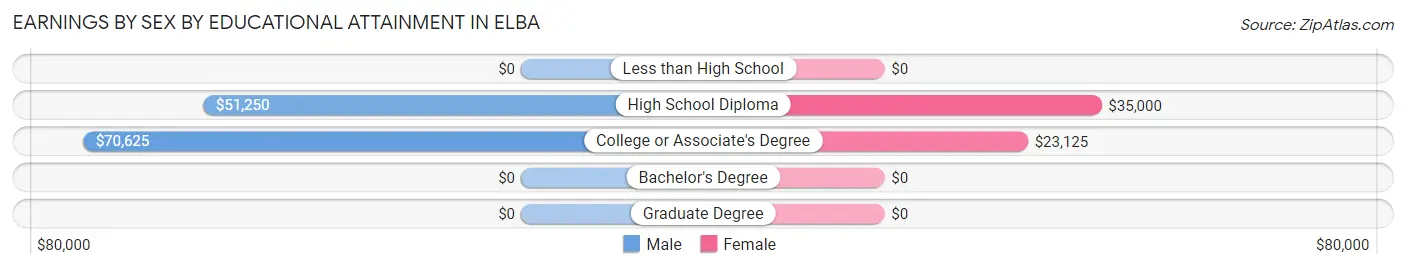
Earnings by Sex by Educational Attainment in Elba
Average earnings in Elba are $51,875 for men and $32,500 for women, a difference of 37.3%. Men with an educational attainment of college or associate's degree enjoy the highest average annual earnings of $70,625, while those with high school diploma education earn the least with $51,250. Women with an educational attainment of high school diploma earn the most with the average annual earnings of $35,000, while those with college or associate's degree education have the smallest earnings of $23,125.
| Educational Attainment | Male Income | Female Income |
| Less than High School | - | - |
| High School Diploma | $51,250 | $35,000 |
| College or Associate's Degree | $70,625 | $23,125 |
| Bachelor's Degree | - | - |
| Graduate Degree | - | - |
| Total | $51,875 | $32,500 |
Family Income in Elba
Family Income Brackets in Elba
According to the Elba family income data, there are 8 families falling into the $100,000 to $149,999 income range, which is the most common income bracket and makes up 42.1% of all families.
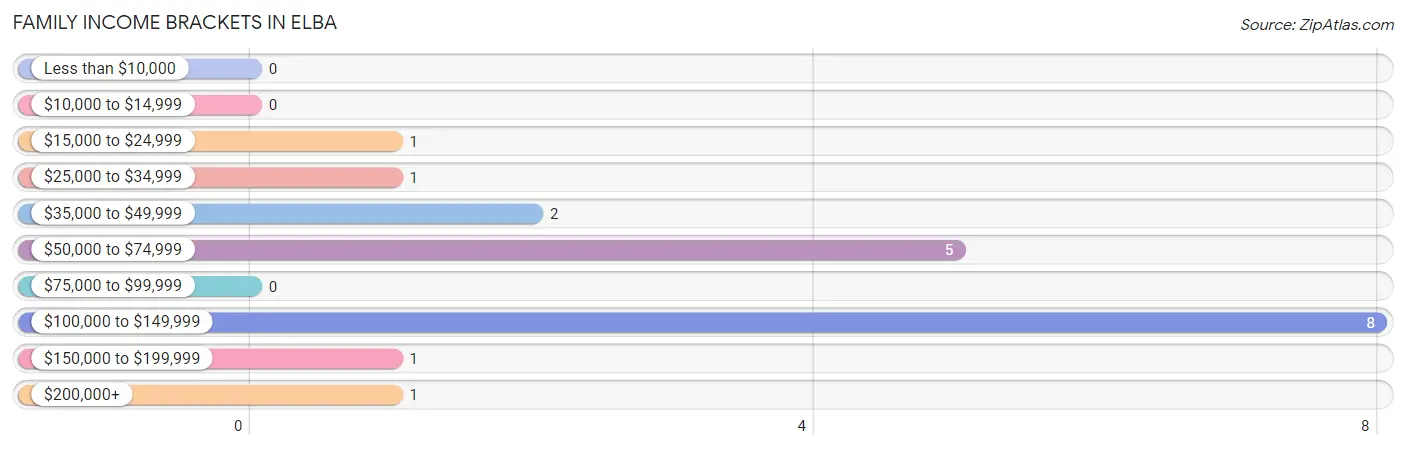
| Income Bracket | # Families | % Families |
| Less than $10,000 | 0 | 0.0% |
| $10,000 to $14,999 | 0 | 0.0% |
| $15,000 to $24,999 | 1 | 5.3% |
| $25,000 to $34,999 | 1 | 5.3% |
| $35,000 to $49,999 | 2 | 10.5% |
| $50,000 to $74,999 | 5 | 26.3% |
| $75,000 to $99,999 | 0 | 0.0% |
| $100,000 to $149,999 | 8 | 42.1% |
| $150,000 to $199,999 | 1 | 5.3% |
| $200,000+ | 1 | 5.3% |
Family Income by Famaliy Size in Elba
3-person families (9 | 47.4%) account for the highest median family income in Elba with $103,750 per family, while 3-person families (9 | 47.4%) have the highest median income of $34,583 per family member.
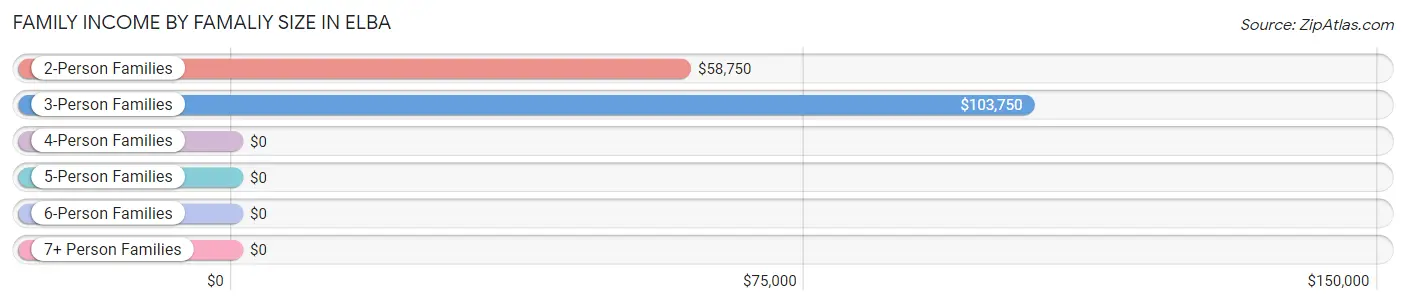
| Income Bracket | # Families | Median Income |
| 2-Person Families | 9 (47.4%) | $58,750 |
| 3-Person Families | 9 (47.4%) | $103,750 |
| 4-Person Families | 1 (5.3%) | $0 |
| 5-Person Families | 0 (0.0%) | $0 |
| 6-Person Families | 0 (0.0%) | $0 |
| 7+ Person Families | 0 (0.0%) | $0 |
| Total | 19 (100.0%) | $103,750 |
Family Income by Number of Earners in Elba
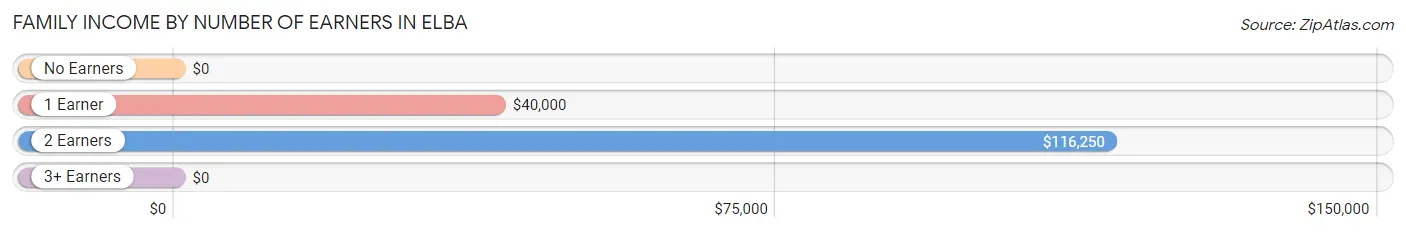
| Number of Earners | # Families | Median Income |
| No Earners | 1 (5.3%) | $0 |
| 1 Earner | 4 (21.0%) | $40,000 |
| 2 Earners | 11 (57.9%) | $116,250 |
| 3+ Earners | 3 (15.8%) | $0 |
| Total | 19 (100.0%) | $103,750 |
Household Income in Elba
Household Income Brackets in Elba
With 12 households falling in the category, the $100,000 to $149,999 income range is the most frequent in Elba, accounting for 32.4% of all households.
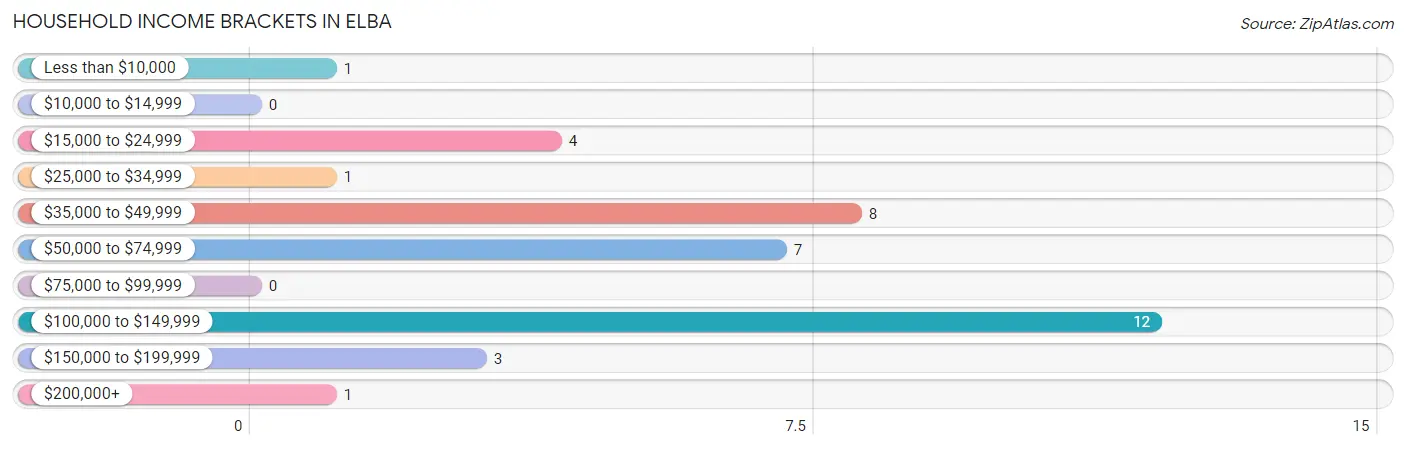
| Income Bracket | # Households | % Households |
| Less than $10,000 | 1 | 2.7% |
| $10,000 to $14,999 | 0 | 0.0% |
| $15,000 to $24,999 | 4 | 10.8% |
| $25,000 to $34,999 | 1 | 2.7% |
| $35,000 to $49,999 | 8 | 21.6% |
| $50,000 to $74,999 | 7 | 18.9% |
| $75,000 to $99,999 | 0 | 0.0% |
| $100,000 to $149,999 | 12 | 32.4% |
| $150,000 to $199,999 | 3 | 8.1% |
| $200,000+ | 1 | 2.7% |
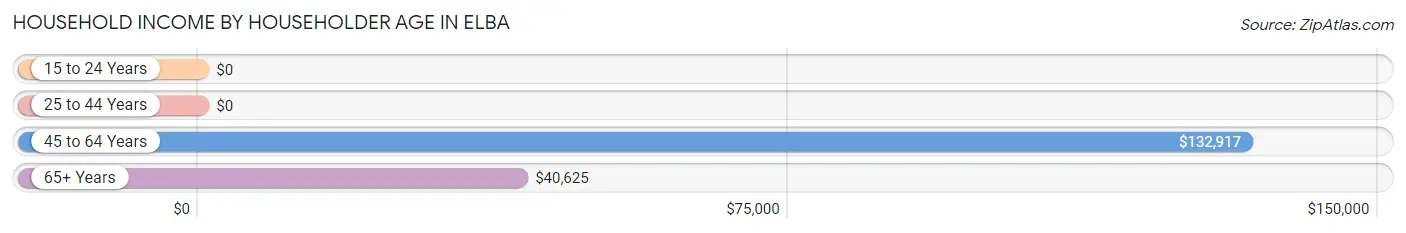
Household Income by Householder Age in Elba
The median household income in Elba is $58,750, with the highest median household income of $132,917 found in the 45 to 64 years age bracket for the primary householder. A total of 17 households (46.0%) fall into this category. Meanwhile, the 15 to 24 years age bracket for the primary householder has the lowest median household income of $0, with 2 households (5.4%) in this group.
| Income Bracket | # Households | Median Income |
| 15 to 24 Years | 2 (5.4%) | $0 |
| 25 to 44 Years | 3 (8.1%) | $0 |
| 45 to 64 Years | 17 (46.0%) | $132,917 |
| 65+ Years | 15 (40.5%) | $40,625 |
| Total | 37 (100.0%) | $58,750 |
Poverty in Elba
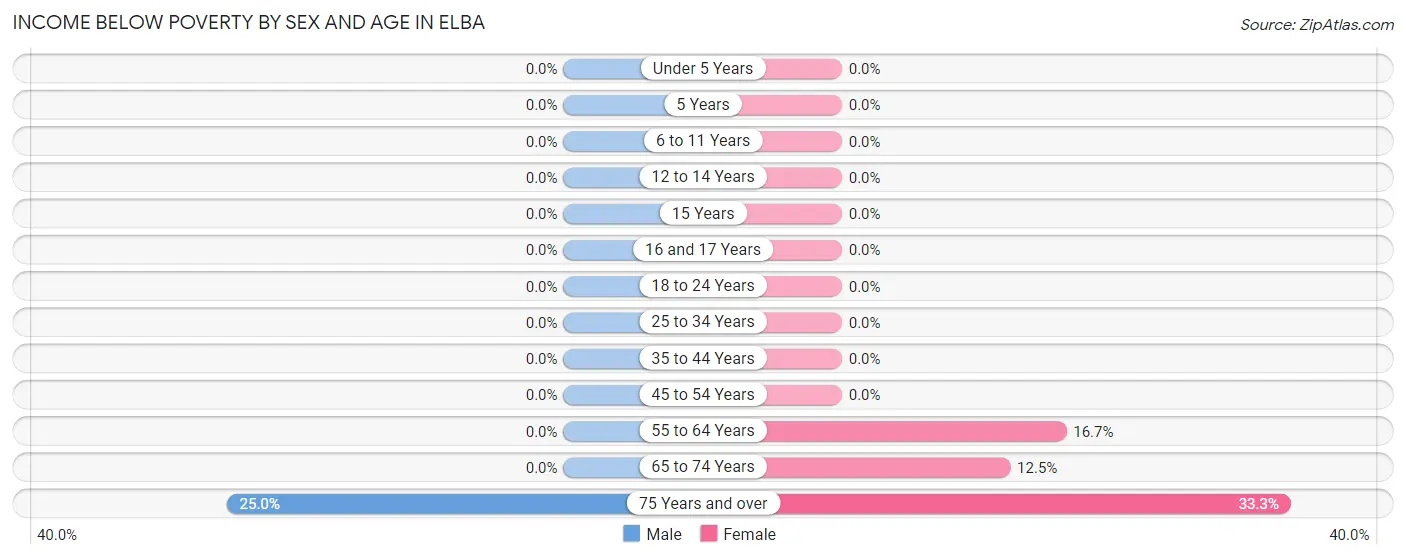
Income Below Poverty by Sex and Age in Elba
With 2.4% poverty level for males and 7.9% for females among the residents of Elba, 75 year old and over males and 75 year old and over females are the most vulnerable to poverty, with 1 males (25.0%) and 1 females (33.3%) in their respective age groups living below the poverty level.
| Age Bracket | Male | Female |
| Under 5 Years | 0 (0.0%) | 0 (0.0%) |
| 5 Years | 0 (0.0%) | 0 (0.0%) |
| 6 to 11 Years | 0 (0.0%) | 0 (0.0%) |
| 12 to 14 Years | 0 (0.0%) | 0 (0.0%) |
| 15 Years | 0 (0.0%) | 0 (0.0%) |
| 16 and 17 Years | 0 (0.0%) | 0 (0.0%) |
| 18 to 24 Years | 0 (0.0%) | 0 (0.0%) |
| 25 to 34 Years | 0 (0.0%) | 0 (0.0%) |
| 35 to 44 Years | 0 (0.0%) | 0 (0.0%) |
| 45 to 54 Years | 0 (0.0%) | 0 (0.0%) |
| 55 to 64 Years | 0 (0.0%) | 1 (16.7%) |
| 65 to 74 Years | 0 (0.0%) | 1 (12.5%) |
| 75 Years and over | 1 (25.0%) | 1 (33.3%) |
| Total | 1 (2.4%) | 3 (7.9%) |
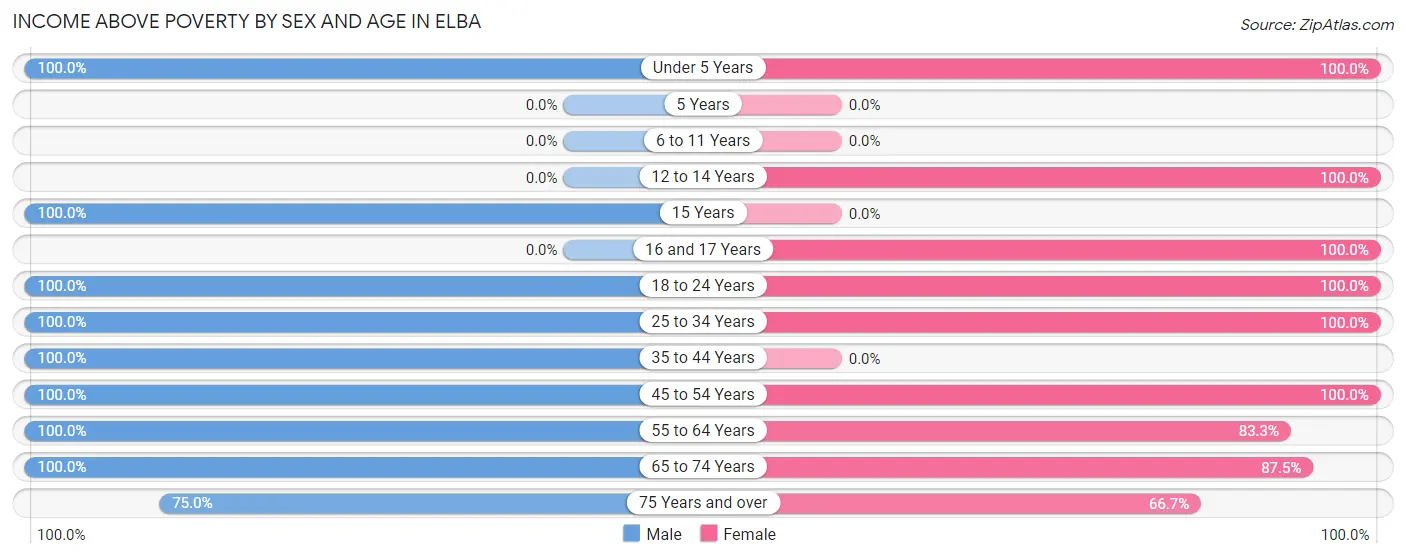
Income Above Poverty by Sex and Age in Elba
According to the poverty statistics in Elba, males aged under 5 years and females aged under 5 years are the age groups that are most secure financially, with 100.0% of males and 100.0% of females in these age groups living above the poverty line.
| Age Bracket | Male | Female |
| Under 5 Years | 3 (100.0%) | 2 (100.0%) |
| 5 Years | 0 (0.0%) | 0 (0.0%) |
| 6 to 11 Years | 0 (0.0%) | 0 (0.0%) |
| 12 to 14 Years | 0 (0.0%) | 1 (100.0%) |
| 15 Years | 2 (100.0%) | 0 (0.0%) |
| 16 and 17 Years | 0 (0.0%) | 3 (100.0%) |
| 18 to 24 Years | 4 (100.0%) | 2 (100.0%) |
| 25 to 34 Years | 3 (100.0%) | 5 (100.0%) |
| 35 to 44 Years | 2 (100.0%) | 0 (0.0%) |
| 45 to 54 Years | 13 (100.0%) | 8 (100.0%) |
| 55 to 64 Years | 5 (100.0%) | 5 (83.3%) |
| 65 to 74 Years | 5 (100.0%) | 7 (87.5%) |
| 75 Years and over | 3 (75.0%) | 2 (66.7%) |
| Total | 40 (97.6%) | 35 (92.1%) |
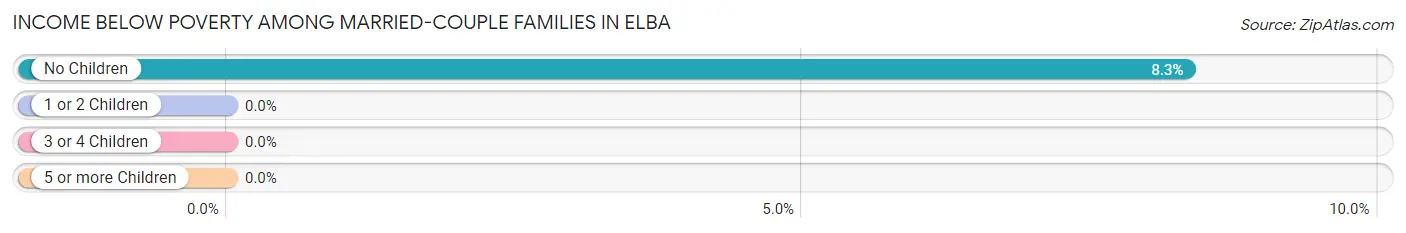
Income Below Poverty Among Married-Couple Families in Elba
The poverty statistics for married-couple families in Elba show that 5.6% or 1 of the total 18 families live below the poverty line. Families with no children have the highest poverty rate of 8.3%, comprising of 1 families. On the other hand, families with 1 or 2 children have the lowest poverty rate of 0.0%, which includes 0 families.
| Children | Above Poverty | Below Poverty |
| No Children | 11 (91.7%) | 1 (8.3%) |
| 1 or 2 Children | 6 (100.0%) | 0 (0.0%) |
| 3 or 4 Children | 0 (0.0%) | 0 (0.0%) |
| 5 or more Children | 0 (0.0%) | 0 (0.0%) |
| Total | 17 (94.4%) | 1 (5.6%) |
Income Below Poverty Among Single-Parent Households in Elba
| Children | Single Father | Single Mother |
| No Children | 0 (0.0%) | 0 (0.0%) |
| 1 or 2 Children | 0 (0.0%) | 0 (0.0%) |
| 3 or 4 Children | 0 (0.0%) | 0 (0.0%) |
| 5 or more Children | 0 (0.0%) | 0 (0.0%) |
| Total | 0 (0.0%) | 0 (0.0%) |
Income Below Poverty Among Married-Couple vs Single-Parent Households in Elba
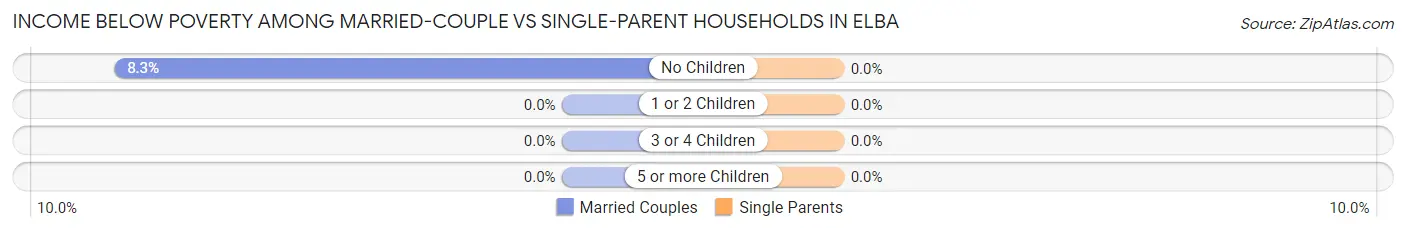
| Children | Married-Couple Families | Single-Parent Households |
| No Children | 1 (8.3%) | 0 (0.0%) |
| 1 or 2 Children | 0 (0.0%) | 0 (0.0%) |
| 3 or 4 Children | 0 (0.0%) | 0 (0.0%) |
| 5 or more Children | 0 (0.0%) | 0 (0.0%) |
| Total | 1 (5.6%) | 0 (0.0%) |
Race in Elba
The most populous races in Elba are White / Caucasian (79 | 100.0%), and Hispanic or Latino (2 | 2.5%).
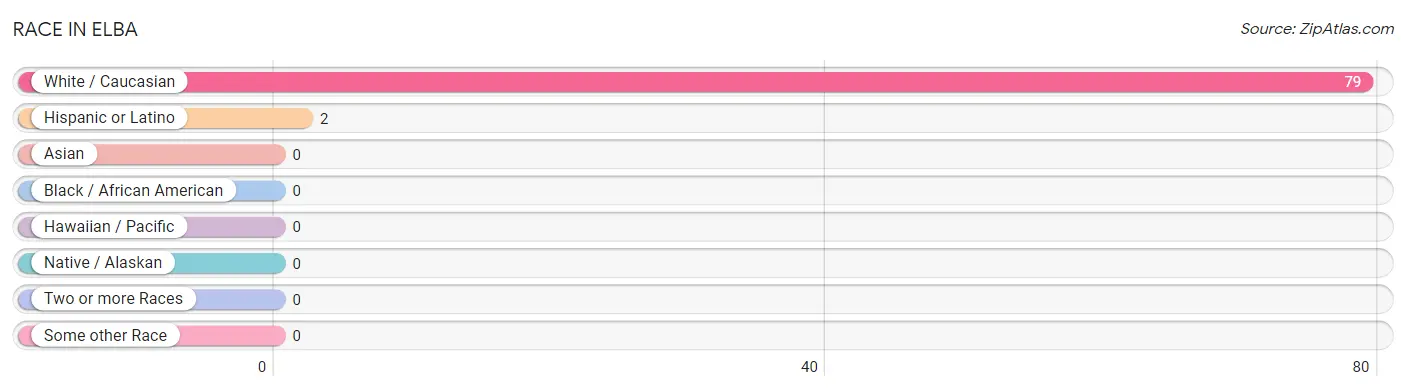
| Race | # Population | % Population |
| Asian | 0 | 0.0% |
| Black / African American | 0 | 0.0% |
| Hawaiian / Pacific | 0 | 0.0% |
| Hispanic or Latino | 2 | 2.5% |
| Native / Alaskan | 0 | 0.0% |
| White / Caucasian | 79 | 100.0% |
| Two or more Races | 0 | 0.0% |
| Some other Race | 0 | 0.0% |
| Total | 79 | 100.0% |
Ancestry in Elba
The most populous ancestries reported in Elba are German (30 | 38.0%), Norwegian (7 | 8.9%), Luxembourger (4 | 5.1%), English (3 | 3.8%), and Irish (3 | 3.8%), together accounting for 59.5% of all Elba residents.
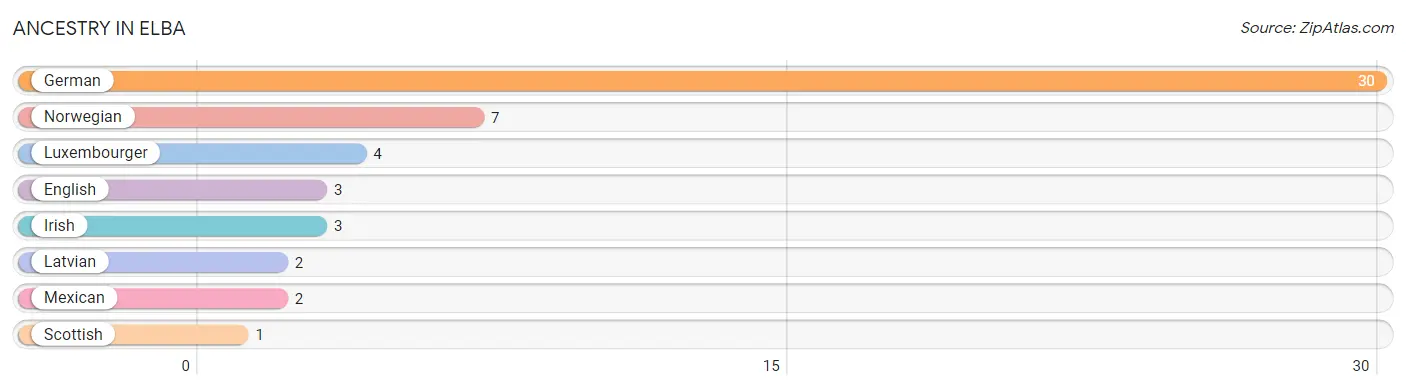
| Ancestry | # Population | % Population |
| English | 3 | 3.8% |
| German | 30 | 38.0% |
| Irish | 3 | 3.8% |
| Latvian | 2 | 2.5% |
| Luxembourger | 4 | 5.1% |
| Mexican | 2 | 2.5% |
| Norwegian | 7 | 8.9% |
| Scottish | 1 | 1.3% | View All 8 Rows |
Immigrants in Elba

| Immigration Origin | # Population | % Population | View All 0 Rows |
Sex and Age in Elba
Sex and Age in Elba
The most populous age groups in Elba are 50 to 54 Years (11 | 26.8%) for men and 65 to 69 Years (5 | 13.2%) for women.
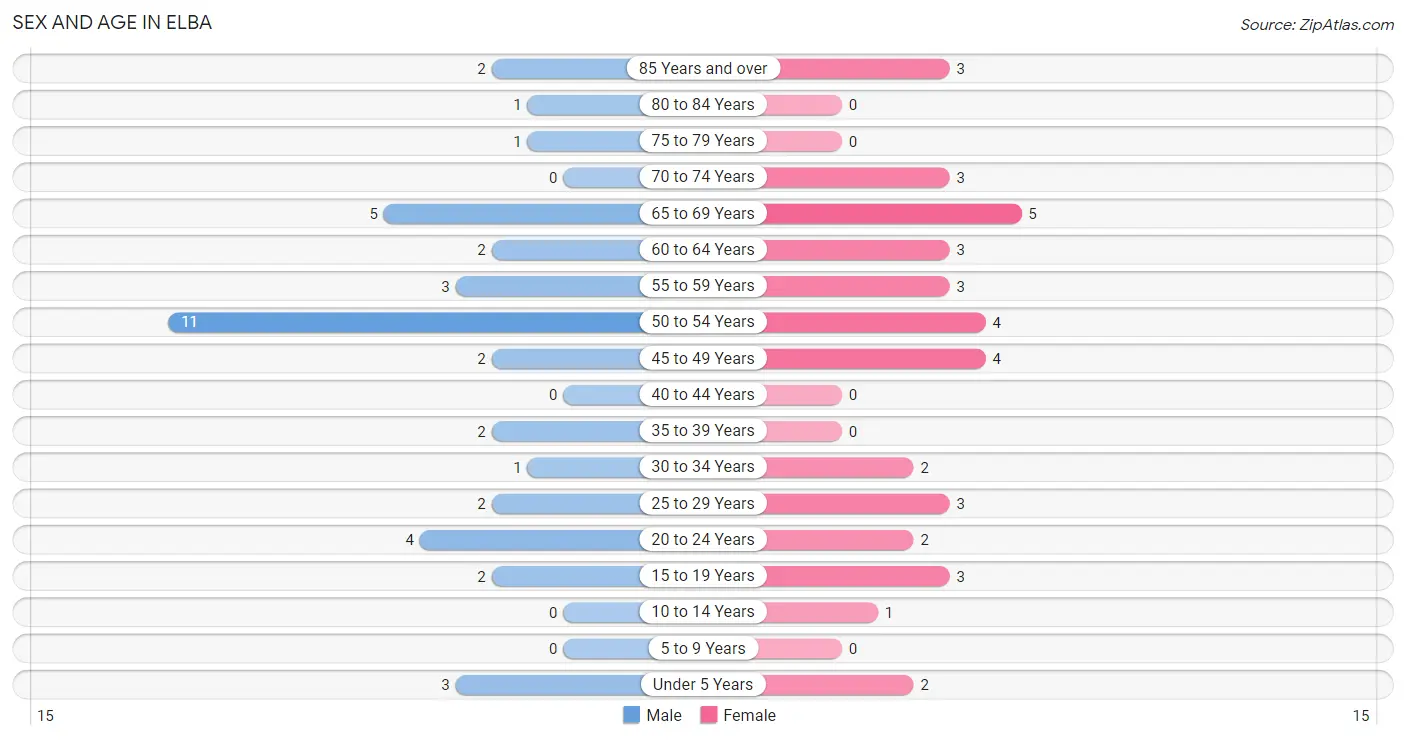
| Age Bracket | Male | Female |
| Under 5 Years | 3 (7.3%) | 2 (5.3%) |
| 5 to 9 Years | 0 (0.0%) | 0 (0.0%) |
| 10 to 14 Years | 0 (0.0%) | 1 (2.6%) |
| 15 to 19 Years | 2 (4.9%) | 3 (7.9%) |
| 20 to 24 Years | 4 (9.8%) | 2 (5.3%) |
| 25 to 29 Years | 2 (4.9%) | 3 (7.9%) |
| 30 to 34 Years | 1 (2.4%) | 2 (5.3%) |
| 35 to 39 Years | 2 (4.9%) | 0 (0.0%) |
| 40 to 44 Years | 0 (0.0%) | 0 (0.0%) |
| 45 to 49 Years | 2 (4.9%) | 4 (10.5%) |
| 50 to 54 Years | 11 (26.8%) | 4 (10.5%) |
| 55 to 59 Years | 3 (7.3%) | 3 (7.9%) |
| 60 to 64 Years | 2 (4.9%) | 3 (7.9%) |
| 65 to 69 Years | 5 (12.2%) | 5 (13.2%) |
| 70 to 74 Years | 0 (0.0%) | 3 (7.9%) |
| 75 to 79 Years | 1 (2.4%) | 0 (0.0%) |
| 80 to 84 Years | 1 (2.4%) | 0 (0.0%) |
| 85 Years and over | 2 (4.9%) | 3 (7.9%) |
| Total | 41 (100.0%) | 38 (100.0%) |
Families and Households in Elba
Median Family Size in Elba
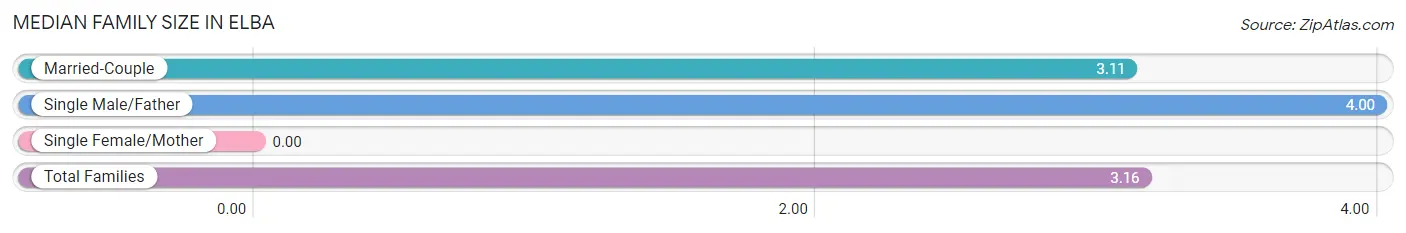
| Family Type | # Families | Family Size |
| Married-Couple | 18 (94.7%) | 3.11 |
| Single Male/Father | 1 (5.3%) | 4.00 |
| Single Female/Mother | 0 (0.0%) | - |
| Total Families | 19 (100.0%) | 3.16 |
Median Household Size in Elba
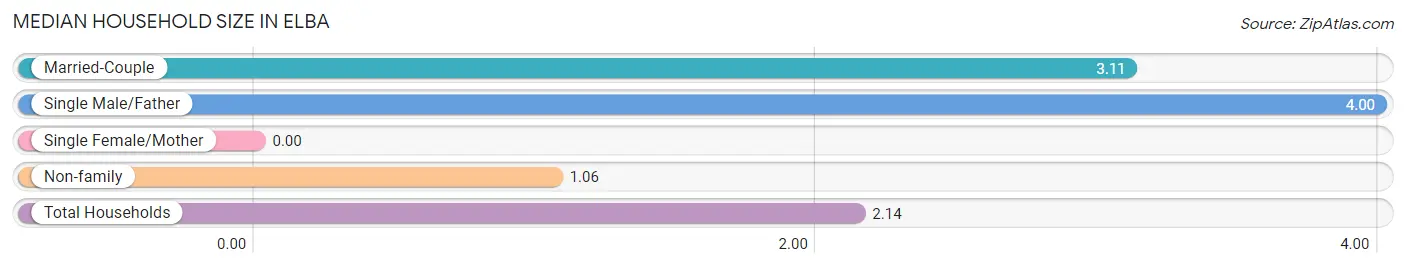
| Household Type | # Households | Household Size |
| Married-Couple | 18 (48.6%) | 3.11 |
| Single Male/Father | 1 (2.7%) | 4.00 |
| Single Female/Mother | 0 (0.0%) | - |
| Non-family | 18 (48.6%) | 1.06 |
| Total Households | 37 (100.0%) | 2.14 |
Household Size by Marriage Status in Elba
Out of a total of 37 households in Elba, 19 (51.3%) are family households, while 18 (48.6%) are nonfamily households. The most numerous type of family households are 2-person households, comprising 9, and the most common type of nonfamily households are 1-person households, comprising 17.
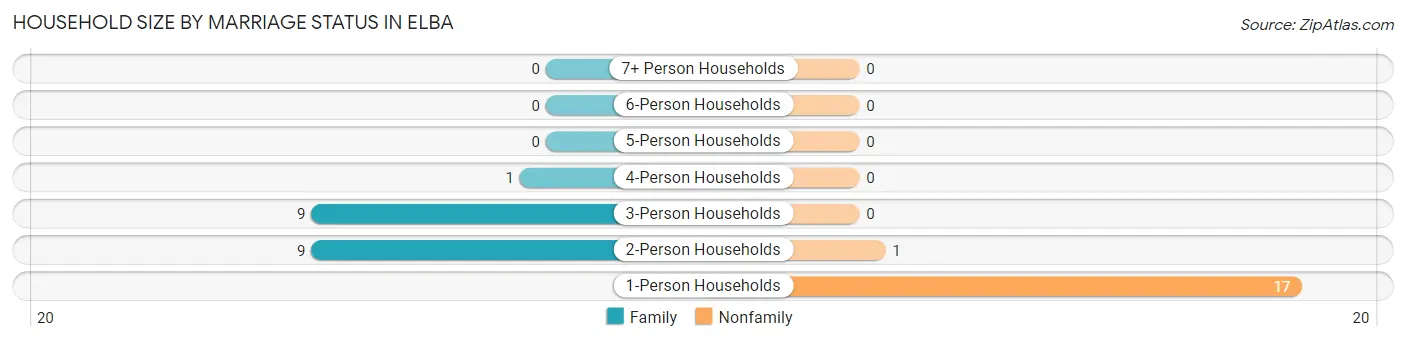
| Household Size | Family Households | Nonfamily Households |
| 1-Person Households | - | 17 (46.0%) |
| 2-Person Households | 9 (24.3%) | 1 (2.7%) |
| 3-Person Households | 9 (24.3%) | 0 (0.0%) |
| 4-Person Households | 1 (2.7%) | 0 (0.0%) |
| 5-Person Households | 0 (0.0%) | 0 (0.0%) |
| 6-Person Households | 0 (0.0%) | 0 (0.0%) |
| 7+ Person Households | 0 (0.0%) | 0 (0.0%) |
| Total | 19 (51.3%) | 18 (48.6%) |
Female Fertility in Elba
Fertility by Age in Elba
Average fertility rate in Elba is 143.0 births per 1,000 women. Women in the age bracket of 20 to 34 years have the highest fertility rate with 286.0 births per 1,000 women. Women in the age bracket of 20 to 34 years acount for 100.0% of all women with births.
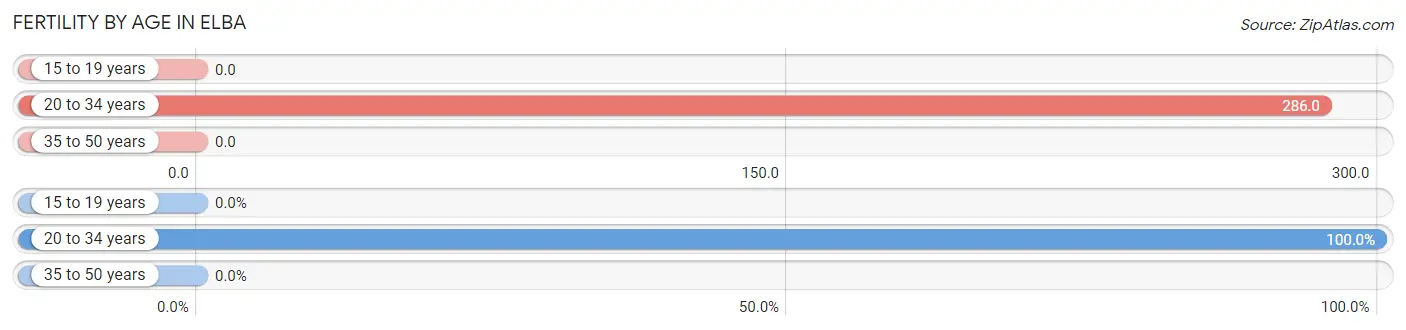
| Age Bracket | Women with Births | Births / 1,000 Women |
| 15 to 19 years | 0 (0.0%) | 0.0 |
| 20 to 34 years | 2 (100.0%) | 286.0 |
| 35 to 50 years | 0 (0.0%) | 0.0 |
| Total | 2 (100.0%) | 143.0 |
Fertility by Age by Marriage Status in Elba
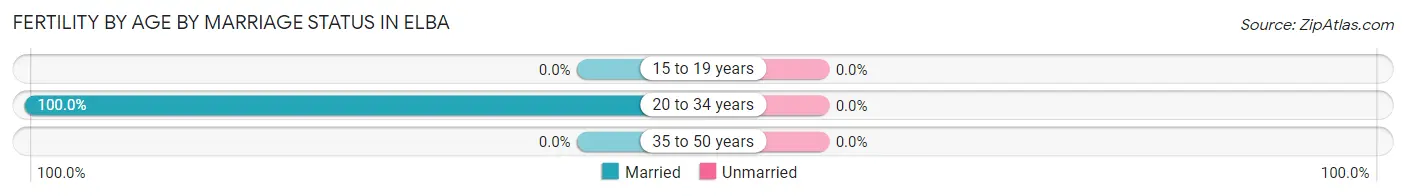
| Age Bracket | Married | Unmarried |
| 15 to 19 years | 0 (0.0%) | 0 (0.0%) |
| 20 to 34 years | 2 (100.0%) | 0 (0.0%) |
| 35 to 50 years | 0 (0.0%) | 0 (0.0%) |
| Total | 2 (100.0%) | 0 (0.0%) |
Fertility by Education in Elba
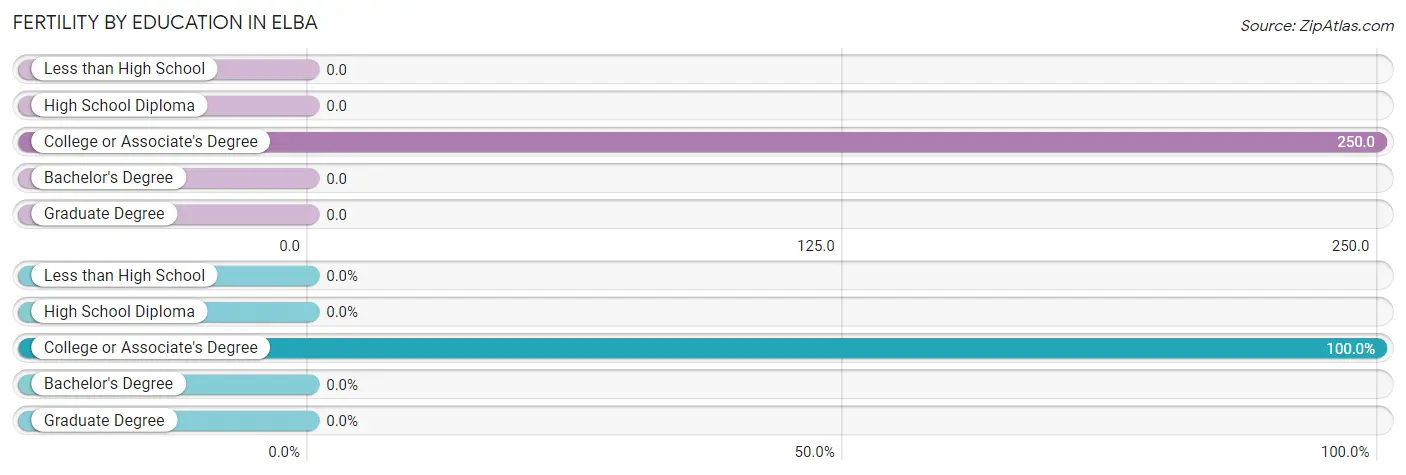
| Educational Attainment | Women with Births | Births / 1,000 Women |
| Less than High School | 0 (0.0%) | 0.0 |
| High School Diploma | 0 (0.0%) | 0.0 |
| College or Associate's Degree | 2 (100.0%) | 250.0 |
| Bachelor's Degree | 0 (0.0%) | 0.0 |
| Graduate Degree | 0 (0.0%) | 0.0 |
| Total | 2 (100.0%) | 143.0 |
Fertility by Education by Marriage Status in Elba
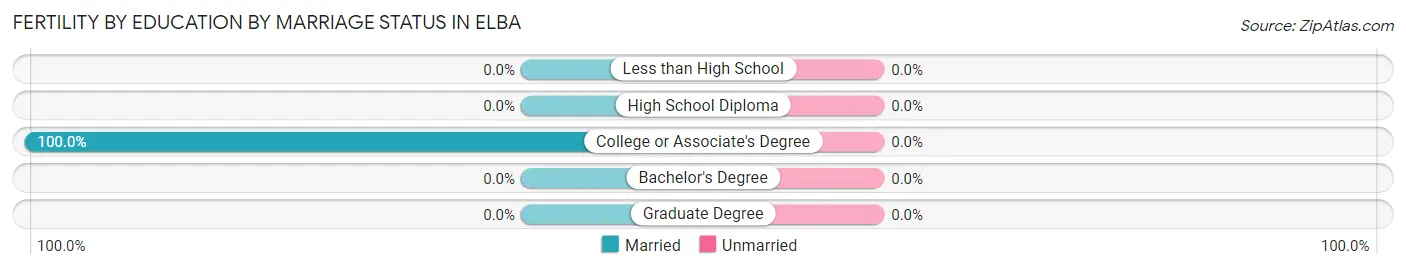
| Educational Attainment | Married | Unmarried |
| Less than High School | 0 (0.0%) | 0 (0.0%) |
| High School Diploma | 0 (0.0%) | 0 (0.0%) |
| College or Associate's Degree | 2 (100.0%) | 0 (0.0%) |
| Bachelor's Degree | 0 (0.0%) | 0 (0.0%) |
| Graduate Degree | 0 (0.0%) | 0 (0.0%) |
| Total | 2 (100.0%) | 0 (0.0%) |
Employment Characteristics in Elba
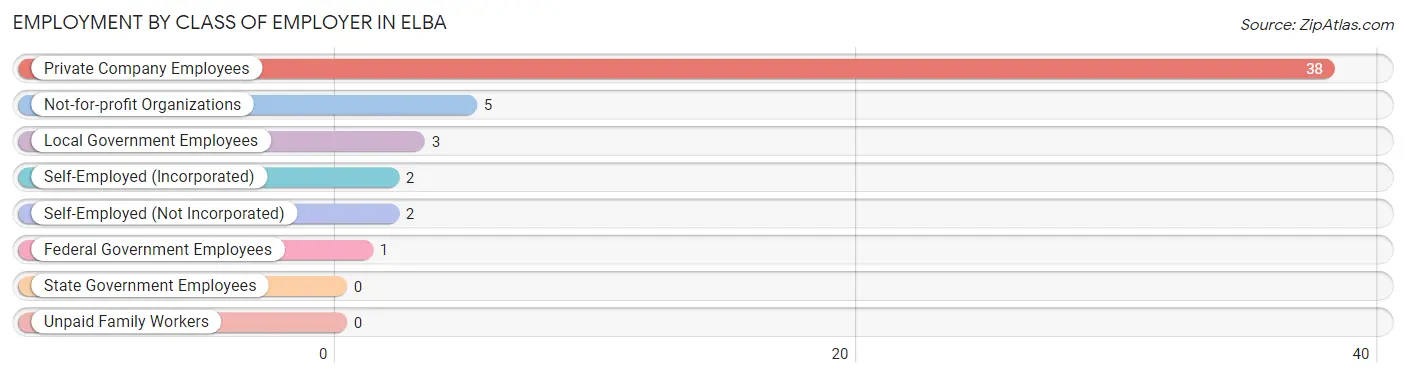
Employment by Class of Employer in Elba
Among the 51 employed individuals in Elba, private company employees (38 | 74.5%), not-for-profit organizations (5 | 9.8%), and local government employees (3 | 5.9%) make up the most common classes of employment.
| Employer Class | # Employees | % Employees |
| Private Company Employees | 38 | 74.5% |
| Self-Employed (Incorporated) | 2 | 3.9% |
| Self-Employed (Not Incorporated) | 2 | 3.9% |
| Not-for-profit Organizations | 5 | 9.8% |
| Local Government Employees | 3 | 5.9% |
| State Government Employees | 0 | 0.0% |
| Federal Government Employees | 1 | 2.0% |
| Unpaid Family Workers | 0 | 0.0% |
| Total | 51 | 100.0% |
Employment Status by Age in Elba
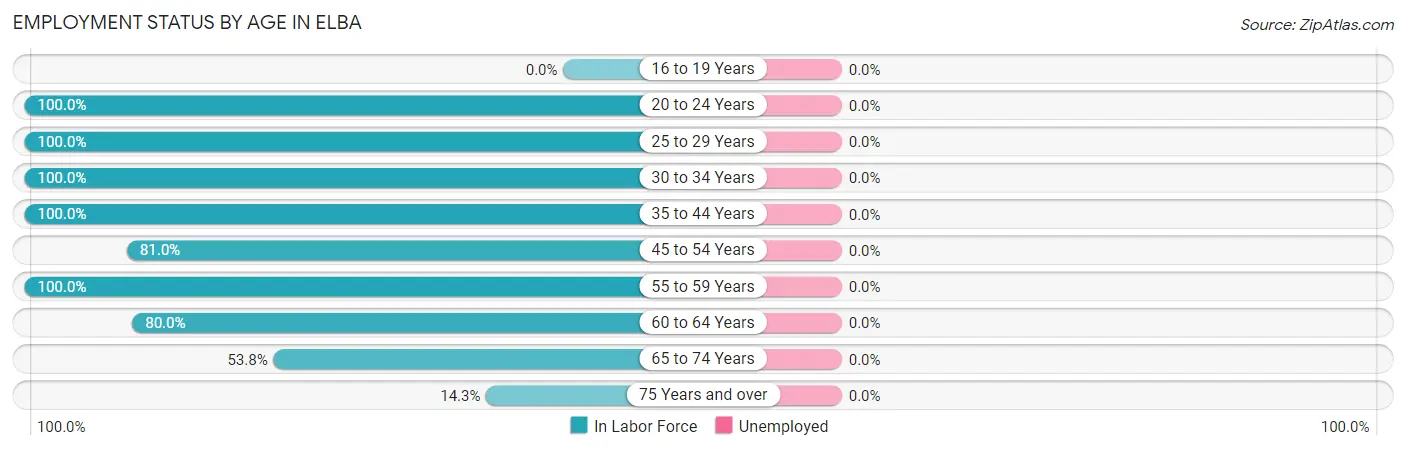
| Age Bracket | In Labor Force | Unemployed |
| 16 to 19 Years | 0 (0.0%) | 0 (0.0%) |
| 20 to 24 Years | 6 (100.0%) | 0 (0.0%) |
| 25 to 29 Years | 5 (100.0%) | 0 (0.0%) |
| 30 to 34 Years | 3 (100.0%) | 0 (0.0%) |
| 35 to 44 Years | 2 (100.0%) | 0 (0.0%) |
| 45 to 54 Years | 17 (81.0%) | 0 (0.0%) |
| 55 to 59 Years | 6 (100.0%) | 0 (0.0%) |
| 60 to 64 Years | 4 (80.0%) | 0 (0.0%) |
| 65 to 74 Years | 7 (53.8%) | 0 (0.0%) |
| 75 Years and over | 1 (14.3%) | 0 (0.0%) |
| Total | 51 (71.8%) | 0 (0.0%) |
Employment Status by Educational Attainment in Elba
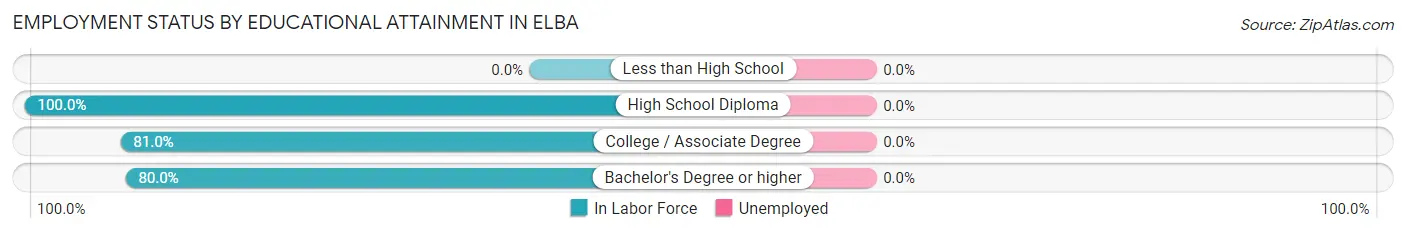
| Educational Attainment | In Labor Force | Unemployed |
| Less than High School | 0 (0.0%) | 0 (0.0%) |
| High School Diploma | 16 (100.0%) | 0 (0.0%) |
| College / Associate Degree | 17 (81.0%) | 0 (0.0%) |
| Bachelor's Degree or higher | 4 (80.0%) | 0 (0.0%) |
| Total | 37 (88.1%) | 0 (0.0%) |
Employment Occupations by Sex in Elba
Management, Business, Science and Arts Occupations
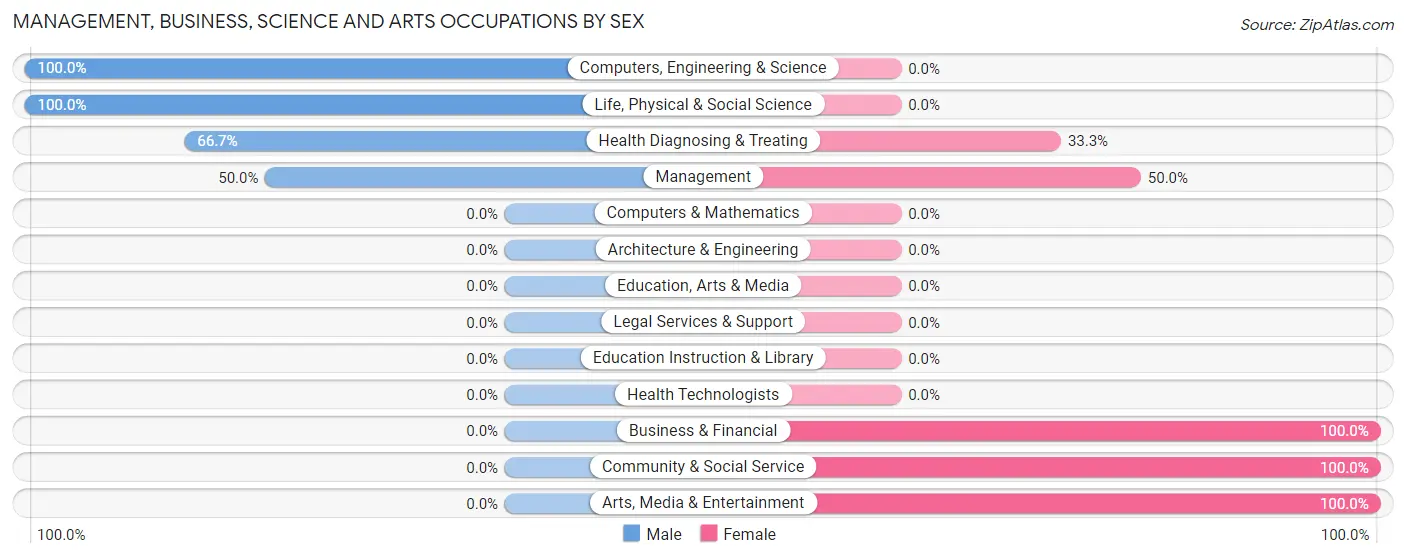
The most common Management, Business, Science and Arts occupations in Elba are Management (4 | 7.8%), Health Diagnosing & Treating (3 | 5.9%), Business & Financial (2 | 3.9%), Community & Social Service (2 | 3.9%), and Arts, Media & Entertainment (2 | 3.9%).
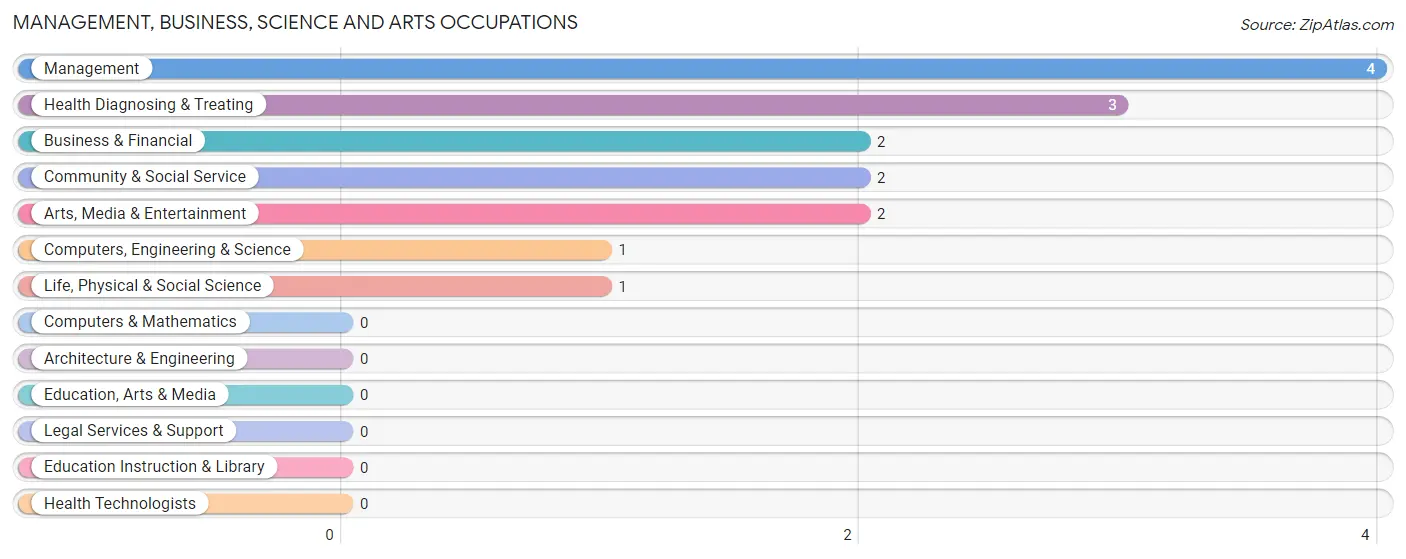
Management, Business, Science and Arts Occupations by Sex
Within the Management, Business, Science and Arts occupations in Elba, the most male-oriented occupations are Computers, Engineering & Science (100.0%), Life, Physical & Social Science (100.0%), and Health Diagnosing & Treating (66.7%), while the most female-oriented occupations are Business & Financial (100.0%), Community & Social Service (100.0%), and Arts, Media & Entertainment (100.0%).
| Occupation | Male | Female |
| Management | 2 (50.0%) | 2 (50.0%) |
| Business & Financial | 0 (0.0%) | 2 (100.0%) |
| Computers, Engineering & Science | 1 (100.0%) | 0 (0.0%) |
| Computers & Mathematics | 0 (0.0%) | 0 (0.0%) |
| Architecture & Engineering | 0 (0.0%) | 0 (0.0%) |
| Life, Physical & Social Science | 1 (100.0%) | 0 (0.0%) |
| Community & Social Service | 0 (0.0%) | 2 (100.0%) |
| Education, Arts & Media | 0 (0.0%) | 0 (0.0%) |
| Legal Services & Support | 0 (0.0%) | 0 (0.0%) |
| Education Instruction & Library | 0 (0.0%) | 0 (0.0%) |
| Arts, Media & Entertainment | 0 (0.0%) | 2 (100.0%) |
| Health Diagnosing & Treating | 2 (66.7%) | 1 (33.3%) |
| Health Technologists | 0 (0.0%) | 0 (0.0%) |
| Total (Category) | 5 (41.7%) | 7 (58.3%) |
| Total (Overall) | 31 (60.8%) | 20 (39.2%) |
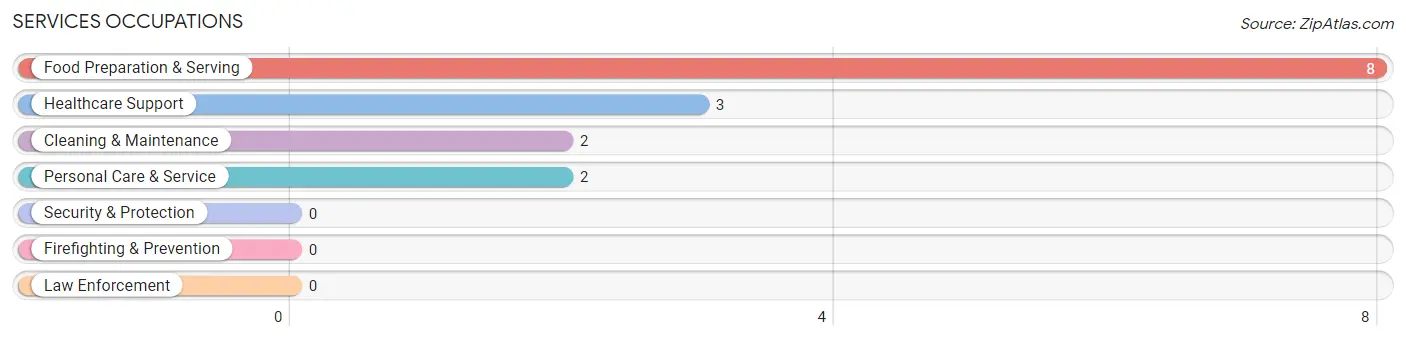
Services Occupations
The most common Services occupations in Elba are Food Preparation & Serving (8 | 15.7%), Healthcare Support (3 | 5.9%), Cleaning & Maintenance (2 | 3.9%), and Personal Care & Service (2 | 3.9%).
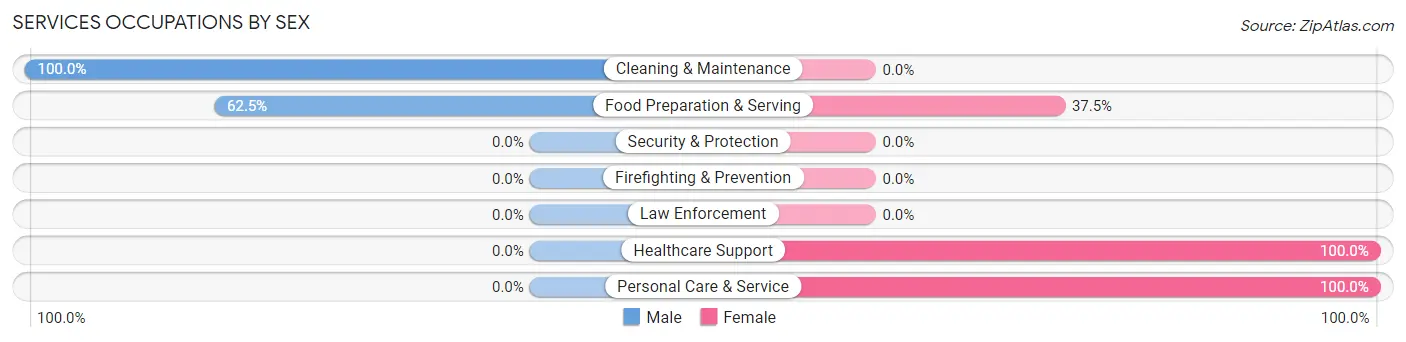
Services Occupations by Sex
Within the Services occupations in Elba, the most male-oriented occupations are Cleaning & Maintenance (100.0%), and Food Preparation & Serving (62.5%), while the most female-oriented occupations are Healthcare Support (100.0%), Personal Care & Service (100.0%), and Food Preparation & Serving (37.5%).
| Occupation | Male | Female |
| Healthcare Support | 0 (0.0%) | 3 (100.0%) |
| Security & Protection | 0 (0.0%) | 0 (0.0%) |
| Firefighting & Prevention | 0 (0.0%) | 0 (0.0%) |
| Law Enforcement | 0 (0.0%) | 0 (0.0%) |
| Food Preparation & Serving | 5 (62.5%) | 3 (37.5%) |
| Cleaning & Maintenance | 2 (100.0%) | 0 (0.0%) |
| Personal Care & Service | 0 (0.0%) | 2 (100.0%) |
| Total (Category) | 7 (46.7%) | 8 (53.3%) |
| Total (Overall) | 31 (60.8%) | 20 (39.2%) |
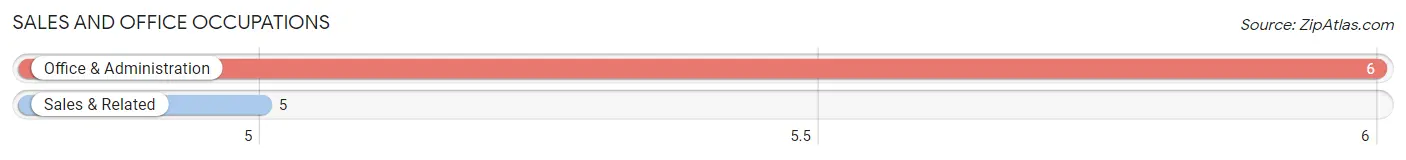
Sales and Office Occupations
The most common Sales and Office occupations in Elba are Office & Administration (6 | 11.8%), and Sales & Related (5 | 9.8%).
Sales and Office Occupations by Sex

| Occupation | Male | Female |
| Sales & Related | 5 (100.0%) | 0 (0.0%) |
| Office & Administration | 1 (16.7%) | 5 (83.3%) |
| Total (Category) | 6 (54.5%) | 5 (45.5%) |
| Total (Overall) | 31 (60.8%) | 20 (39.2%) |
Natural Resources, Construction and Maintenance Occupations
The most common Natural Resources, Construction and Maintenance occupations in Elba are , and Construction & Extraction (1 | 2.0%).
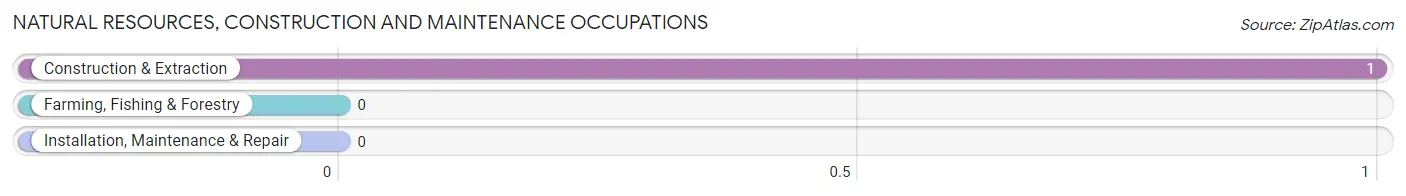
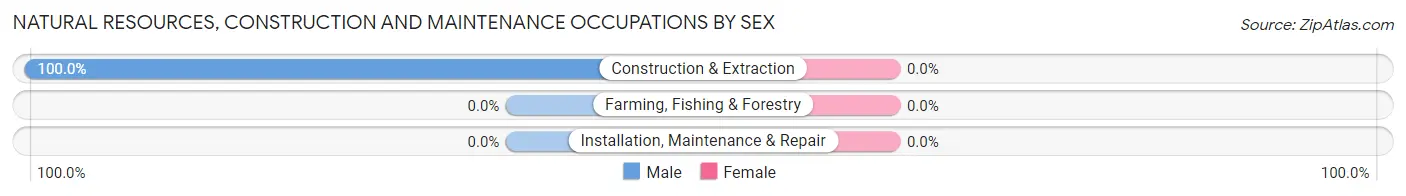
Natural Resources, Construction and Maintenance Occupations by Sex
| Occupation | Male | Female |
| Farming, Fishing & Forestry | 0 (0.0%) | 0 (0.0%) |
| Construction & Extraction | 1 (100.0%) | 0 (0.0%) |
| Installation, Maintenance & Repair | 0 (0.0%) | 0 (0.0%) |
| Total (Category) | 1 (100.0%) | 0 (0.0%) |
| Total (Overall) | 31 (60.8%) | 20 (39.2%) |
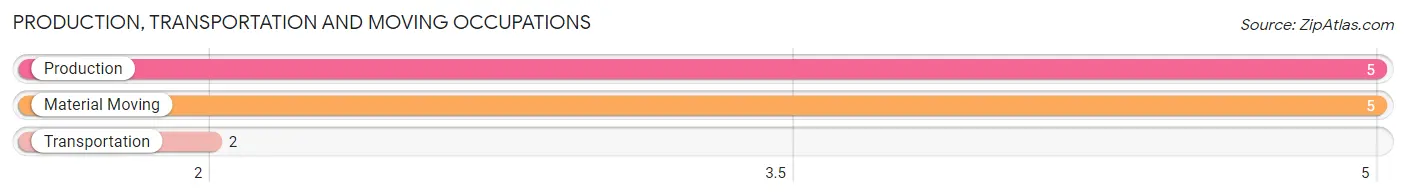
Production, Transportation and Moving Occupations
The most common Production, Transportation and Moving occupations in Elba are Production (5 | 9.8%), Material Moving (5 | 9.8%), and Transportation (2 | 3.9%).
Production, Transportation and Moving Occupations by Sex
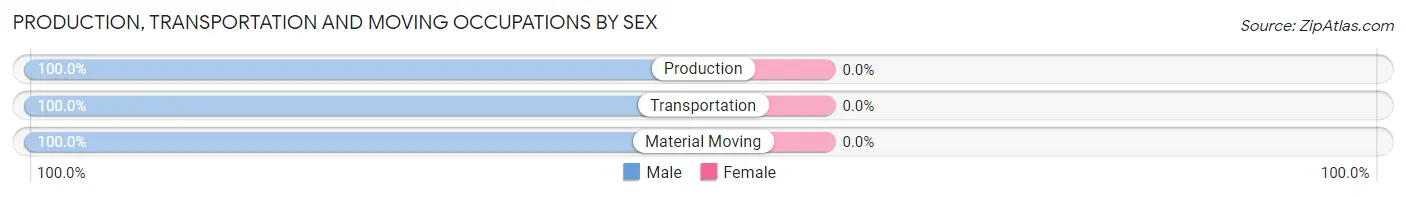
| Occupation | Male | Female |
| Production | 5 (100.0%) | 0 (0.0%) |
| Transportation | 2 (100.0%) | 0 (0.0%) |
| Material Moving | 5 (100.0%) | 0 (0.0%) |
| Total (Category) | 12 (100.0%) | 0 (0.0%) |
| Total (Overall) | 31 (60.8%) | 20 (39.2%) |
Employment Industries by Sex in Elba
Employment Industries in Elba
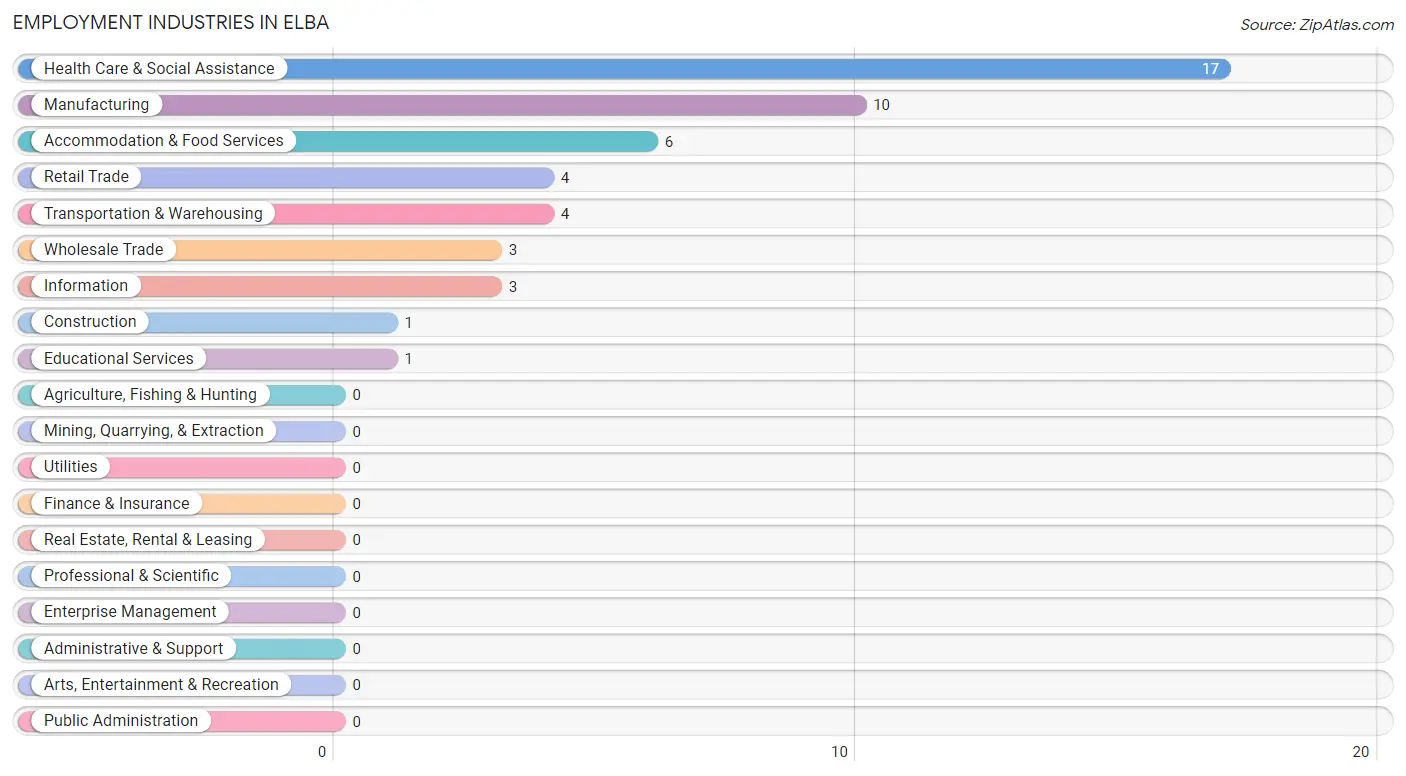
The major employment industries in Elba include Health Care & Social Assistance (17 | 33.3%), Manufacturing (10 | 19.6%), Accommodation & Food Services (6 | 11.8%), Retail Trade (4 | 7.8%), and Transportation & Warehousing (4 | 7.8%).
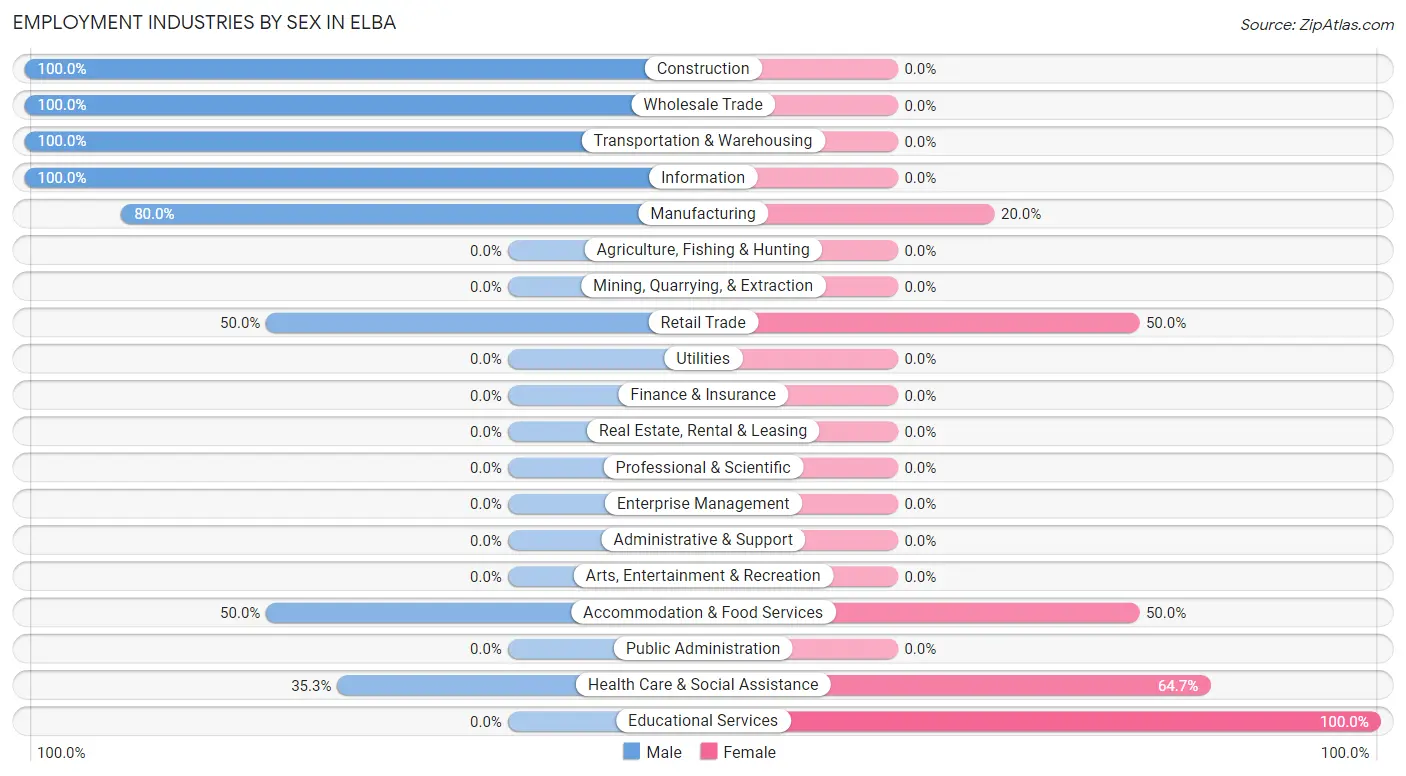
Employment Industries by Sex in Elba
The Elba industries that see more men than women are Construction (100.0%), Wholesale Trade (100.0%), and Transportation & Warehousing (100.0%), whereas the industries that tend to have a higher number of women are Educational Services (100.0%), Health Care & Social Assistance (64.7%), and Retail Trade (50.0%).
| Industry | Male | Female |
| Agriculture, Fishing & Hunting | 0 (0.0%) | 0 (0.0%) |
| Mining, Quarrying, & Extraction | 0 (0.0%) | 0 (0.0%) |
| Construction | 1 (100.0%) | 0 (0.0%) |
| Manufacturing | 8 (80.0%) | 2 (20.0%) |
| Wholesale Trade | 3 (100.0%) | 0 (0.0%) |
| Retail Trade | 2 (50.0%) | 2 (50.0%) |
| Transportation & Warehousing | 4 (100.0%) | 0 (0.0%) |
| Utilities | 0 (0.0%) | 0 (0.0%) |
| Information | 3 (100.0%) | 0 (0.0%) |
| Finance & Insurance | 0 (0.0%) | 0 (0.0%) |
| Real Estate, Rental & Leasing | 0 (0.0%) | 0 (0.0%) |
| Professional & Scientific | 0 (0.0%) | 0 (0.0%) |
| Enterprise Management | 0 (0.0%) | 0 (0.0%) |
| Administrative & Support | 0 (0.0%) | 0 (0.0%) |
| Educational Services | 0 (0.0%) | 1 (100.0%) |
| Health Care & Social Assistance | 6 (35.3%) | 11 (64.7%) |
| Arts, Entertainment & Recreation | 0 (0.0%) | 0 (0.0%) |
| Accommodation & Food Services | 3 (50.0%) | 3 (50.0%) |
| Public Administration | 0 (0.0%) | 0 (0.0%) |
| Total | 31 (60.8%) | 20 (39.2%) |
Education in Elba
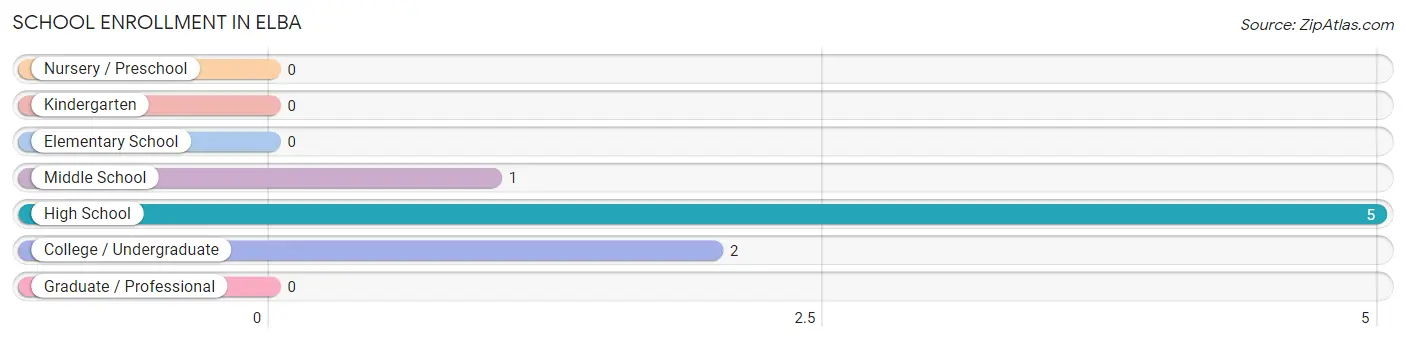
School Enrollment in Elba
The most common levels of schooling among the 8 students in Elba are high school (5 | 62.5%), college / undergraduate (2 | 25.0%), and middle school (1 | 12.5%).
| School Level | # Students | % Students |
| Nursery / Preschool | 0 | 0.0% |
| Kindergarten | 0 | 0.0% |
| Elementary School | 0 | 0.0% |
| Middle School | 1 | 12.5% |
| High School | 5 | 62.5% |
| College / Undergraduate | 2 | 25.0% |
| Graduate / Professional | 0 | 0.0% |
| Total | 8 | 100.0% |
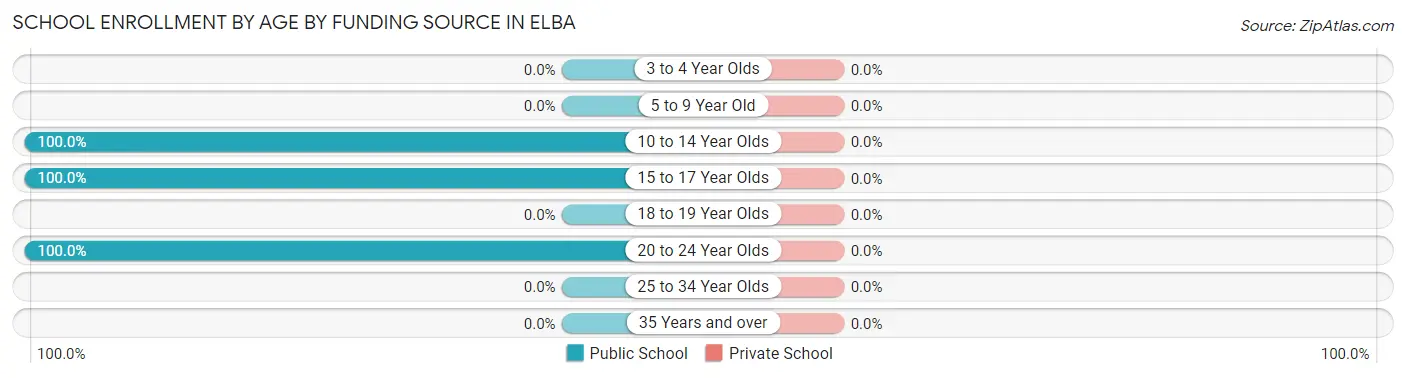
School Enrollment by Age by Funding Source in Elba
| Age Bracket | Public School | Private School |
| 3 to 4 Year Olds | 0 (0.0%) | 0 (0.0%) |
| 5 to 9 Year Old | 0 (0.0%) | 0 (0.0%) |
| 10 to 14 Year Olds | 1 (100.0%) | 0 (0.0%) |
| 15 to 17 Year Olds | 5 (100.0%) | 0 (0.0%) |
| 18 to 19 Year Olds | 0 (0.0%) | 0 (0.0%) |
| 20 to 24 Year Olds | 2 (100.0%) | 0 (0.0%) |
| 25 to 34 Year Olds | 0 (0.0%) | 0 (0.0%) |
| 35 Years and over | 0 (0.0%) | 0 (0.0%) |
| Total | 8 (100.0%) | 0 (0.0%) |
Educational Attainment by Field of Study in Elba
Science & technology (3 | 60.0%), computers & mathematics (1 | 20.0%), and bio, nature & agricultural (1 | 20.0%) are the most common fields of study among 5 individuals in Elba who have obtained a bachelor's degree or higher.
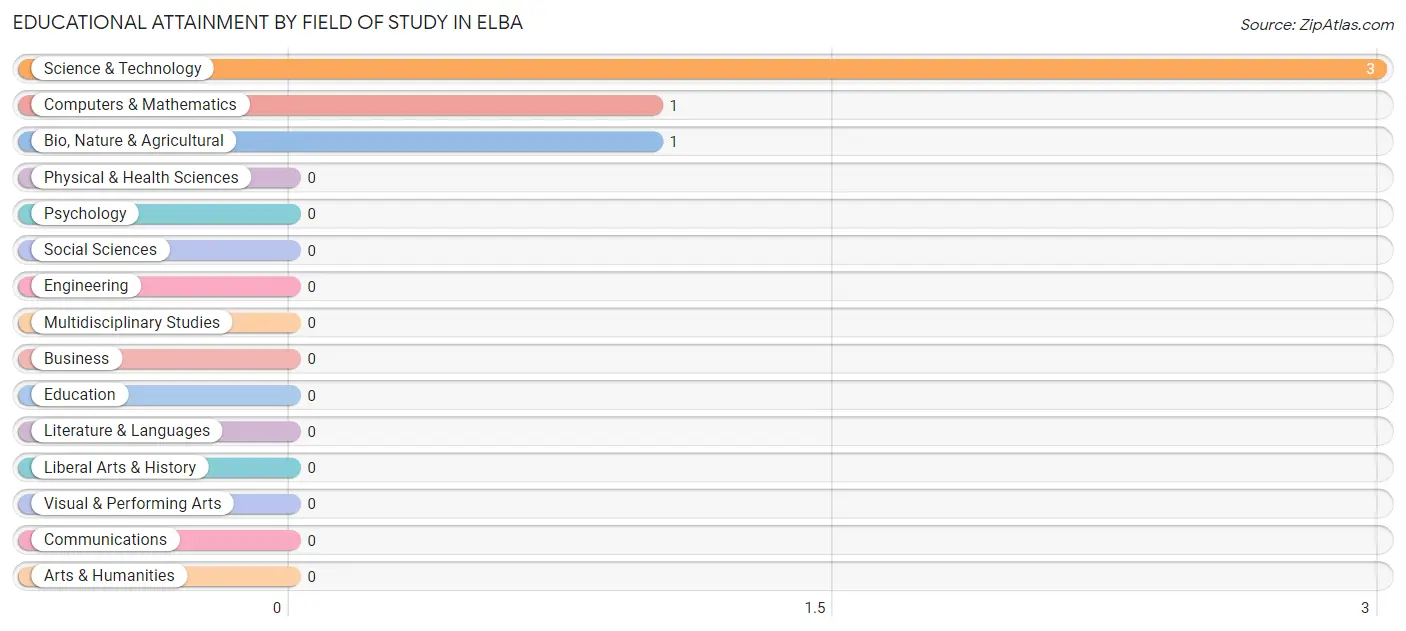
| Field of Study | # Graduates | % Graduates |
| Computers & Mathematics | 1 | 20.0% |
| Bio, Nature & Agricultural | 1 | 20.0% |
| Physical & Health Sciences | 0 | 0.0% |
| Psychology | 0 | 0.0% |
| Social Sciences | 0 | 0.0% |
| Engineering | 0 | 0.0% |
| Multidisciplinary Studies | 0 | 0.0% |
| Science & Technology | 3 | 60.0% |
| Business | 0 | 0.0% |
| Education | 0 | 0.0% |
| Literature & Languages | 0 | 0.0% |
| Liberal Arts & History | 0 | 0.0% |
| Visual & Performing Arts | 0 | 0.0% |
| Communications | 0 | 0.0% |
| Arts & Humanities | 0 | 0.0% |
| Total | 5 | 100.0% |
Transportation & Commute in Elba
Vehicle Availability by Sex in Elba
The most prevalent vehicle ownership categories in Elba are males with 3 vehicles (14, accounting for 45.2%) and females with 3 vehicles (10, making up 70.0%).
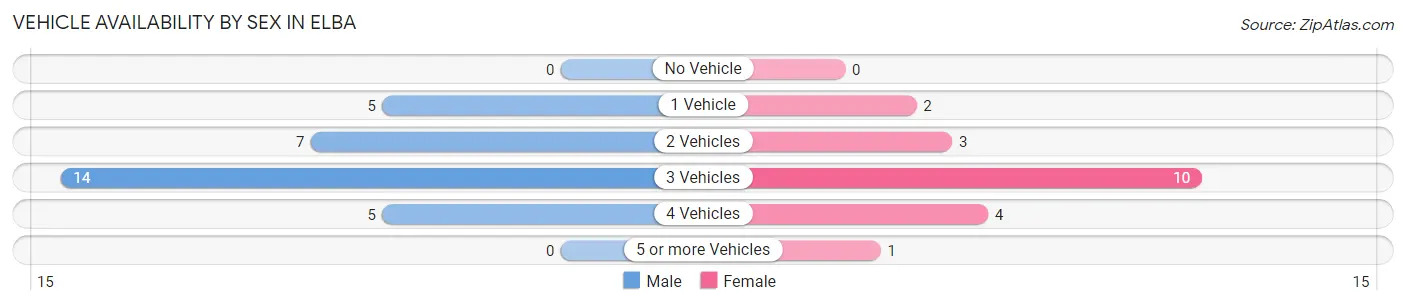
| Vehicles Available | Male | Female |
| No Vehicle | 0 (0.0%) | 0 (0.0%) |
| 1 Vehicle | 5 (16.1%) | 2 (10.0%) |
| 2 Vehicles | 7 (22.6%) | 3 (15.0%) |
| 3 Vehicles | 14 (45.2%) | 10 (50.0%) |
| 4 Vehicles | 5 (16.1%) | 4 (20.0%) |
| 5 or more Vehicles | 0 (0.0%) | 1 (5.0%) |
| Total | 31 (100.0%) | 20 (100.0%) |
Commute Time in Elba
The most frequently occuring commute durations in Elba are 30 to 34 minutes (12 commuters, 25.0%), 40 to 44 minutes (9 commuters, 18.8%), and 5 to 9 minutes (7 commuters, 14.6%).
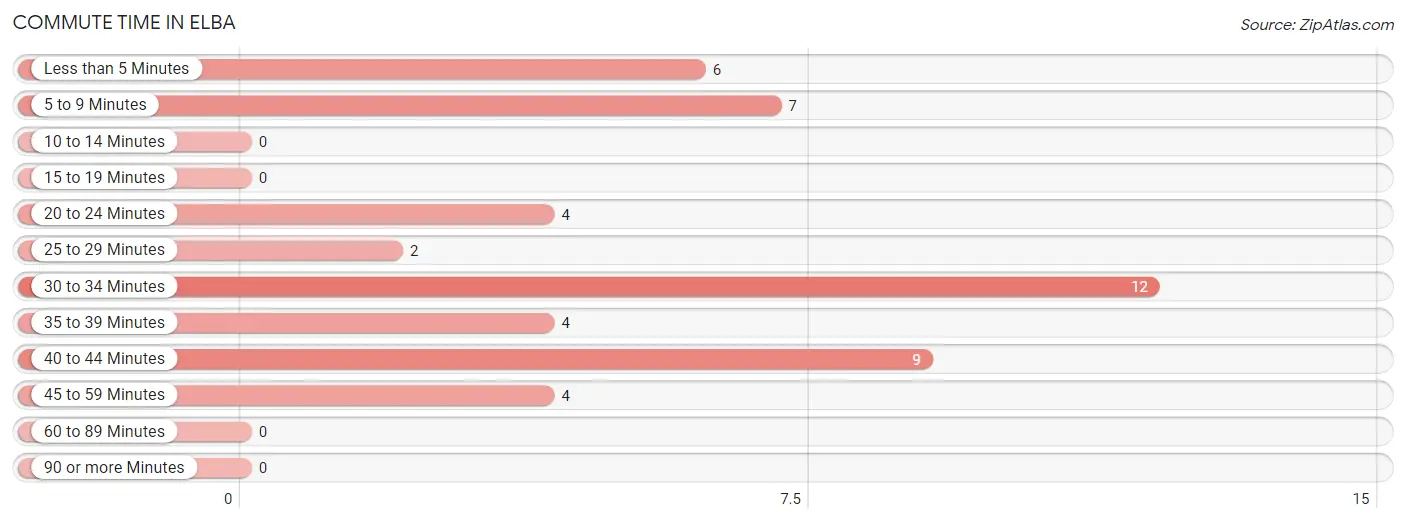
| Commute Time | # Commuters | % Commuters |
| Less than 5 Minutes | 6 | 12.5% |
| 5 to 9 Minutes | 7 | 14.6% |
| 10 to 14 Minutes | 0 | 0.0% |
| 15 to 19 Minutes | 0 | 0.0% |
| 20 to 24 Minutes | 4 | 8.3% |
| 25 to 29 Minutes | 2 | 4.2% |
| 30 to 34 Minutes | 12 | 25.0% |
| 35 to 39 Minutes | 4 | 8.3% |
| 40 to 44 Minutes | 9 | 18.8% |
| 45 to 59 Minutes | 4 | 8.3% |
| 60 to 89 Minutes | 0 | 0.0% |
| 90 or more Minutes | 0 | 0.0% |
Commute Time by Sex in Elba
The most common commute times in Elba are less than 5 minutes (6 commuters, 21.4%) for males and 30 to 34 minutes (6 commuters, 30.0%) for females.
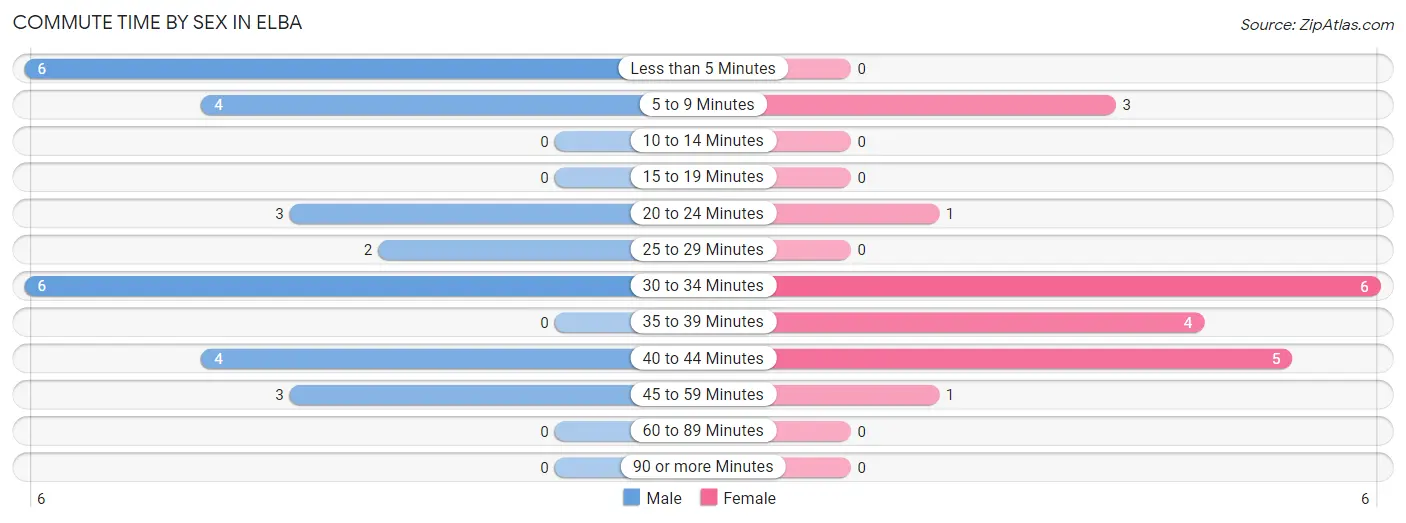
| Commute Time | Male | Female |
| Less than 5 Minutes | 6 (21.4%) | 0 (0.0%) |
| 5 to 9 Minutes | 4 (14.3%) | 3 (15.0%) |
| 10 to 14 Minutes | 0 (0.0%) | 0 (0.0%) |
| 15 to 19 Minutes | 0 (0.0%) | 0 (0.0%) |
| 20 to 24 Minutes | 3 (10.7%) | 1 (5.0%) |
| 25 to 29 Minutes | 2 (7.1%) | 0 (0.0%) |
| 30 to 34 Minutes | 6 (21.4%) | 6 (30.0%) |
| 35 to 39 Minutes | 0 (0.0%) | 4 (20.0%) |
| 40 to 44 Minutes | 4 (14.3%) | 5 (25.0%) |
| 45 to 59 Minutes | 3 (10.7%) | 1 (5.0%) |
| 60 to 89 Minutes | 0 (0.0%) | 0 (0.0%) |
| 90 or more Minutes | 0 (0.0%) | 0 (0.0%) |
Time of Departure to Work by Sex in Elba
The most frequent times of departure to work in Elba are 6:30 AM to 6:59 AM (6, 21.4%) for males and 5:30 AM to 5:59 AM (4, 20.0%) for females.
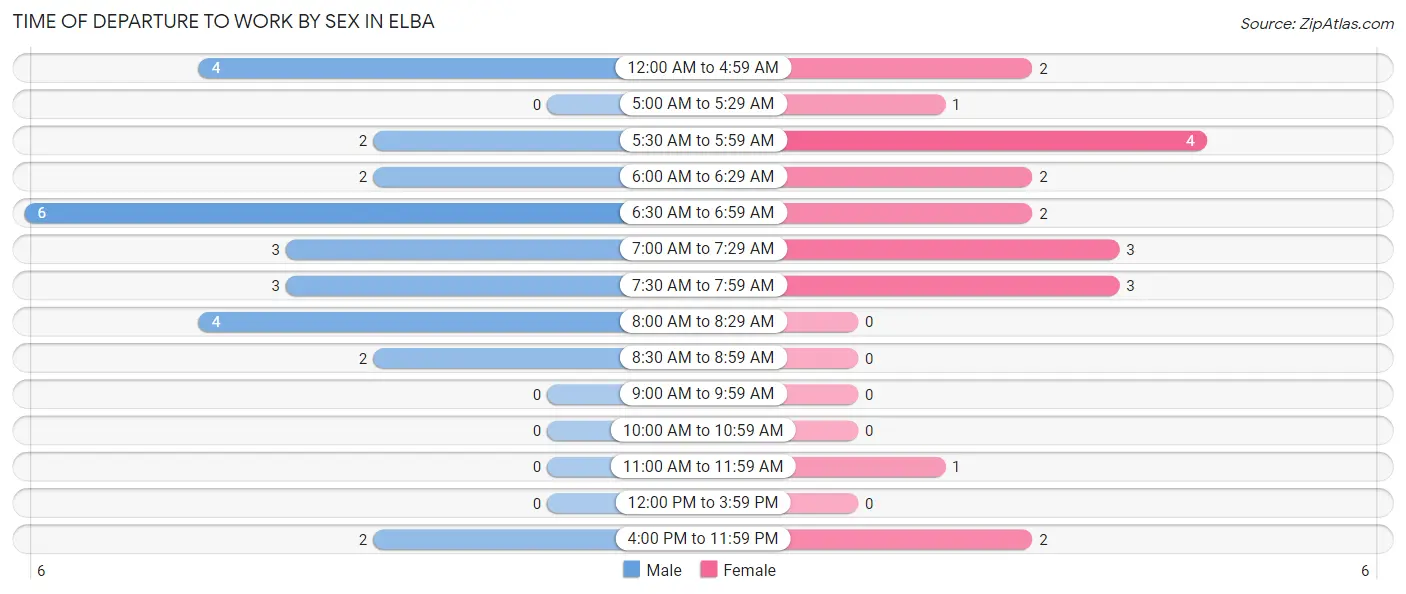
| Time of Departure | Male | Female |
| 12:00 AM to 4:59 AM | 4 (14.3%) | 2 (10.0%) |
| 5:00 AM to 5:29 AM | 0 (0.0%) | 1 (5.0%) |
| 5:30 AM to 5:59 AM | 2 (7.1%) | 4 (20.0%) |
| 6:00 AM to 6:29 AM | 2 (7.1%) | 2 (10.0%) |
| 6:30 AM to 6:59 AM | 6 (21.4%) | 2 (10.0%) |
| 7:00 AM to 7:29 AM | 3 (10.7%) | 3 (15.0%) |
| 7:30 AM to 7:59 AM | 3 (10.7%) | 3 (15.0%) |
| 8:00 AM to 8:29 AM | 4 (14.3%) | 0 (0.0%) |
| 8:30 AM to 8:59 AM | 2 (7.1%) | 0 (0.0%) |
| 9:00 AM to 9:59 AM | 0 (0.0%) | 0 (0.0%) |
| 10:00 AM to 10:59 AM | 0 (0.0%) | 0 (0.0%) |
| 11:00 AM to 11:59 AM | 0 (0.0%) | 1 (5.0%) |
| 12:00 PM to 3:59 PM | 0 (0.0%) | 0 (0.0%) |
| 4:00 PM to 11:59 PM | 2 (7.1%) | 2 (10.0%) |
| Total | 28 (100.0%) | 20 (100.0%) |
Housing Occupancy in Elba
Occupancy by Ownership in Elba
Of the total 37 dwellings in Elba, owner-occupied units account for 34 (91.9%), while renter-occupied units make up 3 (8.1%).
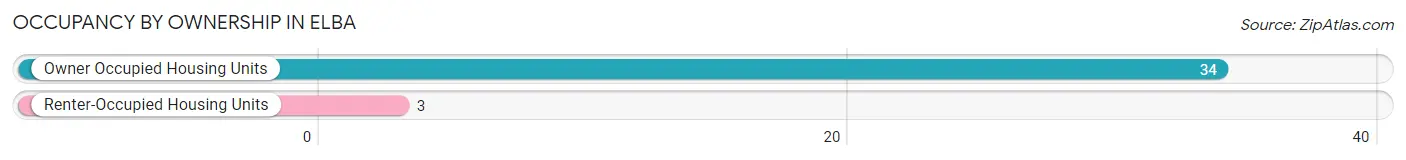
| Occupancy | # Housing Units | % Housing Units |
| Owner Occupied Housing Units | 34 | 91.9% |
| Renter-Occupied Housing Units | 3 | 8.1% |
| Total Occupied Housing Units | 37 | 100.0% |
Occupancy by Household Size in Elba
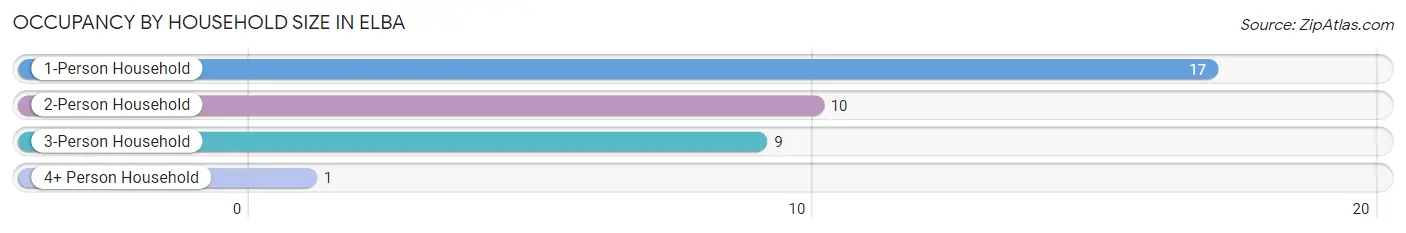
| Household Size | # Housing Units | % Housing Units |
| 1-Person Household | 17 | 46.0% |
| 2-Person Household | 10 | 27.0% |
| 3-Person Household | 9 | 24.3% |
| 4+ Person Household | 1 | 2.7% |
| Total Housing Units | 37 | 100.0% |
Occupancy by Ownership by Household Size in Elba
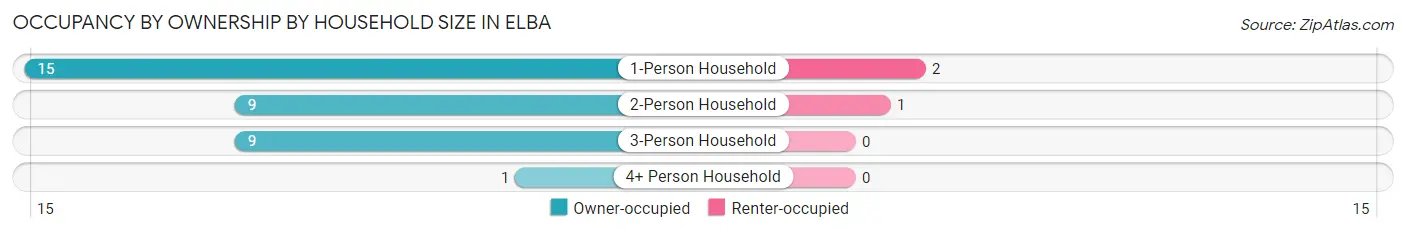
| Household Size | Owner-occupied | Renter-occupied |
| 1-Person Household | 15 (88.2%) | 2 (11.8%) |
| 2-Person Household | 9 (90.0%) | 1 (10.0%) |
| 3-Person Household | 9 (100.0%) | 0 (0.0%) |
| 4+ Person Household | 1 (100.0%) | 0 (0.0%) |
| Total Housing Units | 34 (91.9%) | 3 (8.1%) |
Occupancy by Educational Attainment in Elba
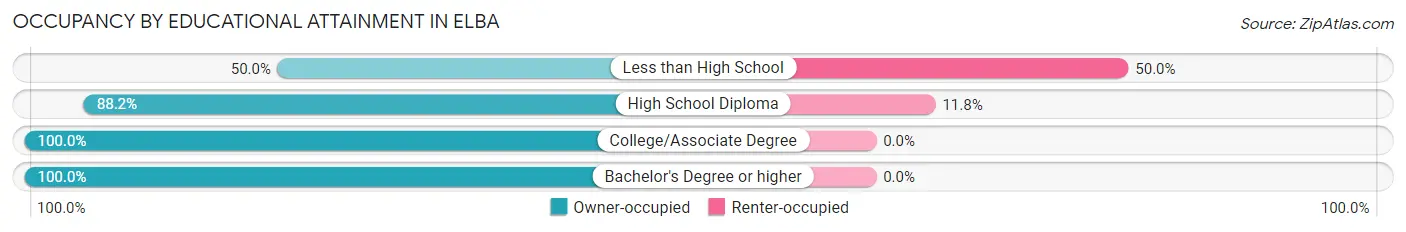
| Household Size | Owner-occupied | Renter-occupied |
| Less than High School | 1 (50.0%) | 1 (50.0%) |
| High School Diploma | 15 (88.2%) | 2 (11.8%) |
| College/Associate Degree | 16 (100.0%) | 0 (0.0%) |
| Bachelor's Degree or higher | 2 (100.0%) | 0 (0.0%) |
Occupancy by Age of Householder in Elba
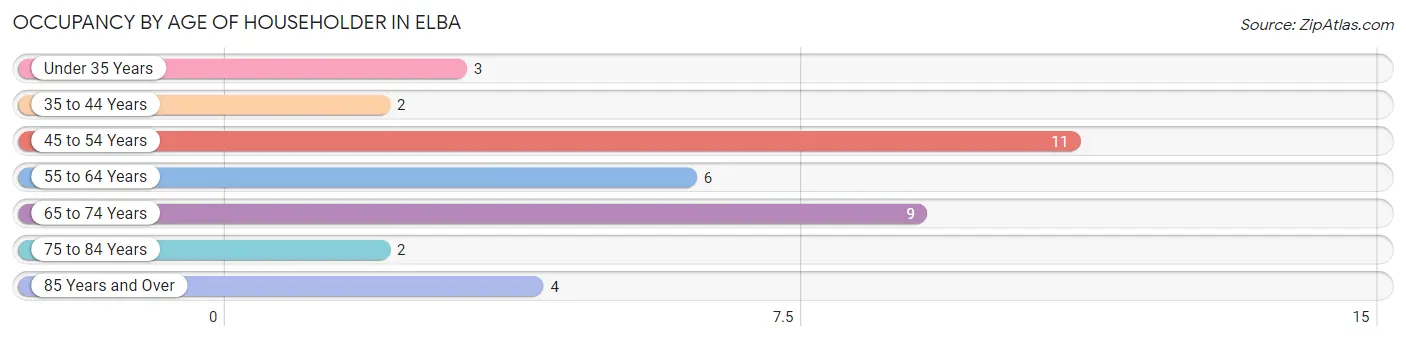
| Age Bracket | # Households | % Households |
| Under 35 Years | 3 | 8.1% |
| 35 to 44 Years | 2 | 5.4% |
| 45 to 54 Years | 11 | 29.7% |
| 55 to 64 Years | 6 | 16.2% |
| 65 to 74 Years | 9 | 24.3% |
| 75 to 84 Years | 2 | 5.4% |
| 85 Years and Over | 4 | 10.8% |
| Total | 37 | 100.0% |
Housing Finances in Elba
Median Income by Occupancy in Elba
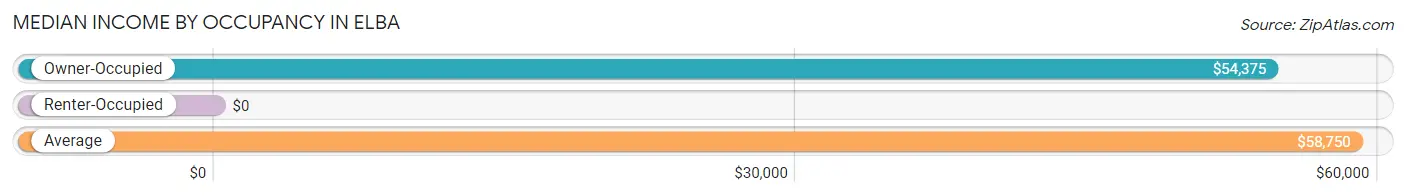
| Occupancy Type | # Households | Median Income |
| Owner-Occupied | 34 (91.9%) | $54,375 |
| Renter-Occupied | 3 (8.1%) | $0 |
| Average | 37 (100.0%) | $58,750 |
Occupancy by Householder Income Bracket in Elba
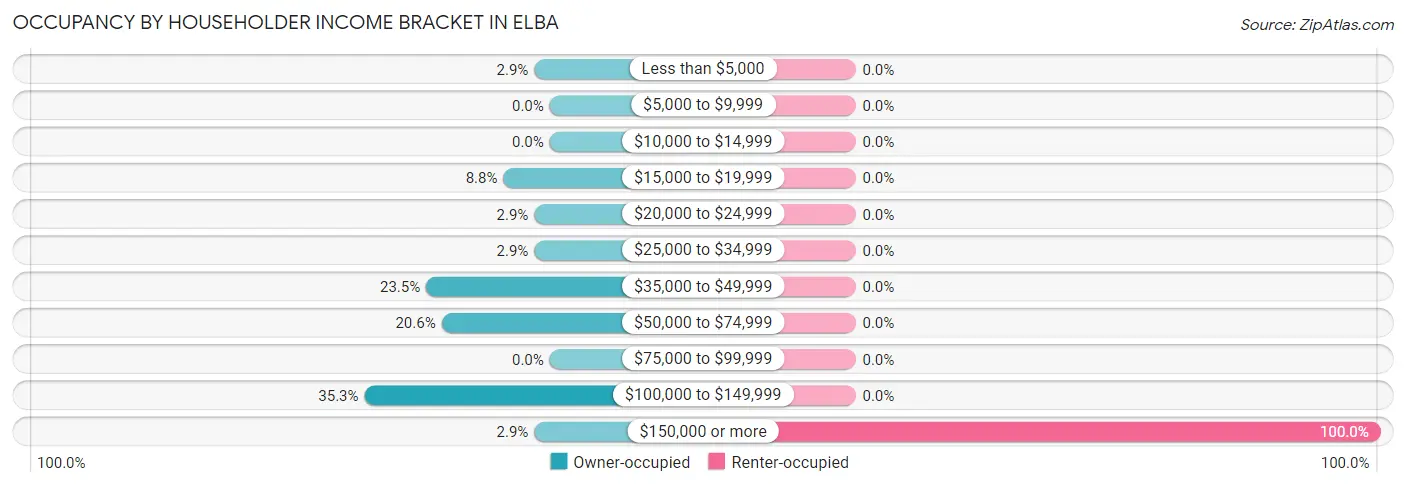
| Income Bracket | Owner-occupied | Renter-occupied |
| Less than $5,000 | 1 (2.9%) | 0 (0.0%) |
| $5,000 to $9,999 | 0 (0.0%) | 0 (0.0%) |
| $10,000 to $14,999 | 0 (0.0%) | 0 (0.0%) |
| $15,000 to $19,999 | 3 (8.8%) | 0 (0.0%) |
| $20,000 to $24,999 | 1 (2.9%) | 0 (0.0%) |
| $25,000 to $34,999 | 1 (2.9%) | 0 (0.0%) |
| $35,000 to $49,999 | 8 (23.5%) | 0 (0.0%) |
| $50,000 to $74,999 | 7 (20.6%) | 0 (0.0%) |
| $75,000 to $99,999 | 0 (0.0%) | 0 (0.0%) |
| $100,000 to $149,999 | 12 (35.3%) | 0 (0.0%) |
| $150,000 or more | 1 (2.9%) | 3 (100.0%) |
| Total | 34 (100.0%) | 3 (100.0%) |
Monthly Housing Cost Tiers in Elba
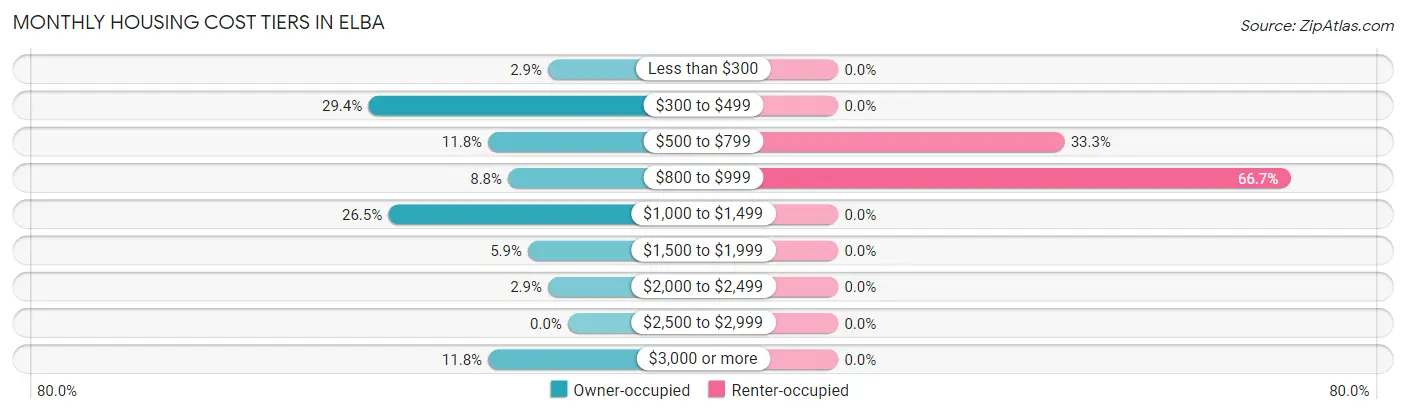
| Monthly Cost | Owner-occupied | Renter-occupied |
| Less than $300 | 1 (2.9%) | 0 (0.0%) |
| $300 to $499 | 10 (29.4%) | 0 (0.0%) |
| $500 to $799 | 4 (11.8%) | 1 (33.3%) |
| $800 to $999 | 3 (8.8%) | 2 (66.7%) |
| $1,000 to $1,499 | 9 (26.5%) | 0 (0.0%) |
| $1,500 to $1,999 | 2 (5.9%) | 0 (0.0%) |
| $2,000 to $2,499 | 1 (2.9%) | 0 (0.0%) |
| $2,500 to $2,999 | 0 (0.0%) | 0 (0.0%) |
| $3,000 or more | 4 (11.8%) | 0 (0.0%) |
| Total | 34 (100.0%) | 3 (100.0%) |
Physical Housing Characteristics in Elba
Housing Structures in Elba
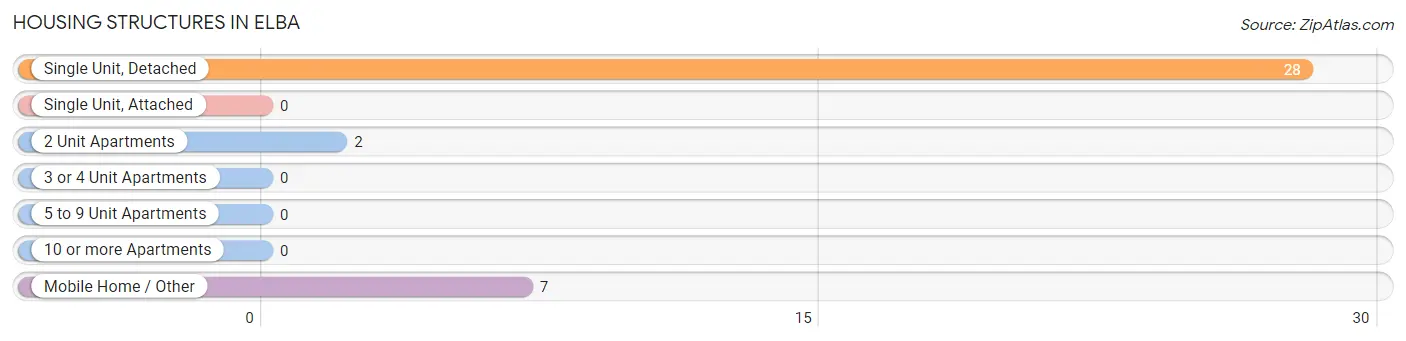
| Structure Type | # Housing Units | % Housing Units |
| Single Unit, Detached | 28 | 75.7% |
| Single Unit, Attached | 0 | 0.0% |
| 2 Unit Apartments | 2 | 5.4% |
| 3 or 4 Unit Apartments | 0 | 0.0% |
| 5 to 9 Unit Apartments | 0 | 0.0% |
| 10 or more Apartments | 0 | 0.0% |
| Mobile Home / Other | 7 | 18.9% |
| Total | 37 | 100.0% |
Housing Structures by Occupancy in Elba
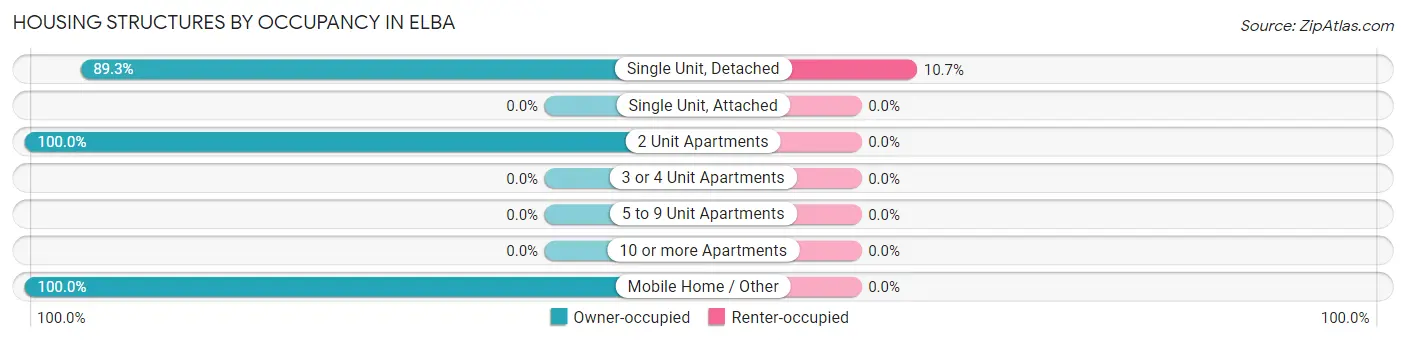
| Structure Type | Owner-occupied | Renter-occupied |
| Single Unit, Detached | 25 (89.3%) | 3 (10.7%) |
| Single Unit, Attached | 0 (0.0%) | 0 (0.0%) |
| 2 Unit Apartments | 2 (100.0%) | 0 (0.0%) |
| 3 or 4 Unit Apartments | 0 (0.0%) | 0 (0.0%) |
| 5 to 9 Unit Apartments | 0 (0.0%) | 0 (0.0%) |
| 10 or more Apartments | 0 (0.0%) | 0 (0.0%) |
| Mobile Home / Other | 7 (100.0%) | 0 (0.0%) |
| Total | 34 (91.9%) | 3 (8.1%) |
Housing Structures by Number of Rooms in Elba
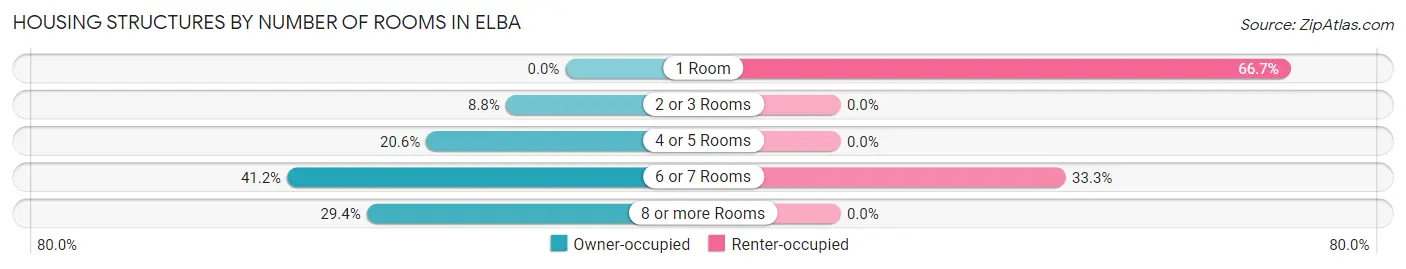
| Number of Rooms | Owner-occupied | Renter-occupied |
| 1 Room | 0 (0.0%) | 2 (66.7%) |
| 2 or 3 Rooms | 3 (8.8%) | 0 (0.0%) |
| 4 or 5 Rooms | 7 (20.6%) | 0 (0.0%) |
| 6 or 7 Rooms | 14 (41.2%) | 1 (33.3%) |
| 8 or more Rooms | 10 (29.4%) | 0 (0.0%) |
| Total | 34 (100.0%) | 3 (100.0%) |
Housing Structure by Heating Type in Elba
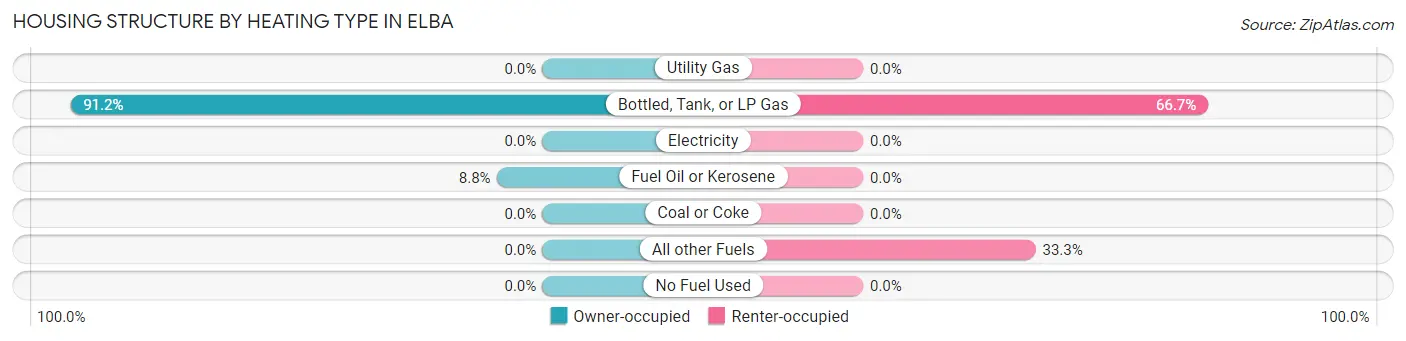
| Heating Type | Owner-occupied | Renter-occupied |
| Utility Gas | 0 (0.0%) | 0 (0.0%) |
| Bottled, Tank, or LP Gas | 31 (91.2%) | 2 (66.7%) |
| Electricity | 0 (0.0%) | 0 (0.0%) |
| Fuel Oil or Kerosene | 3 (8.8%) | 0 (0.0%) |
| Coal or Coke | 0 (0.0%) | 0 (0.0%) |
| All other Fuels | 0 (0.0%) | 1 (33.3%) |
| No Fuel Used | 0 (0.0%) | 0 (0.0%) |
| Total | 34 (100.0%) | 3 (100.0%) |
Household Vehicle Usage in Elba
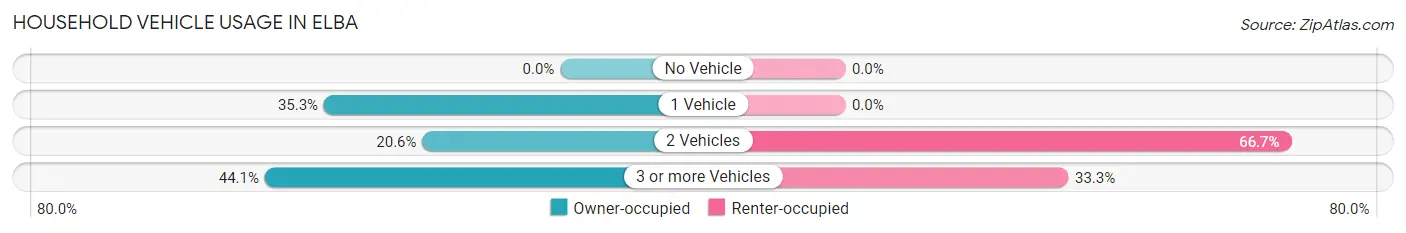
| Vehicles per Household | Owner-occupied | Renter-occupied |
| No Vehicle | 0 (0.0%) | 0 (0.0%) |
| 1 Vehicle | 12 (35.3%) | 0 (0.0%) |
| 2 Vehicles | 7 (20.6%) | 2 (66.7%) |
| 3 or more Vehicles | 15 (44.1%) | 1 (33.3%) |
| Total | 34 (100.0%) | 3 (100.0%) |
Real Estate & Mortgages in Elba
Real Estate and Mortgage Overview in Elba
| Characteristic | Without Mortgage | With Mortgage |
| Housing Units | 15 | 19 |
| Median Property Value | $170,800 | $0 |
| Median Household Income | - | - |
| Monthly Housing Costs | $450 | $4 |
| Real Estate Taxes | $1,150 | $0 |
Property Value by Mortgage Status in Elba
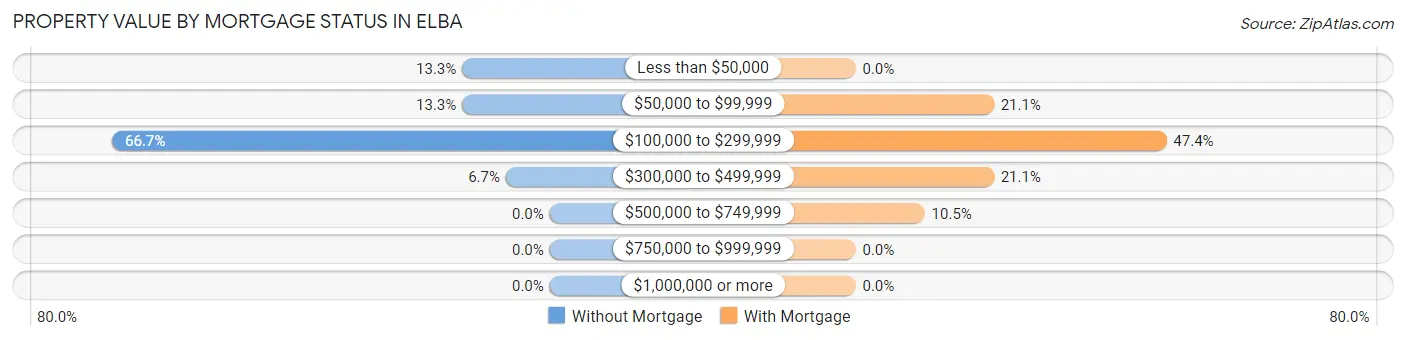
| Property Value | Without Mortgage | With Mortgage |
| Less than $50,000 | 2 (13.3%) | 0 (0.0%) |
| $50,000 to $99,999 | 2 (13.3%) | 4 (21.0%) |
| $100,000 to $299,999 | 10 (66.7%) | 9 (47.4%) |
| $300,000 to $499,999 | 1 (6.7%) | 4 (21.0%) |
| $500,000 to $749,999 | 0 (0.0%) | 2 (10.5%) |
| $750,000 to $999,999 | 0 (0.0%) | 0 (0.0%) |
| $1,000,000 or more | 0 (0.0%) | 0 (0.0%) |
| Total | 15 (100.0%) | 19 (100.0%) |
Household Income by Mortgage Status in Elba
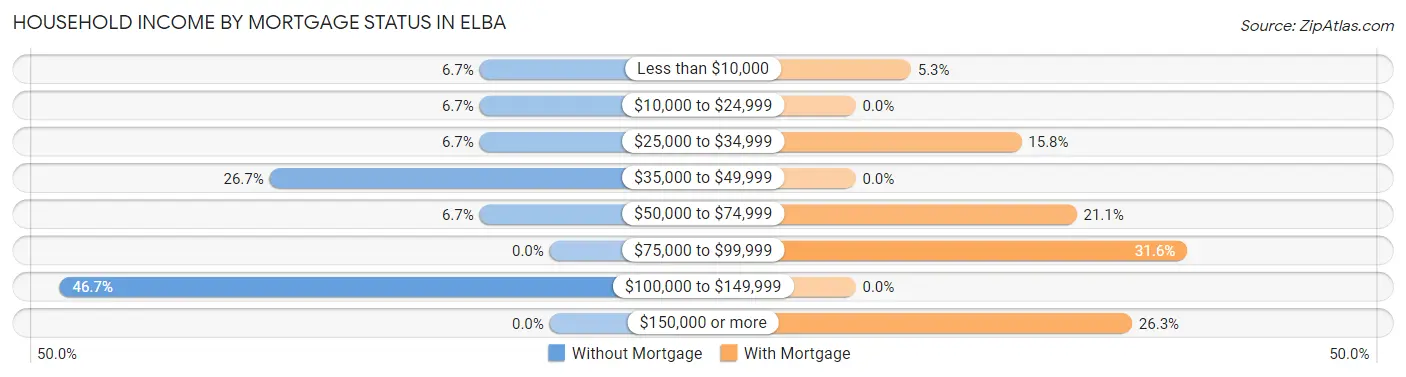
| Household Income | Without Mortgage | With Mortgage |
| Less than $10,000 | 1 (6.7%) | 1 (5.3%) |
| $10,000 to $24,999 | 1 (6.7%) | 0 (0.0%) |
| $25,000 to $34,999 | 1 (6.7%) | 3 (15.8%) |
| $35,000 to $49,999 | 4 (26.7%) | 0 (0.0%) |
| $50,000 to $74,999 | 1 (6.7%) | 4 (21.0%) |
| $75,000 to $99,999 | 0 (0.0%) | 6 (31.6%) |
| $100,000 to $149,999 | 7 (46.7%) | 0 (0.0%) |
| $150,000 or more | 0 (0.0%) | 5 (26.3%) |
| Total | 15 (100.0%) | 19 (100.0%) |
Property Value to Household Income Ratio in Elba
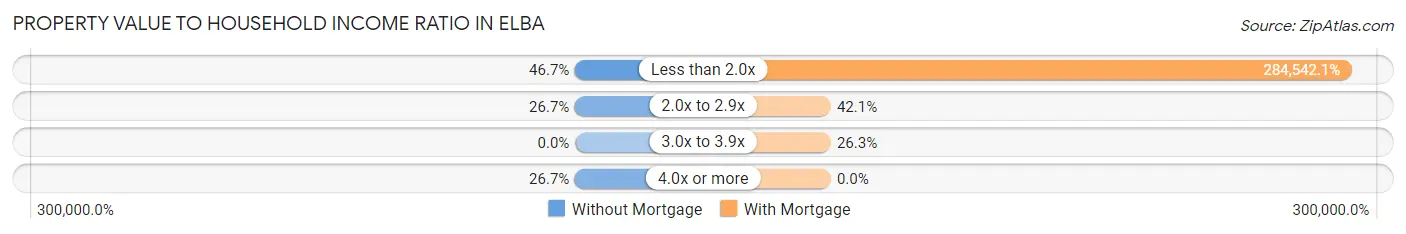
| Value-to-Income Ratio | Without Mortgage | With Mortgage |
| Less than 2.0x | 7 (46.7%) | 54,063 (284,542.1%) |
| 2.0x to 2.9x | 4 (26.7%) | 8 (42.1%) |
| 3.0x to 3.9x | 0 (0.0%) | 5 (26.3%) |
| 4.0x or more | 4 (26.7%) | 0 (0.0%) |
| Total | 15 (100.0%) | 19 (100.0%) |
Real Estate Taxes by Mortgage Status in Elba
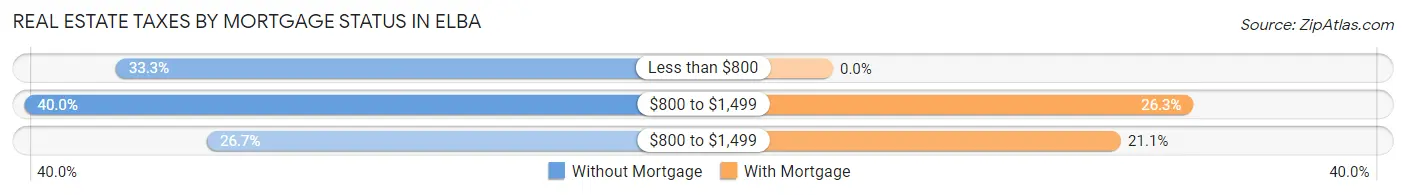
| Property Taxes | Without Mortgage | With Mortgage |
| Less than $800 | 5 (33.3%) | 0 (0.0%) |
| $800 to $1,499 | 6 (40.0%) | 5 (26.3%) |
| $800 to $1,499 | 4 (26.7%) | 4 (21.0%) |
| Total | 15 (100.0%) | 19 (100.0%) |
Health & Disability in Elba
Health Insurance Coverage by Age in Elba
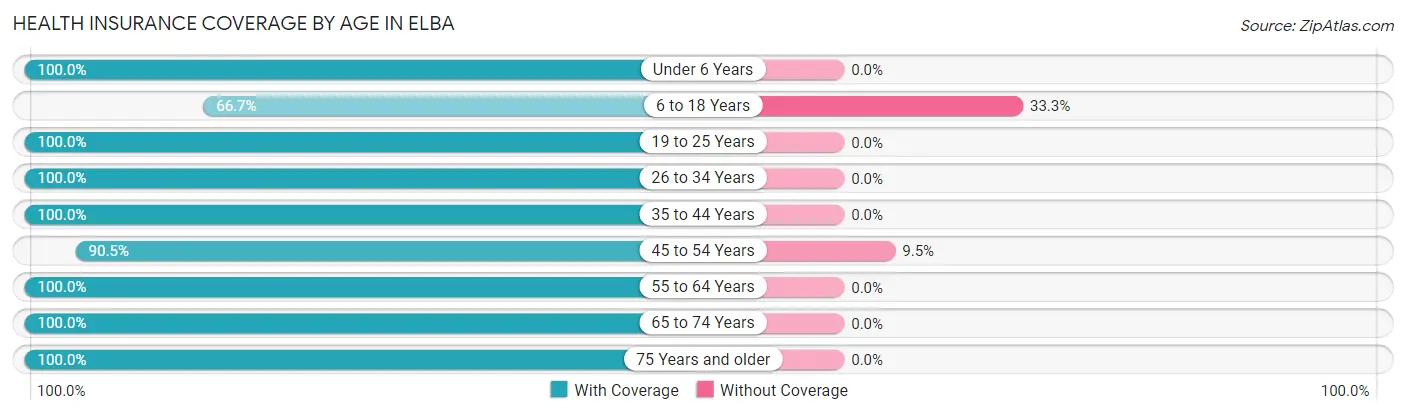
| Age Bracket | With Coverage | Without Coverage |
| Under 6 Years | 5 (100.0%) | 0 (0.0%) |
| 6 to 18 Years | 4 (66.7%) | 2 (33.3%) |
| 19 to 25 Years | 10 (100.0%) | 0 (0.0%) |
| 26 to 34 Years | 4 (100.0%) | 0 (0.0%) |
| 35 to 44 Years | 2 (100.0%) | 0 (0.0%) |
| 45 to 54 Years | 19 (90.5%) | 2 (9.5%) |
| 55 to 64 Years | 11 (100.0%) | 0 (0.0%) |
| 65 to 74 Years | 13 (100.0%) | 0 (0.0%) |
| 75 Years and older | 7 (100.0%) | 0 (0.0%) |
| Total | 75 (94.9%) | 4 (5.1%) |
Health Insurance Coverage by Citizenship Status in Elba
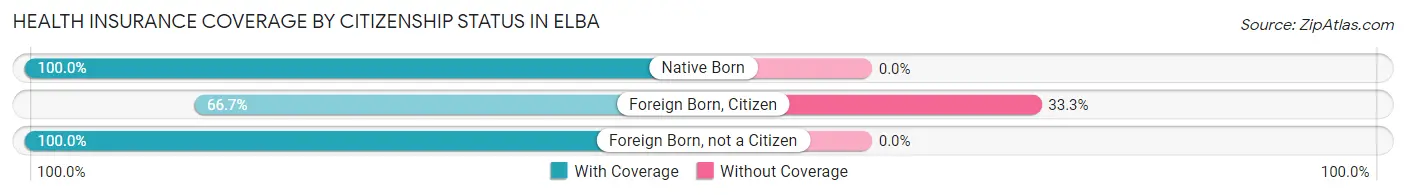
| Citizenship Status | With Coverage | Without Coverage |
| Native Born | 5 (100.0%) | 0 (0.0%) |
| Foreign Born, Citizen | 4 (66.7%) | 2 (33.3%) |
| Foreign Born, not a Citizen | 10 (100.0%) | 0 (0.0%) |
Health Insurance Coverage by Household Income in Elba
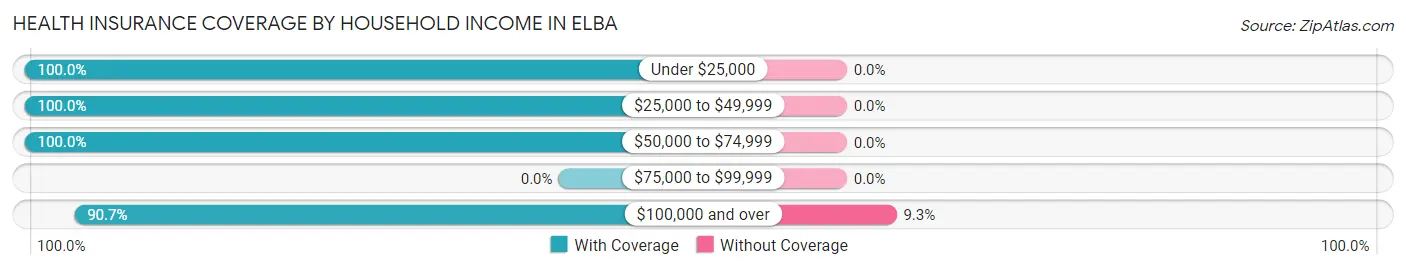
| Household Income | With Coverage | Without Coverage |
| Under $25,000 | 7 (100.0%) | 0 (0.0%) |
| $25,000 to $49,999 | 13 (100.0%) | 0 (0.0%) |
| $50,000 to $74,999 | 16 (100.0%) | 0 (0.0%) |
| $75,000 to $99,999 | 0 (0.0%) | 0 (0.0%) |
| $100,000 and over | 39 (90.7%) | 4 (9.3%) |
Public vs Private Health Insurance Coverage by Age in Elba
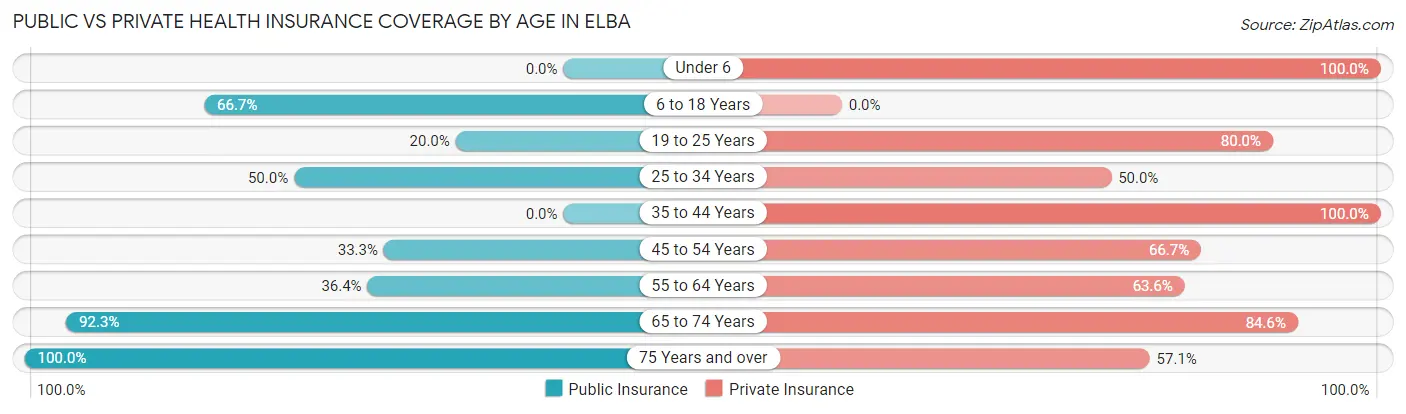
| Age Bracket | Public Insurance | Private Insurance |
| Under 6 | 0 (0.0%) | 5 (100.0%) |
| 6 to 18 Years | 4 (66.7%) | 0 (0.0%) |
| 19 to 25 Years | 2 (20.0%) | 8 (80.0%) |
| 25 to 34 Years | 2 (50.0%) | 2 (50.0%) |
| 35 to 44 Years | 0 (0.0%) | 2 (100.0%) |
| 45 to 54 Years | 7 (33.3%) | 14 (66.7%) |
| 55 to 64 Years | 4 (36.4%) | 7 (63.6%) |
| 65 to 74 Years | 12 (92.3%) | 11 (84.6%) |
| 75 Years and over | 7 (100.0%) | 4 (57.1%) |
| Total | 38 (48.1%) | 53 (67.1%) |
Disability Status by Sex by Age in Elba
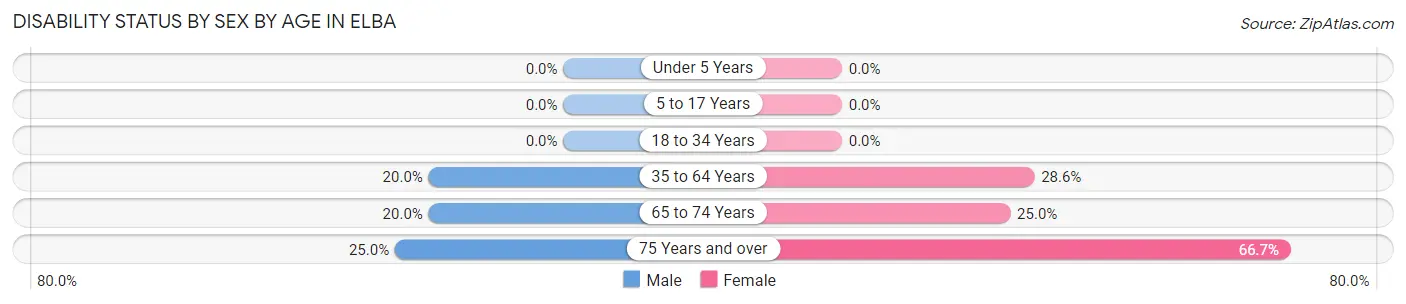
| Age Bracket | Male | Female |
| Under 5 Years | 0 (0.0%) | 0 (0.0%) |
| 5 to 17 Years | 0 (0.0%) | 0 (0.0%) |
| 18 to 34 Years | 0 (0.0%) | 0 (0.0%) |
| 35 to 64 Years | 4 (20.0%) | 4 (28.6%) |
| 65 to 74 Years | 1 (20.0%) | 2 (25.0%) |
| 75 Years and over | 1 (25.0%) | 2 (66.7%) |
Disability Class by Sex by Age in Elba
Disability Class: Hearing Difficulty
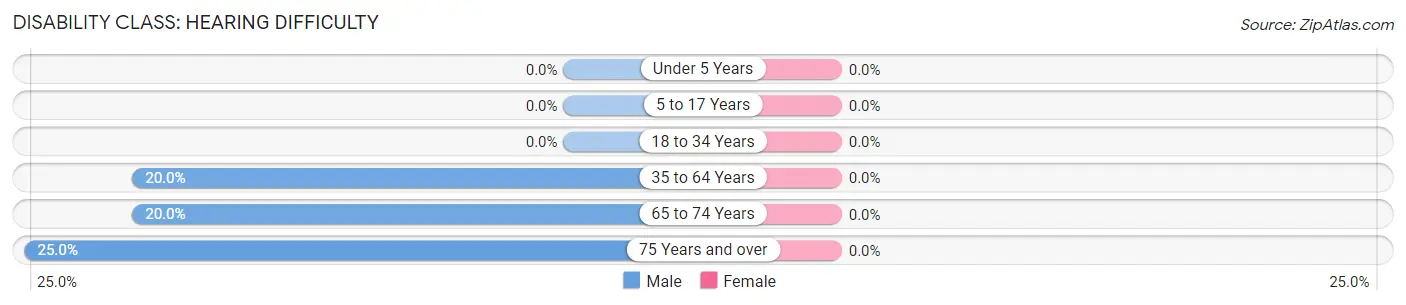
| Age Bracket | Male | Female |
| Under 5 Years | 0 (0.0%) | 0 (0.0%) |
| 5 to 17 Years | 0 (0.0%) | 0 (0.0%) |
| 18 to 34 Years | 0 (0.0%) | 0 (0.0%) |
| 35 to 64 Years | 4 (20.0%) | 0 (0.0%) |
| 65 to 74 Years | 1 (20.0%) | 0 (0.0%) |
| 75 Years and over | 1 (25.0%) | 0 (0.0%) |
Disability Class: Vision Difficulty
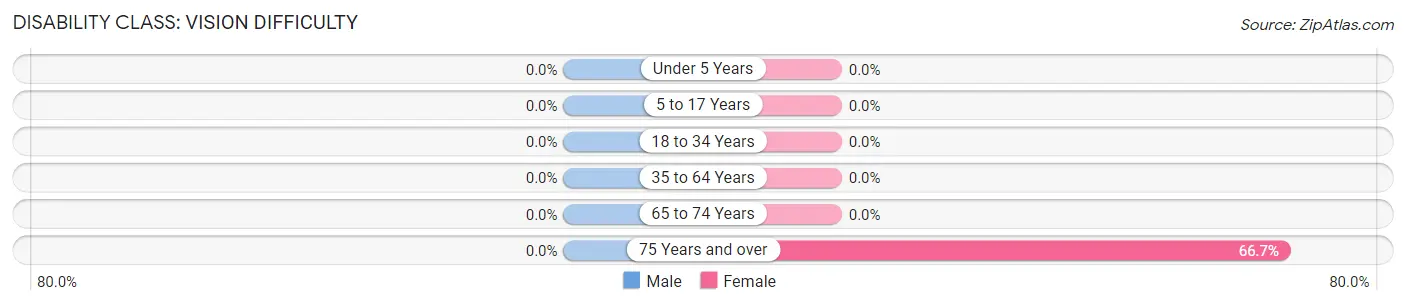
| Age Bracket | Male | Female |
| Under 5 Years | 0 (0.0%) | 0 (0.0%) |
| 5 to 17 Years | 0 (0.0%) | 0 (0.0%) |
| 18 to 34 Years | 0 (0.0%) | 0 (0.0%) |
| 35 to 64 Years | 0 (0.0%) | 0 (0.0%) |
| 65 to 74 Years | 0 (0.0%) | 0 (0.0%) |
| 75 Years and over | 0 (0.0%) | 2 (66.7%) |
Disability Class: Cognitive Difficulty
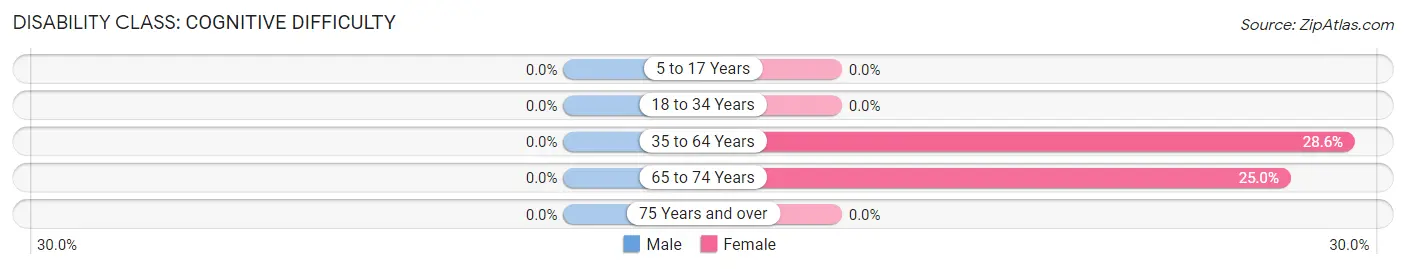
| Age Bracket | Male | Female |
| 5 to 17 Years | 0 (0.0%) | 0 (0.0%) |
| 18 to 34 Years | 0 (0.0%) | 0 (0.0%) |
| 35 to 64 Years | 0 (0.0%) | 4 (28.6%) |
| 65 to 74 Years | 0 (0.0%) | 2 (25.0%) |
| 75 Years and over | 0 (0.0%) | 0 (0.0%) |
Disability Class: Ambulatory Difficulty
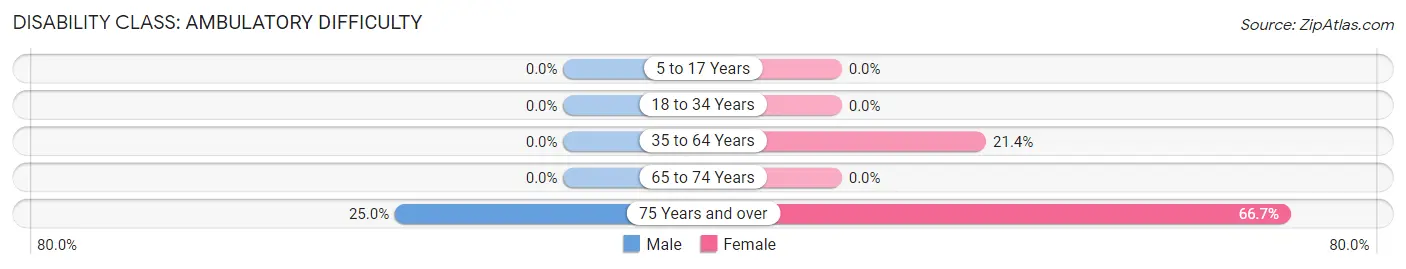
| Age Bracket | Male | Female |
| 5 to 17 Years | 0 (0.0%) | 0 (0.0%) |
| 18 to 34 Years | 0 (0.0%) | 0 (0.0%) |
| 35 to 64 Years | 0 (0.0%) | 3 (21.4%) |
| 65 to 74 Years | 0 (0.0%) | 0 (0.0%) |
| 75 Years and over | 1 (25.0%) | 2 (66.7%) |
Disability Class: Self-Care Difficulty
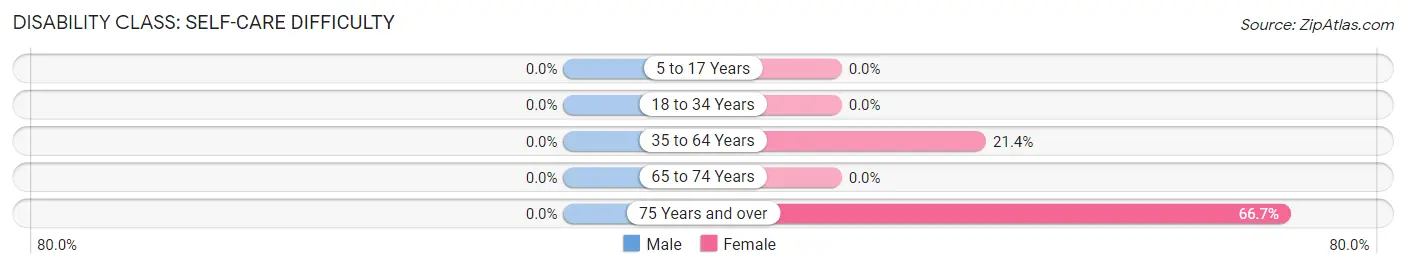
| Age Bracket | Male | Female |
| 5 to 17 Years | 0 (0.0%) | 0 (0.0%) |
| 18 to 34 Years | 0 (0.0%) | 0 (0.0%) |
| 35 to 64 Years | 0 (0.0%) | 3 (21.4%) |
| 65 to 74 Years | 0 (0.0%) | 0 (0.0%) |
| 75 Years and over | 0 (0.0%) | 2 (66.7%) |
Technology Access in Elba
Computing Device Access in Elba
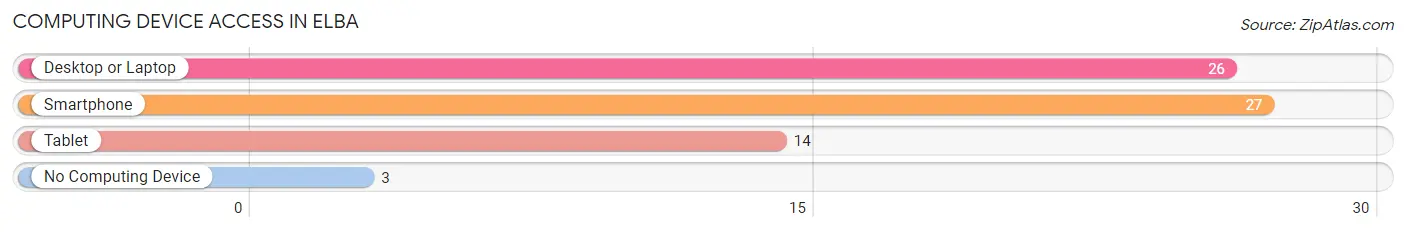
| Device Type | # Households | % Households |
| Desktop or Laptop | 26 | 70.3% |
| Smartphone | 27 | 73.0% |
| Tablet | 14 | 37.8% |
| No Computing Device | 3 | 8.1% |
| Total | 37 | 100.0% |
Internet Access in Elba
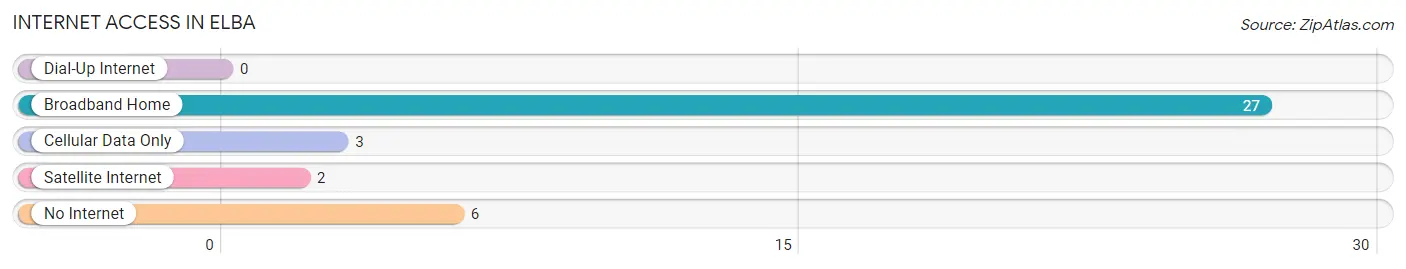
| Internet Type | # Households | % Households |
| Dial-Up Internet | 0 | 0.0% |
| Broadband Home | 27 | 73.0% |
| Cellular Data Only | 3 | 8.1% |
| Satellite Internet | 2 | 5.4% |
| No Internet | 6 | 16.2% |
| Total | 37 | 100.0% |
Elba Summary
Elba, Minnesota is a small town located in the southeastern corner of the state, near the border of Wisconsin. It is part of the Twin Cities metropolitan area and is located in Wabasha County. The population of Elba was estimated to be around 1,000 people in 2020.
History
Elba was founded in 1856 by a group of settlers from New York. The town was named after the biblical city of Elba, which was located in the Mediterranean Sea. The settlers were attracted to the area due to its fertile soil and abundant natural resources. The town quickly grew and by the late 1800s, it had become a thriving agricultural community.
In the early 1900s, Elba began to experience a period of growth and development. The town was connected to the Twin Cities by a railroad line, which allowed for increased trade and commerce. The town also saw the construction of several churches, schools, and businesses.
Geography
Elba is located in the southeastern corner of Minnesota, near the border of Wisconsin. It is part of the Twin Cities metropolitan area and is located in Wabasha County. The town is situated on the banks of the Mississippi River and is surrounded by rolling hills and forests. The town is located approximately 30 miles from the Twin Cities and is accessible by car or train.
Economy
Elba’s economy is largely based on agriculture and tourism. The town is home to several farms, which produce a variety of crops, including corn, soybeans, and wheat. The town also has several small businesses, including restaurants, shops, and a grocery store.
Tourism is also an important part of Elba’s economy. The town is home to several attractions, including the Elba Historical Society Museum, the Elba Nature Center, and the Elba State Park. The town also hosts several festivals and events throughout the year, including the Elba County Fair and the Elba Music Festival.
Demographics
As of 2020, the population of Elba was estimated to be around 1,000 people. The town is predominantly white, with a small percentage of African Americans, Hispanics, and Native Americans. The median household income in Elba is around $50,000, and the median home value is around $150,000. The town has a low unemployment rate and a high rate of homeownership.
Elba is a small town with a rich history and a vibrant economy. The town is home to a diverse population and offers a variety of attractions and activities. Elba is a great place to live, work, and play.
Common Questions
What is Per Capita Income in Elba?
Per Capita income in Elba is $42,673.
What is the Median Family Income in Elba?
Median Family Income in Elba is $103,750.
What is the Median Household income in Elba?
Median Household Income in Elba is $58,750.
What is Income or Wage Gap in Elba?
Income or Wage Gap in Elba is 41.8%.
Women in Elba earn 58.2 cents for every dollar earned by a man.
What is Inequality or Gini Index in Elba?
Inequality or Gini Index in Elba is 0.37.
What is the Total Population of Elba?
Total Population of Elba is 79.
What is the Total Male Population of Elba?
Total Male Population of Elba is 41.
What is the Total Female Population of Elba?
Total Female Population of Elba is 38.
What is the Ratio of Males per 100 Females in Elba?
There are 107.89 Males per 100 Females in Elba.
What is the Ratio of Females per 100 Males in Elba?
There are 92.68 Females per 100 Males in Elba.
What is the Median Population Age in Elba?
Median Population Age in Elba is 53.8 Years.
What is the Average Family Size in Elba
Average Family Size in Elba is 3.2 People.
What is the Average Household Size in Elba
Average Household Size in Elba is 2.1 People.
How Large is the Labor Force in Elba?
There are 51 People in the Labor Forcein in Elba.
What is the Percentage of People in the Labor Force in Elba?
71.8% of People are in the Labor Force in Elba.