Ranier, MN Map & Demographics
Ranier Map
Ranier Overview
$41,628
PER CAPITA INCOME
$78,472
AVG FAMILY INCOME
$74,602
AVG HOUSEHOLD INCOME
33.7%
WAGE / INCOME GAP [ % ]
66.3¢/ $1
WAGE / INCOME GAP [ $ ]
0.40
INEQUALITY / GINI INDEX
602
TOTAL POPULATION
305
MALE POPULATION
297
FEMALE POPULATION
102.69
MALES / 100 FEMALES
97.38
FEMALES / 100 MALES
48.1
MEDIAN AGE
2.7
AVG FAMILY SIZE
2.2
AVG HOUSEHOLD SIZE
300
LABOR FORCE [ PEOPLE ]
59.8%
PERCENT IN LABOR FORCE
6.3%
UNEMPLOYMENT RATE
Ranier Zip Codes
Ranier Area Codes
Income in Ranier
Income Overview in Ranier
Per Capita Income in Ranier is $41,628, while median incomes of families and households are $78,472 and $74,602 respectively.
| Characteristic | Number | Measure |
| Per Capita Income | 602 | $41,628 |
| Median Family Income | 166 | $78,472 |
| Mean Family Income | 166 | $105,497 |
| Median Household Income | 261 | $74,602 |
| Mean Household Income | 261 | $91,917 |
| Income Deficit | 166 | $0 |
| Wage / Income Gap (%) | 602 | 33.74% |
| Wage / Income Gap ($) | 602 | 66.26¢ per $1 |
| Gini / Inequality Index | 602 | 0.40 |
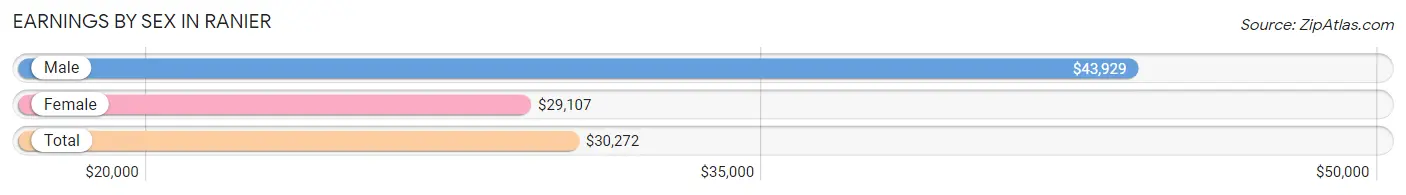
Earnings by Sex in Ranier
Average Earnings in Ranier are $30,272, $43,929 for men and $29,107 for women, a difference of 33.7%.
| Sex | Number | Average Earnings |
| Male | 154 (46.8%) | $43,929 |
| Female | 175 (53.2%) | $29,107 |
| Total | 329 (100.0%) | $30,272 |
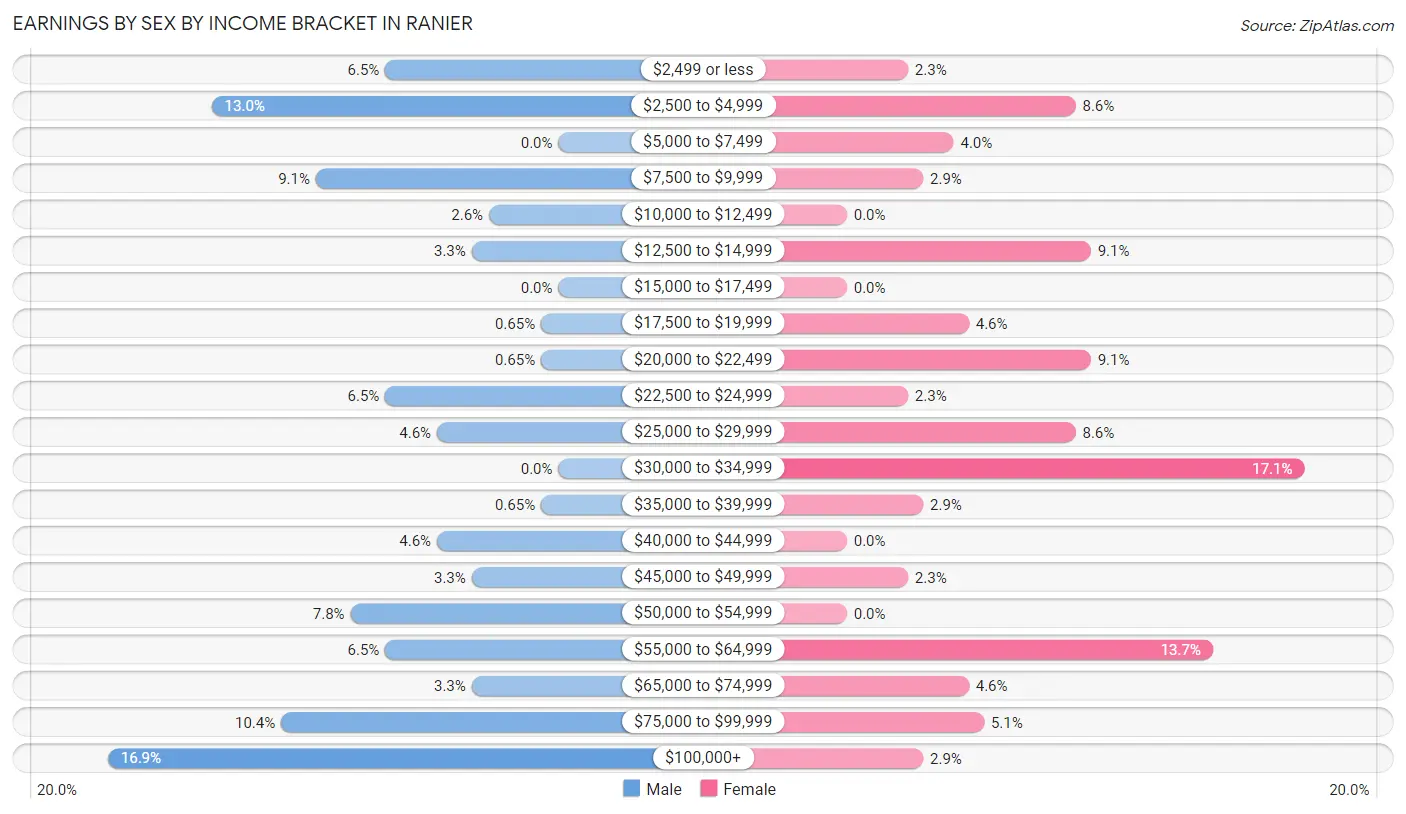
Earnings by Sex by Income Bracket in Ranier
The most common earnings brackets in Ranier are $100,000+ for men (26 | 16.9%) and $30,000 to $34,999 for women (30 | 17.1%).
| Income | Male | Female |
| $2,499 or less | 10 (6.5%) | 4 (2.3%) |
| $2,500 to $4,999 | 20 (13.0%) | 15 (8.6%) |
| $5,000 to $7,499 | 0 (0.0%) | 7 (4.0%) |
| $7,500 to $9,999 | 14 (9.1%) | 5 (2.9%) |
| $10,000 to $12,499 | 4 (2.6%) | 0 (0.0%) |
| $12,500 to $14,999 | 5 (3.3%) | 16 (9.1%) |
| $15,000 to $17,499 | 0 (0.0%) | 0 (0.0%) |
| $17,500 to $19,999 | 1 (0.6%) | 8 (4.6%) |
| $20,000 to $22,499 | 1 (0.6%) | 16 (9.1%) |
| $22,500 to $24,999 | 10 (6.5%) | 4 (2.3%) |
| $25,000 to $29,999 | 7 (4.5%) | 15 (8.6%) |
| $30,000 to $34,999 | 0 (0.0%) | 30 (17.1%) |
| $35,000 to $39,999 | 1 (0.6%) | 5 (2.9%) |
| $40,000 to $44,999 | 7 (4.5%) | 0 (0.0%) |
| $45,000 to $49,999 | 5 (3.3%) | 4 (2.3%) |
| $50,000 to $54,999 | 12 (7.8%) | 0 (0.0%) |
| $55,000 to $64,999 | 10 (6.5%) | 24 (13.7%) |
| $65,000 to $74,999 | 5 (3.3%) | 8 (4.6%) |
| $75,000 to $99,999 | 16 (10.4%) | 9 (5.1%) |
| $100,000+ | 26 (16.9%) | 5 (2.9%) |
| Total | 154 (100.0%) | 175 (100.0%) |
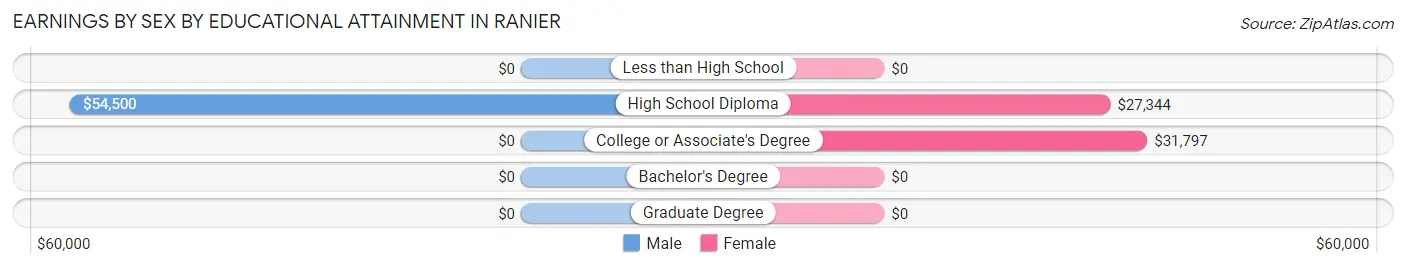
Earnings by Sex by Educational Attainment in Ranier
Average earnings in Ranier are $50,000 for men and $31,413 for women, a difference of 37.2%. Men with an educational attainment of high school diploma enjoy the highest average annual earnings of $54,500, while those with high school diploma education earn the least with $54,500. Women with an educational attainment of college or associate's degree earn the most with the average annual earnings of $31,797, while those with high school diploma education have the smallest earnings of $27,344.
| Educational Attainment | Male Income | Female Income |
| Less than High School | - | - |
| High School Diploma | $54,500 | $27,344 |
| College or Associate's Degree | - | - |
| Bachelor's Degree | - | - |
| Graduate Degree | - | - |
| Total | $50,000 | $31,413 |
Family Income in Ranier
Family Income Brackets in Ranier
According to the Ranier family income data, there are 40 families falling into the $50,000 to $74,999 income range, which is the most common income bracket and makes up 24.1% of all families.
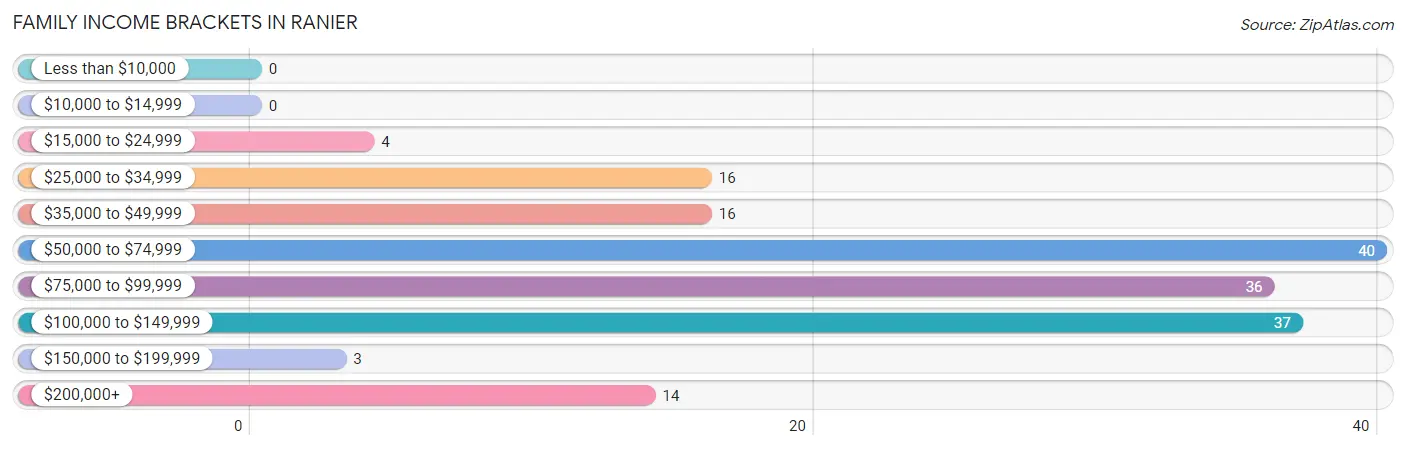
| Income Bracket | # Families | % Families |
| Less than $10,000 | 0 | 0.0% |
| $10,000 to $14,999 | 0 | 0.0% |
| $15,000 to $24,999 | 4 | 2.4% |
| $25,000 to $34,999 | 16 | 9.6% |
| $35,000 to $49,999 | 16 | 9.6% |
| $50,000 to $74,999 | 40 | 24.1% |
| $75,000 to $99,999 | 36 | 21.7% |
| $100,000 to $149,999 | 37 | 22.3% |
| $150,000 to $199,999 | 3 | 1.8% |
| $200,000+ | 14 | 8.4% |
Family Income by Famaliy Size in Ranier
4-person families (15 | 9.0%) account for the highest median family income in Ranier with $96,250 per family, while 2-person families (81 | 48.8%) have the highest median income of $39,427 per family member.
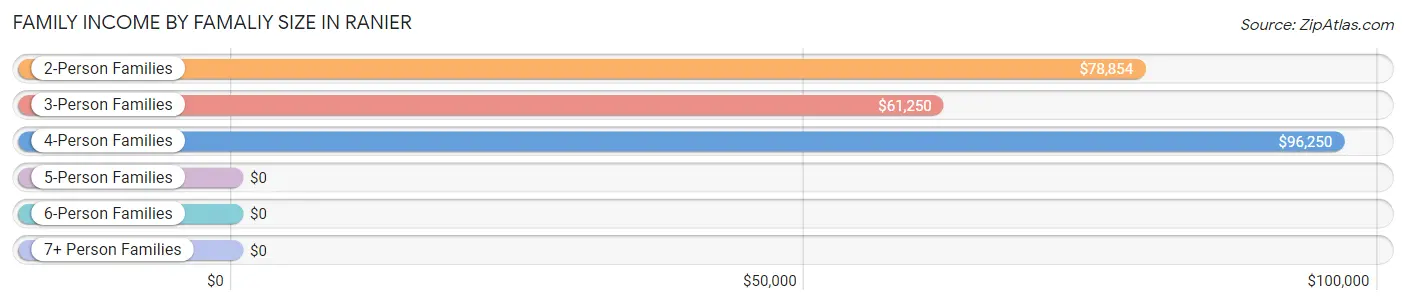
| Income Bracket | # Families | Median Income |
| 2-Person Families | 81 (48.8%) | $78,854 |
| 3-Person Families | 67 (40.4%) | $61,250 |
| 4-Person Families | 15 (9.0%) | $96,250 |
| 5-Person Families | 3 (1.8%) | $0 |
| 6-Person Families | 0 (0.0%) | $0 |
| 7+ Person Families | 0 (0.0%) | $0 |
| Total | 166 (100.0%) | $78,472 |
Family Income by Number of Earners in Ranier
The median family income in Ranier is $78,472, with families comprising 3+ earners (16) having the highest median family income of $103,333, while families with 1 earner (67) have the lowest median family income of $56,250, accounting for 9.6% and 40.4% of families, respectively.
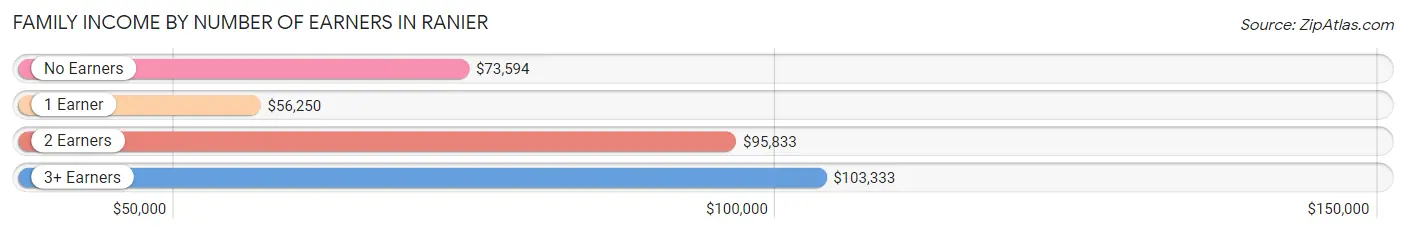
| Number of Earners | # Families | Median Income |
| No Earners | 27 (16.3%) | $73,594 |
| 1 Earner | 67 (40.4%) | $56,250 |
| 2 Earners | 56 (33.7%) | $95,833 |
| 3+ Earners | 16 (9.6%) | $103,333 |
| Total | 166 (100.0%) | $78,472 |
Household Income in Ranier
Household Income Brackets in Ranier
With 63 households falling in the category, the $50,000 to $74,999 income range is the most frequent in Ranier, accounting for 24.1% of all households. In contrast, only 5 households (1.9%) fall into the $10,000 to $14,999 income bracket, making it the least populous group.
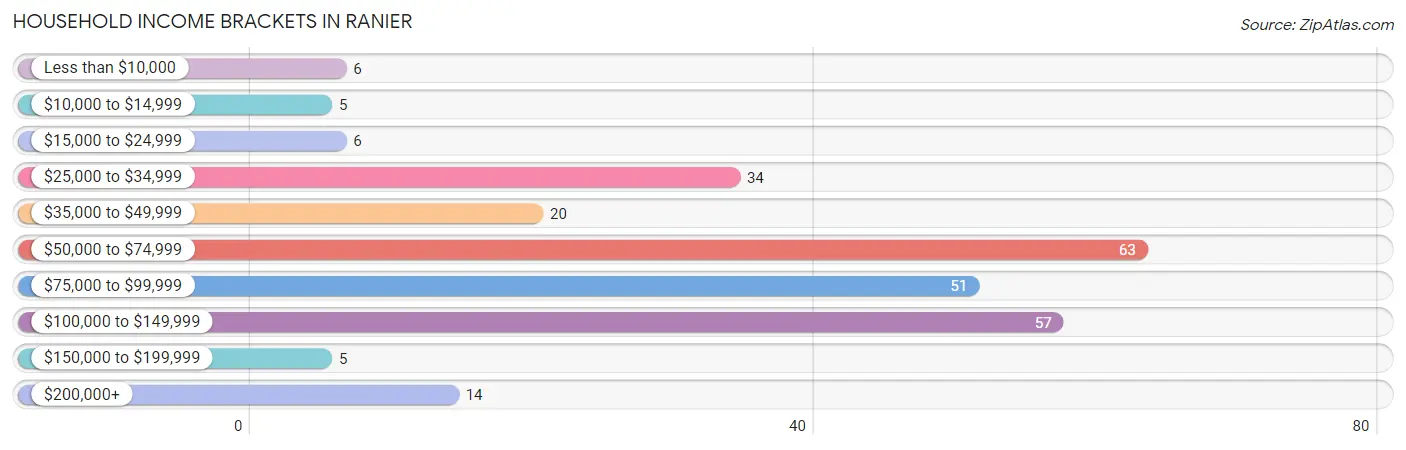
| Income Bracket | # Households | % Households |
| Less than $10,000 | 6 | 2.3% |
| $10,000 to $14,999 | 5 | 1.9% |
| $15,000 to $24,999 | 6 | 2.3% |
| $25,000 to $34,999 | 34 | 13.0% |
| $35,000 to $49,999 | 20 | 7.7% |
| $50,000 to $74,999 | 63 | 24.1% |
| $75,000 to $99,999 | 51 | 19.5% |
| $100,000 to $149,999 | 57 | 21.8% |
| $150,000 to $199,999 | 5 | 1.9% |
| $200,000+ | 14 | 5.4% |
Household Income by Householder Age in Ranier
The median household income in Ranier is $74,602, with the highest median household income of $81,042 found in the 25 to 44 years age bracket for the primary householder. A total of 53 households (20.3%) fall into this category.
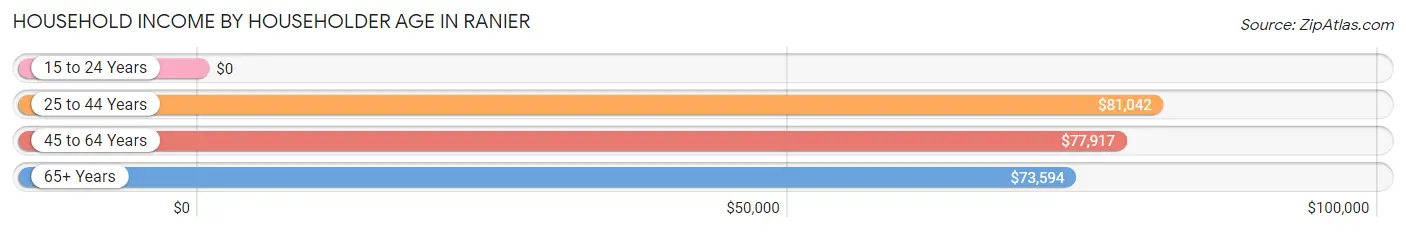
| Income Bracket | # Households | Median Income |
| 15 to 24 Years | 0 (0.0%) | $0 |
| 25 to 44 Years | 53 (20.3%) | $81,042 |
| 45 to 64 Years | 110 (42.1%) | $77,917 |
| 65+ Years | 98 (37.6%) | $73,594 |
| Total | 261 (100.0%) | $74,602 |
Poverty in Ranier
Income Below Poverty by Sex and Age in Ranier
With 3.4% poverty level for males and 9.9% for females among the residents of Ranier, 45 to 54 year old males and 15 year old females are the most vulnerable to poverty, with 6 males (20.0%) and 1 females (100.0%) in their respective age groups living below the poverty level.
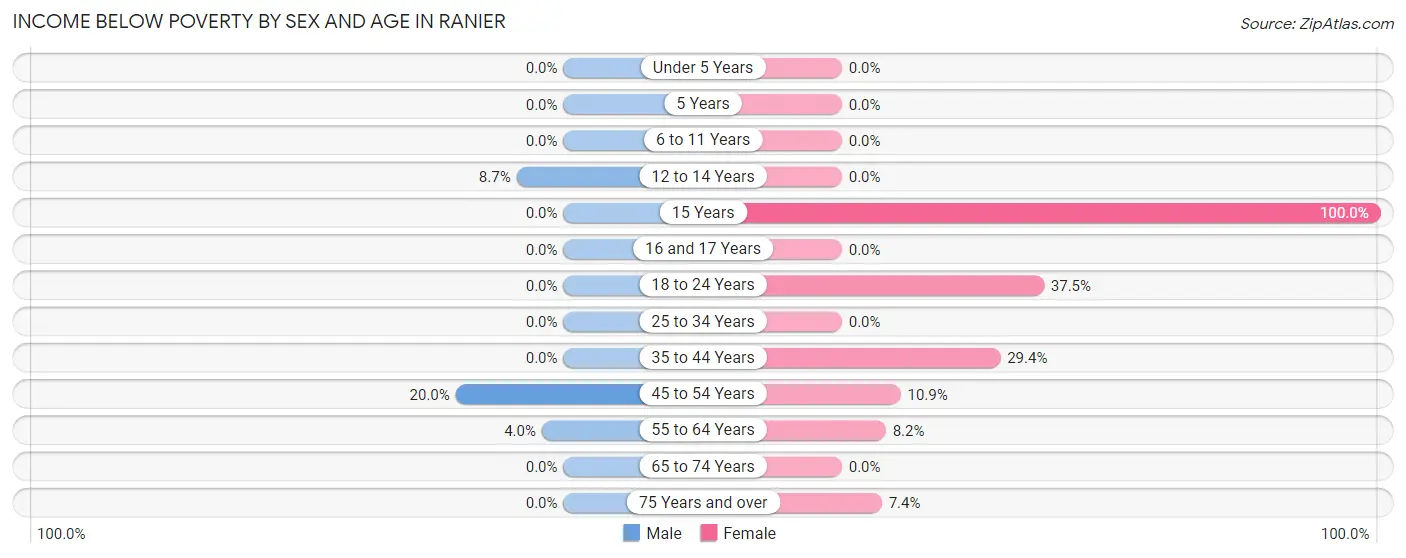
| Age Bracket | Male | Female |
| Under 5 Years | 0 (0.0%) | 0 (0.0%) |
| 5 Years | 0 (0.0%) | 0 (0.0%) |
| 6 to 11 Years | 0 (0.0%) | 0 (0.0%) |
| 12 to 14 Years | 2 (8.7%) | 0 (0.0%) |
| 15 Years | 0 (0.0%) | 1 (100.0%) |
| 16 and 17 Years | 0 (0.0%) | 0 (0.0%) |
| 18 to 24 Years | 0 (0.0%) | 6 (37.5%) |
| 25 to 34 Years | 0 (0.0%) | 0 (0.0%) |
| 35 to 44 Years | 0 (0.0%) | 10 (29.4%) |
| 45 to 54 Years | 6 (20.0%) | 6 (10.9%) |
| 55 to 64 Years | 2 (4.0%) | 4 (8.2%) |
| 65 to 74 Years | 0 (0.0%) | 0 (0.0%) |
| 75 Years and over | 0 (0.0%) | 2 (7.4%) |
| Total | 10 (3.4%) | 29 (9.9%) |
Income Above Poverty by Sex and Age in Ranier
According to the poverty statistics in Ranier, males aged under 5 years and females aged under 5 years are the age groups that are most secure financially, with 100.0% of males and 100.0% of females in these age groups living above the poverty line.
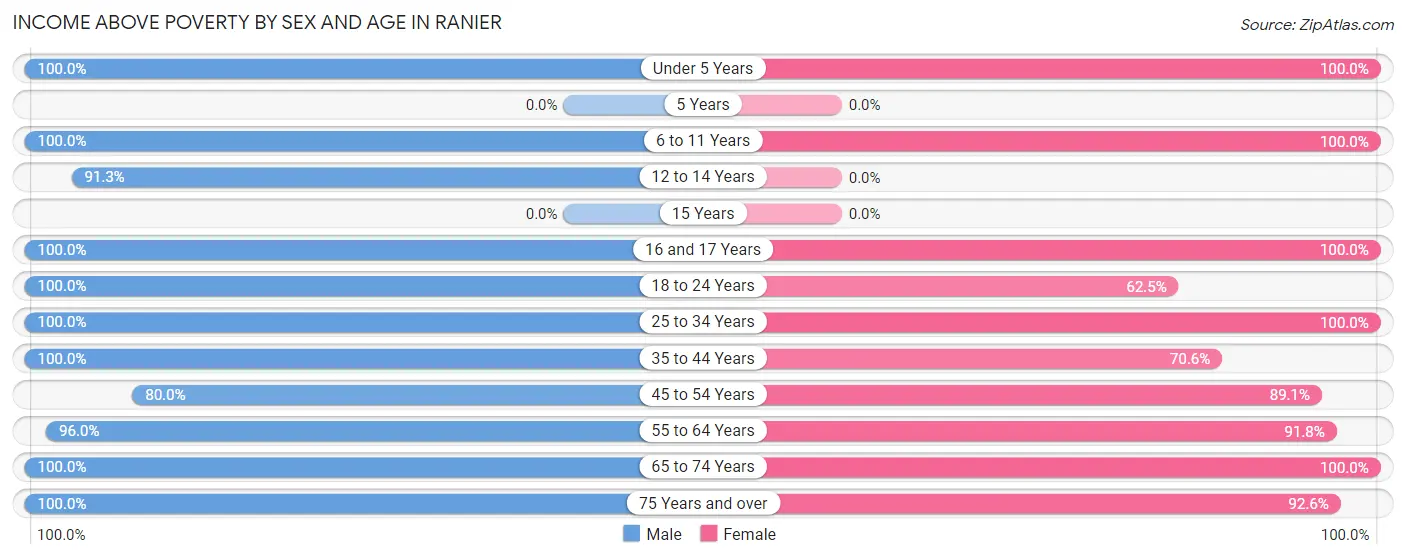
| Age Bracket | Male | Female |
| Under 5 Years | 15 (100.0%) | 16 (100.0%) |
| 5 Years | 0 (0.0%) | 0 (0.0%) |
| 6 to 11 Years | 18 (100.0%) | 27 (100.0%) |
| 12 to 14 Years | 21 (91.3%) | 0 (0.0%) |
| 15 Years | 0 (0.0%) | 0 (0.0%) |
| 16 and 17 Years | 3 (100.0%) | 15 (100.0%) |
| 18 to 24 Years | 13 (100.0%) | 10 (62.5%) |
| 25 to 34 Years | 34 (100.0%) | 27 (100.0%) |
| 35 to 44 Years | 26 (100.0%) | 24 (70.6%) |
| 45 to 54 Years | 24 (80.0%) | 49 (89.1%) |
| 55 to 64 Years | 48 (96.0%) | 45 (91.8%) |
| 65 to 74 Years | 62 (100.0%) | 25 (100.0%) |
| 75 Years and over | 21 (100.0%) | 25 (92.6%) |
| Total | 285 (96.6%) | 263 (90.1%) |
Income Below Poverty Among Married-Couple Families in Ranier
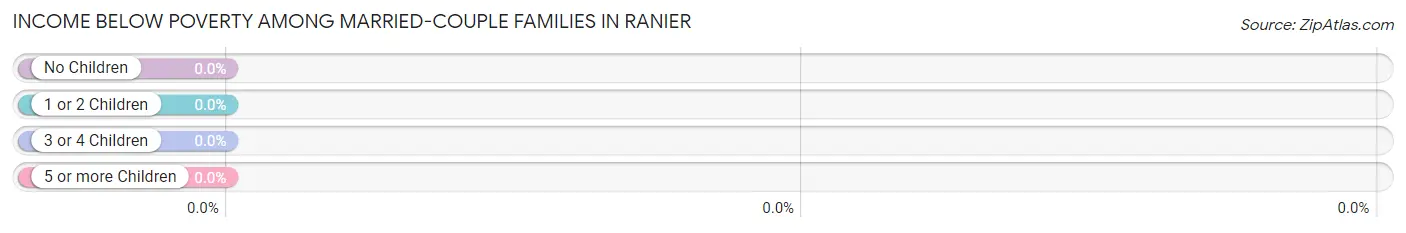
| Children | Above Poverty | Below Poverty |
| No Children | 80 (100.0%) | 0 (0.0%) |
| 1 or 2 Children | 27 (100.0%) | 0 (0.0%) |
| 3 or 4 Children | 3 (100.0%) | 0 (0.0%) |
| 5 or more Children | 0 (0.0%) | 0 (0.0%) |
| Total | 110 (100.0%) | 0 (0.0%) |
Income Below Poverty Among Single-Parent Households in Ranier
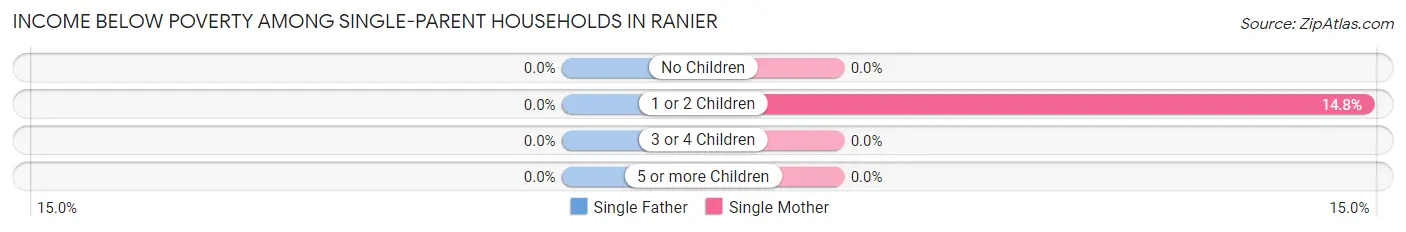
| Children | Single Father | Single Mother |
| No Children | 0 (0.0%) | 0 (0.0%) |
| 1 or 2 Children | 0 (0.0%) | 4 (14.8%) |
| 3 or 4 Children | 0 (0.0%) | 0 (0.0%) |
| 5 or more Children | 0 (0.0%) | 0 (0.0%) |
| Total | 0 (0.0%) | 4 (9.5%) |
Income Below Poverty Among Married-Couple vs Single-Parent Households in Ranier
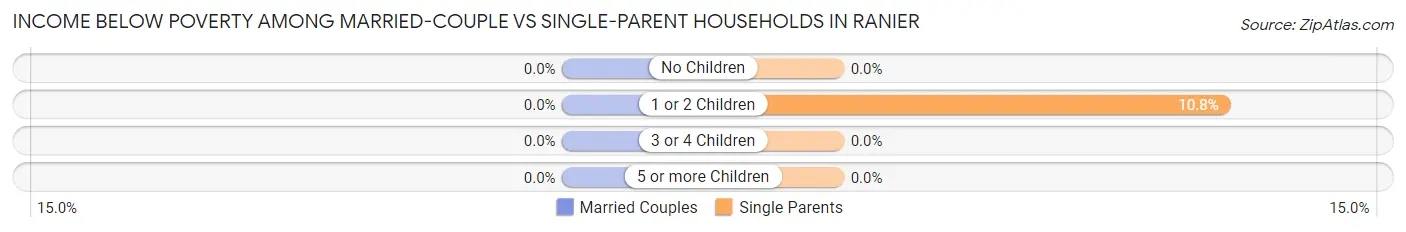
| Children | Married-Couple Families | Single-Parent Households |
| No Children | 0 (0.0%) | 0 (0.0%) |
| 1 or 2 Children | 0 (0.0%) | 4 (10.8%) |
| 3 or 4 Children | 0 (0.0%) | 0 (0.0%) |
| 5 or more Children | 0 (0.0%) | 0 (0.0%) |
| Total | 0 (0.0%) | 4 (7.1%) |
Race in Ranier
The most populous races in Ranier are White / Caucasian (567 | 94.2%), Two or more Races (31 | 5.1%), and Native / Alaskan (4 | 0.7%).
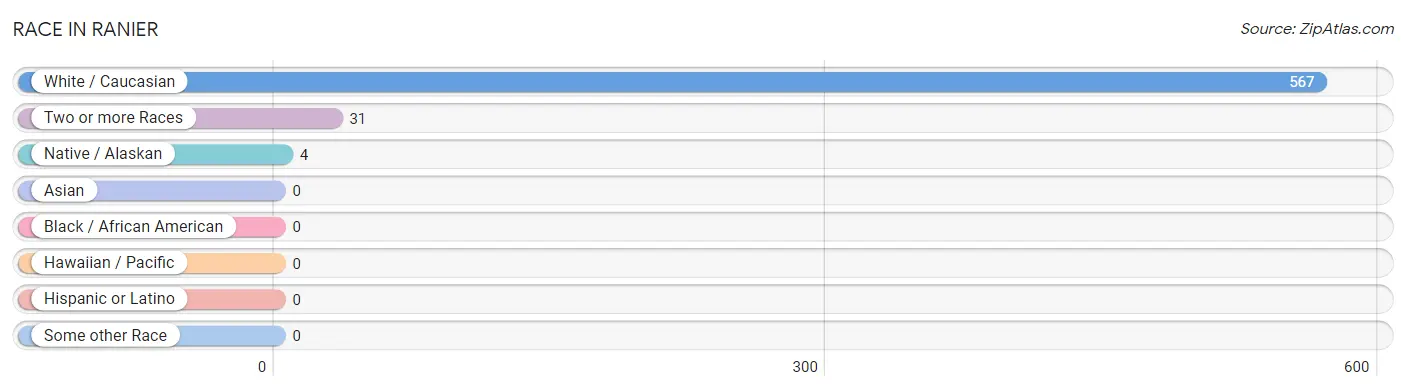
| Race | # Population | % Population |
| Asian | 0 | 0.0% |
| Black / African American | 0 | 0.0% |
| Hawaiian / Pacific | 0 | 0.0% |
| Hispanic or Latino | 0 | 0.0% |
| Native / Alaskan | 4 | 0.7% |
| White / Caucasian | 567 | 94.2% |
| Two or more Races | 31 | 5.1% |
| Some other Race | 0 | 0.0% |
| Total | 602 | 100.0% |
Ancestry in Ranier
The most populous ancestries reported in Ranier are German (101 | 16.8%), Swedish (86 | 14.3%), Norwegian (81 | 13.5%), Irish (71 | 11.8%), and English (57 | 9.5%), together accounting for 65.8% of all Ranier residents.
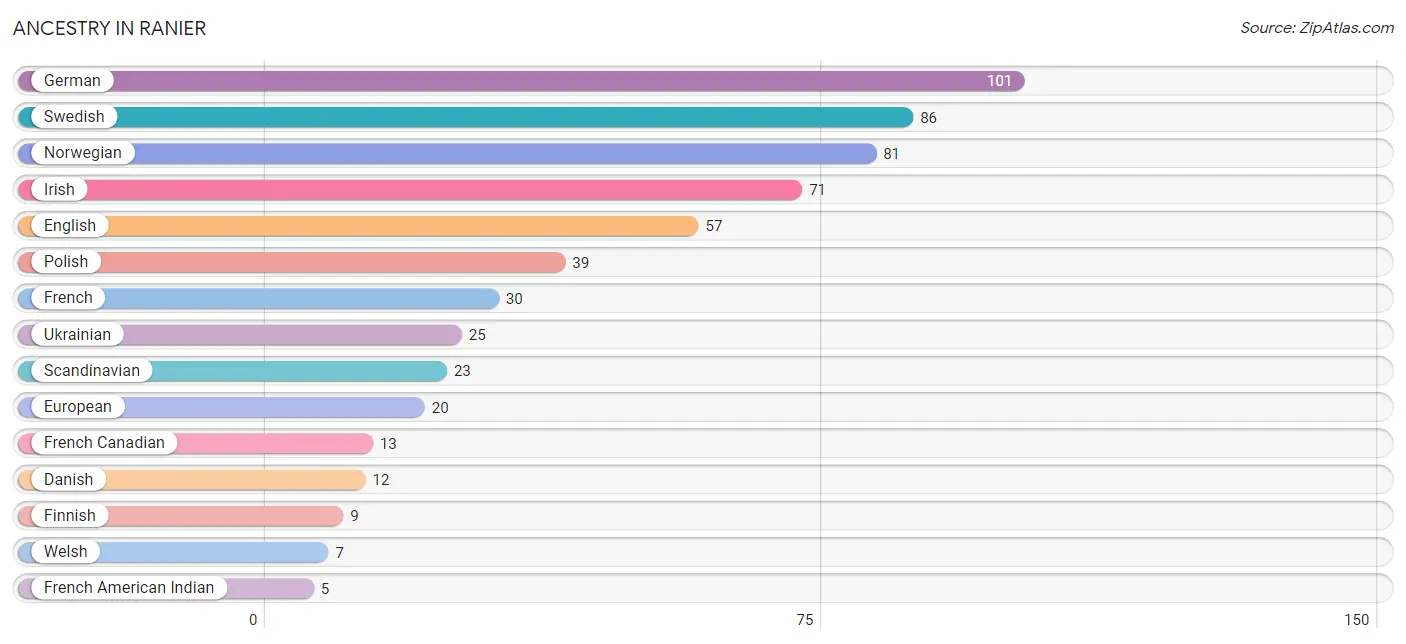
| Ancestry | # Population | % Population |
| American | 2 | 0.3% |
| British | 4 | 0.7% |
| Canadian | 2 | 0.3% |
| Chippewa | 4 | 0.7% |
| Czech | 2 | 0.3% |
| Czechoslovakian | 3 | 0.5% |
| Danish | 12 | 2.0% |
| Dutch | 1 | 0.2% |
| English | 57 | 9.5% |
| European | 20 | 3.3% |
| Finnish | 9 | 1.5% |
| French | 30 | 5.0% |
| French American Indian | 5 | 0.8% |
| French Canadian | 13 | 2.2% |
| German | 101 | 16.8% |
| Icelander | 2 | 0.3% |
| Irish | 71 | 11.8% |
| Italian | 2 | 0.3% |
| Norwegian | 81 | 13.5% |
| Polish | 39 | 6.5% |
| Scandinavian | 23 | 3.8% |
| Scotch-Irish | 3 | 0.5% |
| Scottish | 5 | 0.8% |
| Sioux | 1 | 0.2% |
| Swedish | 86 | 14.3% |
| Ukrainian | 25 | 4.2% |
| Welsh | 7 | 1.2% | View All 27 Rows |
Immigrants in Ranier
The most numerous immigrant groups reported in Ranier came from Canada (18 | 3.0%), Europe (2 | 0.3%), and Northern Europe (2 | 0.3%), together accounting for 3.6% of all Ranier residents.
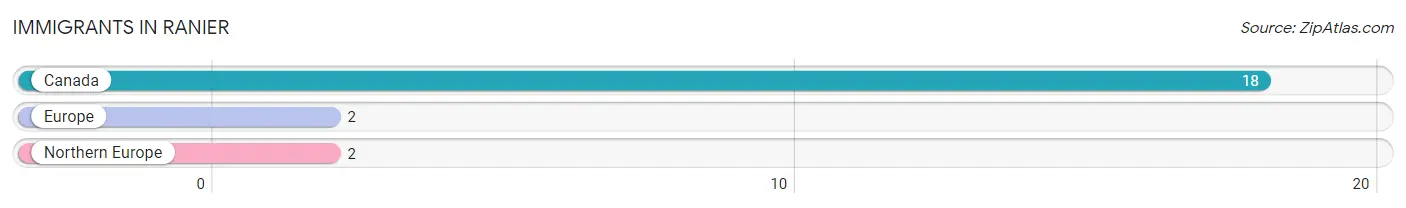
| Immigration Origin | # Population | % Population |
| Canada | 18 | 3.0% |
| Europe | 2 | 0.3% |
| Northern Europe | 2 | 0.3% | View All 3 Rows |
Sex and Age in Ranier
Sex and Age in Ranier
The most populous age groups in Ranier are 65 to 69 Years (37 | 12.1%) for men and 45 to 49 Years (39 | 13.1%) for women.
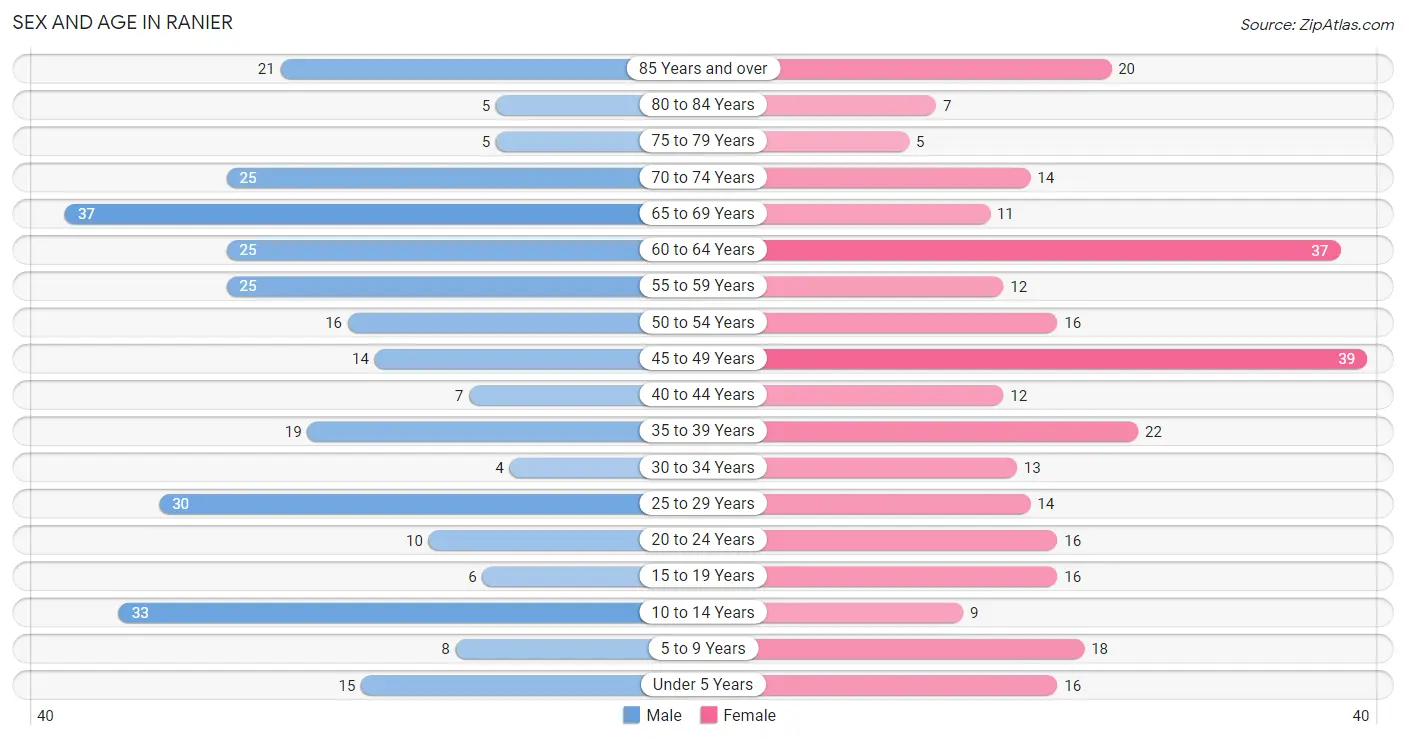
| Age Bracket | Male | Female |
| Under 5 Years | 15 (4.9%) | 16 (5.4%) |
| 5 to 9 Years | 8 (2.6%) | 18 (6.1%) |
| 10 to 14 Years | 33 (10.8%) | 9 (3.0%) |
| 15 to 19 Years | 6 (2.0%) | 16 (5.4%) |
| 20 to 24 Years | 10 (3.3%) | 16 (5.4%) |
| 25 to 29 Years | 30 (9.8%) | 14 (4.7%) |
| 30 to 34 Years | 4 (1.3%) | 13 (4.4%) |
| 35 to 39 Years | 19 (6.2%) | 22 (7.4%) |
| 40 to 44 Years | 7 (2.3%) | 12 (4.0%) |
| 45 to 49 Years | 14 (4.6%) | 39 (13.1%) |
| 50 to 54 Years | 16 (5.2%) | 16 (5.4%) |
| 55 to 59 Years | 25 (8.2%) | 12 (4.0%) |
| 60 to 64 Years | 25 (8.2%) | 37 (12.5%) |
| 65 to 69 Years | 37 (12.1%) | 11 (3.7%) |
| 70 to 74 Years | 25 (8.2%) | 14 (4.7%) |
| 75 to 79 Years | 5 (1.6%) | 5 (1.7%) |
| 80 to 84 Years | 5 (1.6%) | 7 (2.4%) |
| 85 Years and over | 21 (6.9%) | 20 (6.7%) |
| Total | 305 (100.0%) | 297 (100.0%) |
Families and Households in Ranier
Median Family Size in Ranier
The median family size in Ranier is 2.70 persons per family, with single female/mother families (42 | 25.3%) accounting for the largest median family size of 2.76 persons per family. On the other hand, married-couple families (110 | 66.3%) represent the smallest median family size with 2.67 persons per family.
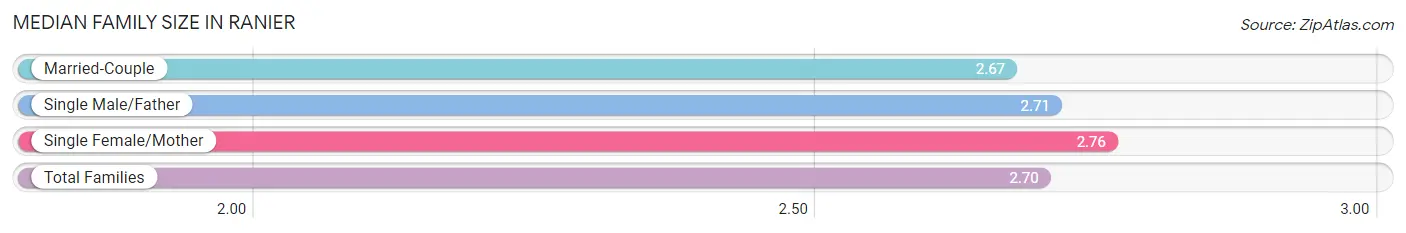
| Family Type | # Families | Family Size |
| Married-Couple | 110 (66.3%) | 2.67 |
| Single Male/Father | 14 (8.4%) | 2.71 |
| Single Female/Mother | 42 (25.3%) | 2.76 |
| Total Families | 166 (100.0%) | 2.70 |
Median Household Size in Ranier
The median household size in Ranier is 2.25 persons per household, with single male/father households (14 | 5.4%) accounting for the largest median household size of 3.86 persons per household. non-family households (95 | 36.4%) represent the smallest median household size with 1.09 persons per household.
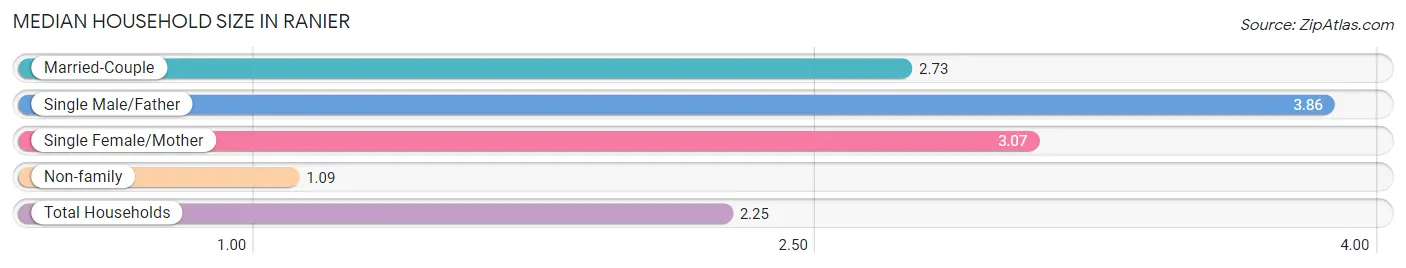
| Household Type | # Households | Household Size |
| Married-Couple | 110 (42.1%) | 2.73 |
| Single Male/Father | 14 (5.4%) | 3.86 |
| Single Female/Mother | 42 (16.1%) | 3.07 |
| Non-family | 95 (36.4%) | 1.09 |
| Total Households | 261 (100.0%) | 2.25 |
Household Size by Marriage Status in Ranier
Out of a total of 261 households in Ranier, 166 (63.6%) are family households, while 95 (36.4%) are nonfamily households. The most numerous type of family households are 2-person households, comprising 79, and the most common type of nonfamily households are 1-person households, comprising 86.
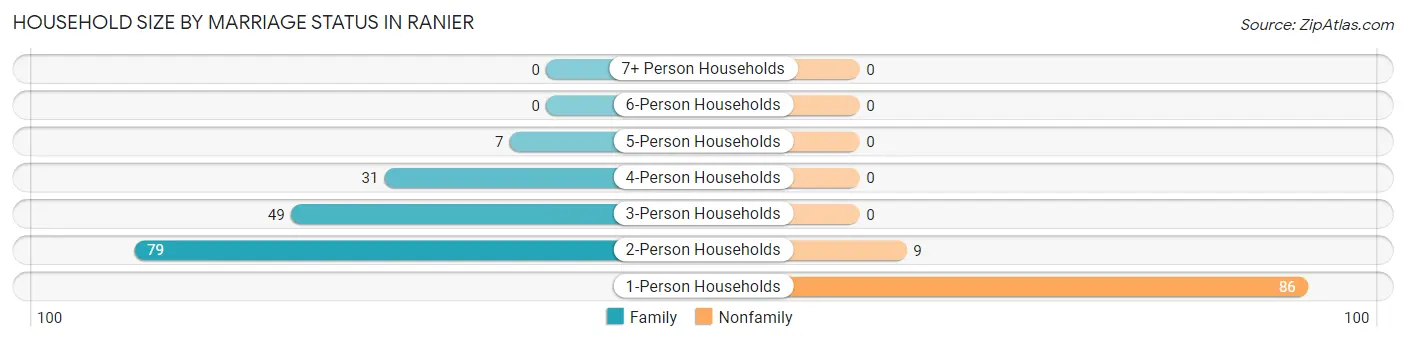
| Household Size | Family Households | Nonfamily Households |
| 1-Person Households | - | 86 (33.0%) |
| 2-Person Households | 79 (30.3%) | 9 (3.5%) |
| 3-Person Households | 49 (18.8%) | 0 (0.0%) |
| 4-Person Households | 31 (11.9%) | 0 (0.0%) |
| 5-Person Households | 7 (2.7%) | 0 (0.0%) |
| 6-Person Households | 0 (0.0%) | 0 (0.0%) |
| 7+ Person Households | 0 (0.0%) | 0 (0.0%) |
| Total | 166 (63.6%) | 95 (36.4%) |
Female Fertility in Ranier
Fertility by Age in Ranier
Average fertility rate in Ranier is 37.0 births per 1,000 women. Women in the age bracket of 20 to 34 years have the highest fertility rate with 116.0 births per 1,000 women. Women in the age bracket of 20 to 34 years acount for 100.0% of all women with births.
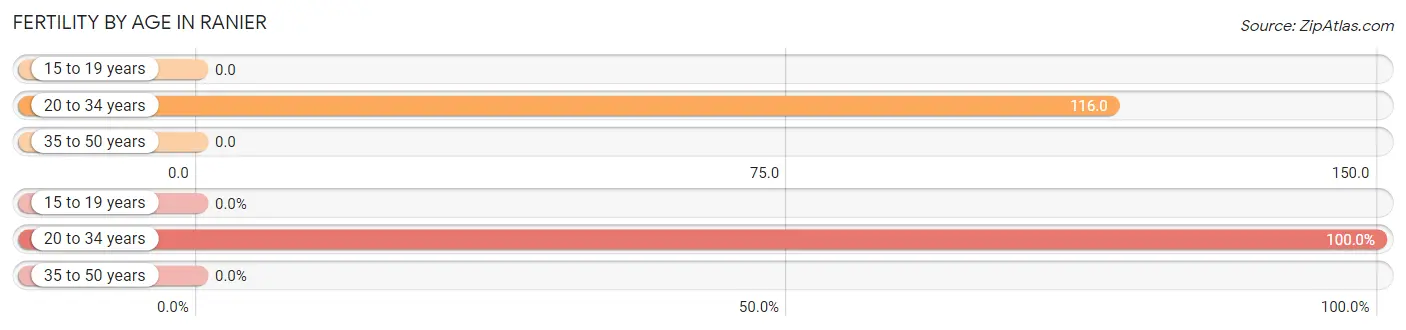
| Age Bracket | Women with Births | Births / 1,000 Women |
| 15 to 19 years | 0 (0.0%) | 0.0 |
| 20 to 34 years | 5 (100.0%) | 116.0 |
| 35 to 50 years | 0 (0.0%) | 0.0 |
| Total | 5 (100.0%) | 37.0 |
Fertility by Age by Marriage Status in Ranier
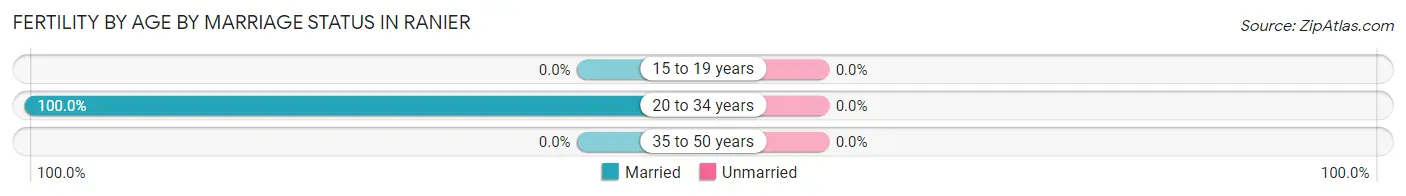
| Age Bracket | Married | Unmarried |
| 15 to 19 years | 0 (0.0%) | 0 (0.0%) |
| 20 to 34 years | 5 (100.0%) | 0 (0.0%) |
| 35 to 50 years | 0 (0.0%) | 0 (0.0%) |
| Total | 5 (100.0%) | 0 (0.0%) |
Fertility by Education in Ranier
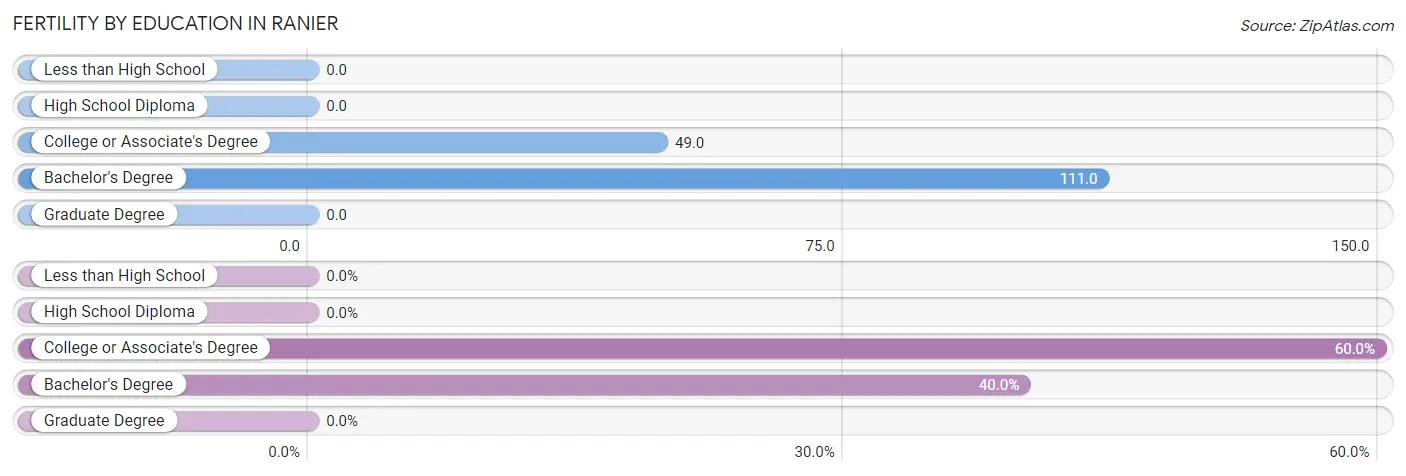
| Educational Attainment | Women with Births | Births / 1,000 Women |
| Less than High School | 0 (0.0%) | 0.0 |
| High School Diploma | 0 (0.0%) | 0.0 |
| College or Associate's Degree | 3 (60.0%) | 49.0 |
| Bachelor's Degree | 2 (40.0%) | 111.0 |
| Graduate Degree | 0 (0.0%) | 0.0 |
| Total | 5 (100.0%) | 37.0 |
Fertility by Education by Marriage Status in Ranier
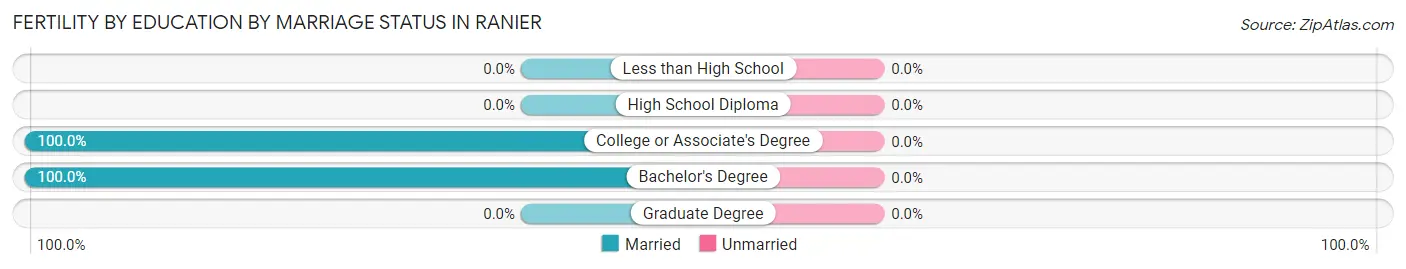
| Educational Attainment | Married | Unmarried |
| Less than High School | 0 (0.0%) | 0 (0.0%) |
| High School Diploma | 0 (0.0%) | 0 (0.0%) |
| College or Associate's Degree | 3 (100.0%) | 0 (0.0%) |
| Bachelor's Degree | 2 (100.0%) | 0 (0.0%) |
| Graduate Degree | 0 (0.0%) | 0 (0.0%) |
| Total | 5 (100.0%) | 0 (0.0%) |
Employment Characteristics in Ranier
Employment by Class of Employer in Ranier
Among the 278 employed individuals in Ranier, private company employees (171 | 61.5%), not-for-profit organizations (51 | 18.3%), and local government employees (34 | 12.2%) make up the most common classes of employment.
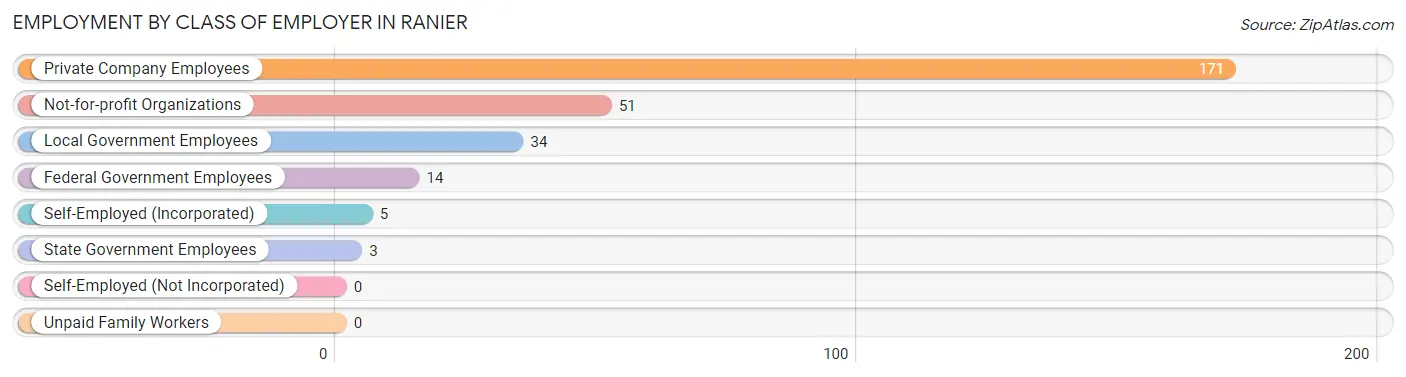
| Employer Class | # Employees | % Employees |
| Private Company Employees | 171 | 61.5% |
| Self-Employed (Incorporated) | 5 | 1.8% |
| Self-Employed (Not Incorporated) | 0 | 0.0% |
| Not-for-profit Organizations | 51 | 18.3% |
| Local Government Employees | 34 | 12.2% |
| State Government Employees | 3 | 1.1% |
| Federal Government Employees | 14 | 5.0% |
| Unpaid Family Workers | 0 | 0.0% |
| Total | 278 | 100.0% |
Employment Status by Age in Ranier
According to the labor force statistics for Ranier, out of the total population over 16 years of age (502), 59.8% or 300 individuals are in the labor force, with 6.3% or 19 of them unemployed. The age group with the highest labor force participation rate is 20 to 24 years, with 100.0% or 26 individuals in the labor force. Within the labor force, the 25 to 29 years age range has the highest percentage of unemployed individuals, with 22.7% or 10 of them being unemployed.
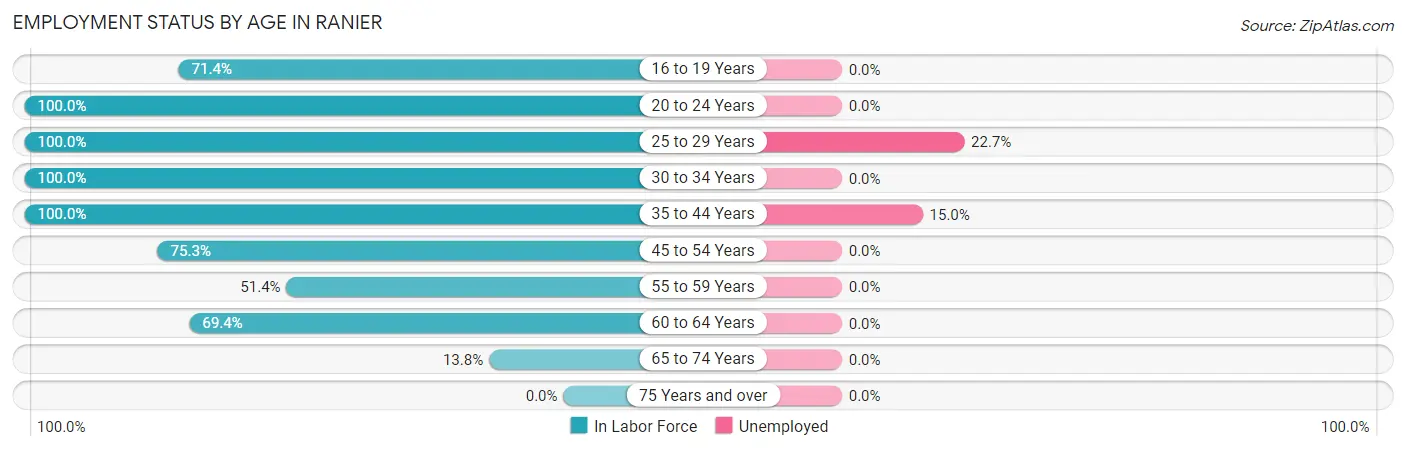
| Age Bracket | In Labor Force | Unemployed |
| 16 to 19 Years | 15 (71.4%) | 0 (0.0%) |
| 20 to 24 Years | 26 (100.0%) | 0 (0.0%) |
| 25 to 29 Years | 44 (100.0%) | 10 (22.7%) |
| 30 to 34 Years | 17 (100.0%) | 0 (0.0%) |
| 35 to 44 Years | 60 (100.0%) | 9 (15.0%) |
| 45 to 54 Years | 64 (75.3%) | 0 (0.0%) |
| 55 to 59 Years | 19 (51.4%) | 0 (0.0%) |
| 60 to 64 Years | 43 (69.4%) | 0 (0.0%) |
| 65 to 74 Years | 12 (13.8%) | 0 (0.0%) |
| 75 Years and over | 0 (0.0%) | 0 (0.0%) |
| Total | 300 (59.8%) | 19 (6.3%) |
Employment Status by Educational Attainment in Ranier
According to labor force statistics for Ranier, 81.0% of individuals (247) out of the total population between 25 and 64 years of age (305) are in the labor force, with 7.7% or 19 of them being unemployed. The group with the highest labor force participation rate are those with the educational attainment of college / associate degree, with 87.5% or 126 individuals in the labor force. Within the labor force, individuals with high school diploma education have the highest percentage of unemployment, with 18.6% or 16 of them being unemployed.
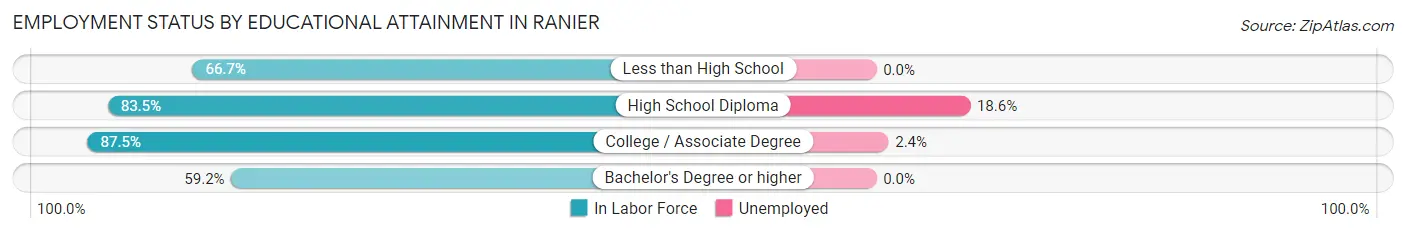
| Educational Attainment | In Labor Force | Unemployed |
| Less than High School | 6 (66.7%) | 0 (0.0%) |
| High School Diploma | 86 (83.5%) | 19 (18.6%) |
| College / Associate Degree | 126 (87.5%) | 3 (2.4%) |
| Bachelor's Degree or higher | 29 (59.2%) | 0 (0.0%) |
| Total | 247 (81.0%) | 23 (7.7%) |
Employment Occupations by Sex in Ranier
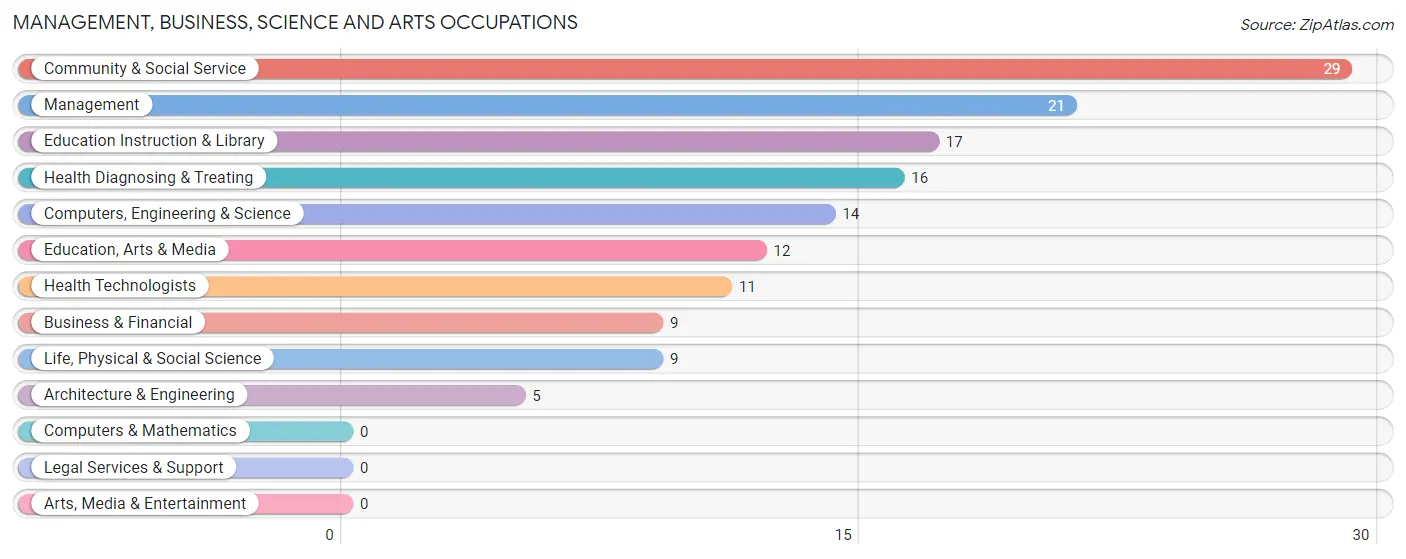
Management, Business, Science and Arts Occupations
The most common Management, Business, Science and Arts occupations in Ranier are Community & Social Service (29 | 10.3%), Management (21 | 7.5%), Education Instruction & Library (17 | 6.0%), Health Diagnosing & Treating (16 | 5.7%), and Computers, Engineering & Science (14 | 5.0%).
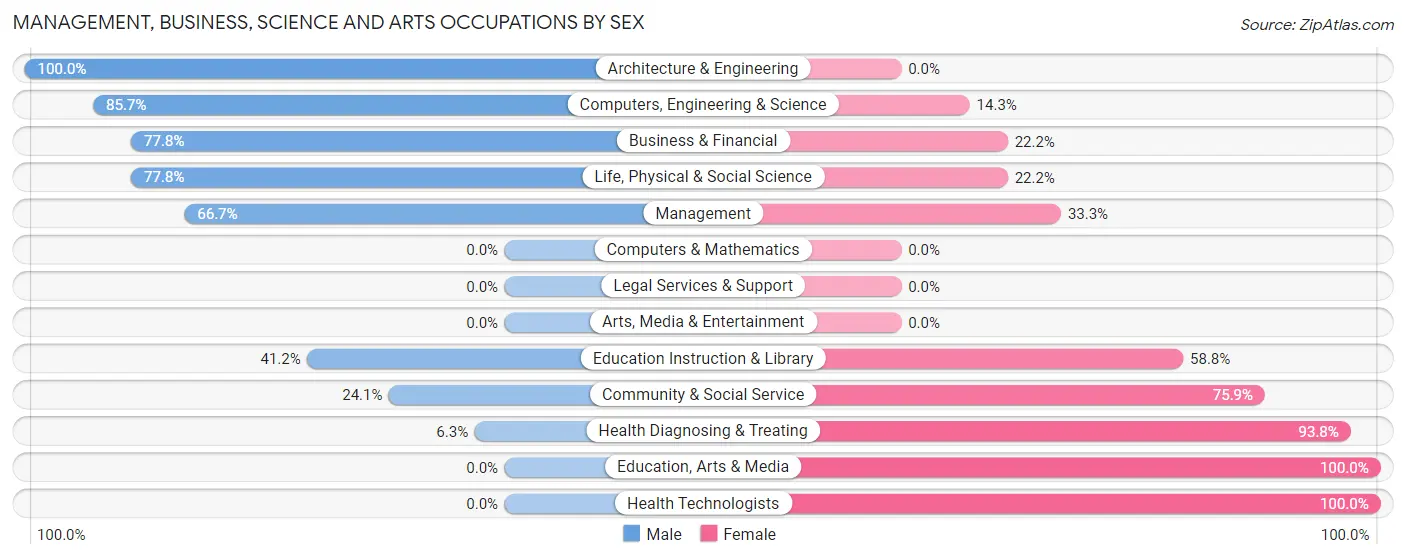
Management, Business, Science and Arts Occupations by Sex
Within the Management, Business, Science and Arts occupations in Ranier, the most male-oriented occupations are Architecture & Engineering (100.0%), Computers, Engineering & Science (85.7%), and Business & Financial (77.8%), while the most female-oriented occupations are Education, Arts & Media (100.0%), Health Technologists (100.0%), and Health Diagnosing & Treating (93.8%).
| Occupation | Male | Female |
| Management | 14 (66.7%) | 7 (33.3%) |
| Business & Financial | 7 (77.8%) | 2 (22.2%) |
| Computers, Engineering & Science | 12 (85.7%) | 2 (14.3%) |
| Computers & Mathematics | 0 (0.0%) | 0 (0.0%) |
| Architecture & Engineering | 5 (100.0%) | 0 (0.0%) |
| Life, Physical & Social Science | 7 (77.8%) | 2 (22.2%) |
| Community & Social Service | 7 (24.1%) | 22 (75.9%) |
| Education, Arts & Media | 0 (0.0%) | 12 (100.0%) |
| Legal Services & Support | 0 (0.0%) | 0 (0.0%) |
| Education Instruction & Library | 7 (41.2%) | 10 (58.8%) |
| Arts, Media & Entertainment | 0 (0.0%) | 0 (0.0%) |
| Health Diagnosing & Treating | 1 (6.2%) | 15 (93.8%) |
| Health Technologists | 0 (0.0%) | 11 (100.0%) |
| Total (Category) | 41 (46.1%) | 48 (53.9%) |
| Total (Overall) | 118 (42.0%) | 163 (58.0%) |
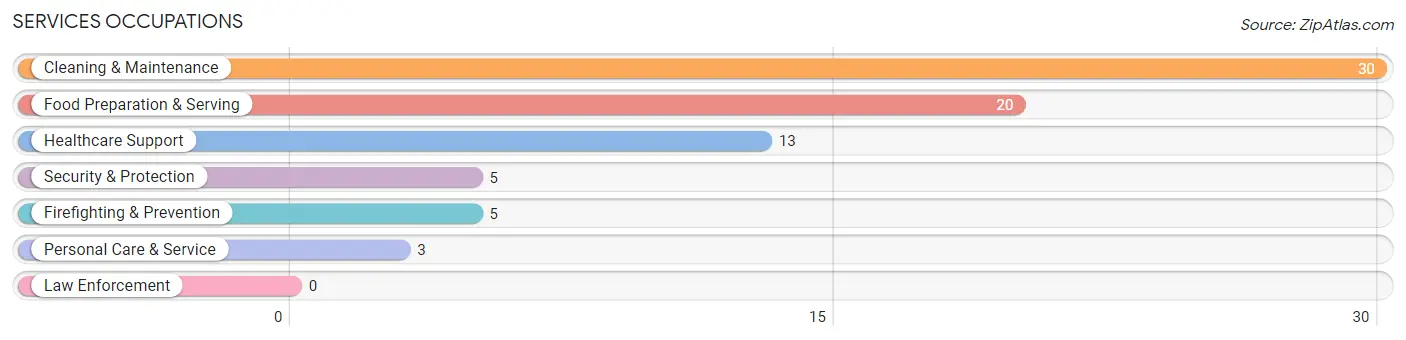
Services Occupations
The most common Services occupations in Ranier are Cleaning & Maintenance (30 | 10.7%), Food Preparation & Serving (20 | 7.1%), Healthcare Support (13 | 4.6%), Security & Protection (5 | 1.8%), and Firefighting & Prevention (5 | 1.8%).
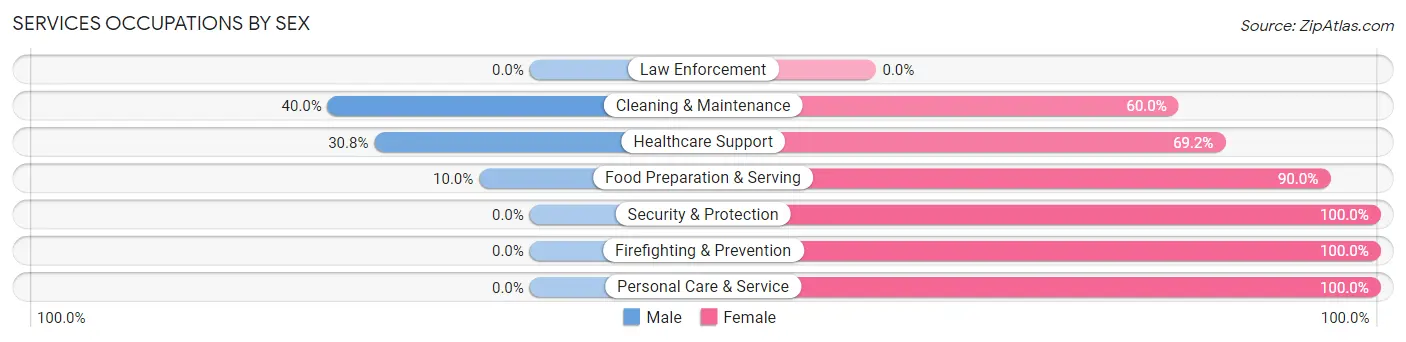
Services Occupations by Sex
Within the Services occupations in Ranier, the most male-oriented occupations are Cleaning & Maintenance (40.0%), Healthcare Support (30.8%), and Food Preparation & Serving (10.0%), while the most female-oriented occupations are Security & Protection (100.0%), Firefighting & Prevention (100.0%), and Personal Care & Service (100.0%).
| Occupation | Male | Female |
| Healthcare Support | 4 (30.8%) | 9 (69.2%) |
| Security & Protection | 0 (0.0%) | 5 (100.0%) |
| Firefighting & Prevention | 0 (0.0%) | 5 (100.0%) |
| Law Enforcement | 0 (0.0%) | 0 (0.0%) |
| Food Preparation & Serving | 2 (10.0%) | 18 (90.0%) |
| Cleaning & Maintenance | 12 (40.0%) | 18 (60.0%) |
| Personal Care & Service | 0 (0.0%) | 3 (100.0%) |
| Total (Category) | 18 (25.4%) | 53 (74.7%) |
| Total (Overall) | 118 (42.0%) | 163 (58.0%) |
Sales and Office Occupations
The most common Sales and Office occupations in Ranier are Office & Administration (58 | 20.6%), and Sales & Related (11 | 3.9%).
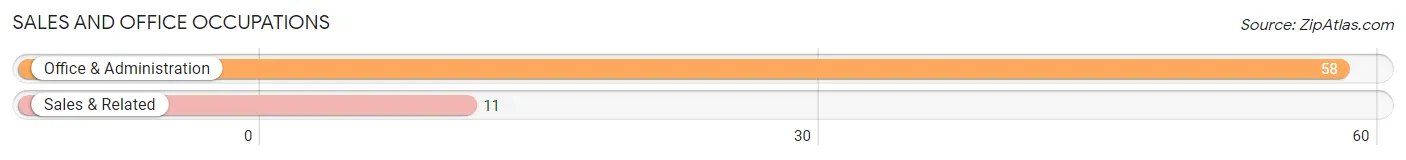
Sales and Office Occupations by Sex
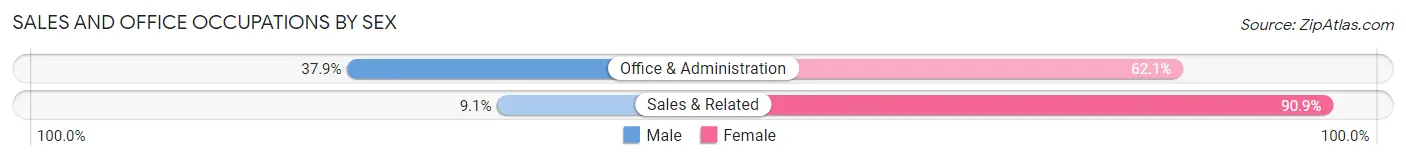
| Occupation | Male | Female |
| Sales & Related | 1 (9.1%) | 10 (90.9%) |
| Office & Administration | 22 (37.9%) | 36 (62.1%) |
| Total (Category) | 23 (33.3%) | 46 (66.7%) |
| Total (Overall) | 118 (42.0%) | 163 (58.0%) |
Natural Resources, Construction and Maintenance Occupations
The most common Natural Resources, Construction and Maintenance occupations in Ranier are Construction & Extraction (13 | 4.6%), and Installation, Maintenance & Repair (5 | 1.8%).
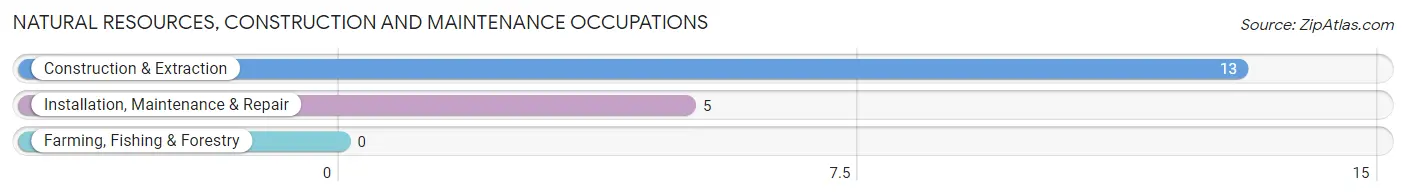
Natural Resources, Construction and Maintenance Occupations by Sex
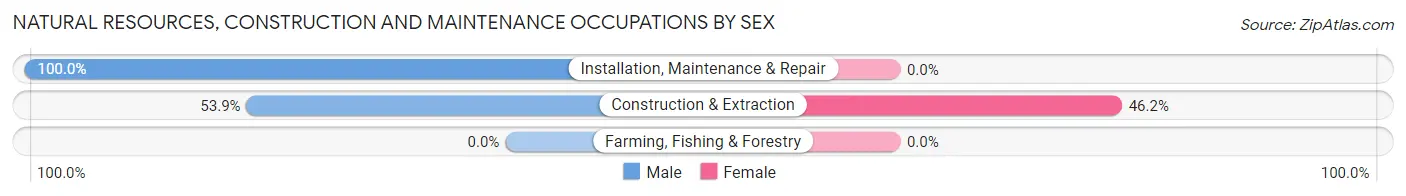
| Occupation | Male | Female |
| Farming, Fishing & Forestry | 0 (0.0%) | 0 (0.0%) |
| Construction & Extraction | 7 (53.8%) | 6 (46.2%) |
| Installation, Maintenance & Repair | 5 (100.0%) | 0 (0.0%) |
| Total (Category) | 12 (66.7%) | 6 (33.3%) |
| Total (Overall) | 118 (42.0%) | 163 (58.0%) |
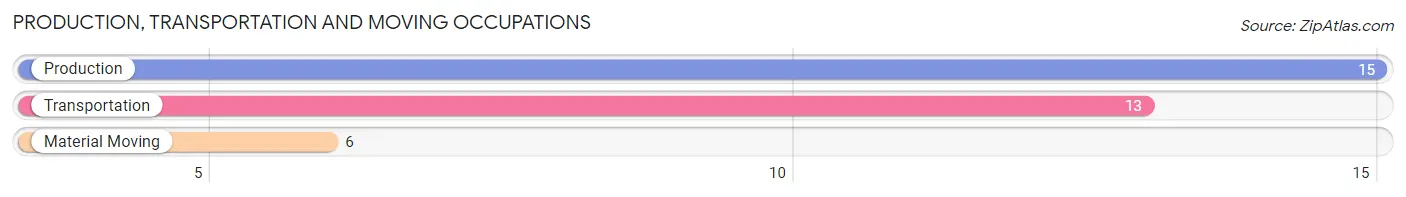
Production, Transportation and Moving Occupations
The most common Production, Transportation and Moving occupations in Ranier are Production (15 | 5.3%), Transportation (13 | 4.6%), and Material Moving (6 | 2.1%).
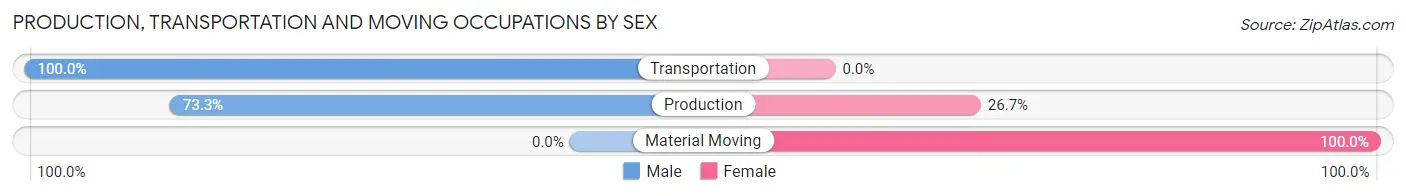
Production, Transportation and Moving Occupations by Sex
| Occupation | Male | Female |
| Production | 11 (73.3%) | 4 (26.7%) |
| Transportation | 13 (100.0%) | 0 (0.0%) |
| Material Moving | 0 (0.0%) | 6 (100.0%) |
| Total (Category) | 24 (70.6%) | 10 (29.4%) |
| Total (Overall) | 118 (42.0%) | 163 (58.0%) |
Employment Industries by Sex in Ranier
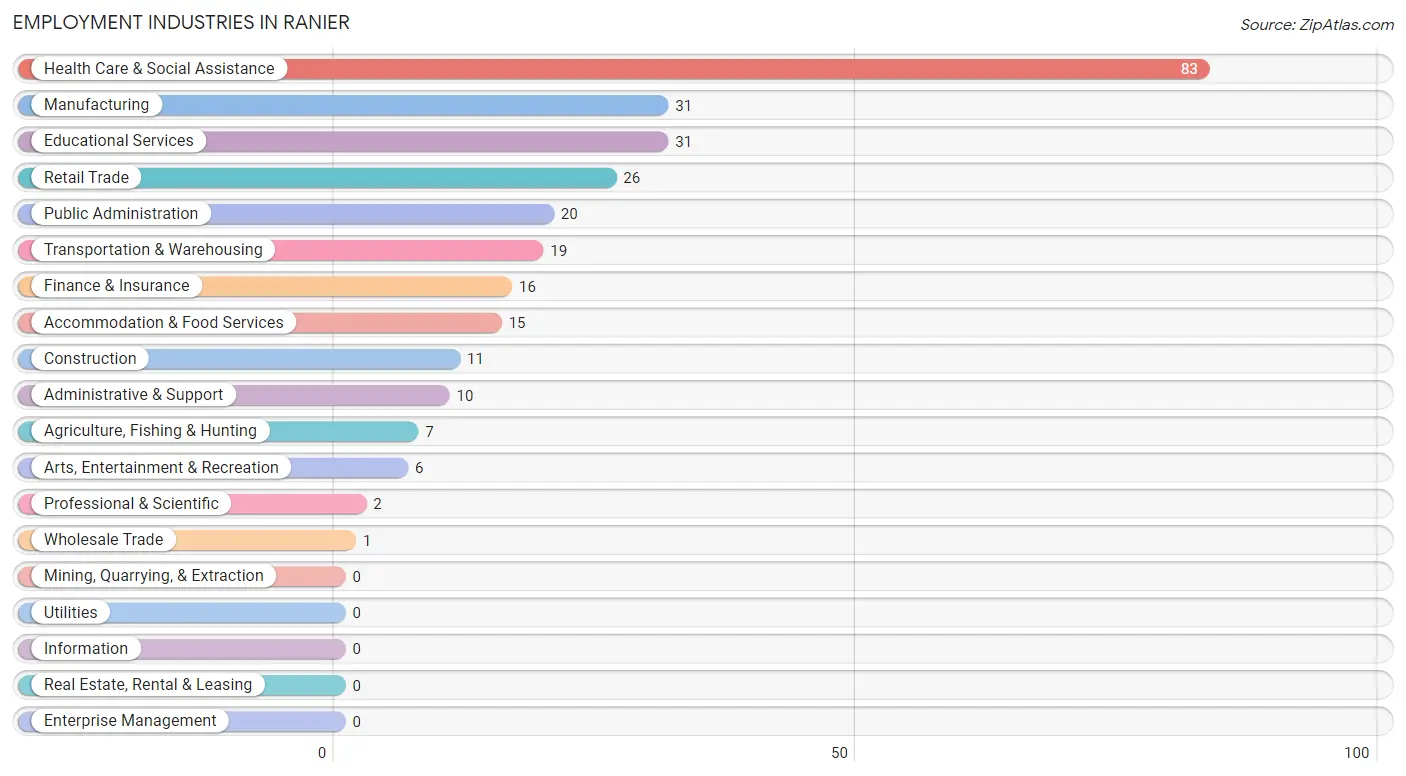
Employment Industries in Ranier
The major employment industries in Ranier include Health Care & Social Assistance (83 | 29.5%), Manufacturing (31 | 11.0%), Educational Services (31 | 11.0%), Retail Trade (26 | 9.2%), and Public Administration (20 | 7.1%).
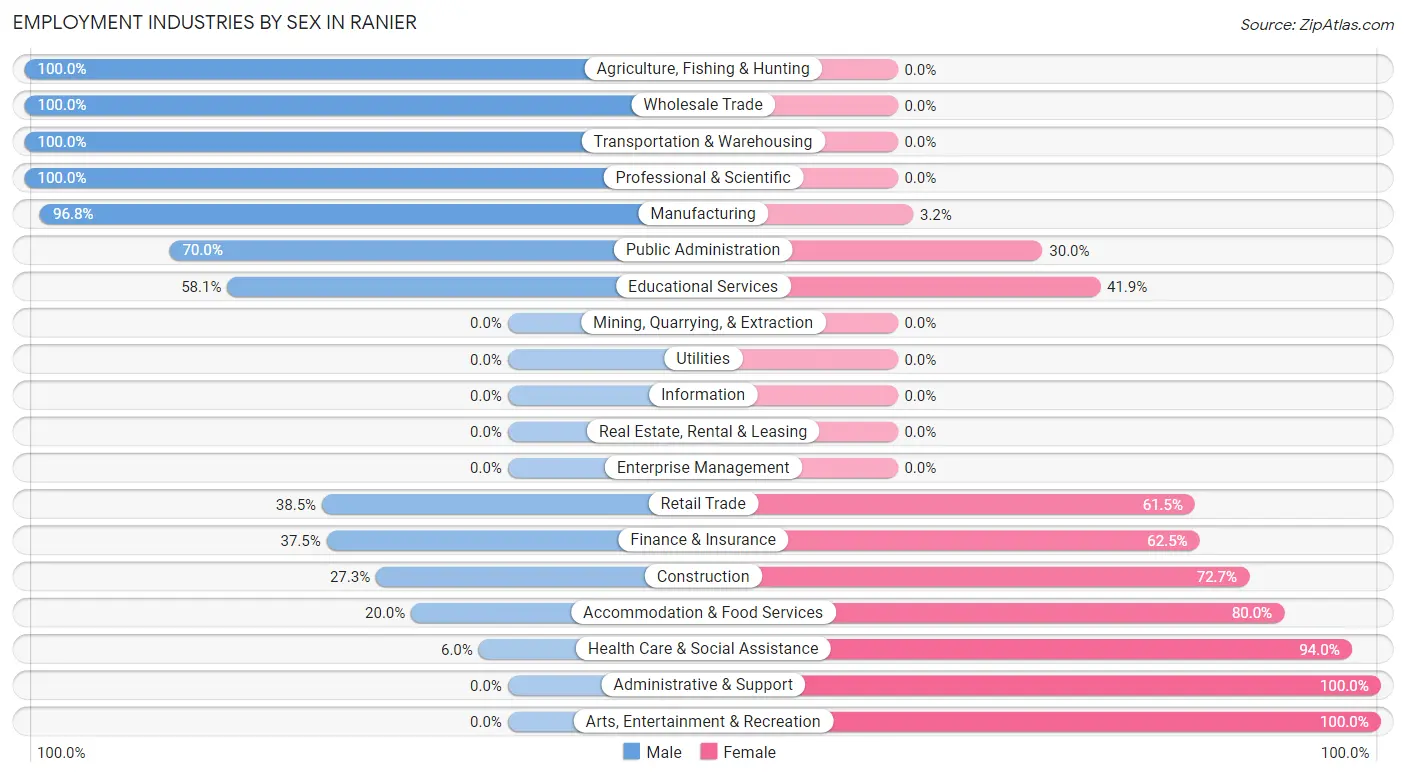
Employment Industries by Sex in Ranier
The Ranier industries that see more men than women are Agriculture, Fishing & Hunting (100.0%), Wholesale Trade (100.0%), and Transportation & Warehousing (100.0%), whereas the industries that tend to have a higher number of women are Administrative & Support (100.0%), Arts, Entertainment & Recreation (100.0%), and Health Care & Social Assistance (94.0%).
| Industry | Male | Female |
| Agriculture, Fishing & Hunting | 7 (100.0%) | 0 (0.0%) |
| Mining, Quarrying, & Extraction | 0 (0.0%) | 0 (0.0%) |
| Construction | 3 (27.3%) | 8 (72.7%) |
| Manufacturing | 30 (96.8%) | 1 (3.2%) |
| Wholesale Trade | 1 (100.0%) | 0 (0.0%) |
| Retail Trade | 10 (38.5%) | 16 (61.5%) |
| Transportation & Warehousing | 19 (100.0%) | 0 (0.0%) |
| Utilities | 0 (0.0%) | 0 (0.0%) |
| Information | 0 (0.0%) | 0 (0.0%) |
| Finance & Insurance | 6 (37.5%) | 10 (62.5%) |
| Real Estate, Rental & Leasing | 0 (0.0%) | 0 (0.0%) |
| Professional & Scientific | 2 (100.0%) | 0 (0.0%) |
| Enterprise Management | 0 (0.0%) | 0 (0.0%) |
| Administrative & Support | 0 (0.0%) | 10 (100.0%) |
| Educational Services | 18 (58.1%) | 13 (41.9%) |
| Health Care & Social Assistance | 5 (6.0%) | 78 (94.0%) |
| Arts, Entertainment & Recreation | 0 (0.0%) | 6 (100.0%) |
| Accommodation & Food Services | 3 (20.0%) | 12 (80.0%) |
| Public Administration | 14 (70.0%) | 6 (30.0%) |
| Total | 118 (42.0%) | 163 (58.0%) |
Education in Ranier
School Enrollment in Ranier
The most common levels of schooling among the 100 students in Ranier are elementary school (30 | 30.0%), middle school (29 | 29.0%), and high school (25 | 25.0%).
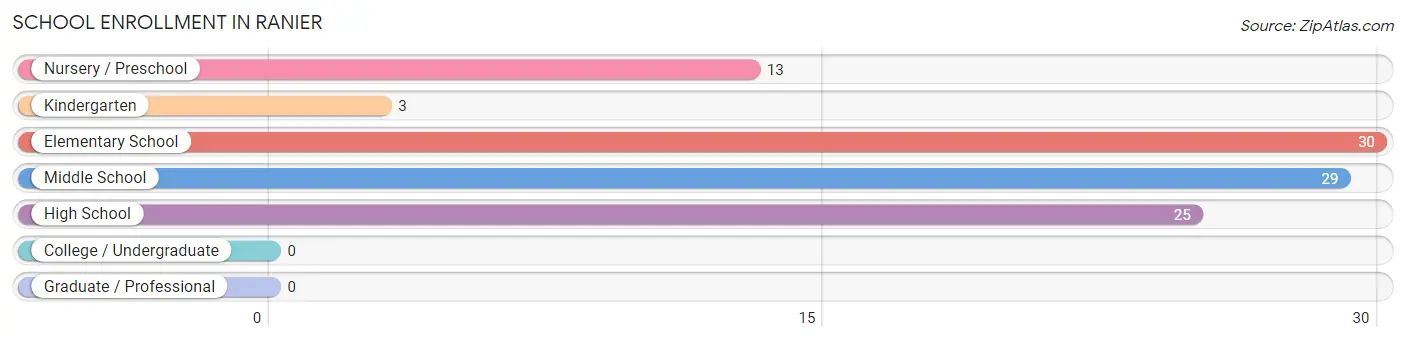
| School Level | # Students | % Students |
| Nursery / Preschool | 13 | 13.0% |
| Kindergarten | 3 | 3.0% |
| Elementary School | 30 | 30.0% |
| Middle School | 29 | 29.0% |
| High School | 25 | 25.0% |
| College / Undergraduate | 0 | 0.0% |
| Graduate / Professional | 0 | 0.0% |
| Total | 100 | 100.0% |
School Enrollment by Age by Funding Source in Ranier
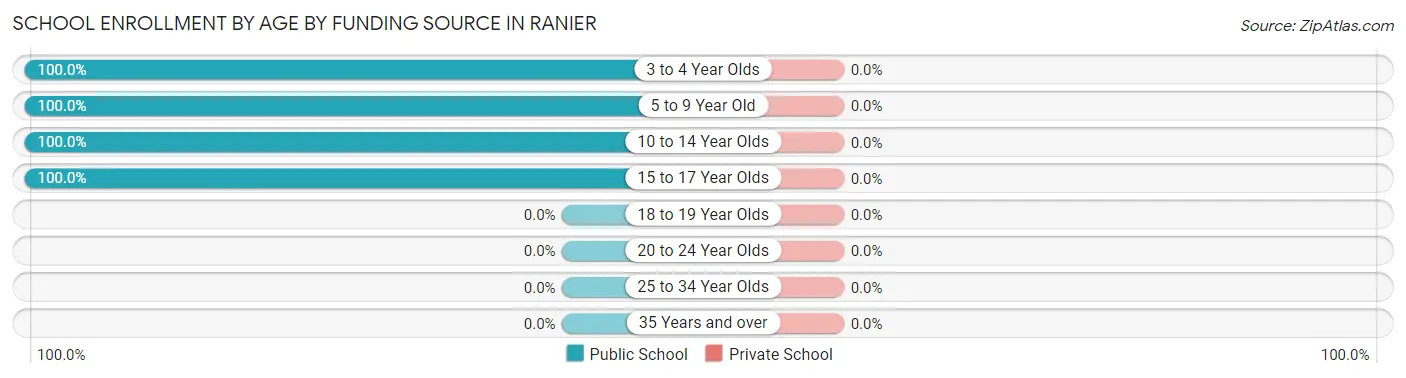
| Age Bracket | Public School | Private School |
| 3 to 4 Year Olds | 13 (100.0%) | 0 (0.0%) |
| 5 to 9 Year Old | 26 (100.0%) | 0 (0.0%) |
| 10 to 14 Year Olds | 42 (100.0%) | 0 (0.0%) |
| 15 to 17 Year Olds | 19 (100.0%) | 0 (0.0%) |
| 18 to 19 Year Olds | 0 (0.0%) | 0 (0.0%) |
| 20 to 24 Year Olds | 0 (0.0%) | 0 (0.0%) |
| 25 to 34 Year Olds | 0 (0.0%) | 0 (0.0%) |
| 35 Years and over | 0 (0.0%) | 0 (0.0%) |
| Total | 100 (100.0%) | 0 (0.0%) |
Educational Attainment by Field of Study in Ranier
Education (25 | 32.1%), business (17 | 21.8%), science & technology (10 | 12.8%), visual & performing arts (8 | 10.3%), and liberal arts & history (5 | 6.4%) are the most common fields of study among 78 individuals in Ranier who have obtained a bachelor's degree or higher.
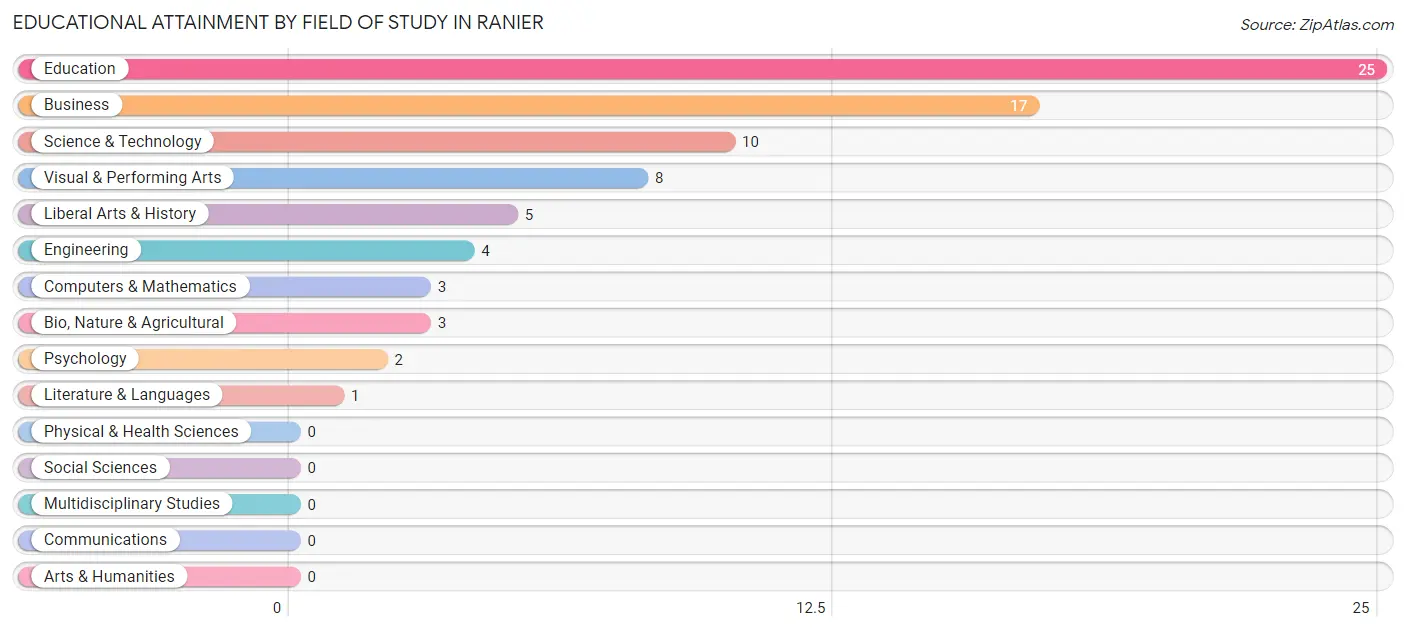
| Field of Study | # Graduates | % Graduates |
| Computers & Mathematics | 3 | 3.8% |
| Bio, Nature & Agricultural | 3 | 3.8% |
| Physical & Health Sciences | 0 | 0.0% |
| Psychology | 2 | 2.6% |
| Social Sciences | 0 | 0.0% |
| Engineering | 4 | 5.1% |
| Multidisciplinary Studies | 0 | 0.0% |
| Science & Technology | 10 | 12.8% |
| Business | 17 | 21.8% |
| Education | 25 | 32.1% |
| Literature & Languages | 1 | 1.3% |
| Liberal Arts & History | 5 | 6.4% |
| Visual & Performing Arts | 8 | 10.3% |
| Communications | 0 | 0.0% |
| Arts & Humanities | 0 | 0.0% |
| Total | 78 | 100.0% |
Transportation & Commute in Ranier
Vehicle Availability by Sex in Ranier
The most prevalent vehicle ownership categories in Ranier are males with 2 vehicles (65, accounting for 55.1%) and females with 2 vehicles (72, making up 40.6%).
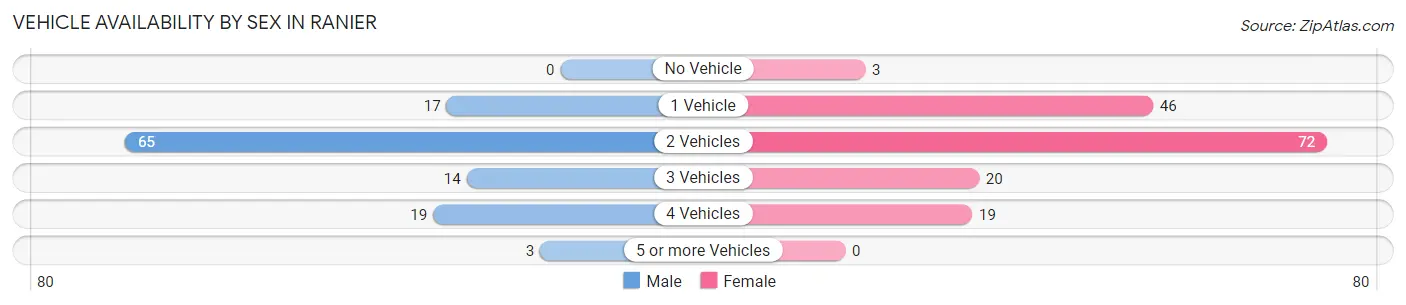
| Vehicles Available | Male | Female |
| No Vehicle | 0 (0.0%) | 3 (1.9%) |
| 1 Vehicle | 17 (14.4%) | 46 (28.7%) |
| 2 Vehicles | 65 (55.1%) | 72 (45.0%) |
| 3 Vehicles | 14 (11.9%) | 20 (12.5%) |
| 4 Vehicles | 19 (16.1%) | 19 (11.9%) |
| 5 or more Vehicles | 3 (2.5%) | 0 (0.0%) |
| Total | 118 (100.0%) | 160 (100.0%) |
Commute Time in Ranier
The most frequently occuring commute durations in Ranier are 10 to 14 minutes (95 commuters, 36.7%), 5 to 9 minutes (66 commuters, 25.5%), and 15 to 19 minutes (38 commuters, 14.7%).
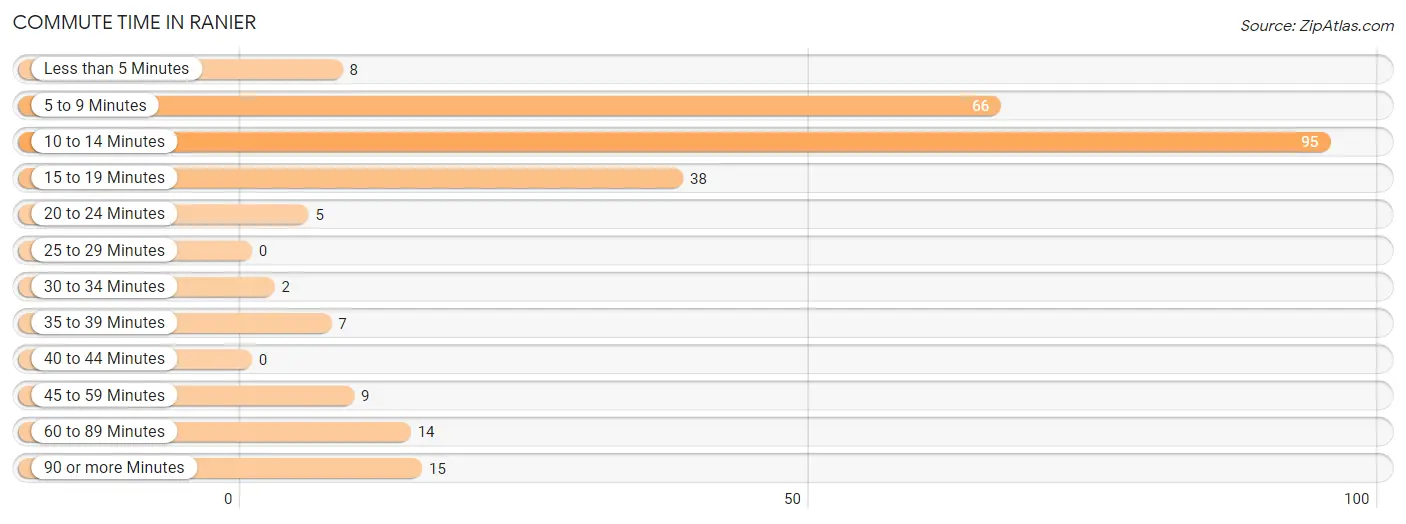
| Commute Time | # Commuters | % Commuters |
| Less than 5 Minutes | 8 | 3.1% |
| 5 to 9 Minutes | 66 | 25.5% |
| 10 to 14 Minutes | 95 | 36.7% |
| 15 to 19 Minutes | 38 | 14.7% |
| 20 to 24 Minutes | 5 | 1.9% |
| 25 to 29 Minutes | 0 | 0.0% |
| 30 to 34 Minutes | 2 | 0.8% |
| 35 to 39 Minutes | 7 | 2.7% |
| 40 to 44 Minutes | 0 | 0.0% |
| 45 to 59 Minutes | 9 | 3.5% |
| 60 to 89 Minutes | 14 | 5.4% |
| 90 or more Minutes | 15 | 5.8% |
Commute Time by Sex in Ranier
The most common commute times in Ranier are 10 to 14 minutes (39 commuters, 34.8%) for males and 10 to 14 minutes (56 commuters, 38.1%) for females.
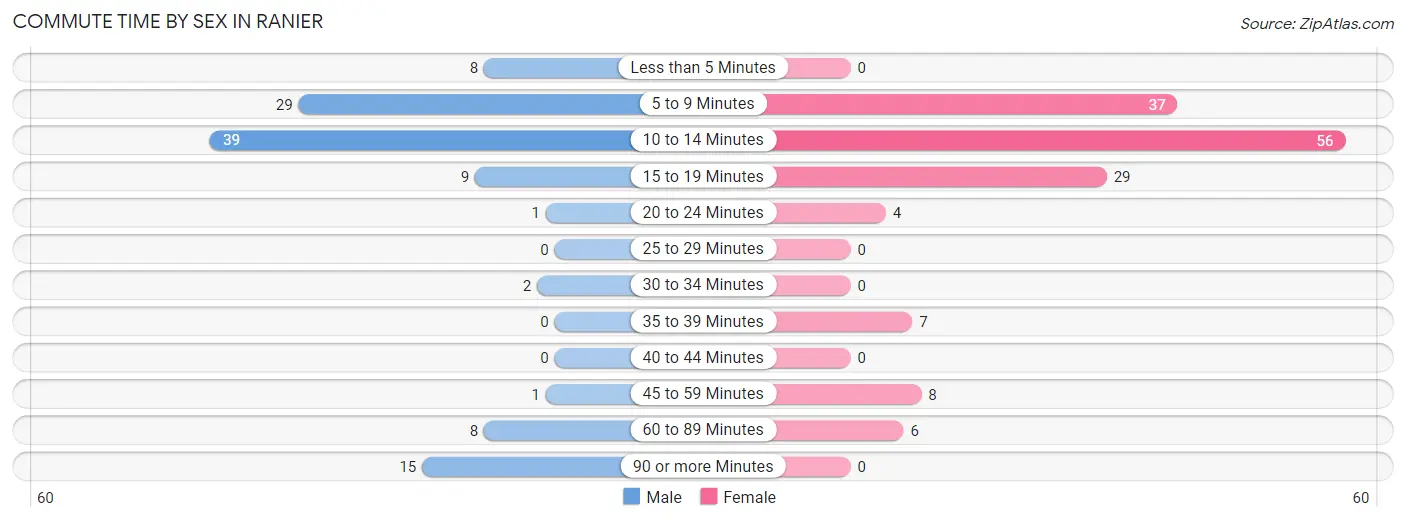
| Commute Time | Male | Female |
| Less than 5 Minutes | 8 (7.1%) | 0 (0.0%) |
| 5 to 9 Minutes | 29 (25.9%) | 37 (25.2%) |
| 10 to 14 Minutes | 39 (34.8%) | 56 (38.1%) |
| 15 to 19 Minutes | 9 (8.0%) | 29 (19.7%) |
| 20 to 24 Minutes | 1 (0.9%) | 4 (2.7%) |
| 25 to 29 Minutes | 0 (0.0%) | 0 (0.0%) |
| 30 to 34 Minutes | 2 (1.8%) | 0 (0.0%) |
| 35 to 39 Minutes | 0 (0.0%) | 7 (4.8%) |
| 40 to 44 Minutes | 0 (0.0%) | 0 (0.0%) |
| 45 to 59 Minutes | 1 (0.9%) | 8 (5.4%) |
| 60 to 89 Minutes | 8 (7.1%) | 6 (4.1%) |
| 90 or more Minutes | 15 (13.4%) | 0 (0.0%) |
Time of Departure to Work by Sex in Ranier
The most frequent times of departure to work in Ranier are 7:30 AM to 7:59 AM (34, 30.4%) for males and 7:30 AM to 7:59 AM (39, 26.5%) for females.
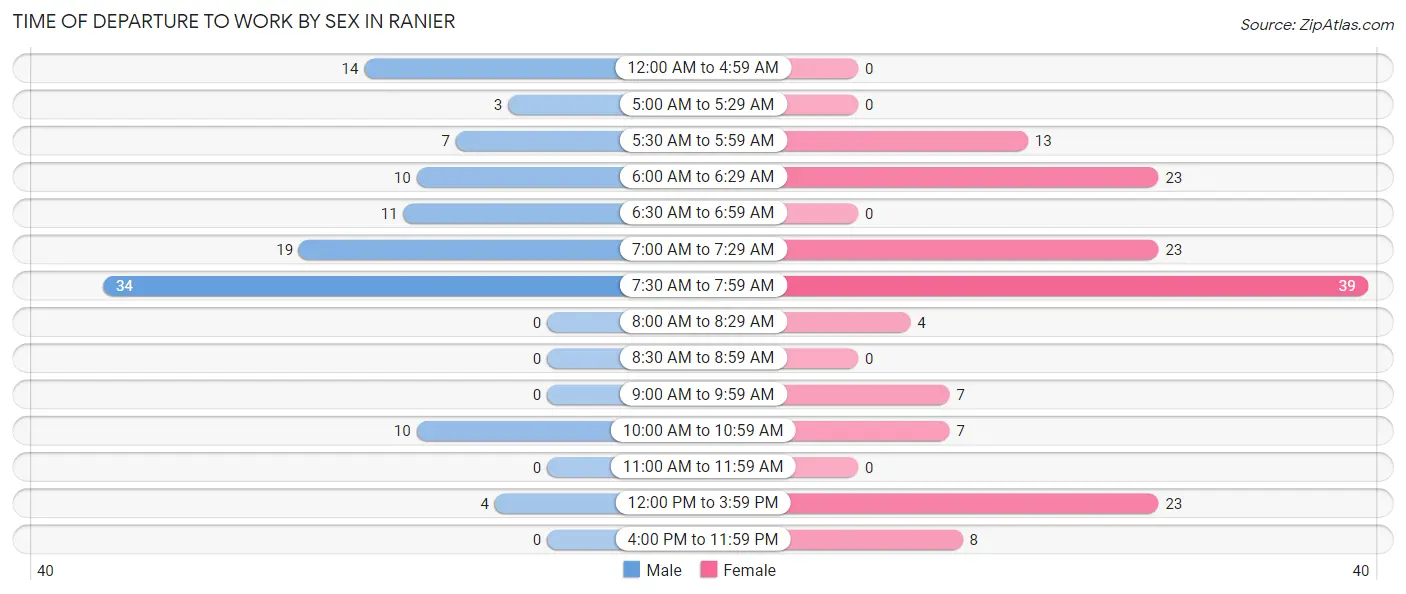
| Time of Departure | Male | Female |
| 12:00 AM to 4:59 AM | 14 (12.5%) | 0 (0.0%) |
| 5:00 AM to 5:29 AM | 3 (2.7%) | 0 (0.0%) |
| 5:30 AM to 5:59 AM | 7 (6.2%) | 13 (8.8%) |
| 6:00 AM to 6:29 AM | 10 (8.9%) | 23 (15.7%) |
| 6:30 AM to 6:59 AM | 11 (9.8%) | 0 (0.0%) |
| 7:00 AM to 7:29 AM | 19 (17.0%) | 23 (15.7%) |
| 7:30 AM to 7:59 AM | 34 (30.4%) | 39 (26.5%) |
| 8:00 AM to 8:29 AM | 0 (0.0%) | 4 (2.7%) |
| 8:30 AM to 8:59 AM | 0 (0.0%) | 0 (0.0%) |
| 9:00 AM to 9:59 AM | 0 (0.0%) | 7 (4.8%) |
| 10:00 AM to 10:59 AM | 10 (8.9%) | 7 (4.8%) |
| 11:00 AM to 11:59 AM | 0 (0.0%) | 0 (0.0%) |
| 12:00 PM to 3:59 PM | 4 (3.6%) | 23 (15.7%) |
| 4:00 PM to 11:59 PM | 0 (0.0%) | 8 (5.4%) |
| Total | 112 (100.0%) | 147 (100.0%) |
Housing Occupancy in Ranier
Occupancy by Ownership in Ranier
Of the total 261 dwellings in Ranier, owner-occupied units account for 226 (86.6%), while renter-occupied units make up 35 (13.4%).
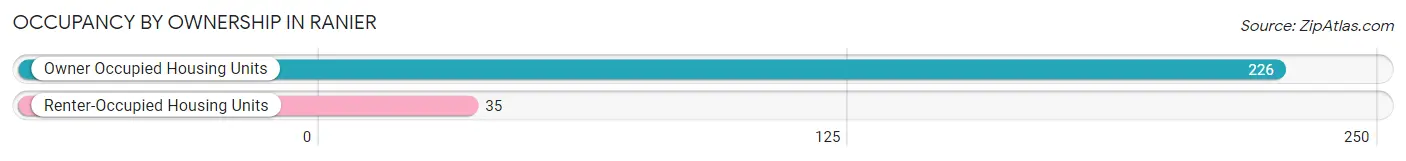
| Occupancy | # Housing Units | % Housing Units |
| Owner Occupied Housing Units | 226 | 86.6% |
| Renter-Occupied Housing Units | 35 | 13.4% |
| Total Occupied Housing Units | 261 | 100.0% |
Occupancy by Household Size in Ranier
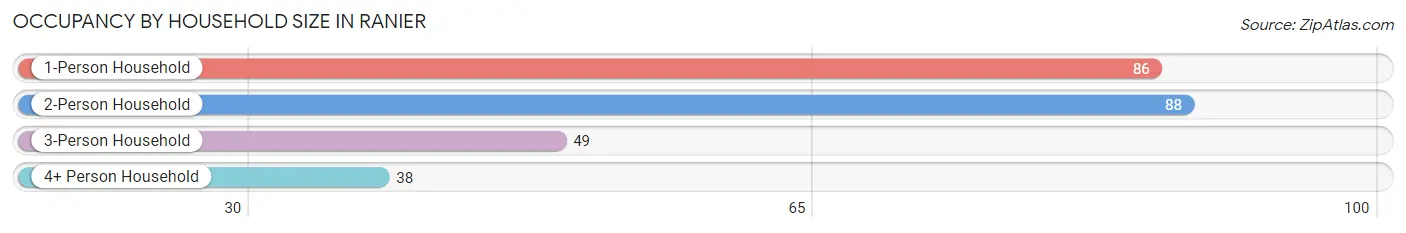
| Household Size | # Housing Units | % Housing Units |
| 1-Person Household | 86 | 33.0% |
| 2-Person Household | 88 | 33.7% |
| 3-Person Household | 49 | 18.8% |
| 4+ Person Household | 38 | 14.6% |
| Total Housing Units | 261 | 100.0% |
Occupancy by Ownership by Household Size in Ranier
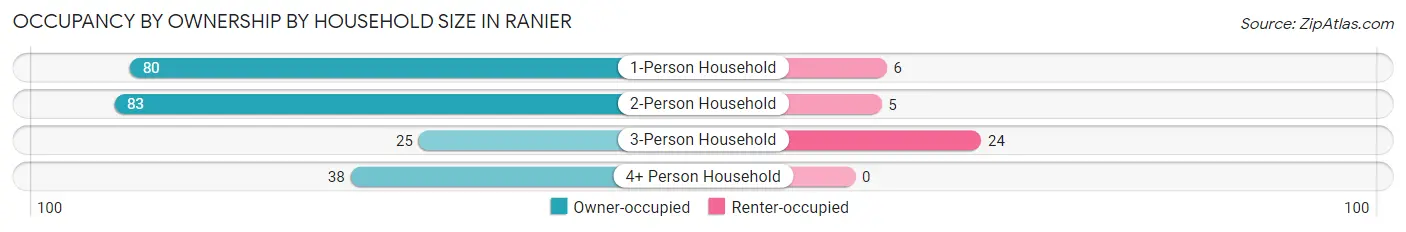
| Household Size | Owner-occupied | Renter-occupied |
| 1-Person Household | 80 (93.0%) | 6 (7.0%) |
| 2-Person Household | 83 (94.3%) | 5 (5.7%) |
| 3-Person Household | 25 (51.0%) | 24 (49.0%) |
| 4+ Person Household | 38 (100.0%) | 0 (0.0%) |
| Total Housing Units | 226 (86.6%) | 35 (13.4%) |
Occupancy by Educational Attainment in Ranier
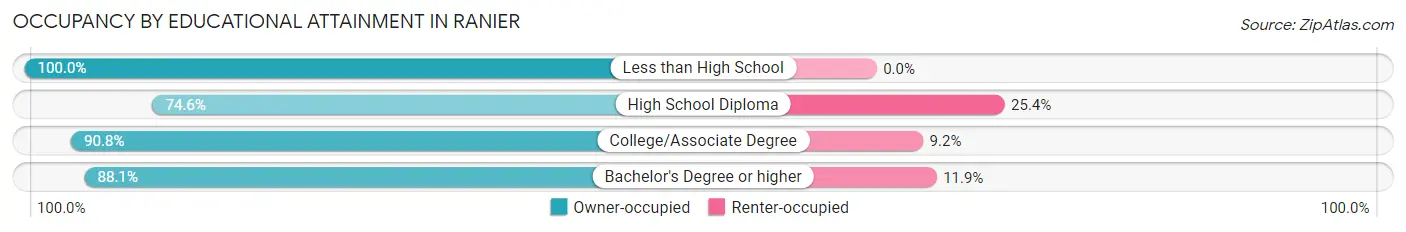
| Household Size | Owner-occupied | Renter-occupied |
| Less than High School | 11 (100.0%) | 0 (0.0%) |
| High School Diploma | 50 (74.6%) | 17 (25.4%) |
| College/Associate Degree | 128 (90.8%) | 13 (9.2%) |
| Bachelor's Degree or higher | 37 (88.1%) | 5 (11.9%) |
Occupancy by Age of Householder in Ranier
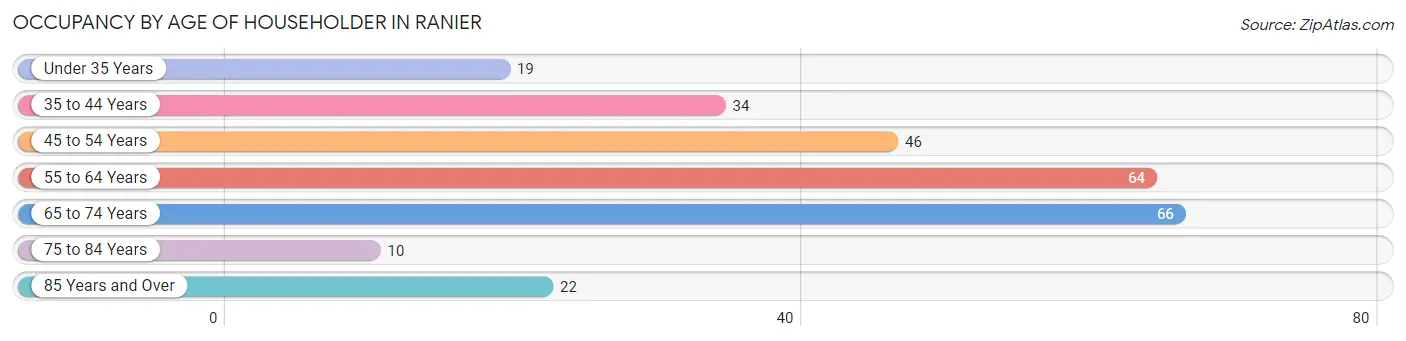
| Age Bracket | # Households | % Households |
| Under 35 Years | 19 | 7.3% |
| 35 to 44 Years | 34 | 13.0% |
| 45 to 54 Years | 46 | 17.6% |
| 55 to 64 Years | 64 | 24.5% |
| 65 to 74 Years | 66 | 25.3% |
| 75 to 84 Years | 10 | 3.8% |
| 85 Years and Over | 22 | 8.4% |
| Total | 261 | 100.0% |
Housing Finances in Ranier
Median Income by Occupancy in Ranier
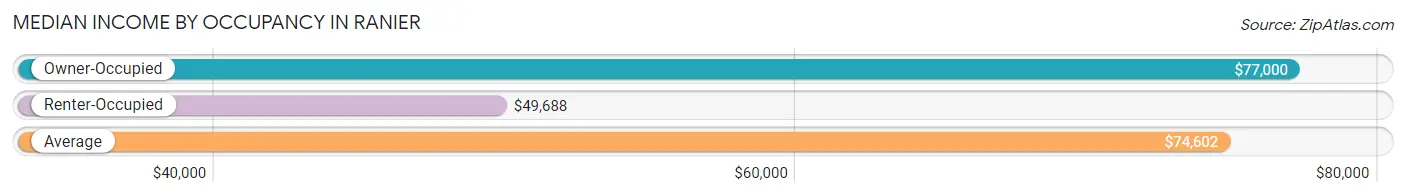
| Occupancy Type | # Households | Median Income |
| Owner-Occupied | 226 (86.6%) | $77,000 |
| Renter-Occupied | 35 (13.4%) | $49,688 |
| Average | 261 (100.0%) | $74,602 |
Occupancy by Householder Income Bracket in Ranier
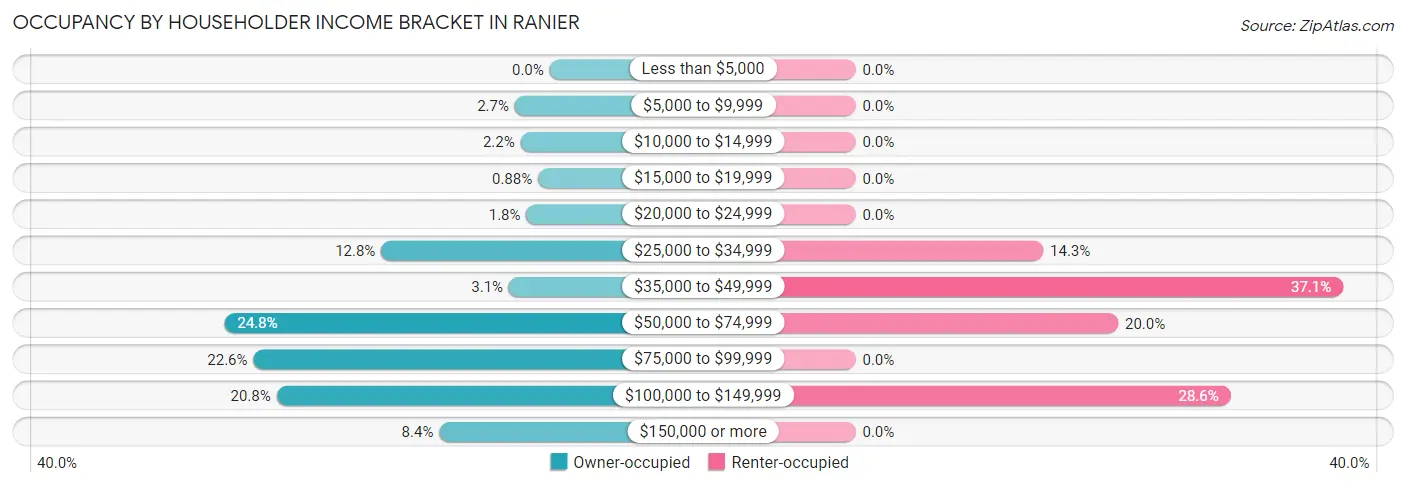
| Income Bracket | Owner-occupied | Renter-occupied |
| Less than $5,000 | 0 (0.0%) | 0 (0.0%) |
| $5,000 to $9,999 | 6 (2.6%) | 0 (0.0%) |
| $10,000 to $14,999 | 5 (2.2%) | 0 (0.0%) |
| $15,000 to $19,999 | 2 (0.9%) | 0 (0.0%) |
| $20,000 to $24,999 | 4 (1.8%) | 0 (0.0%) |
| $25,000 to $34,999 | 29 (12.8%) | 5 (14.3%) |
| $35,000 to $49,999 | 7 (3.1%) | 13 (37.1%) |
| $50,000 to $74,999 | 56 (24.8%) | 7 (20.0%) |
| $75,000 to $99,999 | 51 (22.6%) | 0 (0.0%) |
| $100,000 to $149,999 | 47 (20.8%) | 10 (28.6%) |
| $150,000 or more | 19 (8.4%) | 0 (0.0%) |
| Total | 226 (100.0%) | 35 (100.0%) |
Monthly Housing Cost Tiers in Ranier
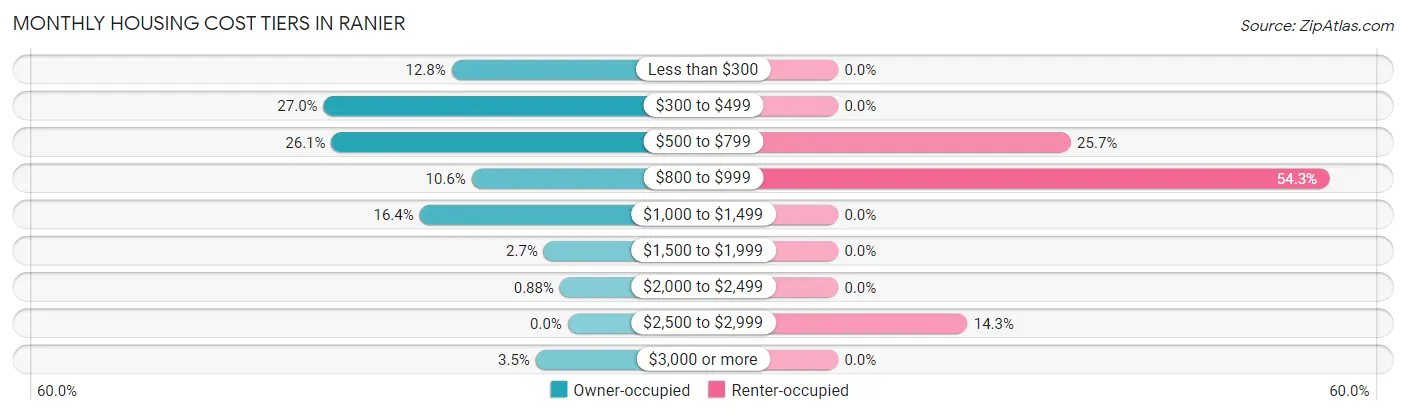
| Monthly Cost | Owner-occupied | Renter-occupied |
| Less than $300 | 29 (12.8%) | 0 (0.0%) |
| $300 to $499 | 61 (27.0%) | 0 (0.0%) |
| $500 to $799 | 59 (26.1%) | 9 (25.7%) |
| $800 to $999 | 24 (10.6%) | 19 (54.3%) |
| $1,000 to $1,499 | 37 (16.4%) | 0 (0.0%) |
| $1,500 to $1,999 | 6 (2.6%) | 0 (0.0%) |
| $2,000 to $2,499 | 2 (0.9%) | 0 (0.0%) |
| $2,500 to $2,999 | 0 (0.0%) | 5 (14.3%) |
| $3,000 or more | 8 (3.5%) | 0 (0.0%) |
| Total | 226 (100.0%) | 35 (100.0%) |
Physical Housing Characteristics in Ranier
Housing Structures in Ranier
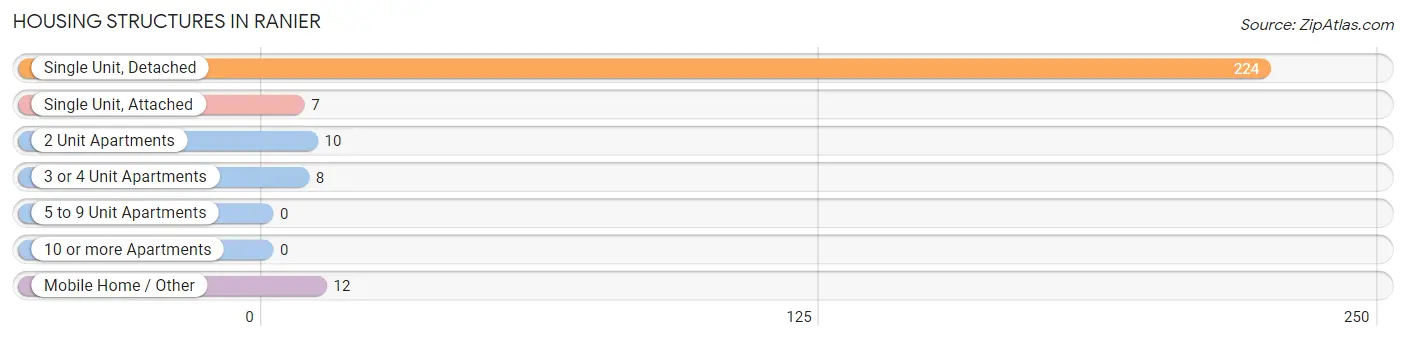
| Structure Type | # Housing Units | % Housing Units |
| Single Unit, Detached | 224 | 85.8% |
| Single Unit, Attached | 7 | 2.7% |
| 2 Unit Apartments | 10 | 3.8% |
| 3 or 4 Unit Apartments | 8 | 3.1% |
| 5 to 9 Unit Apartments | 0 | 0.0% |
| 10 or more Apartments | 0 | 0.0% |
| Mobile Home / Other | 12 | 4.6% |
| Total | 261 | 100.0% |
Housing Structures by Occupancy in Ranier
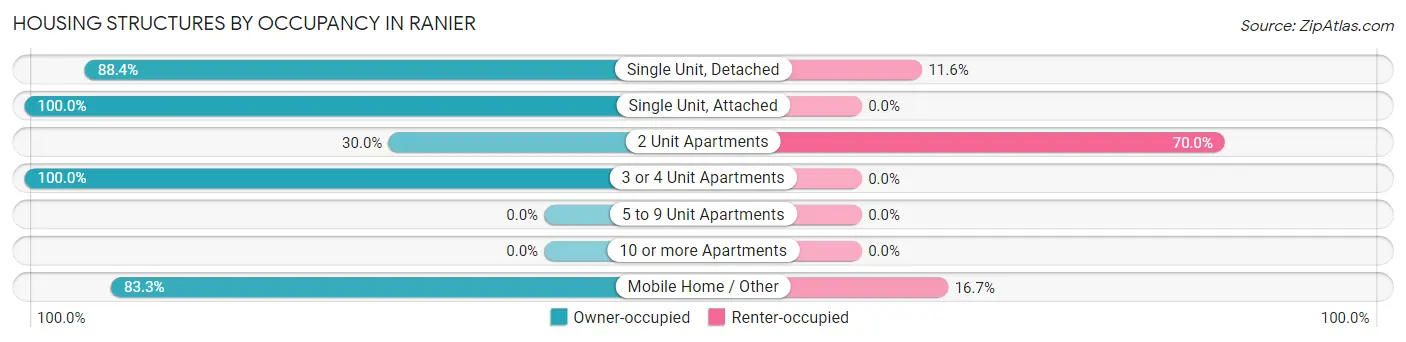
| Structure Type | Owner-occupied | Renter-occupied |
| Single Unit, Detached | 198 (88.4%) | 26 (11.6%) |
| Single Unit, Attached | 7 (100.0%) | 0 (0.0%) |
| 2 Unit Apartments | 3 (30.0%) | 7 (70.0%) |
| 3 or 4 Unit Apartments | 8 (100.0%) | 0 (0.0%) |
| 5 to 9 Unit Apartments | 0 (0.0%) | 0 (0.0%) |
| 10 or more Apartments | 0 (0.0%) | 0 (0.0%) |
| Mobile Home / Other | 10 (83.3%) | 2 (16.7%) |
| Total | 226 (86.6%) | 35 (13.4%) |
Housing Structures by Number of Rooms in Ranier
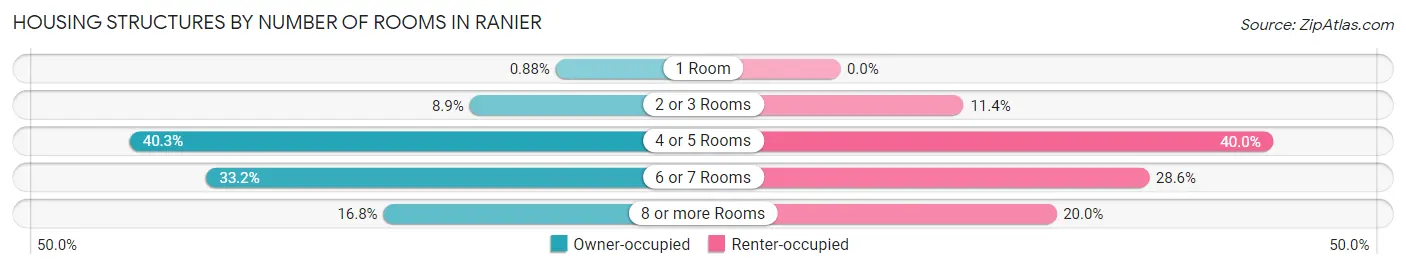
| Number of Rooms | Owner-occupied | Renter-occupied |
| 1 Room | 2 (0.9%) | 0 (0.0%) |
| 2 or 3 Rooms | 20 (8.8%) | 4 (11.4%) |
| 4 or 5 Rooms | 91 (40.3%) | 14 (40.0%) |
| 6 or 7 Rooms | 75 (33.2%) | 10 (28.6%) |
| 8 or more Rooms | 38 (16.8%) | 7 (20.0%) |
| Total | 226 (100.0%) | 35 (100.0%) |
Housing Structure by Heating Type in Ranier
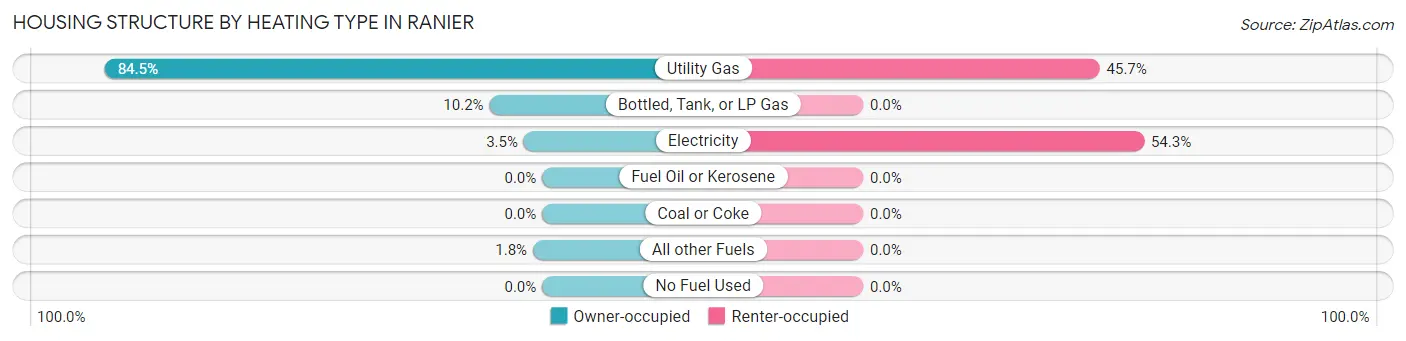
| Heating Type | Owner-occupied | Renter-occupied |
| Utility Gas | 191 (84.5%) | 16 (45.7%) |
| Bottled, Tank, or LP Gas | 23 (10.2%) | 0 (0.0%) |
| Electricity | 8 (3.5%) | 19 (54.3%) |
| Fuel Oil or Kerosene | 0 (0.0%) | 0 (0.0%) |
| Coal or Coke | 0 (0.0%) | 0 (0.0%) |
| All other Fuels | 4 (1.8%) | 0 (0.0%) |
| No Fuel Used | 0 (0.0%) | 0 (0.0%) |
| Total | 226 (100.0%) | 35 (100.0%) |
Household Vehicle Usage in Ranier
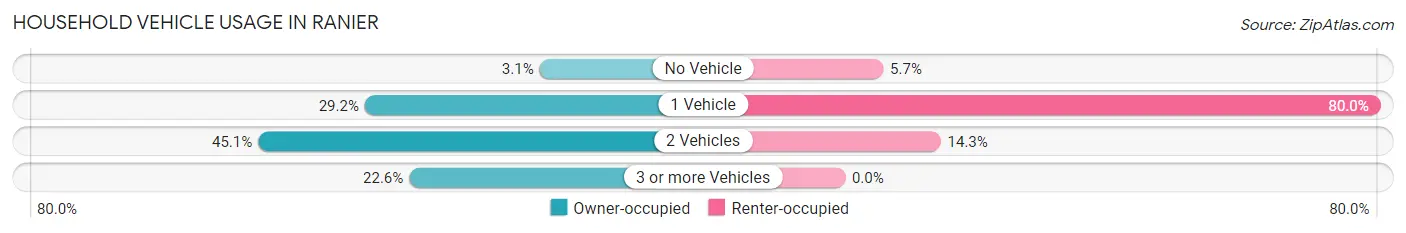
| Vehicles per Household | Owner-occupied | Renter-occupied |
| No Vehicle | 7 (3.1%) | 2 (5.7%) |
| 1 Vehicle | 66 (29.2%) | 28 (80.0%) |
| 2 Vehicles | 102 (45.1%) | 5 (14.3%) |
| 3 or more Vehicles | 51 (22.6%) | 0 (0.0%) |
| Total | 226 (100.0%) | 35 (100.0%) |
Real Estate & Mortgages in Ranier
Real Estate and Mortgage Overview in Ranier
| Characteristic | Without Mortgage | With Mortgage |
| Housing Units | 119 | 107 |
| Median Property Value | $154,300 | $108,200 |
| Median Household Income | $73,661 | $11 |
| Monthly Housing Costs | $408 | $8 |
| Real Estate Taxes | $1,185 | $0 |
Property Value by Mortgage Status in Ranier
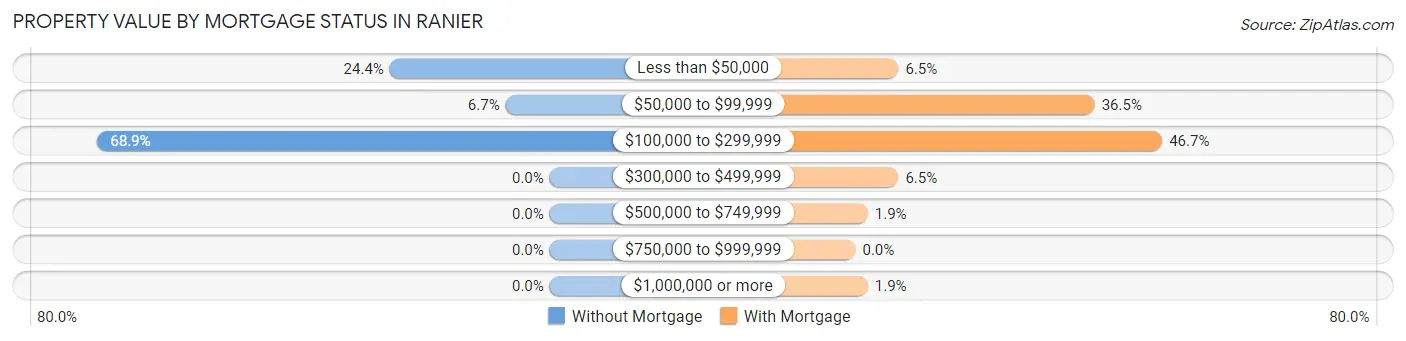
| Property Value | Without Mortgage | With Mortgage |
| Less than $50,000 | 29 (24.4%) | 7 (6.5%) |
| $50,000 to $99,999 | 8 (6.7%) | 39 (36.4%) |
| $100,000 to $299,999 | 82 (68.9%) | 50 (46.7%) |
| $300,000 to $499,999 | 0 (0.0%) | 7 (6.5%) |
| $500,000 to $749,999 | 0 (0.0%) | 2 (1.9%) |
| $750,000 to $999,999 | 0 (0.0%) | 0 (0.0%) |
| $1,000,000 or more | 0 (0.0%) | 2 (1.9%) |
| Total | 119 (100.0%) | 107 (100.0%) |
Household Income by Mortgage Status in Ranier
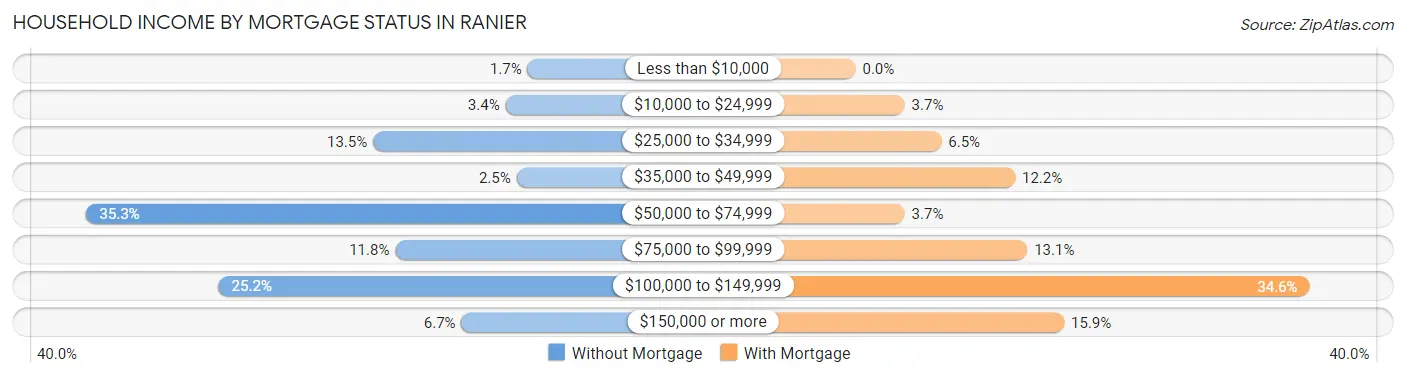
| Household Income | Without Mortgage | With Mortgage |
| Less than $10,000 | 2 (1.7%) | 0 (0.0%) |
| $10,000 to $24,999 | 4 (3.4%) | 4 (3.7%) |
| $25,000 to $34,999 | 16 (13.5%) | 7 (6.5%) |
| $35,000 to $49,999 | 3 (2.5%) | 13 (12.1%) |
| $50,000 to $74,999 | 42 (35.3%) | 4 (3.7%) |
| $75,000 to $99,999 | 14 (11.8%) | 14 (13.1%) |
| $100,000 to $149,999 | 30 (25.2%) | 37 (34.6%) |
| $150,000 or more | 8 (6.7%) | 17 (15.9%) |
| Total | 119 (100.0%) | 107 (100.0%) |
Property Value to Household Income Ratio in Ranier
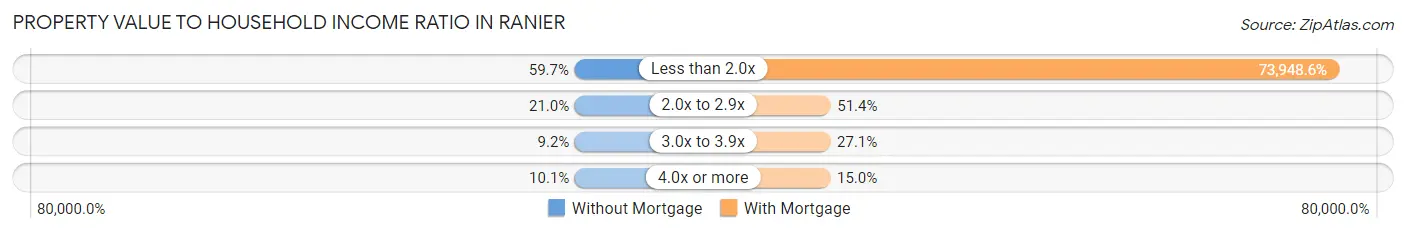
| Value-to-Income Ratio | Without Mortgage | With Mortgage |
| Less than 2.0x | 71 (59.7%) | 79,125 (73,948.6%) |
| 2.0x to 2.9x | 25 (21.0%) | 55 (51.4%) |
| 3.0x to 3.9x | 11 (9.2%) | 29 (27.1%) |
| 4.0x or more | 12 (10.1%) | 16 (14.9%) |
| Total | 119 (100.0%) | 107 (100.0%) |
Real Estate Taxes by Mortgage Status in Ranier
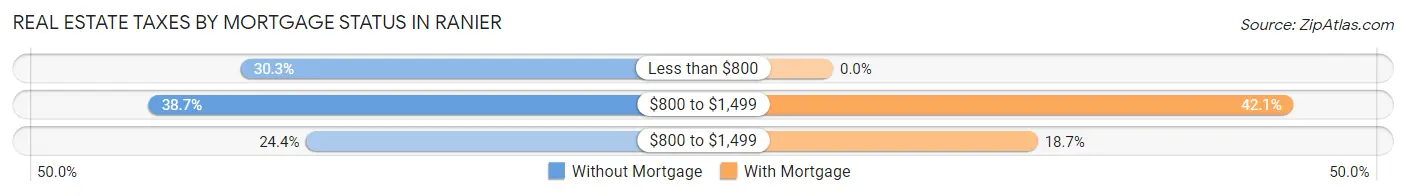
| Property Taxes | Without Mortgage | With Mortgage |
| Less than $800 | 36 (30.2%) | 0 (0.0%) |
| $800 to $1,499 | 46 (38.7%) | 45 (42.1%) |
| $800 to $1,499 | 29 (24.4%) | 20 (18.7%) |
| Total | 119 (100.0%) | 107 (100.0%) |
Health & Disability in Ranier
Health Insurance Coverage by Age in Ranier
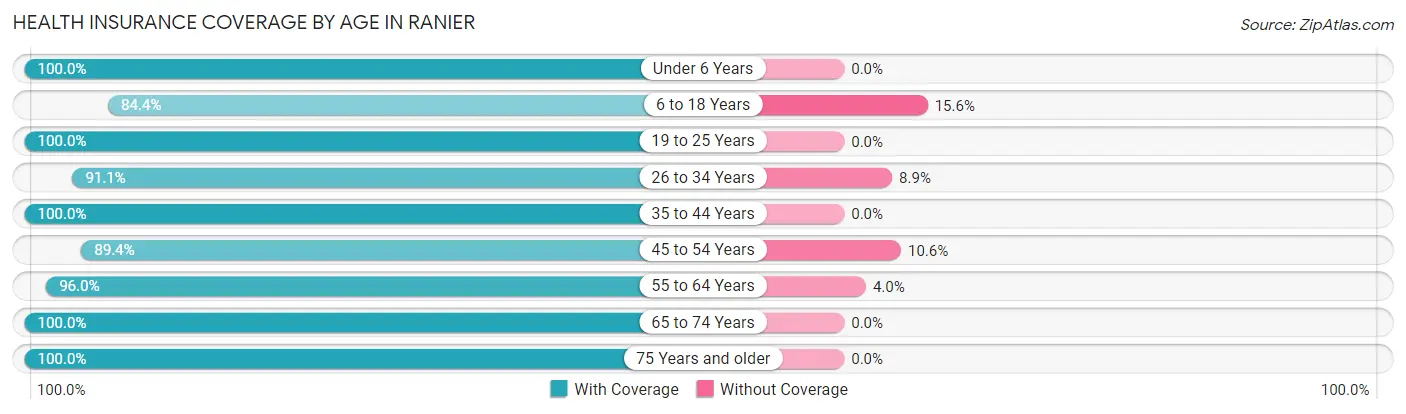
| Age Bracket | With Coverage | Without Coverage |
| Under 6 Years | 31 (100.0%) | 0 (0.0%) |
| 6 to 18 Years | 76 (84.4%) | 14 (15.6%) |
| 19 to 25 Years | 31 (100.0%) | 0 (0.0%) |
| 26 to 34 Years | 51 (91.1%) | 5 (8.9%) |
| 35 to 44 Years | 60 (100.0%) | 0 (0.0%) |
| 45 to 54 Years | 76 (89.4%) | 9 (10.6%) |
| 55 to 64 Years | 95 (96.0%) | 4 (4.0%) |
| 65 to 74 Years | 87 (100.0%) | 0 (0.0%) |
| 75 Years and older | 48 (100.0%) | 0 (0.0%) |
| Total | 555 (94.6%) | 32 (5.4%) |
Health Insurance Coverage by Citizenship Status in Ranier
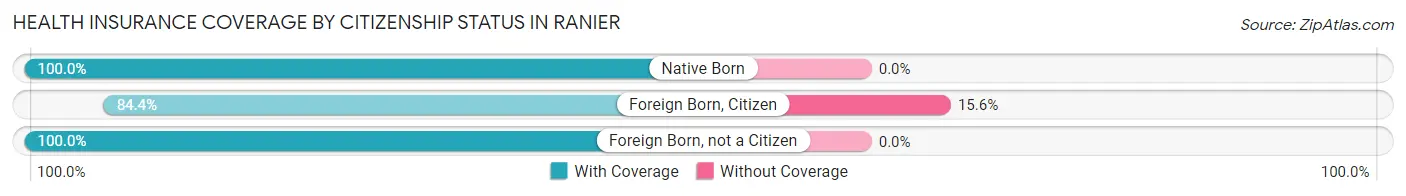
| Citizenship Status | With Coverage | Without Coverage |
| Native Born | 31 (100.0%) | 0 (0.0%) |
| Foreign Born, Citizen | 76 (84.4%) | 14 (15.6%) |
| Foreign Born, not a Citizen | 31 (100.0%) | 0 (0.0%) |
Health Insurance Coverage by Household Income in Ranier
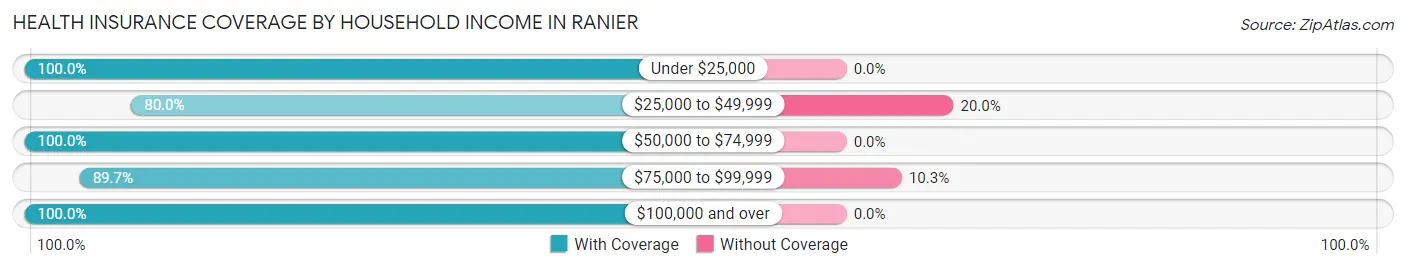
| Household Income | With Coverage | Without Coverage |
| Under $25,000 | 20 (100.0%) | 0 (0.0%) |
| $25,000 to $49,999 | 68 (80.0%) | 17 (20.0%) |
| $50,000 to $74,999 | 148 (100.0%) | 0 (0.0%) |
| $75,000 to $99,999 | 130 (89.7%) | 15 (10.3%) |
| $100,000 and over | 189 (100.0%) | 0 (0.0%) |
Public vs Private Health Insurance Coverage by Age in Ranier
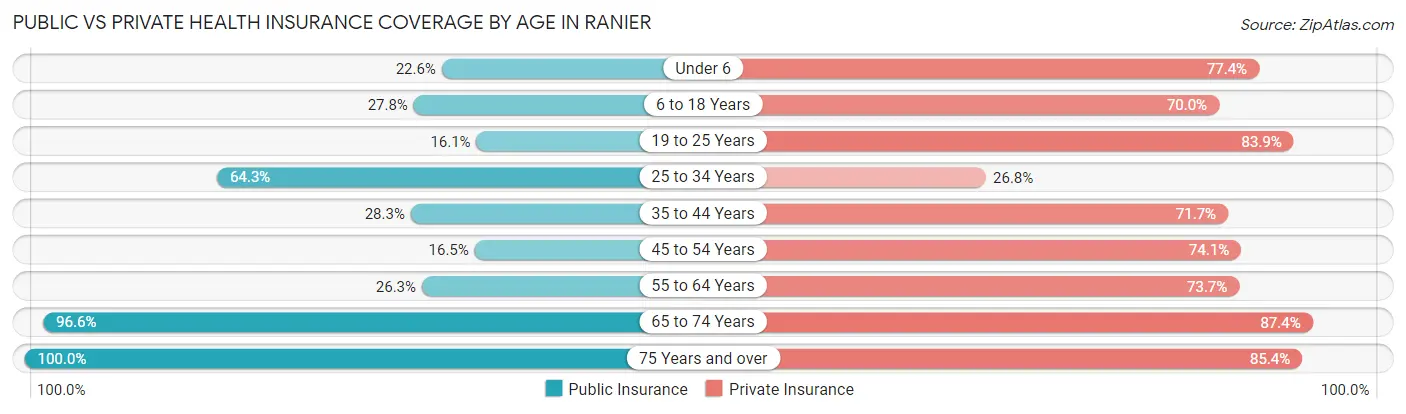
| Age Bracket | Public Insurance | Private Insurance |
| Under 6 | 7 (22.6%) | 24 (77.4%) |
| 6 to 18 Years | 25 (27.8%) | 63 (70.0%) |
| 19 to 25 Years | 5 (16.1%) | 26 (83.9%) |
| 25 to 34 Years | 36 (64.3%) | 15 (26.8%) |
| 35 to 44 Years | 17 (28.3%) | 43 (71.7%) |
| 45 to 54 Years | 14 (16.5%) | 63 (74.1%) |
| 55 to 64 Years | 26 (26.3%) | 73 (73.7%) |
| 65 to 74 Years | 84 (96.6%) | 76 (87.4%) |
| 75 Years and over | 48 (100.0%) | 41 (85.4%) |
| Total | 262 (44.6%) | 424 (72.2%) |
Disability Status by Sex by Age in Ranier
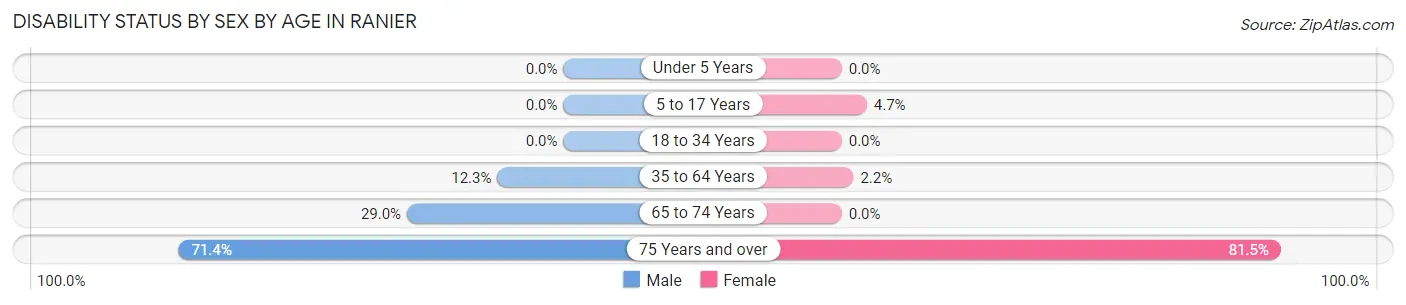
| Age Bracket | Male | Female |
| Under 5 Years | 0 (0.0%) | 0 (0.0%) |
| 5 to 17 Years | 0 (0.0%) | 2 (4.6%) |
| 18 to 34 Years | 0 (0.0%) | 0 (0.0%) |
| 35 to 64 Years | 13 (12.3%) | 3 (2.2%) |
| 65 to 74 Years | 18 (29.0%) | 0 (0.0%) |
| 75 Years and over | 15 (71.4%) | 22 (81.5%) |
Disability Class by Sex by Age in Ranier
Disability Class: Hearing Difficulty
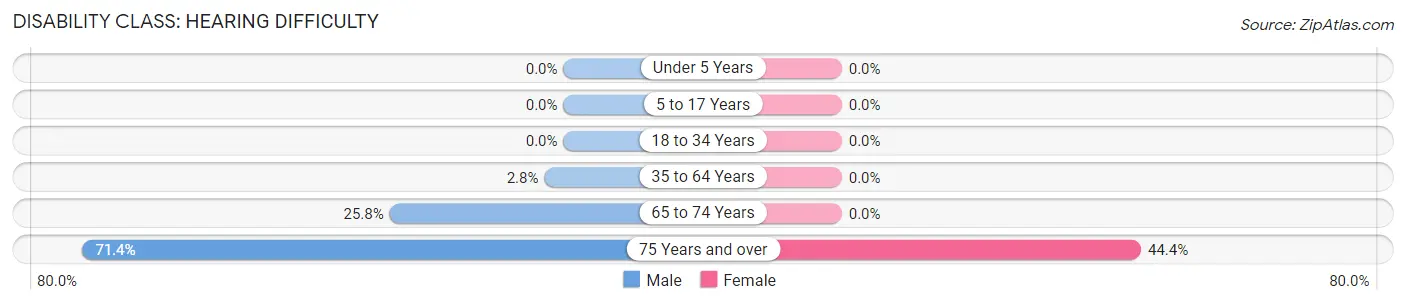
| Age Bracket | Male | Female |
| Under 5 Years | 0 (0.0%) | 0 (0.0%) |
| 5 to 17 Years | 0 (0.0%) | 0 (0.0%) |
| 18 to 34 Years | 0 (0.0%) | 0 (0.0%) |
| 35 to 64 Years | 3 (2.8%) | 0 (0.0%) |
| 65 to 74 Years | 16 (25.8%) | 0 (0.0%) |
| 75 Years and over | 15 (71.4%) | 12 (44.4%) |
Disability Class: Vision Difficulty
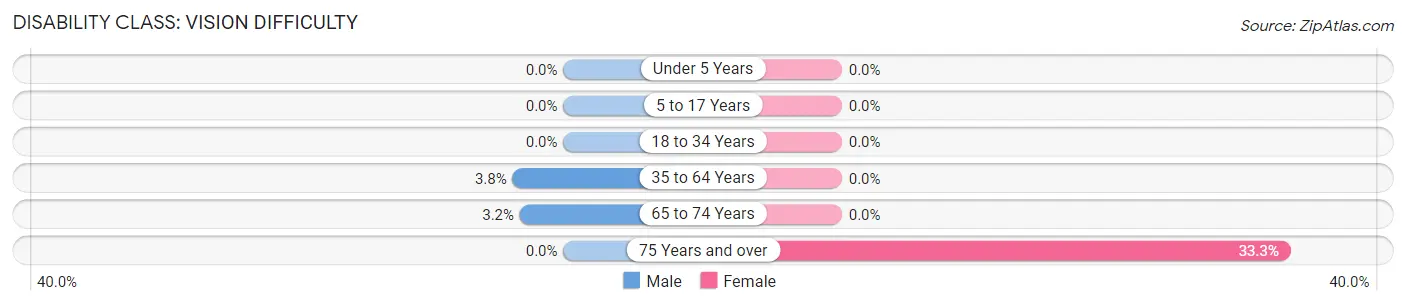
| Age Bracket | Male | Female |
| Under 5 Years | 0 (0.0%) | 0 (0.0%) |
| 5 to 17 Years | 0 (0.0%) | 0 (0.0%) |
| 18 to 34 Years | 0 (0.0%) | 0 (0.0%) |
| 35 to 64 Years | 4 (3.8%) | 0 (0.0%) |
| 65 to 74 Years | 2 (3.2%) | 0 (0.0%) |
| 75 Years and over | 0 (0.0%) | 9 (33.3%) |
Disability Class: Cognitive Difficulty
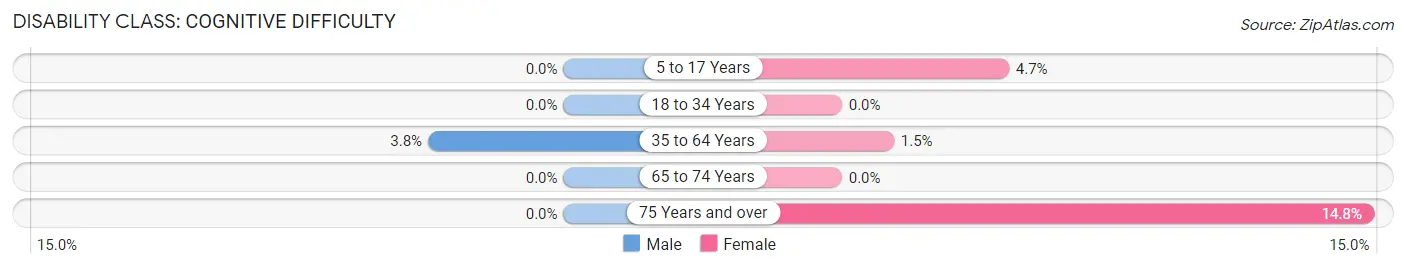
| Age Bracket | Male | Female |
| 5 to 17 Years | 0 (0.0%) | 2 (4.6%) |
| 18 to 34 Years | 0 (0.0%) | 0 (0.0%) |
| 35 to 64 Years | 4 (3.8%) | 2 (1.5%) |
| 65 to 74 Years | 0 (0.0%) | 0 (0.0%) |
| 75 Years and over | 0 (0.0%) | 4 (14.8%) |
Disability Class: Ambulatory Difficulty
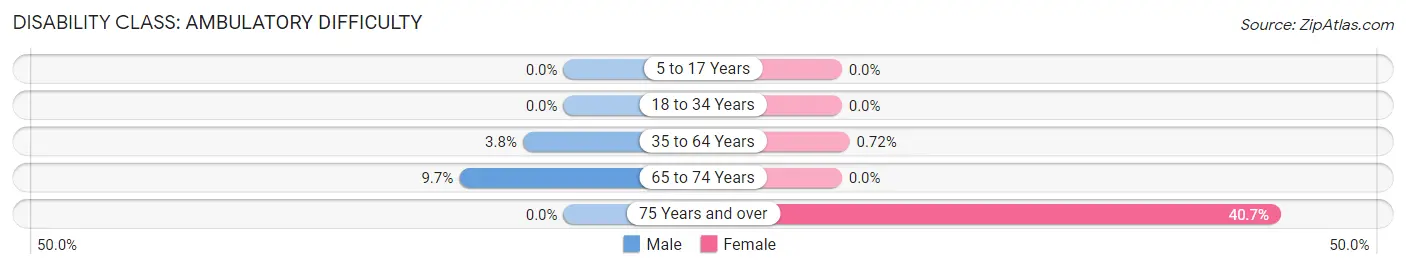
| Age Bracket | Male | Female |
| 5 to 17 Years | 0 (0.0%) | 0 (0.0%) |
| 18 to 34 Years | 0 (0.0%) | 0 (0.0%) |
| 35 to 64 Years | 4 (3.8%) | 1 (0.7%) |
| 65 to 74 Years | 6 (9.7%) | 0 (0.0%) |
| 75 Years and over | 0 (0.0%) | 11 (40.7%) |
Disability Class: Self-Care Difficulty
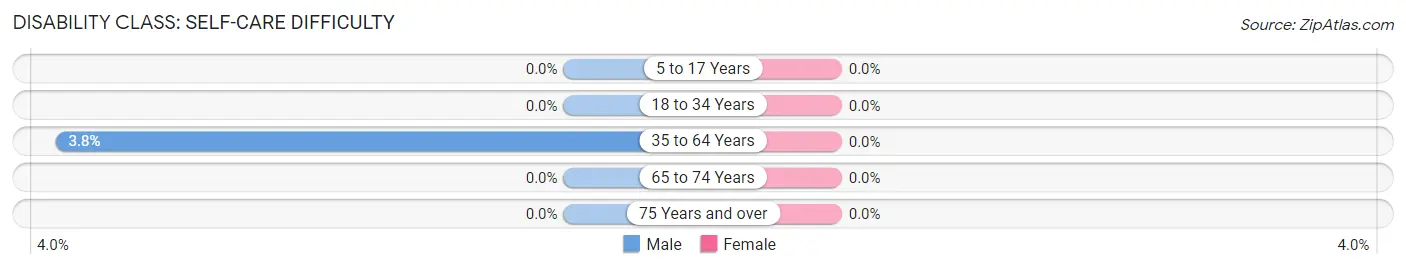
| Age Bracket | Male | Female |
| 5 to 17 Years | 0 (0.0%) | 0 (0.0%) |
| 18 to 34 Years | 0 (0.0%) | 0 (0.0%) |
| 35 to 64 Years | 4 (3.8%) | 0 (0.0%) |
| 65 to 74 Years | 0 (0.0%) | 0 (0.0%) |
| 75 Years and over | 0 (0.0%) | 0 (0.0%) |
Technology Access in Ranier
Computing Device Access in Ranier
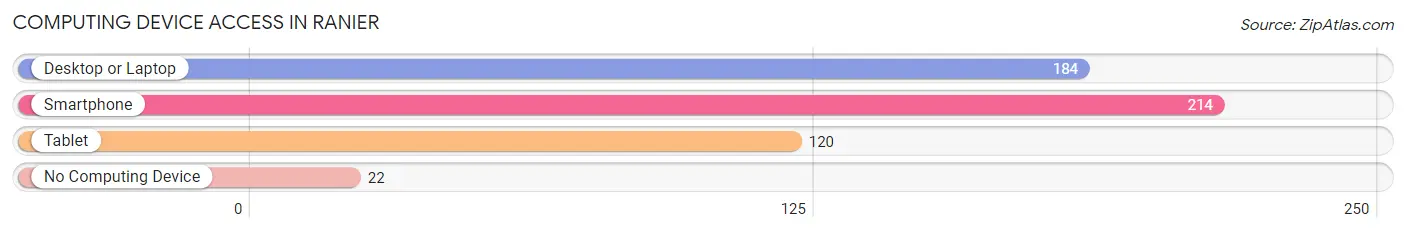
| Device Type | # Households | % Households |
| Desktop or Laptop | 184 | 70.5% |
| Smartphone | 214 | 82.0% |
| Tablet | 120 | 46.0% |
| No Computing Device | 22 | 8.4% |
| Total | 261 | 100.0% |
Internet Access in Ranier
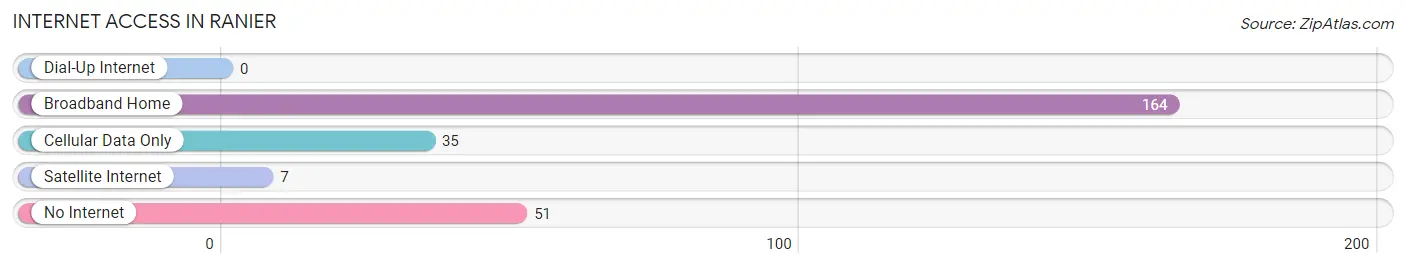
| Internet Type | # Households | % Households |
| Dial-Up Internet | 0 | 0.0% |
| Broadband Home | 164 | 62.8% |
| Cellular Data Only | 35 | 13.4% |
| Satellite Internet | 7 | 2.7% |
| No Internet | 51 | 19.5% |
| Total | 261 | 100.0% |
Ranier Summary
Ranier, Minnesota is a small city located in the northern part of the state, near the Canadian border. It is situated on the banks of the Rainy River, which forms the border between Minnesota and Ontario, Canada. The city has a population of approximately 1,500 people and is part of the larger Rainy River District.
History
Ranier was founded in 1887 by a group of Finnish immigrants who had come to the area to work in the logging industry. The city was named after the nearby Rainy River, which was named after the French explorer Pierre-Esprit Radisson. The city was incorporated in 1891 and quickly grew to become a major center for the logging industry. The city was also home to a number of sawmills and other industries, such as a flour mill and a brickyard.
In the early 1900s, the city experienced a period of rapid growth, with the population increasing from 1,000 to over 3,000 by 1910. This growth was largely due to the influx of immigrants from Finland, Sweden, and other parts of Europe. The city also became a major center for the iron ore mining industry, with several mines located in the area.
Geography
Ranier is located in the northern part of Minnesota, near the Canadian border. The city is situated on the banks of the Rainy River, which forms the border between Minnesota and Ontario, Canada. The city is surrounded by a number of lakes, including Rainy Lake, which is the largest lake in the area. The city is also located near the Boundary Waters Canoe Area Wilderness, which is a popular destination for outdoor recreation.
The city has a total area of 2.2 square miles, with 0.2 square miles of water. The city has a humid continental climate, with cold winters and warm summers. The average annual temperature is around 40 degrees Fahrenheit.
Economy
Ranier’s economy is largely based on the logging and mining industries. The city is home to several sawmills and other wood-related industries, as well as a number of iron ore mines. The city is also home to a number of small businesses, such as restaurants, retail stores, and other services.
Demographics
As of the 2010 census, the population of Ranier was 1,500 people. The racial makeup of the city was 95.3% White, 0.7% African American, 0.3% Native American, 0.7% Asian, 0.3% from other races, and 2.7% from two or more races. The median household income was $37,500, and the median family income was $45,000. The per capita income was $19,000.
Ranier is a small city with a rich history and a diverse population. The city is home to a number of industries, including logging, mining, and small businesses. The city is also home to a number of outdoor recreational activities, such as fishing, camping, and canoeing. The city is a great place to live and work, and is a great place to visit for those looking for a unique experience.
Common Questions
What is Per Capita Income in Ranier?
Per Capita income in Ranier is $41,628.
What is the Median Family Income in Ranier?
Median Family Income in Ranier is $78,472.
What is the Median Household income in Ranier?
Median Household Income in Ranier is $74,602.
What is Income or Wage Gap in Ranier?
Income or Wage Gap in Ranier is 33.7%.
Women in Ranier earn 66.3 cents for every dollar earned by a man.
What is Inequality or Gini Index in Ranier?
Inequality or Gini Index in Ranier is 0.40.
What is the Total Population of Ranier?
Total Population of Ranier is 602.
What is the Total Male Population of Ranier?
Total Male Population of Ranier is 305.
What is the Total Female Population of Ranier?
Total Female Population of Ranier is 297.
What is the Ratio of Males per 100 Females in Ranier?
There are 102.69 Males per 100 Females in Ranier.
What is the Ratio of Females per 100 Males in Ranier?
There are 97.38 Females per 100 Males in Ranier.
What is the Median Population Age in Ranier?
Median Population Age in Ranier is 48.1 Years.
What is the Average Family Size in Ranier
Average Family Size in Ranier is 2.7 People.
What is the Average Household Size in Ranier
Average Household Size in Ranier is 2.2 People.
How Large is the Labor Force in Ranier?
There are 300 People in the Labor Forcein in Ranier.
What is the Percentage of People in the Labor Force in Ranier?
59.8% of People are in the Labor Force in Ranier.
What is the Unemployment Rate in Ranier?
Unemployment Rate in Ranier is 6.3%.