Zip Codes with the Highest Percentage of Population Employed in Life, Physical & Social Science in Minnesota
RELATED REPORTS & OPTIONS
Life, Physical & Social Science
Minnesota
Compare Zip Codes
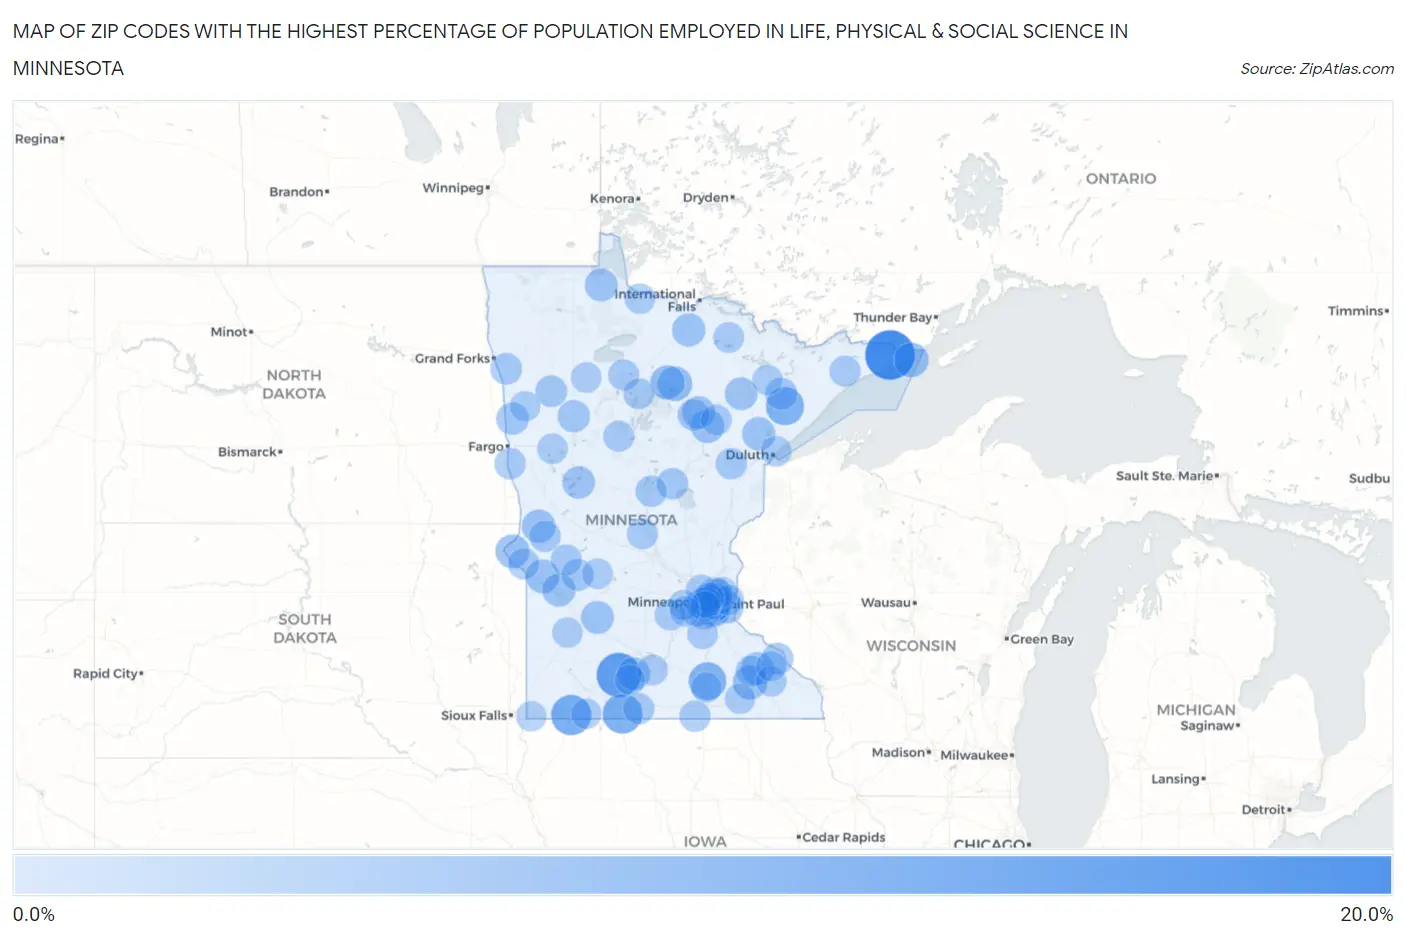
Map of Zip Codes with the Highest Percentage of Population Employed in Life, Physical & Social Science in Minnesota
0.0%
20.0%
Zip Codes with the Highest Percentage of Population Employed in Life, Physical & Social Science in Minnesota
| Zip Code | % Employed | vs State | vs National | |
| 1. | 55606 | 17.3% | 1.2%(+16.1)#1 | 1.1%(+16.3)#81 |
| 2. | 56022 | 13.0% | 1.2%(+11.8)#2 | 1.1%(+12.0)#131 |
| 3. | 56117 | 9.8% | 1.2%(+8.56)#3 | 1.1%(+8.70)#216 |
| 4. | 56127 | 9.3% | 1.2%(+8.02)#4 | 1.1%(+8.17)#239 |
| 5. | 55602 | 8.0% | 1.2%(+6.73)#5 | 1.1%(+6.87)#325 |
| 6. | 56046 | 7.7% | 1.2%(+6.46)#6 | 1.1%(+6.60)#352 |
| 7. | 55114 | 7.1% | 1.2%(+5.85)#7 | 1.1%(+5.99)#398 |
| 8. | 55108 | 5.4% | 1.2%(+4.21)#8 | 1.1%(+4.36)#638 |
| 9. | 55605 | 5.3% | 1.2%(+4.04)#9 | 1.1%(+4.19)#692 |
| 10. | 56637 | 5.1% | 1.2%(+3.89)#10 | 1.1%(+4.04)#729 |
| 11. | 56680 | 5.0% | 1.2%(+3.76)#11 | 1.1%(+3.91)#761 |
| 12. | 55120 | 4.9% | 1.2%(+3.66)#12 | 1.1%(+3.81)#794 |
| 13. | 55902 | 4.9% | 1.2%(+3.64)#13 | 1.1%(+3.78)#803 |
| 14. | 56211 | 4.7% | 1.2%(+3.49)#14 | 1.1%(+3.64)#841 |
| 15. | 56227 | 4.5% | 1.2%(+3.28)#15 | 1.1%(+3.42)#923 |
| 16. | 55793 | 4.5% | 1.2%(+3.22)#16 | 1.1%(+3.36)#942 |
| 17. | 56274 | 4.4% | 1.2%(+3.15)#17 | 1.1%(+3.30)#971 |
| 18. | 55150 | 4.3% | 1.2%(+3.05)#18 | 1.1%(+3.19)#1,013 |
| 19. | 56262 | 4.2% | 1.2%(+2.99)#19 | 1.1%(+3.14)#1,035 |
| 20. | 55906 | 4.2% | 1.2%(+2.98)#20 | 1.1%(+3.13)#1,041 |
| 21. | 56653 | 4.2% | 1.2%(+2.97)#21 | 1.1%(+3.12)#1,043 |
| 22. | 55717 | 4.2% | 1.2%(+2.93)#22 | 1.1%(+3.08)#1,067 |
| 23. | 56056 | 4.1% | 1.2%(+2.85)#23 | 1.1%(+2.99)#1,109 |
| 24. | 55105 | 4.1% | 1.2%(+2.83)#24 | 1.1%(+2.98)#1,114 |
| 25. | 56284 | 4.0% | 1.2%(+2.76)#25 | 1.1%(+2.90)#1,157 |
| 26. | 56673 | 4.0% | 1.2%(+2.74)#26 | 1.1%(+2.88)#1,172 |
| 27. | 55768 | 3.9% | 1.2%(+2.62)#27 | 1.1%(+2.76)#1,232 |
| 28. | 55722 | 3.8% | 1.2%(+2.58)#28 | 1.1%(+2.73)#1,252 |
| 29. | 56571 | 3.6% | 1.2%(+2.41)#29 | 1.1%(+2.56)#1,344 |
| 30. | 56566 | 3.5% | 1.2%(+2.27)#30 | 1.1%(+2.42)#1,416 |
| 31. | 56574 | 3.5% | 1.2%(+2.23)#31 | 1.1%(+2.38)#1,447 |
| 32. | 55401 | 3.5% | 1.2%(+2.22)#32 | 1.1%(+2.36)#1,456 |
| 33. | 55419 | 3.4% | 1.2%(+2.19)#33 | 1.1%(+2.34)#1,482 |
| 34. | 55346 | 3.3% | 1.2%(+2.10)#34 | 1.1%(+2.24)#1,545 |
| 35. | 55414 | 3.3% | 1.2%(+2.08)#35 | 1.1%(+2.23)#1,560 |
| 36. | 55750 | 3.3% | 1.2%(+2.08)#36 | 1.1%(+2.22)#1,566 |
| 37. | 55409 | 3.2% | 1.2%(+2.00)#37 | 1.1%(+2.15)#1,634 |
| 38. | 55129 | 3.1% | 1.2%(+1.90)#38 | 1.1%(+2.05)#1,715 |
| 39. | 56215 | 3.1% | 1.2%(+1.83)#39 | 1.1%(+1.97)#1,801 |
| 40. | 56592 | 3.0% | 1.2%(+1.79)#40 | 1.1%(+1.94)#1,842 |
| 41. | 55744 | 3.0% | 1.2%(+1.78)#41 | 1.1%(+1.93)#1,859 |
| 42. | 55945 | 3.0% | 1.2%(+1.76)#42 | 1.1%(+1.91)#1,878 |
| 43. | 56723 | 2.9% | 1.2%(+1.69)#43 | 1.1%(+1.84)#1,962 |
| 44. | 56444 | 2.9% | 1.2%(+1.65)#44 | 1.1%(+1.80)#2,007 |
| 45. | 55403 | 2.8% | 1.2%(+1.57)#45 | 1.1%(+1.71)#2,115 |
| 46. | 55726 | 2.8% | 1.2%(+1.54)#46 | 1.1%(+1.68)#2,148 |
| 47. | 56425 | 2.8% | 1.2%(+1.53)#47 | 1.1%(+1.67)#2,162 |
| 48. | 56248 | 2.7% | 1.2%(+1.49)#48 | 1.1%(+1.64)#2,208 |
| 49. | 56029 | 2.6% | 1.2%(+1.40)#49 | 1.1%(+1.54)#2,347 |
| 50. | 56225 | 2.6% | 1.2%(+1.38)#50 | 1.1%(+1.52)#2,370 |
| 51. | 56031 | 2.6% | 1.2%(+1.37)#51 | 1.1%(+1.52)#2,380 |
| 52. | 56683 | 2.6% | 1.2%(+1.34)#52 | 1.1%(+1.48)#2,439 |
| 53. | 56525 | 2.6% | 1.2%(+1.33)#53 | 1.1%(+1.47)#2,460 |
| 54. | 55901 | 2.5% | 1.2%(+1.31)#54 | 1.1%(+1.46)#2,482 |
| 55. | 55104 | 2.5% | 1.2%(+1.30)#55 | 1.1%(+1.44)#2,509 |
| 56. | 56467 | 2.5% | 1.2%(+1.28)#56 | 1.1%(+1.42)#2,551 |
| 57. | 55415 | 2.5% | 1.2%(+1.27)#57 | 1.1%(+1.42)#2,555 |
| 58. | 56244 | 2.5% | 1.2%(+1.27)#58 | 1.1%(+1.41)#2,567 |
| 59. | 55615 | 2.5% | 1.2%(+1.23)#59 | 1.1%(+1.38)#2,624 |
| 60. | 55113 | 2.5% | 1.2%(+1.22)#60 | 1.1%(+1.37)#2,647 |
| 61. | 56314 | 2.4% | 1.2%(+1.20)#61 | 1.1%(+1.34)#2,692 |
| 62. | 55116 | 2.4% | 1.2%(+1.19)#62 | 1.1%(+1.33)#2,712 |
| 63. | 55102 | 2.4% | 1.2%(+1.17)#63 | 1.1%(+1.31)#2,754 |
| 64. | 55437 | 2.4% | 1.2%(+1.17)#64 | 1.1%(+1.31)#2,761 |
| 65. | 55408 | 2.4% | 1.2%(+1.16)#65 | 1.1%(+1.30)#2,766 |
| 66. | 55117 | 2.4% | 1.2%(+1.13)#66 | 1.1%(+1.28)#2,811 |
| 67. | 55426 | 2.4% | 1.2%(+1.13)#67 | 1.1%(+1.28)#2,814 |
| 68. | 55126 | 2.4% | 1.2%(+1.12)#68 | 1.1%(+1.26)#2,842 |
| 69. | 55742 | 2.3% | 1.2%(+1.09)#69 | 1.1%(+1.23)#2,894 |
| 70. | 55445 | 2.3% | 1.2%(+1.08)#70 | 1.1%(+1.22)#2,932 |
| 71. | 55110 | 2.3% | 1.2%(+1.06)#71 | 1.1%(+1.21)#2,960 |
| 72. | 55397 | 2.3% | 1.2%(+1.05)#72 | 1.1%(+1.20)#2,980 |
| 73. | 55406 | 2.3% | 1.2%(+1.04)#73 | 1.1%(+1.19)#2,998 |
| 74. | 55413 | 2.3% | 1.2%(+1.04)#74 | 1.1%(+1.19)#3,009 |
| 75. | 56663 | 2.3% | 1.2%(+1.04)#75 | 1.1%(+1.18)#3,020 |
| 76. | 55054 | 2.2% | 1.2%(+1.01)#76 | 1.1%(+1.16)#3,069 |
| 77. | 56055 | 2.2% | 1.2%(+0.957)#77 | 1.1%(+1.10)#3,202 |
| 78. | 55771 | 2.2% | 1.2%(+0.951)#78 | 1.1%(+1.10)#3,214 |
| 79. | 55929 | 2.2% | 1.2%(+0.945)#79 | 1.1%(+1.09)#3,225 |
| 80. | 55127 | 2.2% | 1.2%(+0.916)#80 | 1.1%(+1.06)#3,299 |
| 81. | 56511 | 2.1% | 1.2%(+0.892)#81 | 1.1%(+1.04)#3,350 |
| 82. | 56289 | 2.1% | 1.2%(+0.877)#82 | 1.1%(+1.02)#3,387 |
| 83. | 55812 | 2.1% | 1.2%(+0.871)#83 | 1.1%(+1.02)#3,408 |
| 84. | 56081 | 2.1% | 1.2%(+0.862)#84 | 1.1%(+1.01)#3,430 |
| 85. | 56634 | 2.1% | 1.2%(+0.842)#85 | 1.1%(+0.987)#3,472 |
| 86. | 55042 | 2.0% | 1.2%(+0.811)#86 | 1.1%(+0.956)#3,552 |
| 87. | 55405 | 2.0% | 1.2%(+0.807)#87 | 1.1%(+0.952)#3,562 |
| 88. | 55418 | 2.0% | 1.2%(+0.790)#88 | 1.1%(+0.934)#3,612 |
| 89. | 56623 | 2.0% | 1.2%(+0.787)#89 | 1.1%(+0.932)#3,620 |
| 90. | 55410 | 2.0% | 1.2%(+0.784)#90 | 1.1%(+0.928)#3,633 |
| 91. | 56229 | 2.0% | 1.2%(+0.775)#91 | 1.1%(+0.920)#3,658 |
| 92. | 55964 | 2.0% | 1.2%(+0.771)#92 | 1.1%(+0.916)#3,666 |
| 93. | 56167 | 2.0% | 1.2%(+0.765)#93 | 1.1%(+0.909)#3,688 |
| 94. | 55926 | 2.0% | 1.2%(+0.760)#94 | 1.1%(+0.904)#3,697 |
| 95. | 55364 | 2.0% | 1.2%(+0.740)#95 | 1.1%(+0.884)#3,757 |
| 96. | 55386 | 2.0% | 1.2%(+0.735)#96 | 1.1%(+0.880)#3,772 |
| 97. | 55732 | 2.0% | 1.2%(+0.725)#97 | 1.1%(+0.870)#3,798 |
| 98. | 56510 | 1.9% | 1.2%(+0.709)#98 | 1.1%(+0.854)#3,847 |
| 99. | 56138 | 1.9% | 1.2%(+0.699)#99 | 1.1%(+0.843)#3,876 |
| 100. | 56026 | 1.9% | 1.2%(+0.695)#100 | 1.1%(+0.840)#3,886 |
Common Questions
What are the Top 10 Zip Codes with the Highest Percentage of Population Employed in Life, Physical & Social Science in Minnesota?
Top 10 Zip Codes with the Highest Percentage of Population Employed in Life, Physical & Social Science in Minnesota are:
What zip code has the Highest Percentage of Population Employed in Life, Physical & Social Science in Minnesota?
55606 has the Highest Percentage of Population Employed in Life, Physical & Social Science in Minnesota with 17.3%.
What is the Percentage of Population Employed in Life, Physical & Social Science in the State of Minnesota?
Percentage of Population Employed in Life, Physical & Social Science in Minnesota is 1.2%.
What is the Percentage of Population Employed in Life, Physical & Social Science in the United States?
Percentage of Population Employed in Life, Physical & Social Science in the United States is 1.1%.