Central, LA Map & Demographics
Central Map
Central Overview
$41,070
PER CAPITA INCOME
$104,400
AVG FAMILY INCOME
$82,714
AVG HOUSEHOLD INCOME
46.7%
WAGE / INCOME GAP [ % ]
53.3¢/ $1
WAGE / INCOME GAP [ $ ]
0.40
INEQUALITY / GINI INDEX
29,518
TOTAL POPULATION
14,384
MALE POPULATION
15,134
FEMALE POPULATION
95.04
MALES / 100 FEMALES
105.21
FEMALES / 100 MALES
38.8
MEDIAN AGE
3.2
AVG FAMILY SIZE
2.7
AVG HOUSEHOLD SIZE
14,140
LABOR FORCE [ PEOPLE ]
61.9%
PERCENT IN LABOR FORCE
2.2%
UNEMPLOYMENT RATE
Central Area Codes
Income in Central
Income Overview in Central
Per Capita Income in Central is $41,070, while median incomes of families and households are $104,400 and $82,714 respectively.
| Characteristic | Number | Measure |
| Per Capita Income | 29,518 | $41,070 |
| Median Family Income | 8,076 | $104,400 |
| Mean Family Income | 8,076 | $125,439 |
| Median Household Income | 11,035 | $82,714 |
| Mean Household Income | 11,035 | $107,317 |
| Income Deficit | 8,076 | $0 |
| Wage / Income Gap (%) | 29,518 | 46.70% |
| Wage / Income Gap ($) | 29,518 | 53.30¢ per $1 |
| Gini / Inequality Index | 29,518 | 0.40 |
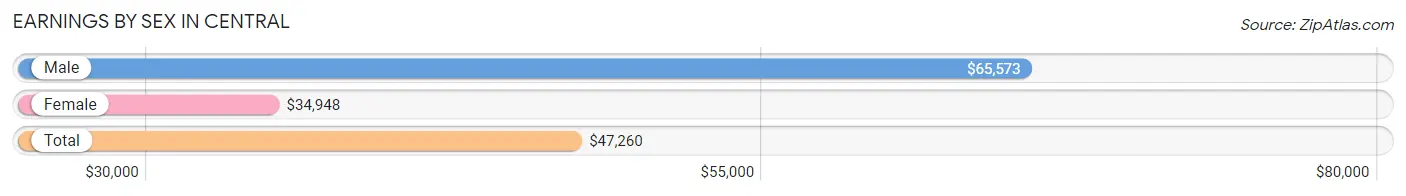
Earnings by Sex in Central
Average Earnings in Central are $47,260, $65,573 for men and $34,948 for women, a difference of 46.7%.
| Sex | Number | Average Earnings |
| Male | 8,236 (53.1%) | $65,573 |
| Female | 7,287 (46.9%) | $34,948 |
| Total | 15,523 (100.0%) | $47,260 |
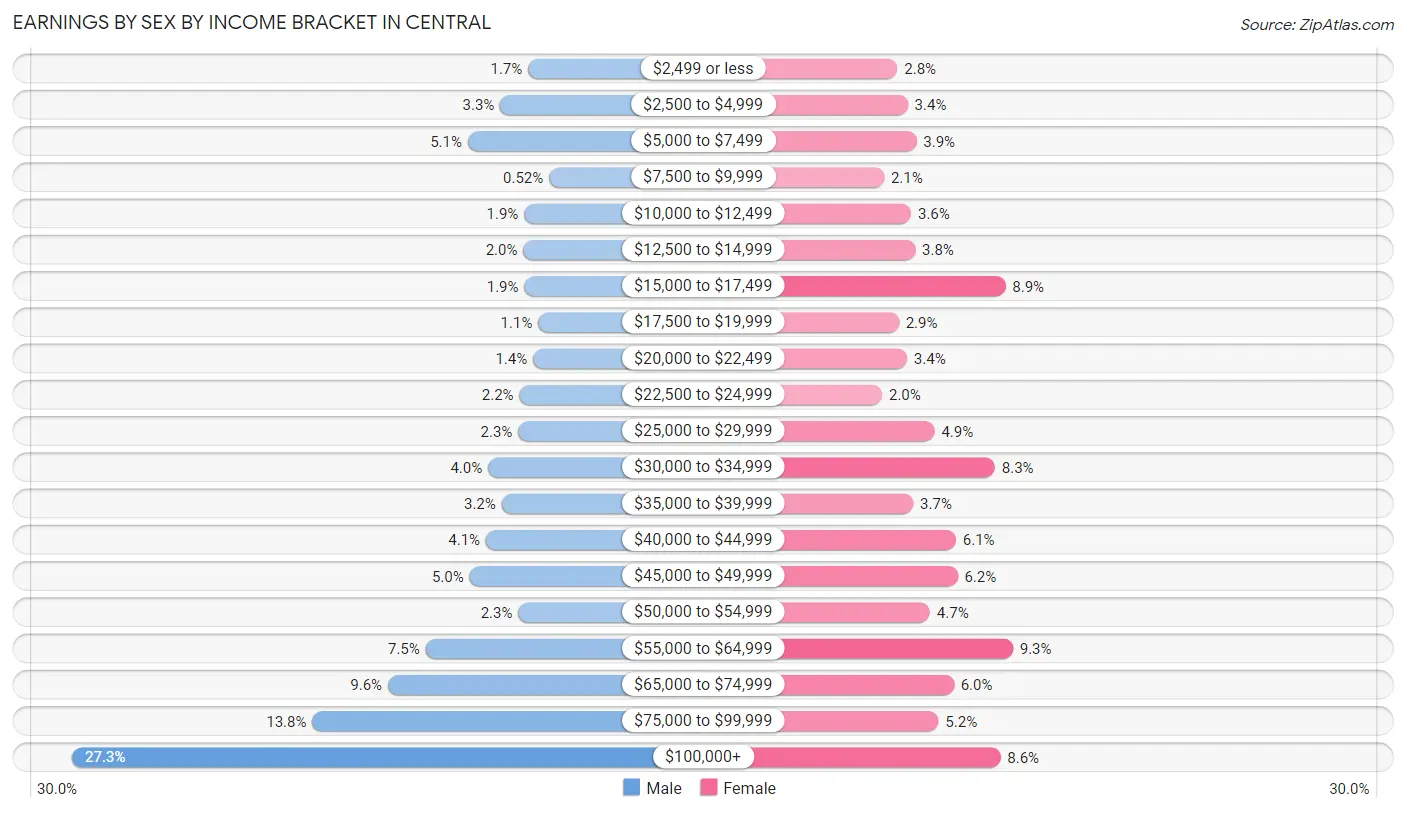
Earnings by Sex by Income Bracket in Central
The most common earnings brackets in Central are $100,000+ for men (2,251 | 27.3%) and $55,000 to $64,999 for women (680 | 9.3%).
| Income | Male | Female |
| $2,499 or less | 140 (1.7%) | 207 (2.8%) |
| $2,500 to $4,999 | 269 (3.3%) | 249 (3.4%) |
| $5,000 to $7,499 | 419 (5.1%) | 285 (3.9%) |
| $7,500 to $9,999 | 43 (0.5%) | 152 (2.1%) |
| $10,000 to $12,499 | 158 (1.9%) | 263 (3.6%) |
| $12,500 to $14,999 | 162 (2.0%) | 280 (3.8%) |
| $15,000 to $17,499 | 157 (1.9%) | 649 (8.9%) |
| $17,500 to $19,999 | 93 (1.1%) | 213 (2.9%) |
| $20,000 to $22,499 | 117 (1.4%) | 246 (3.4%) |
| $22,500 to $24,999 | 180 (2.2%) | 144 (2.0%) |
| $25,000 to $29,999 | 186 (2.3%) | 359 (4.9%) |
| $30,000 to $34,999 | 325 (4.0%) | 606 (8.3%) |
| $35,000 to $39,999 | 263 (3.2%) | 272 (3.7%) |
| $40,000 to $44,999 | 335 (4.1%) | 447 (6.1%) |
| $45,000 to $49,999 | 411 (5.0%) | 453 (6.2%) |
| $50,000 to $54,999 | 185 (2.2%) | 340 (4.7%) |
| $55,000 to $64,999 | 614 (7.5%) | 680 (9.3%) |
| $65,000 to $74,999 | 789 (9.6%) | 438 (6.0%) |
| $75,000 to $99,999 | 1,139 (13.8%) | 375 (5.1%) |
| $100,000+ | 2,251 (27.3%) | 629 (8.6%) |
| Total | 8,236 (100.0%) | 7,287 (100.0%) |
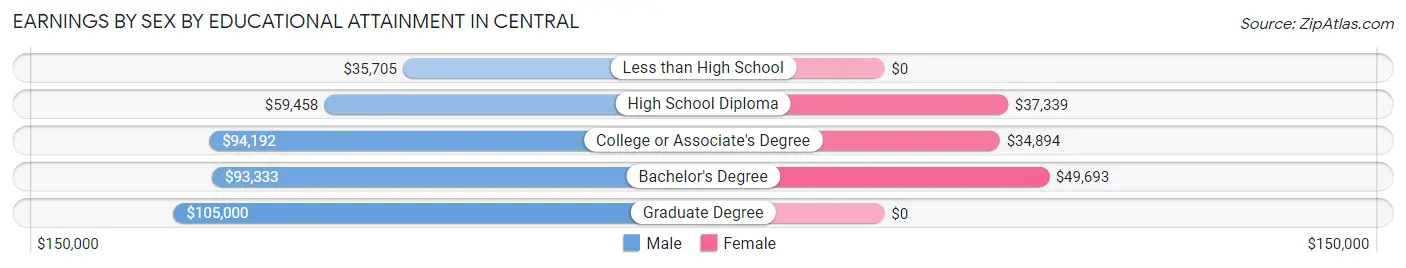
Earnings by Sex by Educational Attainment in Central
Average earnings in Central are $74,193 for men and $41,118 for women, a difference of 44.6%. Men with an educational attainment of graduate degree enjoy the highest average annual earnings of $105,000, while those with less than high school education earn the least with $35,705. Women with an educational attainment of bachelor's degree earn the most with the average annual earnings of $49,693, while those with college or associate's degree education have the smallest earnings of $34,894.
| Educational Attainment | Male Income | Female Income |
| Less than High School | $35,705 | $0 |
| High School Diploma | $59,458 | $37,339 |
| College or Associate's Degree | $94,192 | $34,894 |
| Bachelor's Degree | $93,333 | $49,693 |
| Graduate Degree | $105,000 | $0 |
| Total | $74,193 | $41,118 |
Family Income in Central
Family Income Brackets in Central
According to the Central family income data, there are 2,059 families falling into the $100,000 to $149,999 income range, which is the most common income bracket and makes up 25.5% of all families. Conversely, the $10,000 to $14,999 income bracket is the least frequent group with only 8 families (0.1%) belonging to this category.
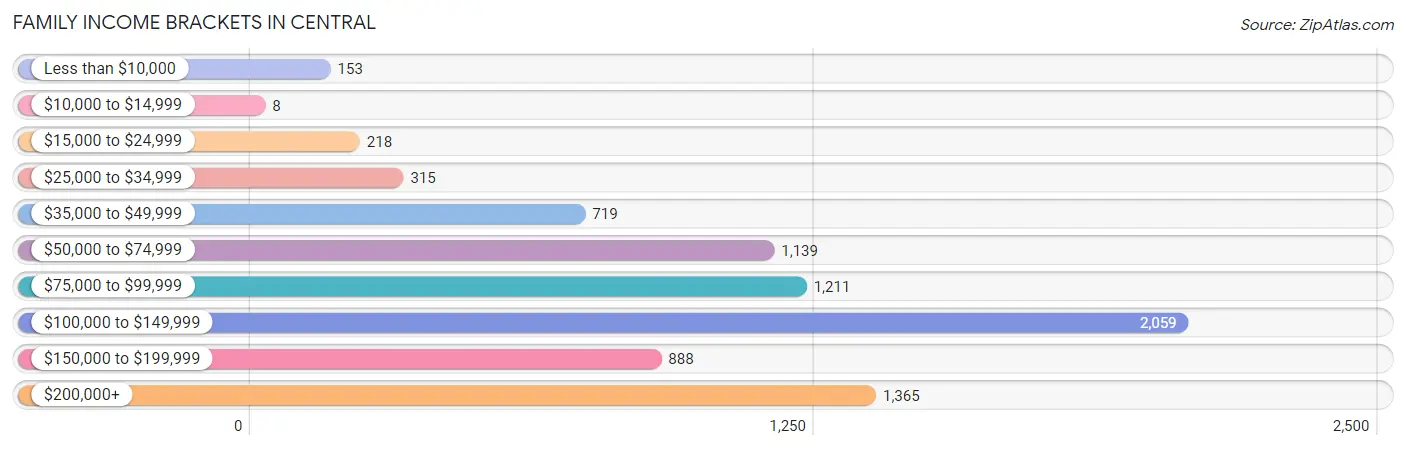
| Income Bracket | # Families | % Families |
| Less than $10,000 | 153 | 1.9% |
| $10,000 to $14,999 | 8 | 0.1% |
| $15,000 to $24,999 | 218 | 2.7% |
| $25,000 to $34,999 | 315 | 3.9% |
| $35,000 to $49,999 | 719 | 8.9% |
| $50,000 to $74,999 | 1,139 | 14.1% |
| $75,000 to $99,999 | 1,211 | 15.0% |
| $100,000 to $149,999 | 2,059 | 25.5% |
| $150,000 to $199,999 | 888 | 11.0% |
| $200,000+ | 1,365 | 16.9% |
Family Income by Famaliy Size in Central
6-person families (192 | 2.4%) account for the highest median family income in Central with $225,449 per family, while 2-person families (3,460 | 42.8%) have the highest median income of $42,681 per family member.
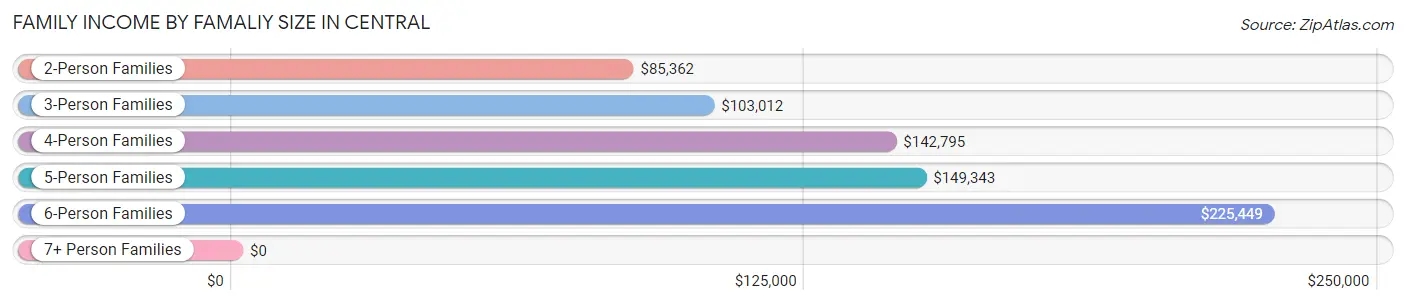
| Income Bracket | # Families | Median Income |
| 2-Person Families | 3,460 (42.8%) | $85,362 |
| 3-Person Families | 1,958 (24.2%) | $103,012 |
| 4-Person Families | 1,907 (23.6%) | $142,795 |
| 5-Person Families | 475 (5.9%) | $149,343 |
| 6-Person Families | 192 (2.4%) | $225,449 |
| 7+ Person Families | 84 (1.0%) | $0 |
| Total | 8,076 (100.0%) | $104,400 |
Family Income by Number of Earners in Central
The median family income in Central is $104,400, with families comprising 3+ earners (701) having the highest median family income of $219,279, while families with no earners (1,276) have the lowest median family income of $61,196, accounting for 8.7% and 15.8% of families, respectively.
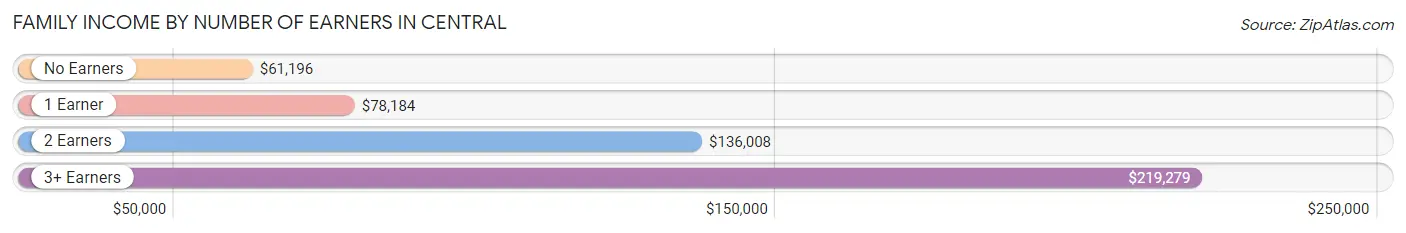
| Number of Earners | # Families | Median Income |
| No Earners | 1,276 (15.8%) | $61,196 |
| 1 Earner | 2,822 (34.9%) | $78,184 |
| 2 Earners | 3,277 (40.6%) | $136,008 |
| 3+ Earners | 701 (8.7%) | $219,279 |
| Total | 8,076 (100.0%) | $104,400 |
Household Income in Central
Household Income Brackets in Central
With 2,284 households falling in the category, the $100,000 to $149,999 income range is the most frequent in Central, accounting for 20.7% of all households. In contrast, only 77 households (0.7%) fall into the $10,000 to $14,999 income bracket, making it the least populous group.
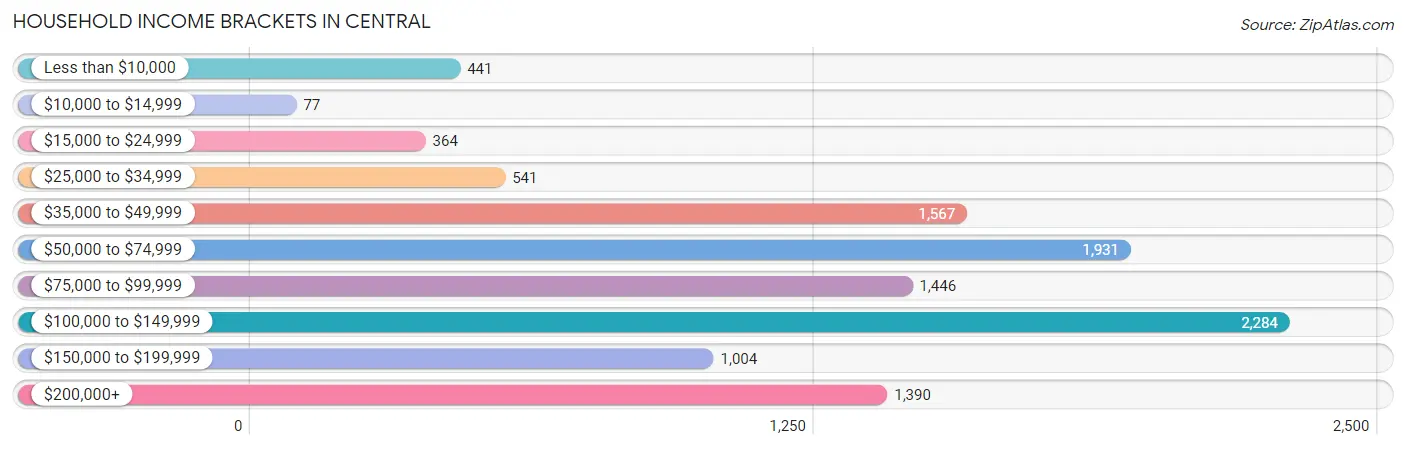
| Income Bracket | # Households | % Households |
| Less than $10,000 | 441 | 4.0% |
| $10,000 to $14,999 | 77 | 0.7% |
| $15,000 to $24,999 | 364 | 3.3% |
| $25,000 to $34,999 | 541 | 4.9% |
| $35,000 to $49,999 | 1,567 | 14.2% |
| $50,000 to $74,999 | 1,931 | 17.5% |
| $75,000 to $99,999 | 1,446 | 13.1% |
| $100,000 to $149,999 | 2,284 | 20.7% |
| $150,000 to $199,999 | 1,004 | 9.1% |
| $200,000+ | 1,390 | 12.6% |
Household Income by Householder Age in Central
The median household income in Central is $82,714, with the highest median household income of $105,919 found in the 25 to 44 years age bracket for the primary householder. A total of 3,483 households (31.6%) fall into this category. Meanwhile, the 65+ years age bracket for the primary householder has the lowest median household income of $54,236, with 3,240 households (29.4%) in this group.
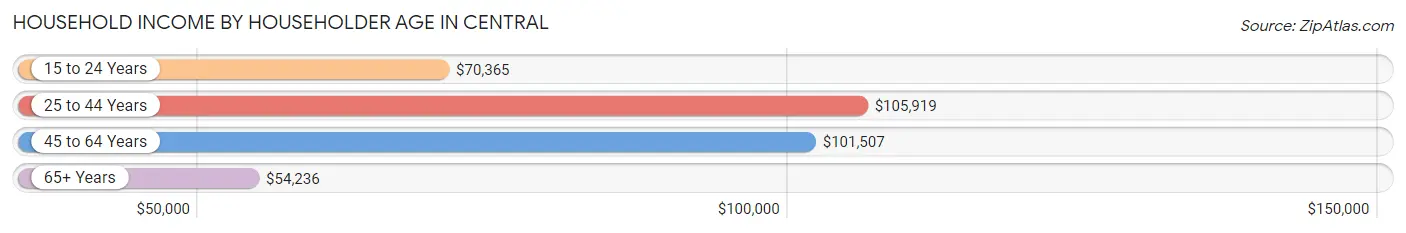
| Income Bracket | # Households | Median Income |
| 15 to 24 Years | 263 (2.4%) | $70,365 |
| 25 to 44 Years | 3,483 (31.6%) | $105,919 |
| 45 to 64 Years | 4,049 (36.7%) | $101,507 |
| 65+ Years | 3,240 (29.4%) | $54,236 |
| Total | 11,035 (100.0%) | $82,714 |
Poverty in Central
Income Below Poverty by Sex and Age in Central
With 4.4% poverty level for males and 4.3% for females among the residents of Central, 12 to 14 year old males and 5 year old females are the most vulnerable to poverty, with 141 males (28.0%) and 55 females (36.9%) in their respective age groups living below the poverty level.
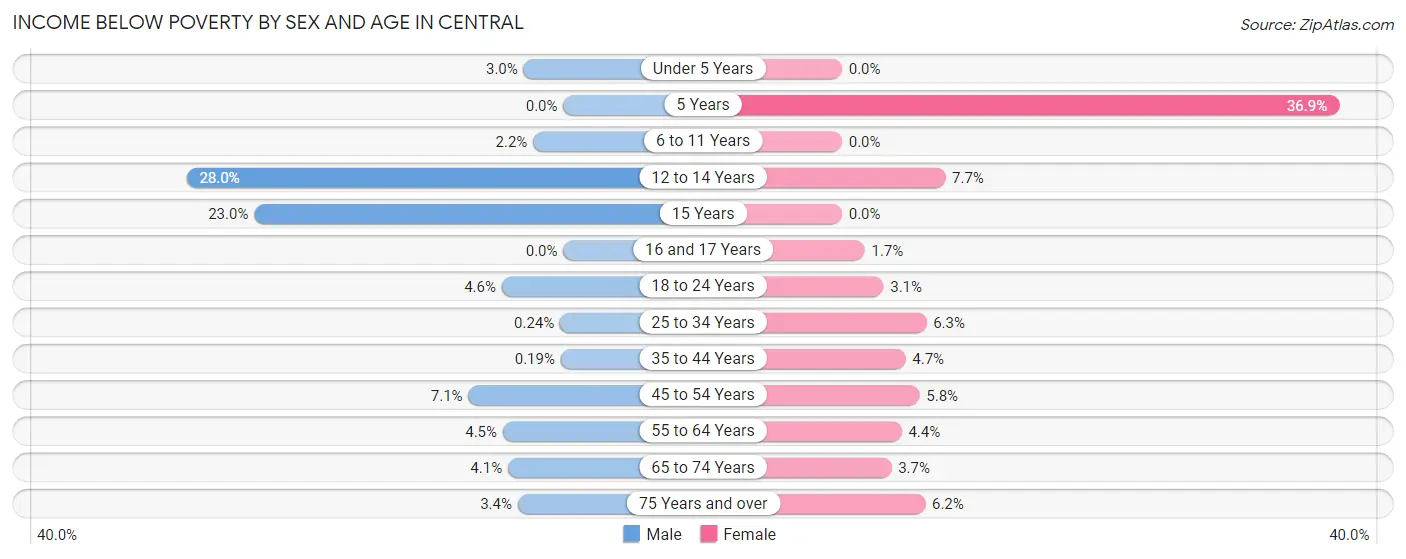
| Age Bracket | Male | Female |
| Under 5 Years | 25 (2.9%) | 0 (0.0%) |
| 5 Years | 0 (0.0%) | 55 (36.9%) |
| 6 to 11 Years | 33 (2.2%) | 0 (0.0%) |
| 12 to 14 Years | 141 (28.0%) | 45 (7.7%) |
| 15 Years | 70 (23.0%) | 0 (0.0%) |
| 16 and 17 Years | 0 (0.0%) | 9 (1.7%) |
| 18 to 24 Years | 76 (4.6%) | 29 (3.1%) |
| 25 to 34 Years | 3 (0.2%) | 85 (6.3%) |
| 35 to 44 Years | 4 (0.2%) | 93 (4.7%) |
| 45 to 54 Years | 98 (7.0%) | 91 (5.8%) |
| 55 to 64 Years | 98 (4.5%) | 97 (4.4%) |
| 65 to 74 Years | 62 (4.1%) | 57 (3.7%) |
| 75 Years and over | 23 (3.4%) | 96 (6.2%) |
| Total | 633 (4.4%) | 657 (4.3%) |
Income Above Poverty by Sex and Age in Central
According to the poverty statistics in Central, males aged 5 years and females aged under 5 years are the age groups that are most secure financially, with 100.0% of males and 100.0% of females in these age groups living above the poverty line.
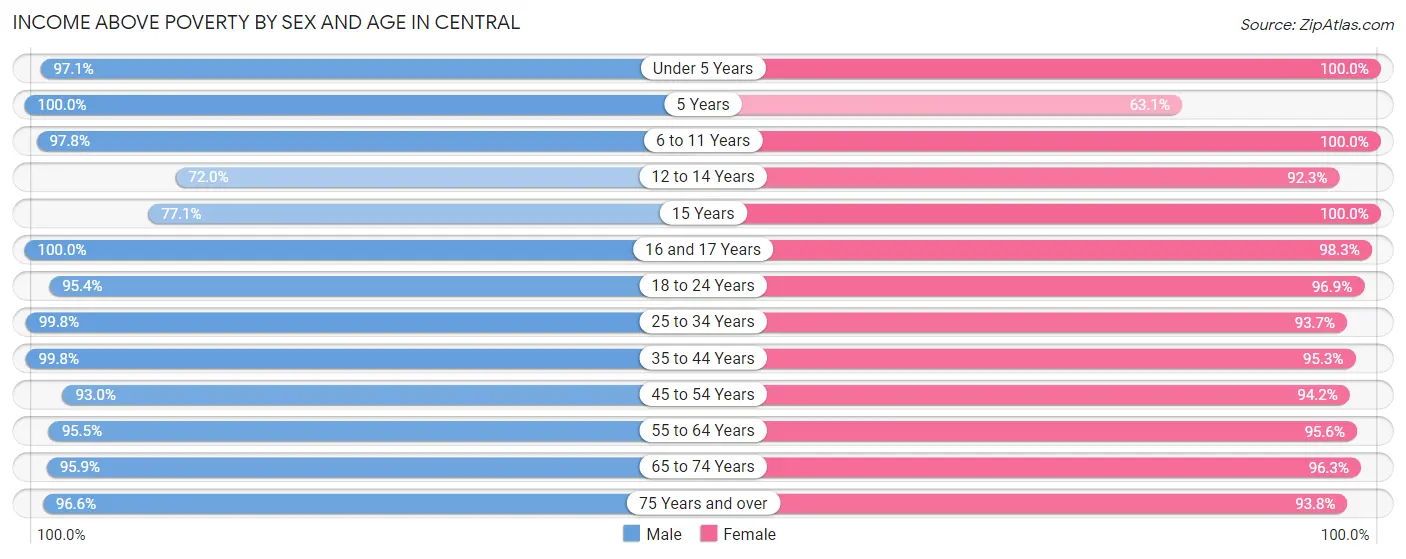
| Age Bracket | Male | Female |
| Under 5 Years | 823 (97.1%) | 932 (100.0%) |
| 5 Years | 83 (100.0%) | 94 (63.1%) |
| 6 to 11 Years | 1,440 (97.8%) | 1,574 (100.0%) |
| 12 to 14 Years | 363 (72.0%) | 542 (92.3%) |
| 15 Years | 235 (77.0%) | 219 (100.0%) |
| 16 and 17 Years | 354 (100.0%) | 523 (98.3%) |
| 18 to 24 Years | 1,586 (95.4%) | 912 (96.9%) |
| 25 to 34 Years | 1,257 (99.8%) | 1,271 (93.7%) |
| 35 to 44 Years | 2,123 (99.8%) | 1,876 (95.3%) |
| 45 to 54 Years | 1,292 (92.9%) | 1,489 (94.2%) |
| 55 to 64 Years | 2,086 (95.5%) | 2,091 (95.6%) |
| 65 to 74 Years | 1,448 (95.9%) | 1,495 (96.3%) |
| 75 Years and over | 658 (96.6%) | 1,458 (93.8%) |
| Total | 13,748 (95.6%) | 14,476 (95.7%) |
Income Below Poverty Among Married-Couple Families in Central
The poverty statistics for married-couple families in Central show that 0.8% or 49 of the total 6,365 families live below the poverty line. Families with no children have the highest poverty rate of 1.3%, comprising of 49 families. On the other hand, families with 1 or 2 children have the lowest poverty rate of 0.0%, which includes 0 families.
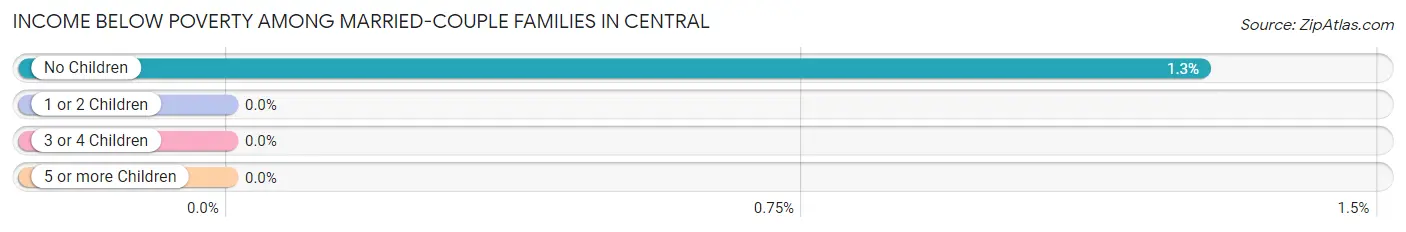
| Children | Above Poverty | Below Poverty |
| No Children | 3,808 (98.7%) | 49 (1.3%) |
| 1 or 2 Children | 1,947 (100.0%) | 0 (0.0%) |
| 3 or 4 Children | 477 (100.0%) | 0 (0.0%) |
| 5 or more Children | 84 (100.0%) | 0 (0.0%) |
| Total | 6,316 (99.2%) | 49 (0.8%) |
Income Below Poverty Among Single-Parent Households in Central
According to the poverty data in Central, 12.4% or 55 single-father households and 13.2% or 167 single-mother households are living below the poverty line. Among single-father households, those with 1 or 2 children have the highest poverty rate, with 55 households (15.1%) experiencing poverty. Likewise, among single-mother households, those with 1 or 2 children have the highest poverty rate, with 144 households (18.9%) falling below the poverty line.
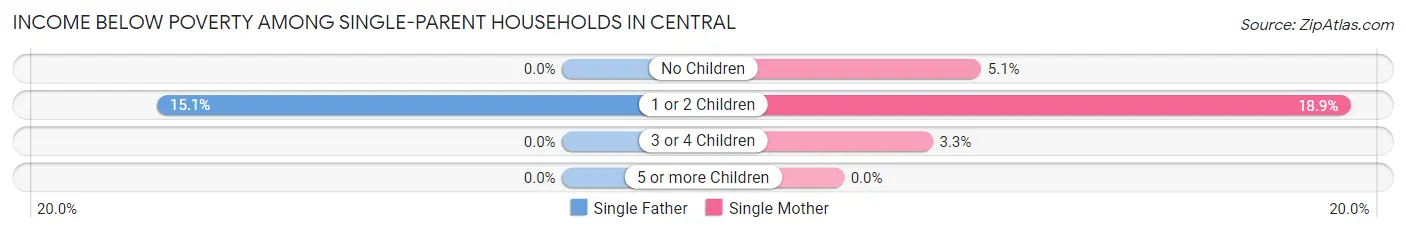
| Children | Single Father | Single Mother |
| No Children | 0 (0.0%) | 18 (5.1%) |
| 1 or 2 Children | 55 (15.1%) | 144 (18.9%) |
| 3 or 4 Children | 0 (0.0%) | 5 (3.3%) |
| 5 or more Children | 0 (0.0%) | 0 (0.0%) |
| Total | 55 (12.4%) | 167 (13.2%) |
Income Below Poverty Among Married-Couple vs Single-Parent Households in Central
The poverty data for Central shows that 49 of the married-couple family households (0.8%) and 222 of the single-parent households (13.0%) are living below the poverty level. Within the married-couple family households, those with no children have the highest poverty rate, with 49 households (1.3%) falling below the poverty line. Among the single-parent households, those with 1 or 2 children have the highest poverty rate, with 199 household (17.6%) living below poverty.
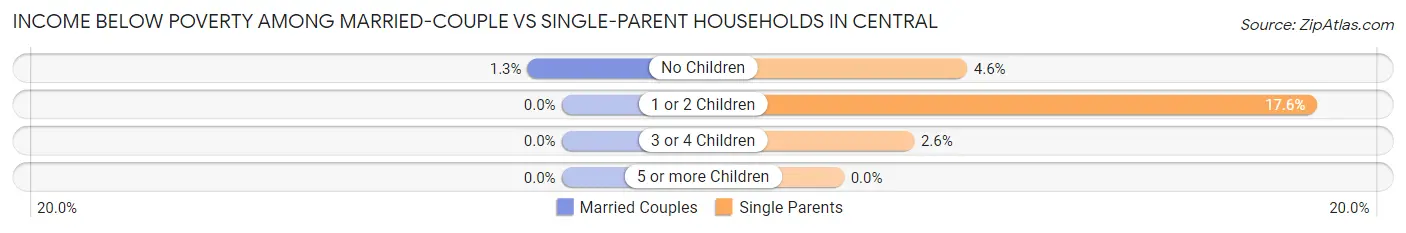
| Children | Married-Couple Families | Single-Parent Households |
| No Children | 49 (1.3%) | 18 (4.6%) |
| 1 or 2 Children | 0 (0.0%) | 199 (17.6%) |
| 3 or 4 Children | 0 (0.0%) | 5 (2.6%) |
| 5 or more Children | 0 (0.0%) | 0 (0.0%) |
| Total | 49 (0.8%) | 222 (13.0%) |
Race in Central
The most populous races in Central are White / Caucasian (24,620 | 83.4%), Black / African American (2,476 | 8.4%), and Two or more Races (1,919 | 6.5%).
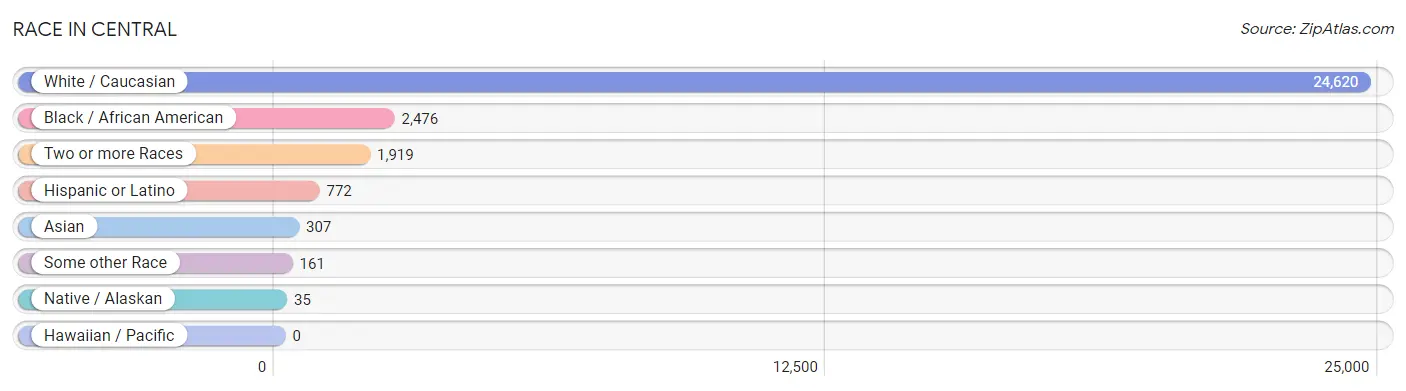
| Race | # Population | % Population |
| Asian | 307 | 1.0% |
| Black / African American | 2,476 | 8.4% |
| Hawaiian / Pacific | 0 | 0.0% |
| Hispanic or Latino | 772 | 2.6% |
| Native / Alaskan | 35 | 0.1% |
| White / Caucasian | 24,620 | 83.4% |
| Two or more Races | 1,919 | 6.5% |
| Some other Race | 161 | 0.5% |
| Total | 29,518 | 100.0% |
Ancestry in Central
The most populous ancestries reported in Central are American (3,647 | 12.4%), French (3,247 | 11.0%), English (2,791 | 9.5%), Irish (2,294 | 7.8%), and Italian (1,692 | 5.7%), together accounting for 46.3% of all Central residents.
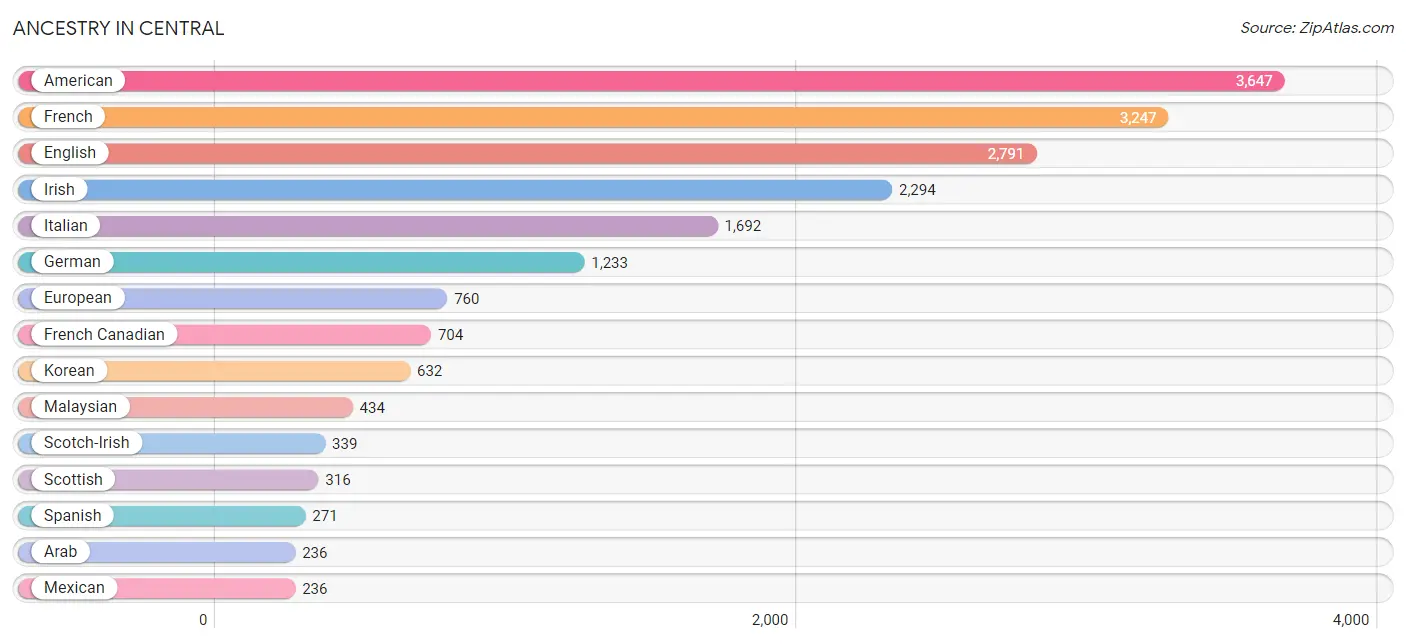
| Ancestry | # Population | % Population |
| African | 63 | 0.2% |
| American | 3,647 | 12.4% |
| Arab | 236 | 0.8% |
| Belgian | 18 | 0.1% |
| Brazilian | 32 | 0.1% |
| British | 69 | 0.2% |
| Cajun | 184 | 0.6% |
| Canadian | 6 | 0.0% |
| Central American | 107 | 0.4% |
| Central American Indian | 18 | 0.1% |
| Cherokee | 27 | 0.1% |
| Costa Rican | 75 | 0.3% |
| Cuban | 10 | 0.0% |
| Czech | 31 | 0.1% |
| Dutch | 160 | 0.5% |
| Egyptian | 10 | 0.0% |
| English | 2,791 | 9.5% |
| European | 760 | 2.6% |
| Finnish | 6 | 0.0% |
| French | 3,247 | 11.0% |
| French Canadian | 704 | 2.4% |
| German | 1,233 | 4.2% |
| Honduran | 18 | 0.1% |
| Hungarian | 63 | 0.2% |
| Indian (Asian) | 19 | 0.1% |
| Irish | 2,294 | 7.8% |
| Italian | 1,692 | 5.7% |
| Korean | 632 | 2.1% |
| Lebanese | 147 | 0.5% |
| Malaysian | 434 | 1.5% |
| Mexican | 236 | 0.8% |
| Native Hawaiian | 8 | 0.0% |
| Nicaraguan | 14 | 0.1% |
| Northern European | 13 | 0.0% |
| Norwegian | 111 | 0.4% |
| Polish | 227 | 0.8% |
| Portuguese | 5 | 0.0% |
| Pueblo | 16 | 0.1% |
| Puerto Rican | 56 | 0.2% |
| Scandinavian | 10 | 0.0% |
| Scotch-Irish | 339 | 1.1% |
| Scottish | 316 | 1.1% |
| Slavic | 8 | 0.0% |
| South American | 1 | 0.0% |
| Spaniard | 78 | 0.3% |
| Spanish | 271 | 0.9% |
| Sri Lankan | 57 | 0.2% |
| Subsaharan African | 63 | 0.2% |
| Swedish | 133 | 0.4% |
| Venezuelan | 1 | 0.0% |
| Welsh | 205 | 0.7% |
| West Indian | 3 | 0.0% | View All 52 Rows |
Immigrants in Central
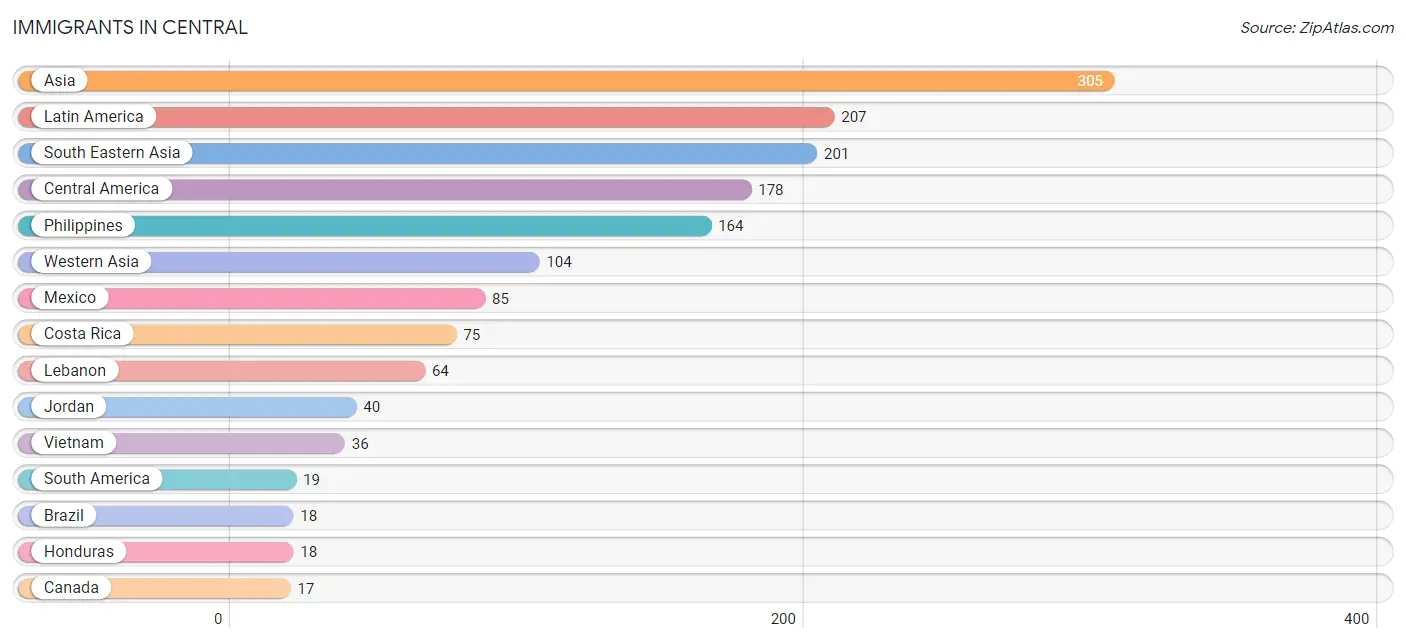
The most numerous immigrant groups reported in Central came from Asia (305 | 1.0%), Latin America (207 | 0.7%), South Eastern Asia (201 | 0.7%), Central America (178 | 0.6%), and Philippines (164 | 0.6%), together accounting for 3.6% of all Central residents.
| Immigration Origin | # Population | % Population |
| Asia | 305 | 1.0% |
| Brazil | 18 | 0.1% |
| Canada | 17 | 0.1% |
| Caribbean | 10 | 0.0% |
| Central America | 178 | 0.6% |
| Costa Rica | 75 | 0.3% |
| Cuba | 10 | 0.0% |
| England | 8 | 0.0% |
| Europe | 8 | 0.0% |
| Honduras | 18 | 0.1% |
| Jordan | 40 | 0.1% |
| Latin America | 207 | 0.7% |
| Lebanon | 64 | 0.2% |
| Mexico | 85 | 0.3% |
| Northern Europe | 8 | 0.0% |
| Philippines | 164 | 0.6% |
| South America | 19 | 0.1% |
| South Eastern Asia | 201 | 0.7% |
| Thailand | 1 | 0.0% |
| Venezuela | 1 | 0.0% |
| Vietnam | 36 | 0.1% |
| Western Asia | 104 | 0.4% | View All 22 Rows |
Sex and Age in Central
Sex and Age in Central
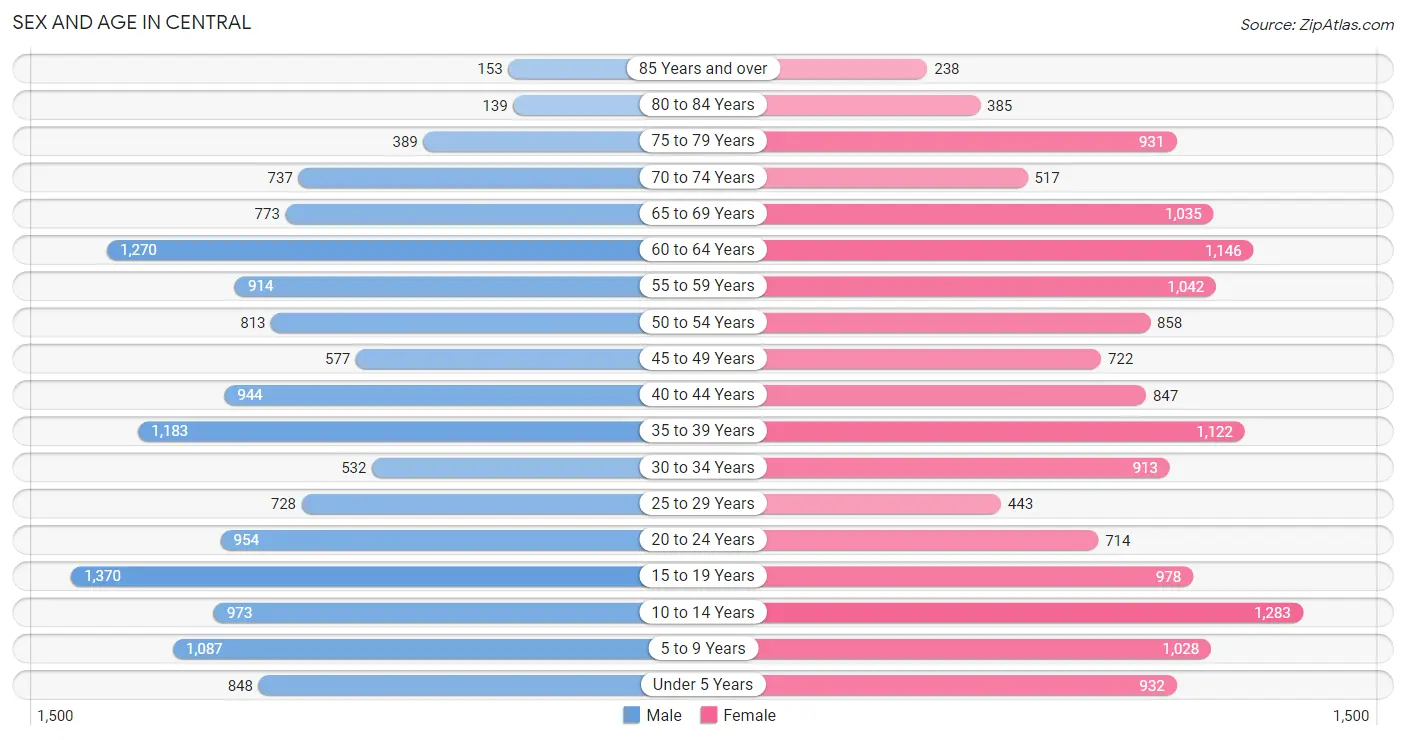
The most populous age groups in Central are 15 to 19 Years (1,370 | 9.5%) for men and 10 to 14 Years (1,283 | 8.5%) for women.
| Age Bracket | Male | Female |
| Under 5 Years | 848 (5.9%) | 932 (6.2%) |
| 5 to 9 Years | 1,087 (7.6%) | 1,028 (6.8%) |
| 10 to 14 Years | 973 (6.8%) | 1,283 (8.5%) |
| 15 to 19 Years | 1,370 (9.5%) | 978 (6.5%) |
| 20 to 24 Years | 954 (6.6%) | 714 (4.7%) |
| 25 to 29 Years | 728 (5.1%) | 443 (2.9%) |
| 30 to 34 Years | 532 (3.7%) | 913 (6.0%) |
| 35 to 39 Years | 1,183 (8.2%) | 1,122 (7.4%) |
| 40 to 44 Years | 944 (6.6%) | 847 (5.6%) |
| 45 to 49 Years | 577 (4.0%) | 722 (4.8%) |
| 50 to 54 Years | 813 (5.7%) | 858 (5.7%) |
| 55 to 59 Years | 914 (6.4%) | 1,042 (6.9%) |
| 60 to 64 Years | 1,270 (8.8%) | 1,146 (7.6%) |
| 65 to 69 Years | 773 (5.4%) | 1,035 (6.8%) |
| 70 to 74 Years | 737 (5.1%) | 517 (3.4%) |
| 75 to 79 Years | 389 (2.7%) | 931 (6.1%) |
| 80 to 84 Years | 139 (1.0%) | 385 (2.5%) |
| 85 Years and over | 153 (1.1%) | 238 (1.6%) |
| Total | 14,384 (100.0%) | 15,134 (100.0%) |
Families and Households in Central
Median Family Size in Central
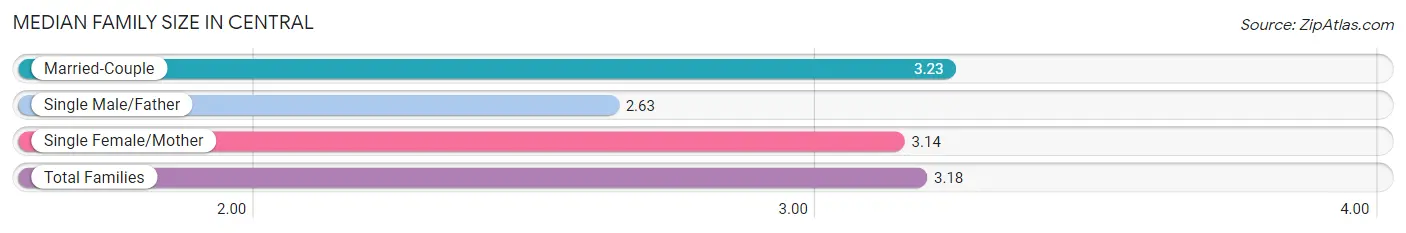
The median family size in Central is 3.18 persons per family, with married-couple families (6,365 | 78.8%) accounting for the largest median family size of 3.23 persons per family. On the other hand, single male/father families (445 | 5.5%) represent the smallest median family size with 2.63 persons per family.
| Family Type | # Families | Family Size |
| Married-Couple | 6,365 (78.8%) | 3.23 |
| Single Male/Father | 445 (5.5%) | 2.63 |
| Single Female/Mother | 1,266 (15.7%) | 3.14 |
| Total Families | 8,076 (100.0%) | 3.18 |
Median Household Size in Central
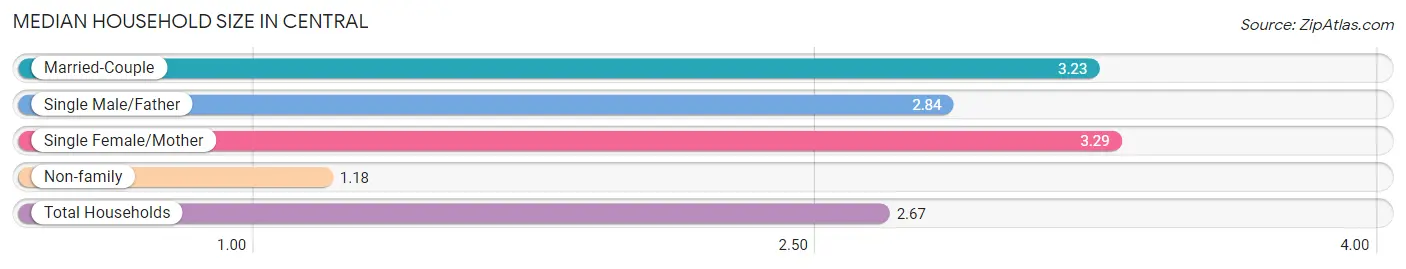
The median household size in Central is 2.67 persons per household, with single female/mother households (1,266 | 11.5%) accounting for the largest median household size of 3.29 persons per household. non-family households (2,959 | 26.8%) represent the smallest median household size with 1.18 persons per household.
| Household Type | # Households | Household Size |
| Married-Couple | 6,365 (57.7%) | 3.23 |
| Single Male/Father | 445 (4.0%) | 2.84 |
| Single Female/Mother | 1,266 (11.5%) | 3.29 |
| Non-family | 2,959 (26.8%) | 1.18 |
| Total Households | 11,035 (100.0%) | 2.67 |
Household Size by Marriage Status in Central
Out of a total of 11,035 households in Central, 8,076 (73.2%) are family households, while 2,959 (26.8%) are nonfamily households. The most numerous type of family households are 2-person households, comprising 3,387, and the most common type of nonfamily households are 1-person households, comprising 2,485.
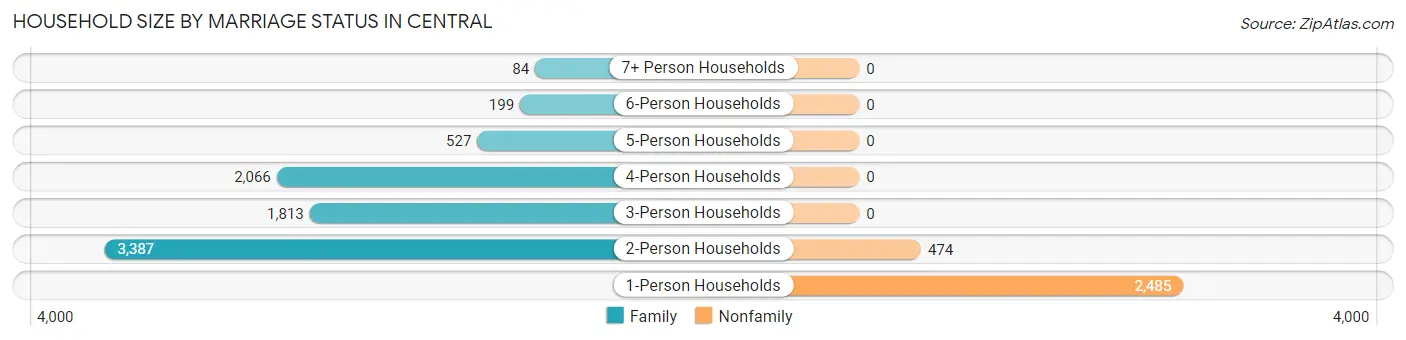
| Household Size | Family Households | Nonfamily Households |
| 1-Person Households | - | 2,485 (22.5%) |
| 2-Person Households | 3,387 (30.7%) | 474 (4.3%) |
| 3-Person Households | 1,813 (16.4%) | 0 (0.0%) |
| 4-Person Households | 2,066 (18.7%) | 0 (0.0%) |
| 5-Person Households | 527 (4.8%) | 0 (0.0%) |
| 6-Person Households | 199 (1.8%) | 0 (0.0%) |
| 7+ Person Households | 84 (0.8%) | 0 (0.0%) |
| Total | 8,076 (73.2%) | 2,959 (26.8%) |
Female Fertility in Central
Fertility by Age in Central
Average fertility rate in Central is 70.0 births per 1,000 women. Women in the age bracket of 20 to 34 years have the highest fertility rate with 200.0 births per 1,000 women. Women in the age bracket of 20 to 34 years acount for 100.0% of all women with births.
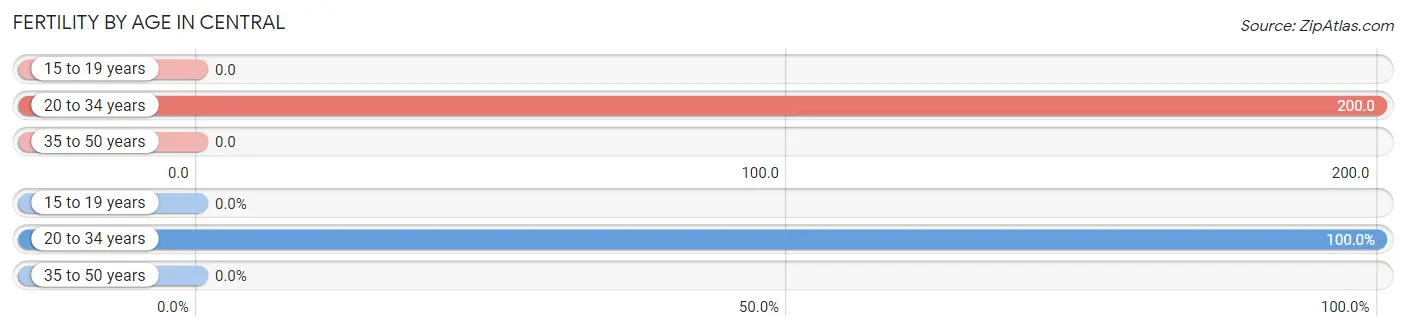
| Age Bracket | Women with Births | Births / 1,000 Women |
| 15 to 19 years | 0 (0.0%) | 0.0 |
| 20 to 34 years | 415 (100.0%) | 200.0 |
| 35 to 50 years | 0 (0.0%) | 0.0 |
| Total | 415 (100.0%) | 70.0 |
Fertility by Age by Marriage Status in Central
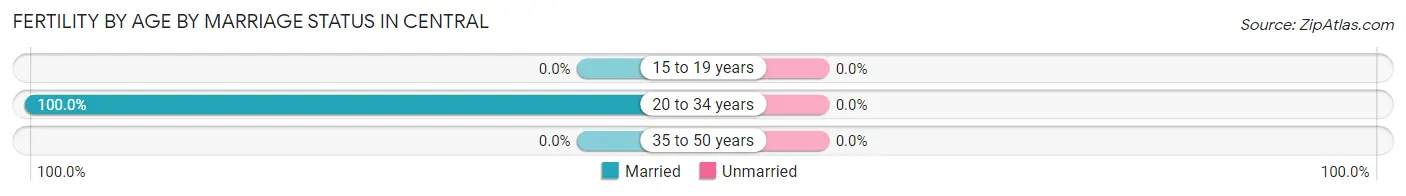
| Age Bracket | Married | Unmarried |
| 15 to 19 years | 0 (0.0%) | 0 (0.0%) |
| 20 to 34 years | 415 (100.0%) | 0 (0.0%) |
| 35 to 50 years | 0 (0.0%) | 0 (0.0%) |
| Total | 415 (100.0%) | 0 (0.0%) |
Fertility by Education in Central
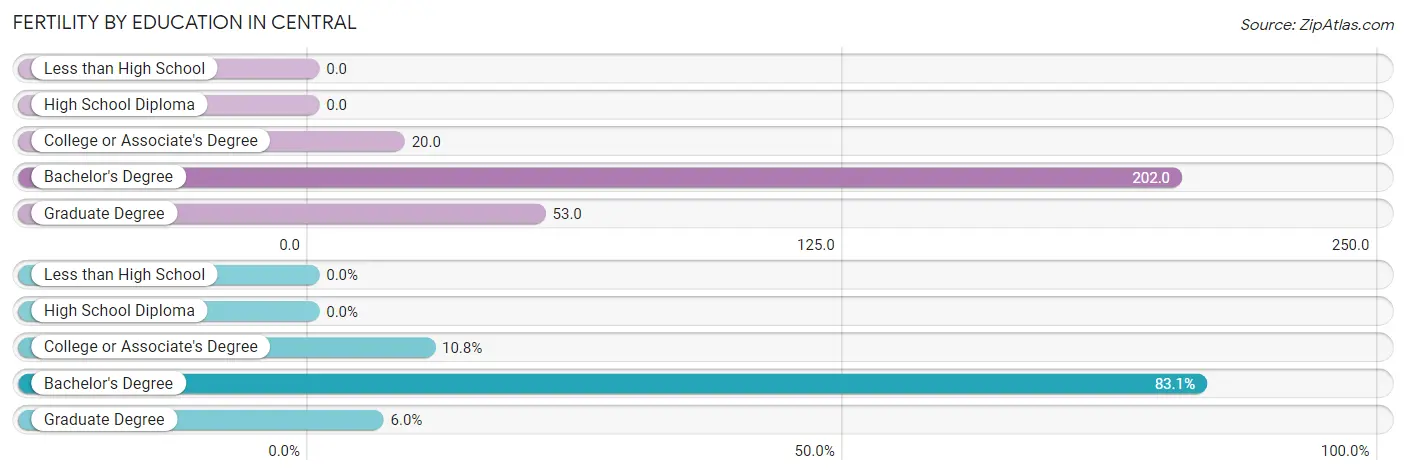
| Educational Attainment | Women with Births | Births / 1,000 Women |
| Less than High School | 0 (0.0%) | 0.0 |
| High School Diploma | 0 (0.0%) | 0.0 |
| College or Associate's Degree | 45 (10.8%) | 20.0 |
| Bachelor's Degree | 345 (83.1%) | 202.0 |
| Graduate Degree | 25 (6.0%) | 53.0 |
| Total | 415 (100.0%) | 70.0 |
Fertility by Education by Marriage Status in Central
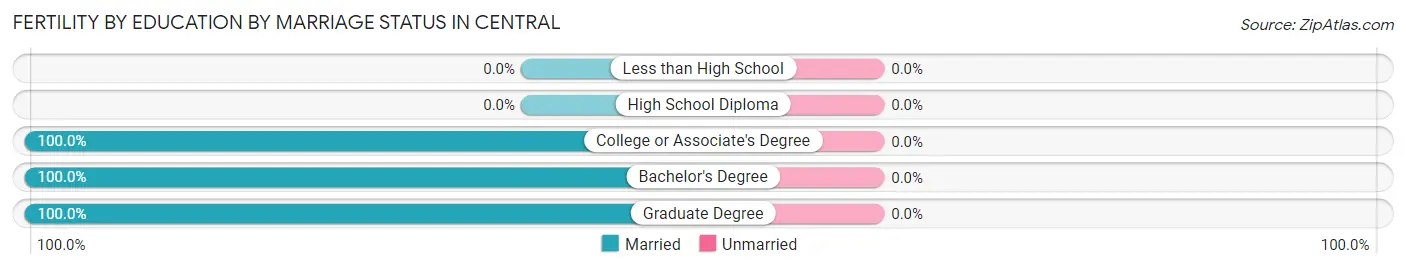
| Educational Attainment | Married | Unmarried |
| Less than High School | 0 (0.0%) | 0 (0.0%) |
| High School Diploma | 0 (0.0%) | 0 (0.0%) |
| College or Associate's Degree | 45 (100.0%) | 0 (0.0%) |
| Bachelor's Degree | 345 (100.0%) | 0 (0.0%) |
| Graduate Degree | 25 (100.0%) | 0 (0.0%) |
| Total | 415 (100.0%) | 0 (0.0%) |
Employment Characteristics in Central
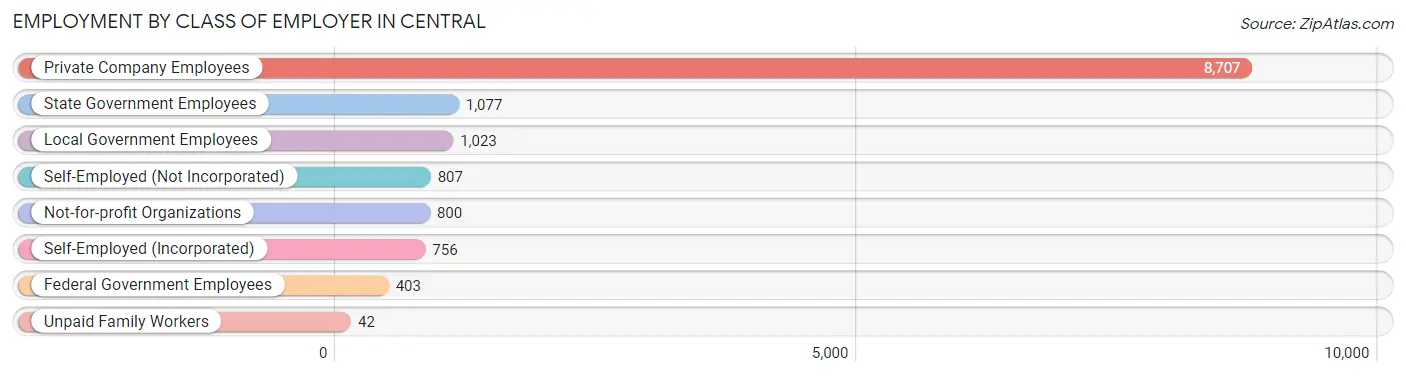
Employment by Class of Employer in Central
Among the 13,615 employed individuals in Central, private company employees (8,707 | 63.9%), state government employees (1,077 | 7.9%), and local government employees (1,023 | 7.5%) make up the most common classes of employment.
| Employer Class | # Employees | % Employees |
| Private Company Employees | 8,707 | 63.9% |
| Self-Employed (Incorporated) | 756 | 5.6% |
| Self-Employed (Not Incorporated) | 807 | 5.9% |
| Not-for-profit Organizations | 800 | 5.9% |
| Local Government Employees | 1,023 | 7.5% |
| State Government Employees | 1,077 | 7.9% |
| Federal Government Employees | 403 | 3.0% |
| Unpaid Family Workers | 42 | 0.3% |
| Total | 13,615 | 100.0% |
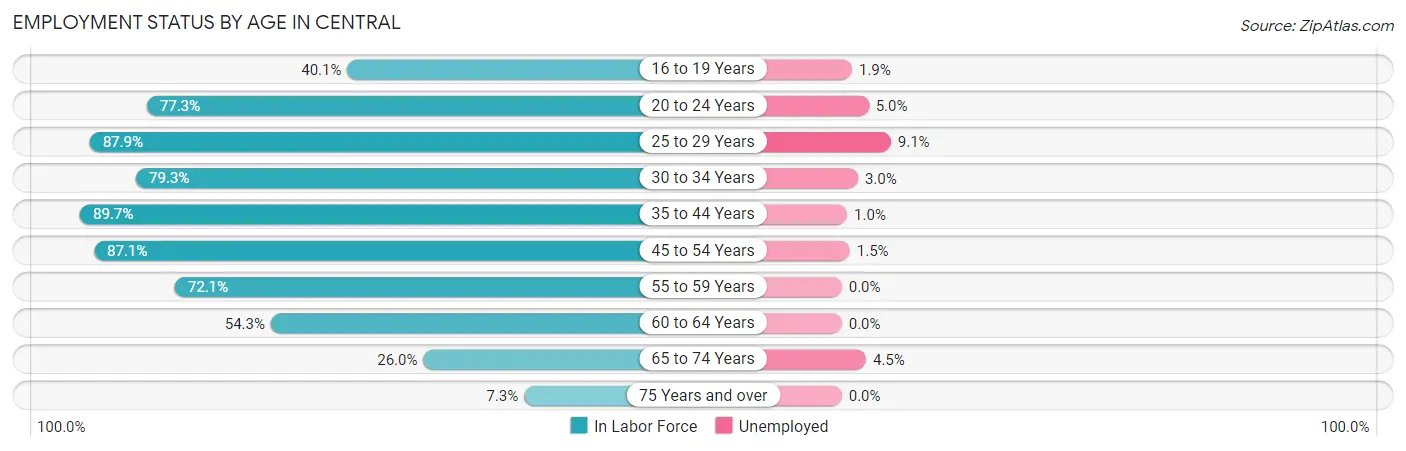
Employment Status by Age in Central
According to the labor force statistics for Central, out of the total population over 16 years of age (22,843), 61.9% or 14,140 individuals are in the labor force, with 2.2% or 311 of them unemployed. The age group with the highest labor force participation rate is 35 to 44 years, with 89.7% or 3,674 individuals in the labor force. Within the labor force, the 25 to 29 years age range has the highest percentage of unemployed individuals, with 9.1% or 94 of them being unemployed.
| Age Bracket | In Labor Force | Unemployed |
| 16 to 19 Years | 731 (40.1%) | 14 (1.9%) |
| 20 to 24 Years | 1,289 (77.3%) | 64 (5.0%) |
| 25 to 29 Years | 1,029 (87.9%) | 94 (9.1%) |
| 30 to 34 Years | 1,146 (79.3%) | 34 (3.0%) |
| 35 to 44 Years | 3,674 (89.7%) | 37 (1.0%) |
| 45 to 54 Years | 2,587 (87.1%) | 39 (1.5%) |
| 55 to 59 Years | 1,410 (72.1%) | 0 (0.0%) |
| 60 to 64 Years | 1,312 (54.3%) | 0 (0.0%) |
| 65 to 74 Years | 796 (26.0%) | 36 (4.5%) |
| 75 Years and over | 163 (7.3%) | 0 (0.0%) |
| Total | 14,140 (61.9%) | 311 (2.2%) |
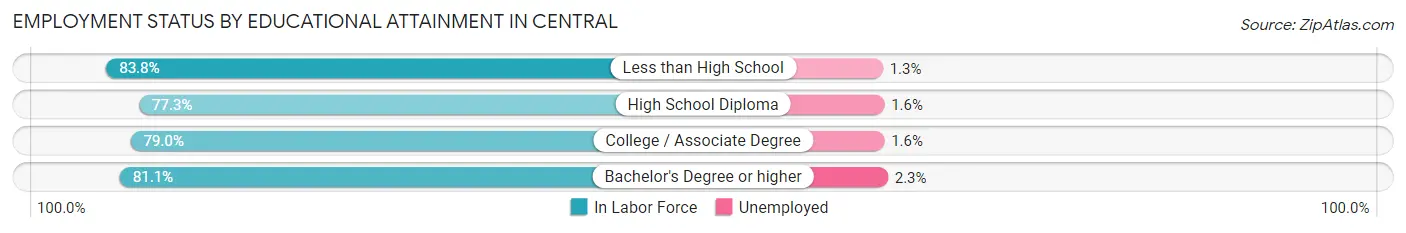
Employment Status by Educational Attainment in Central
According to labor force statistics for Central, 79.4% of individuals (11,159) out of the total population between 25 and 64 years of age (14,054) are in the labor force, with 1.8% or 201 of them being unemployed. The group with the highest labor force participation rate are those with the educational attainment of less than high school, with 83.8% or 532 individuals in the labor force. Within the labor force, individuals with bachelor's degree or higher education have the highest percentage of unemployment, with 2.3% or 88 of them being unemployed.
| Educational Attainment | In Labor Force | Unemployed |
| Less than High School | 532 (83.8%) | 8 (1.3%) |
| High School Diploma | 3,335 (77.3%) | 69 (1.6%) |
| College / Associate Degree | 3,450 (79.0%) | 70 (1.6%) |
| Bachelor's Degree or higher | 3,843 (81.1%) | 109 (2.3%) |
| Total | 11,159 (79.4%) | 253 (1.8%) |
Employment Occupations by Sex in Central
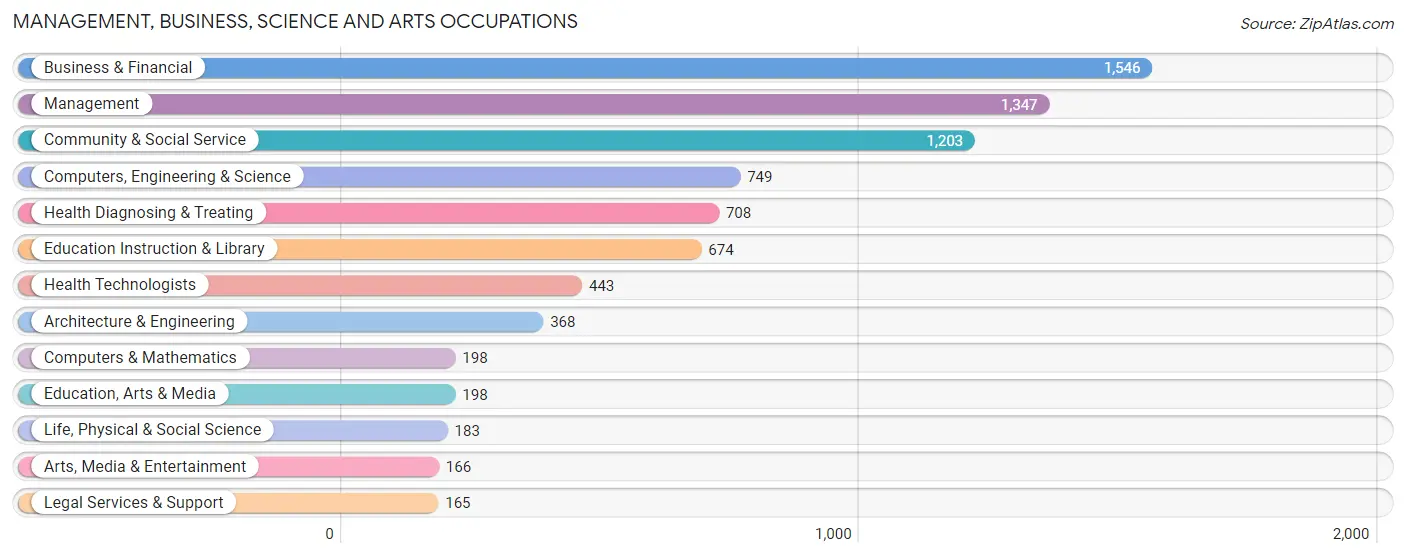
Management, Business, Science and Arts Occupations
The most common Management, Business, Science and Arts occupations in Central are Business & Financial (1,546 | 11.2%), Management (1,347 | 9.8%), Community & Social Service (1,203 | 8.7%), Computers, Engineering & Science (749 | 5.4%), and Health Diagnosing & Treating (708 | 5.1%).
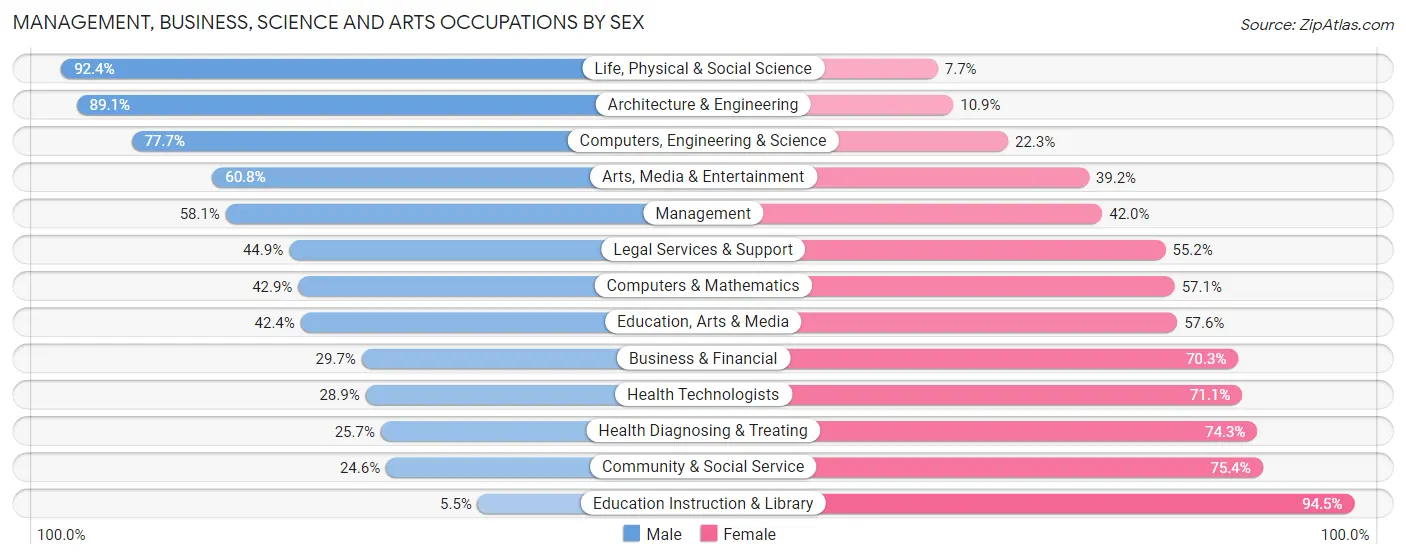
Management, Business, Science and Arts Occupations by Sex
Within the Management, Business, Science and Arts occupations in Central, the most male-oriented occupations are Life, Physical & Social Science (92.3%), Architecture & Engineering (89.1%), and Computers, Engineering & Science (77.7%), while the most female-oriented occupations are Education Instruction & Library (94.5%), Community & Social Service (75.4%), and Health Diagnosing & Treating (74.3%).
| Occupation | Male | Female |
| Management | 782 (58.1%) | 565 (41.9%) |
| Business & Financial | 459 (29.7%) | 1,087 (70.3%) |
| Computers, Engineering & Science | 582 (77.7%) | 167 (22.3%) |
| Computers & Mathematics | 85 (42.9%) | 113 (57.1%) |
| Architecture & Engineering | 328 (89.1%) | 40 (10.9%) |
| Life, Physical & Social Science | 169 (92.3%) | 14 (7.6%) |
| Community & Social Service | 296 (24.6%) | 907 (75.4%) |
| Education, Arts & Media | 84 (42.4%) | 114 (57.6%) |
| Legal Services & Support | 74 (44.9%) | 91 (55.1%) |
| Education Instruction & Library | 37 (5.5%) | 637 (94.5%) |
| Arts, Media & Entertainment | 101 (60.8%) | 65 (39.2%) |
| Health Diagnosing & Treating | 182 (25.7%) | 526 (74.3%) |
| Health Technologists | 128 (28.9%) | 315 (71.1%) |
| Total (Category) | 2,301 (41.4%) | 3,252 (58.6%) |
| Total (Overall) | 7,461 (54.0%) | 6,358 (46.0%) |
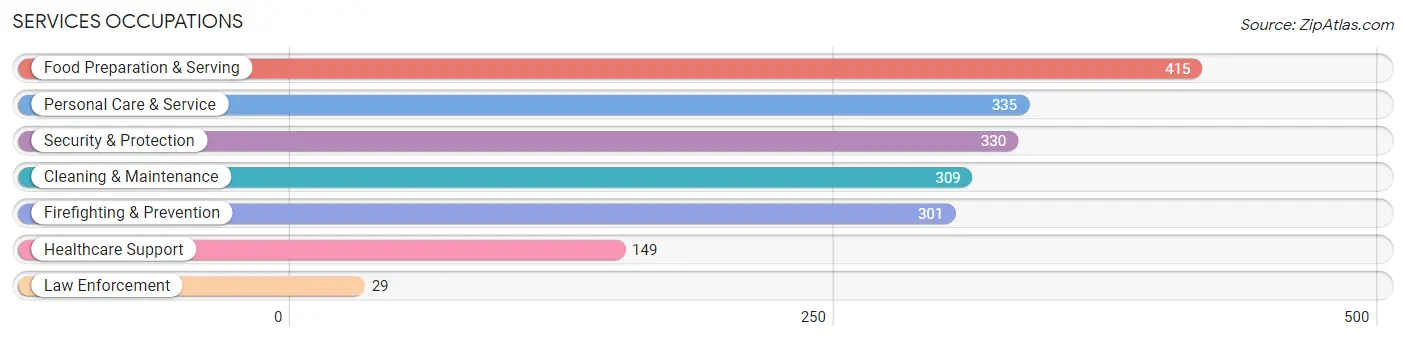
Services Occupations
The most common Services occupations in Central are Food Preparation & Serving (415 | 3.0%), Personal Care & Service (335 | 2.4%), Security & Protection (330 | 2.4%), Cleaning & Maintenance (309 | 2.2%), and Firefighting & Prevention (301 | 2.2%).
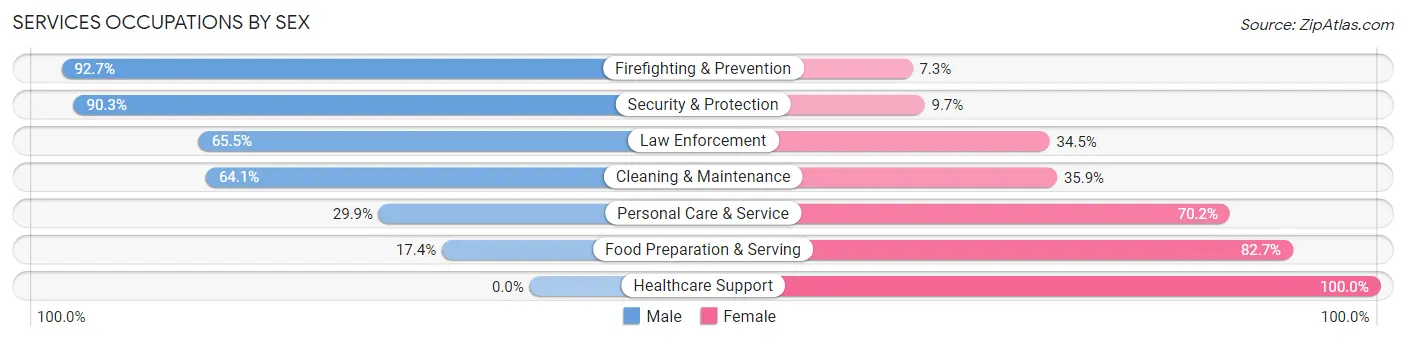
Services Occupations by Sex
Within the Services occupations in Central, the most male-oriented occupations are Firefighting & Prevention (92.7%), Security & Protection (90.3%), and Law Enforcement (65.5%), while the most female-oriented occupations are Healthcare Support (100.0%), Food Preparation & Serving (82.7%), and Personal Care & Service (70.2%).
| Occupation | Male | Female |
| Healthcare Support | 0 (0.0%) | 149 (100.0%) |
| Security & Protection | 298 (90.3%) | 32 (9.7%) |
| Firefighting & Prevention | 279 (92.7%) | 22 (7.3%) |
| Law Enforcement | 19 (65.5%) | 10 (34.5%) |
| Food Preparation & Serving | 72 (17.3%) | 343 (82.7%) |
| Cleaning & Maintenance | 198 (64.1%) | 111 (35.9%) |
| Personal Care & Service | 100 (29.8%) | 235 (70.2%) |
| Total (Category) | 668 (43.4%) | 870 (56.6%) |
| Total (Overall) | 7,461 (54.0%) | 6,358 (46.0%) |
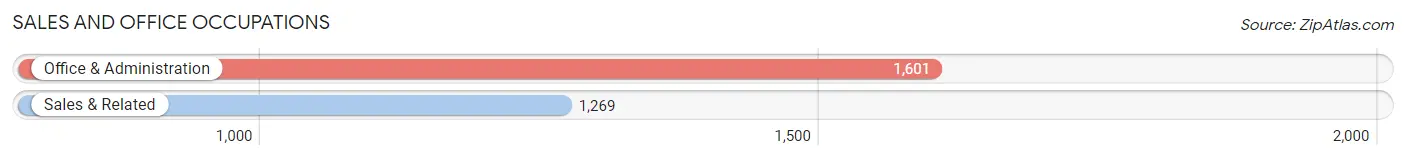
Sales and Office Occupations
The most common Sales and Office occupations in Central are Office & Administration (1,601 | 11.6%), and Sales & Related (1,269 | 9.2%).
Sales and Office Occupations by Sex
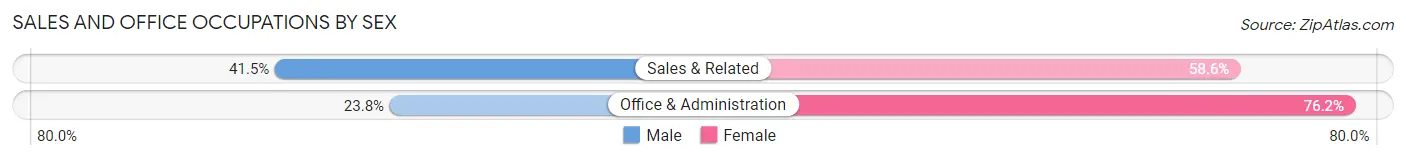
| Occupation | Male | Female |
| Sales & Related | 526 (41.4%) | 743 (58.6%) |
| Office & Administration | 381 (23.8%) | 1,220 (76.2%) |
| Total (Category) | 907 (31.6%) | 1,963 (68.4%) |
| Total (Overall) | 7,461 (54.0%) | 6,358 (46.0%) |
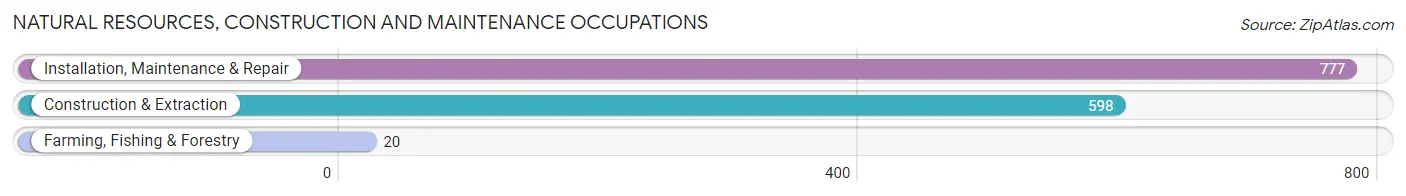
Natural Resources, Construction and Maintenance Occupations
The most common Natural Resources, Construction and Maintenance occupations in Central are Installation, Maintenance & Repair (777 | 5.6%), Construction & Extraction (598 | 4.3%), and Farming, Fishing & Forestry (20 | 0.1%).
Natural Resources, Construction and Maintenance Occupations by Sex
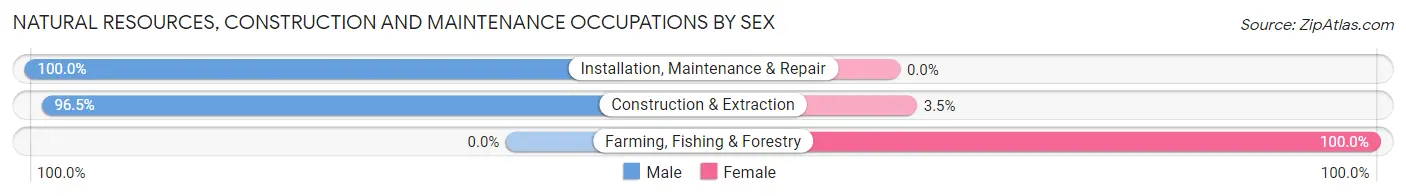
| Occupation | Male | Female |
| Farming, Fishing & Forestry | 0 (0.0%) | 20 (100.0%) |
| Construction & Extraction | 577 (96.5%) | 21 (3.5%) |
| Installation, Maintenance & Repair | 777 (100.0%) | 0 (0.0%) |
| Total (Category) | 1,354 (97.1%) | 41 (2.9%) |
| Total (Overall) | 7,461 (54.0%) | 6,358 (46.0%) |
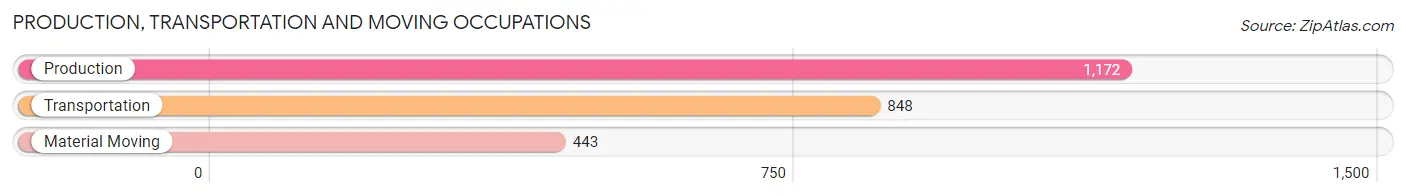
Production, Transportation and Moving Occupations
The most common Production, Transportation and Moving occupations in Central are Production (1,172 | 8.5%), Transportation (848 | 6.1%), and Material Moving (443 | 3.2%).
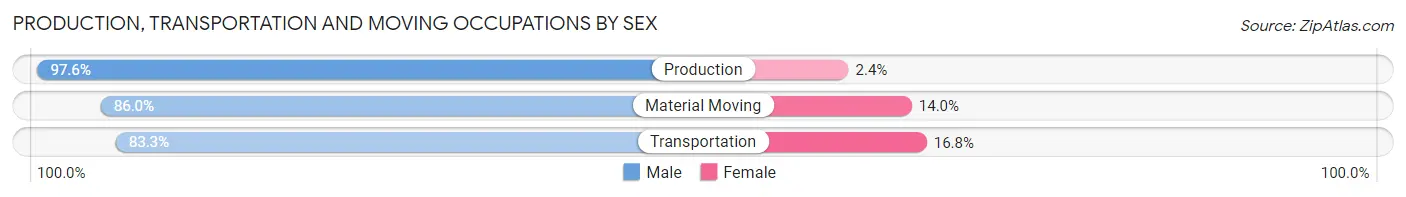
Production, Transportation and Moving Occupations by Sex
| Occupation | Male | Female |
| Production | 1,144 (97.6%) | 28 (2.4%) |
| Transportation | 706 (83.3%) | 142 (16.8%) |
| Material Moving | 381 (86.0%) | 62 (14.0%) |
| Total (Category) | 2,231 (90.6%) | 232 (9.4%) |
| Total (Overall) | 7,461 (54.0%) | 6,358 (46.0%) |
Employment Industries by Sex in Central
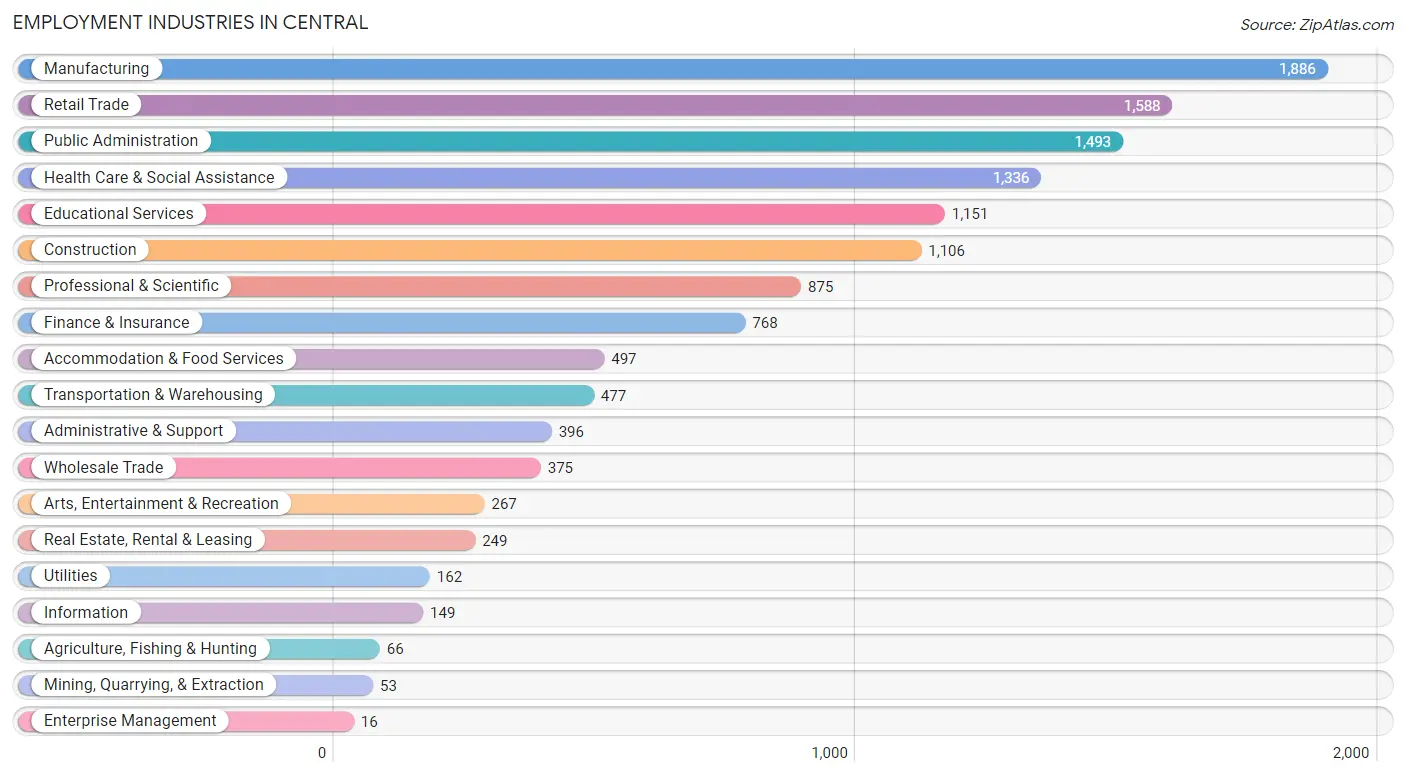
Employment Industries in Central
The major employment industries in Central include Manufacturing (1,886 | 13.7%), Retail Trade (1,588 | 11.5%), Public Administration (1,493 | 10.8%), Health Care & Social Assistance (1,336 | 9.7%), and Educational Services (1,151 | 8.3%).
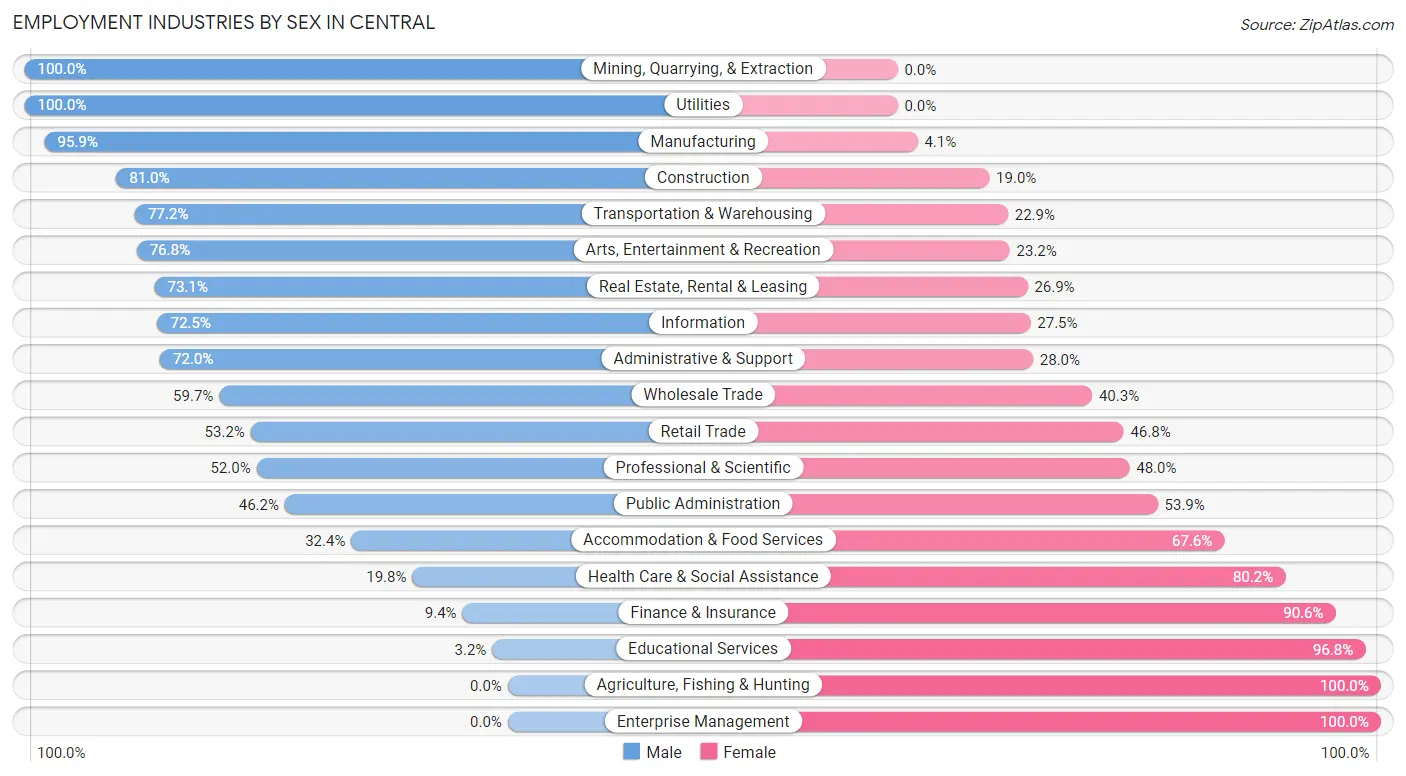
Employment Industries by Sex in Central
The Central industries that see more men than women are Mining, Quarrying, & Extraction (100.0%), Utilities (100.0%), and Manufacturing (95.9%), whereas the industries that tend to have a higher number of women are Agriculture, Fishing & Hunting (100.0%), Enterprise Management (100.0%), and Educational Services (96.8%).
| Industry | Male | Female |
| Agriculture, Fishing & Hunting | 0 (0.0%) | 66 (100.0%) |
| Mining, Quarrying, & Extraction | 53 (100.0%) | 0 (0.0%) |
| Construction | 896 (81.0%) | 210 (19.0%) |
| Manufacturing | 1,808 (95.9%) | 78 (4.1%) |
| Wholesale Trade | 224 (59.7%) | 151 (40.3%) |
| Retail Trade | 845 (53.2%) | 743 (46.8%) |
| Transportation & Warehousing | 368 (77.1%) | 109 (22.9%) |
| Utilities | 162 (100.0%) | 0 (0.0%) |
| Information | 108 (72.5%) | 41 (27.5%) |
| Finance & Insurance | 72 (9.4%) | 696 (90.6%) |
| Real Estate, Rental & Leasing | 182 (73.1%) | 67 (26.9%) |
| Professional & Scientific | 455 (52.0%) | 420 (48.0%) |
| Enterprise Management | 0 (0.0%) | 16 (100.0%) |
| Administrative & Support | 285 (72.0%) | 111 (28.0%) |
| Educational Services | 37 (3.2%) | 1,114 (96.8%) |
| Health Care & Social Assistance | 264 (19.8%) | 1,072 (80.2%) |
| Arts, Entertainment & Recreation | 205 (76.8%) | 62 (23.2%) |
| Accommodation & Food Services | 161 (32.4%) | 336 (67.6%) |
| Public Administration | 689 (46.2%) | 804 (53.8%) |
| Total | 7,461 (54.0%) | 6,358 (46.0%) |
Education in Central
School Enrollment in Central
The most common levels of schooling among the 8,245 students in Central are elementary school (2,339 | 28.4%), high school (2,006 | 24.3%), and middle school (1,499 | 18.2%).
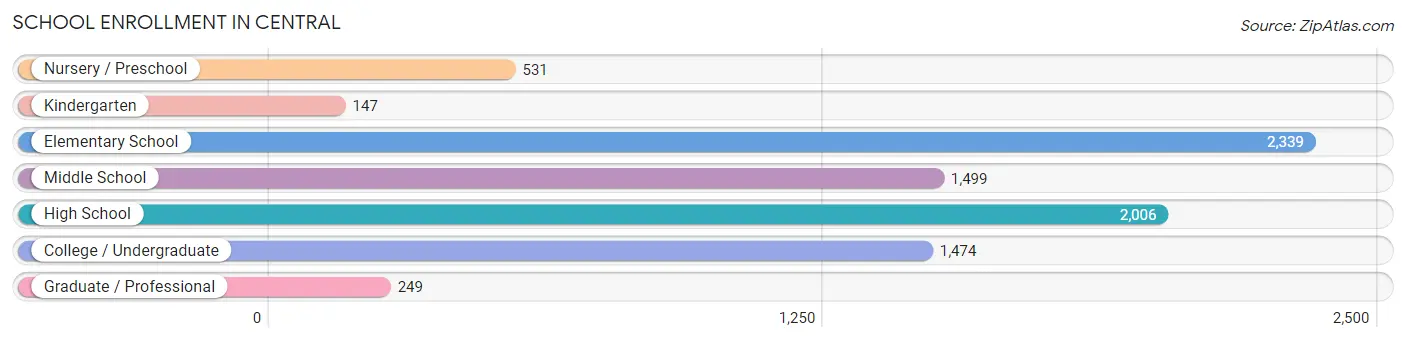
| School Level | # Students | % Students |
| Nursery / Preschool | 531 | 6.4% |
| Kindergarten | 147 | 1.8% |
| Elementary School | 2,339 | 28.4% |
| Middle School | 1,499 | 18.2% |
| High School | 2,006 | 24.3% |
| College / Undergraduate | 1,474 | 17.9% |
| Graduate / Professional | 249 | 3.0% |
| Total | 8,245 | 100.0% |
School Enrollment by Age by Funding Source in Central
Out of a total of 8,245 students who are enrolled in schools in Central, 1,896 (23.0%) attend a private institution, while the remaining 6,349 (77.0%) are enrolled in public schools. The age group of 3 to 4 year olds has the highest likelihood of being enrolled in private schools, with 254 (62.3% in the age bracket) enrolled. Conversely, the age group of 20 to 24 year olds has the lowest likelihood of being enrolled in a private school, with 857 (100.0% in the age bracket) attending a public institution.
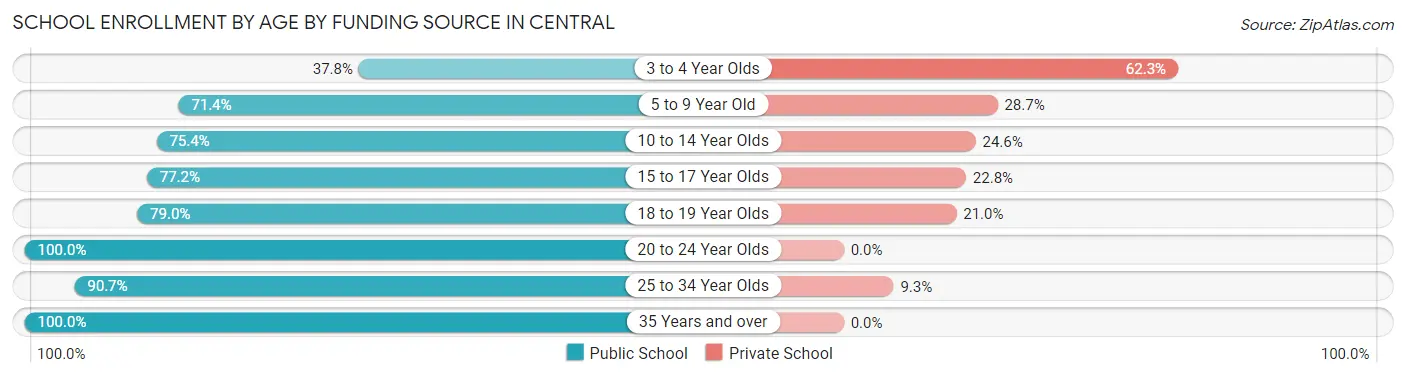
| Age Bracket | Public School | Private School |
| 3 to 4 Year Olds | 154 (37.8%) | 254 (62.3%) |
| 5 to 9 Year Old | 1,487 (71.4%) | 597 (28.6%) |
| 10 to 14 Year Olds | 1,702 (75.4%) | 554 (24.6%) |
| 15 to 17 Year Olds | 1,075 (77.2%) | 317 (22.8%) |
| 18 to 19 Year Olds | 520 (79.0%) | 138 (21.0%) |
| 20 to 24 Year Olds | 857 (100.0%) | 0 (0.0%) |
| 25 to 34 Year Olds | 352 (90.7%) | 36 (9.3%) |
| 35 Years and over | 202 (100.0%) | 0 (0.0%) |
| Total | 6,349 (77.0%) | 1,896 (23.0%) |
Educational Attainment by Field of Study in Central
Business (1,577 | 23.8%), education (1,420 | 21.4%), science & technology (618 | 9.3%), engineering (555 | 8.4%), and liberal arts & history (453 | 6.8%) are the most common fields of study among 6,631 individuals in Central who have obtained a bachelor's degree or higher.
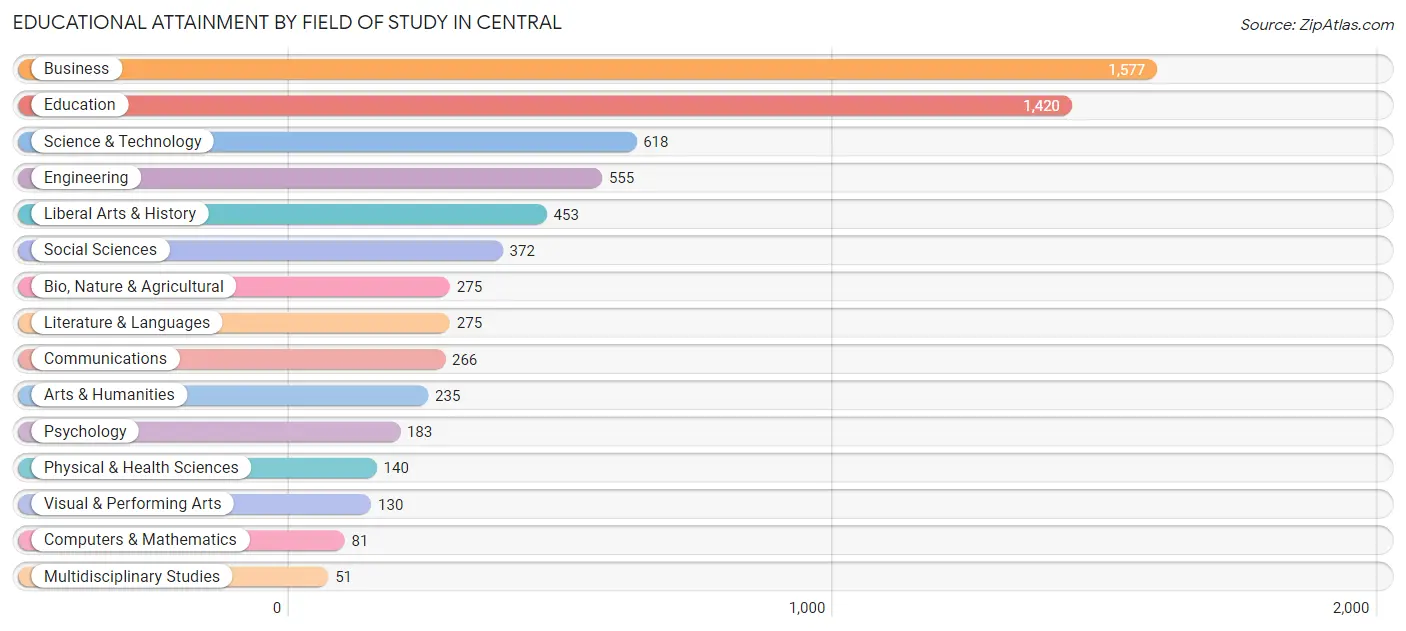
| Field of Study | # Graduates | % Graduates |
| Computers & Mathematics | 81 | 1.2% |
| Bio, Nature & Agricultural | 275 | 4.2% |
| Physical & Health Sciences | 140 | 2.1% |
| Psychology | 183 | 2.8% |
| Social Sciences | 372 | 5.6% |
| Engineering | 555 | 8.4% |
| Multidisciplinary Studies | 51 | 0.8% |
| Science & Technology | 618 | 9.3% |
| Business | 1,577 | 23.8% |
| Education | 1,420 | 21.4% |
| Literature & Languages | 275 | 4.2% |
| Liberal Arts & History | 453 | 6.8% |
| Visual & Performing Arts | 130 | 2.0% |
| Communications | 266 | 4.0% |
| Arts & Humanities | 235 | 3.5% |
| Total | 6,631 | 100.0% |
Transportation & Commute in Central
Vehicle Availability by Sex in Central
The most prevalent vehicle ownership categories in Central are males with 2 vehicles (3,571, accounting for 48.1%) and females with 2 vehicles (2,594, making up 57.8%).
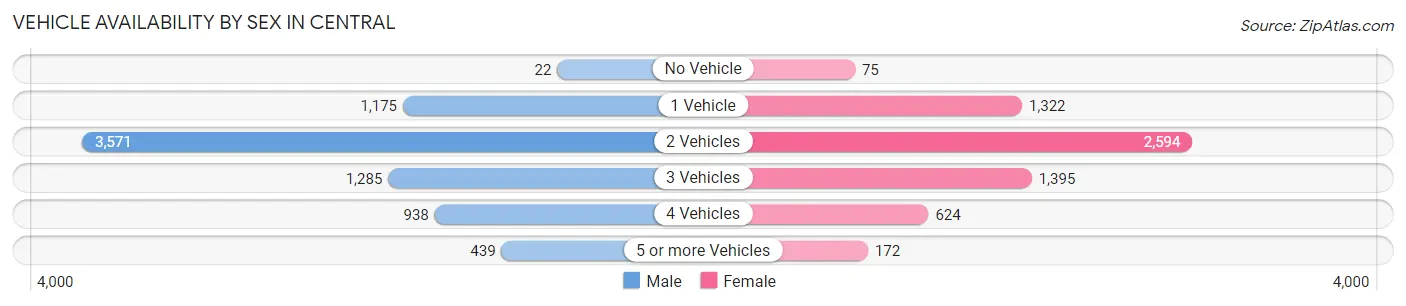
| Vehicles Available | Male | Female |
| No Vehicle | 22 (0.3%) | 75 (1.2%) |
| 1 Vehicle | 1,175 (15.8%) | 1,322 (21.4%) |
| 2 Vehicles | 3,571 (48.1%) | 2,594 (42.0%) |
| 3 Vehicles | 1,285 (17.3%) | 1,395 (22.6%) |
| 4 Vehicles | 938 (12.6%) | 624 (10.1%) |
| 5 or more Vehicles | 439 (5.9%) | 172 (2.8%) |
| Total | 7,430 (100.0%) | 6,182 (100.0%) |
Commute Time in Central
The most frequently occuring commute durations in Central are 30 to 34 minutes (3,292 commuters, 25.5%), 15 to 19 minutes (1,924 commuters, 14.9%), and 20 to 24 minutes (1,771 commuters, 13.7%).
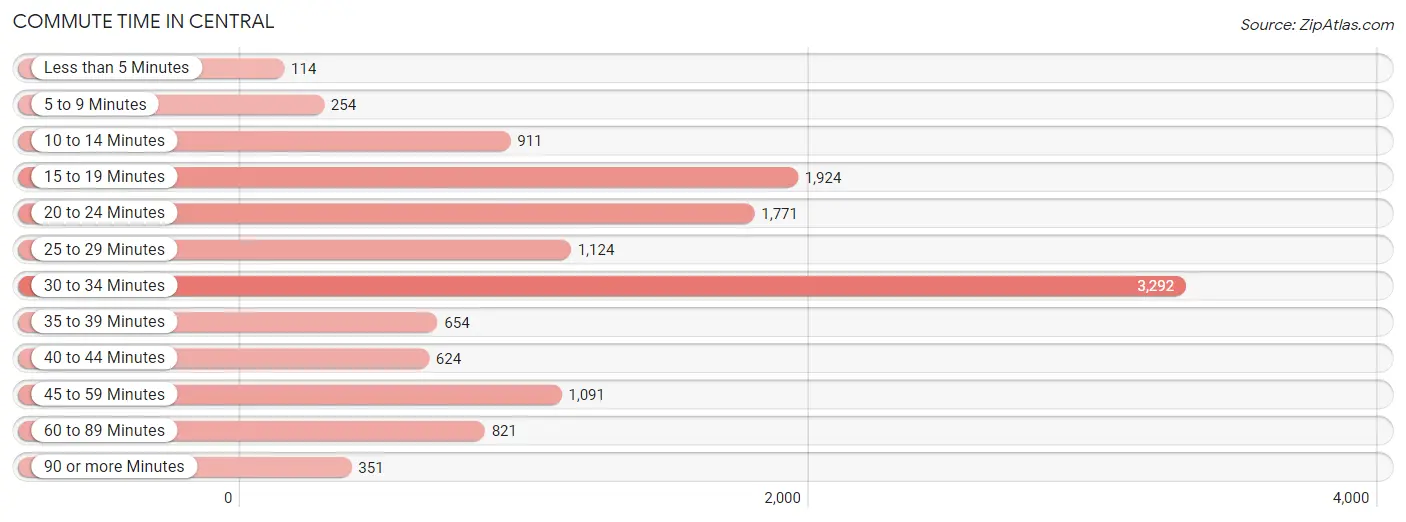
| Commute Time | # Commuters | % Commuters |
| Less than 5 Minutes | 114 | 0.9% |
| 5 to 9 Minutes | 254 | 2.0% |
| 10 to 14 Minutes | 911 | 7.0% |
| 15 to 19 Minutes | 1,924 | 14.9% |
| 20 to 24 Minutes | 1,771 | 13.7% |
| 25 to 29 Minutes | 1,124 | 8.7% |
| 30 to 34 Minutes | 3,292 | 25.5% |
| 35 to 39 Minutes | 654 | 5.1% |
| 40 to 44 Minutes | 624 | 4.8% |
| 45 to 59 Minutes | 1,091 | 8.4% |
| 60 to 89 Minutes | 821 | 6.4% |
| 90 or more Minutes | 351 | 2.7% |
Commute Time by Sex in Central
The most common commute times in Central are 30 to 34 minutes (1,662 commuters, 23.4%) for males and 30 to 34 minutes (1,630 commuters, 28.0%) for females.
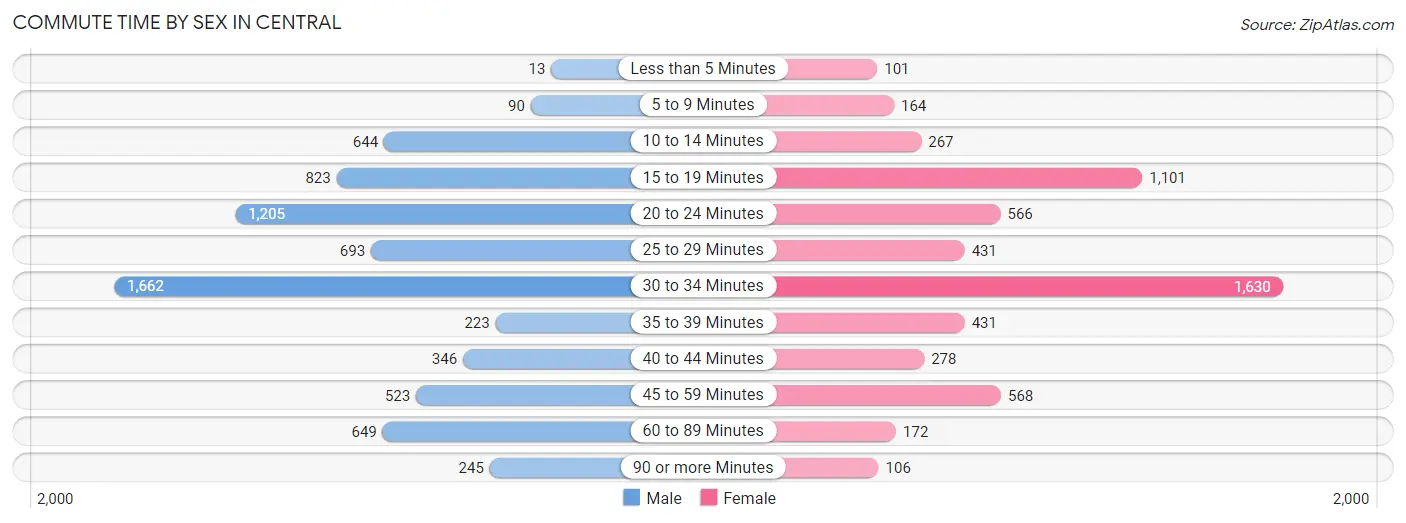
| Commute Time | Male | Female |
| Less than 5 Minutes | 13 (0.2%) | 101 (1.7%) |
| 5 to 9 Minutes | 90 (1.3%) | 164 (2.8%) |
| 10 to 14 Minutes | 644 (9.0%) | 267 (4.6%) |
| 15 to 19 Minutes | 823 (11.6%) | 1,101 (18.9%) |
| 20 to 24 Minutes | 1,205 (16.9%) | 566 (9.7%) |
| 25 to 29 Minutes | 693 (9.7%) | 431 (7.4%) |
| 30 to 34 Minutes | 1,662 (23.4%) | 1,630 (28.0%) |
| 35 to 39 Minutes | 223 (3.1%) | 431 (7.4%) |
| 40 to 44 Minutes | 346 (4.9%) | 278 (4.8%) |
| 45 to 59 Minutes | 523 (7.3%) | 568 (9.8%) |
| 60 to 89 Minutes | 649 (9.1%) | 172 (3.0%) |
| 90 or more Minutes | 245 (3.4%) | 106 (1.8%) |
Time of Departure to Work by Sex in Central
The most frequent times of departure to work in Central are 12:00 AM to 4:59 AM (1,514, 21.3%) for males and 7:00 AM to 7:29 AM (1,423, 24.5%) for females.
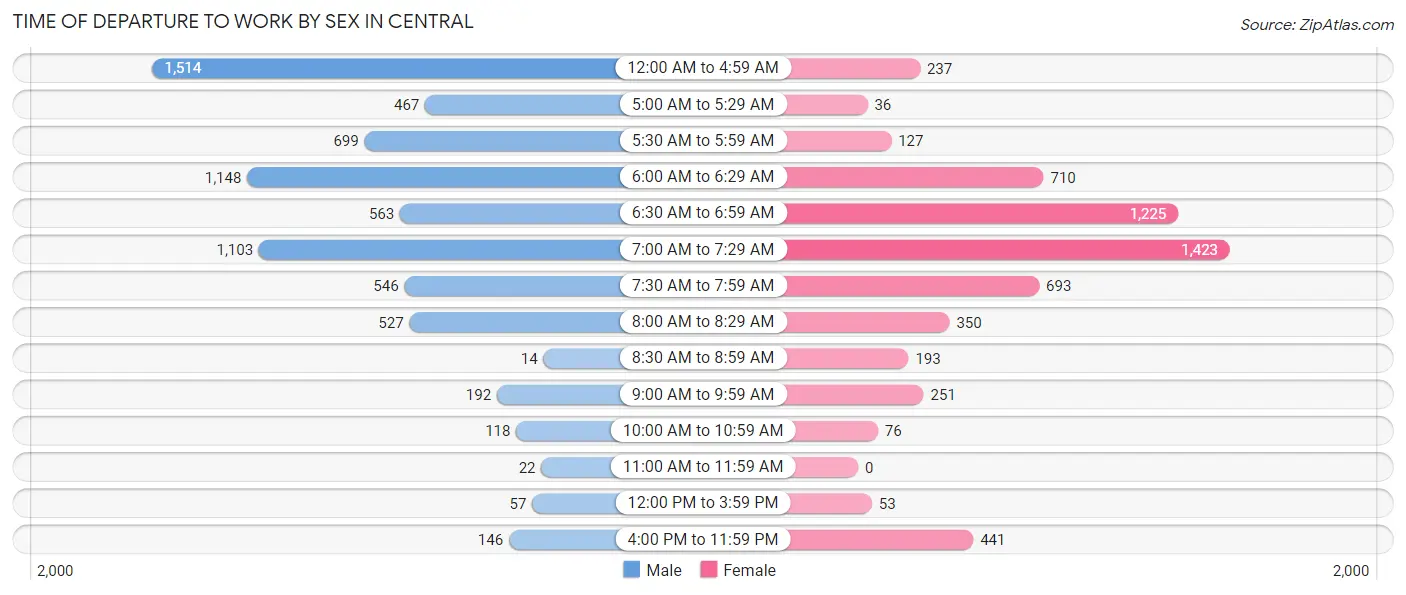
| Time of Departure | Male | Female |
| 12:00 AM to 4:59 AM | 1,514 (21.3%) | 237 (4.1%) |
| 5:00 AM to 5:29 AM | 467 (6.6%) | 36 (0.6%) |
| 5:30 AM to 5:59 AM | 699 (9.8%) | 127 (2.2%) |
| 6:00 AM to 6:29 AM | 1,148 (16.1%) | 710 (12.2%) |
| 6:30 AM to 6:59 AM | 563 (7.9%) | 1,225 (21.1%) |
| 7:00 AM to 7:29 AM | 1,103 (15.5%) | 1,423 (24.5%) |
| 7:30 AM to 7:59 AM | 546 (7.7%) | 693 (11.9%) |
| 8:00 AM to 8:29 AM | 527 (7.4%) | 350 (6.0%) |
| 8:30 AM to 8:59 AM | 14 (0.2%) | 193 (3.3%) |
| 9:00 AM to 9:59 AM | 192 (2.7%) | 251 (4.3%) |
| 10:00 AM to 10:59 AM | 118 (1.7%) | 76 (1.3%) |
| 11:00 AM to 11:59 AM | 22 (0.3%) | 0 (0.0%) |
| 12:00 PM to 3:59 PM | 57 (0.8%) | 53 (0.9%) |
| 4:00 PM to 11:59 PM | 146 (2.1%) | 441 (7.6%) |
| Total | 7,116 (100.0%) | 5,815 (100.0%) |
Housing Occupancy in Central
Occupancy by Ownership in Central
Of the total 11,035 dwellings in Central, owner-occupied units account for 9,894 (89.7%), while renter-occupied units make up 1,141 (10.3%).
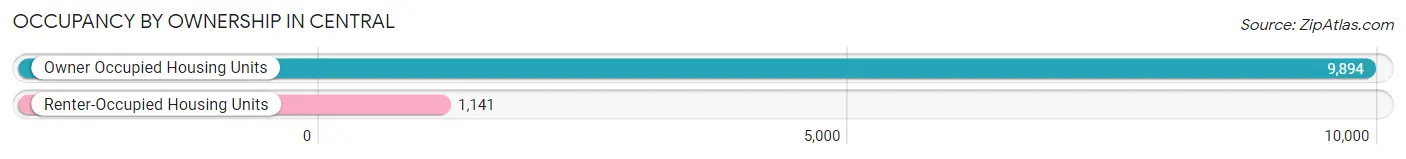
| Occupancy | # Housing Units | % Housing Units |
| Owner Occupied Housing Units | 9,894 | 89.7% |
| Renter-Occupied Housing Units | 1,141 | 10.3% |
| Total Occupied Housing Units | 11,035 | 100.0% |
Occupancy by Household Size in Central
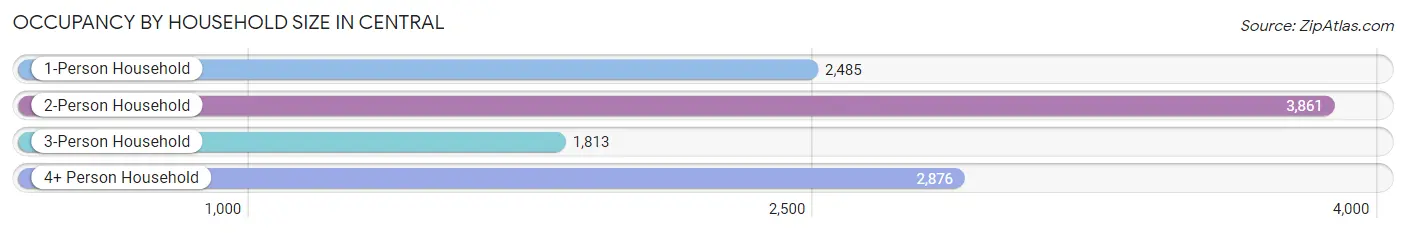
| Household Size | # Housing Units | % Housing Units |
| 1-Person Household | 2,485 | 22.5% |
| 2-Person Household | 3,861 | 35.0% |
| 3-Person Household | 1,813 | 16.4% |
| 4+ Person Household | 2,876 | 26.1% |
| Total Housing Units | 11,035 | 100.0% |
Occupancy by Ownership by Household Size in Central
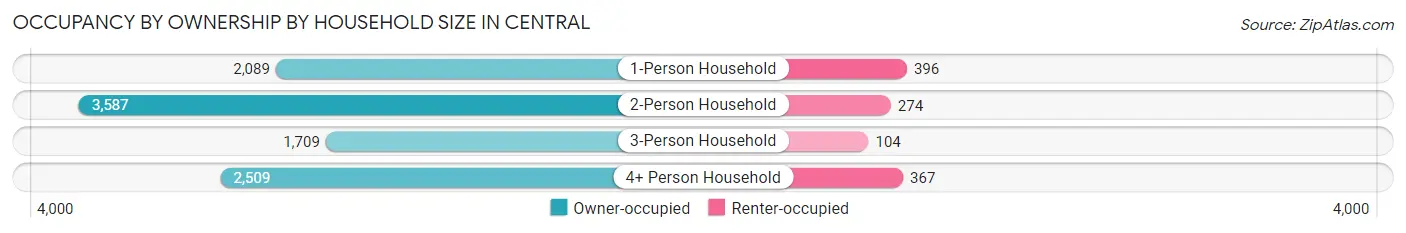
| Household Size | Owner-occupied | Renter-occupied |
| 1-Person Household | 2,089 (84.1%) | 396 (15.9%) |
| 2-Person Household | 3,587 (92.9%) | 274 (7.1%) |
| 3-Person Household | 1,709 (94.3%) | 104 (5.7%) |
| 4+ Person Household | 2,509 (87.2%) | 367 (12.8%) |
| Total Housing Units | 9,894 (89.7%) | 1,141 (10.3%) |
Occupancy by Educational Attainment in Central
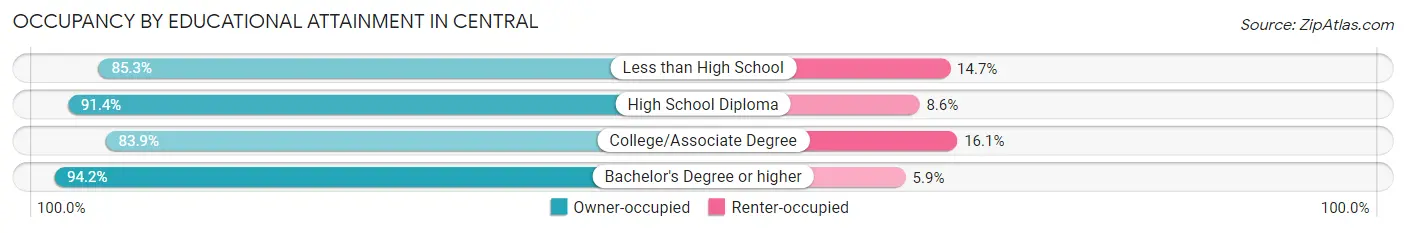
| Household Size | Owner-occupied | Renter-occupied |
| Less than High School | 384 (85.3%) | 66 (14.7%) |
| High School Diploma | 3,204 (91.4%) | 301 (8.6%) |
| College/Associate Degree | 2,957 (83.9%) | 566 (16.1%) |
| Bachelor's Degree or higher | 3,349 (94.2%) | 208 (5.9%) |
Occupancy by Age of Householder in Central
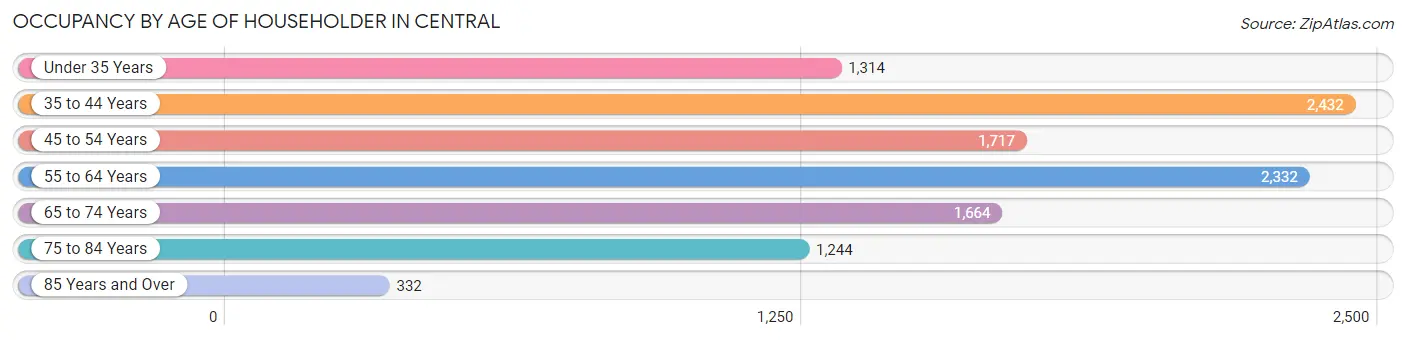
| Age Bracket | # Households | % Households |
| Under 35 Years | 1,314 | 11.9% |
| 35 to 44 Years | 2,432 | 22.0% |
| 45 to 54 Years | 1,717 | 15.6% |
| 55 to 64 Years | 2,332 | 21.1% |
| 65 to 74 Years | 1,664 | 15.1% |
| 75 to 84 Years | 1,244 | 11.3% |
| 85 Years and Over | 332 | 3.0% |
| Total | 11,035 | 100.0% |
Housing Finances in Central
Median Income by Occupancy in Central
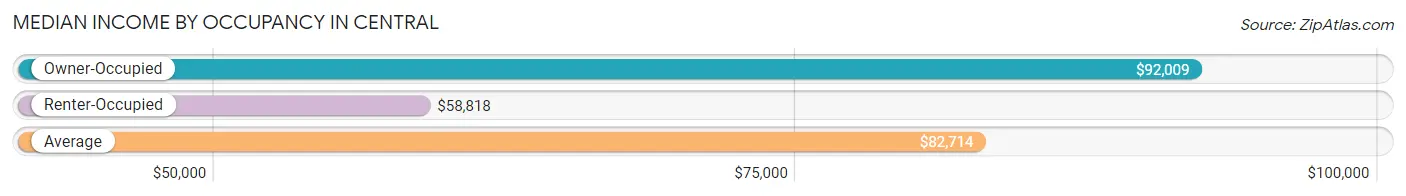
| Occupancy Type | # Households | Median Income |
| Owner-Occupied | 9,894 (89.7%) | $92,009 |
| Renter-Occupied | 1,141 (10.3%) | $58,818 |
| Average | 11,035 (100.0%) | $82,714 |
Occupancy by Householder Income Bracket in Central
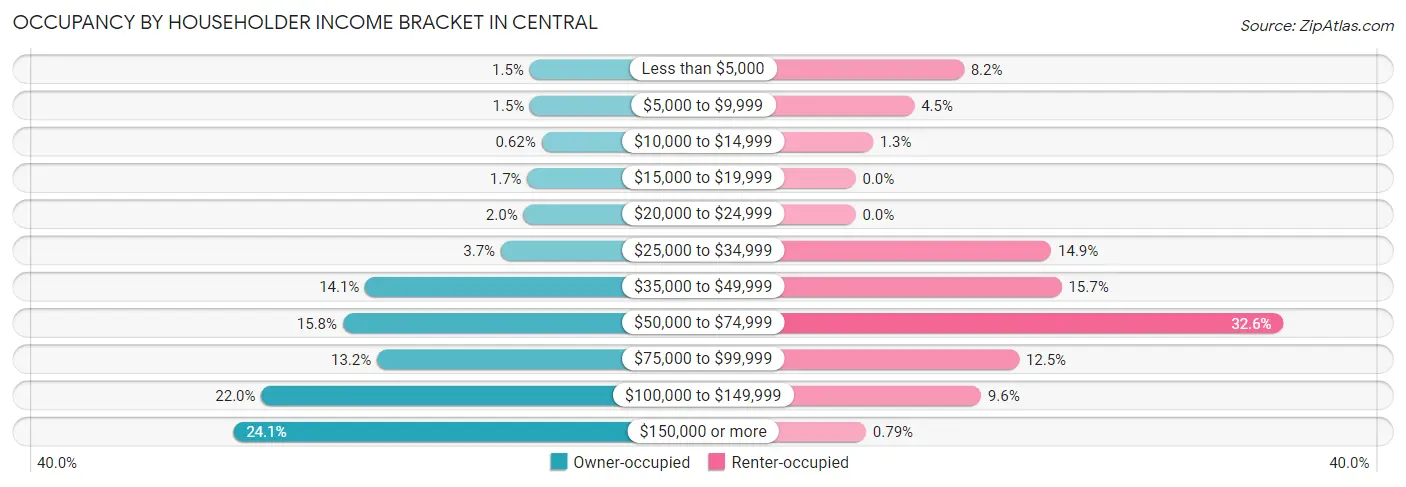
| Income Bracket | Owner-occupied | Renter-occupied |
| Less than $5,000 | 150 (1.5%) | 94 (8.2%) |
| $5,000 to $9,999 | 146 (1.5%) | 51 (4.5%) |
| $10,000 to $14,999 | 61 (0.6%) | 15 (1.3%) |
| $15,000 to $19,999 | 167 (1.7%) | 0 (0.0%) |
| $20,000 to $24,999 | 197 (2.0%) | 0 (0.0%) |
| $25,000 to $34,999 | 367 (3.7%) | 170 (14.9%) |
| $35,000 to $49,999 | 1,390 (14.1%) | 179 (15.7%) |
| $50,000 to $74,999 | 1,558 (15.8%) | 372 (32.6%) |
| $75,000 to $99,999 | 1,301 (13.2%) | 142 (12.4%) |
| $100,000 to $149,999 | 2,173 (22.0%) | 109 (9.6%) |
| $150,000 or more | 2,384 (24.1%) | 9 (0.8%) |
| Total | 9,894 (100.0%) | 1,141 (100.0%) |
Monthly Housing Cost Tiers in Central
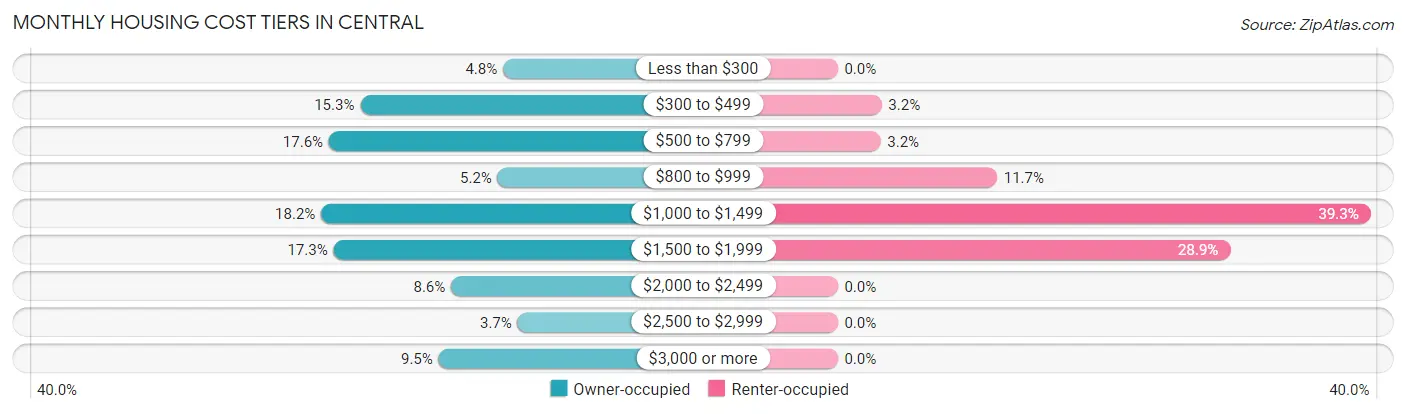
| Monthly Cost | Owner-occupied | Renter-occupied |
| Less than $300 | 471 (4.8%) | 0 (0.0%) |
| $300 to $499 | 1,512 (15.3%) | 37 (3.2%) |
| $500 to $799 | 1,740 (17.6%) | 36 (3.2%) |
| $800 to $999 | 511 (5.2%) | 134 (11.7%) |
| $1,000 to $1,499 | 1,797 (18.2%) | 448 (39.3%) |
| $1,500 to $1,999 | 1,707 (17.2%) | 330 (28.9%) |
| $2,000 to $2,499 | 850 (8.6%) | 0 (0.0%) |
| $2,500 to $2,999 | 365 (3.7%) | 0 (0.0%) |
| $3,000 or more | 941 (9.5%) | 0 (0.0%) |
| Total | 9,894 (100.0%) | 1,141 (100.0%) |
Physical Housing Characteristics in Central
Housing Structures in Central
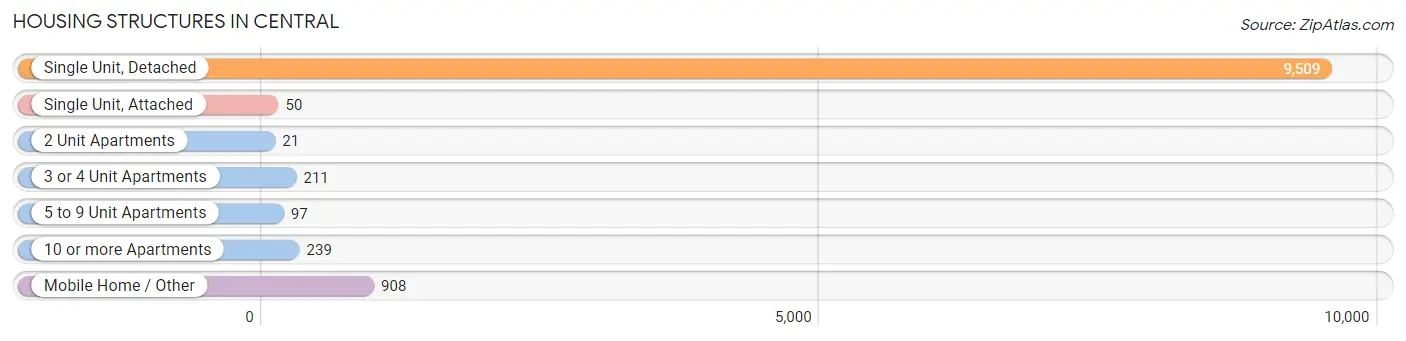
| Structure Type | # Housing Units | % Housing Units |
| Single Unit, Detached | 9,509 | 86.2% |
| Single Unit, Attached | 50 | 0.4% |
| 2 Unit Apartments | 21 | 0.2% |
| 3 or 4 Unit Apartments | 211 | 1.9% |
| 5 to 9 Unit Apartments | 97 | 0.9% |
| 10 or more Apartments | 239 | 2.2% |
| Mobile Home / Other | 908 | 8.2% |
| Total | 11,035 | 100.0% |
Housing Structures by Occupancy in Central
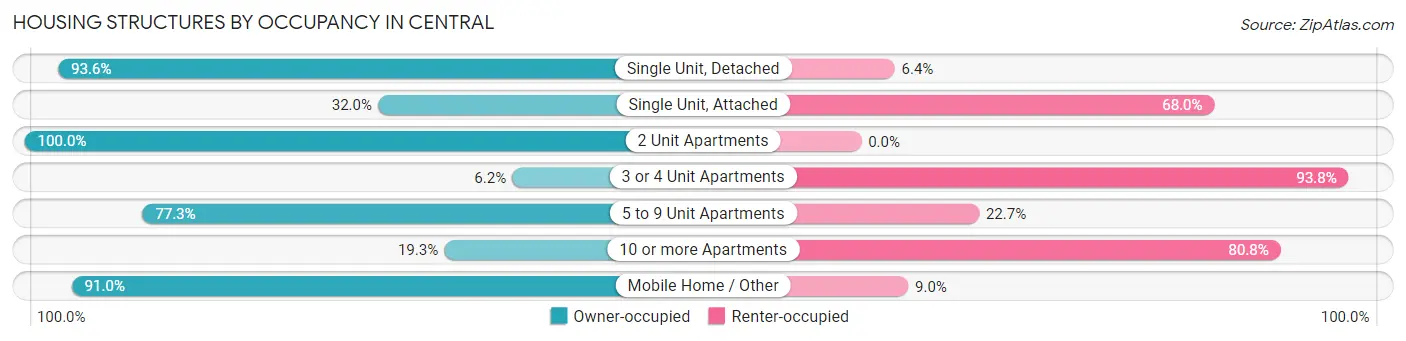
| Structure Type | Owner-occupied | Renter-occupied |
| Single Unit, Detached | 8,897 (93.6%) | 612 (6.4%) |
| Single Unit, Attached | 16 (32.0%) | 34 (68.0%) |
| 2 Unit Apartments | 21 (100.0%) | 0 (0.0%) |
| 3 or 4 Unit Apartments | 13 (6.2%) | 198 (93.8%) |
| 5 to 9 Unit Apartments | 75 (77.3%) | 22 (22.7%) |
| 10 or more Apartments | 46 (19.3%) | 193 (80.7%) |
| Mobile Home / Other | 826 (91.0%) | 82 (9.0%) |
| Total | 9,894 (89.7%) | 1,141 (10.3%) |
Housing Structures by Number of Rooms in Central
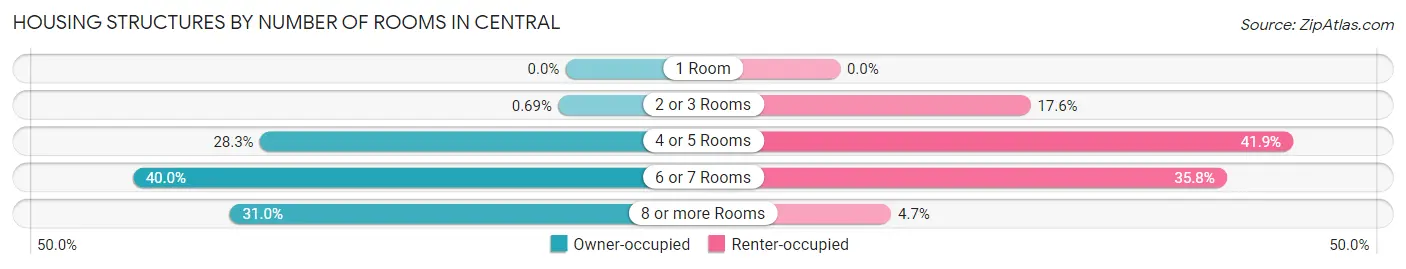
| Number of Rooms | Owner-occupied | Renter-occupied |
| 1 Room | 0 (0.0%) | 0 (0.0%) |
| 2 or 3 Rooms | 68 (0.7%) | 201 (17.6%) |
| 4 or 5 Rooms | 2,798 (28.3%) | 478 (41.9%) |
| 6 or 7 Rooms | 3,958 (40.0%) | 408 (35.8%) |
| 8 or more Rooms | 3,070 (31.0%) | 54 (4.7%) |
| Total | 9,894 (100.0%) | 1,141 (100.0%) |
Housing Structure by Heating Type in Central
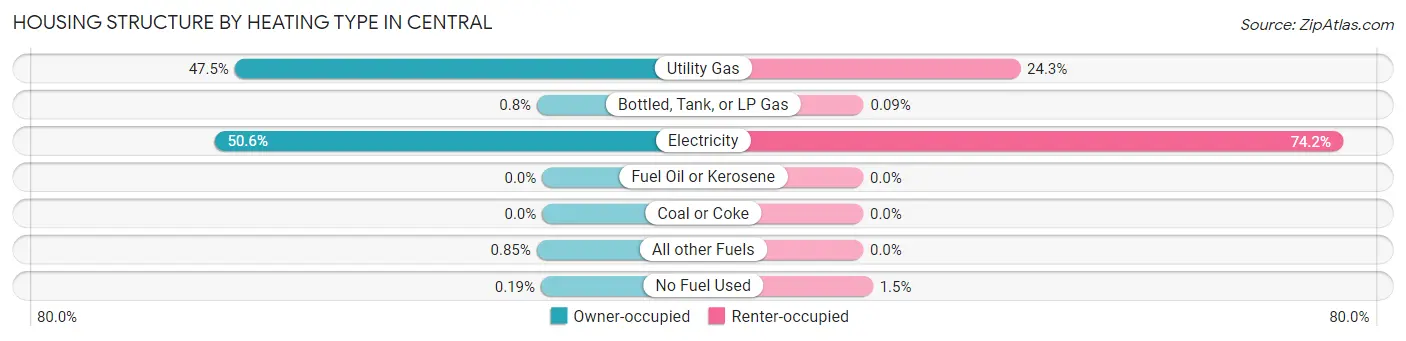
| Heating Type | Owner-occupied | Renter-occupied |
| Utility Gas | 4,702 (47.5%) | 277 (24.3%) |
| Bottled, Tank, or LP Gas | 79 (0.8%) | 1 (0.1%) |
| Electricity | 5,010 (50.6%) | 846 (74.2%) |
| Fuel Oil or Kerosene | 0 (0.0%) | 0 (0.0%) |
| Coal or Coke | 0 (0.0%) | 0 (0.0%) |
| All other Fuels | 84 (0.9%) | 0 (0.0%) |
| No Fuel Used | 19 (0.2%) | 17 (1.5%) |
| Total | 9,894 (100.0%) | 1,141 (100.0%) |
Household Vehicle Usage in Central
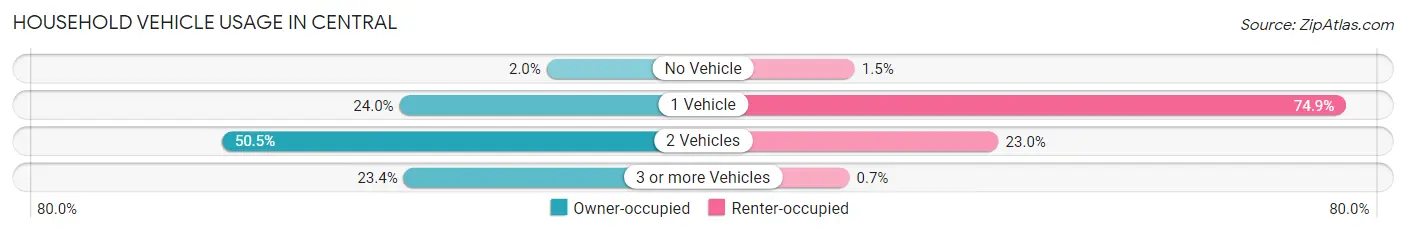
| Vehicles per Household | Owner-occupied | Renter-occupied |
| No Vehicle | 201 (2.0%) | 17 (1.5%) |
| 1 Vehicle | 2,377 (24.0%) | 854 (74.9%) |
| 2 Vehicles | 5,000 (50.5%) | 262 (23.0%) |
| 3 or more Vehicles | 2,316 (23.4%) | 8 (0.7%) |
| Total | 9,894 (100.0%) | 1,141 (100.0%) |
Real Estate & Mortgages in Central
Real Estate and Mortgage Overview in Central
| Characteristic | Without Mortgage | With Mortgage |
| Housing Units | 3,800 | 6,094 |
| Median Property Value | $235,900 | $279,700 |
| Median Household Income | $78,889 | $1,630 |
| Monthly Housing Costs | $494 | $941 |
| Real Estate Taxes | $1,312 | $610 |
Property Value by Mortgage Status in Central
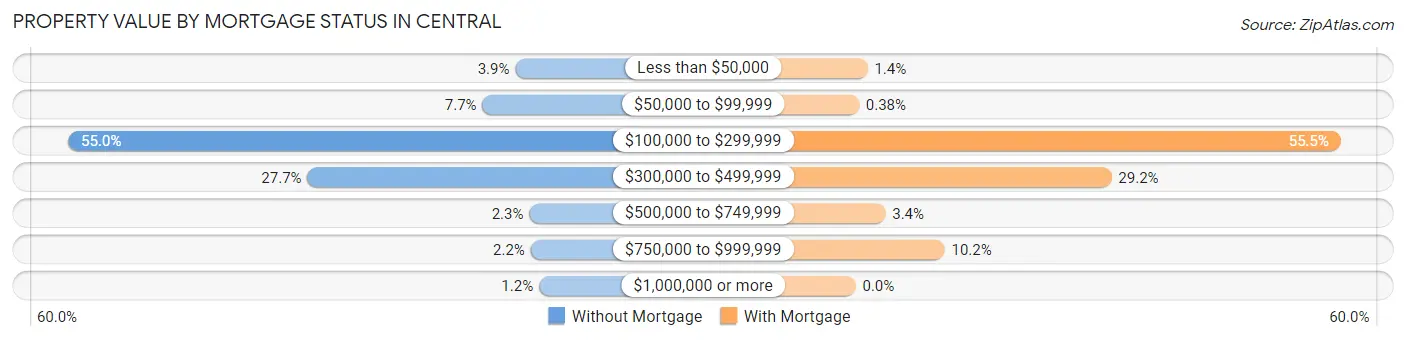
| Property Value | Without Mortgage | With Mortgage |
| Less than $50,000 | 149 (3.9%) | 83 (1.4%) |
| $50,000 to $99,999 | 292 (7.7%) | 23 (0.4%) |
| $100,000 to $299,999 | 2,091 (55.0%) | 3,379 (55.4%) |
| $300,000 to $499,999 | 1,052 (27.7%) | 1,782 (29.2%) |
| $500,000 to $749,999 | 88 (2.3%) | 207 (3.4%) |
| $750,000 to $999,999 | 82 (2.2%) | 620 (10.2%) |
| $1,000,000 or more | 46 (1.2%) | 0 (0.0%) |
| Total | 3,800 (100.0%) | 6,094 (100.0%) |
Household Income by Mortgage Status in Central
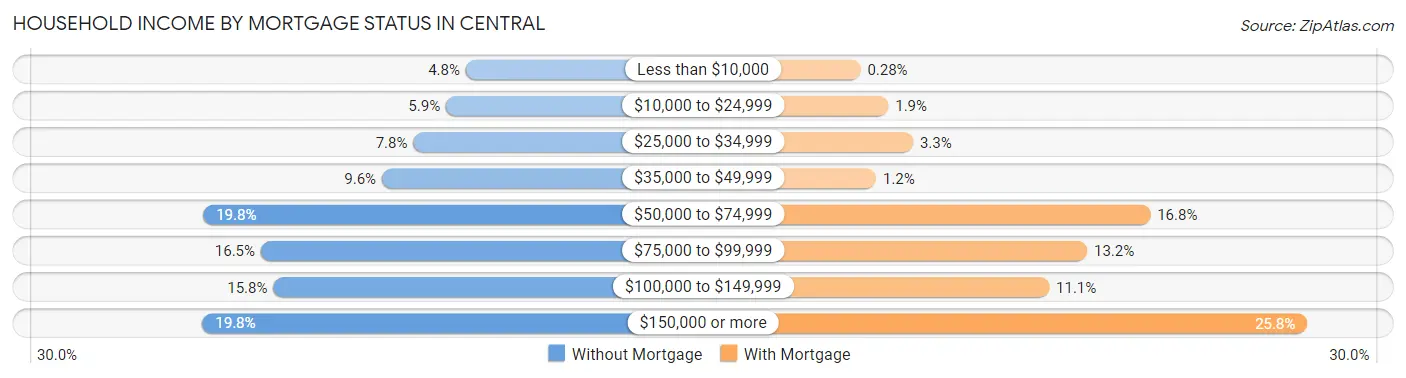
| Household Income | Without Mortgage | With Mortgage |
| Less than $10,000 | 182 (4.8%) | 17 (0.3%) |
| $10,000 to $24,999 | 225 (5.9%) | 114 (1.9%) |
| $25,000 to $34,999 | 296 (7.8%) | 200 (3.3%) |
| $35,000 to $49,999 | 364 (9.6%) | 71 (1.2%) |
| $50,000 to $74,999 | 752 (19.8%) | 1,026 (16.8%) |
| $75,000 to $99,999 | 627 (16.5%) | 806 (13.2%) |
| $100,000 to $149,999 | 600 (15.8%) | 674 (11.1%) |
| $150,000 or more | 754 (19.8%) | 1,573 (25.8%) |
| Total | 3,800 (100.0%) | 6,094 (100.0%) |
Property Value to Household Income Ratio in Central
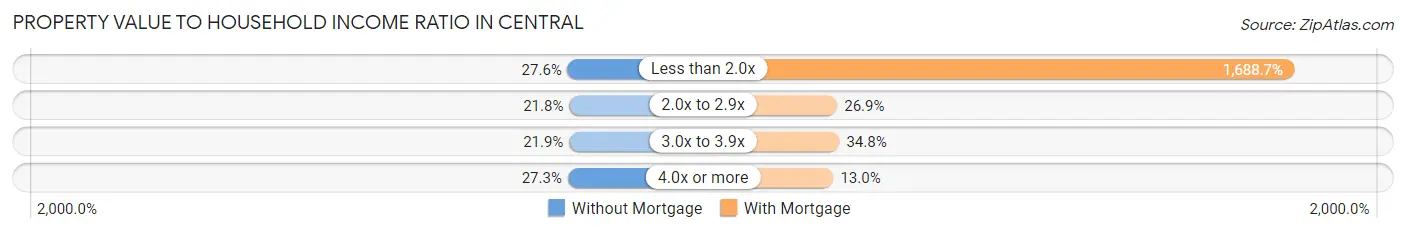
| Value-to-Income Ratio | Without Mortgage | With Mortgage |
| Less than 2.0x | 1,048 (27.6%) | 102,908 (1,688.7%) |
| 2.0x to 2.9x | 829 (21.8%) | 1,642 (26.9%) |
| 3.0x to 3.9x | 831 (21.9%) | 2,119 (34.8%) |
| 4.0x or more | 1,036 (27.3%) | 793 (13.0%) |
| Total | 3,800 (100.0%) | 6,094 (100.0%) |
Real Estate Taxes by Mortgage Status in Central
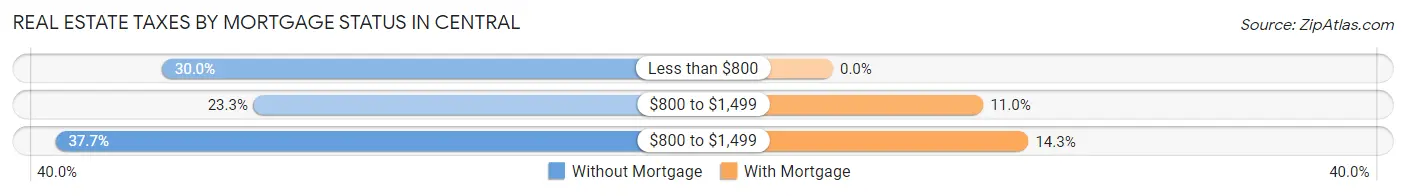
| Property Taxes | Without Mortgage | With Mortgage |
| Less than $800 | 1,139 (30.0%) | 0 (0.0%) |
| $800 to $1,499 | 884 (23.3%) | 670 (11.0%) |
| $800 to $1,499 | 1,434 (37.7%) | 870 (14.3%) |
| Total | 3,800 (100.0%) | 6,094 (100.0%) |
Health & Disability in Central
Health Insurance Coverage by Age in Central
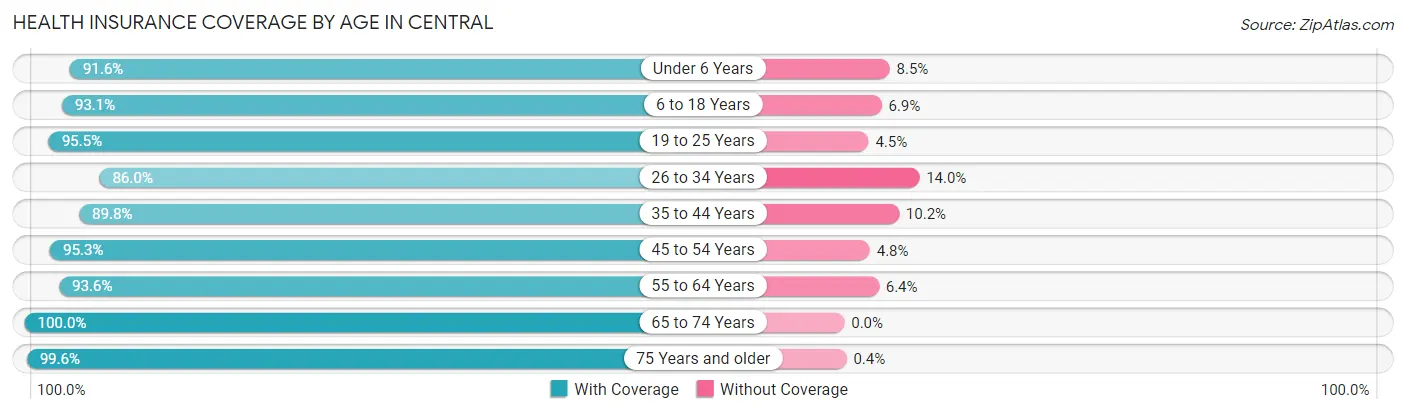
| Age Bracket | With Coverage | Without Coverage |
| Under 6 Years | 1,842 (91.5%) | 170 (8.5%) |
| 6 to 18 Years | 5,550 (93.1%) | 414 (6.9%) |
| 19 to 25 Years | 2,287 (95.5%) | 108 (4.5%) |
| 26 to 34 Years | 2,069 (86.0%) | 336 (14.0%) |
| 35 to 44 Years | 3,679 (89.8%) | 417 (10.2%) |
| 45 to 54 Years | 2,829 (95.3%) | 141 (4.8%) |
| 55 to 64 Years | 4,091 (93.6%) | 281 (6.4%) |
| 65 to 74 Years | 3,062 (100.0%) | 0 (0.0%) |
| 75 Years and older | 2,226 (99.6%) | 9 (0.4%) |
| Total | 27,635 (93.6%) | 1,876 (6.4%) |
Health Insurance Coverage by Citizenship Status in Central
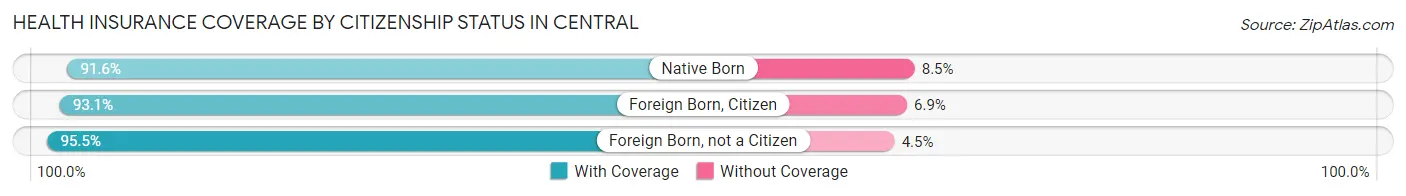
| Citizenship Status | With Coverage | Without Coverage |
| Native Born | 1,842 (91.5%) | 170 (8.5%) |
| Foreign Born, Citizen | 5,550 (93.1%) | 414 (6.9%) |
| Foreign Born, not a Citizen | 2,287 (95.5%) | 108 (4.5%) |
Health Insurance Coverage by Household Income in Central
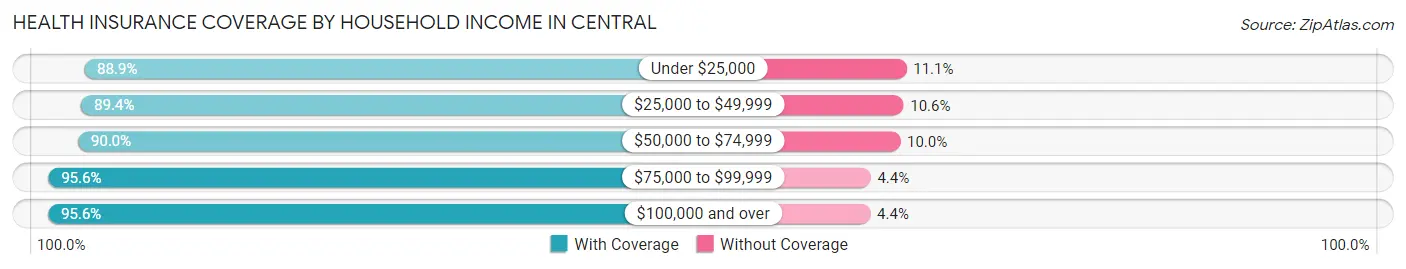
| Household Income | With Coverage | Without Coverage |
| Under $25,000 | 1,173 (88.9%) | 147 (11.1%) |
| $25,000 to $49,999 | 3,609 (89.4%) | 427 (10.6%) |
| $50,000 to $74,999 | 3,889 (90.0%) | 431 (10.0%) |
| $75,000 to $99,999 | 3,798 (95.6%) | 176 (4.4%) |
| $100,000 and over | 15,140 (95.6%) | 693 (4.4%) |
Public vs Private Health Insurance Coverage by Age in Central
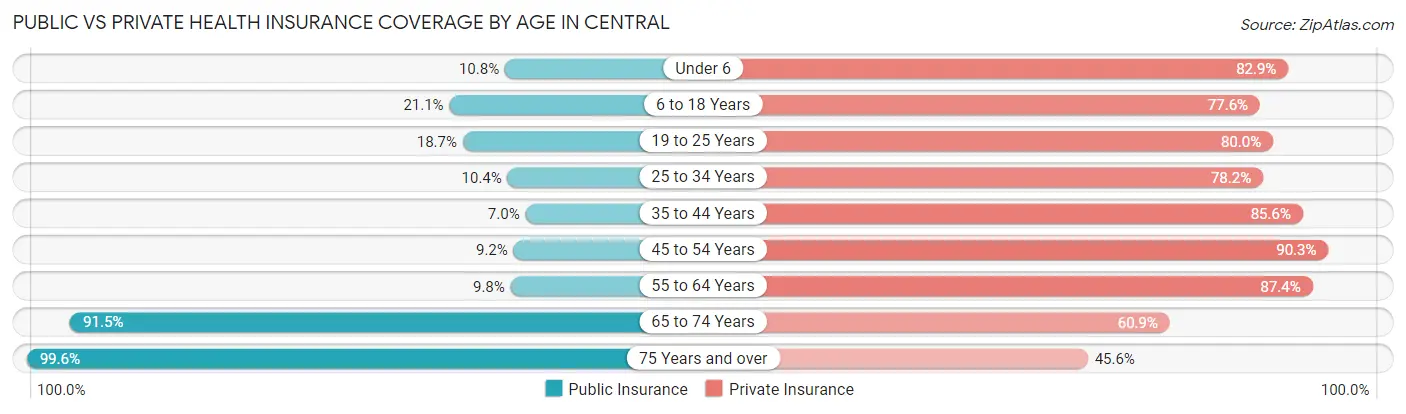
| Age Bracket | Public Insurance | Private Insurance |
| Under 6 | 218 (10.8%) | 1,667 (82.9%) |
| 6 to 18 Years | 1,261 (21.1%) | 4,628 (77.6%) |
| 19 to 25 Years | 447 (18.7%) | 1,917 (80.0%) |
| 25 to 34 Years | 249 (10.3%) | 1,880 (78.2%) |
| 35 to 44 Years | 288 (7.0%) | 3,504 (85.6%) |
| 45 to 54 Years | 274 (9.2%) | 2,682 (90.3%) |
| 55 to 64 Years | 428 (9.8%) | 3,820 (87.4%) |
| 65 to 74 Years | 2,803 (91.5%) | 1,864 (60.9%) |
| 75 Years and over | 2,226 (99.6%) | 1,020 (45.6%) |
| Total | 8,194 (27.8%) | 22,982 (77.9%) |
Disability Status by Sex by Age in Central
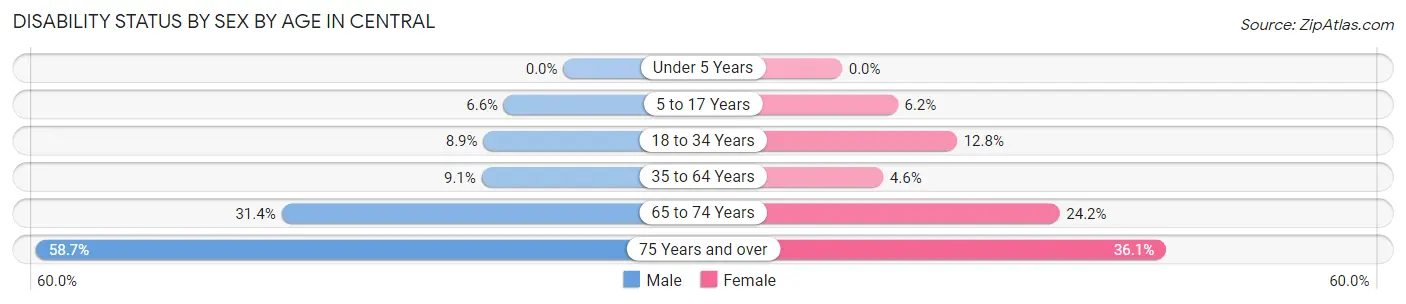
| Age Bracket | Male | Female |
| Under 5 Years | 0 (0.0%) | 0 (0.0%) |
| 5 to 17 Years | 180 (6.6%) | 190 (6.2%) |
| 18 to 34 Years | 260 (8.9%) | 294 (12.8%) |
| 35 to 64 Years | 519 (9.1%) | 263 (4.6%) |
| 65 to 74 Years | 474 (31.4%) | 376 (24.2%) |
| 75 Years and over | 400 (58.7%) | 561 (36.1%) |
Disability Class by Sex by Age in Central
Disability Class: Hearing Difficulty
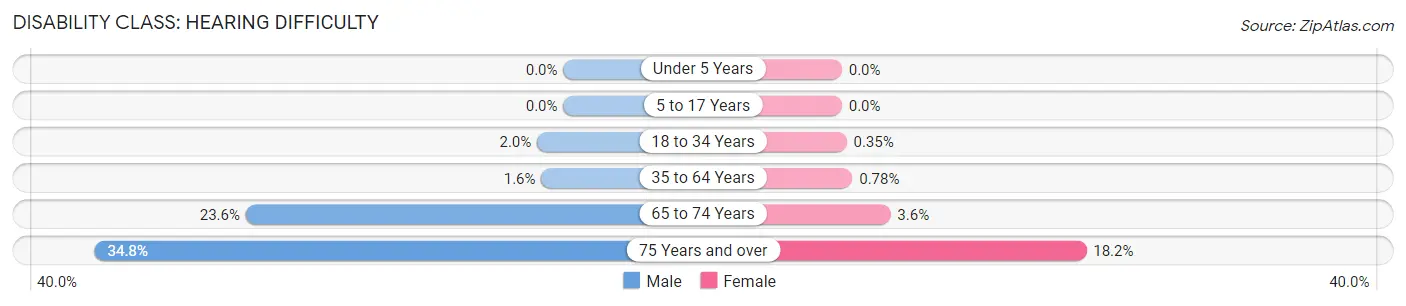
| Age Bracket | Male | Female |
| Under 5 Years | 0 (0.0%) | 0 (0.0%) |
| 5 to 17 Years | 0 (0.0%) | 0 (0.0%) |
| 18 to 34 Years | 57 (1.9%) | 8 (0.4%) |
| 35 to 64 Years | 93 (1.6%) | 45 (0.8%) |
| 65 to 74 Years | 356 (23.6%) | 56 (3.6%) |
| 75 Years and over | 237 (34.8%) | 282 (18.1%) |
Disability Class: Vision Difficulty
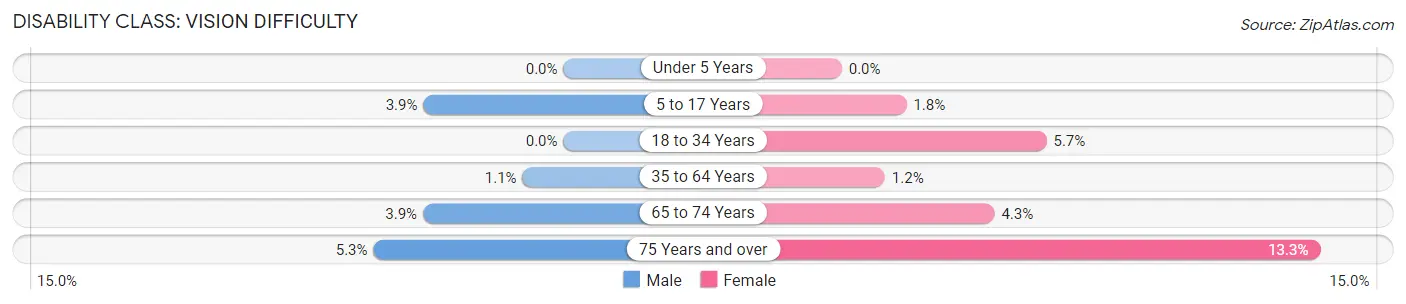
| Age Bracket | Male | Female |
| Under 5 Years | 0 (0.0%) | 0 (0.0%) |
| 5 to 17 Years | 106 (3.9%) | 55 (1.8%) |
| 18 to 34 Years | 0 (0.0%) | 131 (5.7%) |
| 35 to 64 Years | 65 (1.1%) | 69 (1.2%) |
| 65 to 74 Years | 59 (3.9%) | 66 (4.3%) |
| 75 Years and over | 36 (5.3%) | 207 (13.3%) |
Disability Class: Cognitive Difficulty
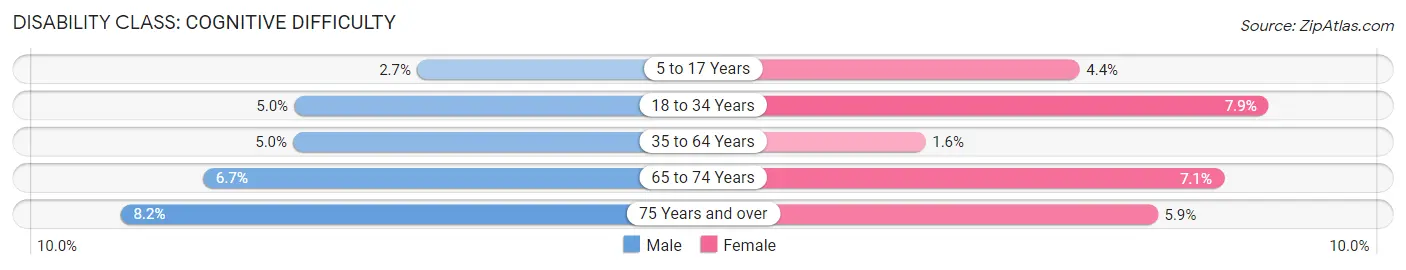
| Age Bracket | Male | Female |
| 5 to 17 Years | 74 (2.7%) | 135 (4.4%) |
| 18 to 34 Years | 146 (5.0%) | 182 (7.9%) |
| 35 to 64 Years | 286 (5.0%) | 89 (1.5%) |
| 65 to 74 Years | 101 (6.7%) | 110 (7.1%) |
| 75 Years and over | 56 (8.2%) | 91 (5.9%) |
Disability Class: Ambulatory Difficulty
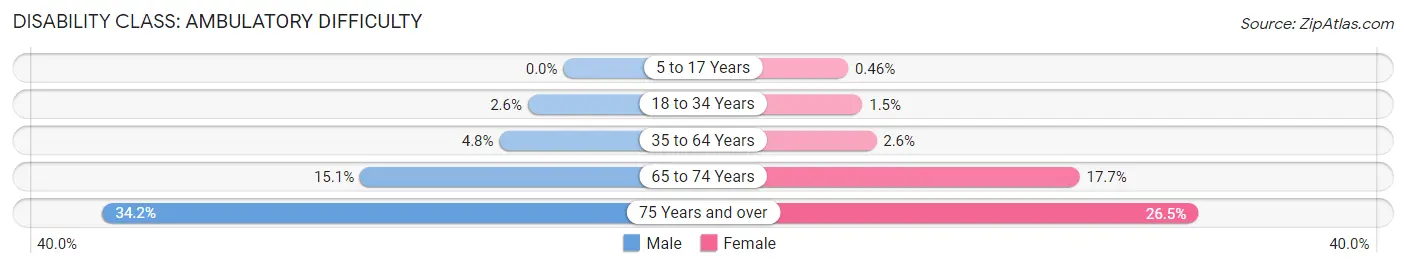
| Age Bracket | Male | Female |
| 5 to 17 Years | 0 (0.0%) | 14 (0.5%) |
| 18 to 34 Years | 77 (2.6%) | 35 (1.5%) |
| 35 to 64 Years | 271 (4.8%) | 147 (2.6%) |
| 65 to 74 Years | 228 (15.1%) | 274 (17.6%) |
| 75 Years and over | 233 (34.2%) | 411 (26.5%) |
Disability Class: Self-Care Difficulty
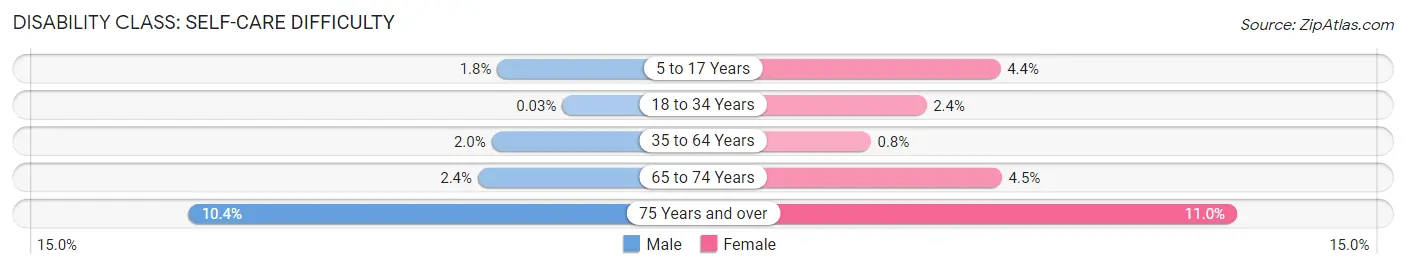
| Age Bracket | Male | Female |
| 5 to 17 Years | 50 (1.8%) | 135 (4.4%) |
| 18 to 34 Years | 1 (0.0%) | 54 (2.4%) |
| 35 to 64 Years | 114 (2.0%) | 46 (0.8%) |
| 65 to 74 Years | 36 (2.4%) | 69 (4.4%) |
| 75 Years and over | 71 (10.4%) | 171 (11.0%) |
Technology Access in Central
Computing Device Access in Central
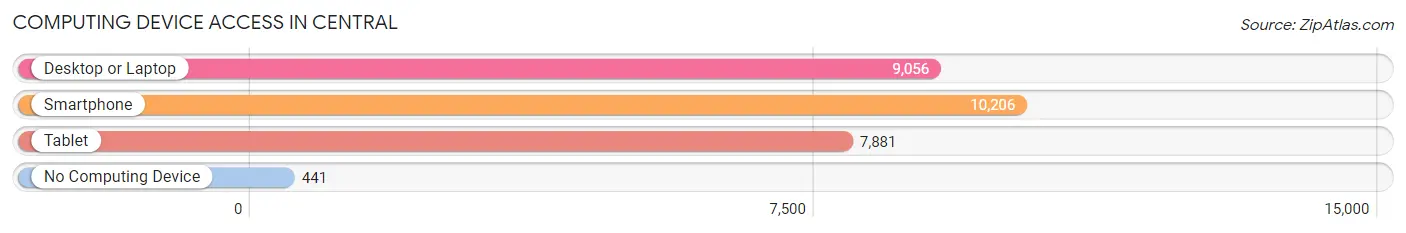
| Device Type | # Households | % Households |
| Desktop or Laptop | 9,056 | 82.1% |
| Smartphone | 10,206 | 92.5% |
| Tablet | 7,881 | 71.4% |
| No Computing Device | 441 | 4.0% |
| Total | 11,035 | 100.0% |
Internet Access in Central
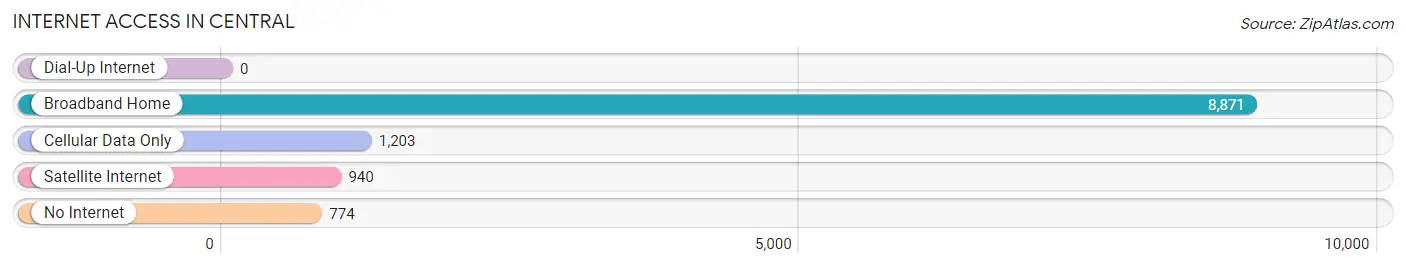
| Internet Type | # Households | % Households |
| Dial-Up Internet | 0 | 0.0% |
| Broadband Home | 8,871 | 80.4% |
| Cellular Data Only | 1,203 | 10.9% |
| Satellite Internet | 940 | 8.5% |
| No Internet | 774 | 7.0% |
| Total | 11,035 | 100.0% |
Central Summary
Central, Louisiana is a city located in the heart of the state, in the center of the Central Louisiana region. It is the parish seat of Rapides Parish and is the largest city in the region. The city is located on the banks of the Red River and is home to a population of over 48,000 people.
History
Central was founded in 1807 by a group of settlers from the Natchez area of Mississippi. The city was originally known as Grand Ecore, named after the nearby Grand Ecore plantation. The city was renamed Central in 1839, and it was incorporated in 1871.
Central was an important port city during the Civil War, and it was the site of several battles. After the war, the city experienced a period of growth and development, and it became a major center for the lumber industry. The city also became a hub for the railroad industry, and it was home to several major railroads.
Geography
Central is located in the center of the state, in the Central Louisiana region. The city is situated on the banks of the Red River, and it is surrounded by the Kisatchie National Forest. The city is located about 90 miles north of Baton Rouge and about 120 miles south of Shreveport.
The city has a total area of 16.3 square miles, and it has a humid subtropical climate. The average temperature in the summer is around 90 degrees Fahrenheit, and the average temperature in the winter is around 50 degrees Fahrenheit.
Economy
Central is a major center for the lumber industry, and it is home to several large lumber mills. The city is also home to several manufacturing companies, including a paper mill, a steel mill, and a chemical plant.
The city is also home to several major retail stores, including Walmart, Target, and Home Depot. The city is also home to several restaurants, bars, and entertainment venues.
Demographics
As of the 2010 census, Central had a population of 48,093 people. The racial makeup of the city was 63.3% White, 28.2% African American, 0.4% Native American, 0.7% Asian, 0.1% Pacific Islander, and 6.3% from other races. Hispanic or Latino of any race were 8.2% of the population.
The median income for a household in the city was $37,945, and the median income for a family was $45,945. The per capita income for the city was $20,845. About 17.2% of the population was below the poverty line.
Common Questions
What is Per Capita Income in Central?
Per Capita income in Central is $41,070.
What is the Median Family Income in Central?
Median Family Income in Central is $104,400.
What is the Median Household income in Central?
Median Household Income in Central is $82,714.
What is Income or Wage Gap in Central?
Income or Wage Gap in Central is 46.7%.
Women in Central earn 53.3 cents for every dollar earned by a man.
What is Inequality or Gini Index in Central?
Inequality or Gini Index in Central is 0.40.
What is the Total Population of Central?
Total Population of Central is 29,518.
What is the Total Male Population of Central?
Total Male Population of Central is 14,384.
What is the Total Female Population of Central?
Total Female Population of Central is 15,134.
What is the Ratio of Males per 100 Females in Central?
There are 95.04 Males per 100 Females in Central.
What is the Ratio of Females per 100 Males in Central?
There are 105.21 Females per 100 Males in Central.
What is the Median Population Age in Central?
Median Population Age in Central is 38.8 Years.
What is the Average Family Size in Central
Average Family Size in Central is 3.2 People.
What is the Average Household Size in Central
Average Household Size in Central is 2.7 People.
How Large is the Labor Force in Central?
There are 14,140 People in the Labor Forcein in Central.
What is the Percentage of People in the Labor Force in Central?
61.9% of People are in the Labor Force in Central.
What is the Unemployment Rate in Central?
Unemployment Rate in Central is 2.2%.