Marrero, LA Map & Demographics
Marrero Map
Marrero Overview
$25,731
PER CAPITA INCOME
$59,214
AVG FAMILY INCOME
$47,757
AVG HOUSEHOLD INCOME
22.0%
WAGE / INCOME GAP [ % ]
78.0¢/ $1
WAGE / INCOME GAP [ $ ]
$10,582
FAMILY INCOME DEFICIT
0.46
INEQUALITY / GINI INDEX
32,003
TOTAL POPULATION
14,807
MALE POPULATION
17,196
FEMALE POPULATION
86.11
MALES / 100 FEMALES
116.13
FEMALES / 100 MALES
43.1
MEDIAN AGE
3.3
AVG FAMILY SIZE
2.5
AVG HOUSEHOLD SIZE
14,917
LABOR FORCE [ PEOPLE ]
57.2%
PERCENT IN LABOR FORCE
7.0%
UNEMPLOYMENT RATE
Marrero Zip Codes
Income in Marrero
Income Overview in Marrero
Per Capita Income in Marrero is $25,731, while median incomes of families and households are $59,214 and $47,757 respectively.
| Characteristic | Number | Measure |
| Per Capita Income | 32,003 | $25,731 |
| Median Family Income | 7,658 | $59,214 |
| Mean Family Income | 7,658 | $70,658 |
| Median Household Income | 12,595 | $47,757 |
| Mean Household Income | 12,595 | $60,517 |
| Income Deficit | 7,658 | $10,582 |
| Wage / Income Gap (%) | 32,003 | 22.03% |
| Wage / Income Gap ($) | 32,003 | 77.97¢ per $1 |
| Gini / Inequality Index | 32,003 | 0.46 |
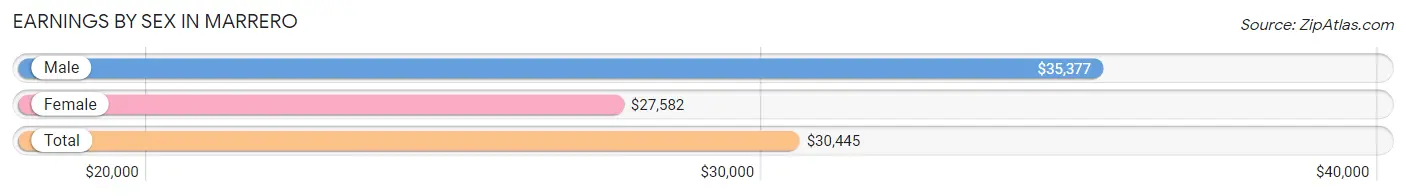
Earnings by Sex in Marrero
Average Earnings in Marrero are $30,445, $35,377 for men and $27,582 for women, a difference of 22.0%.
| Sex | Number | Average Earnings |
| Male | 7,349 (47.9%) | $35,377 |
| Female | 7,983 (52.1%) | $27,582 |
| Total | 15,332 (100.0%) | $30,445 |
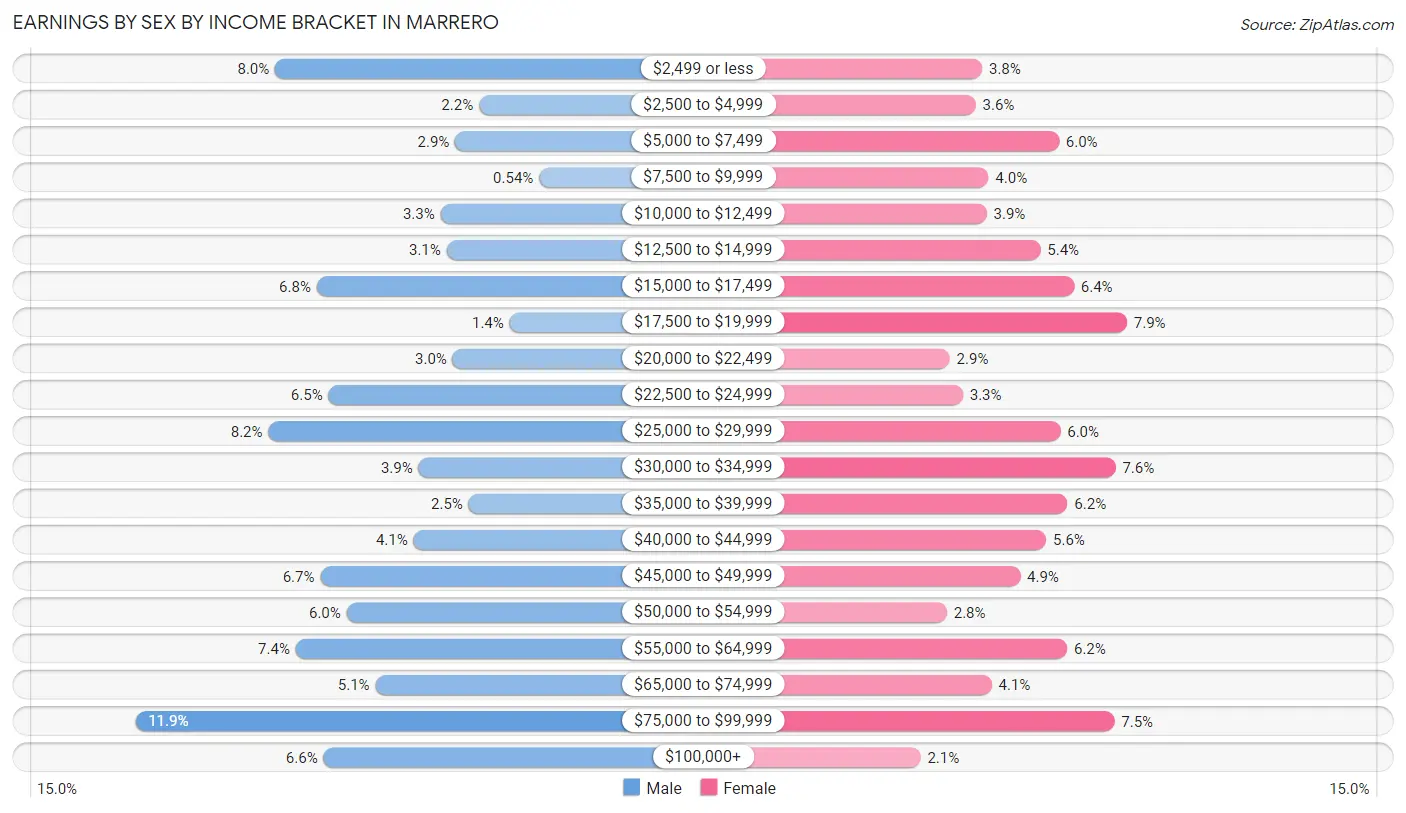
Earnings by Sex by Income Bracket in Marrero
The most common earnings brackets in Marrero are $75,000 to $99,999 for men (874 | 11.9%) and $17,500 to $19,999 for women (628 | 7.9%).
| Income | Male | Female |
| $2,499 or less | 585 (8.0%) | 303 (3.8%) |
| $2,500 to $4,999 | 164 (2.2%) | 289 (3.6%) |
| $5,000 to $7,499 | 213 (2.9%) | 476 (6.0%) |
| $7,500 to $9,999 | 40 (0.5%) | 318 (4.0%) |
| $10,000 to $12,499 | 243 (3.3%) | 314 (3.9%) |
| $12,500 to $14,999 | 231 (3.1%) | 434 (5.4%) |
| $15,000 to $17,499 | 499 (6.8%) | 509 (6.4%) |
| $17,500 to $19,999 | 101 (1.4%) | 628 (7.9%) |
| $20,000 to $22,499 | 218 (3.0%) | 231 (2.9%) |
| $22,500 to $24,999 | 475 (6.5%) | 260 (3.3%) |
| $25,000 to $29,999 | 599 (8.2%) | 479 (6.0%) |
| $30,000 to $34,999 | 289 (3.9%) | 603 (7.5%) |
| $35,000 to $39,999 | 185 (2.5%) | 495 (6.2%) |
| $40,000 to $44,999 | 299 (4.1%) | 447 (5.6%) |
| $45,000 to $49,999 | 492 (6.7%) | 389 (4.9%) |
| $50,000 to $54,999 | 437 (5.9%) | 224 (2.8%) |
| $55,000 to $64,999 | 542 (7.4%) | 494 (6.2%) |
| $65,000 to $74,999 | 378 (5.1%) | 325 (4.1%) |
| $75,000 to $99,999 | 874 (11.9%) | 600 (7.5%) |
| $100,000+ | 485 (6.6%) | 165 (2.1%) |
| Total | 7,349 (100.0%) | 7,983 (100.0%) |
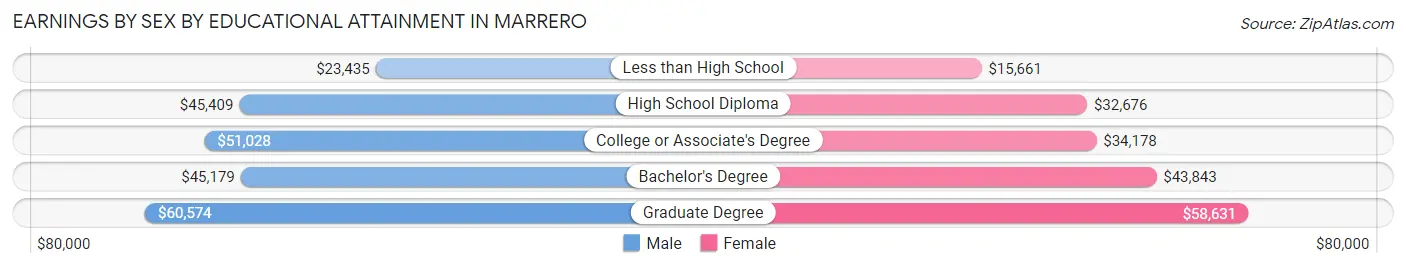
Earnings by Sex by Educational Attainment in Marrero
Average earnings in Marrero are $45,596 for men and $33,317 for women, a difference of 26.9%. Men with an educational attainment of graduate degree enjoy the highest average annual earnings of $60,574, while those with less than high school education earn the least with $23,435. Women with an educational attainment of graduate degree earn the most with the average annual earnings of $58,631, while those with less than high school education have the smallest earnings of $15,661.
| Educational Attainment | Male Income | Female Income |
| Less than High School | $23,435 | $15,661 |
| High School Diploma | $45,409 | $32,676 |
| College or Associate's Degree | $51,028 | $34,178 |
| Bachelor's Degree | $45,179 | $43,843 |
| Graduate Degree | $60,574 | $58,631 |
| Total | $45,596 | $33,317 |
Family Income in Marrero
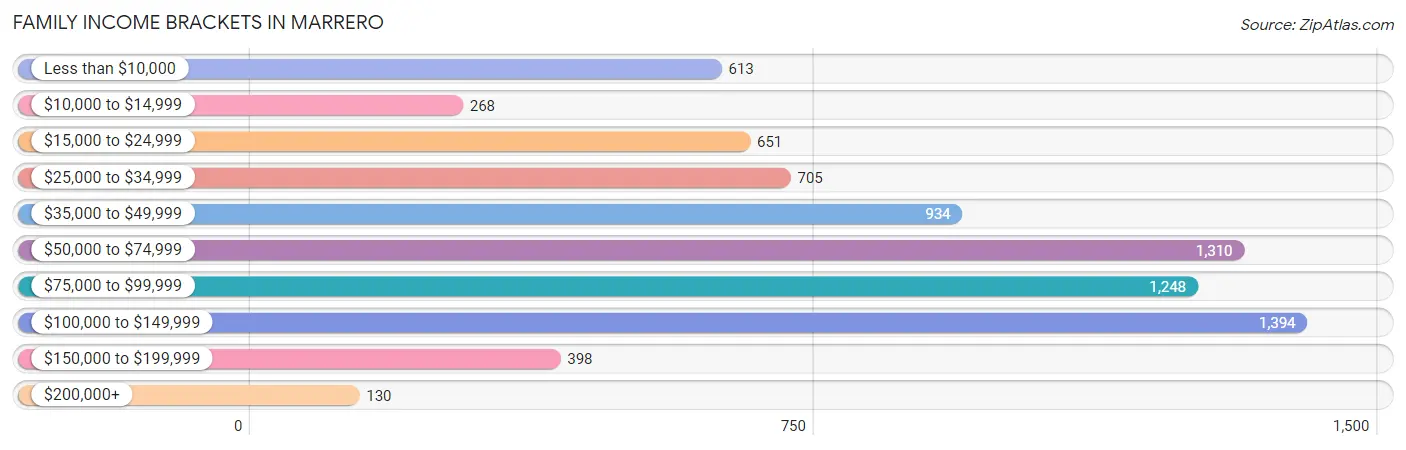
Family Income Brackets in Marrero
According to the Marrero family income data, there are 1,394 families falling into the $100,000 to $149,999 income range, which is the most common income bracket and makes up 18.2% of all families. Conversely, the $200,000+ income bracket is the least frequent group with only 130 families (1.7%) belonging to this category.
| Income Bracket | # Families | % Families |
| Less than $10,000 | 613 | 8.0% |
| $10,000 to $14,999 | 268 | 3.5% |
| $15,000 to $24,999 | 651 | 8.5% |
| $25,000 to $34,999 | 705 | 9.2% |
| $35,000 to $49,999 | 934 | 12.2% |
| $50,000 to $74,999 | 1,310 | 17.1% |
| $75,000 to $99,999 | 1,248 | 16.3% |
| $100,000 to $149,999 | 1,394 | 18.2% |
| $150,000 to $199,999 | 398 | 5.2% |
| $200,000+ | 130 | 1.7% |
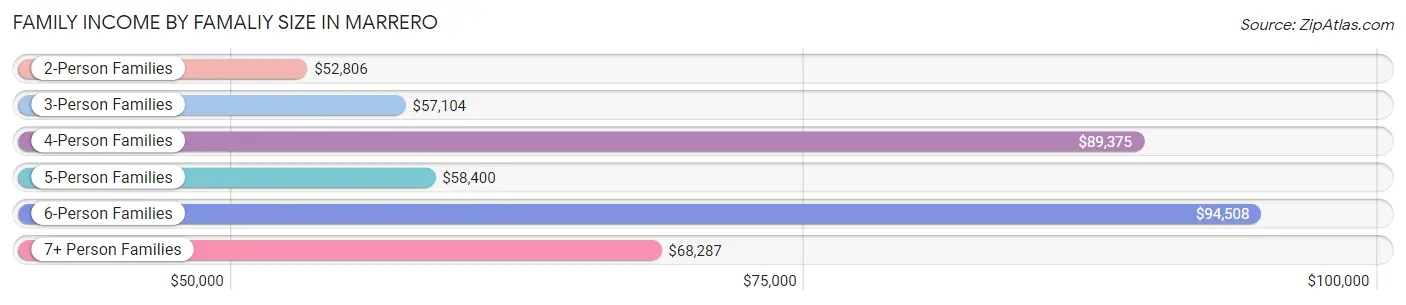
Family Income by Famaliy Size in Marrero
6-person families (61 | 0.8%) account for the highest median family income in Marrero with $94,508 per family, while 2-person families (3,413 | 44.6%) have the highest median income of $26,403 per family member.
| Income Bracket | # Families | Median Income |
| 2-Person Families | 3,413 (44.6%) | $52,806 |
| 3-Person Families | 2,232 (29.1%) | $57,104 |
| 4-Person Families | 1,423 (18.6%) | $89,375 |
| 5-Person Families | 438 (5.7%) | $58,400 |
| 6-Person Families | 61 (0.8%) | $94,508 |
| 7+ Person Families | 91 (1.2%) | $68,287 |
| Total | 7,658 (100.0%) | $59,214 |
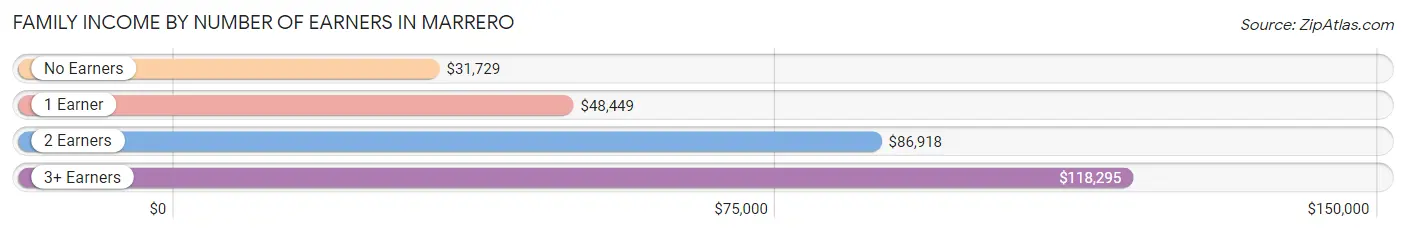
Family Income by Number of Earners in Marrero
The median family income in Marrero is $59,214, with families comprising 3+ earners (707) having the highest median family income of $118,295, while families with no earners (1,427) have the lowest median family income of $31,729, accounting for 9.2% and 18.6% of families, respectively.
| Number of Earners | # Families | Median Income |
| No Earners | 1,427 (18.6%) | $31,729 |
| 1 Earner | 3,001 (39.2%) | $48,449 |
| 2 Earners | 2,523 (33.0%) | $86,918 |
| 3+ Earners | 707 (9.2%) | $118,295 |
| Total | 7,658 (100.0%) | $59,214 |
Household Income in Marrero
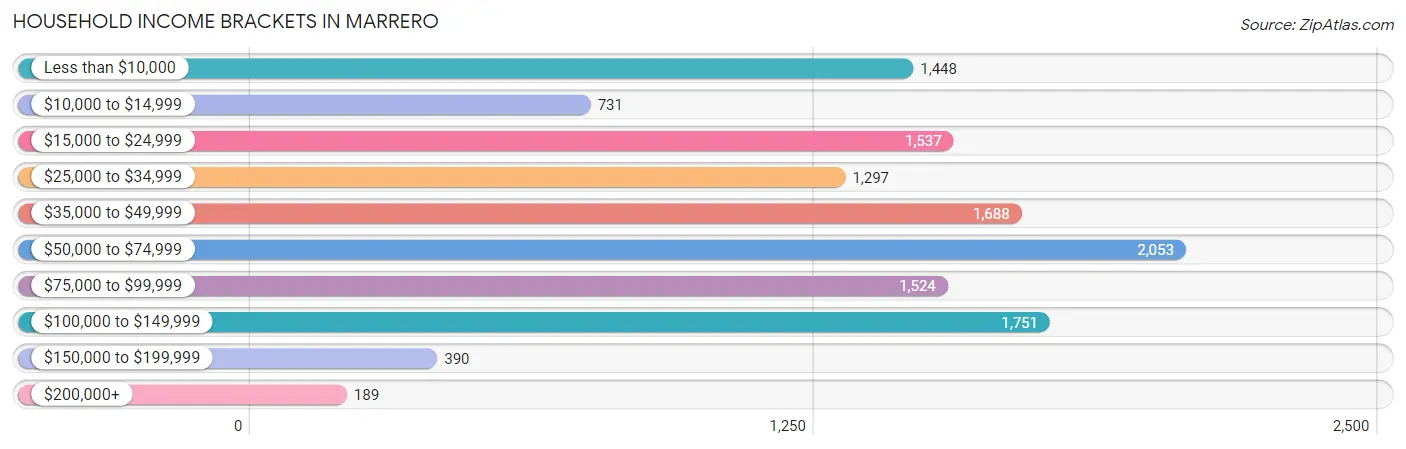
Household Income Brackets in Marrero
With 2,053 households falling in the category, the $50,000 to $74,999 income range is the most frequent in Marrero, accounting for 16.3% of all households. In contrast, only 189 households (1.5%) fall into the $200,000+ income bracket, making it the least populous group.
| Income Bracket | # Households | % Households |
| Less than $10,000 | 1,448 | 11.5% |
| $10,000 to $14,999 | 731 | 5.8% |
| $15,000 to $24,999 | 1,537 | 12.2% |
| $25,000 to $34,999 | 1,297 | 10.3% |
| $35,000 to $49,999 | 1,688 | 13.4% |
| $50,000 to $74,999 | 2,053 | 16.3% |
| $75,000 to $99,999 | 1,524 | 12.1% |
| $100,000 to $149,999 | 1,751 | 13.9% |
| $150,000 to $199,999 | 390 | 3.1% |
| $200,000+ | 189 | 1.5% |
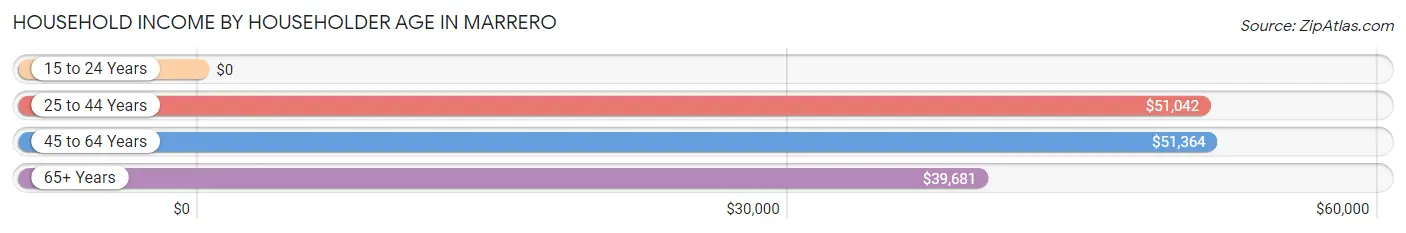
Household Income by Householder Age in Marrero
The median household income in Marrero is $47,757, with the highest median household income of $51,364 found in the 45 to 64 years age bracket for the primary householder. A total of 4,936 households (39.2%) fall into this category. Meanwhile, the 15 to 24 years age bracket for the primary householder has the lowest median household income of $0, with 378 households (3.0%) in this group.
| Income Bracket | # Households | Median Income |
| 15 to 24 Years | 378 (3.0%) | $0 |
| 25 to 44 Years | 2,995 (23.8%) | $51,042 |
| 45 to 64 Years | 4,936 (39.2%) | $51,364 |
| 65+ Years | 4,286 (34.0%) | $39,681 |
| Total | 12,595 (100.0%) | $47,757 |
Poverty in Marrero
Income Below Poverty by Sex and Age in Marrero
With 17.1% poverty level for males and 24.6% for females among the residents of Marrero, 6 to 11 year old males and 6 to 11 year old females are the most vulnerable to poverty, with 436 males (53.1%) and 545 females (39.9%) in their respective age groups living below the poverty level.
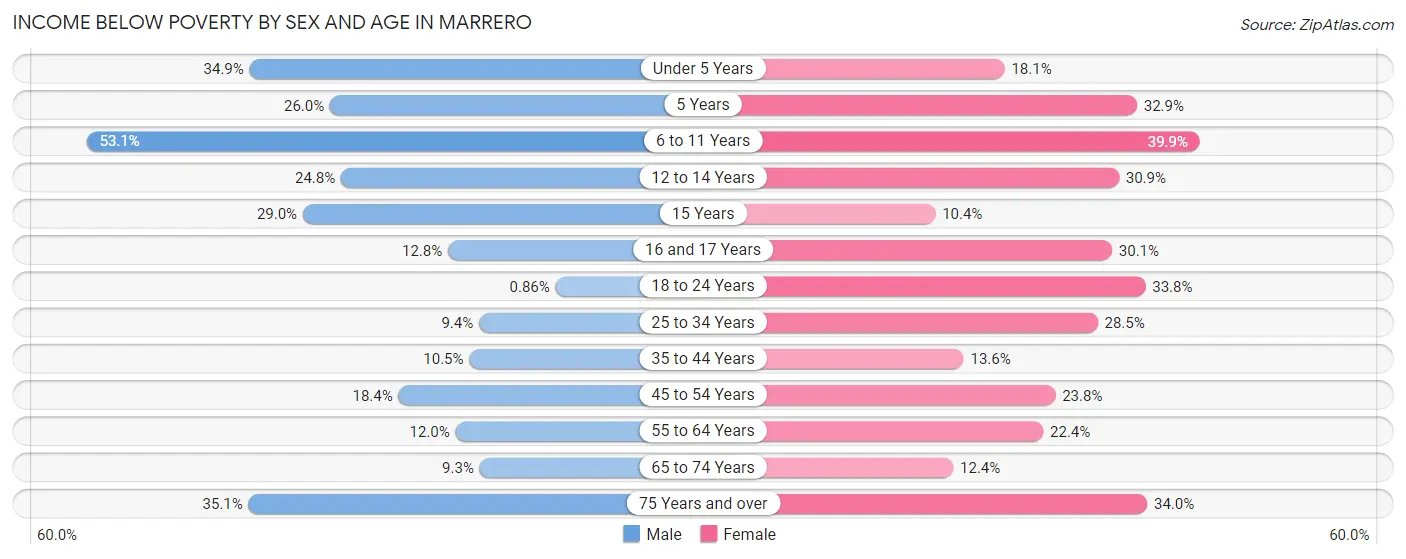
| Age Bracket | Male | Female |
| Under 5 Years | 369 (34.9%) | 133 (18.1%) |
| 5 Years | 33 (26.0%) | 68 (32.9%) |
| 6 to 11 Years | 436 (53.1%) | 545 (39.9%) |
| 12 to 14 Years | 203 (24.8%) | 141 (30.8%) |
| 15 Years | 29 (29.0%) | 13 (10.4%) |
| 16 and 17 Years | 42 (12.8%) | 108 (30.1%) |
| 18 to 24 Years | 16 (0.9%) | 438 (33.8%) |
| 25 to 34 Years | 156 (9.4%) | 607 (28.5%) |
| 35 to 44 Years | 162 (10.5%) | 236 (13.6%) |
| 45 to 54 Years | 340 (18.3%) | 463 (23.8%) |
| 55 to 64 Years | 260 (12.0%) | 603 (22.4%) |
| 65 to 74 Years | 126 (9.3%) | 299 (12.4%) |
| 75 Years and over | 339 (35.1%) | 527 (34.0%) |
| Total | 2,511 (17.1%) | 4,181 (24.6%) |
Income Above Poverty by Sex and Age in Marrero
According to the poverty statistics in Marrero, males aged 18 to 24 years and females aged 15 years are the age groups that are most secure financially, with 99.1% of males and 89.6% of females in these age groups living above the poverty line.
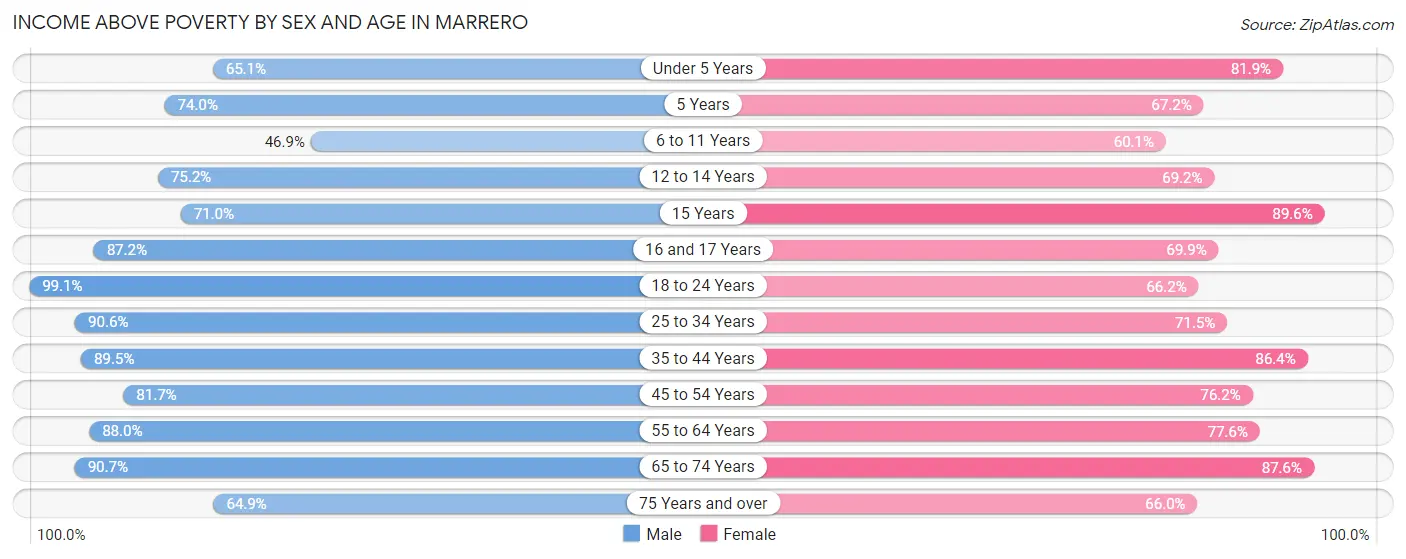
| Age Bracket | Male | Female |
| Under 5 Years | 687 (65.1%) | 601 (81.9%) |
| 5 Years | 94 (74.0%) | 139 (67.1%) |
| 6 to 11 Years | 385 (46.9%) | 822 (60.1%) |
| 12 to 14 Years | 617 (75.2%) | 316 (69.2%) |
| 15 Years | 71 (71.0%) | 112 (89.6%) |
| 16 and 17 Years | 285 (87.2%) | 251 (69.9%) |
| 18 to 24 Years | 1,844 (99.1%) | 858 (66.2%) |
| 25 to 34 Years | 1,505 (90.6%) | 1,524 (71.5%) |
| 35 to 44 Years | 1,386 (89.5%) | 1,504 (86.4%) |
| 45 to 54 Years | 1,513 (81.7%) | 1,485 (76.2%) |
| 55 to 64 Years | 1,907 (88.0%) | 2,086 (77.6%) |
| 65 to 74 Years | 1,227 (90.7%) | 2,112 (87.6%) |
| 75 Years and over | 628 (64.9%) | 1,023 (66.0%) |
| Total | 12,149 (82.9%) | 12,833 (75.4%) |
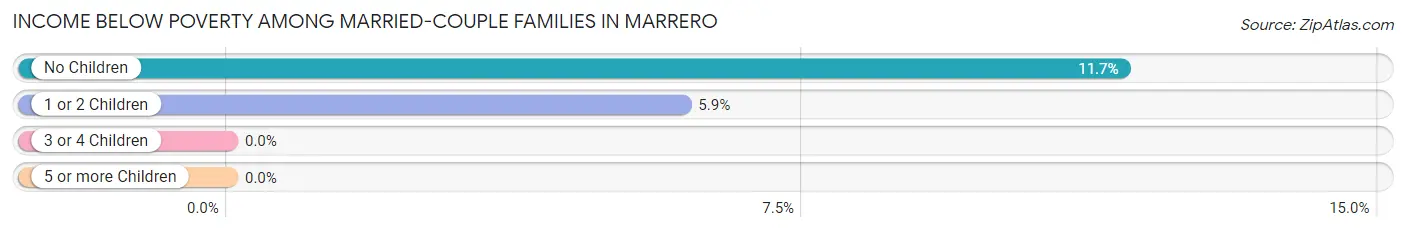
Income Below Poverty Among Married-Couple Families in Marrero
The poverty statistics for married-couple families in Marrero show that 9.8% or 406 of the total 4,128 families live below the poverty line. Families with no children have the highest poverty rate of 11.7%, comprising of 340 families. On the other hand, families with 3 or 4 children have the lowest poverty rate of 0.0%, which includes 0 families.
| Children | Above Poverty | Below Poverty |
| No Children | 2,579 (88.3%) | 340 (11.7%) |
| 1 or 2 Children | 1,048 (94.1%) | 66 (5.9%) |
| 3 or 4 Children | 95 (100.0%) | 0 (0.0%) |
| 5 or more Children | 0 (0.0%) | 0 (0.0%) |
| Total | 3,722 (90.2%) | 406 (9.8%) |
Income Below Poverty Among Single-Parent Households in Marrero
According to the poverty data in Marrero, 15.8% or 77 single-father households and 33.5% or 1,020 single-mother households are living below the poverty line. Among single-father households, those with 1 or 2 children have the highest poverty rate, with 58 households (29.9%) experiencing poverty. Likewise, among single-mother households, those with 5 or more children have the highest poverty rate, with 22 households (100.0%) falling below the poverty line.
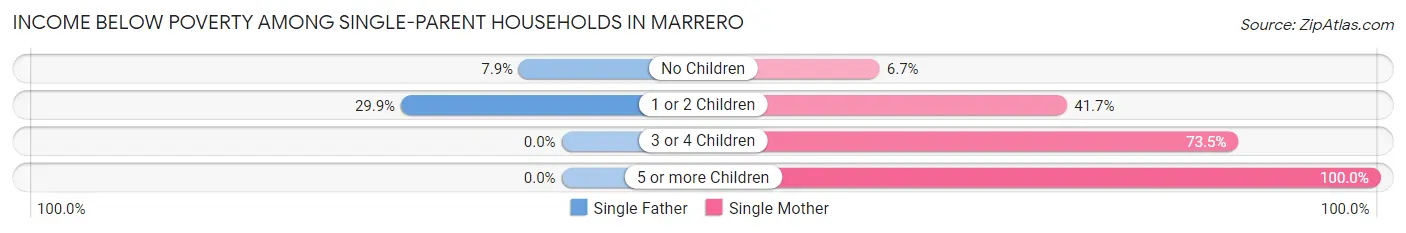
| Children | Single Father | Single Mother |
| No Children | 19 (7.9%) | 76 (6.7%) |
| 1 or 2 Children | 58 (29.9%) | 614 (41.7%) |
| 3 or 4 Children | 0 (0.0%) | 308 (73.5%) |
| 5 or more Children | 0 (0.0%) | 22 (100.0%) |
| Total | 77 (15.8%) | 1,020 (33.5%) |
Income Below Poverty Among Married-Couple vs Single-Parent Households in Marrero
The poverty data for Marrero shows that 406 of the married-couple family households (9.8%) and 1,097 of the single-parent households (31.1%) are living below the poverty level. Within the married-couple family households, those with no children have the highest poverty rate, with 340 households (11.7%) falling below the poverty line. Among the single-parent households, those with 3 or 4 children have the highest poverty rate, with 308 household (69.1%) living below poverty.
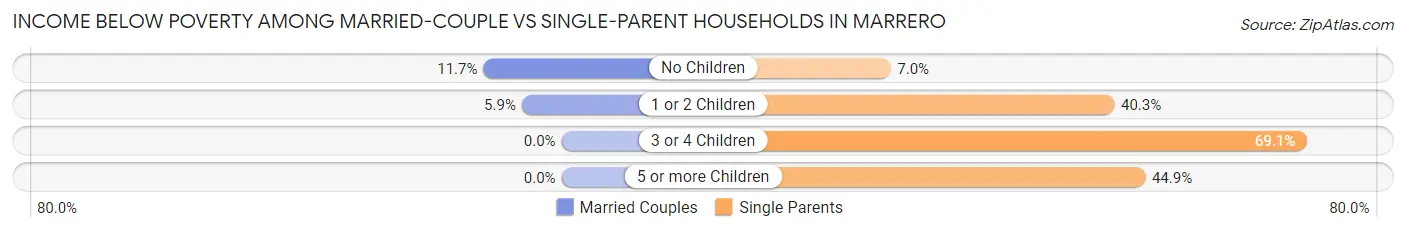
| Children | Married-Couple Families | Single-Parent Households |
| No Children | 340 (11.7%) | 95 (7.0%) |
| 1 or 2 Children | 66 (5.9%) | 672 (40.3%) |
| 3 or 4 Children | 0 (0.0%) | 308 (69.1%) |
| 5 or more Children | 0 (0.0%) | 22 (44.9%) |
| Total | 406 (9.8%) | 1,097 (31.1%) |
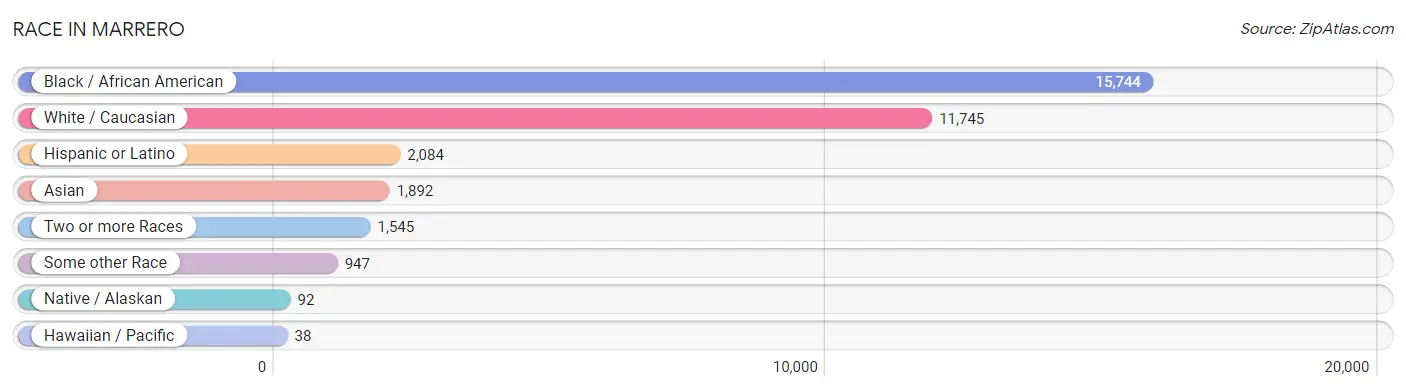
Race in Marrero
The most populous races in Marrero are Black / African American (15,744 | 49.2%), White / Caucasian (11,745 | 36.7%), and Hispanic or Latino (2,084 | 6.5%).
| Race | # Population | % Population |
| Asian | 1,892 | 5.9% |
| Black / African American | 15,744 | 49.2% |
| Hawaiian / Pacific | 38 | 0.1% |
| Hispanic or Latino | 2,084 | 6.5% |
| Native / Alaskan | 92 | 0.3% |
| White / Caucasian | 11,745 | 36.7% |
| Two or more Races | 1,545 | 4.8% |
| Some other Race | 947 | 3.0% |
| Total | 32,003 | 100.0% |
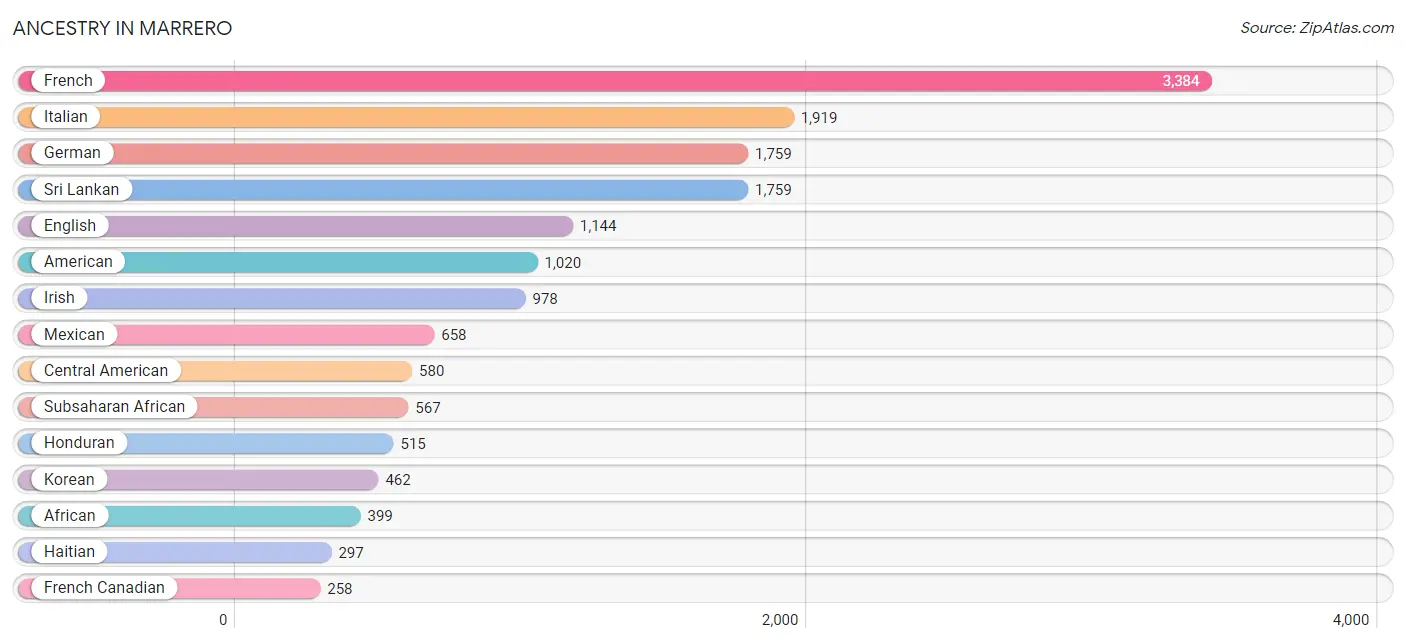
Ancestry in Marrero
The most populous ancestries reported in Marrero are French (3,384 | 10.6%), Italian (1,919 | 6.0%), German (1,759 | 5.5%), Sri Lankan (1,759 | 5.5%), and English (1,144 | 3.6%), together accounting for 31.1% of all Marrero residents.
| Ancestry | # Population | % Population |
| African | 399 | 1.3% |
| American | 1,020 | 3.2% |
| Arab | 118 | 0.4% |
| Bhutanese | 7 | 0.0% |
| Blackfeet | 32 | 0.1% |
| Brazilian | 41 | 0.1% |
| British | 59 | 0.2% |
| Burmese | 10 | 0.0% |
| Cajun | 87 | 0.3% |
| Central American | 580 | 1.8% |
| Cherokee | 138 | 0.4% |
| Choctaw | 16 | 0.1% |
| Colombian | 27 | 0.1% |
| Cuban | 52 | 0.2% |
| Danish | 24 | 0.1% |
| Dominican | 120 | 0.4% |
| Dutch | 45 | 0.1% |
| Eastern European | 9 | 0.0% |
| Ecuadorian | 22 | 0.1% |
| Egyptian | 10 | 0.0% |
| English | 1,144 | 3.6% |
| European | 25 | 0.1% |
| French | 3,384 | 10.6% |
| French Canadian | 258 | 0.8% |
| German | 1,759 | 5.5% |
| Greek | 13 | 0.0% |
| Haitian | 297 | 0.9% |
| Honduran | 515 | 1.6% |
| Houma | 128 | 0.4% |
| Indian (Asian) | 66 | 0.2% |
| Irish | 978 | 3.1% |
| Italian | 1,919 | 6.0% |
| Japanese | 25 | 0.1% |
| Korean | 462 | 1.4% |
| Lebanese | 11 | 0.0% |
| Lithuanian | 15 | 0.1% |
| Mexican | 658 | 2.1% |
| Mexican American Indian | 25 | 0.1% |
| Native Hawaiian | 4 | 0.0% |
| Navajo | 30 | 0.1% |
| Nicaraguan | 35 | 0.1% |
| Nigerian | 145 | 0.4% |
| Norwegian | 15 | 0.1% |
| Pakistani | 15 | 0.1% |
| Palestinian | 9 | 0.0% |
| Peruvian | 91 | 0.3% |
| Polish | 99 | 0.3% |
| Portuguese | 24 | 0.1% |
| Puerto Rican | 162 | 0.5% |
| Russian | 7 | 0.0% |
| Salvadoran | 30 | 0.1% |
| Samoan | 6 | 0.0% |
| Scandinavian | 8 | 0.0% |
| Scotch-Irish | 64 | 0.2% |
| Scottish | 126 | 0.4% |
| Slovak | 16 | 0.1% |
| South American | 140 | 0.4% |
| Spaniard | 122 | 0.4% |
| Spanish | 71 | 0.2% |
| Sri Lankan | 1,759 | 5.5% |
| Subsaharan African | 567 | 1.8% |
| Swedish | 54 | 0.2% |
| Thai | 52 | 0.2% |
| Trinidadian and Tobagonian | 34 | 0.1% |
| Welsh | 41 | 0.1% | View All 65 Rows |
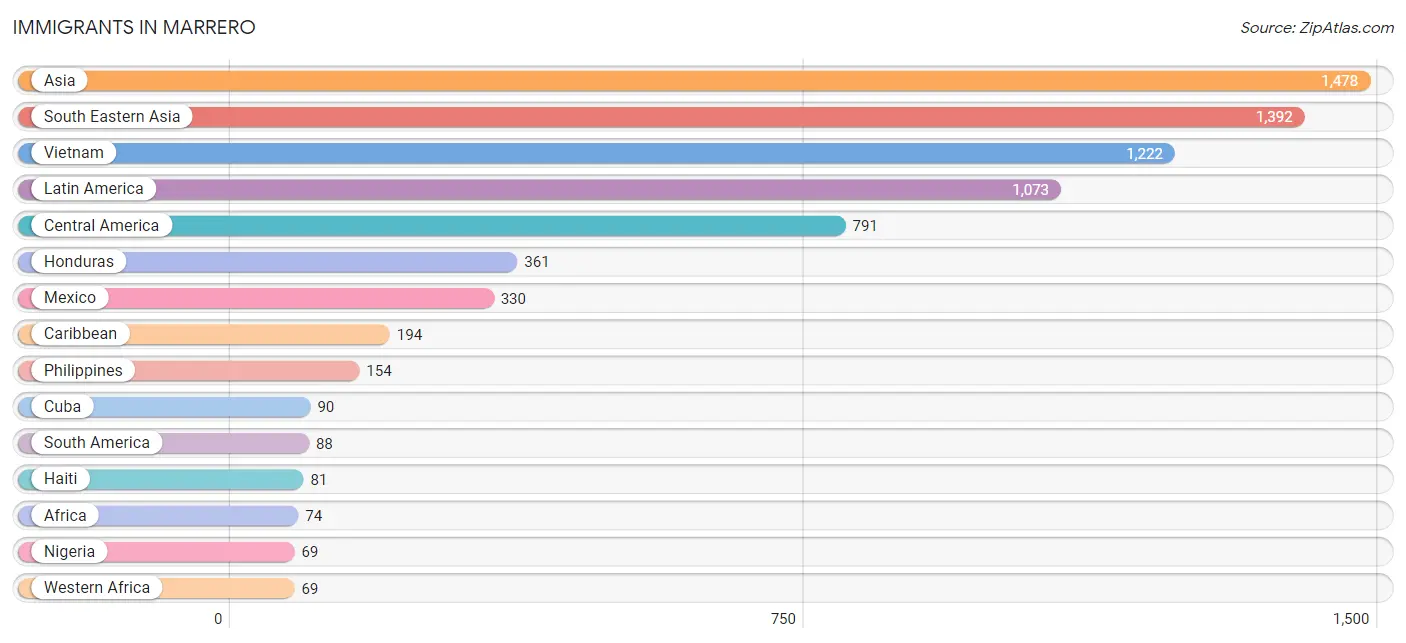
Immigrants in Marrero
The most numerous immigrant groups reported in Marrero came from Asia (1,478 | 4.6%), South Eastern Asia (1,392 | 4.3%), Vietnam (1,222 | 3.8%), Latin America (1,073 | 3.4%), and Central America (791 | 2.5%), together accounting for 18.6% of all Marrero residents.
| Immigration Origin | # Population | % Population |
| Africa | 74 | 0.2% |
| Asia | 1,478 | 4.6% |
| Belize | 15 | 0.1% |
| Brazil | 41 | 0.1% |
| Canada | 5 | 0.0% |
| Caribbean | 194 | 0.6% |
| Central America | 791 | 2.5% |
| Cuba | 90 | 0.3% |
| Egypt | 5 | 0.0% |
| El Salvador | 29 | 0.1% |
| England | 18 | 0.1% |
| Europe | 66 | 0.2% |
| France | 15 | 0.1% |
| Guatemala | 21 | 0.1% |
| Haiti | 81 | 0.3% |
| Honduras | 361 | 1.1% |
| India | 27 | 0.1% |
| Italy | 12 | 0.0% |
| Jordan | 43 | 0.1% |
| Latin America | 1,073 | 3.4% |
| Lebanon | 11 | 0.0% |
| Malaysia | 11 | 0.0% |
| Mexico | 330 | 1.0% |
| Nicaragua | 35 | 0.1% |
| Nigeria | 69 | 0.2% |
| Northern Africa | 5 | 0.0% |
| Northern Europe | 39 | 0.1% |
| Peru | 47 | 0.2% |
| Philippines | 154 | 0.5% |
| South America | 88 | 0.3% |
| South Central Asia | 27 | 0.1% |
| South Eastern Asia | 1,392 | 4.3% |
| Southern Europe | 12 | 0.0% |
| Thailand | 5 | 0.0% |
| Trinidad and Tobago | 15 | 0.1% |
| Vietnam | 1,222 | 3.8% |
| Western Africa | 69 | 0.2% |
| Western Asia | 59 | 0.2% |
| Western Europe | 15 | 0.1% | View All 39 Rows |
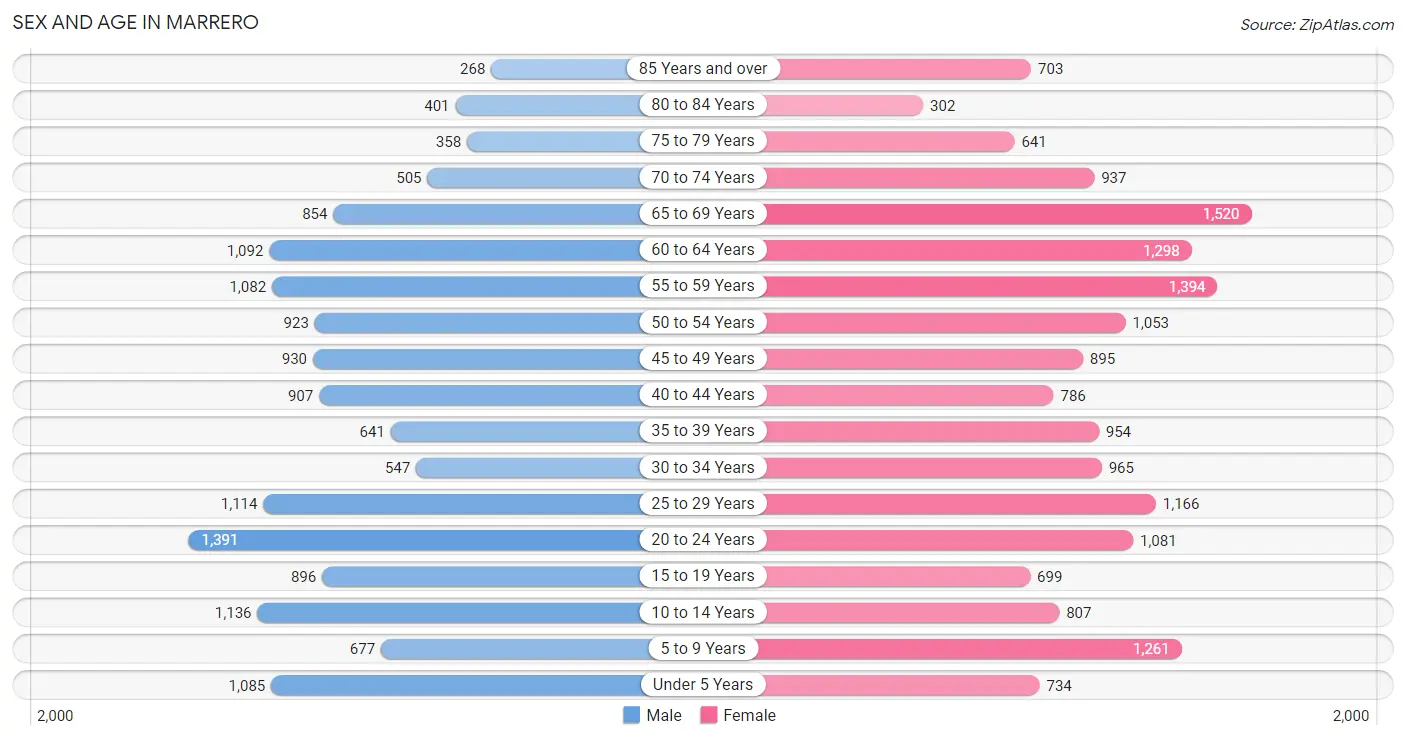
Sex and Age in Marrero
Sex and Age in Marrero
The most populous age groups in Marrero are 20 to 24 Years (1,391 | 9.4%) for men and 65 to 69 Years (1,520 | 8.8%) for women.
| Age Bracket | Male | Female |
| Under 5 Years | 1,085 (7.3%) | 734 (4.3%) |
| 5 to 9 Years | 677 (4.6%) | 1,261 (7.3%) |
| 10 to 14 Years | 1,136 (7.7%) | 807 (4.7%) |
| 15 to 19 Years | 896 (6.0%) | 699 (4.1%) |
| 20 to 24 Years | 1,391 (9.4%) | 1,081 (6.3%) |
| 25 to 29 Years | 1,114 (7.5%) | 1,166 (6.8%) |
| 30 to 34 Years | 547 (3.7%) | 965 (5.6%) |
| 35 to 39 Years | 641 (4.3%) | 954 (5.6%) |
| 40 to 44 Years | 907 (6.1%) | 786 (4.6%) |
| 45 to 49 Years | 930 (6.3%) | 895 (5.2%) |
| 50 to 54 Years | 923 (6.2%) | 1,053 (6.1%) |
| 55 to 59 Years | 1,082 (7.3%) | 1,394 (8.1%) |
| 60 to 64 Years | 1,092 (7.4%) | 1,298 (7.5%) |
| 65 to 69 Years | 854 (5.8%) | 1,520 (8.8%) |
| 70 to 74 Years | 505 (3.4%) | 937 (5.4%) |
| 75 to 79 Years | 358 (2.4%) | 641 (3.7%) |
| 80 to 84 Years | 401 (2.7%) | 302 (1.8%) |
| 85 Years and over | 268 (1.8%) | 703 (4.1%) |
| Total | 14,807 (100.0%) | 17,196 (100.0%) |
Families and Households in Marrero
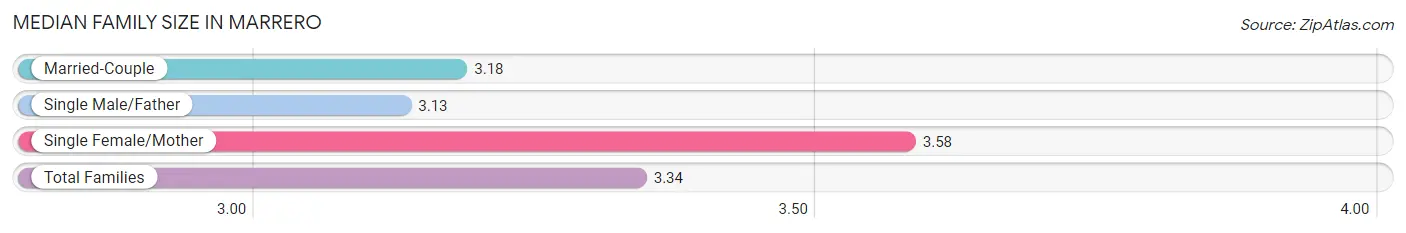
Median Family Size in Marrero
The median family size in Marrero is 3.34 persons per family, with single female/mother families (3,042 | 39.7%) accounting for the largest median family size of 3.58 persons per family. On the other hand, single male/father families (488 | 6.4%) represent the smallest median family size with 3.13 persons per family.
| Family Type | # Families | Family Size |
| Married-Couple | 4,128 (53.9%) | 3.18 |
| Single Male/Father | 488 (6.4%) | 3.13 |
| Single Female/Mother | 3,042 (39.7%) | 3.58 |
| Total Families | 7,658 (100.0%) | 3.34 |
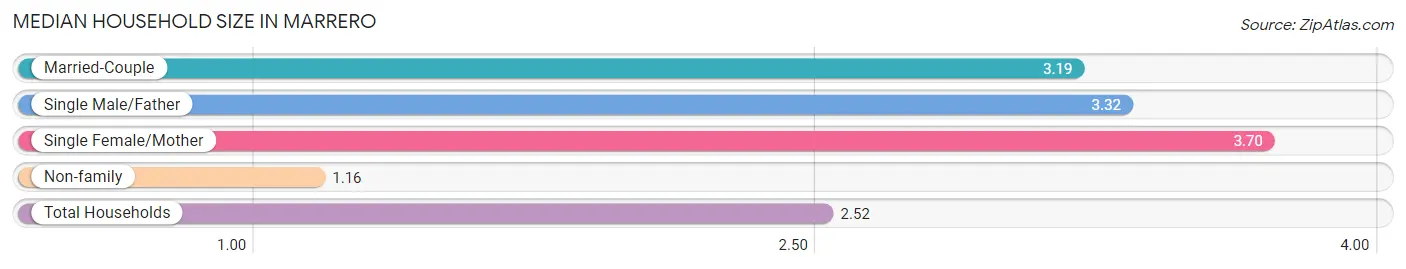
Median Household Size in Marrero
The median household size in Marrero is 2.52 persons per household, with single female/mother households (3,042 | 24.1%) accounting for the largest median household size of 3.7 persons per household. non-family households (4,937 | 39.2%) represent the smallest median household size with 1.16 persons per household.
| Household Type | # Households | Household Size |
| Married-Couple | 4,128 (32.8%) | 3.19 |
| Single Male/Father | 488 (3.9%) | 3.32 |
| Single Female/Mother | 3,042 (24.1%) | 3.70 |
| Non-family | 4,937 (39.2%) | 1.16 |
| Total Households | 12,595 (100.0%) | 2.52 |
Household Size by Marriage Status in Marrero
Out of a total of 12,595 households in Marrero, 7,658 (60.8%) are family households, while 4,937 (39.2%) are nonfamily households. The most numerous type of family households are 2-person households, comprising 3,199, and the most common type of nonfamily households are 1-person households, comprising 4,224.
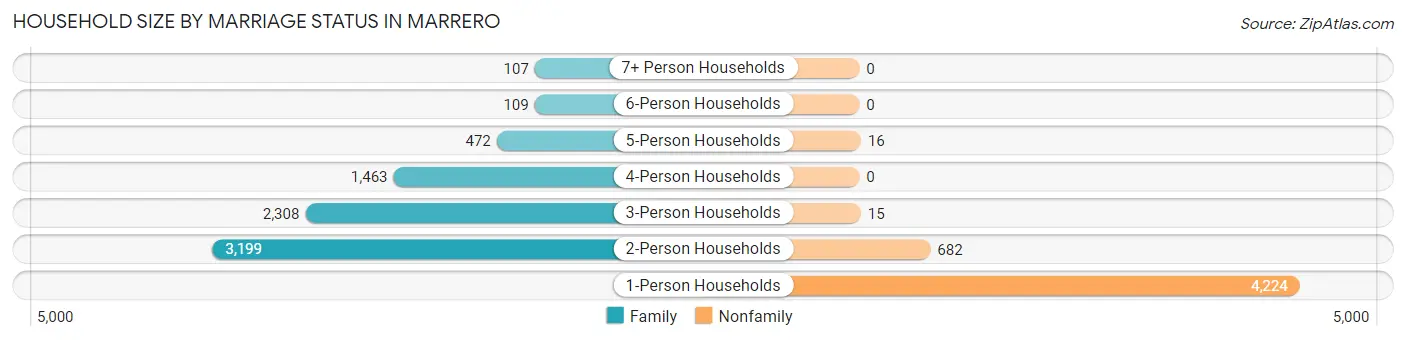
| Household Size | Family Households | Nonfamily Households |
| 1-Person Households | - | 4,224 (33.5%) |
| 2-Person Households | 3,199 (25.4%) | 682 (5.4%) |
| 3-Person Households | 2,308 (18.3%) | 15 (0.1%) |
| 4-Person Households | 1,463 (11.6%) | 0 (0.0%) |
| 5-Person Households | 472 (3.7%) | 16 (0.1%) |
| 6-Person Households | 109 (0.9%) | 0 (0.0%) |
| 7+ Person Households | 107 (0.9%) | 0 (0.0%) |
| Total | 7,658 (60.8%) | 4,937 (39.2%) |
Female Fertility in Marrero
Fertility by Age in Marrero
Average fertility rate in Marrero is 96.0 births per 1,000 women. Women in the age bracket of 20 to 34 years have the highest fertility rate with 187.0 births per 1,000 women. Women in the age bracket of 20 to 34 years acount for 92.0% of all women with births.
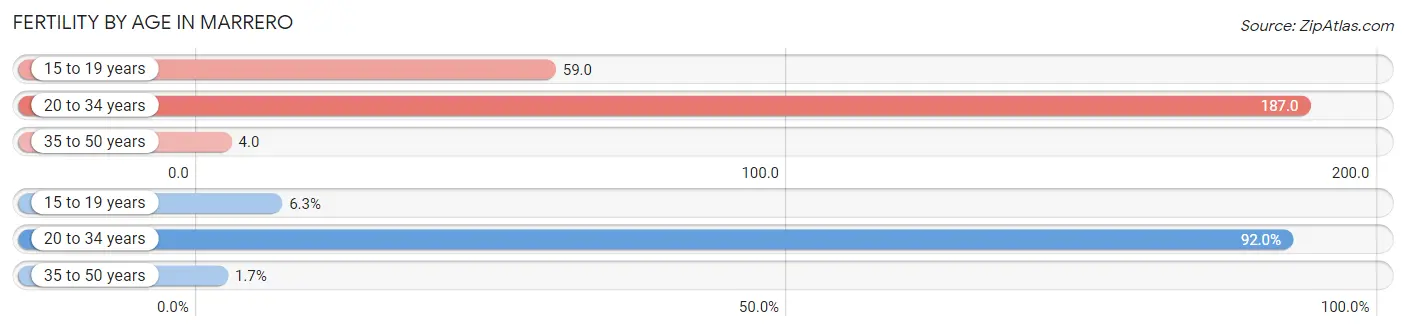
| Age Bracket | Women with Births | Births / 1,000 Women |
| 15 to 19 years | 41 (6.3%) | 59.0 |
| 20 to 34 years | 600 (92.0%) | 187.0 |
| 35 to 50 years | 11 (1.7%) | 4.0 |
| Total | 652 (100.0%) | 96.0 |
Fertility by Age by Marriage Status in Marrero
31.4% of women with births (652) in Marrero are married. The highest percentage of unmarried women with births falls into 15 to 19 years age bracket with 100.0% of them unmarried at the time of birth, while the lowest percentage of unmarried women with births belong to 35 to 50 years age bracket with 0.0% of them unmarried.
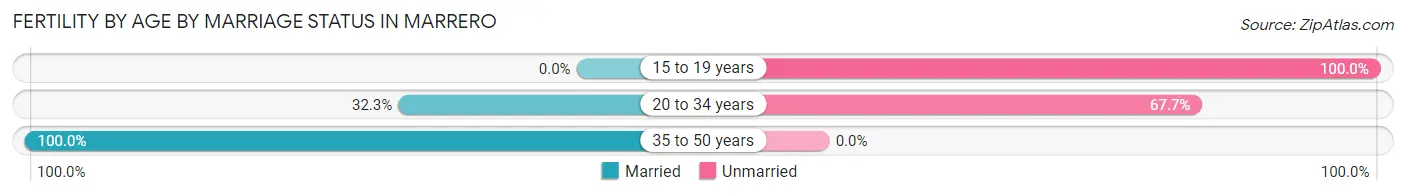
| Age Bracket | Married | Unmarried |
| 15 to 19 years | 0 (0.0%) | 41 (100.0%) |
| 20 to 34 years | 194 (32.3%) | 406 (67.7%) |
| 35 to 50 years | 11 (100.0%) | 0 (0.0%) |
| Total | 205 (31.4%) | 447 (68.6%) |
Fertility by Education in Marrero
Average fertility rate in Marrero is 96.0 births per 1,000 women. Women with the education attainment of college or associate's degree have the highest fertility rate of 141.0 births per 1,000 women, while women with the education attainment of bachelor's degree have the lowest fertility at 33.0 births per 1,000 women. Women with the education attainment of college or associate's degree represent 59.7% of all women with births.
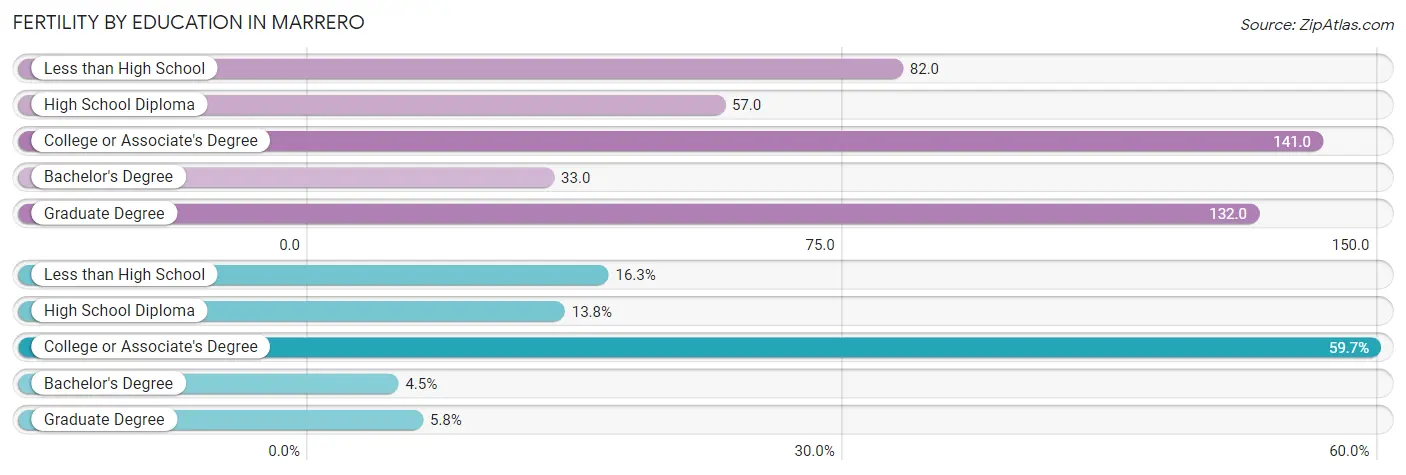
| Educational Attainment | Women with Births | Births / 1,000 Women |
| Less than High School | 106 (16.3%) | 82.0 |
| High School Diploma | 90 (13.8%) | 57.0 |
| College or Associate's Degree | 389 (59.7%) | 141.0 |
| Bachelor's Degree | 29 (4.4%) | 33.0 |
| Graduate Degree | 38 (5.8%) | 132.0 |
| Total | 652 (100.0%) | 96.0 |
Fertility by Education by Marriage Status in Marrero
68.6% of women with births in Marrero are unmarried. Women with the educational attainment of graduate degree are most likely to be married with 100.0% of them married at childbirth, while women with the educational attainment of bachelor's degree are least likely to be married with 100.0% of them unmarried at childbirth.
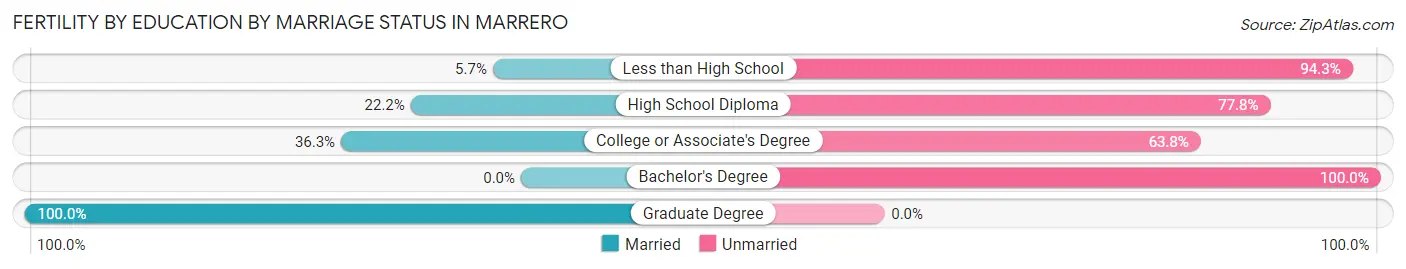
| Educational Attainment | Married | Unmarried |
| Less than High School | 6 (5.7%) | 100 (94.3%) |
| High School Diploma | 20 (22.2%) | 70 (77.8%) |
| College or Associate's Degree | 141 (36.2%) | 248 (63.7%) |
| Bachelor's Degree | 0 (0.0%) | 29 (100.0%) |
| Graduate Degree | 38 (100.0%) | 0 (0.0%) |
| Total | 205 (31.4%) | 447 (68.6%) |
Employment Characteristics in Marrero
Employment by Class of Employer in Marrero
Among the 13,475 employed individuals in Marrero, private company employees (8,702 | 64.6%), local government employees (1,388 | 10.3%), and not-for-profit organizations (1,066 | 7.9%) make up the most common classes of employment.
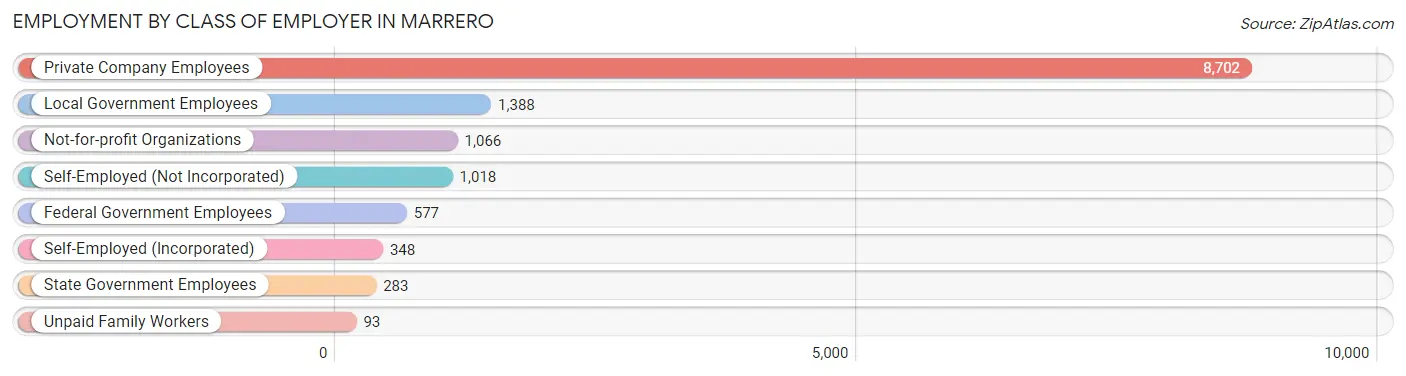
| Employer Class | # Employees | % Employees |
| Private Company Employees | 8,702 | 64.6% |
| Self-Employed (Incorporated) | 348 | 2.6% |
| Self-Employed (Not Incorporated) | 1,018 | 7.5% |
| Not-for-profit Organizations | 1,066 | 7.9% |
| Local Government Employees | 1,388 | 10.3% |
| State Government Employees | 283 | 2.1% |
| Federal Government Employees | 577 | 4.3% |
| Unpaid Family Workers | 93 | 0.7% |
| Total | 13,475 | 100.0% |
Employment Status by Age in Marrero
According to the labor force statistics for Marrero, out of the total population over 16 years of age (26,078), 57.2% or 14,917 individuals are in the labor force, with 7.0% or 1,044 of them unemployed. The age group with the highest labor force participation rate is 30 to 34 years, with 82.3% or 1,244 individuals in the labor force. Within the labor force, the 16 to 19 years age range has the highest percentage of unemployed individuals, with 28.4% or 131 of them being unemployed.
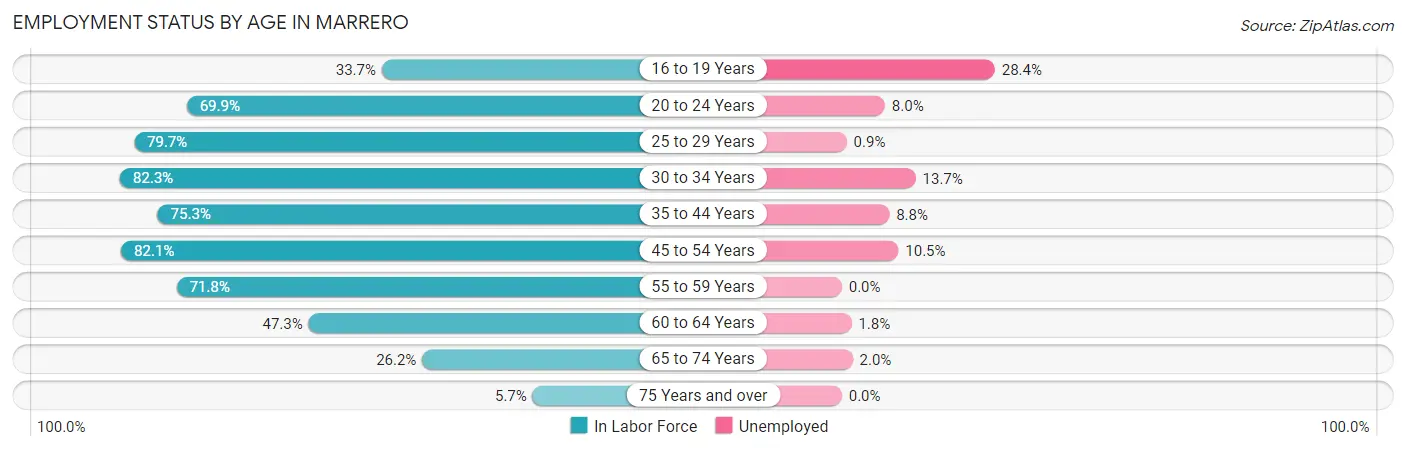
| Age Bracket | In Labor Force | Unemployed |
| 16 to 19 Years | 462 (33.7%) | 131 (28.4%) |
| 20 to 24 Years | 1,728 (69.9%) | 138 (8.0%) |
| 25 to 29 Years | 1,817 (79.7%) | 16 (0.9%) |
| 30 to 34 Years | 1,244 (82.3%) | 170 (13.7%) |
| 35 to 44 Years | 2,476 (75.3%) | 218 (8.8%) |
| 45 to 54 Years | 3,121 (82.1%) | 328 (10.5%) |
| 55 to 59 Years | 1,778 (71.8%) | 0 (0.0%) |
| 60 to 64 Years | 1,130 (47.3%) | 20 (1.8%) |
| 65 to 74 Years | 1,000 (26.2%) | 20 (2.0%) |
| 75 Years and over | 152 (5.7%) | 0 (0.0%) |
| Total | 14,917 (57.2%) | 1,044 (7.0%) |
Employment Status by Educational Attainment in Marrero
According to labor force statistics for Marrero, 73.4% of individuals (11,558) out of the total population between 25 and 64 years of age (15,747) are in the labor force, with 6.5% or 751 of them being unemployed. The group with the highest labor force participation rate are those with the educational attainment of bachelor's degree or higher, with 86.2% or 1,949 individuals in the labor force. Within the labor force, individuals with high school diploma education have the highest percentage of unemployment, with 9.2% or 338 of them being unemployed.
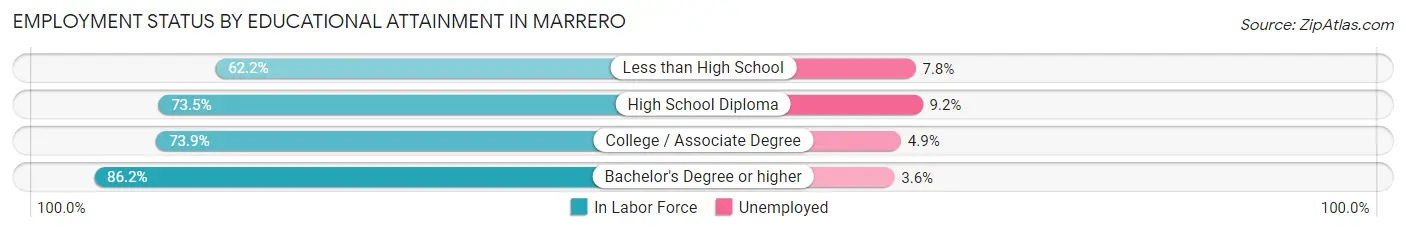
| Educational Attainment | In Labor Force | Unemployed |
| Less than High School | 1,762 (62.2%) | 221 (7.8%) |
| High School Diploma | 3,669 (73.5%) | 459 (9.2%) |
| College / Associate Degree | 4,184 (73.9%) | 277 (4.9%) |
| Bachelor's Degree or higher | 1,949 (86.2%) | 81 (3.6%) |
| Total | 11,558 (73.4%) | 1,024 (6.5%) |
Employment Occupations by Sex in Marrero
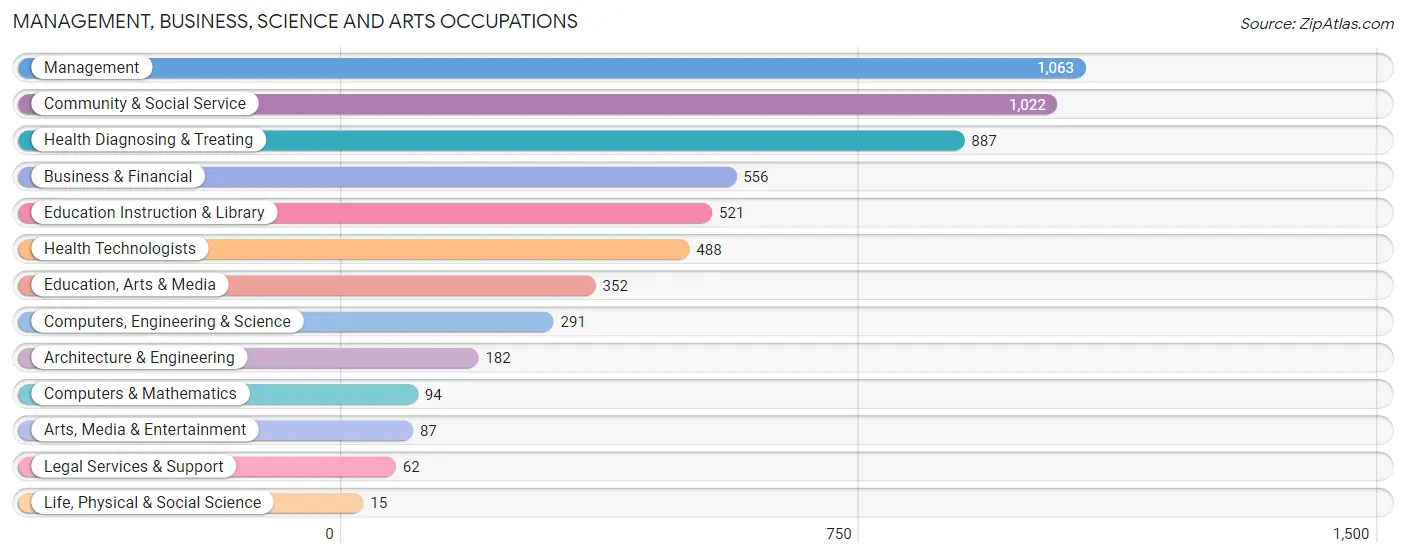
Management, Business, Science and Arts Occupations
The most common Management, Business, Science and Arts occupations in Marrero are Management (1,063 | 7.7%), Community & Social Service (1,022 | 7.4%), Health Diagnosing & Treating (887 | 6.4%), Business & Financial (556 | 4.0%), and Education Instruction & Library (521 | 3.8%).
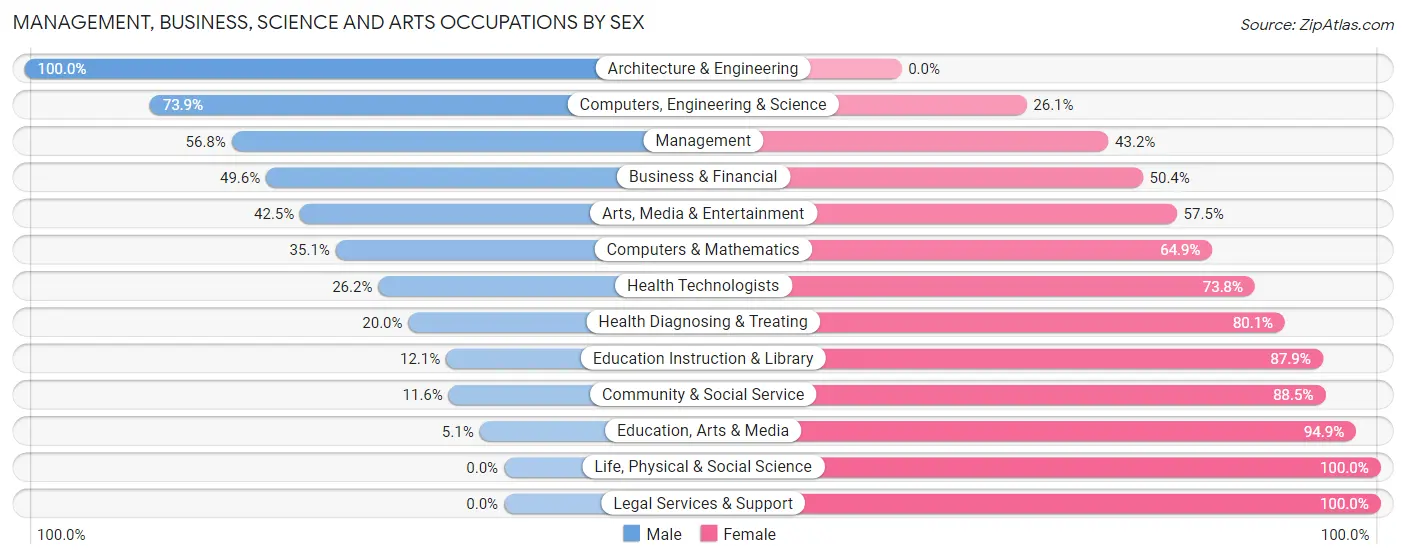
Management, Business, Science and Arts Occupations by Sex
Within the Management, Business, Science and Arts occupations in Marrero, the most male-oriented occupations are Architecture & Engineering (100.0%), Computers, Engineering & Science (73.9%), and Management (56.8%), while the most female-oriented occupations are Life, Physical & Social Science (100.0%), Legal Services & Support (100.0%), and Education, Arts & Media (94.9%).
| Occupation | Male | Female |
| Management | 604 (56.8%) | 459 (43.2%) |
| Business & Financial | 276 (49.6%) | 280 (50.4%) |
| Computers, Engineering & Science | 215 (73.9%) | 76 (26.1%) |
| Computers & Mathematics | 33 (35.1%) | 61 (64.9%) |
| Architecture & Engineering | 182 (100.0%) | 0 (0.0%) |
| Life, Physical & Social Science | 0 (0.0%) | 15 (100.0%) |
| Community & Social Service | 118 (11.6%) | 904 (88.4%) |
| Education, Arts & Media | 18 (5.1%) | 334 (94.9%) |
| Legal Services & Support | 0 (0.0%) | 62 (100.0%) |
| Education Instruction & Library | 63 (12.1%) | 458 (87.9%) |
| Arts, Media & Entertainment | 37 (42.5%) | 50 (57.5%) |
| Health Diagnosing & Treating | 177 (20.0%) | 710 (80.0%) |
| Health Technologists | 128 (26.2%) | 360 (73.8%) |
| Total (Category) | 1,390 (36.4%) | 2,429 (63.6%) |
| Total (Overall) | 6,491 (47.0%) | 7,328 (53.0%) |
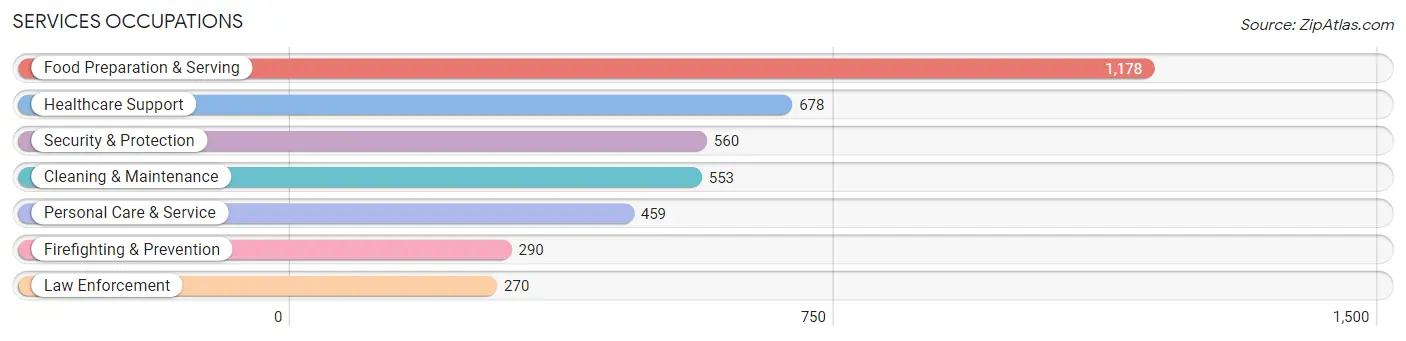
Services Occupations
The most common Services occupations in Marrero are Food Preparation & Serving (1,178 | 8.5%), Healthcare Support (678 | 4.9%), Security & Protection (560 | 4.1%), Cleaning & Maintenance (553 | 4.0%), and Personal Care & Service (459 | 3.3%).
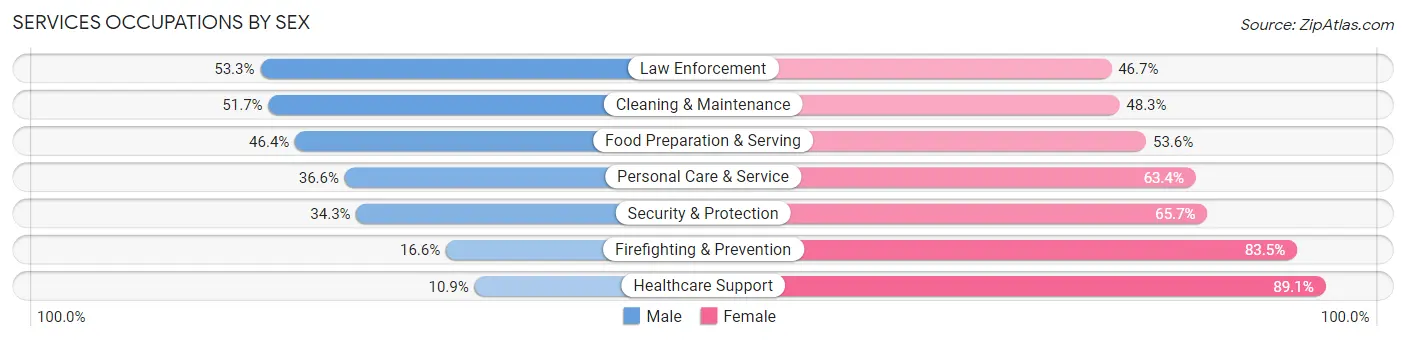
Services Occupations by Sex
Within the Services occupations in Marrero, the most male-oriented occupations are Law Enforcement (53.3%), Cleaning & Maintenance (51.7%), and Food Preparation & Serving (46.4%), while the most female-oriented occupations are Healthcare Support (89.1%), Firefighting & Prevention (83.5%), and Security & Protection (65.7%).
| Occupation | Male | Female |
| Healthcare Support | 74 (10.9%) | 604 (89.1%) |
| Security & Protection | 192 (34.3%) | 368 (65.7%) |
| Firefighting & Prevention | 48 (16.6%) | 242 (83.5%) |
| Law Enforcement | 144 (53.3%) | 126 (46.7%) |
| Food Preparation & Serving | 547 (46.4%) | 631 (53.6%) |
| Cleaning & Maintenance | 286 (51.7%) | 267 (48.3%) |
| Personal Care & Service | 168 (36.6%) | 291 (63.4%) |
| Total (Category) | 1,267 (37.0%) | 2,161 (63.0%) |
| Total (Overall) | 6,491 (47.0%) | 7,328 (53.0%) |
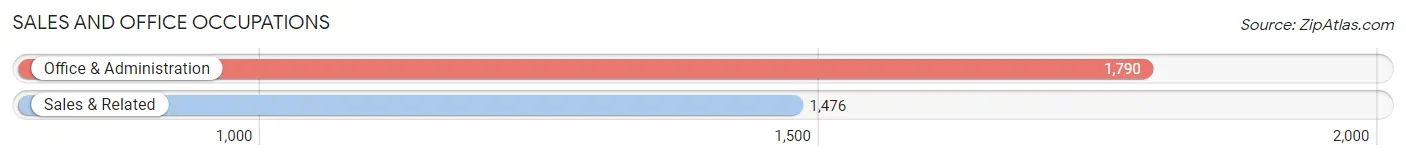
Sales and Office Occupations
The most common Sales and Office occupations in Marrero are Office & Administration (1,790 | 13.0%), and Sales & Related (1,476 | 10.7%).
Sales and Office Occupations by Sex
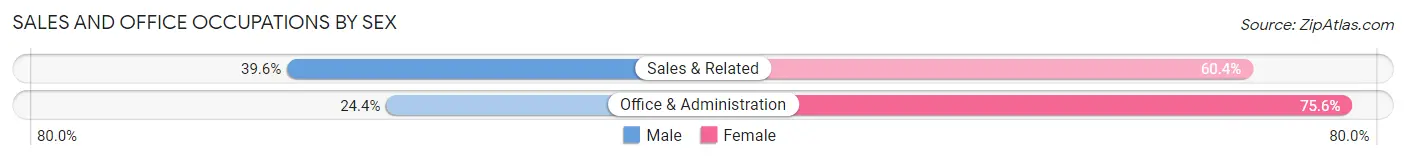
| Occupation | Male | Female |
| Sales & Related | 585 (39.6%) | 891 (60.4%) |
| Office & Administration | 436 (24.4%) | 1,354 (75.6%) |
| Total (Category) | 1,021 (31.3%) | 2,245 (68.7%) |
| Total (Overall) | 6,491 (47.0%) | 7,328 (53.0%) |
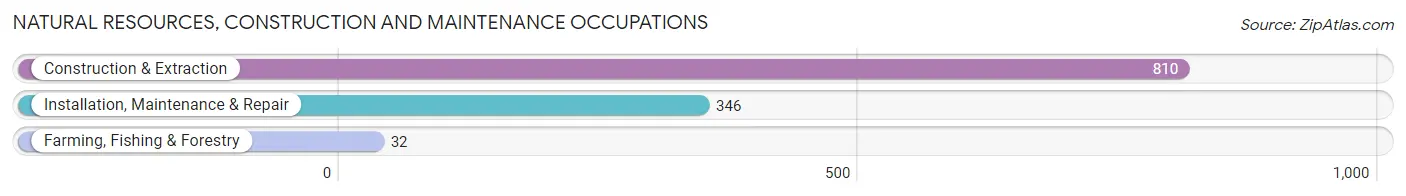
Natural Resources, Construction and Maintenance Occupations
The most common Natural Resources, Construction and Maintenance occupations in Marrero are Construction & Extraction (810 | 5.9%), Installation, Maintenance & Repair (346 | 2.5%), and Farming, Fishing & Forestry (32 | 0.2%).
Natural Resources, Construction and Maintenance Occupations by Sex
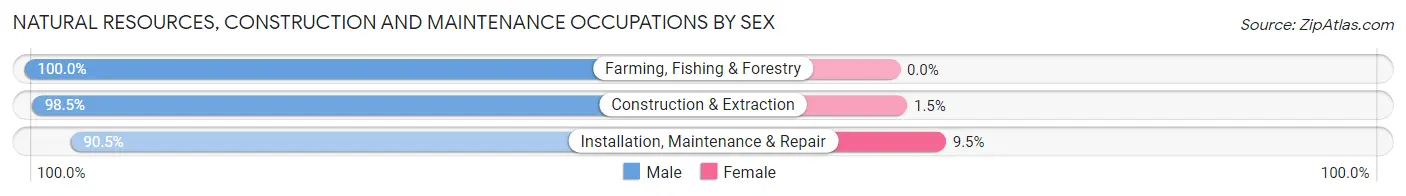
| Occupation | Male | Female |
| Farming, Fishing & Forestry | 32 (100.0%) | 0 (0.0%) |
| Construction & Extraction | 798 (98.5%) | 12 (1.5%) |
| Installation, Maintenance & Repair | 313 (90.5%) | 33 (9.5%) |
| Total (Category) | 1,143 (96.2%) | 45 (3.8%) |
| Total (Overall) | 6,491 (47.0%) | 7,328 (53.0%) |
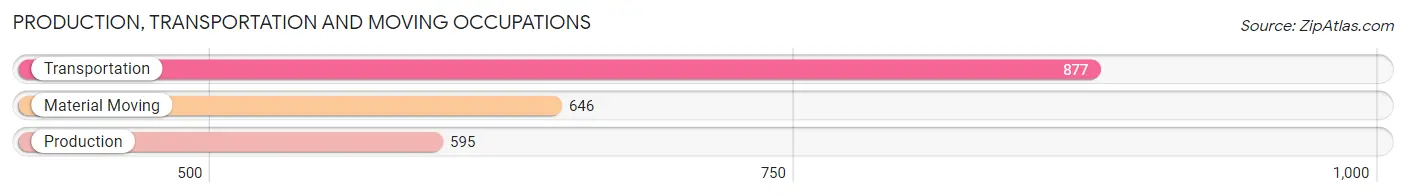
Production, Transportation and Moving Occupations
The most common Production, Transportation and Moving occupations in Marrero are Transportation (877 | 6.4%), Material Moving (646 | 4.7%), and Production (595 | 4.3%).
Production, Transportation and Moving Occupations by Sex
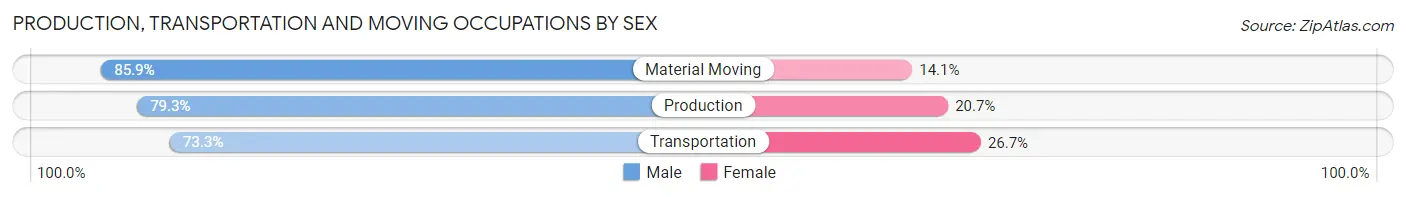
| Occupation | Male | Female |
| Production | 472 (79.3%) | 123 (20.7%) |
| Transportation | 643 (73.3%) | 234 (26.7%) |
| Material Moving | 555 (85.9%) | 91 (14.1%) |
| Total (Category) | 1,670 (78.8%) | 448 (21.1%) |
| Total (Overall) | 6,491 (47.0%) | 7,328 (53.0%) |
Employment Industries by Sex in Marrero
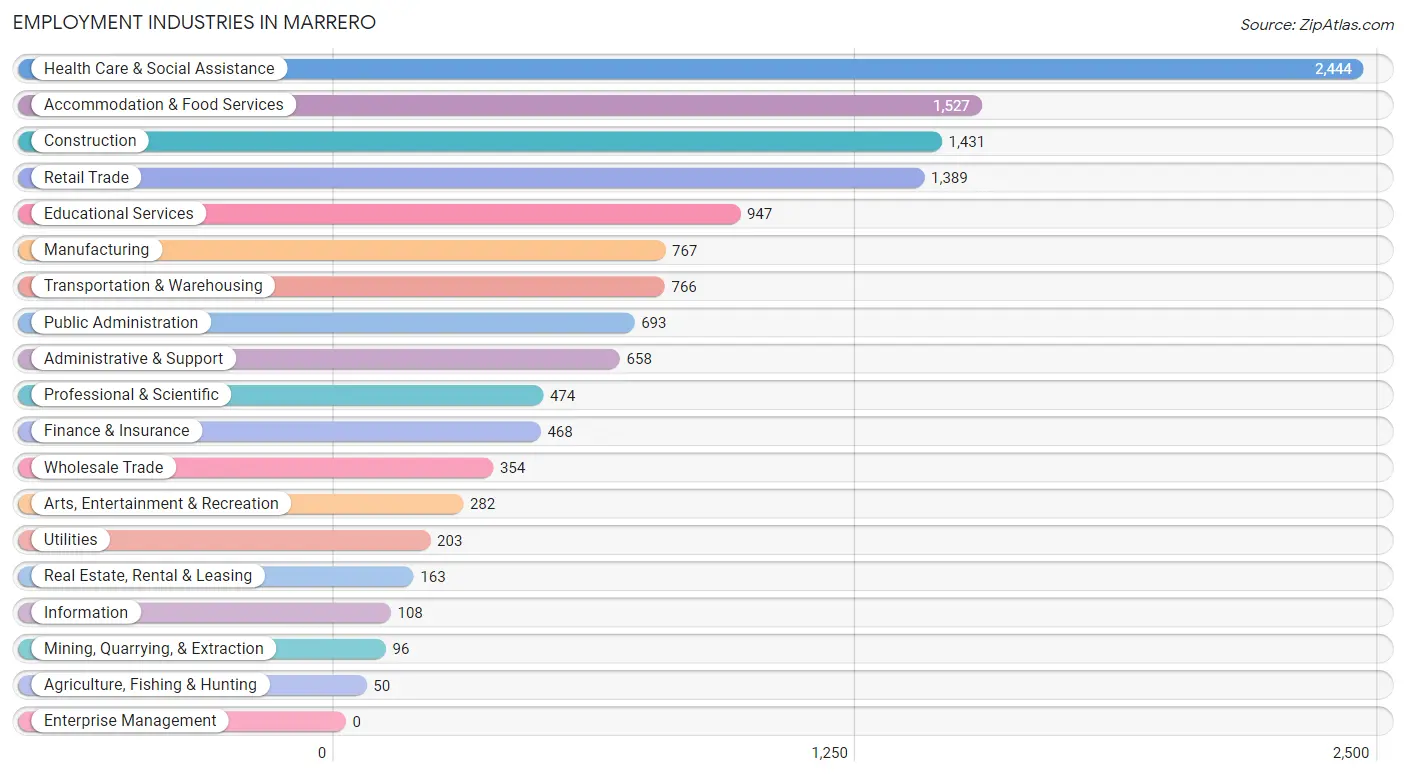
Employment Industries in Marrero
The major employment industries in Marrero include Health Care & Social Assistance (2,444 | 17.7%), Accommodation & Food Services (1,527 | 11.1%), Construction (1,431 | 10.4%), Retail Trade (1,389 | 10.1%), and Educational Services (947 | 6.9%).
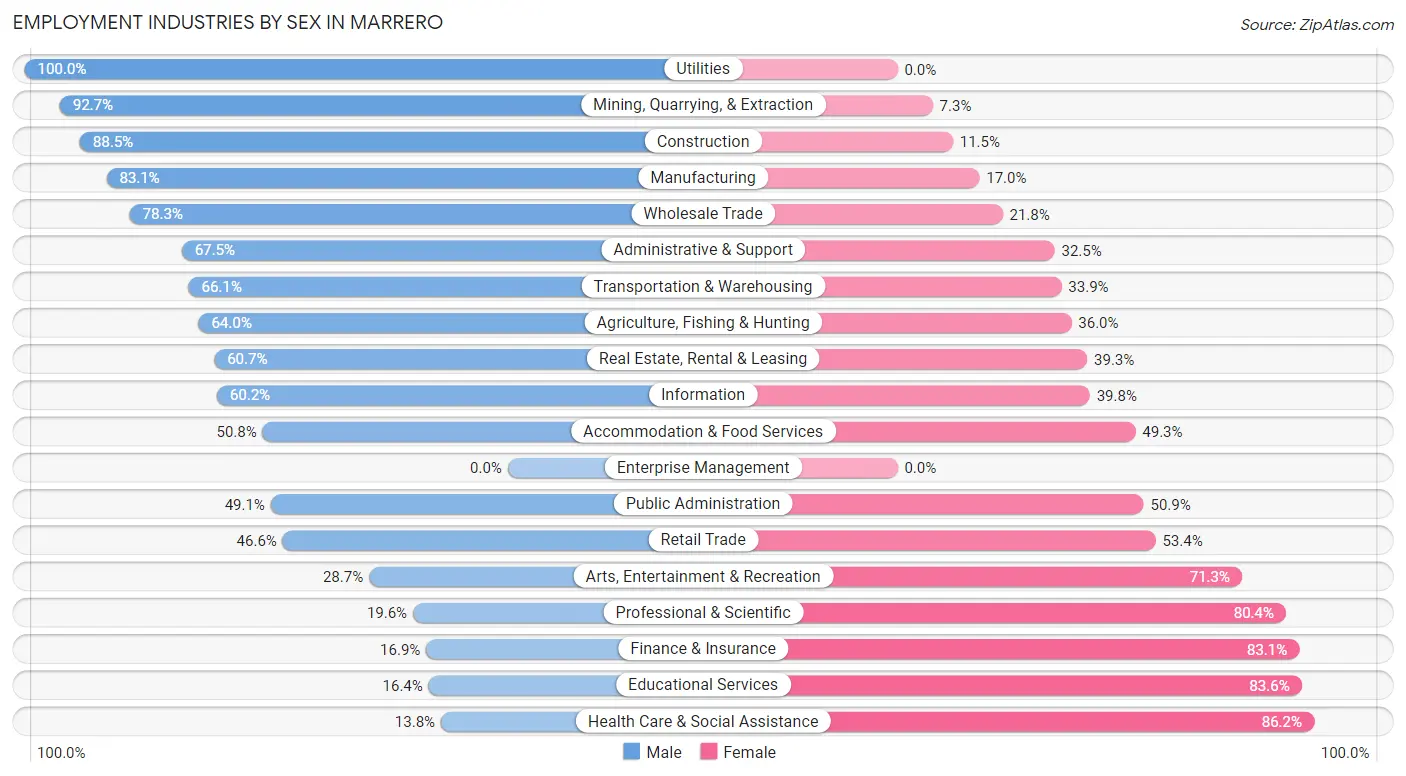
Employment Industries by Sex in Marrero
The Marrero industries that see more men than women are Utilities (100.0%), Mining, Quarrying, & Extraction (92.7%), and Construction (88.5%), whereas the industries that tend to have a higher number of women are Health Care & Social Assistance (86.2%), Educational Services (83.6%), and Finance & Insurance (83.1%).
| Industry | Male | Female |
| Agriculture, Fishing & Hunting | 32 (64.0%) | 18 (36.0%) |
| Mining, Quarrying, & Extraction | 89 (92.7%) | 7 (7.3%) |
| Construction | 1,267 (88.5%) | 164 (11.5%) |
| Manufacturing | 637 (83.1%) | 130 (17.0%) |
| Wholesale Trade | 277 (78.2%) | 77 (21.7%) |
| Retail Trade | 647 (46.6%) | 742 (53.4%) |
| Transportation & Warehousing | 506 (66.1%) | 260 (33.9%) |
| Utilities | 203 (100.0%) | 0 (0.0%) |
| Information | 65 (60.2%) | 43 (39.8%) |
| Finance & Insurance | 79 (16.9%) | 389 (83.1%) |
| Real Estate, Rental & Leasing | 99 (60.7%) | 64 (39.3%) |
| Professional & Scientific | 93 (19.6%) | 381 (80.4%) |
| Enterprise Management | 0 (0.0%) | 0 (0.0%) |
| Administrative & Support | 444 (67.5%) | 214 (32.5%) |
| Educational Services | 155 (16.4%) | 792 (83.6%) |
| Health Care & Social Assistance | 338 (13.8%) | 2,106 (86.2%) |
| Arts, Entertainment & Recreation | 81 (28.7%) | 201 (71.3%) |
| Accommodation & Food Services | 775 (50.7%) | 752 (49.2%) |
| Public Administration | 340 (49.1%) | 353 (50.9%) |
| Total | 6,491 (47.0%) | 7,328 (53.0%) |
Education in Marrero
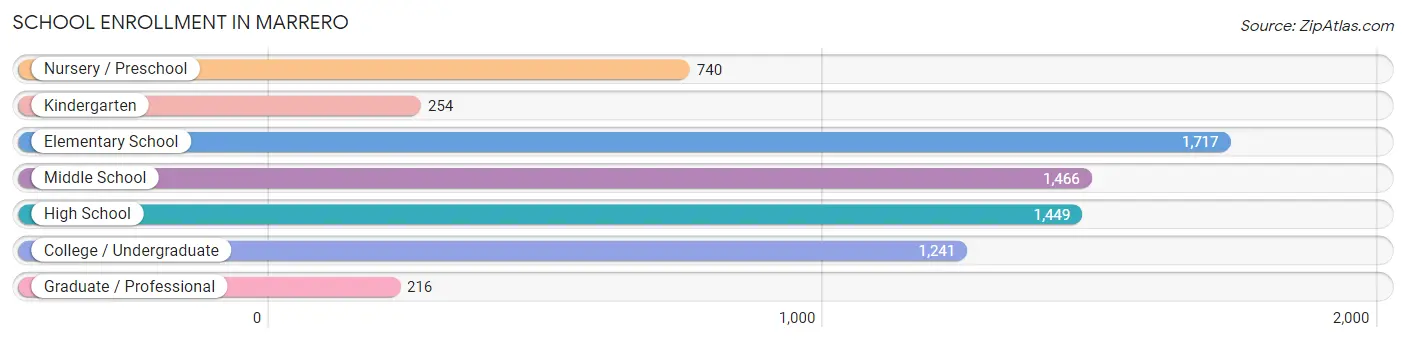
School Enrollment in Marrero
The most common levels of schooling among the 7,083 students in Marrero are elementary school (1,717 | 24.2%), middle school (1,466 | 20.7%), and high school (1,449 | 20.5%).
| School Level | # Students | % Students |
| Nursery / Preschool | 740 | 10.4% |
| Kindergarten | 254 | 3.6% |
| Elementary School | 1,717 | 24.2% |
| Middle School | 1,466 | 20.7% |
| High School | 1,449 | 20.5% |
| College / Undergraduate | 1,241 | 17.5% |
| Graduate / Professional | 216 | 3.0% |
| Total | 7,083 | 100.0% |
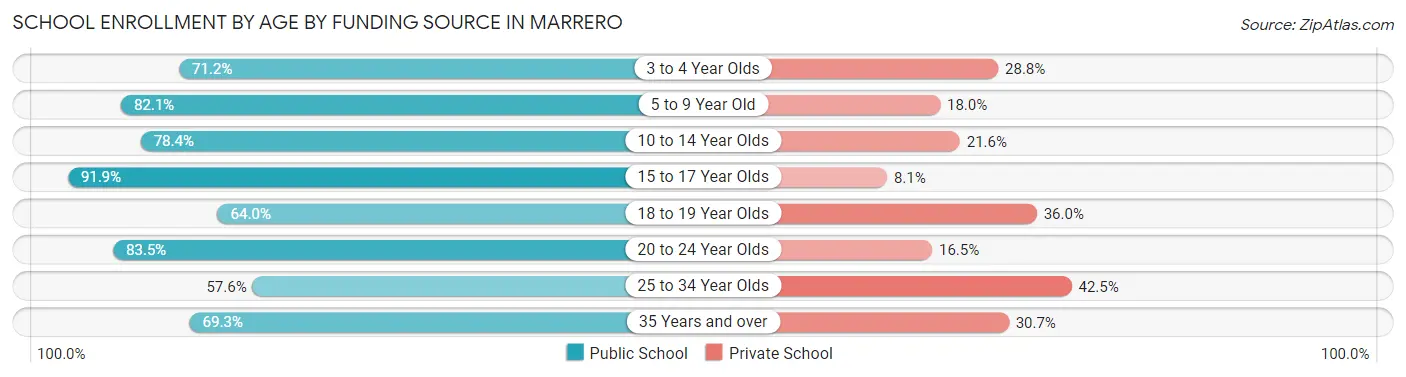
School Enrollment by Age by Funding Source in Marrero
Out of a total of 7,083 students who are enrolled in schools in Marrero, 1,530 (21.6%) attend a private institution, while the remaining 5,553 (78.4%) are enrolled in public schools. The age group of 25 to 34 year olds has the highest likelihood of being enrolled in private schools, with 177 (42.4% in the age bracket) enrolled. Conversely, the age group of 15 to 17 year olds has the lowest likelihood of being enrolled in a private school, with 821 (91.9% in the age bracket) attending a public institution.
| Age Bracket | Public School | Private School |
| 3 to 4 Year Olds | 463 (71.2%) | 187 (28.8%) |
| 5 to 9 Year Old | 1,582 (82.1%) | 346 (17.9%) |
| 10 to 14 Year Olds | 1,362 (78.4%) | 376 (21.6%) |
| 15 to 17 Year Olds | 821 (91.9%) | 72 (8.1%) |
| 18 to 19 Year Olds | 301 (64.0%) | 169 (36.0%) |
| 20 to 24 Year Olds | 599 (83.5%) | 118 (16.5%) |
| 25 to 34 Year Olds | 240 (57.6%) | 177 (42.4%) |
| 35 Years and over | 187 (69.3%) | 83 (30.7%) |
| Total | 5,553 (78.4%) | 1,530 (21.6%) |
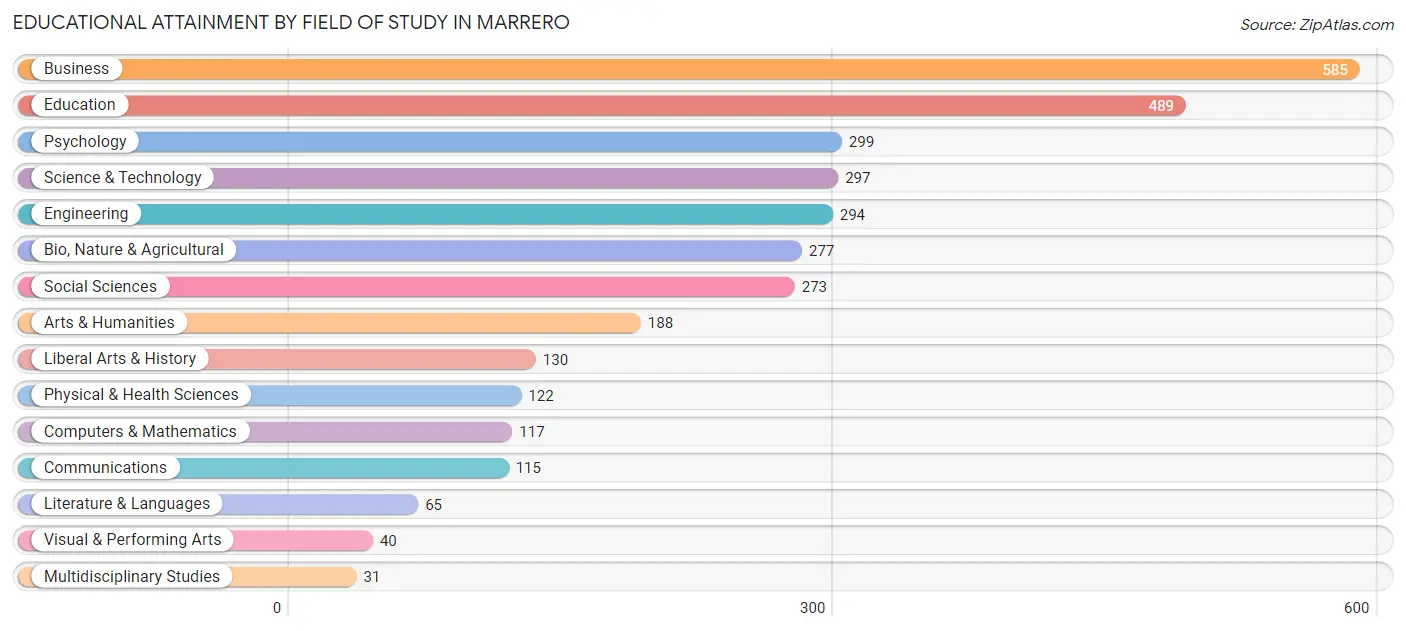
Educational Attainment by Field of Study in Marrero
Business (585 | 17.6%), education (489 | 14.7%), psychology (299 | 9.0%), science & technology (297 | 8.9%), and engineering (294 | 8.8%) are the most common fields of study among 3,322 individuals in Marrero who have obtained a bachelor's degree or higher.
| Field of Study | # Graduates | % Graduates |
| Computers & Mathematics | 117 | 3.5% |
| Bio, Nature & Agricultural | 277 | 8.3% |
| Physical & Health Sciences | 122 | 3.7% |
| Psychology | 299 | 9.0% |
| Social Sciences | 273 | 8.2% |
| Engineering | 294 | 8.8% |
| Multidisciplinary Studies | 31 | 0.9% |
| Science & Technology | 297 | 8.9% |
| Business | 585 | 17.6% |
| Education | 489 | 14.7% |
| Literature & Languages | 65 | 2.0% |
| Liberal Arts & History | 130 | 3.9% |
| Visual & Performing Arts | 40 | 1.2% |
| Communications | 115 | 3.5% |
| Arts & Humanities | 188 | 5.7% |
| Total | 3,322 | 100.0% |
Transportation & Commute in Marrero
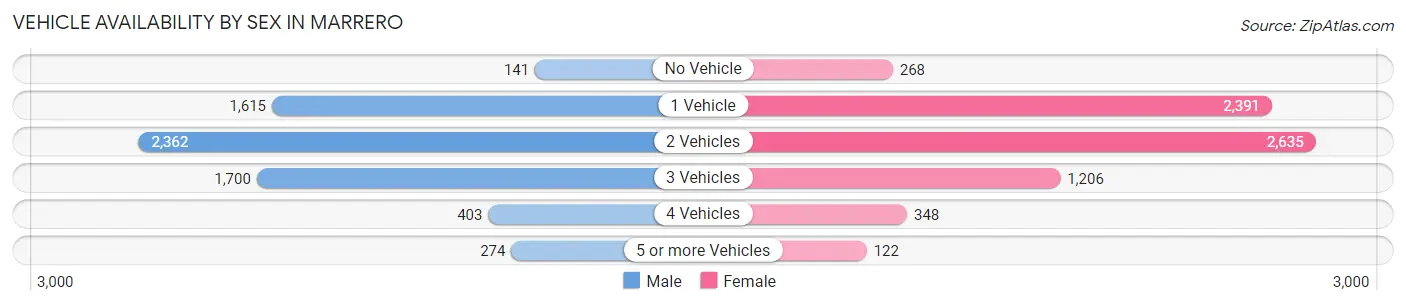
Vehicle Availability by Sex in Marrero
The most prevalent vehicle ownership categories in Marrero are males with 2 vehicles (2,362, accounting for 36.4%) and females with 2 vehicles (2,635, making up 33.9%).
| Vehicles Available | Male | Female |
| No Vehicle | 141 (2.2%) | 268 (3.8%) |
| 1 Vehicle | 1,615 (24.9%) | 2,391 (34.3%) |
| 2 Vehicles | 2,362 (36.4%) | 2,635 (37.8%) |
| 3 Vehicles | 1,700 (26.2%) | 1,206 (17.3%) |
| 4 Vehicles | 403 (6.2%) | 348 (5.0%) |
| 5 or more Vehicles | 274 (4.2%) | 122 (1.8%) |
| Total | 6,495 (100.0%) | 6,970 (100.0%) |
Commute Time in Marrero
The most frequently occuring commute durations in Marrero are 15 to 19 minutes (2,661 commuters, 20.4%), 20 to 24 minutes (2,114 commuters, 16.3%), and 30 to 34 minutes (1,722 commuters, 13.2%).
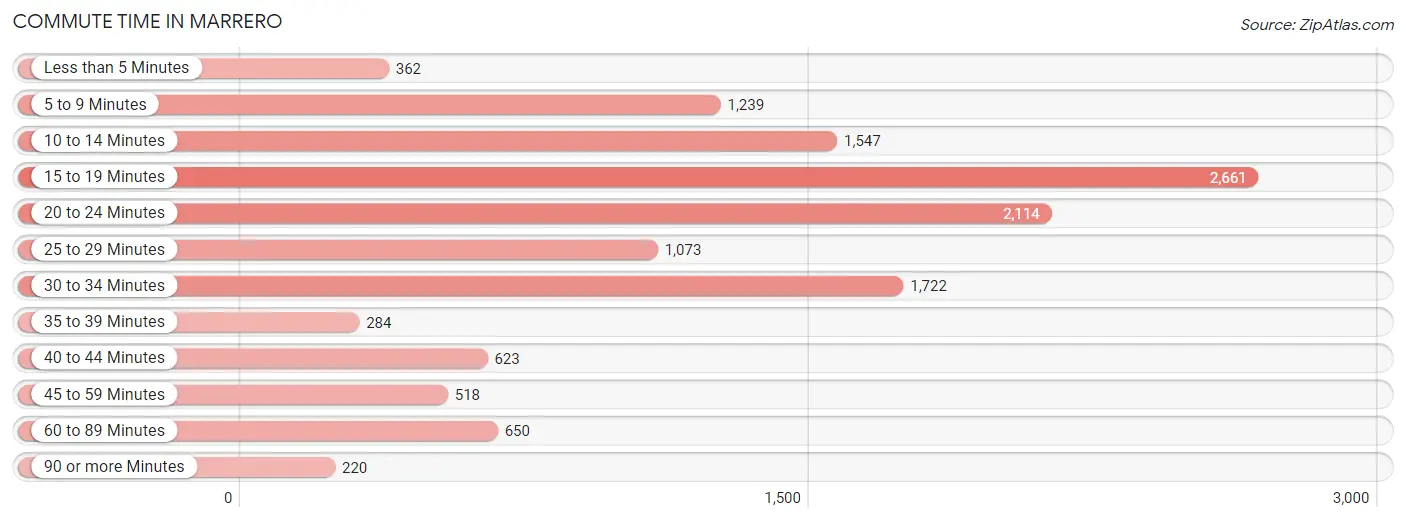
| Commute Time | # Commuters | % Commuters |
| Less than 5 Minutes | 362 | 2.8% |
| 5 to 9 Minutes | 1,239 | 9.5% |
| 10 to 14 Minutes | 1,547 | 11.9% |
| 15 to 19 Minutes | 2,661 | 20.4% |
| 20 to 24 Minutes | 2,114 | 16.3% |
| 25 to 29 Minutes | 1,073 | 8.3% |
| 30 to 34 Minutes | 1,722 | 13.2% |
| 35 to 39 Minutes | 284 | 2.2% |
| 40 to 44 Minutes | 623 | 4.8% |
| 45 to 59 Minutes | 518 | 4.0% |
| 60 to 89 Minutes | 650 | 5.0% |
| 90 or more Minutes | 220 | 1.7% |
Commute Time by Sex in Marrero
The most common commute times in Marrero are 15 to 19 minutes (1,274 commuters, 20.3%) for males and 15 to 19 minutes (1,387 commuters, 20.6%) for females.
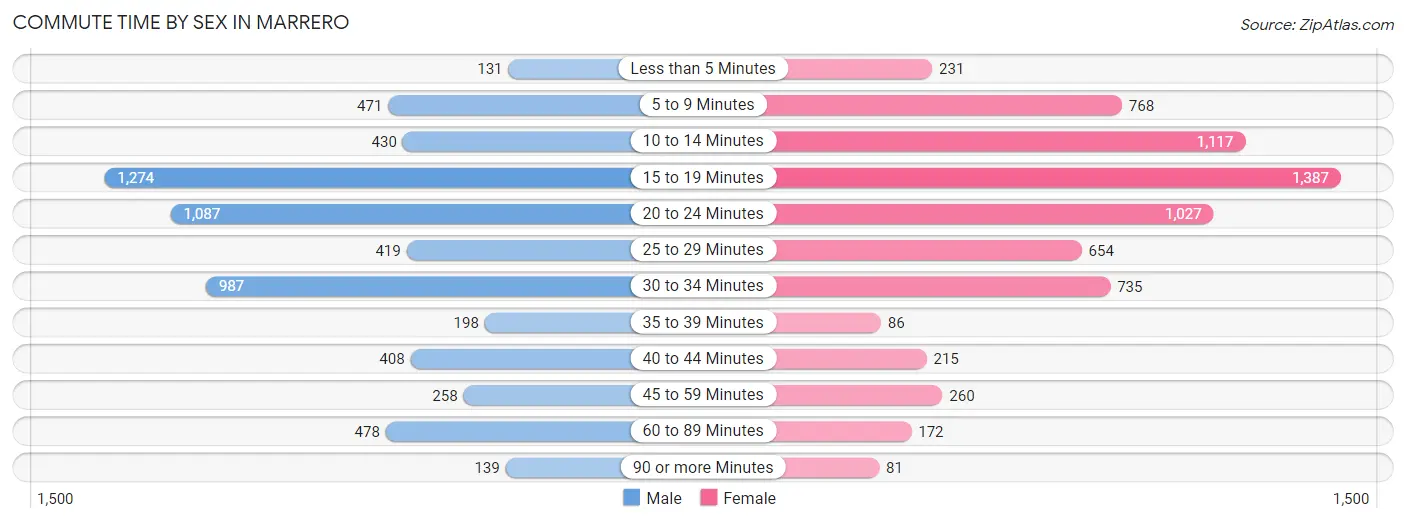
| Commute Time | Male | Female |
| Less than 5 Minutes | 131 (2.1%) | 231 (3.4%) |
| 5 to 9 Minutes | 471 (7.5%) | 768 (11.4%) |
| 10 to 14 Minutes | 430 (6.9%) | 1,117 (16.6%) |
| 15 to 19 Minutes | 1,274 (20.3%) | 1,387 (20.6%) |
| 20 to 24 Minutes | 1,087 (17.3%) | 1,027 (15.2%) |
| 25 to 29 Minutes | 419 (6.7%) | 654 (9.7%) |
| 30 to 34 Minutes | 987 (15.7%) | 735 (10.9%) |
| 35 to 39 Minutes | 198 (3.2%) | 86 (1.3%) |
| 40 to 44 Minutes | 408 (6.5%) | 215 (3.2%) |
| 45 to 59 Minutes | 258 (4.1%) | 260 (3.9%) |
| 60 to 89 Minutes | 478 (7.6%) | 172 (2.5%) |
| 90 or more Minutes | 139 (2.2%) | 81 (1.2%) |
Time of Departure to Work by Sex in Marrero
The most frequent times of departure to work in Marrero are 7:00 AM to 7:29 AM (1,048, 16.7%) for males and 7:00 AM to 7:29 AM (1,471, 21.8%) for females.
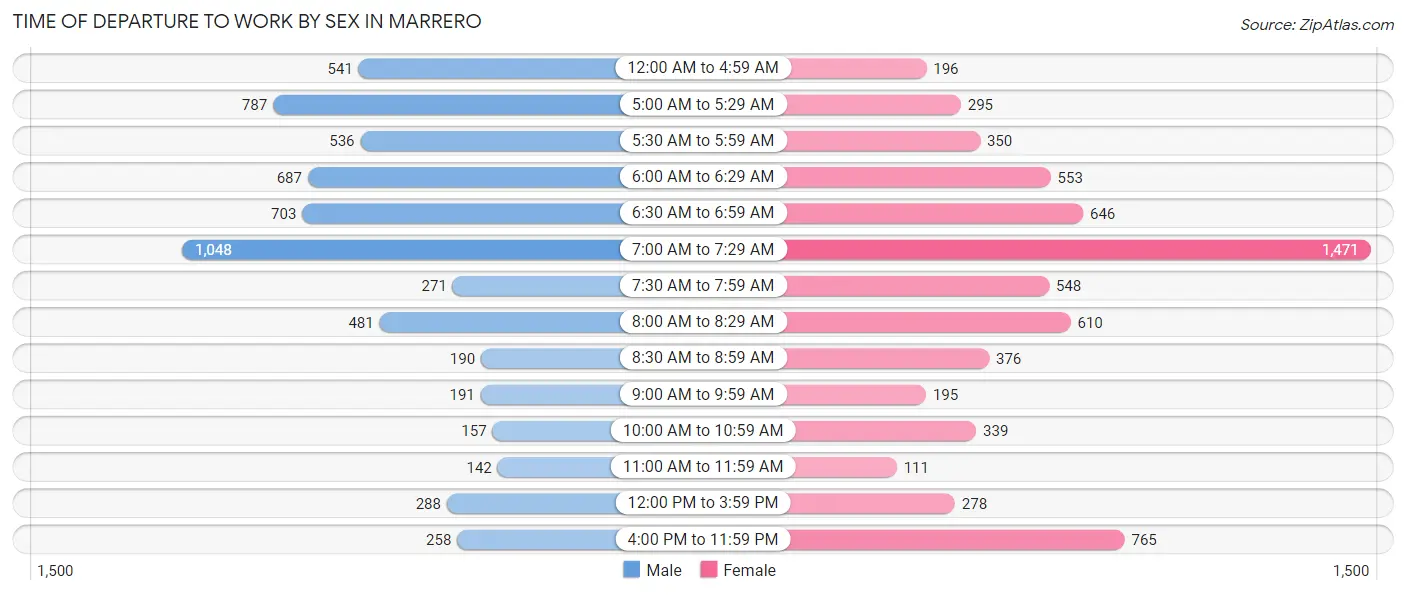
| Time of Departure | Male | Female |
| 12:00 AM to 4:59 AM | 541 (8.6%) | 196 (2.9%) |
| 5:00 AM to 5:29 AM | 787 (12.5%) | 295 (4.4%) |
| 5:30 AM to 5:59 AM | 536 (8.5%) | 350 (5.2%) |
| 6:00 AM to 6:29 AM | 687 (10.9%) | 553 (8.2%) |
| 6:30 AM to 6:59 AM | 703 (11.2%) | 646 (9.6%) |
| 7:00 AM to 7:29 AM | 1,048 (16.7%) | 1,471 (21.8%) |
| 7:30 AM to 7:59 AM | 271 (4.3%) | 548 (8.1%) |
| 8:00 AM to 8:29 AM | 481 (7.7%) | 610 (9.1%) |
| 8:30 AM to 8:59 AM | 190 (3.0%) | 376 (5.6%) |
| 9:00 AM to 9:59 AM | 191 (3.0%) | 195 (2.9%) |
| 10:00 AM to 10:59 AM | 157 (2.5%) | 339 (5.0%) |
| 11:00 AM to 11:59 AM | 142 (2.3%) | 111 (1.7%) |
| 12:00 PM to 3:59 PM | 288 (4.6%) | 278 (4.1%) |
| 4:00 PM to 11:59 PM | 258 (4.1%) | 765 (11.4%) |
| Total | 6,280 (100.0%) | 6,733 (100.0%) |
Housing Occupancy in Marrero
Occupancy by Ownership in Marrero
Of the total 12,595 dwellings in Marrero, owner-occupied units account for 8,543 (67.8%), while renter-occupied units make up 4,052 (32.2%).
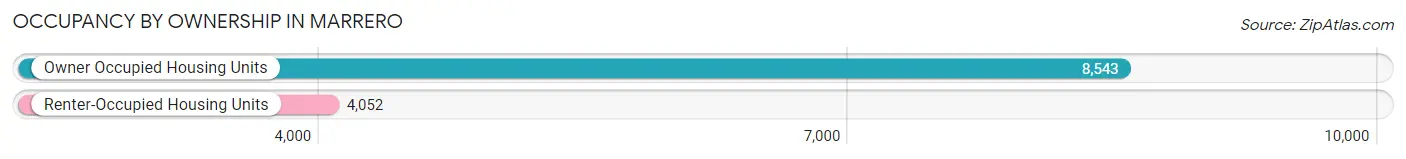
| Occupancy | # Housing Units | % Housing Units |
| Owner Occupied Housing Units | 8,543 | 67.8% |
| Renter-Occupied Housing Units | 4,052 | 32.2% |
| Total Occupied Housing Units | 12,595 | 100.0% |
Occupancy by Household Size in Marrero
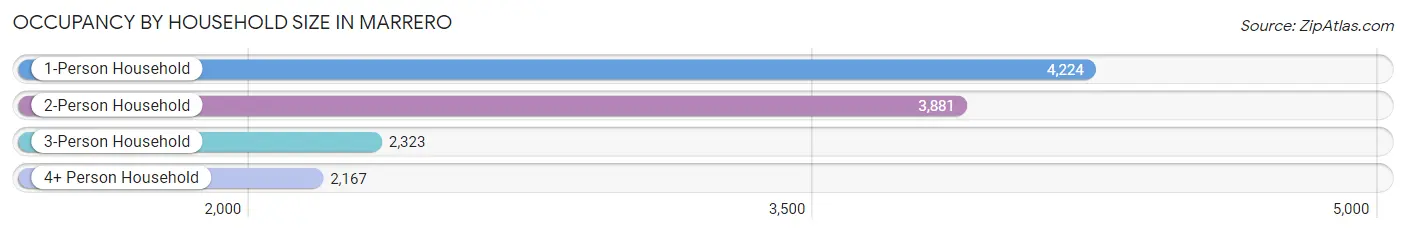
| Household Size | # Housing Units | % Housing Units |
| 1-Person Household | 4,224 | 33.5% |
| 2-Person Household | 3,881 | 30.8% |
| 3-Person Household | 2,323 | 18.4% |
| 4+ Person Household | 2,167 | 17.2% |
| Total Housing Units | 12,595 | 100.0% |
Occupancy by Ownership by Household Size in Marrero
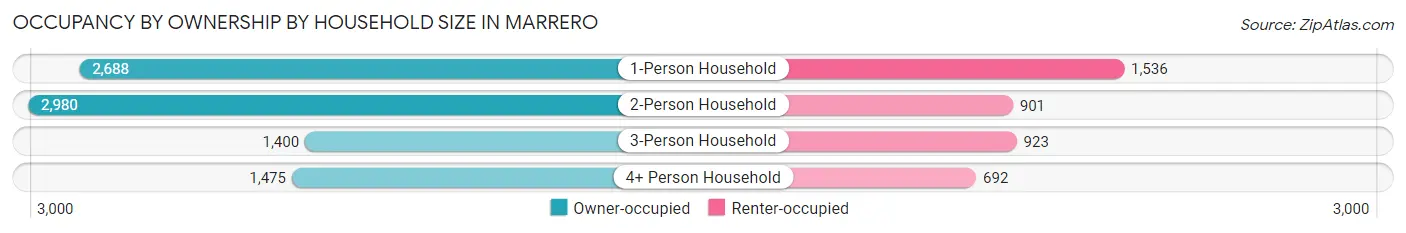
| Household Size | Owner-occupied | Renter-occupied |
| 1-Person Household | 2,688 (63.6%) | 1,536 (36.4%) |
| 2-Person Household | 2,980 (76.8%) | 901 (23.2%) |
| 3-Person Household | 1,400 (60.3%) | 923 (39.7%) |
| 4+ Person Household | 1,475 (68.1%) | 692 (31.9%) |
| Total Housing Units | 8,543 (67.8%) | 4,052 (32.2%) |
Occupancy by Educational Attainment in Marrero
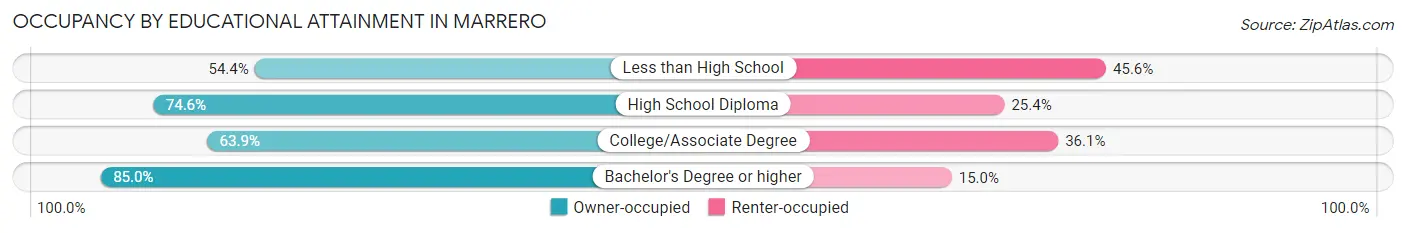
| Household Size | Owner-occupied | Renter-occupied |
| Less than High School | 1,443 (54.4%) | 1,209 (45.6%) |
| High School Diploma | 2,808 (74.6%) | 958 (25.4%) |
| College/Associate Degree | 2,903 (63.9%) | 1,640 (36.1%) |
| Bachelor's Degree or higher | 1,389 (85.0%) | 245 (15.0%) |
Occupancy by Age of Householder in Marrero
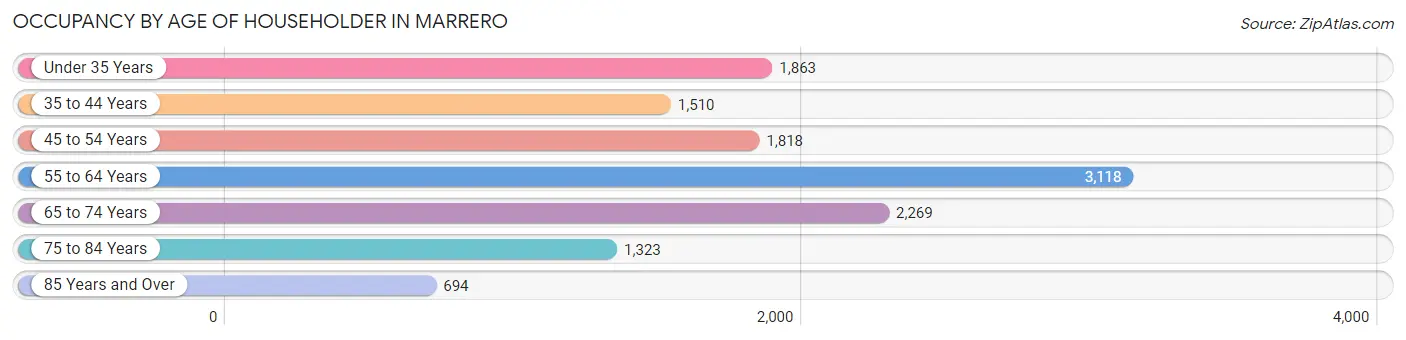
| Age Bracket | # Households | % Households |
| Under 35 Years | 1,863 | 14.8% |
| 35 to 44 Years | 1,510 | 12.0% |
| 45 to 54 Years | 1,818 | 14.4% |
| 55 to 64 Years | 3,118 | 24.8% |
| 65 to 74 Years | 2,269 | 18.0% |
| 75 to 84 Years | 1,323 | 10.5% |
| 85 Years and Over | 694 | 5.5% |
| Total | 12,595 | 100.0% |
Housing Finances in Marrero
Median Income by Occupancy in Marrero
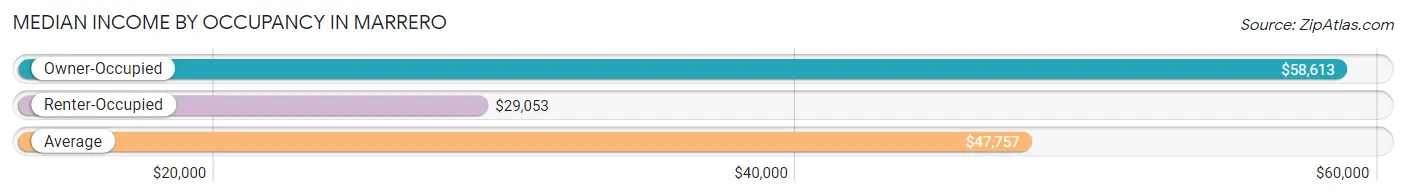
| Occupancy Type | # Households | Median Income |
| Owner-Occupied | 8,543 (67.8%) | $58,613 |
| Renter-Occupied | 4,052 (32.2%) | $29,053 |
| Average | 12,595 (100.0%) | $47,757 |
Occupancy by Householder Income Bracket in Marrero
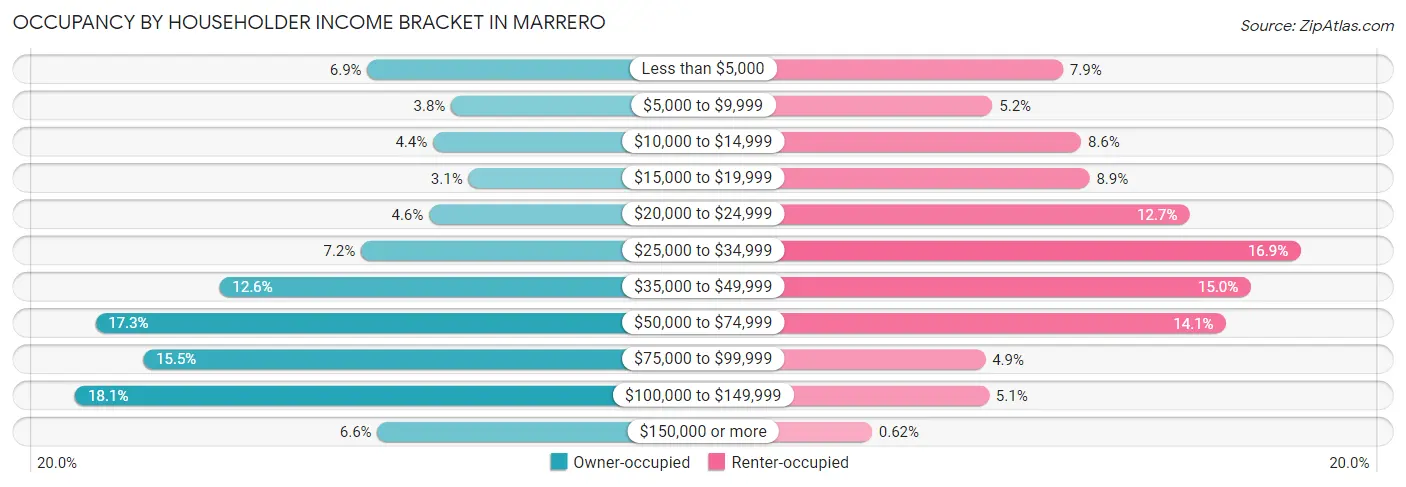
| Income Bracket | Owner-occupied | Renter-occupied |
| Less than $5,000 | 593 (6.9%) | 320 (7.9%) |
| $5,000 to $9,999 | 320 (3.7%) | 211 (5.2%) |
| $10,000 to $14,999 | 379 (4.4%) | 348 (8.6%) |
| $15,000 to $19,999 | 264 (3.1%) | 361 (8.9%) |
| $20,000 to $24,999 | 392 (4.6%) | 515 (12.7%) |
| $25,000 to $34,999 | 613 (7.2%) | 686 (16.9%) |
| $35,000 to $49,999 | 1,075 (12.6%) | 609 (15.0%) |
| $50,000 to $74,999 | 1,479 (17.3%) | 571 (14.1%) |
| $75,000 to $99,999 | 1,323 (15.5%) | 200 (4.9%) |
| $100,000 to $149,999 | 1,545 (18.1%) | 206 (5.1%) |
| $150,000 or more | 560 (6.6%) | 25 (0.6%) |
| Total | 8,543 (100.0%) | 4,052 (100.0%) |
Monthly Housing Cost Tiers in Marrero
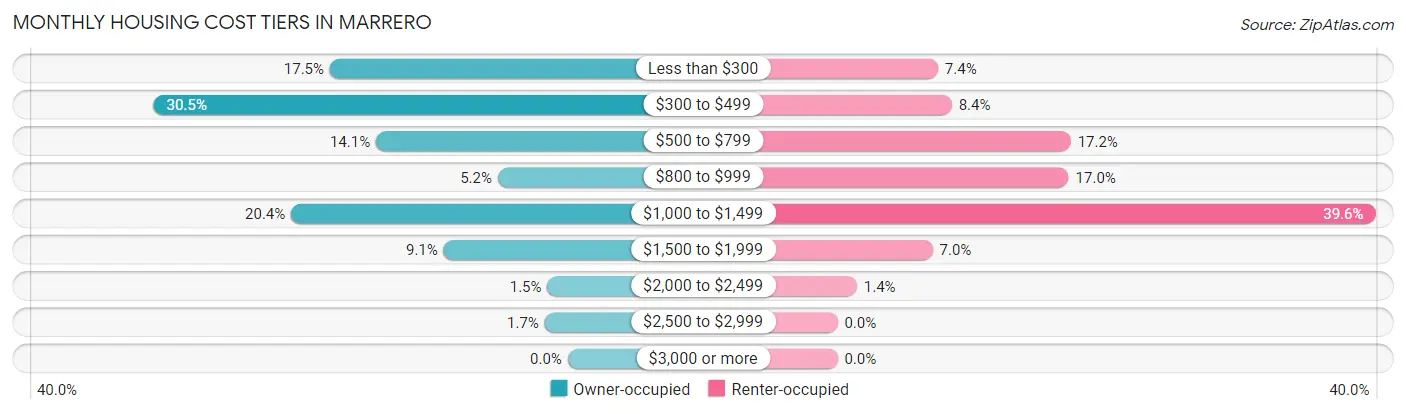
| Monthly Cost | Owner-occupied | Renter-occupied |
| Less than $300 | 1,497 (17.5%) | 300 (7.4%) |
| $300 to $499 | 2,606 (30.5%) | 341 (8.4%) |
| $500 to $799 | 1,206 (14.1%) | 696 (17.2%) |
| $800 to $999 | 440 (5.1%) | 690 (17.0%) |
| $1,000 to $1,499 | 1,740 (20.4%) | 1,605 (39.6%) |
| $1,500 to $1,999 | 781 (9.1%) | 284 (7.0%) |
| $2,000 to $2,499 | 128 (1.5%) | 58 (1.4%) |
| $2,500 to $2,999 | 145 (1.7%) | 0 (0.0%) |
| $3,000 or more | 0 (0.0%) | 0 (0.0%) |
| Total | 8,543 (100.0%) | 4,052 (100.0%) |
Physical Housing Characteristics in Marrero
Housing Structures in Marrero
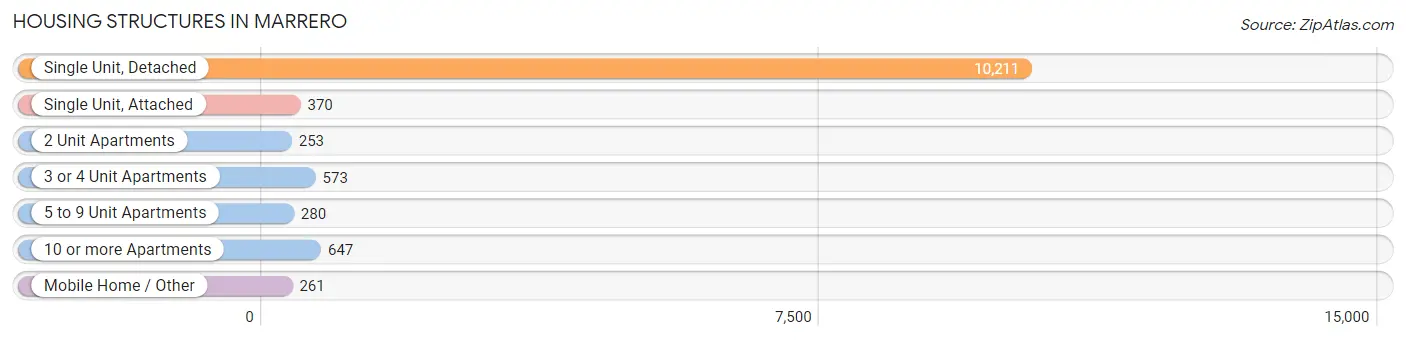
| Structure Type | # Housing Units | % Housing Units |
| Single Unit, Detached | 10,211 | 81.1% |
| Single Unit, Attached | 370 | 2.9% |
| 2 Unit Apartments | 253 | 2.0% |
| 3 or 4 Unit Apartments | 573 | 4.5% |
| 5 to 9 Unit Apartments | 280 | 2.2% |
| 10 or more Apartments | 647 | 5.1% |
| Mobile Home / Other | 261 | 2.1% |
| Total | 12,595 | 100.0% |
Housing Structures by Occupancy in Marrero
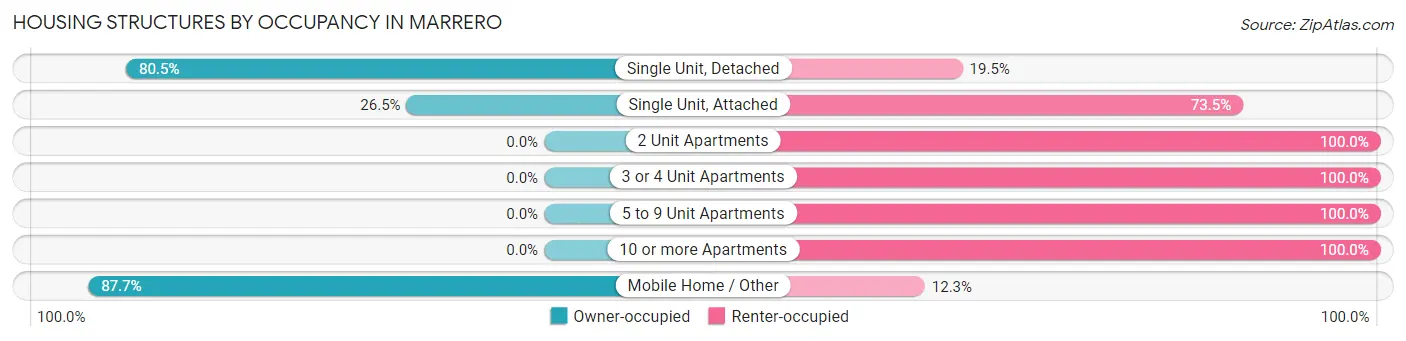
| Structure Type | Owner-occupied | Renter-occupied |
| Single Unit, Detached | 8,216 (80.5%) | 1,995 (19.5%) |
| Single Unit, Attached | 98 (26.5%) | 272 (73.5%) |
| 2 Unit Apartments | 0 (0.0%) | 253 (100.0%) |
| 3 or 4 Unit Apartments | 0 (0.0%) | 573 (100.0%) |
| 5 to 9 Unit Apartments | 0 (0.0%) | 280 (100.0%) |
| 10 or more Apartments | 0 (0.0%) | 647 (100.0%) |
| Mobile Home / Other | 229 (87.7%) | 32 (12.3%) |
| Total | 8,543 (67.8%) | 4,052 (32.2%) |
Housing Structures by Number of Rooms in Marrero
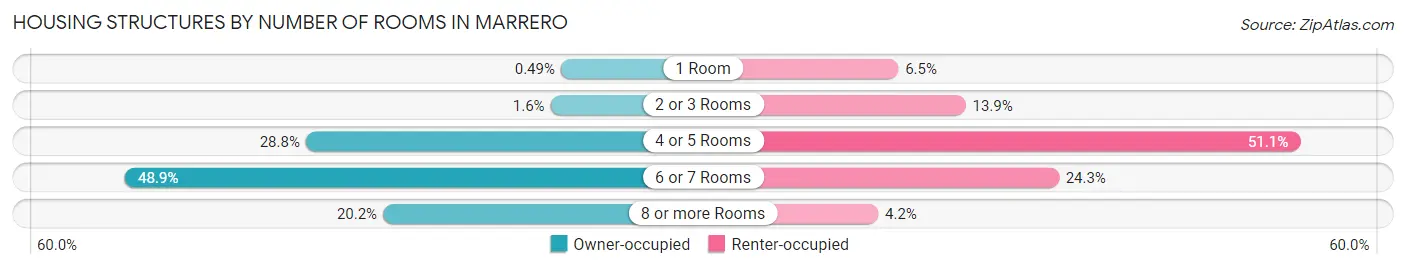
| Number of Rooms | Owner-occupied | Renter-occupied |
| 1 Room | 42 (0.5%) | 262 (6.5%) |
| 2 or 3 Rooms | 140 (1.6%) | 565 (13.9%) |
| 4 or 5 Rooms | 2,460 (28.8%) | 2,069 (51.1%) |
| 6 or 7 Rooms | 4,173 (48.8%) | 984 (24.3%) |
| 8 or more Rooms | 1,728 (20.2%) | 172 (4.2%) |
| Total | 8,543 (100.0%) | 4,052 (100.0%) |
Housing Structure by Heating Type in Marrero
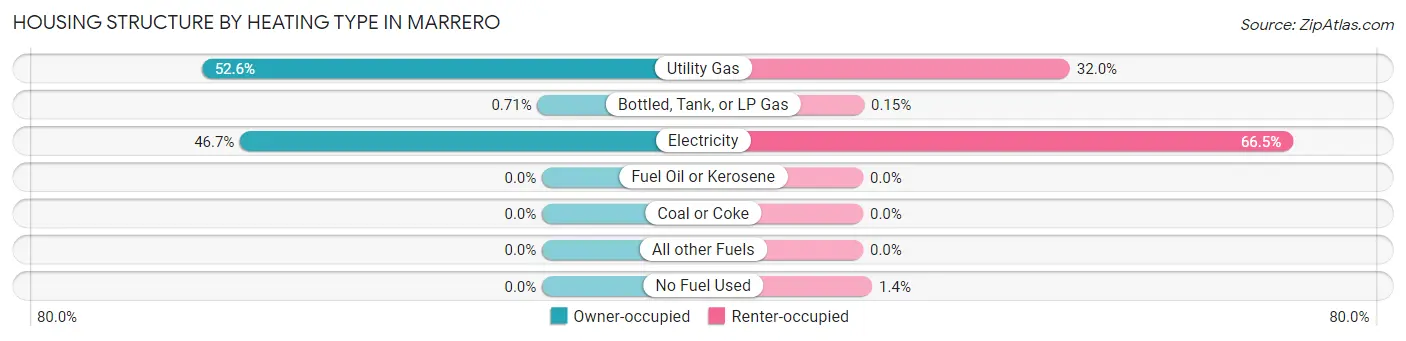
| Heating Type | Owner-occupied | Renter-occupied |
| Utility Gas | 4,495 (52.6%) | 1,296 (32.0%) |
| Bottled, Tank, or LP Gas | 61 (0.7%) | 6 (0.2%) |
| Electricity | 3,987 (46.7%) | 2,693 (66.5%) |
| Fuel Oil or Kerosene | 0 (0.0%) | 0 (0.0%) |
| Coal or Coke | 0 (0.0%) | 0 (0.0%) |
| All other Fuels | 0 (0.0%) | 0 (0.0%) |
| No Fuel Used | 0 (0.0%) | 57 (1.4%) |
| Total | 8,543 (100.0%) | 4,052 (100.0%) |
Household Vehicle Usage in Marrero
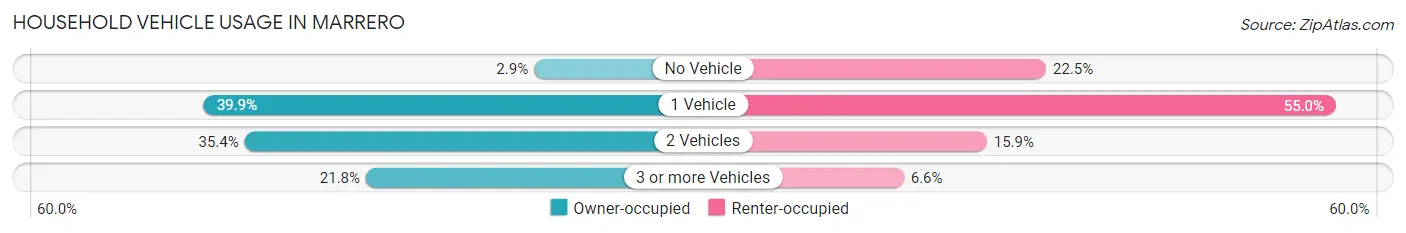
| Vehicles per Household | Owner-occupied | Renter-occupied |
| No Vehicle | 251 (2.9%) | 913 (22.5%) |
| 1 Vehicle | 3,411 (39.9%) | 2,228 (55.0%) |
| 2 Vehicles | 3,021 (35.4%) | 644 (15.9%) |
| 3 or more Vehicles | 1,860 (21.8%) | 267 (6.6%) |
| Total | 8,543 (100.0%) | 4,052 (100.0%) |
Real Estate & Mortgages in Marrero
Real Estate and Mortgage Overview in Marrero
| Characteristic | Without Mortgage | With Mortgage |
| Housing Units | 5,189 | 3,354 |
| Median Property Value | $156,400 | $176,100 |
| Median Household Income | $49,848 | $246 |
| Monthly Housing Costs | $372 | $0 |
| Real Estate Taxes | $479 | $405 |
Property Value by Mortgage Status in Marrero
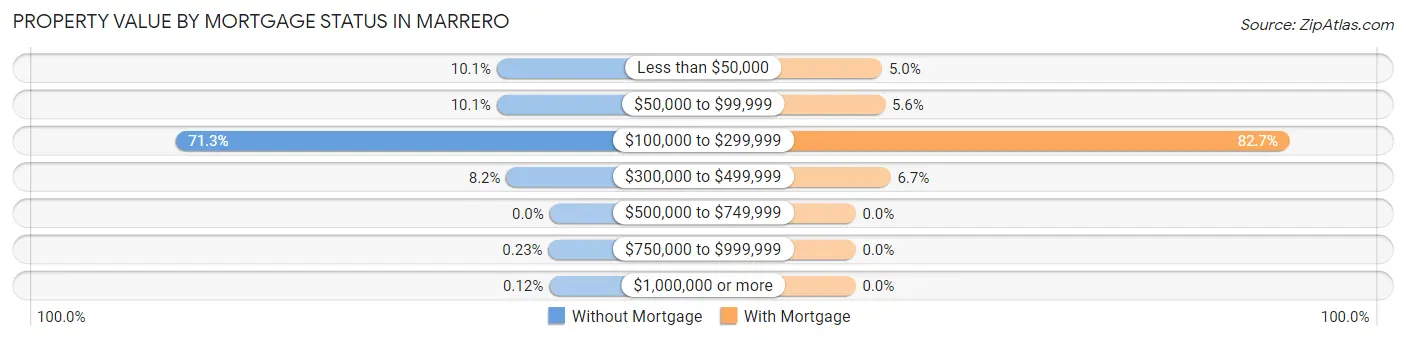
| Property Value | Without Mortgage | With Mortgage |
| Less than $50,000 | 522 (10.1%) | 169 (5.0%) |
| $50,000 to $99,999 | 523 (10.1%) | 188 (5.6%) |
| $100,000 to $299,999 | 3,699 (71.3%) | 2,774 (82.7%) |
| $300,000 to $499,999 | 427 (8.2%) | 223 (6.7%) |
| $500,000 to $749,999 | 0 (0.0%) | 0 (0.0%) |
| $750,000 to $999,999 | 12 (0.2%) | 0 (0.0%) |
| $1,000,000 or more | 6 (0.1%) | 0 (0.0%) |
| Total | 5,189 (100.0%) | 3,354 (100.0%) |
Household Income by Mortgage Status in Marrero
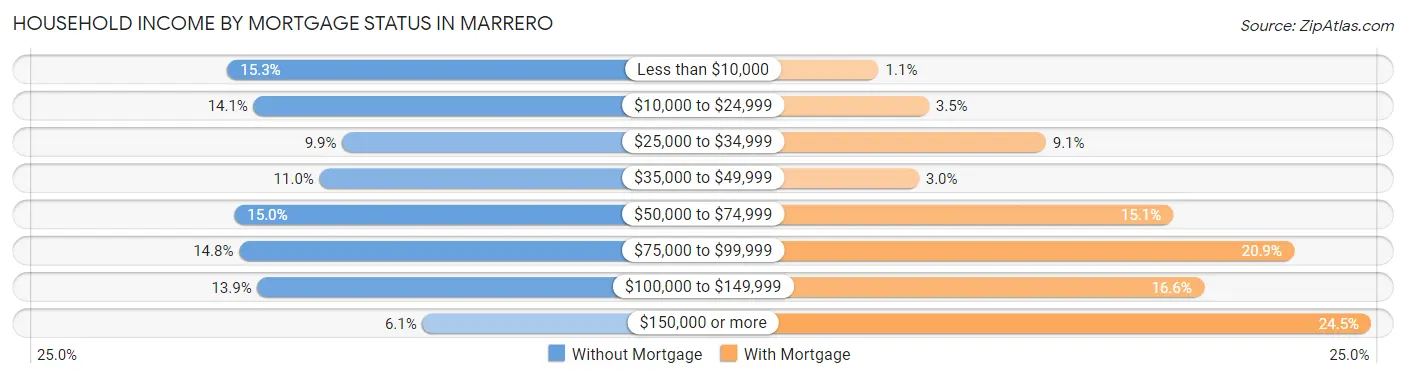
| Household Income | Without Mortgage | With Mortgage |
| Less than $10,000 | 796 (15.3%) | 37 (1.1%) |
| $10,000 to $24,999 | 731 (14.1%) | 117 (3.5%) |
| $25,000 to $34,999 | 512 (9.9%) | 304 (9.1%) |
| $35,000 to $49,999 | 568 (11.0%) | 101 (3.0%) |
| $50,000 to $74,999 | 779 (15.0%) | 507 (15.1%) |
| $75,000 to $99,999 | 767 (14.8%) | 700 (20.9%) |
| $100,000 to $149,999 | 722 (13.9%) | 556 (16.6%) |
| $150,000 or more | 314 (6.0%) | 823 (24.5%) |
| Total | 5,189 (100.0%) | 3,354 (100.0%) |
Property Value to Household Income Ratio in Marrero
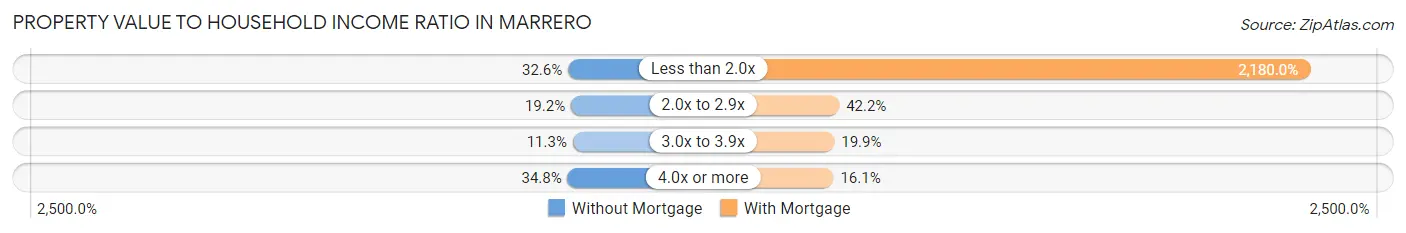
| Value-to-Income Ratio | Without Mortgage | With Mortgage |
| Less than 2.0x | 1,690 (32.6%) | 73,116 (2,180.0%) |
| 2.0x to 2.9x | 998 (19.2%) | 1,414 (42.2%) |
| 3.0x to 3.9x | 585 (11.3%) | 668 (19.9%) |
| 4.0x or more | 1,804 (34.8%) | 541 (16.1%) |
| Total | 5,189 (100.0%) | 3,354 (100.0%) |
Real Estate Taxes by Mortgage Status in Marrero
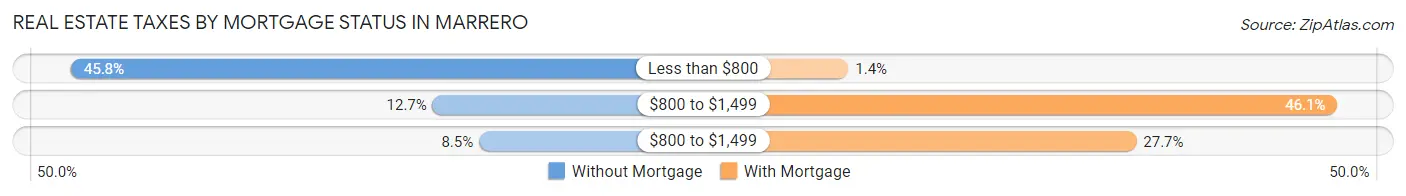
| Property Taxes | Without Mortgage | With Mortgage |
| Less than $800 | 2,375 (45.8%) | 47 (1.4%) |
| $800 to $1,499 | 661 (12.7%) | 1,545 (46.1%) |
| $800 to $1,499 | 441 (8.5%) | 929 (27.7%) |
| Total | 5,189 (100.0%) | 3,354 (100.0%) |
Health & Disability in Marrero
Health Insurance Coverage by Age in Marrero
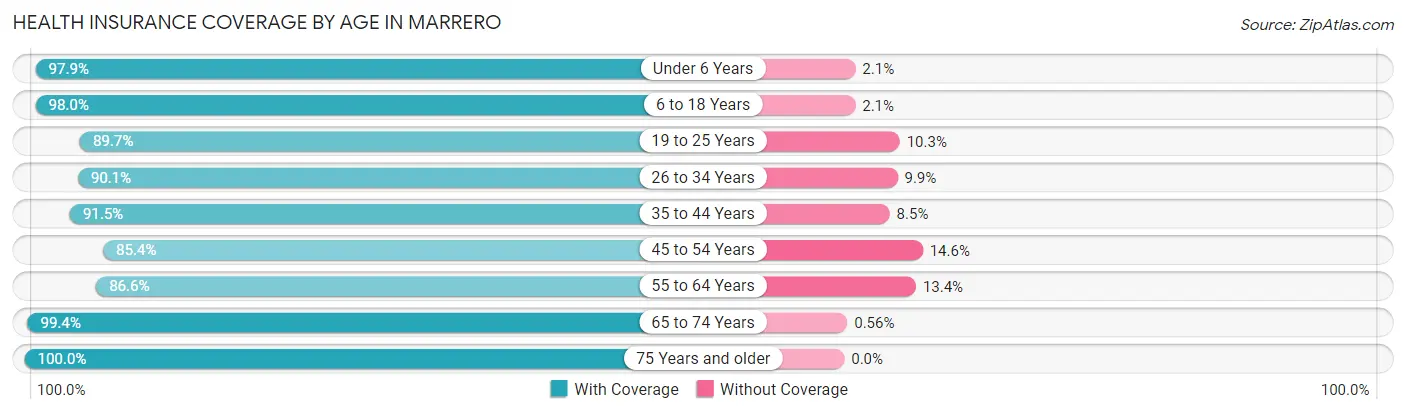
| Age Bracket | With Coverage | Without Coverage |
| Under 6 Years | 2,125 (97.9%) | 45 (2.1%) |
| 6 to 18 Years | 4,721 (98.0%) | 99 (2.1%) |
| 19 to 25 Years | 2,793 (89.7%) | 322 (10.3%) |
| 26 to 34 Years | 3,111 (90.1%) | 343 (9.9%) |
| 35 to 44 Years | 2,966 (91.5%) | 274 (8.5%) |
| 45 to 54 Years | 3,245 (85.4%) | 556 (14.6%) |
| 55 to 64 Years | 4,207 (86.6%) | 649 (13.4%) |
| 65 to 74 Years | 3,743 (99.4%) | 21 (0.6%) |
| 75 Years and older | 2,517 (100.0%) | 0 (0.0%) |
| Total | 29,428 (92.7%) | 2,309 (7.3%) |
Health Insurance Coverage by Citizenship Status in Marrero
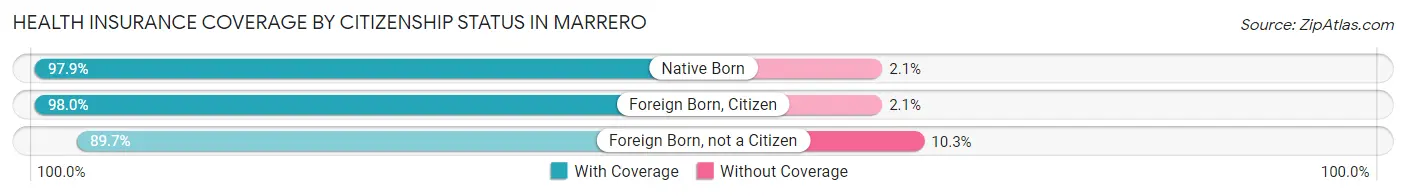
| Citizenship Status | With Coverage | Without Coverage |
| Native Born | 2,125 (97.9%) | 45 (2.1%) |
| Foreign Born, Citizen | 4,721 (98.0%) | 99 (2.1%) |
| Foreign Born, not a Citizen | 2,793 (89.7%) | 322 (10.3%) |
Health Insurance Coverage by Household Income in Marrero
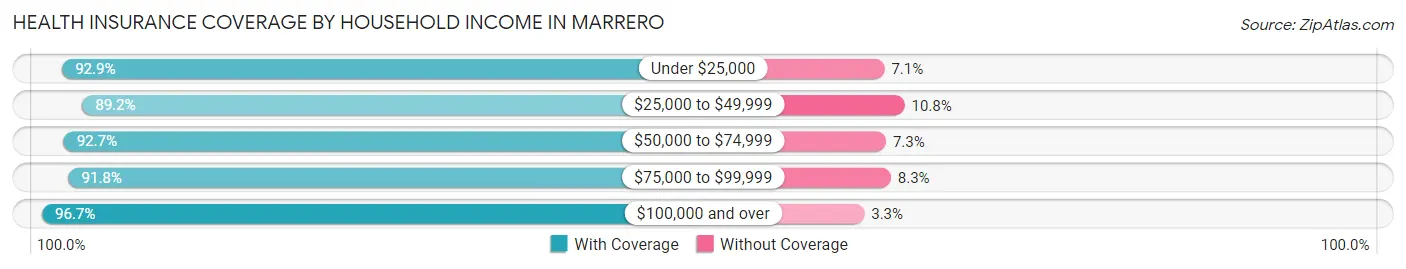
| Household Income | With Coverage | Without Coverage |
| Under $25,000 | 6,214 (92.9%) | 472 (7.1%) |
| $25,000 to $49,999 | 6,586 (89.2%) | 799 (10.8%) |
| $50,000 to $74,999 | 4,950 (92.7%) | 392 (7.3%) |
| $75,000 to $99,999 | 4,471 (91.7%) | 402 (8.3%) |
| $100,000 and over | 7,193 (96.7%) | 244 (3.3%) |
Public vs Private Health Insurance Coverage by Age in Marrero
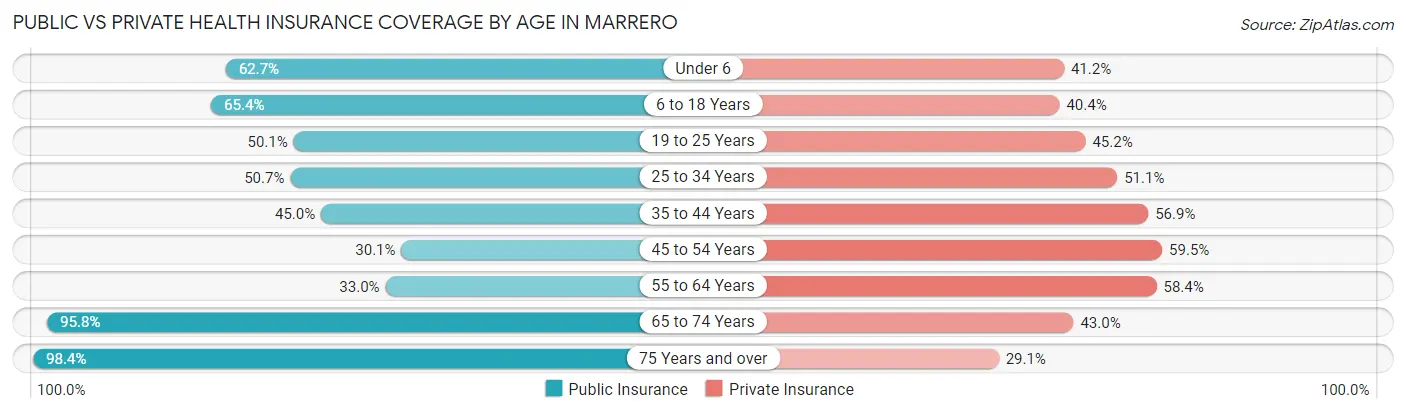
| Age Bracket | Public Insurance | Private Insurance |
| Under 6 | 1,360 (62.7%) | 895 (41.2%) |
| 6 to 18 Years | 3,151 (65.4%) | 1,948 (40.4%) |
| 19 to 25 Years | 1,560 (50.1%) | 1,409 (45.2%) |
| 25 to 34 Years | 1,751 (50.7%) | 1,766 (51.1%) |
| 35 to 44 Years | 1,457 (45.0%) | 1,843 (56.9%) |
| 45 to 54 Years | 1,143 (30.1%) | 2,260 (59.5%) |
| 55 to 64 Years | 1,604 (33.0%) | 2,837 (58.4%) |
| 65 to 74 Years | 3,607 (95.8%) | 1,619 (43.0%) |
| 75 Years and over | 2,477 (98.4%) | 733 (29.1%) |
| Total | 18,110 (57.1%) | 15,310 (48.2%) |
Disability Status by Sex by Age in Marrero
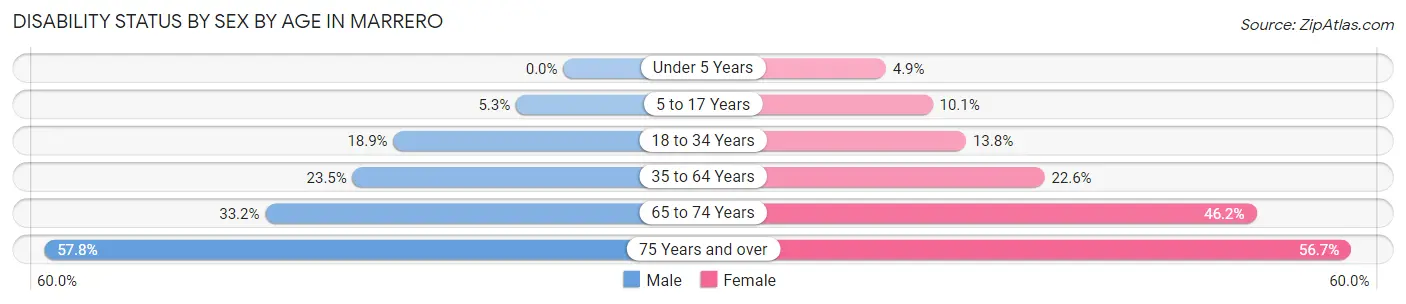
| Age Bracket | Male | Female |
| Under 5 Years | 0 (0.0%) | 36 (4.9%) |
| 5 to 17 Years | 118 (5.3%) | 258 (10.1%) |
| 18 to 34 Years | 666 (18.9%) | 474 (13.8%) |
| 35 to 64 Years | 1,299 (23.5%) | 1,436 (22.6%) |
| 65 to 74 Years | 449 (33.2%) | 1,113 (46.2%) |
| 75 Years and over | 559 (57.8%) | 879 (56.7%) |
Disability Class by Sex by Age in Marrero
Disability Class: Hearing Difficulty
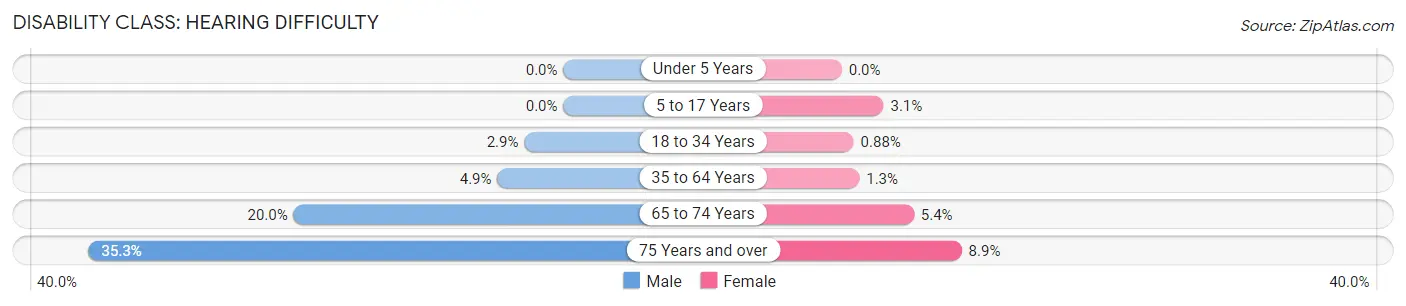
| Age Bracket | Male | Female |
| Under 5 Years | 0 (0.0%) | 0 (0.0%) |
| 5 to 17 Years | 0 (0.0%) | 79 (3.1%) |
| 18 to 34 Years | 102 (2.9%) | 30 (0.9%) |
| 35 to 64 Years | 271 (4.9%) | 83 (1.3%) |
| 65 to 74 Years | 271 (20.0%) | 129 (5.3%) |
| 75 Years and over | 341 (35.3%) | 138 (8.9%) |
Disability Class: Vision Difficulty
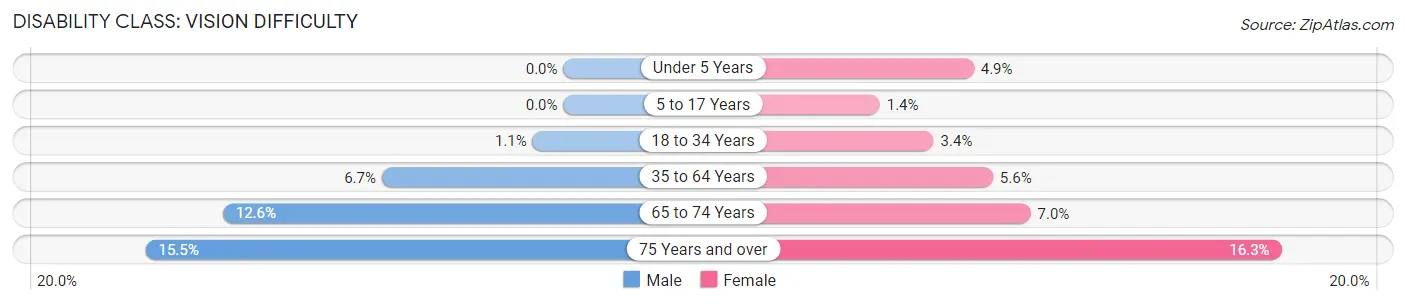
| Age Bracket | Male | Female |
| Under 5 Years | 0 (0.0%) | 36 (4.9%) |
| 5 to 17 Years | 0 (0.0%) | 36 (1.4%) |
| 18 to 34 Years | 40 (1.1%) | 117 (3.4%) |
| 35 to 64 Years | 373 (6.7%) | 357 (5.6%) |
| 65 to 74 Years | 171 (12.6%) | 169 (7.0%) |
| 75 Years and over | 150 (15.5%) | 253 (16.3%) |
Disability Class: Cognitive Difficulty
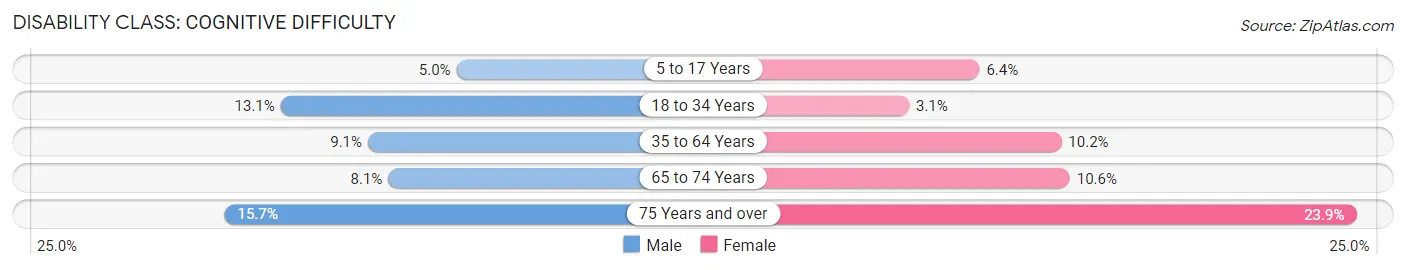
| Age Bracket | Male | Female |
| 5 to 17 Years | 111 (5.0%) | 163 (6.4%) |
| 18 to 34 Years | 462 (13.1%) | 107 (3.1%) |
| 35 to 64 Years | 502 (9.1%) | 648 (10.2%) |
| 65 to 74 Years | 110 (8.1%) | 255 (10.6%) |
| 75 Years and over | 152 (15.7%) | 370 (23.9%) |
Disability Class: Ambulatory Difficulty
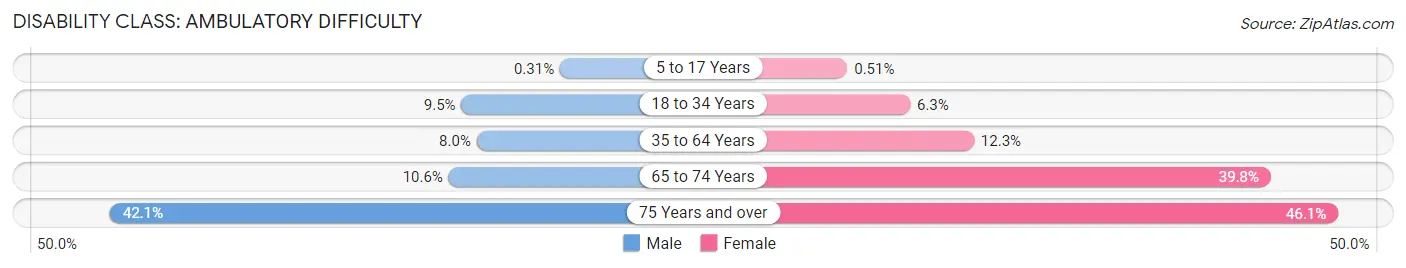
| Age Bracket | Male | Female |
| 5 to 17 Years | 7 (0.3%) | 13 (0.5%) |
| 18 to 34 Years | 333 (9.5%) | 217 (6.3%) |
| 35 to 64 Years | 445 (8.0%) | 780 (12.3%) |
| 65 to 74 Years | 144 (10.6%) | 960 (39.8%) |
| 75 Years and over | 407 (42.1%) | 714 (46.1%) |
Disability Class: Self-Care Difficulty
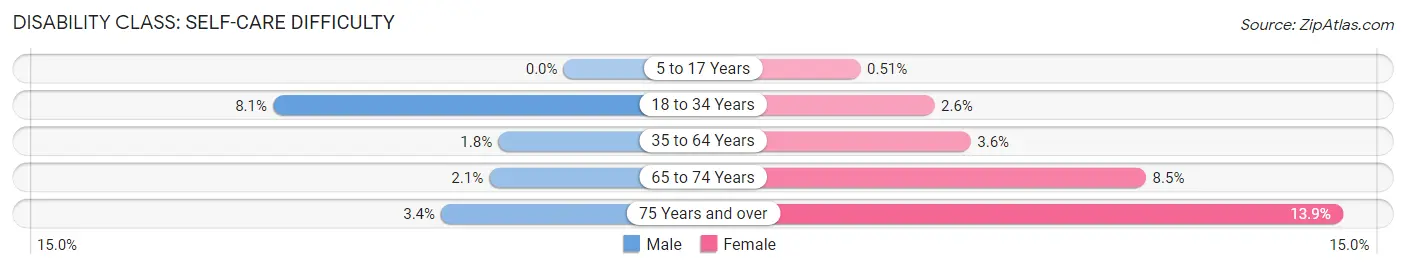
| Age Bracket | Male | Female |
| 5 to 17 Years | 0 (0.0%) | 13 (0.5%) |
| 18 to 34 Years | 285 (8.1%) | 88 (2.6%) |
| 35 to 64 Years | 101 (1.8%) | 228 (3.6%) |
| 65 to 74 Years | 28 (2.1%) | 204 (8.5%) |
| 75 Years and over | 33 (3.4%) | 216 (13.9%) |
Technology Access in Marrero
Computing Device Access in Marrero
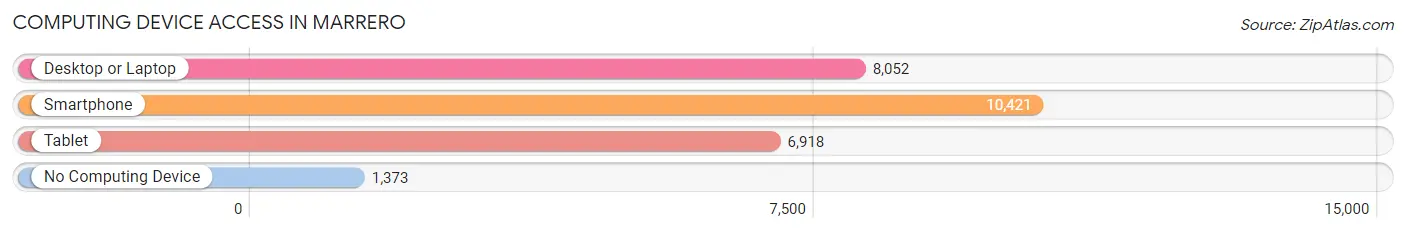
| Device Type | # Households | % Households |
| Desktop or Laptop | 8,052 | 63.9% |
| Smartphone | 10,421 | 82.7% |
| Tablet | 6,918 | 54.9% |
| No Computing Device | 1,373 | 10.9% |
| Total | 12,595 | 100.0% |
Internet Access in Marrero
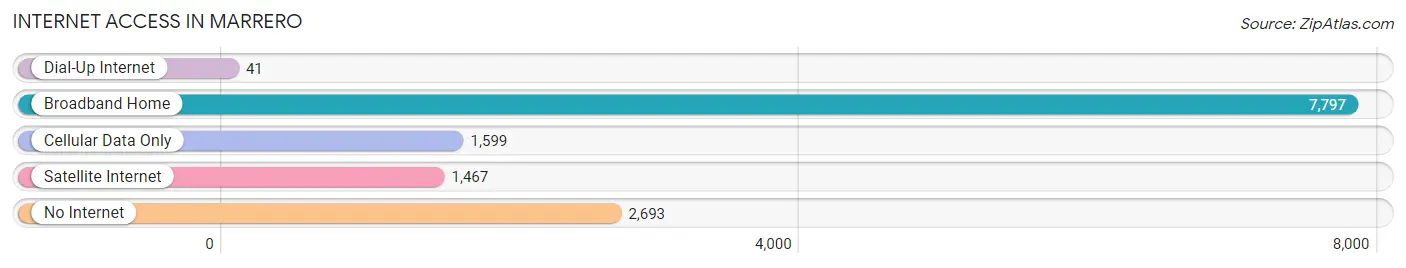
| Internet Type | # Households | % Households |
| Dial-Up Internet | 41 | 0.3% |
| Broadband Home | 7,797 | 61.9% |
| Cellular Data Only | 1,599 | 12.7% |
| Satellite Internet | 1,467 | 11.7% |
| No Internet | 2,693 | 21.4% |
| Total | 12,595 | 100.0% |
Marrero Summary
Marrero is a census-designated place (CDP) located in Jefferson Parish, Louisiana, United States. It is part of the New Orleans–Metairie–Kenner Metropolitan Statistical Area. The population was 33,141 at the 2010 census.
History
Marrero was founded in 1887 by Louis Marrero, a Spanish immigrant who had come to the area from Cuba. He purchased a large tract of land and began to develop it as a sugar plantation. The town was named after him and was incorporated in 1913.
Marrero was a rural community until the 1950s, when the construction of the Westbank Expressway (now known as the Westbank Expressway) and the Huey P. Long Bridge made it easier for people to commute to New Orleans. This led to an influx of people and businesses to the area, transforming it into a suburban community.
Geography
Marrero is located at 29°54'25" North, 90°09'45" West (29.906833, -90.1625). According to the United States Census Bureau, the CDP has a total area of 8.3 square miles (21.5 km2), of which 8.2 square miles (21.3 km2) is land and 0.1 square miles (0.2 km2) (1.17%) is water.
Economy
Marrero’s economy is largely based on the service industry, with many residents employed in retail, hospitality, and healthcare. The area is also home to a number of manufacturing and industrial businesses, including a large oil refinery.
Demographics
As of the 2010 census, there were 33,141 people, 11,945 households, and 8,717 families residing in the CDP. The population density was 4,039.3 people per square mile (1,561.2/km2). There were 12,845 housing units at an average density of 1,564.3 per square mile (604.3/km2). The racial makeup of the CDP was 57.2% White, 33.7% African American, 0.4% Native American, 1.3% Asian, 0.1% Pacific Islander, 5.2% from other races, and 2.1% from two or more races. Hispanic or Latino of any race were 11.7% of the population.
There were 11,945 households, out of which 36.2% had children under the age of 18 living with them, 44.2% were married couples living together, 20.2% had a female householder with no husband present, and 29.2% were non-families. 24.2% of all households were made up of individuals, and 8.2% had someone living alone who was 65 years of age or older. The average household size was 2.75 and the average family size was 3.27.
In the CDP, the population was spread out, with 28.2% under the age of 18, 10.2% from 18 to 24, 28.7% from 25 to 44, 21.7% from 45 to 64, and 11.2% who were 65 years of age or older. The median age was 33 years. For every 100 females, there were 93.2 males. For every 100 females age 18 and over, there were 89.3 males.
The median income for a household in the CDP was $35,945, and the median income for a family was $41,845. Males had a median income of $35,945 versus $25,945 for females. The per capita income for the CDP was $16,945. About 14.2% of families and 17.2% of the population were below the poverty line, including 24.2% of those under age 18 and 11.2% of those age 65 or over.
Common Questions
What is Per Capita Income in Marrero?
Per Capita income in Marrero is $25,731.
What is the Median Family Income in Marrero?
Median Family Income in Marrero is $59,214.
What is the Median Household income in Marrero?
Median Household Income in Marrero is $47,757.
What is Income or Wage Gap in Marrero?
Income or Wage Gap in Marrero is 22.0%.
Women in Marrero earn 78.0 cents for every dollar earned by a man.
What is Family Income Deficit in Marrero?
Family Income Deficit in Marrero is $10,582.
Families that are below poverty line in Marrero earn $10,582 less on average than the poverty threshold level.
What is Inequality or Gini Index in Marrero?
Inequality or Gini Index in Marrero is 0.46.
What is the Total Population of Marrero?
Total Population of Marrero is 32,003.
What is the Total Male Population of Marrero?
Total Male Population of Marrero is 14,807.
What is the Total Female Population of Marrero?
Total Female Population of Marrero is 17,196.
What is the Ratio of Males per 100 Females in Marrero?
There are 86.11 Males per 100 Females in Marrero.
What is the Ratio of Females per 100 Males in Marrero?
There are 116.13 Females per 100 Males in Marrero.
What is the Median Population Age in Marrero?
Median Population Age in Marrero is 43.1 Years.
What is the Average Family Size in Marrero
Average Family Size in Marrero is 3.3 People.
What is the Average Household Size in Marrero
Average Household Size in Marrero is 2.5 People.
How Large is the Labor Force in Marrero?
There are 14,917 People in the Labor Forcein in Marrero.
What is the Percentage of People in the Labor Force in Marrero?
57.2% of People are in the Labor Force in Marrero.
What is the Unemployment Rate in Marrero?
Unemployment Rate in Marrero is 7.0%.