Slidell, LA Map & Demographics
Slidell Map
Slidell Overview
$31,276
PER CAPITA INCOME
$75,525
AVG FAMILY INCOME
$63,004
AVG HOUSEHOLD INCOME
38.8%
WAGE / INCOME GAP [ % ]
61.2¢/ $1
WAGE / INCOME GAP [ $ ]
$12,653
FAMILY INCOME DEFICIT
0.40
INEQUALITY / GINI INDEX
28,690
TOTAL POPULATION
13,419
MALE POPULATION
15,271
FEMALE POPULATION
87.87
MALES / 100 FEMALES
113.80
FEMALES / 100 MALES
38.7
MEDIAN AGE
3.2
AVG FAMILY SIZE
2.6
AVG HOUSEHOLD SIZE
13,828
LABOR FORCE [ PEOPLE ]
62.3%
PERCENT IN LABOR FORCE
5.2%
UNEMPLOYMENT RATE
Income in Slidell
Income Overview in Slidell
Per Capita Income in Slidell is $31,276, while median incomes of families and households are $75,525 and $63,004 respectively.
| Characteristic | Number | Measure |
| Per Capita Income | 28,690 | $31,276 |
| Median Family Income | 7,080 | $75,525 |
| Mean Family Income | 7,080 | $86,337 |
| Median Household Income | 10,761 | $63,004 |
| Mean Household Income | 10,761 | $78,730 |
| Income Deficit | 7,080 | $12,653 |
| Wage / Income Gap (%) | 28,690 | 38.83% |
| Wage / Income Gap ($) | 28,690 | 61.17¢ per $1 |
| Gini / Inequality Index | 28,690 | 0.40 |
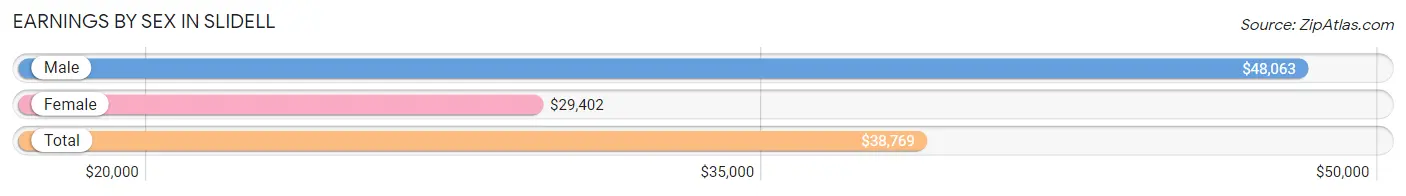
Earnings by Sex in Slidell
Average Earnings in Slidell are $38,769, $48,063 for men and $29,402 for women, a difference of 38.8%.
| Sex | Number | Average Earnings |
| Male | 6,818 (47.6%) | $48,063 |
| Female | 7,511 (52.4%) | $29,402 |
| Total | 14,329 (100.0%) | $38,769 |
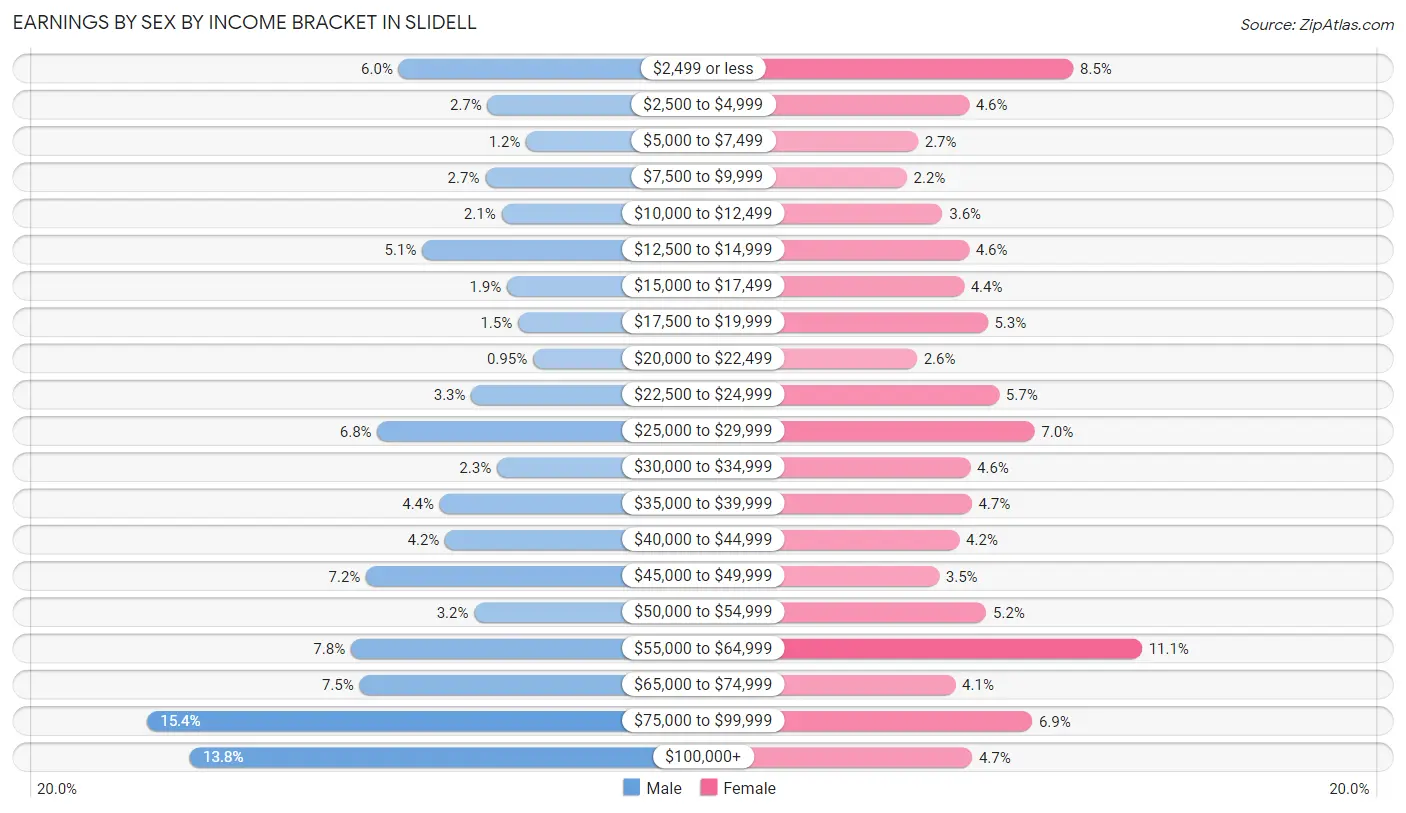
Earnings by Sex by Income Bracket in Slidell
The most common earnings brackets in Slidell are $75,000 to $99,999 for men (1,050 | 15.4%) and $55,000 to $64,999 for women (830 | 11.1%).
| Income | Male | Female |
| $2,499 or less | 408 (6.0%) | 637 (8.5%) |
| $2,500 to $4,999 | 181 (2.6%) | 343 (4.6%) |
| $5,000 to $7,499 | 82 (1.2%) | 200 (2.7%) |
| $7,500 to $9,999 | 187 (2.7%) | 168 (2.2%) |
| $10,000 to $12,499 | 145 (2.1%) | 269 (3.6%) |
| $12,500 to $14,999 | 348 (5.1%) | 343 (4.6%) |
| $15,000 to $17,499 | 131 (1.9%) | 329 (4.4%) |
| $17,500 to $19,999 | 103 (1.5%) | 396 (5.3%) |
| $20,000 to $22,499 | 65 (0.9%) | 197 (2.6%) |
| $22,500 to $24,999 | 222 (3.3%) | 428 (5.7%) |
| $25,000 to $29,999 | 462 (6.8%) | 528 (7.0%) |
| $30,000 to $34,999 | 157 (2.3%) | 347 (4.6%) |
| $35,000 to $39,999 | 303 (4.4%) | 351 (4.7%) |
| $40,000 to $44,999 | 289 (4.2%) | 316 (4.2%) |
| $45,000 to $49,999 | 491 (7.2%) | 259 (3.5%) |
| $50,000 to $54,999 | 215 (3.2%) | 392 (5.2%) |
| $55,000 to $64,999 | 530 (7.8%) | 830 (11.1%) |
| $65,000 to $74,999 | 508 (7.4%) | 305 (4.1%) |
| $75,000 to $99,999 | 1,050 (15.4%) | 521 (6.9%) |
| $100,000+ | 941 (13.8%) | 352 (4.7%) |
| Total | 6,818 (100.0%) | 7,511 (100.0%) |
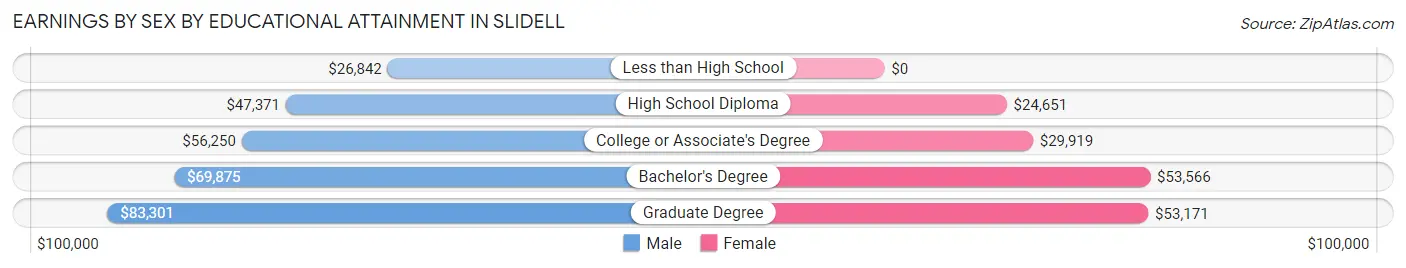
Earnings by Sex by Educational Attainment in Slidell
Average earnings in Slidell are $54,167 for men and $35,422 for women, a difference of 34.6%. Men with an educational attainment of graduate degree enjoy the highest average annual earnings of $83,301, while those with less than high school education earn the least with $26,842. Women with an educational attainment of bachelor's degree earn the most with the average annual earnings of $53,566, while those with high school diploma education have the smallest earnings of $24,651.
| Educational Attainment | Male Income | Female Income |
| Less than High School | $26,842 | $0 |
| High School Diploma | $47,371 | $24,651 |
| College or Associate's Degree | $56,250 | $29,919 |
| Bachelor's Degree | $69,875 | $53,566 |
| Graduate Degree | $83,301 | $53,171 |
| Total | $54,167 | $35,422 |
Family Income in Slidell
Family Income Brackets in Slidell
According to the Slidell family income data, there are 1,430 families falling into the $100,000 to $149,999 income range, which is the most common income bracket and makes up 20.2% of all families. Conversely, the $10,000 to $14,999 income bracket is the least frequent group with only 163 families (2.3%) belonging to this category.
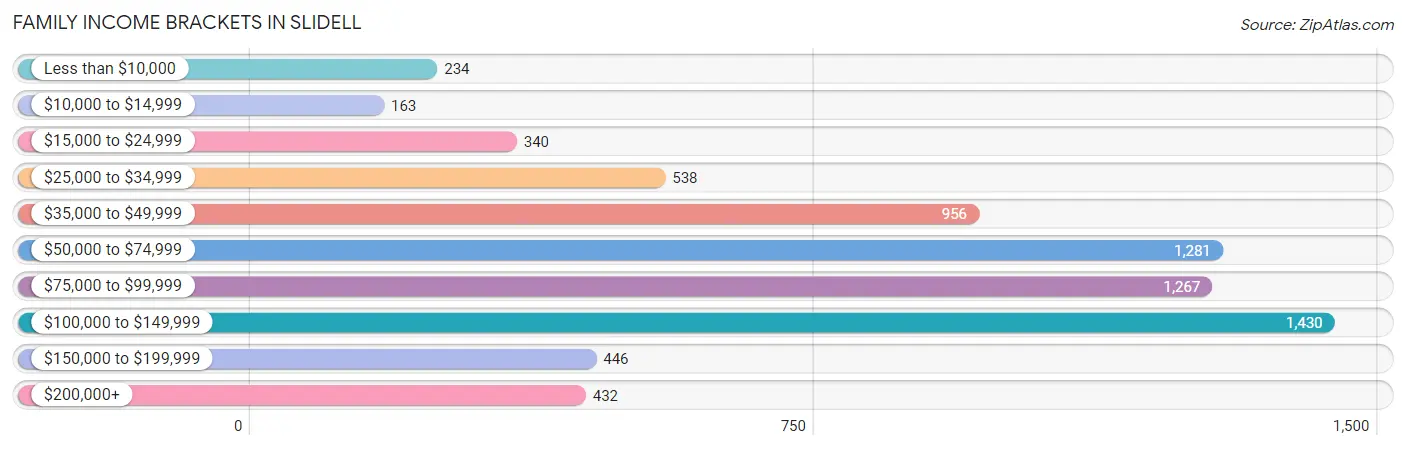
| Income Bracket | # Families | % Families |
| Less than $10,000 | 234 | 3.3% |
| $10,000 to $14,999 | 163 | 2.3% |
| $15,000 to $24,999 | 340 | 4.8% |
| $25,000 to $34,999 | 538 | 7.6% |
| $35,000 to $49,999 | 956 | 13.5% |
| $50,000 to $74,999 | 1,281 | 18.1% |
| $75,000 to $99,999 | 1,267 | 17.9% |
| $100,000 to $149,999 | 1,430 | 20.2% |
| $150,000 to $199,999 | 446 | 6.3% |
| $200,000+ | 432 | 6.1% |
Family Income by Famaliy Size in Slidell
5-person families (440 | 6.2%) account for the highest median family income in Slidell with $99,054 per family, while 2-person families (3,462 | 48.9%) have the highest median income of $32,332 per family member.
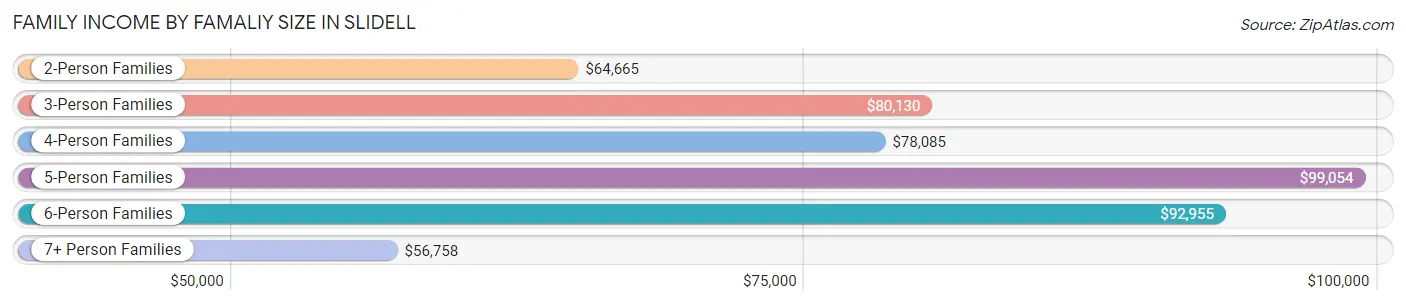
| Income Bracket | # Families | Median Income |
| 2-Person Families | 3,462 (48.9%) | $64,665 |
| 3-Person Families | 1,719 (24.3%) | $80,130 |
| 4-Person Families | 1,046 (14.8%) | $78,085 |
| 5-Person Families | 440 (6.2%) | $99,054 |
| 6-Person Families | 230 (3.3%) | $92,955 |
| 7+ Person Families | 183 (2.6%) | $56,758 |
| Total | 7,080 (100.0%) | $75,525 |
Family Income by Number of Earners in Slidell
The median family income in Slidell is $75,525, with families comprising 3+ earners (530) having the highest median family income of $109,792, while families with 1 earner (2,790) have the lowest median family income of $52,609, accounting for 7.5% and 39.4% of families, respectively.
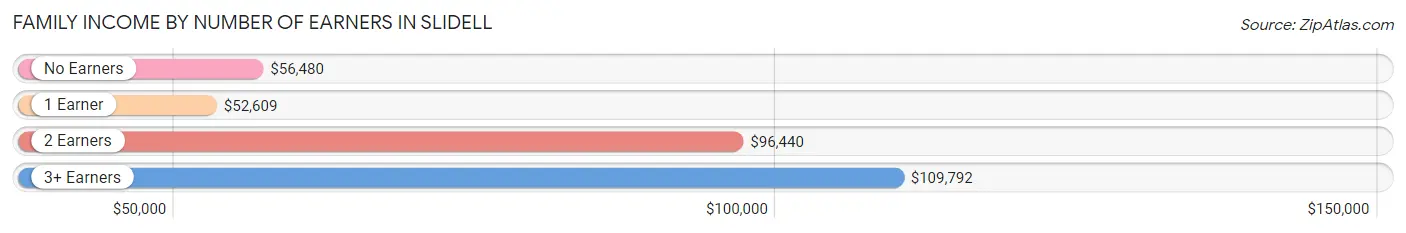
| Number of Earners | # Families | Median Income |
| No Earners | 955 (13.5%) | $56,480 |
| 1 Earner | 2,790 (39.4%) | $52,609 |
| 2 Earners | 2,805 (39.6%) | $96,440 |
| 3+ Earners | 530 (7.5%) | $109,792 |
| Total | 7,080 (100.0%) | $75,525 |
Household Income in Slidell
Household Income Brackets in Slidell
With 2,141 households falling in the category, the $100,000 to $149,999 income range is the most frequent in Slidell, accounting for 19.9% of all households. In contrast, only 387 households (3.6%) fall into the less than $10,000 income bracket, making it the least populous group.
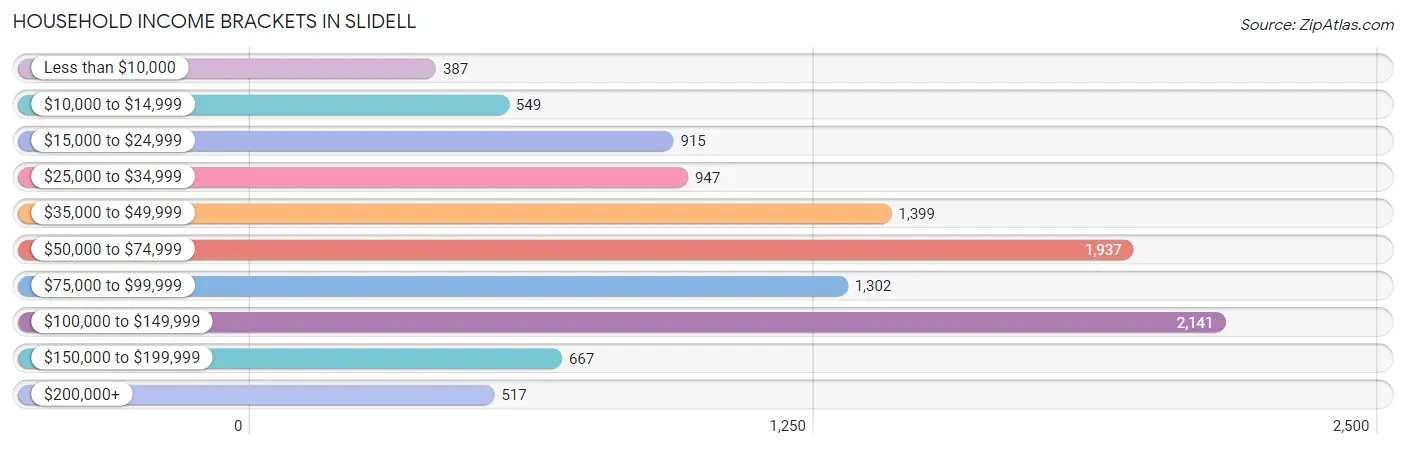
| Income Bracket | # Households | % Households |
| Less than $10,000 | 387 | 3.6% |
| $10,000 to $14,999 | 549 | 5.1% |
| $15,000 to $24,999 | 915 | 8.5% |
| $25,000 to $34,999 | 947 | 8.8% |
| $35,000 to $49,999 | 1,399 | 13.0% |
| $50,000 to $74,999 | 1,937 | 18.0% |
| $75,000 to $99,999 | 1,302 | 12.1% |
| $100,000 to $149,999 | 2,141 | 19.9% |
| $150,000 to $199,999 | 667 | 6.2% |
| $200,000+ | 517 | 4.8% |
Household Income by Householder Age in Slidell
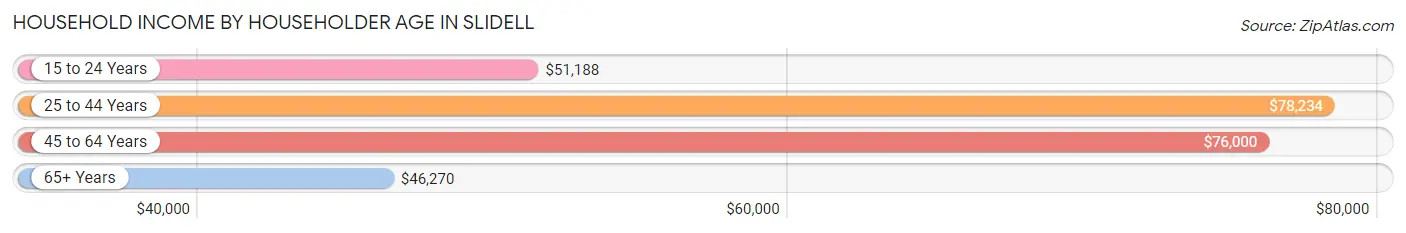
The median household income in Slidell is $63,004, with the highest median household income of $78,234 found in the 25 to 44 years age bracket for the primary householder. A total of 3,995 households (37.1%) fall into this category. Meanwhile, the 65+ years age bracket for the primary householder has the lowest median household income of $46,270, with 3,112 households (28.9%) in this group.
| Income Bracket | # Households | Median Income |
| 15 to 24 Years | 316 (2.9%) | $51,188 |
| 25 to 44 Years | 3,995 (37.1%) | $78,234 |
| 45 to 64 Years | 3,338 (31.0%) | $76,000 |
| 65+ Years | 3,112 (28.9%) | $46,270 |
| Total | 10,761 (100.0%) | $63,004 |
Poverty in Slidell
Income Below Poverty by Sex and Age in Slidell
With 13.1% poverty level for males and 17.8% for females among the residents of Slidell, under 5 year old males and under 5 year old females are the most vulnerable to poverty, with 251 males (30.9%) and 317 females (43.9%) in their respective age groups living below the poverty level.
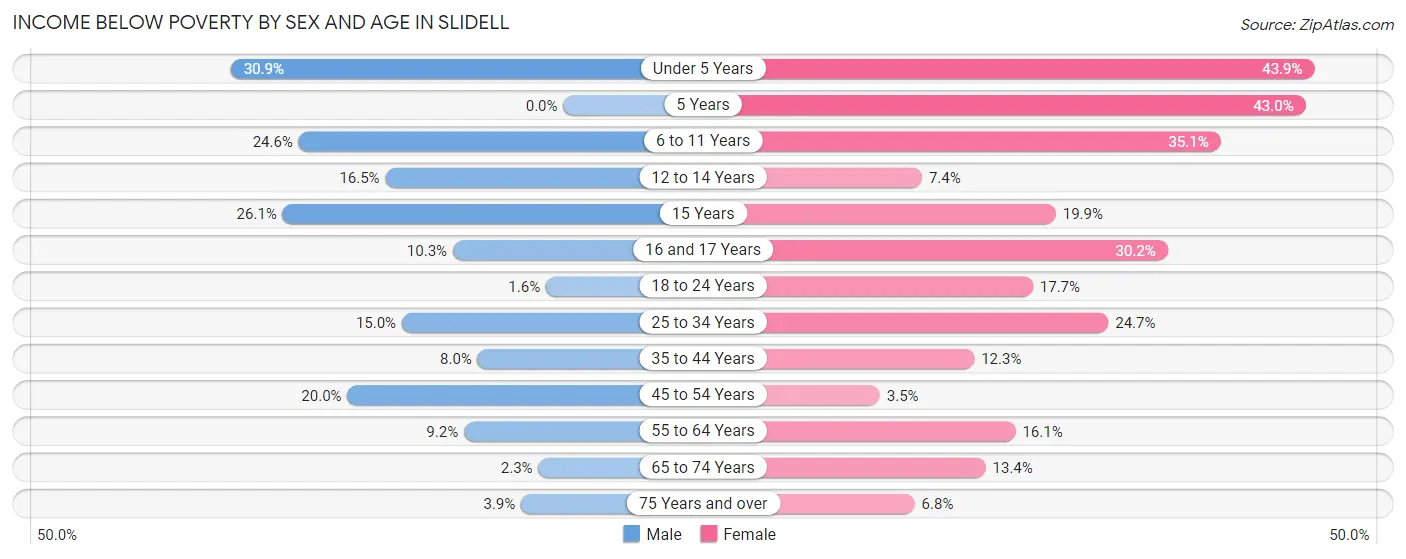
| Age Bracket | Male | Female |
| Under 5 Years | 251 (30.9%) | 317 (43.9%) |
| 5 Years | 0 (0.0%) | 105 (43.0%) |
| 6 to 11 Years | 320 (24.6%) | 435 (35.1%) |
| 12 to 14 Years | 71 (16.5%) | 53 (7.4%) |
| 15 Years | 112 (26.1%) | 29 (19.9%) |
| 16 and 17 Years | 25 (10.2%) | 127 (30.2%) |
| 18 to 24 Years | 16 (1.6%) | 206 (17.7%) |
| 25 to 34 Years | 255 (15.0%) | 475 (24.7%) |
| 35 to 44 Years | 155 (8.0%) | 264 (12.3%) |
| 45 to 54 Years | 309 (20.0%) | 55 (3.5%) |
| 55 to 64 Years | 130 (9.2%) | 289 (16.1%) |
| 65 to 74 Years | 30 (2.3%) | 246 (13.4%) |
| 75 Years and over | 29 (3.9%) | 77 (6.8%) |
| Total | 1,703 (13.1%) | 2,678 (17.8%) |
Income Above Poverty by Sex and Age in Slidell
According to the poverty statistics in Slidell, males aged 5 years and females aged 45 to 54 years are the age groups that are most secure financially, with 100.0% of males and 96.5% of females in these age groups living above the poverty line.
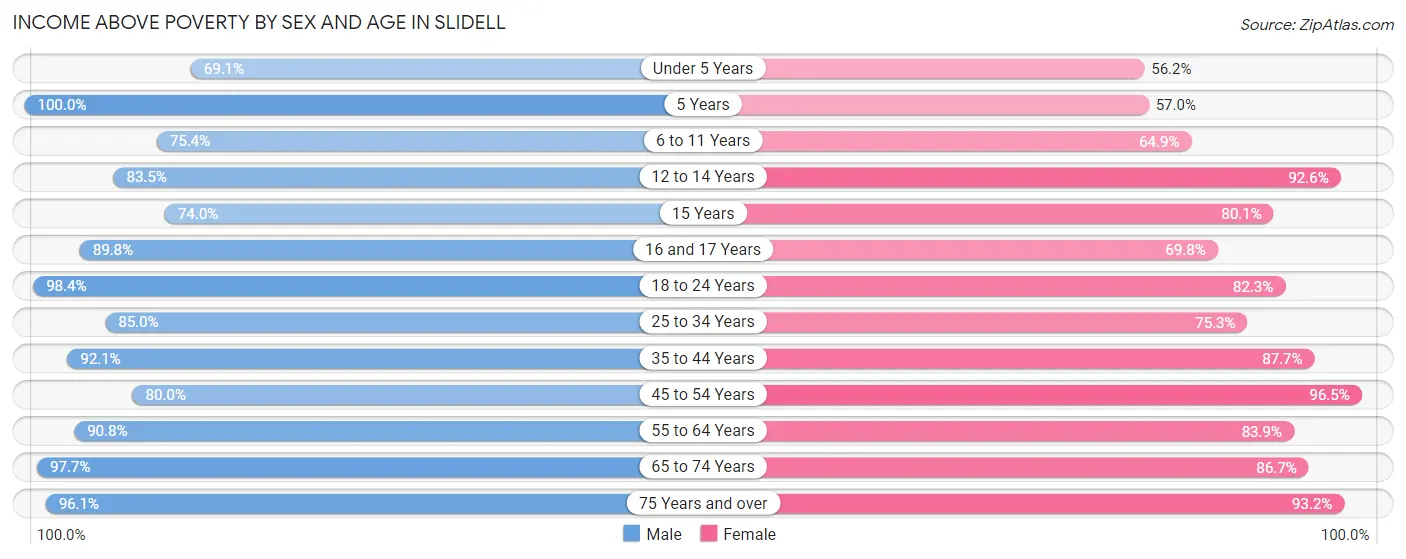
| Age Bracket | Male | Female |
| Under 5 Years | 562 (69.1%) | 406 (56.1%) |
| 5 Years | 189 (100.0%) | 139 (57.0%) |
| 6 to 11 Years | 983 (75.4%) | 803 (64.9%) |
| 12 to 14 Years | 359 (83.5%) | 659 (92.6%) |
| 15 Years | 318 (74.0%) | 117 (80.1%) |
| 16 and 17 Years | 219 (89.7%) | 293 (69.8%) |
| 18 to 24 Years | 975 (98.4%) | 956 (82.3%) |
| 25 to 34 Years | 1,447 (85.0%) | 1,446 (75.3%) |
| 35 to 44 Years | 1,795 (92.0%) | 1,884 (87.7%) |
| 45 to 54 Years | 1,233 (80.0%) | 1,501 (96.5%) |
| 55 to 64 Years | 1,280 (90.8%) | 1,504 (83.9%) |
| 65 to 74 Years | 1,267 (97.7%) | 1,597 (86.7%) |
| 75 Years and over | 710 (96.1%) | 1,062 (93.2%) |
| Total | 11,337 (86.9%) | 12,367 (82.2%) |
Income Below Poverty Among Married-Couple Families in Slidell
The poverty statistics for married-couple families in Slidell show that 4.8% or 213 of the total 4,450 families live below the poverty line. Families with 5 or more children have the highest poverty rate of 53.3%, comprising of 32 families. On the other hand, families with 1 or 2 children have the lowest poverty rate of 0.6%, which includes 7 families.
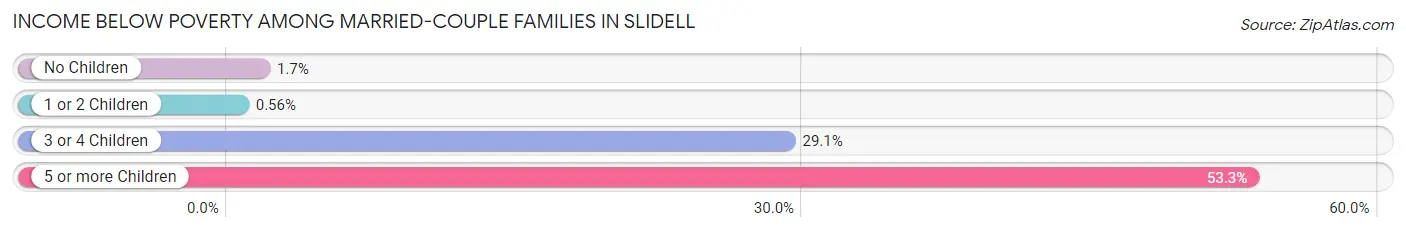
| Children | Above Poverty | Below Poverty |
| No Children | 2,642 (98.3%) | 45 (1.7%) |
| 1 or 2 Children | 1,253 (99.4%) | 7 (0.6%) |
| 3 or 4 Children | 314 (70.9%) | 129 (29.1%) |
| 5 or more Children | 28 (46.7%) | 32 (53.3%) |
| Total | 4,237 (95.2%) | 213 (4.8%) |
Income Below Poverty Among Single-Parent Households in Slidell
According to the poverty data in Slidell, 10.6% or 80 single-father households and 22.6% or 425 single-mother households are living below the poverty line. Among single-father households, those with 1 or 2 children have the highest poverty rate, with 80 households (18.6%) experiencing poverty. Likewise, among single-mother households, those with 5 or more children have the highest poverty rate, with 61 households (100.0%) falling below the poverty line.
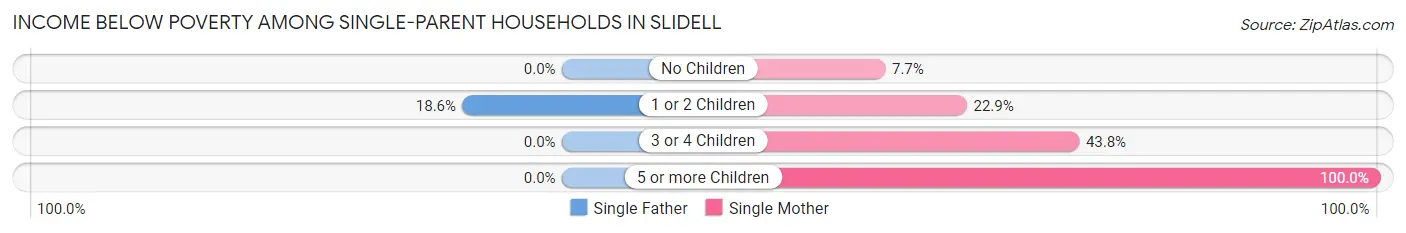
| Children | Single Father | Single Mother |
| No Children | 0 (0.0%) | 53 (7.7%) |
| 1 or 2 Children | 80 (18.6%) | 201 (22.9%) |
| 3 or 4 Children | 0 (0.0%) | 110 (43.8%) |
| 5 or more Children | 0 (0.0%) | 61 (100.0%) |
| Total | 80 (10.6%) | 425 (22.6%) |
Income Below Poverty Among Married-Couple vs Single-Parent Households in Slidell
The poverty data for Slidell shows that 213 of the married-couple family households (4.8%) and 505 of the single-parent households (19.2%) are living below the poverty level. Within the married-couple family households, those with 5 or more children have the highest poverty rate, with 32 households (53.3%) falling below the poverty line. Among the single-parent households, those with 5 or more children have the highest poverty rate, with 61 household (68.5%) living below poverty.
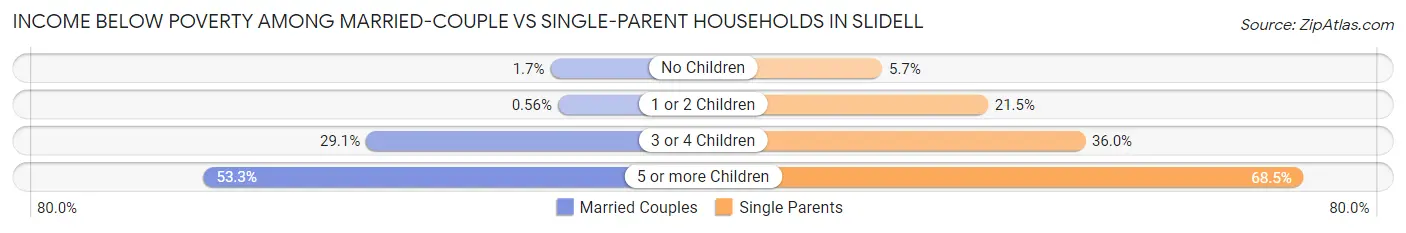
| Children | Married-Couple Families | Single-Parent Households |
| No Children | 45 (1.7%) | 53 (5.7%) |
| 1 or 2 Children | 7 (0.6%) | 281 (21.5%) |
| 3 or 4 Children | 129 (29.1%) | 110 (35.9%) |
| 5 or more Children | 32 (53.3%) | 61 (68.5%) |
| Total | 213 (4.8%) | 505 (19.2%) |
Race in Slidell
The most populous races in Slidell are White / Caucasian (19,294 | 67.2%), Black / African American (5,715 | 19.9%), and Two or more Races (2,267 | 7.9%).
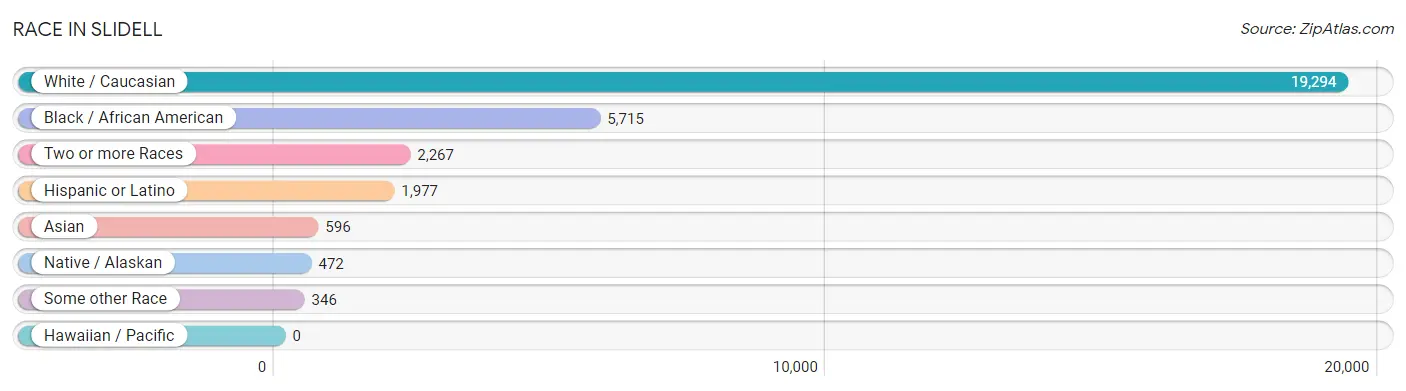
| Race | # Population | % Population |
| Asian | 596 | 2.1% |
| Black / African American | 5,715 | 19.9% |
| Hawaiian / Pacific | 0 | 0.0% |
| Hispanic or Latino | 1,977 | 6.9% |
| Native / Alaskan | 472 | 1.7% |
| White / Caucasian | 19,294 | 67.2% |
| Two or more Races | 2,267 | 7.9% |
| Some other Race | 346 | 1.2% |
| Total | 28,690 | 100.0% |
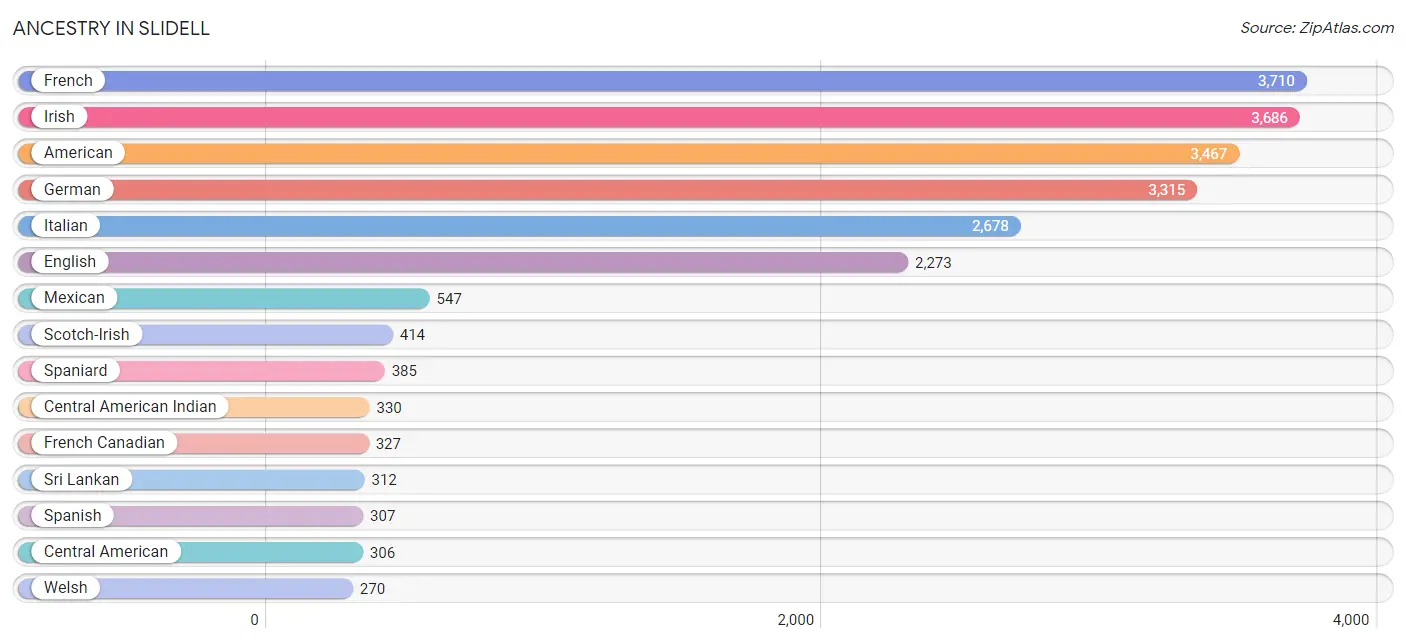
Ancestry in Slidell
The most populous ancestries reported in Slidell are French (3,710 | 12.9%), Irish (3,686 | 12.9%), American (3,467 | 12.1%), German (3,315 | 11.6%), and Italian (2,678 | 9.3%), together accounting for 58.7% of all Slidell residents.
| Ancestry | # Population | % Population |
| African | 31 | 0.1% |
| Alaskan Athabascan | 19 | 0.1% |
| American | 3,467 | 12.1% |
| Arab | 76 | 0.3% |
| Austrian | 16 | 0.1% |
| Basque | 2 | 0.0% |
| Belgian | 33 | 0.1% |
| Belizean | 62 | 0.2% |
| Bhutanese | 2 | 0.0% |
| Blackfeet | 25 | 0.1% |
| Bolivian | 6 | 0.0% |
| Brazilian | 17 | 0.1% |
| British | 96 | 0.3% |
| Burmese | 47 | 0.2% |
| Cajun | 86 | 0.3% |
| Canadian | 26 | 0.1% |
| Central American | 306 | 1.1% |
| Central American Indian | 330 | 1.1% |
| Cherokee | 123 | 0.4% |
| Chilean | 1 | 0.0% |
| Chippewa | 5 | 0.0% |
| Choctaw | 43 | 0.2% |
| Colombian | 23 | 0.1% |
| Cree | 5 | 0.0% |
| Croatian | 17 | 0.1% |
| Cuban | 24 | 0.1% |
| Danish | 6 | 0.0% |
| Dutch | 182 | 0.6% |
| Eastern European | 45 | 0.2% |
| English | 2,273 | 7.9% |
| Ethiopian | 23 | 0.1% |
| European | 193 | 0.7% |
| Finnish | 15 | 0.1% |
| French | 3,710 | 12.9% |
| French Canadian | 327 | 1.1% |
| German | 3,315 | 11.6% |
| Ghanaian | 25 | 0.1% |
| Greek | 26 | 0.1% |
| Guatemalan | 20 | 0.1% |
| Haitian | 41 | 0.1% |
| Honduran | 125 | 0.4% |
| Hungarian | 6 | 0.0% |
| Indian (Asian) | 50 | 0.2% |
| Iranian | 25 | 0.1% |
| Irish | 3,686 | 12.9% |
| Italian | 2,678 | 9.3% |
| Jamaican | 1 | 0.0% |
| Jordanian | 33 | 0.1% |
| Korean | 248 | 0.9% |
| Lebanese | 43 | 0.2% |
| Lithuanian | 67 | 0.2% |
| Mexican | 547 | 1.9% |
| Mexican American Indian | 24 | 0.1% |
| Nicaraguan | 153 | 0.5% |
| Norwegian | 144 | 0.5% |
| Panamanian | 8 | 0.0% |
| Peruvian | 15 | 0.1% |
| Polish | 248 | 0.9% |
| Portuguese | 75 | 0.3% |
| Puerto Rican | 265 | 0.9% |
| Romanian | 11 | 0.0% |
| Russian | 32 | 0.1% |
| Scandinavian | 29 | 0.1% |
| Scotch-Irish | 414 | 1.4% |
| Scottish | 238 | 0.8% |
| Sioux | 5 | 0.0% |
| Slavic | 51 | 0.2% |
| Slovak | 86 | 0.3% |
| Slovene | 5 | 0.0% |
| South American | 85 | 0.3% |
| Spaniard | 385 | 1.3% |
| Spanish | 307 | 1.1% |
| Sri Lankan | 312 | 1.1% |
| Subsaharan African | 67 | 0.2% |
| Swedish | 100 | 0.4% |
| Swiss | 112 | 0.4% |
| Thai | 46 | 0.2% |
| U.S. Virgin Islander | 10 | 0.0% |
| Ukrainian | 209 | 0.7% |
| Venezuelan | 40 | 0.1% |
| Welsh | 270 | 0.9% |
| West Indian | 84 | 0.3% | View All 82 Rows |
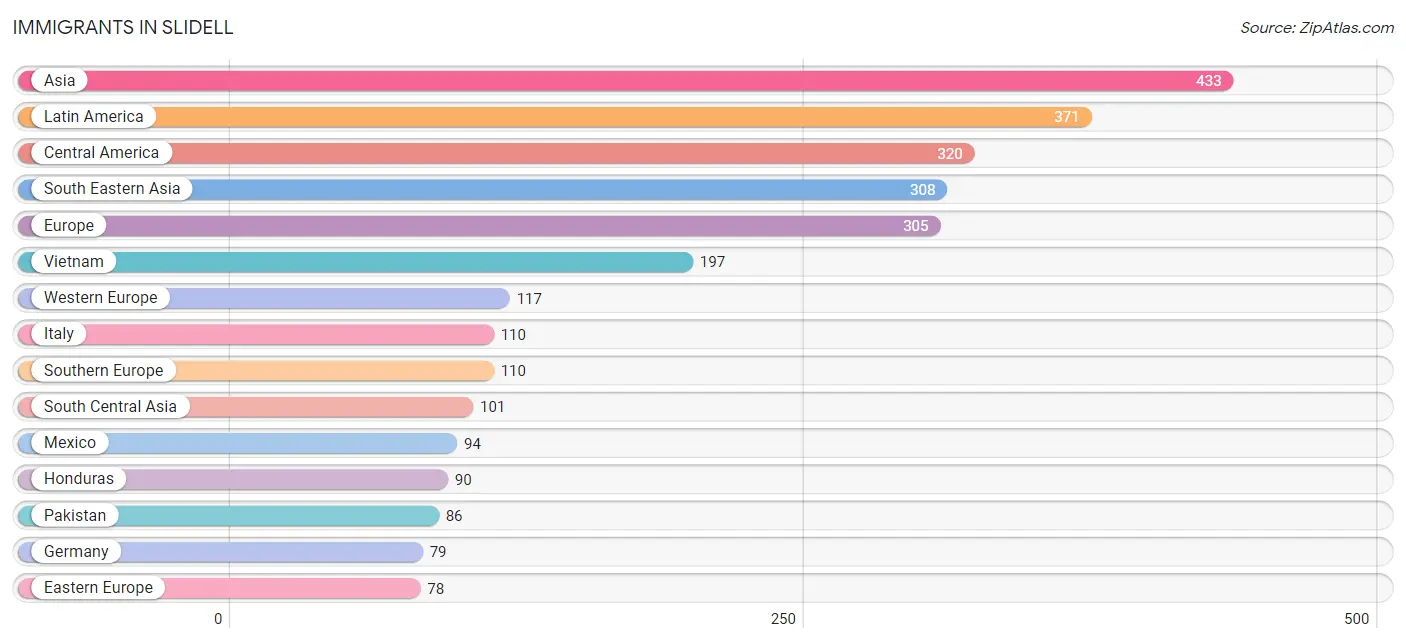
Immigrants in Slidell
The most numerous immigrant groups reported in Slidell came from Asia (433 | 1.5%), Latin America (371 | 1.3%), Central America (320 | 1.1%), South Eastern Asia (308 | 1.1%), and Europe (305 | 1.1%), together accounting for 6.0% of all Slidell residents.
| Immigration Origin | # Population | % Population |
| Africa | 23 | 0.1% |
| Argentina | 8 | 0.0% |
| Asia | 433 | 1.5% |
| Belize | 62 | 0.2% |
| Brazil | 1 | 0.0% |
| Canada | 5 | 0.0% |
| Caribbean | 9 | 0.0% |
| Central America | 320 | 1.1% |
| Chile | 1 | 0.0% |
| China | 7 | 0.0% |
| Colombia | 17 | 0.1% |
| Cuba | 8 | 0.0% |
| Eastern Africa | 23 | 0.1% |
| Eastern Asia | 24 | 0.1% |
| Eastern Europe | 78 | 0.3% |
| El Salvador | 8 | 0.0% |
| Ethiopia | 23 | 0.1% |
| Europe | 305 | 1.1% |
| Germany | 79 | 0.3% |
| Guatemala | 41 | 0.1% |
| Honduras | 90 | 0.3% |
| Iran | 15 | 0.1% |
| Italy | 110 | 0.4% |
| Jamaica | 1 | 0.0% |
| Japan | 2 | 0.0% |
| Korea | 15 | 0.1% |
| Laos | 44 | 0.2% |
| Latin America | 371 | 1.3% |
| Mexico | 94 | 0.3% |
| Netherlands | 38 | 0.1% |
| Nicaragua | 17 | 0.1% |
| Pakistan | 86 | 0.3% |
| Panama | 8 | 0.0% |
| Peru | 15 | 0.1% |
| Philippines | 67 | 0.2% |
| South America | 42 | 0.2% |
| South Central Asia | 101 | 0.4% |
| South Eastern Asia | 308 | 1.1% |
| Southern Europe | 110 | 0.4% |
| Ukraine | 78 | 0.3% |
| Vietnam | 197 | 0.7% |
| Western Europe | 117 | 0.4% | View All 42 Rows |
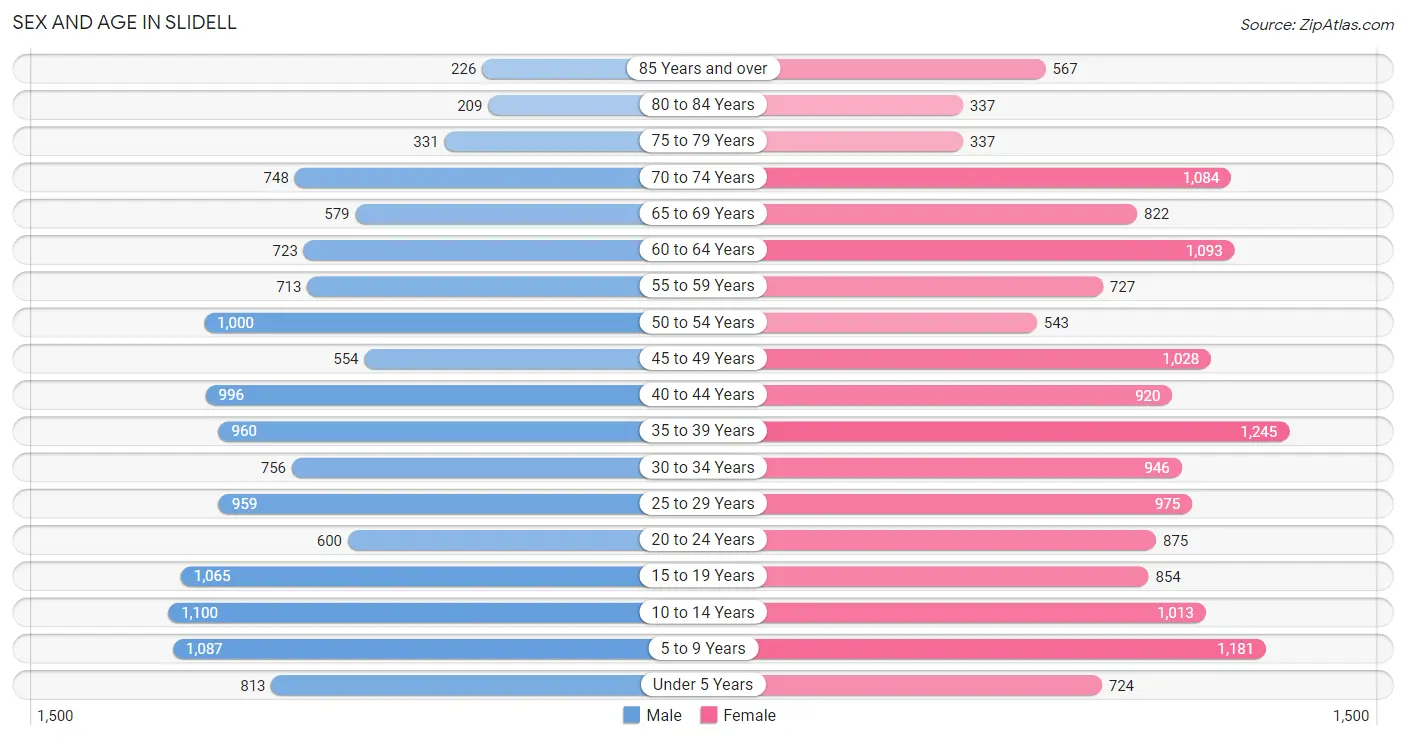
Sex and Age in Slidell
Sex and Age in Slidell
The most populous age groups in Slidell are 10 to 14 Years (1,100 | 8.2%) for men and 35 to 39 Years (1,245 | 8.2%) for women.
| Age Bracket | Male | Female |
| Under 5 Years | 813 (6.1%) | 724 (4.7%) |
| 5 to 9 Years | 1,087 (8.1%) | 1,181 (7.7%) |
| 10 to 14 Years | 1,100 (8.2%) | 1,013 (6.6%) |
| 15 to 19 Years | 1,065 (7.9%) | 854 (5.6%) |
| 20 to 24 Years | 600 (4.5%) | 875 (5.7%) |
| 25 to 29 Years | 959 (7.1%) | 975 (6.4%) |
| 30 to 34 Years | 756 (5.6%) | 946 (6.2%) |
| 35 to 39 Years | 960 (7.1%) | 1,245 (8.2%) |
| 40 to 44 Years | 996 (7.4%) | 920 (6.0%) |
| 45 to 49 Years | 554 (4.1%) | 1,028 (6.7%) |
| 50 to 54 Years | 1,000 (7.4%) | 543 (3.6%) |
| 55 to 59 Years | 713 (5.3%) | 727 (4.8%) |
| 60 to 64 Years | 723 (5.4%) | 1,093 (7.2%) |
| 65 to 69 Years | 579 (4.3%) | 822 (5.4%) |
| 70 to 74 Years | 748 (5.6%) | 1,084 (7.1%) |
| 75 to 79 Years | 331 (2.5%) | 337 (2.2%) |
| 80 to 84 Years | 209 (1.6%) | 337 (2.2%) |
| 85 Years and over | 226 (1.7%) | 567 (3.7%) |
| Total | 13,419 (100.0%) | 15,271 (100.0%) |
Families and Households in Slidell
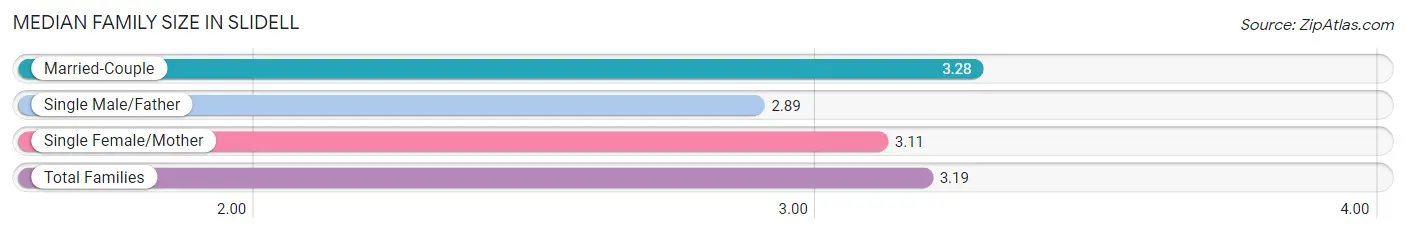
Median Family Size in Slidell
The median family size in Slidell is 3.19 persons per family, with married-couple families (4,450 | 62.8%) accounting for the largest median family size of 3.28 persons per family. On the other hand, single male/father families (752 | 10.6%) represent the smallest median family size with 2.89 persons per family.
| Family Type | # Families | Family Size |
| Married-Couple | 4,450 (62.8%) | 3.28 |
| Single Male/Father | 752 (10.6%) | 2.89 |
| Single Female/Mother | 1,878 (26.5%) | 3.11 |
| Total Families | 7,080 (100.0%) | 3.19 |
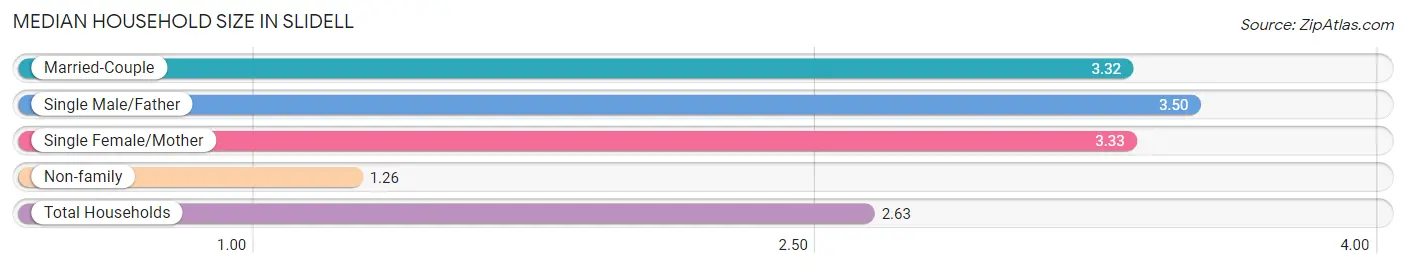
Median Household Size in Slidell
The median household size in Slidell is 2.63 persons per household, with single male/father households (752 | 7.0%) accounting for the largest median household size of 3.5 persons per household. non-family households (3,681 | 34.2%) represent the smallest median household size with 1.26 persons per household.
| Household Type | # Households | Household Size |
| Married-Couple | 4,450 (41.3%) | 3.32 |
| Single Male/Father | 752 (7.0%) | 3.50 |
| Single Female/Mother | 1,878 (17.4%) | 3.33 |
| Non-family | 3,681 (34.2%) | 1.26 |
| Total Households | 10,761 (100.0%) | 2.63 |
Household Size by Marriage Status in Slidell
Out of a total of 10,761 households in Slidell, 7,080 (65.8%) are family households, while 3,681 (34.2%) are nonfamily households. The most numerous type of family households are 2-person households, comprising 3,151, and the most common type of nonfamily households are 1-person households, comprising 3,098.
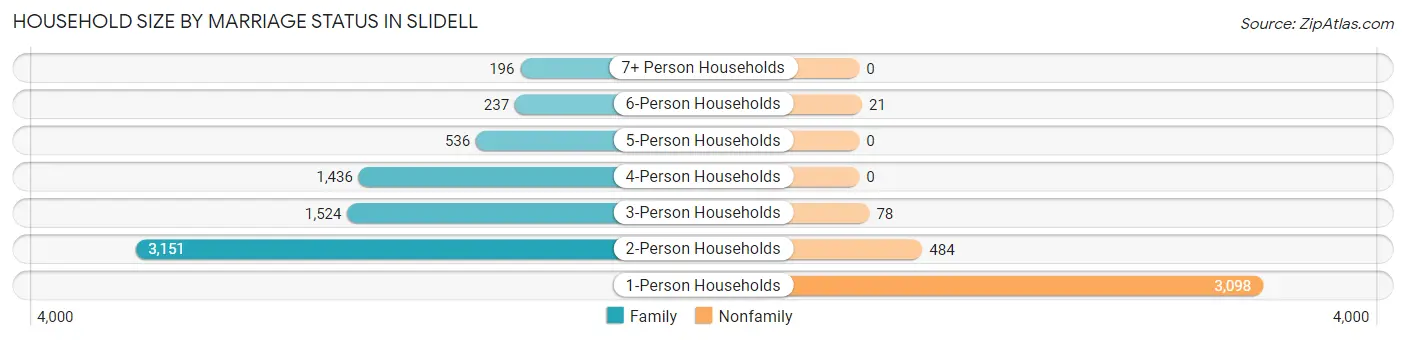
| Household Size | Family Households | Nonfamily Households |
| 1-Person Households | - | 3,098 (28.8%) |
| 2-Person Households | 3,151 (29.3%) | 484 (4.5%) |
| 3-Person Households | 1,524 (14.2%) | 78 (0.7%) |
| 4-Person Households | 1,436 (13.3%) | 0 (0.0%) |
| 5-Person Households | 536 (5.0%) | 0 (0.0%) |
| 6-Person Households | 237 (2.2%) | 21 (0.2%) |
| 7+ Person Households | 196 (1.8%) | 0 (0.0%) |
| Total | 7,080 (65.8%) | 3,681 (34.2%) |
Female Fertility in Slidell
Fertility by Age in Slidell
Average fertility rate in Slidell is 71.0 births per 1,000 women. Women in the age bracket of 20 to 34 years have the highest fertility rate with 144.0 births per 1,000 women. Women in the age bracket of 20 to 34 years acount for 82.7% of all women with births.
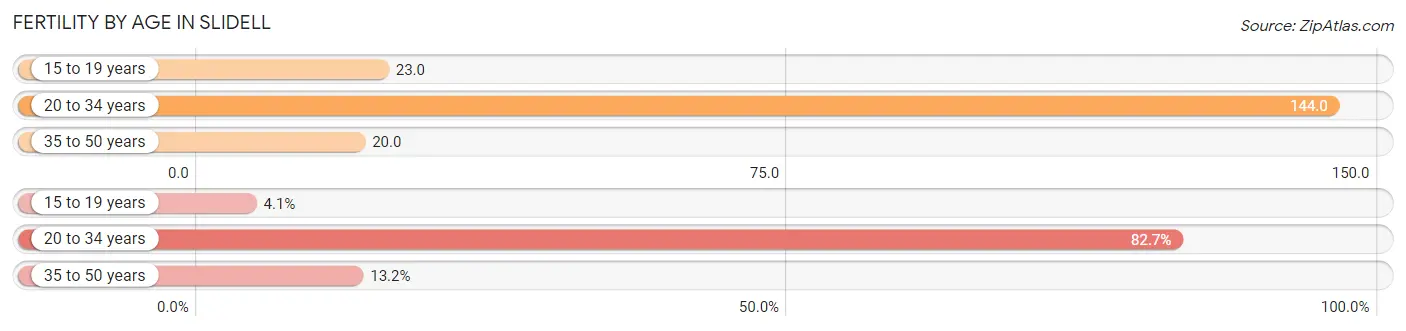
| Age Bracket | Women with Births | Births / 1,000 Women |
| 15 to 19 years | 20 (4.1%) | 23.0 |
| 20 to 34 years | 402 (82.7%) | 144.0 |
| 35 to 50 years | 64 (13.2%) | 20.0 |
| Total | 486 (100.0%) | 71.0 |
Fertility by Age by Marriage Status in Slidell
38.9% of women with births (486) in Slidell are married. The highest percentage of unmarried women with births falls into 15 to 19 years age bracket with 100.0% of them unmarried at the time of birth, while the lowest percentage of unmarried women with births belong to 35 to 50 years age bracket with 15.6% of them unmarried.
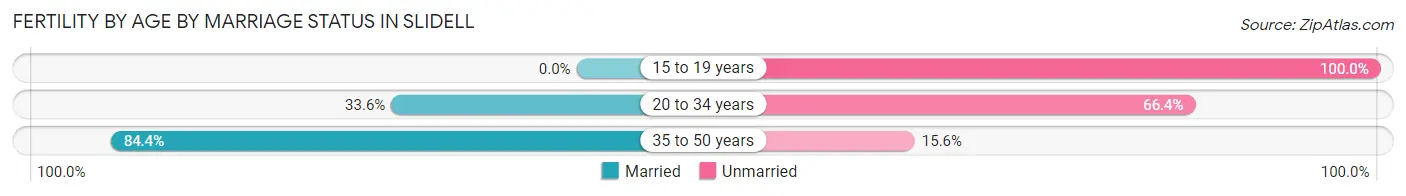
| Age Bracket | Married | Unmarried |
| 15 to 19 years | 0 (0.0%) | 20 (100.0%) |
| 20 to 34 years | 135 (33.6%) | 267 (66.4%) |
| 35 to 50 years | 54 (84.4%) | 10 (15.6%) |
| Total | 189 (38.9%) | 297 (61.1%) |
Fertility by Education in Slidell
Average fertility rate in Slidell is 71.0 births per 1,000 women. Women with the education attainment of graduate degree have the highest fertility rate of 160.0 births per 1,000 women, while women with the education attainment of less than high school have the lowest fertility at 18.0 births per 1,000 women. Women with the education attainment of high school diploma represent 35.6% of all women with births.
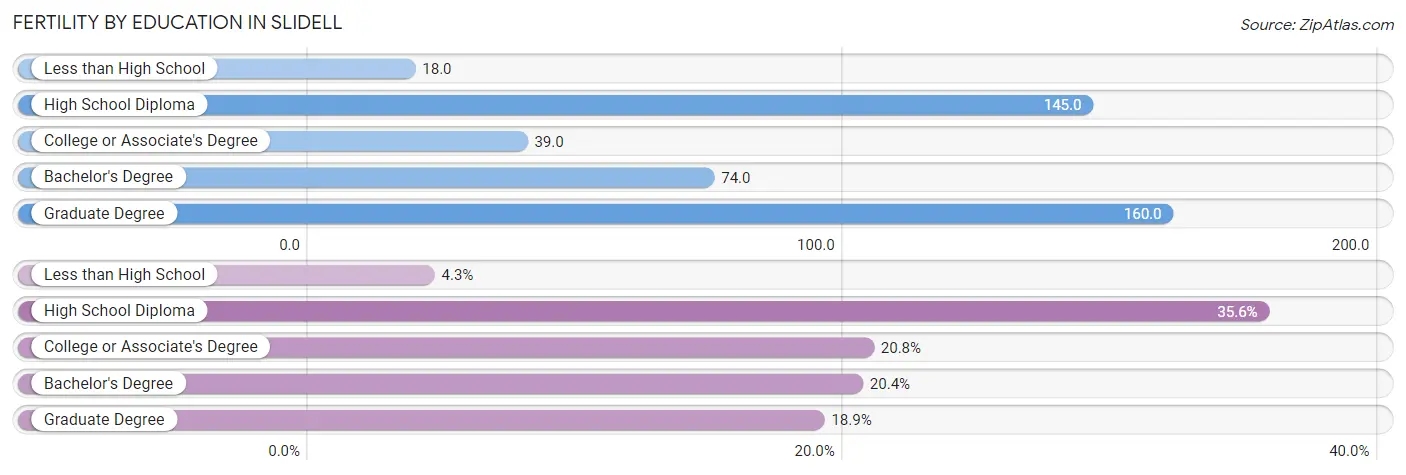
| Educational Attainment | Women with Births | Births / 1,000 Women |
| Less than High School | 21 (4.3%) | 18.0 |
| High School Diploma | 173 (35.6%) | 145.0 |
| College or Associate's Degree | 101 (20.8%) | 39.0 |
| Bachelor's Degree | 99 (20.4%) | 74.0 |
| Graduate Degree | 92 (18.9%) | 160.0 |
| Total | 486 (100.0%) | 71.0 |
Fertility by Education by Marriage Status in Slidell
61.1% of women with births in Slidell are unmarried. Women with the educational attainment of bachelor's degree are most likely to be married with 95.0% of them married at childbirth, while women with the educational attainment of less than high school are least likely to be married with 100.0% of them unmarried at childbirth.
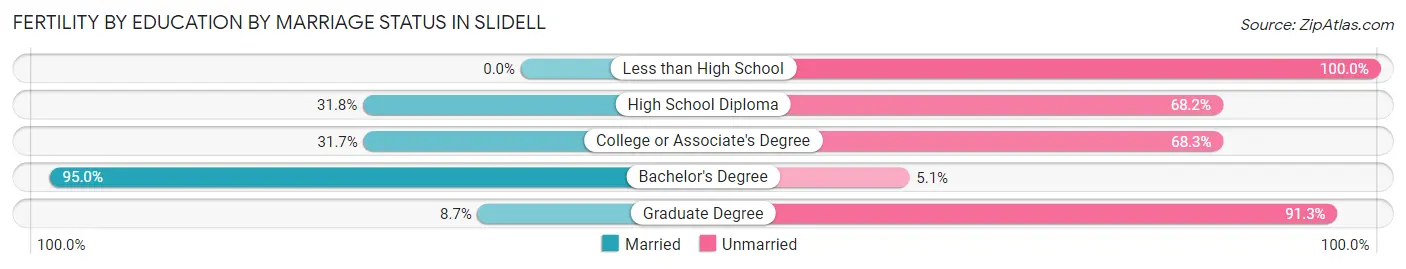
| Educational Attainment | Married | Unmarried |
| Less than High School | 0 (0.0%) | 21 (100.0%) |
| High School Diploma | 55 (31.8%) | 118 (68.2%) |
| College or Associate's Degree | 32 (31.7%) | 69 (68.3%) |
| Bachelor's Degree | 94 (95.0%) | 5 (5.1%) |
| Graduate Degree | 8 (8.7%) | 84 (91.3%) |
| Total | 189 (38.9%) | 297 (61.1%) |
Employment Characteristics in Slidell
Employment by Class of Employer in Slidell
Among the 12,911 employed individuals in Slidell, private company employees (8,610 | 66.7%), local government employees (1,009 | 7.8%), and federal government employees (981 | 7.6%) make up the most common classes of employment.
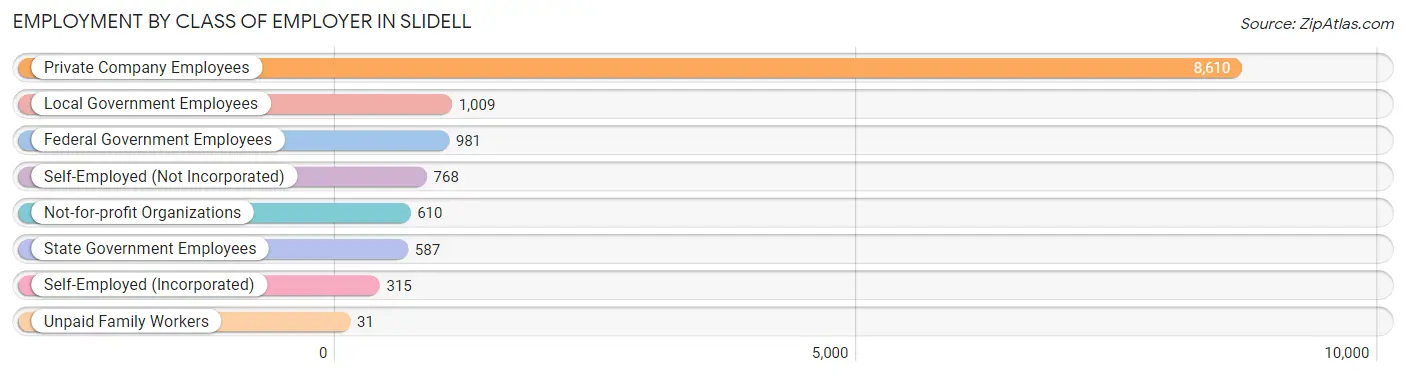
| Employer Class | # Employees | % Employees |
| Private Company Employees | 8,610 | 66.7% |
| Self-Employed (Incorporated) | 315 | 2.4% |
| Self-Employed (Not Incorporated) | 768 | 5.9% |
| Not-for-profit Organizations | 610 | 4.7% |
| Local Government Employees | 1,009 | 7.8% |
| State Government Employees | 587 | 4.5% |
| Federal Government Employees | 981 | 7.6% |
| Unpaid Family Workers | 31 | 0.2% |
| Total | 12,911 | 100.0% |
Employment Status by Age in Slidell
According to the labor force statistics for Slidell, out of the total population over 16 years of age (22,196), 62.3% or 13,828 individuals are in the labor force, with 5.2% or 719 of them unemployed. The age group with the highest labor force participation rate is 25 to 29 years, with 88.3% or 1,708 individuals in the labor force. Within the labor force, the 16 to 19 years age range has the highest percentage of unemployed individuals, with 11.5% or 78 of them being unemployed.
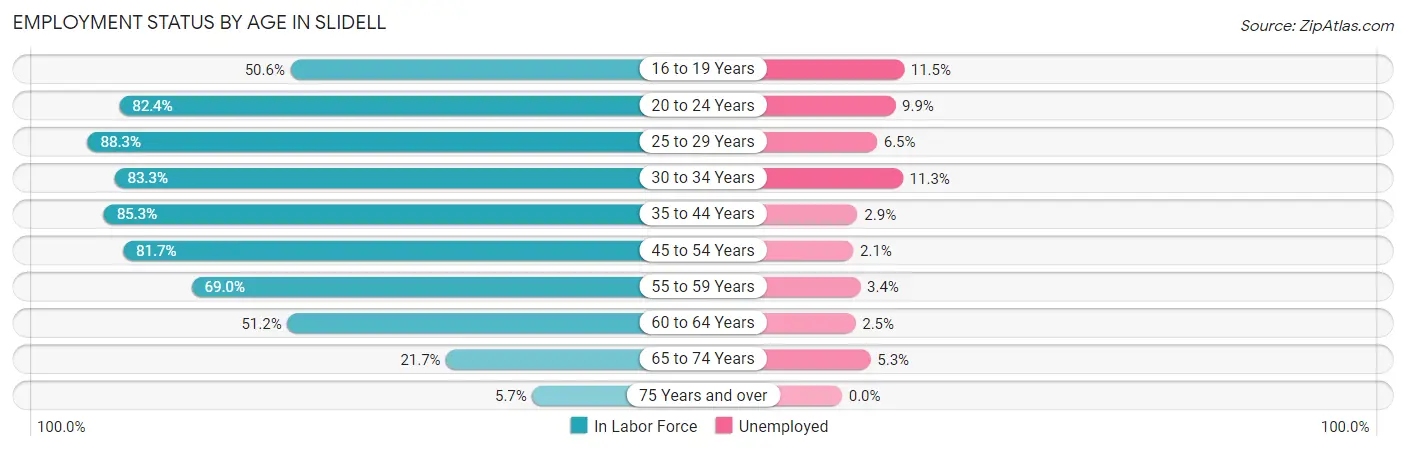
| Age Bracket | In Labor Force | Unemployed |
| 16 to 19 Years | 680 (50.6%) | 78 (11.5%) |
| 20 to 24 Years | 1,215 (82.4%) | 120 (9.9%) |
| 25 to 29 Years | 1,708 (88.3%) | 111 (6.5%) |
| 30 to 34 Years | 1,418 (83.3%) | 160 (11.3%) |
| 35 to 44 Years | 3,515 (85.3%) | 102 (2.9%) |
| 45 to 54 Years | 2,553 (81.7%) | 54 (2.1%) |
| 55 to 59 Years | 994 (69.0%) | 34 (3.4%) |
| 60 to 64 Years | 930 (51.2%) | 23 (2.5%) |
| 65 to 74 Years | 702 (21.7%) | 37 (5.3%) |
| 75 Years and over | 114 (5.7%) | 0 (0.0%) |
| Total | 13,828 (62.3%) | 719 (5.2%) |
Employment Status by Educational Attainment in Slidell
According to labor force statistics for Slidell, 78.6% of individuals (11,112) out of the total population between 25 and 64 years of age (14,138) are in the labor force, with 4.3% or 478 of them being unemployed. The group with the highest labor force participation rate are those with the educational attainment of bachelor's degree or higher, with 85.1% or 3,381 individuals in the labor force. Within the labor force, individuals with less than high school education have the highest percentage of unemployment, with 19.4% or 174 of them being unemployed.
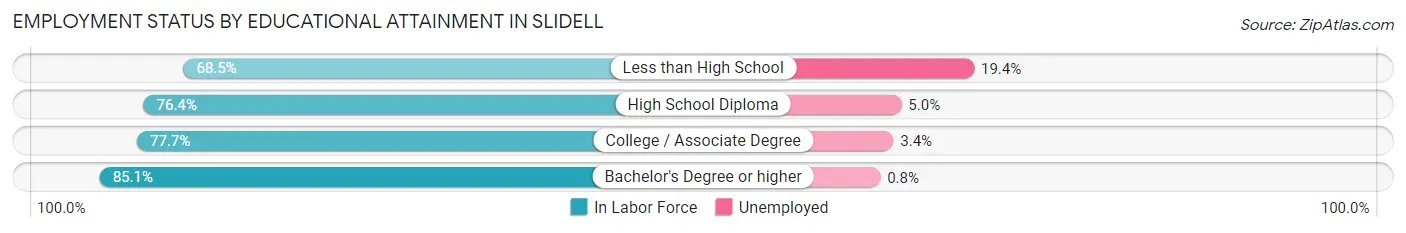
| Educational Attainment | In Labor Force | Unemployed |
| Less than High School | 896 (68.5%) | 254 (19.4%) |
| High School Diploma | 2,675 (76.4%) | 175 (5.0%) |
| College / Associate Degree | 4,162 (77.7%) | 182 (3.4%) |
| Bachelor's Degree or higher | 3,381 (85.1%) | 32 (0.8%) |
| Total | 11,112 (78.6%) | 608 (4.3%) |
Employment Occupations by Sex in Slidell
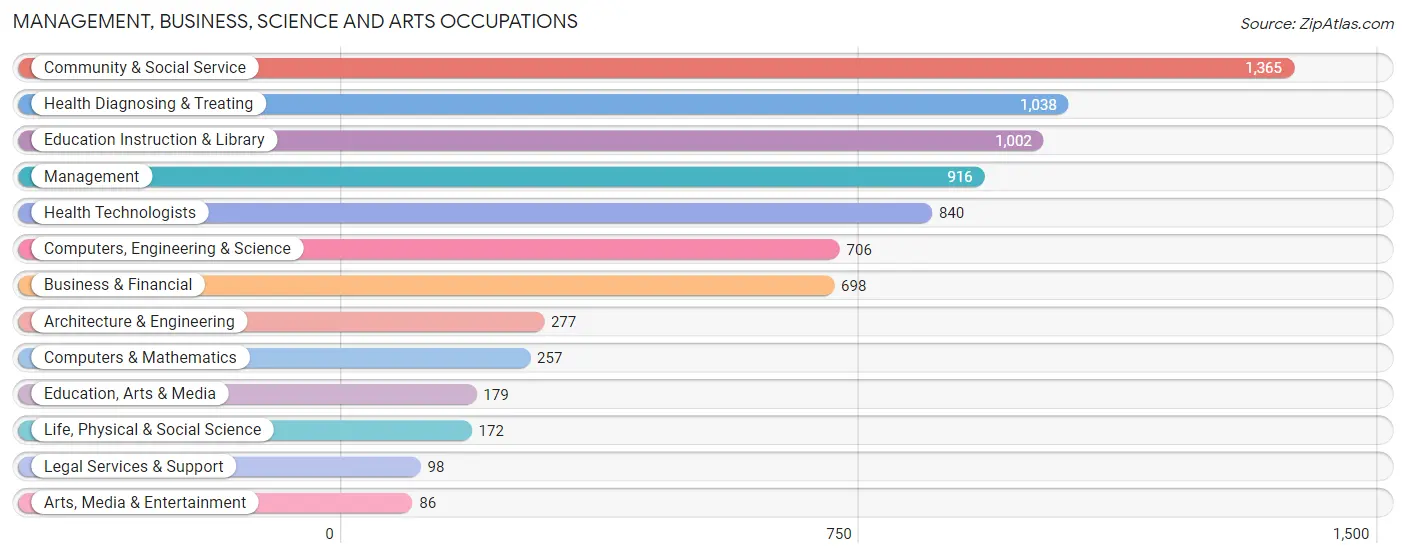
Management, Business, Science and Arts Occupations
The most common Management, Business, Science and Arts occupations in Slidell are Community & Social Service (1,365 | 10.7%), Health Diagnosing & Treating (1,038 | 8.1%), Education Instruction & Library (1,002 | 7.9%), Management (916 | 7.2%), and Health Technologists (840 | 6.6%).
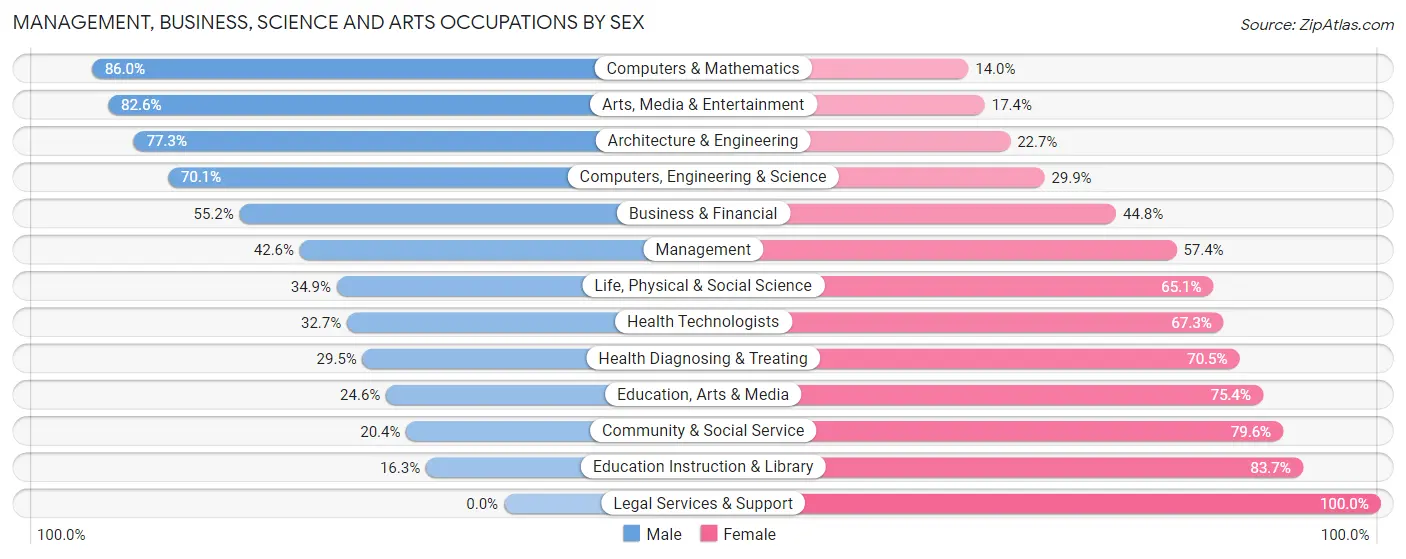
Management, Business, Science and Arts Occupations by Sex
Within the Management, Business, Science and Arts occupations in Slidell, the most male-oriented occupations are Computers & Mathematics (86.0%), Arts, Media & Entertainment (82.6%), and Architecture & Engineering (77.3%), while the most female-oriented occupations are Legal Services & Support (100.0%), Education Instruction & Library (83.7%), and Community & Social Service (79.6%).
| Occupation | Male | Female |
| Management | 390 (42.6%) | 526 (57.4%) |
| Business & Financial | 385 (55.2%) | 313 (44.8%) |
| Computers, Engineering & Science | 495 (70.1%) | 211 (29.9%) |
| Computers & Mathematics | 221 (86.0%) | 36 (14.0%) |
| Architecture & Engineering | 214 (77.3%) | 63 (22.7%) |
| Life, Physical & Social Science | 60 (34.9%) | 112 (65.1%) |
| Community & Social Service | 278 (20.4%) | 1,087 (79.6%) |
| Education, Arts & Media | 44 (24.6%) | 135 (75.4%) |
| Legal Services & Support | 0 (0.0%) | 98 (100.0%) |
| Education Instruction & Library | 163 (16.3%) | 839 (83.7%) |
| Arts, Media & Entertainment | 71 (82.6%) | 15 (17.4%) |
| Health Diagnosing & Treating | 306 (29.5%) | 732 (70.5%) |
| Health Technologists | 275 (32.7%) | 565 (67.3%) |
| Total (Category) | 1,854 (39.3%) | 2,869 (60.8%) |
| Total (Overall) | 5,963 (46.8%) | 6,782 (53.2%) |
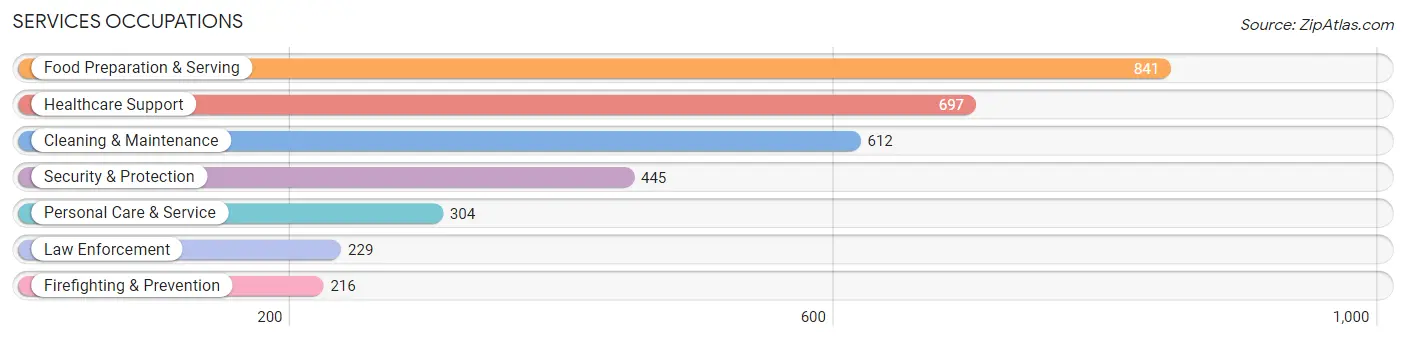
Services Occupations
The most common Services occupations in Slidell are Food Preparation & Serving (841 | 6.6%), Healthcare Support (697 | 5.5%), Cleaning & Maintenance (612 | 4.8%), Security & Protection (445 | 3.5%), and Personal Care & Service (304 | 2.4%).
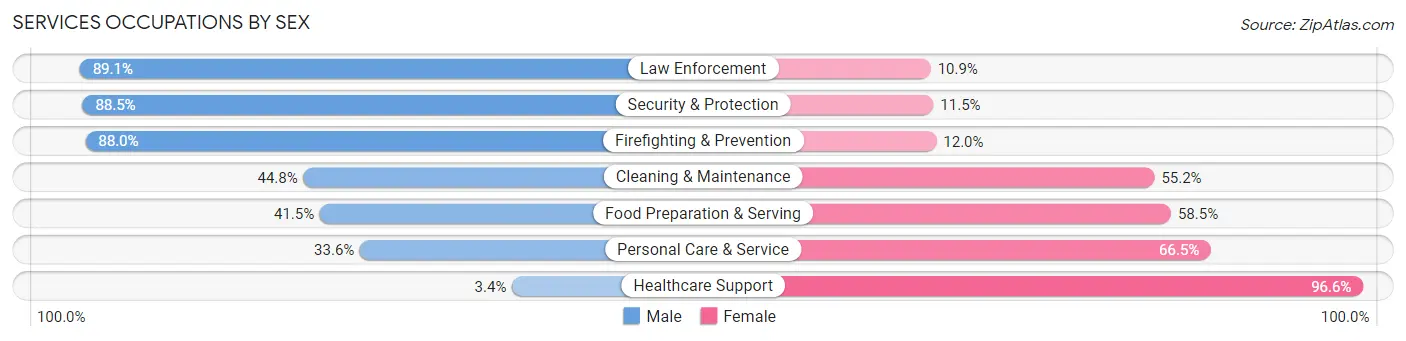
Services Occupations by Sex
Within the Services occupations in Slidell, the most male-oriented occupations are Law Enforcement (89.1%), Security & Protection (88.5%), and Firefighting & Prevention (88.0%), while the most female-oriented occupations are Healthcare Support (96.6%), Personal Care & Service (66.4%), and Food Preparation & Serving (58.5%).
| Occupation | Male | Female |
| Healthcare Support | 24 (3.4%) | 673 (96.6%) |
| Security & Protection | 394 (88.5%) | 51 (11.5%) |
| Firefighting & Prevention | 190 (88.0%) | 26 (12.0%) |
| Law Enforcement | 204 (89.1%) | 25 (10.9%) |
| Food Preparation & Serving | 349 (41.5%) | 492 (58.5%) |
| Cleaning & Maintenance | 274 (44.8%) | 338 (55.2%) |
| Personal Care & Service | 102 (33.6%) | 202 (66.4%) |
| Total (Category) | 1,143 (39.4%) | 1,756 (60.6%) |
| Total (Overall) | 5,963 (46.8%) | 6,782 (53.2%) |
Sales and Office Occupations
The most common Sales and Office occupations in Slidell are Office & Administration (1,442 | 11.3%), and Sales & Related (1,231 | 9.7%).
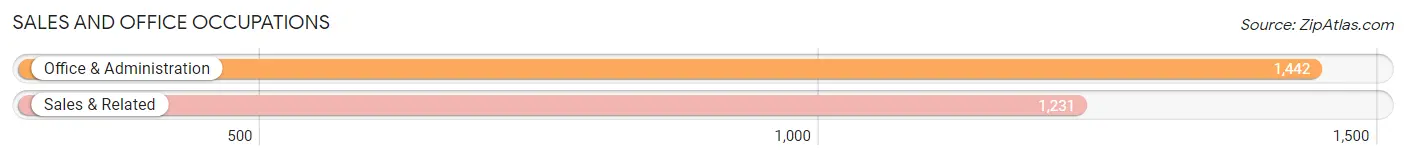
Sales and Office Occupations by Sex
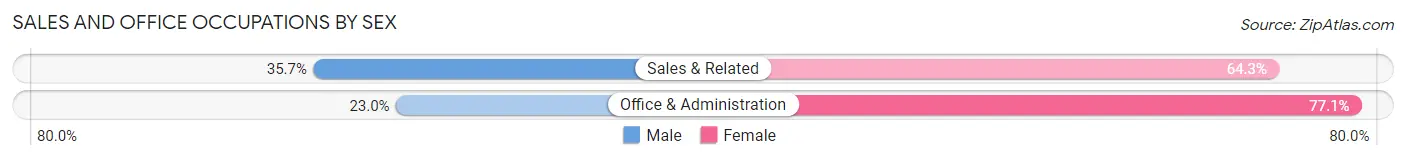
| Occupation | Male | Female |
| Sales & Related | 439 (35.7%) | 792 (64.3%) |
| Office & Administration | 331 (23.0%) | 1,111 (77.0%) |
| Total (Category) | 770 (28.8%) | 1,903 (71.2%) |
| Total (Overall) | 5,963 (46.8%) | 6,782 (53.2%) |
Natural Resources, Construction and Maintenance Occupations
The most common Natural Resources, Construction and Maintenance occupations in Slidell are Construction & Extraction (618 | 4.9%), Installation, Maintenance & Repair (531 | 4.2%), and Farming, Fishing & Forestry (7 | 0.1%).
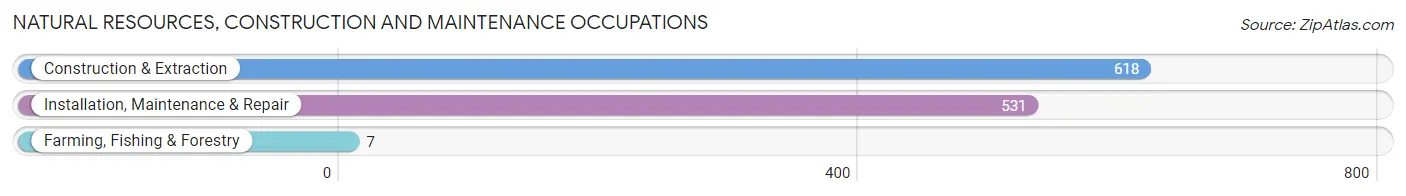
Natural Resources, Construction and Maintenance Occupations by Sex
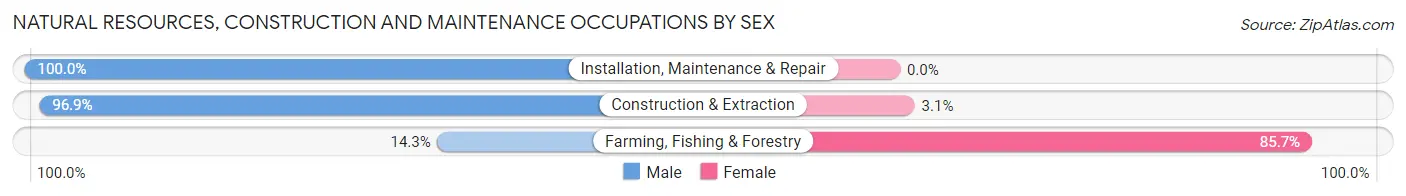
| Occupation | Male | Female |
| Farming, Fishing & Forestry | 1 (14.3%) | 6 (85.7%) |
| Construction & Extraction | 599 (96.9%) | 19 (3.1%) |
| Installation, Maintenance & Repair | 531 (100.0%) | 0 (0.0%) |
| Total (Category) | 1,131 (97.8%) | 25 (2.2%) |
| Total (Overall) | 5,963 (46.8%) | 6,782 (53.2%) |
Production, Transportation and Moving Occupations
The most common Production, Transportation and Moving occupations in Slidell are Transportation (606 | 4.8%), Production (469 | 3.7%), and Material Moving (219 | 1.7%).
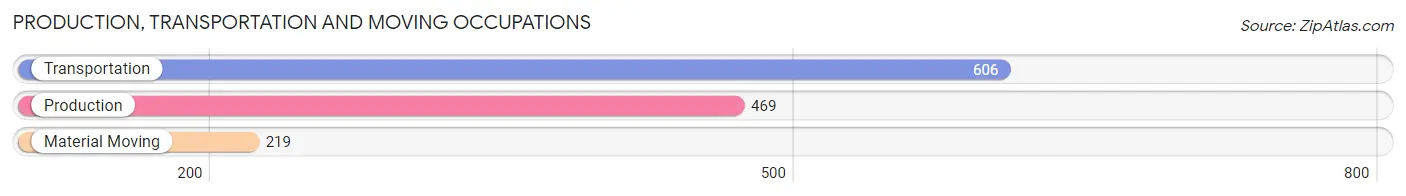
Production, Transportation and Moving Occupations by Sex
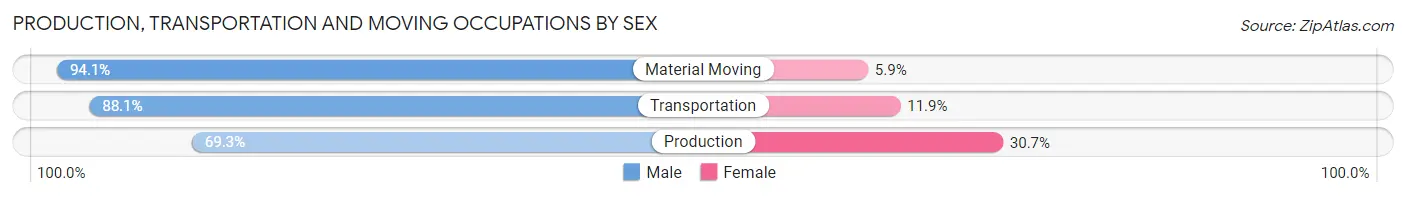
| Occupation | Male | Female |
| Production | 325 (69.3%) | 144 (30.7%) |
| Transportation | 534 (88.1%) | 72 (11.9%) |
| Material Moving | 206 (94.1%) | 13 (5.9%) |
| Total (Category) | 1,065 (82.3%) | 229 (17.7%) |
| Total (Overall) | 5,963 (46.8%) | 6,782 (53.2%) |
Employment Industries by Sex in Slidell
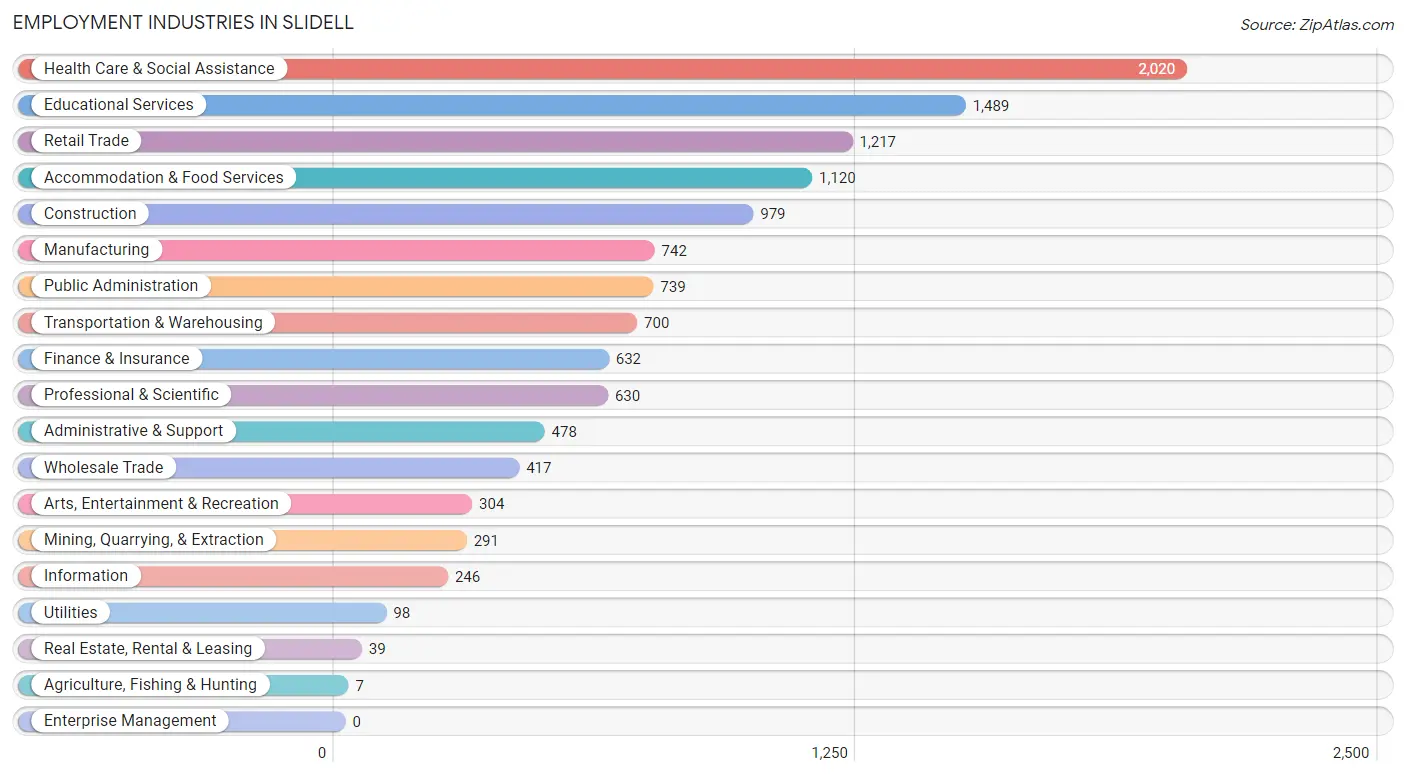
Employment Industries in Slidell
The major employment industries in Slidell include Health Care & Social Assistance (2,020 | 15.9%), Educational Services (1,489 | 11.7%), Retail Trade (1,217 | 9.6%), Accommodation & Food Services (1,120 | 8.8%), and Construction (979 | 7.7%).
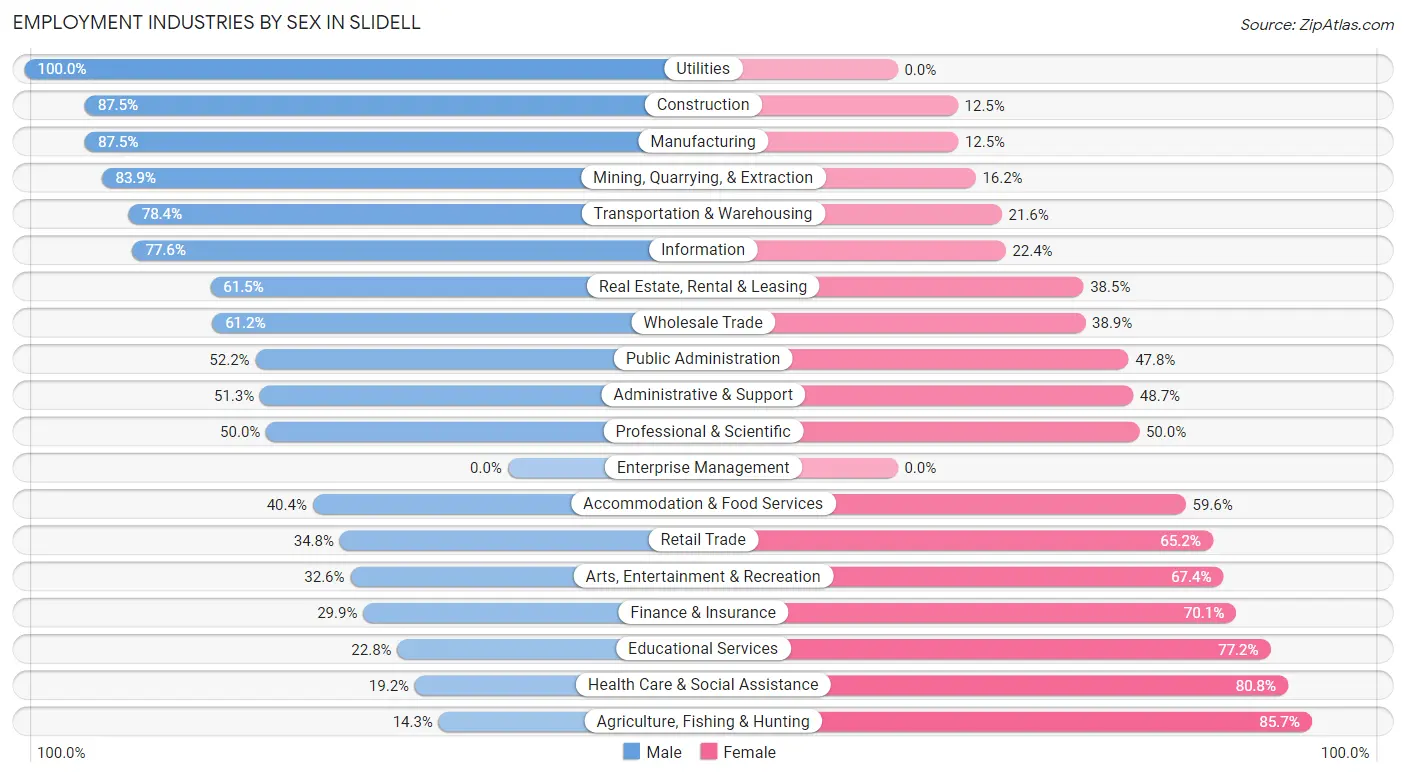
Employment Industries by Sex in Slidell
The Slidell industries that see more men than women are Utilities (100.0%), Construction (87.5%), and Manufacturing (87.5%), whereas the industries that tend to have a higher number of women are Agriculture, Fishing & Hunting (85.7%), Health Care & Social Assistance (80.8%), and Educational Services (77.2%).
| Industry | Male | Female |
| Agriculture, Fishing & Hunting | 1 (14.3%) | 6 (85.7%) |
| Mining, Quarrying, & Extraction | 244 (83.9%) | 47 (16.2%) |
| Construction | 857 (87.5%) | 122 (12.5%) |
| Manufacturing | 649 (87.5%) | 93 (12.5%) |
| Wholesale Trade | 255 (61.2%) | 162 (38.9%) |
| Retail Trade | 423 (34.8%) | 794 (65.2%) |
| Transportation & Warehousing | 549 (78.4%) | 151 (21.6%) |
| Utilities | 98 (100.0%) | 0 (0.0%) |
| Information | 191 (77.6%) | 55 (22.4%) |
| Finance & Insurance | 189 (29.9%) | 443 (70.1%) |
| Real Estate, Rental & Leasing | 24 (61.5%) | 15 (38.5%) |
| Professional & Scientific | 315 (50.0%) | 315 (50.0%) |
| Enterprise Management | 0 (0.0%) | 0 (0.0%) |
| Administrative & Support | 245 (51.3%) | 233 (48.7%) |
| Educational Services | 340 (22.8%) | 1,149 (77.2%) |
| Health Care & Social Assistance | 388 (19.2%) | 1,632 (80.8%) |
| Arts, Entertainment & Recreation | 99 (32.6%) | 205 (67.4%) |
| Accommodation & Food Services | 452 (40.4%) | 668 (59.6%) |
| Public Administration | 386 (52.2%) | 353 (47.8%) |
| Total | 5,963 (46.8%) | 6,782 (53.2%) |
Education in Slidell
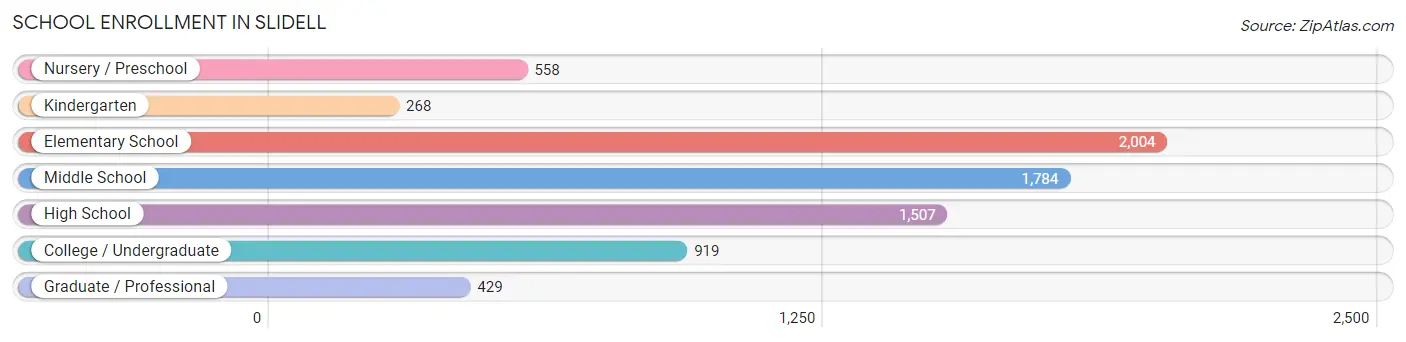
School Enrollment in Slidell
The most common levels of schooling among the 7,469 students in Slidell are elementary school (2,004 | 26.8%), middle school (1,784 | 23.9%), and high school (1,507 | 20.2%).
| School Level | # Students | % Students |
| Nursery / Preschool | 558 | 7.5% |
| Kindergarten | 268 | 3.6% |
| Elementary School | 2,004 | 26.8% |
| Middle School | 1,784 | 23.9% |
| High School | 1,507 | 20.2% |
| College / Undergraduate | 919 | 12.3% |
| Graduate / Professional | 429 | 5.7% |
| Total | 7,469 | 100.0% |
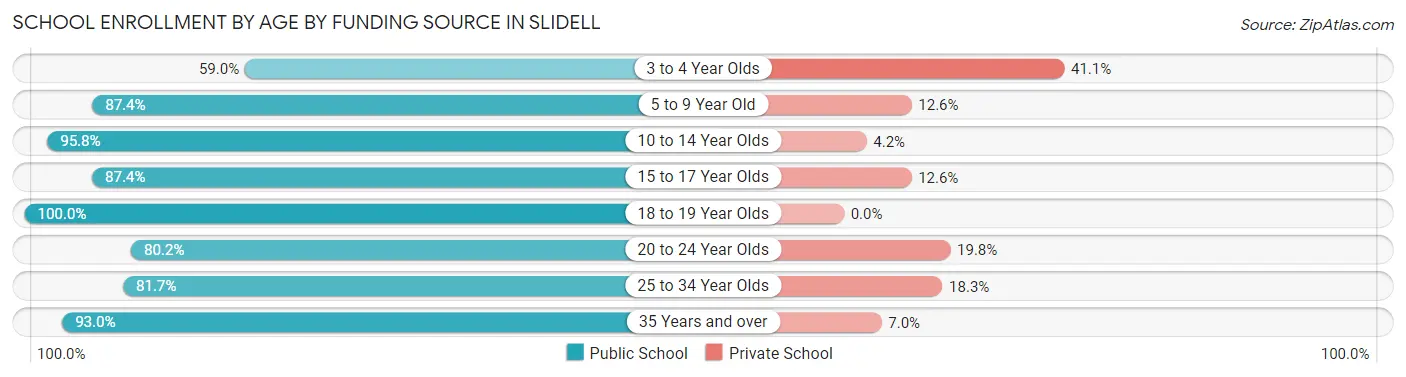
School Enrollment by Age by Funding Source in Slidell
Out of a total of 7,469 students who are enrolled in schools in Slidell, 822 (11.0%) attend a private institution, while the remaining 6,647 (89.0%) are enrolled in public schools. The age group of 3 to 4 year olds has the highest likelihood of being enrolled in private schools, with 156 (41.0% in the age bracket) enrolled. Conversely, the age group of 18 to 19 year olds has the lowest likelihood of being enrolled in a private school, with 568 (100.0% in the age bracket) attending a public institution.
| Age Bracket | Public School | Private School |
| 3 to 4 Year Olds | 224 (59.0%) | 156 (41.0%) |
| 5 to 9 Year Old | 1,933 (87.4%) | 279 (12.6%) |
| 10 to 14 Year Olds | 1,990 (95.8%) | 88 (4.2%) |
| 15 to 17 Year Olds | 952 (87.4%) | 137 (12.6%) |
| 18 to 19 Year Olds | 568 (100.0%) | 0 (0.0%) |
| 20 to 24 Year Olds | 279 (80.2%) | 69 (19.8%) |
| 25 to 34 Year Olds | 276 (81.7%) | 62 (18.3%) |
| 35 Years and over | 424 (93.0%) | 32 (7.0%) |
| Total | 6,647 (89.0%) | 822 (11.0%) |
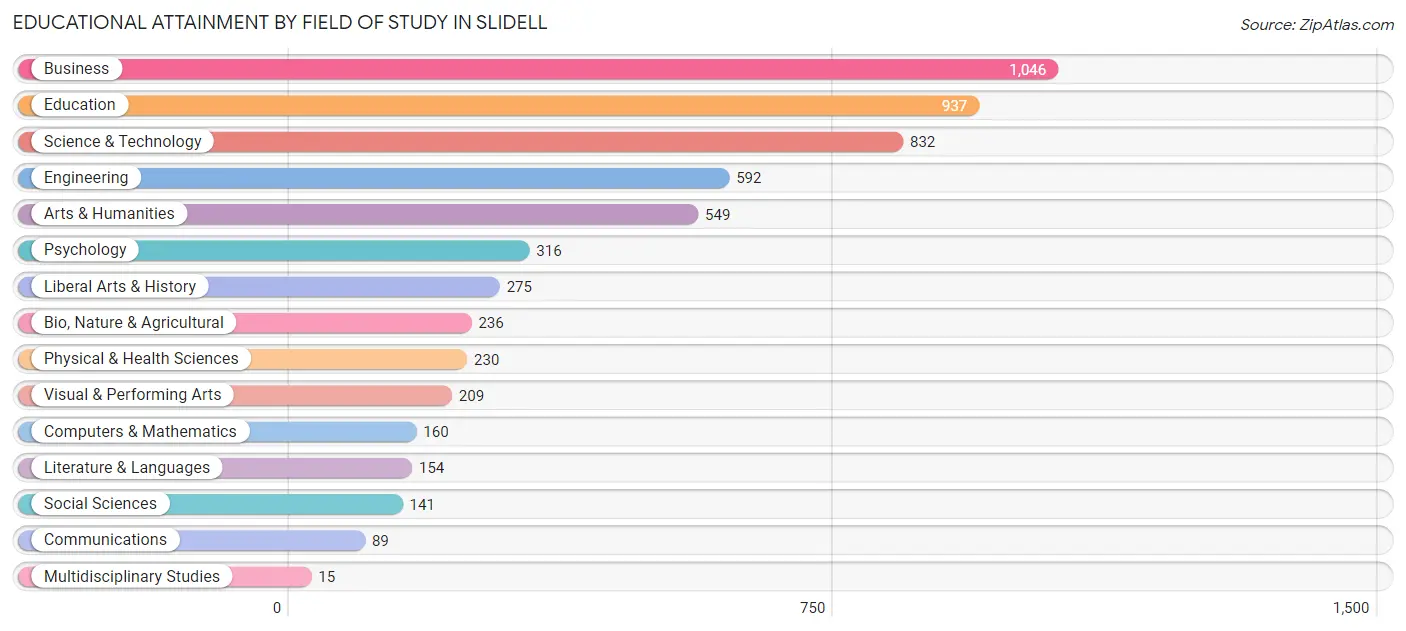
Educational Attainment by Field of Study in Slidell
Business (1,046 | 18.1%), education (937 | 16.2%), science & technology (832 | 14.4%), engineering (592 | 10.2%), and arts & humanities (549 | 9.5%) are the most common fields of study among 5,781 individuals in Slidell who have obtained a bachelor's degree or higher.
| Field of Study | # Graduates | % Graduates |
| Computers & Mathematics | 160 | 2.8% |
| Bio, Nature & Agricultural | 236 | 4.1% |
| Physical & Health Sciences | 230 | 4.0% |
| Psychology | 316 | 5.5% |
| Social Sciences | 141 | 2.4% |
| Engineering | 592 | 10.2% |
| Multidisciplinary Studies | 15 | 0.3% |
| Science & Technology | 832 | 14.4% |
| Business | 1,046 | 18.1% |
| Education | 937 | 16.2% |
| Literature & Languages | 154 | 2.7% |
| Liberal Arts & History | 275 | 4.8% |
| Visual & Performing Arts | 209 | 3.6% |
| Communications | 89 | 1.5% |
| Arts & Humanities | 549 | 9.5% |
| Total | 5,781 | 100.0% |
Transportation & Commute in Slidell
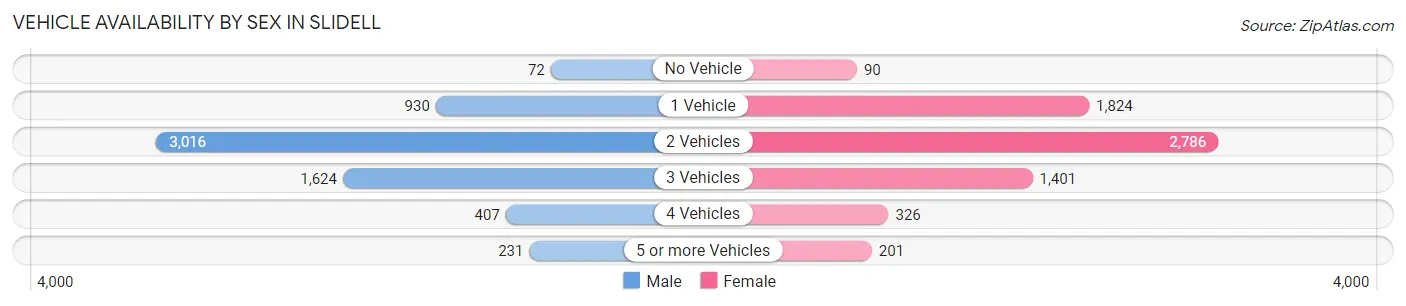
Vehicle Availability by Sex in Slidell
The most prevalent vehicle ownership categories in Slidell are males with 2 vehicles (3,016, accounting for 48.0%) and females with 2 vehicles (2,786, making up 45.5%).
| Vehicles Available | Male | Female |
| No Vehicle | 72 (1.1%) | 90 (1.4%) |
| 1 Vehicle | 930 (14.8%) | 1,824 (27.5%) |
| 2 Vehicles | 3,016 (48.0%) | 2,786 (42.0%) |
| 3 Vehicles | 1,624 (25.9%) | 1,401 (21.1%) |
| 4 Vehicles | 407 (6.5%) | 326 (4.9%) |
| 5 or more Vehicles | 231 (3.7%) | 201 (3.0%) |
| Total | 6,280 (100.0%) | 6,628 (100.0%) |
Commute Time in Slidell
The most frequently occuring commute durations in Slidell are 10 to 14 minutes (1,915 commuters, 16.6%), 5 to 9 minutes (1,666 commuters, 14.5%), and 15 to 19 minutes (1,194 commuters, 10.4%).
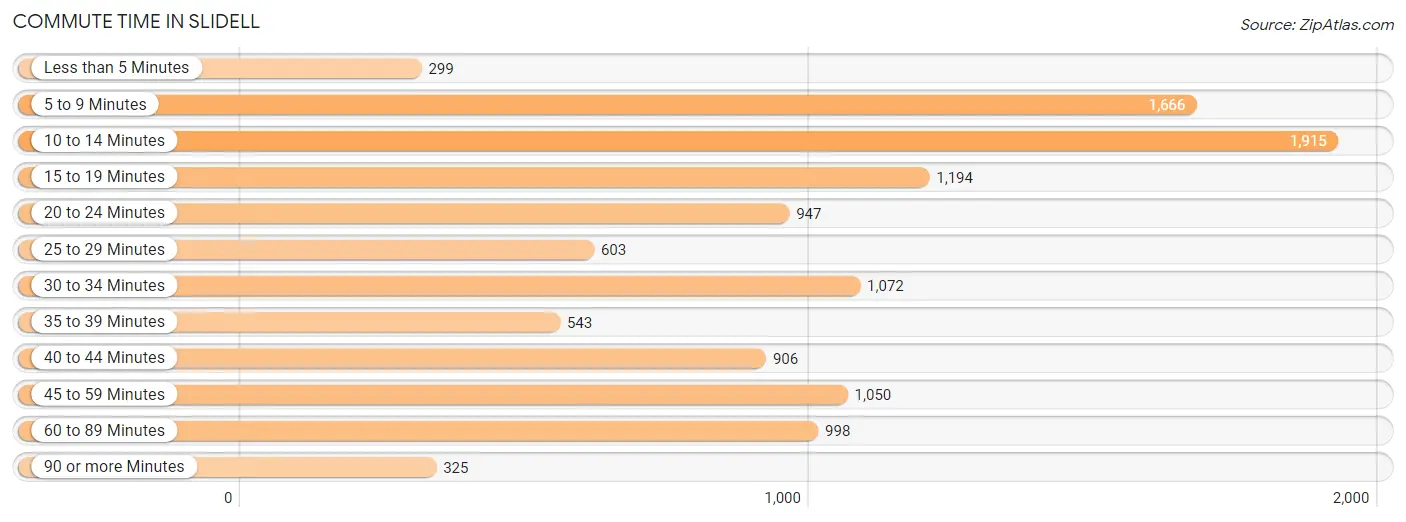
| Commute Time | # Commuters | % Commuters |
| Less than 5 Minutes | 299 | 2.6% |
| 5 to 9 Minutes | 1,666 | 14.5% |
| 10 to 14 Minutes | 1,915 | 16.6% |
| 15 to 19 Minutes | 1,194 | 10.4% |
| 20 to 24 Minutes | 947 | 8.2% |
| 25 to 29 Minutes | 603 | 5.2% |
| 30 to 34 Minutes | 1,072 | 9.3% |
| 35 to 39 Minutes | 543 | 4.7% |
| 40 to 44 Minutes | 906 | 7.9% |
| 45 to 59 Minutes | 1,050 | 9.1% |
| 60 to 89 Minutes | 998 | 8.7% |
| 90 or more Minutes | 325 | 2.8% |
Commute Time by Sex in Slidell
The most common commute times in Slidell are 5 to 9 minutes (714 commuters, 12.4%) for males and 10 to 14 minutes (1,345 commuters, 23.4%) for females.
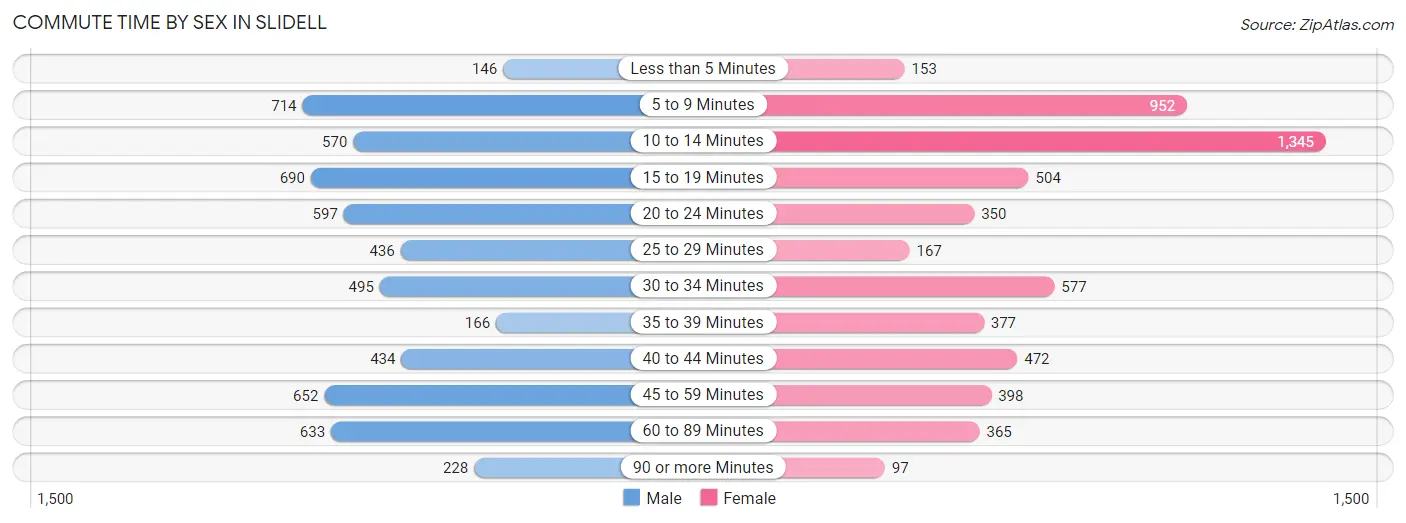
| Commute Time | Male | Female |
| Less than 5 Minutes | 146 (2.5%) | 153 (2.7%) |
| 5 to 9 Minutes | 714 (12.4%) | 952 (16.5%) |
| 10 to 14 Minutes | 570 (9.9%) | 1,345 (23.4%) |
| 15 to 19 Minutes | 690 (12.0%) | 504 (8.7%) |
| 20 to 24 Minutes | 597 (10.4%) | 350 (6.1%) |
| 25 to 29 Minutes | 436 (7.6%) | 167 (2.9%) |
| 30 to 34 Minutes | 495 (8.6%) | 577 (10.0%) |
| 35 to 39 Minutes | 166 (2.9%) | 377 (6.6%) |
| 40 to 44 Minutes | 434 (7.5%) | 472 (8.2%) |
| 45 to 59 Minutes | 652 (11.3%) | 398 (6.9%) |
| 60 to 89 Minutes | 633 (11.0%) | 365 (6.3%) |
| 90 or more Minutes | 228 (4.0%) | 97 (1.7%) |
Time of Departure to Work by Sex in Slidell
The most frequent times of departure to work in Slidell are 6:30 AM to 6:59 AM (874, 15.2%) for males and 8:00 AM to 8:29 AM (1,017, 17.7%) for females.
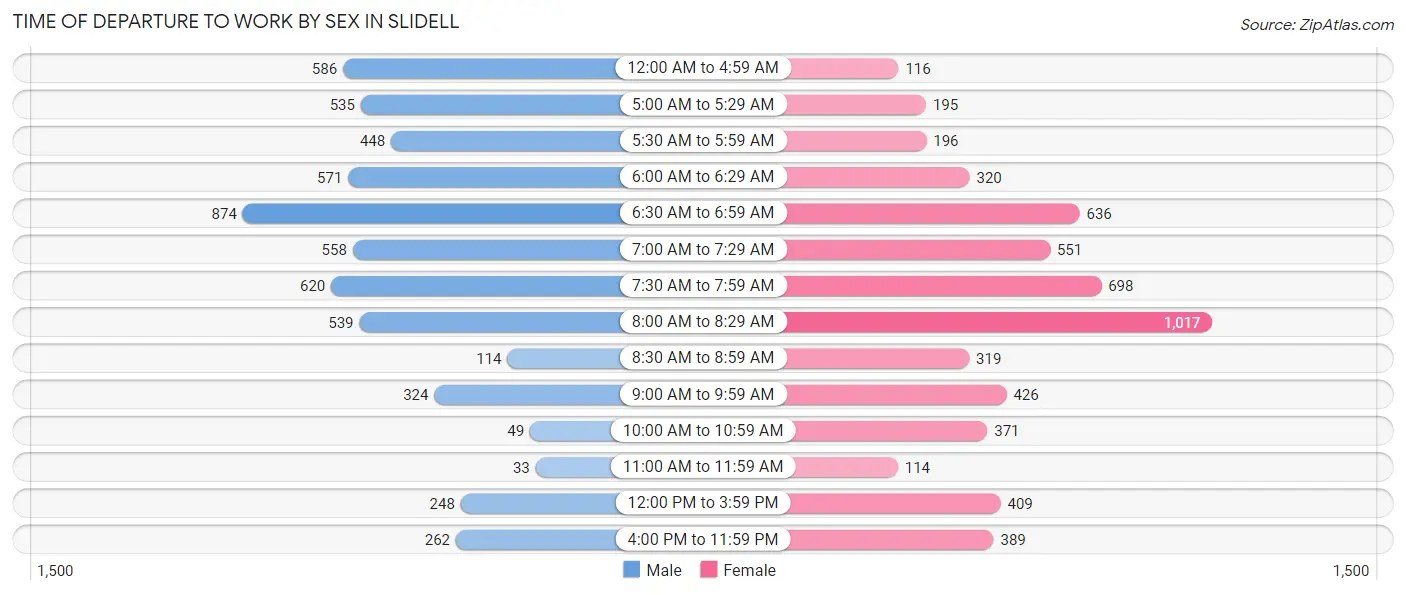
| Time of Departure | Male | Female |
| 12:00 AM to 4:59 AM | 586 (10.2%) | 116 (2.0%) |
| 5:00 AM to 5:29 AM | 535 (9.3%) | 195 (3.4%) |
| 5:30 AM to 5:59 AM | 448 (7.8%) | 196 (3.4%) |
| 6:00 AM to 6:29 AM | 571 (9.9%) | 320 (5.6%) |
| 6:30 AM to 6:59 AM | 874 (15.2%) | 636 (11.1%) |
| 7:00 AM to 7:29 AM | 558 (9.7%) | 551 (9.6%) |
| 7:30 AM to 7:59 AM | 620 (10.8%) | 698 (12.1%) |
| 8:00 AM to 8:29 AM | 539 (9.4%) | 1,017 (17.7%) |
| 8:30 AM to 8:59 AM | 114 (2.0%) | 319 (5.5%) |
| 9:00 AM to 9:59 AM | 324 (5.6%) | 426 (7.4%) |
| 10:00 AM to 10:59 AM | 49 (0.9%) | 371 (6.4%) |
| 11:00 AM to 11:59 AM | 33 (0.6%) | 114 (2.0%) |
| 12:00 PM to 3:59 PM | 248 (4.3%) | 409 (7.1%) |
| 4:00 PM to 11:59 PM | 262 (4.5%) | 389 (6.8%) |
| Total | 5,761 (100.0%) | 5,757 (100.0%) |
Housing Occupancy in Slidell
Occupancy by Ownership in Slidell
Of the total 10,761 dwellings in Slidell, owner-occupied units account for 7,561 (70.3%), while renter-occupied units make up 3,200 (29.7%).
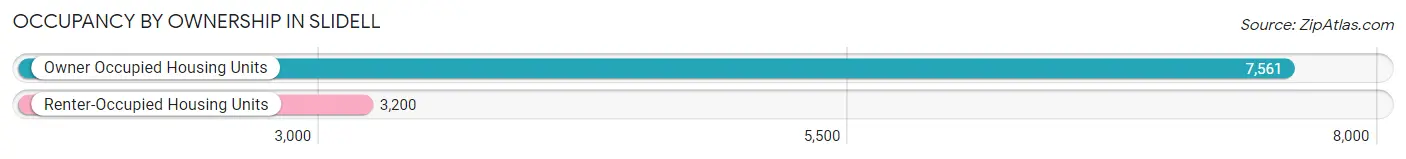
| Occupancy | # Housing Units | % Housing Units |
| Owner Occupied Housing Units | 7,561 | 70.3% |
| Renter-Occupied Housing Units | 3,200 | 29.7% |
| Total Occupied Housing Units | 10,761 | 100.0% |
Occupancy by Household Size in Slidell
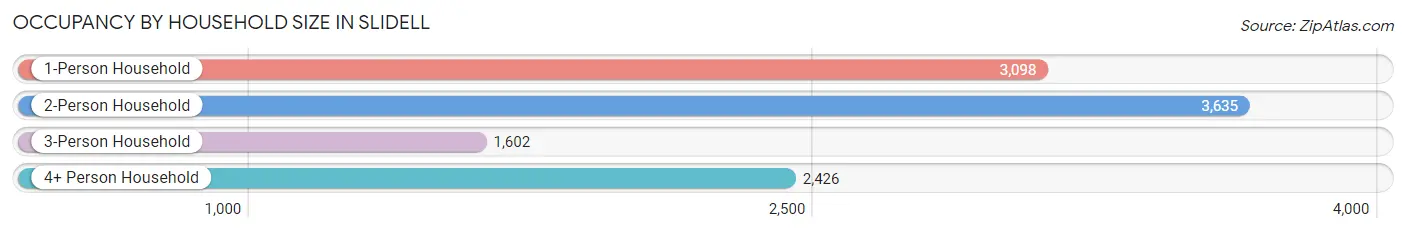
| Household Size | # Housing Units | % Housing Units |
| 1-Person Household | 3,098 | 28.8% |
| 2-Person Household | 3,635 | 33.8% |
| 3-Person Household | 1,602 | 14.9% |
| 4+ Person Household | 2,426 | 22.5% |
| Total Housing Units | 10,761 | 100.0% |
Occupancy by Ownership by Household Size in Slidell
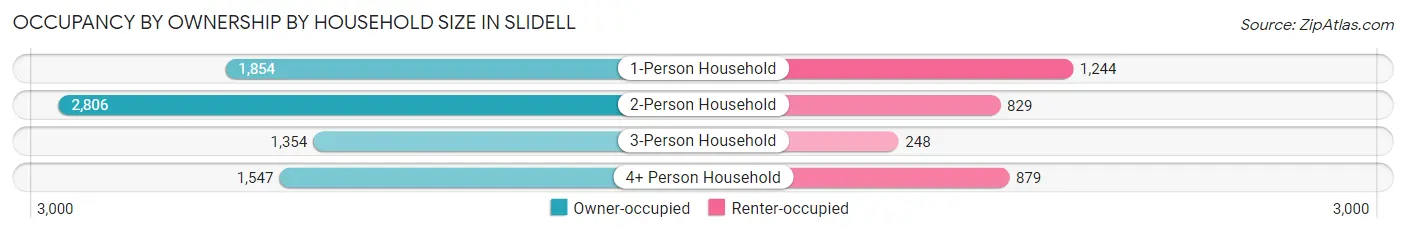
| Household Size | Owner-occupied | Renter-occupied |
| 1-Person Household | 1,854 (59.9%) | 1,244 (40.2%) |
| 2-Person Household | 2,806 (77.2%) | 829 (22.8%) |
| 3-Person Household | 1,354 (84.5%) | 248 (15.5%) |
| 4+ Person Household | 1,547 (63.8%) | 879 (36.2%) |
| Total Housing Units | 7,561 (70.3%) | 3,200 (29.7%) |
Occupancy by Educational Attainment in Slidell
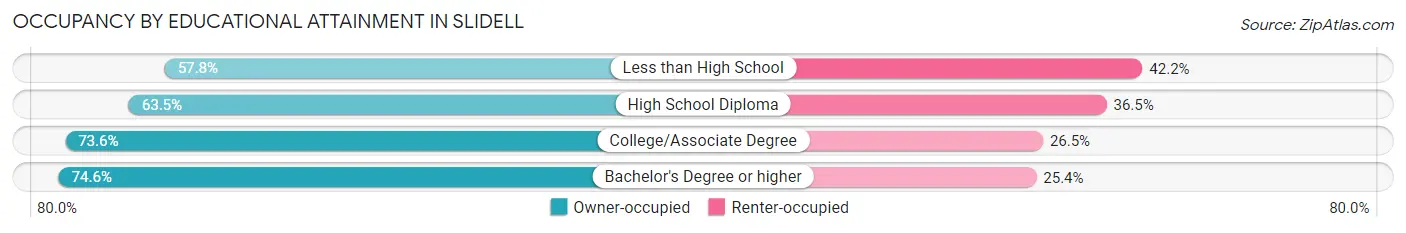
| Household Size | Owner-occupied | Renter-occupied |
| Less than High School | 498 (57.8%) | 364 (42.2%) |
| High School Diploma | 1,603 (63.5%) | 923 (36.5%) |
| College/Associate Degree | 2,812 (73.6%) | 1,011 (26.5%) |
| Bachelor's Degree or higher | 2,648 (74.6%) | 902 (25.4%) |
Occupancy by Age of Householder in Slidell
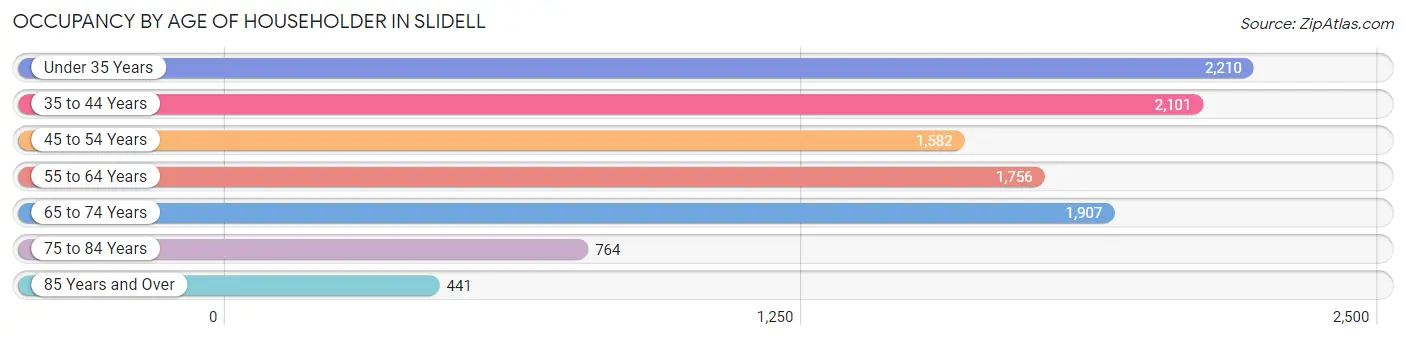
| Age Bracket | # Households | % Households |
| Under 35 Years | 2,210 | 20.5% |
| 35 to 44 Years | 2,101 | 19.5% |
| 45 to 54 Years | 1,582 | 14.7% |
| 55 to 64 Years | 1,756 | 16.3% |
| 65 to 74 Years | 1,907 | 17.7% |
| 75 to 84 Years | 764 | 7.1% |
| 85 Years and Over | 441 | 4.1% |
| Total | 10,761 | 100.0% |
Housing Finances in Slidell
Median Income by Occupancy in Slidell
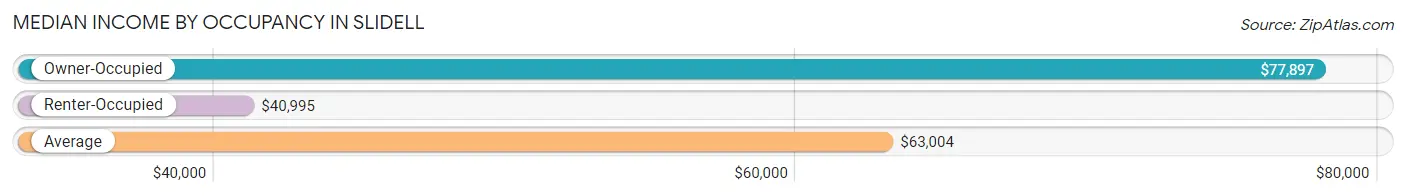
| Occupancy Type | # Households | Median Income |
| Owner-Occupied | 7,561 (70.3%) | $77,897 |
| Renter-Occupied | 3,200 (29.7%) | $40,995 |
| Average | 10,761 (100.0%) | $63,004 |
Occupancy by Householder Income Bracket in Slidell
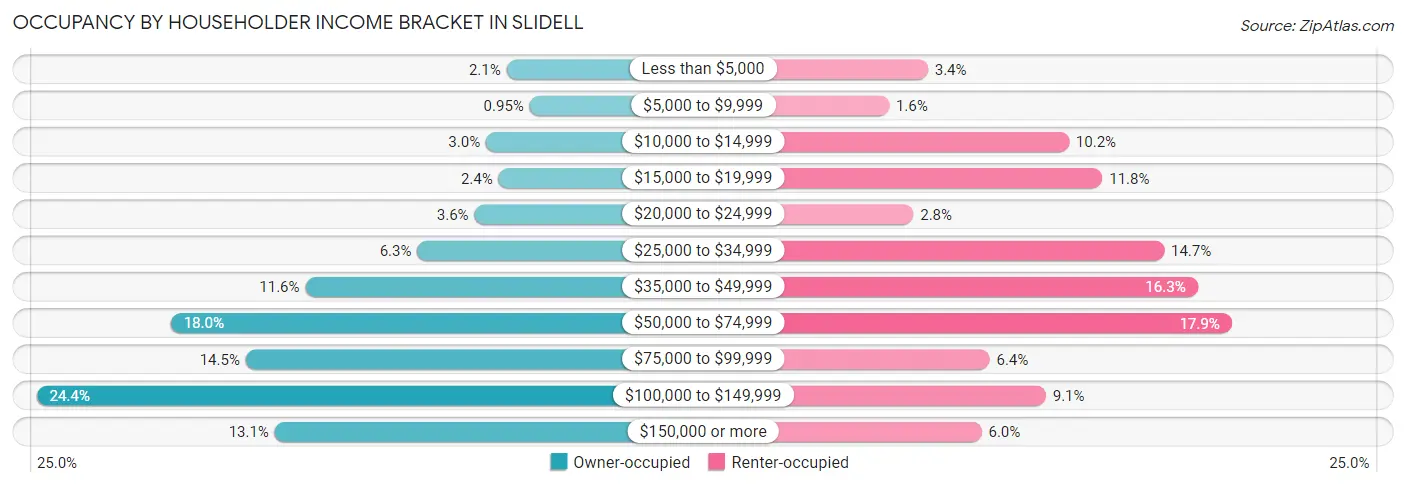
| Income Bracket | Owner-occupied | Renter-occupied |
| Less than $5,000 | 155 (2.1%) | 110 (3.4%) |
| $5,000 to $9,999 | 72 (0.9%) | 51 (1.6%) |
| $10,000 to $14,999 | 229 (3.0%) | 325 (10.2%) |
| $15,000 to $19,999 | 184 (2.4%) | 376 (11.7%) |
| $20,000 to $24,999 | 271 (3.6%) | 88 (2.8%) |
| $25,000 to $34,999 | 476 (6.3%) | 470 (14.7%) |
| $35,000 to $49,999 | 879 (11.6%) | 521 (16.3%) |
| $50,000 to $74,999 | 1,364 (18.0%) | 573 (17.9%) |
| $75,000 to $99,999 | 1,094 (14.5%) | 204 (6.4%) |
| $100,000 to $149,999 | 1,847 (24.4%) | 290 (9.1%) |
| $150,000 or more | 990 (13.1%) | 192 (6.0%) |
| Total | 7,561 (100.0%) | 3,200 (100.0%) |
Monthly Housing Cost Tiers in Slidell
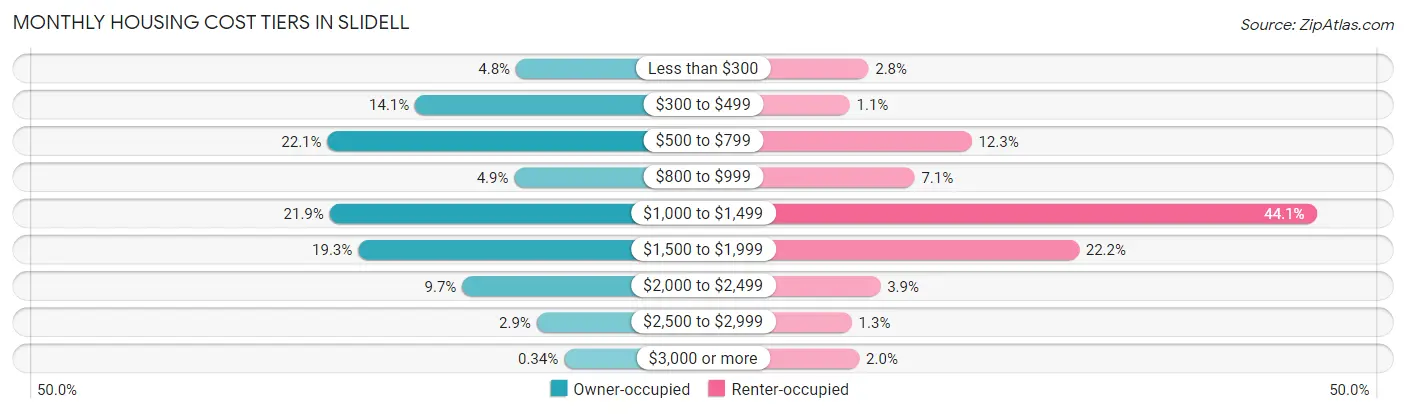
| Monthly Cost | Owner-occupied | Renter-occupied |
| Less than $300 | 361 (4.8%) | 91 (2.8%) |
| $300 to $499 | 1,062 (14.1%) | 36 (1.1%) |
| $500 to $799 | 1,673 (22.1%) | 395 (12.3%) |
| $800 to $999 | 372 (4.9%) | 227 (7.1%) |
| $1,000 to $1,499 | 1,657 (21.9%) | 1,411 (44.1%) |
| $1,500 to $1,999 | 1,459 (19.3%) | 711 (22.2%) |
| $2,000 to $2,499 | 735 (9.7%) | 126 (3.9%) |
| $2,500 to $2,999 | 216 (2.9%) | 42 (1.3%) |
| $3,000 or more | 26 (0.3%) | 64 (2.0%) |
| Total | 7,561 (100.0%) | 3,200 (100.0%) |
Physical Housing Characteristics in Slidell
Housing Structures in Slidell
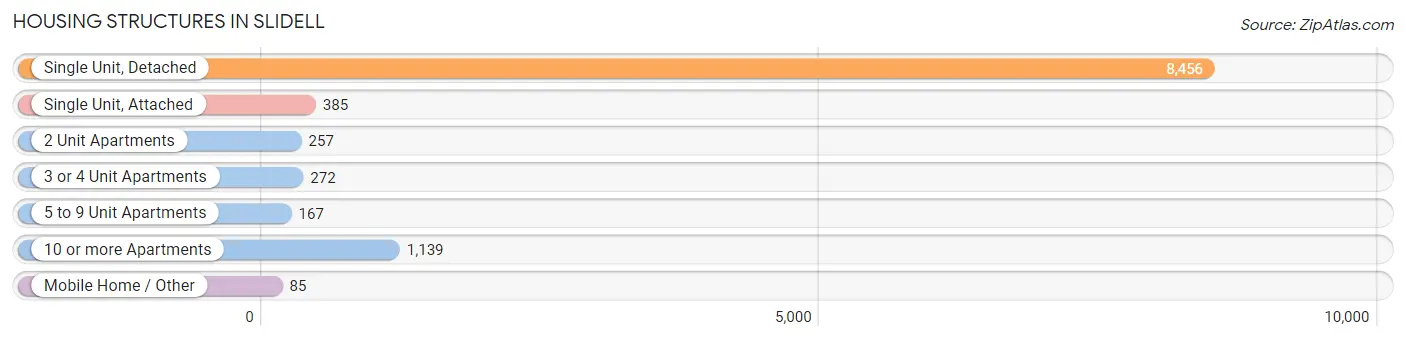
| Structure Type | # Housing Units | % Housing Units |
| Single Unit, Detached | 8,456 | 78.6% |
| Single Unit, Attached | 385 | 3.6% |
| 2 Unit Apartments | 257 | 2.4% |
| 3 or 4 Unit Apartments | 272 | 2.5% |
| 5 to 9 Unit Apartments | 167 | 1.5% |
| 10 or more Apartments | 1,139 | 10.6% |
| Mobile Home / Other | 85 | 0.8% |
| Total | 10,761 | 100.0% |
Housing Structures by Occupancy in Slidell
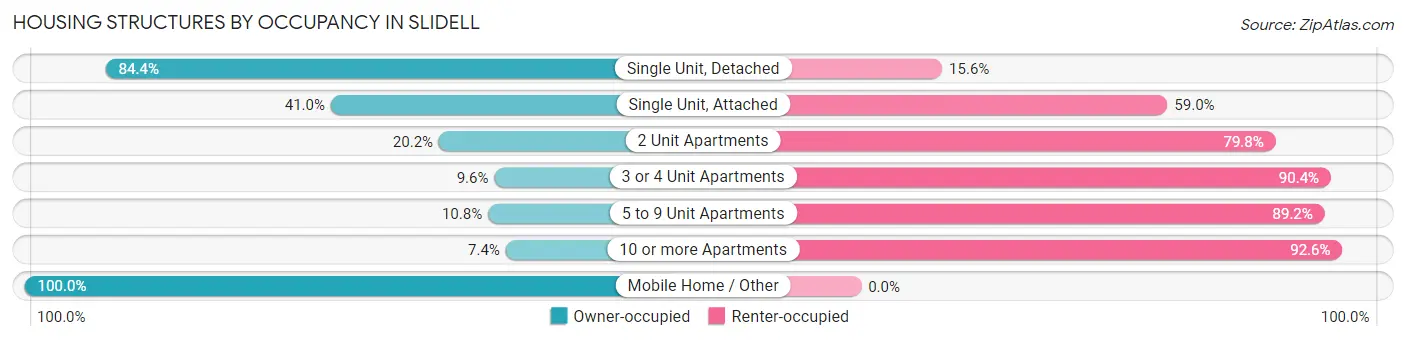
| Structure Type | Owner-occupied | Renter-occupied |
| Single Unit, Detached | 7,138 (84.4%) | 1,318 (15.6%) |
| Single Unit, Attached | 158 (41.0%) | 227 (59.0%) |
| 2 Unit Apartments | 52 (20.2%) | 205 (79.8%) |
| 3 or 4 Unit Apartments | 26 (9.6%) | 246 (90.4%) |
| 5 to 9 Unit Apartments | 18 (10.8%) | 149 (89.2%) |
| 10 or more Apartments | 84 (7.4%) | 1,055 (92.6%) |
| Mobile Home / Other | 85 (100.0%) | 0 (0.0%) |
| Total | 7,561 (70.3%) | 3,200 (29.7%) |
Housing Structures by Number of Rooms in Slidell
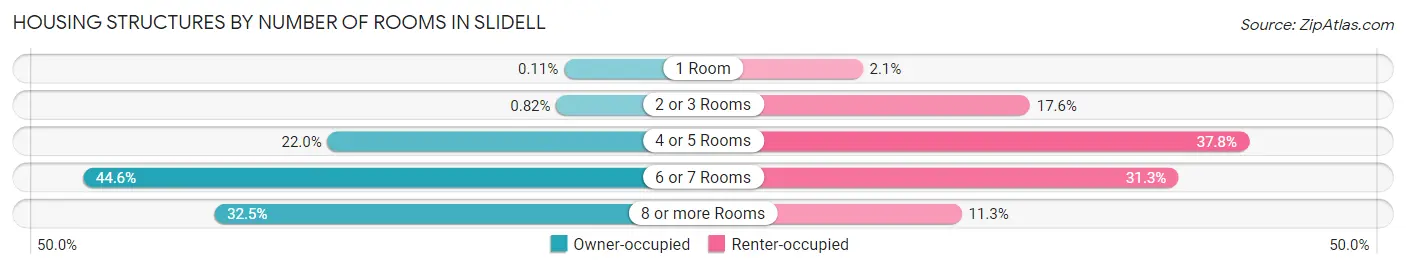
| Number of Rooms | Owner-occupied | Renter-occupied |
| 1 Room | 8 (0.1%) | 67 (2.1%) |
| 2 or 3 Rooms | 62 (0.8%) | 562 (17.6%) |
| 4 or 5 Rooms | 1,662 (22.0%) | 1,210 (37.8%) |
| 6 or 7 Rooms | 3,373 (44.6%) | 1,001 (31.3%) |
| 8 or more Rooms | 2,456 (32.5%) | 360 (11.3%) |
| Total | 7,561 (100.0%) | 3,200 (100.0%) |
Housing Structure by Heating Type in Slidell
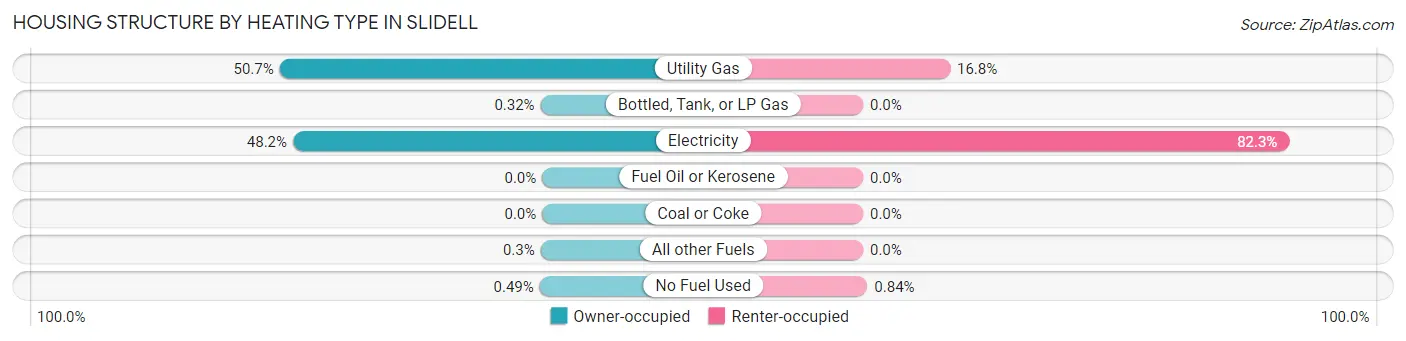
| Heating Type | Owner-occupied | Renter-occupied |
| Utility Gas | 3,836 (50.7%) | 538 (16.8%) |
| Bottled, Tank, or LP Gas | 24 (0.3%) | 0 (0.0%) |
| Electricity | 3,641 (48.2%) | 2,635 (82.3%) |
| Fuel Oil or Kerosene | 0 (0.0%) | 0 (0.0%) |
| Coal or Coke | 0 (0.0%) | 0 (0.0%) |
| All other Fuels | 23 (0.3%) | 0 (0.0%) |
| No Fuel Used | 37 (0.5%) | 27 (0.8%) |
| Total | 7,561 (100.0%) | 3,200 (100.0%) |
Household Vehicle Usage in Slidell
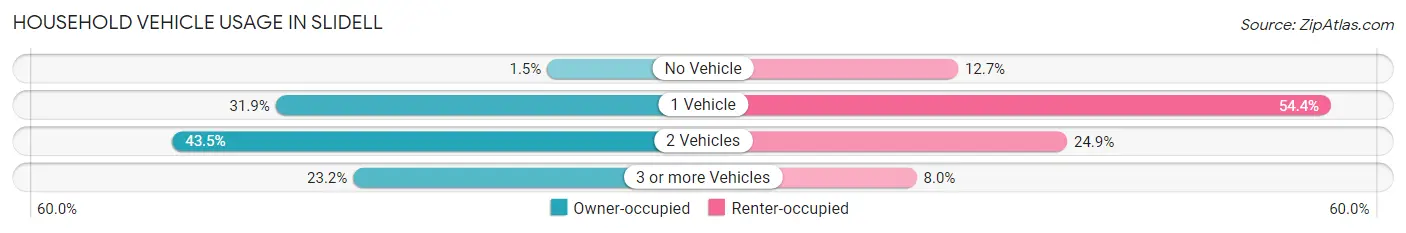
| Vehicles per Household | Owner-occupied | Renter-occupied |
| No Vehicle | 111 (1.5%) | 405 (12.7%) |
| 1 Vehicle | 2,411 (31.9%) | 1,742 (54.4%) |
| 2 Vehicles | 3,285 (43.4%) | 796 (24.9%) |
| 3 or more Vehicles | 1,754 (23.2%) | 257 (8.0%) |
| Total | 7,561 (100.0%) | 3,200 (100.0%) |
Real Estate & Mortgages in Slidell
Real Estate and Mortgage Overview in Slidell
| Characteristic | Without Mortgage | With Mortgage |
| Housing Units | 3,029 | 4,532 |
| Median Property Value | $177,700 | $202,300 |
| Median Household Income | $56,496 | $713 |
| Monthly Housing Costs | $522 | $26 |
| Real Estate Taxes | $1,039 | $99 |
Property Value by Mortgage Status in Slidell
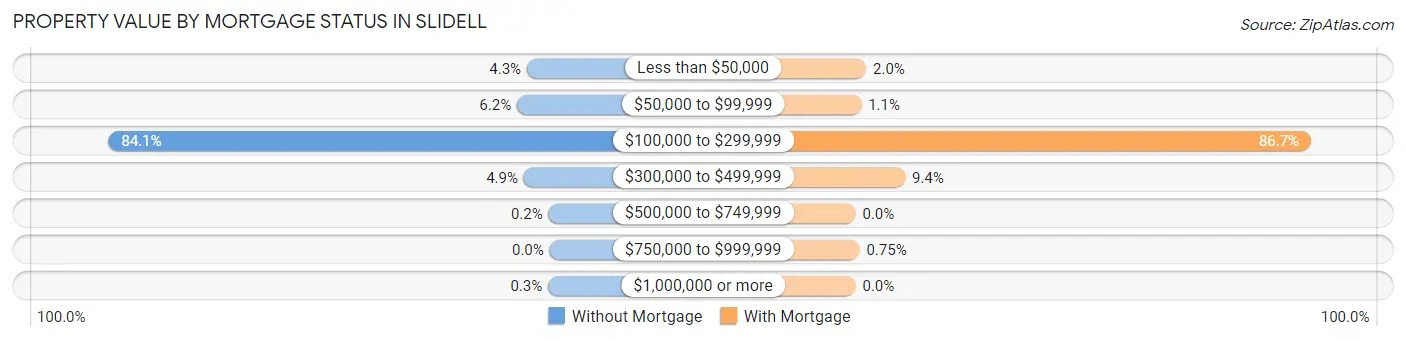
| Property Value | Without Mortgage | With Mortgage |
| Less than $50,000 | 131 (4.3%) | 91 (2.0%) |
| $50,000 to $99,999 | 188 (6.2%) | 49 (1.1%) |
| $100,000 to $299,999 | 2,546 (84.1%) | 3,931 (86.7%) |
| $300,000 to $499,999 | 149 (4.9%) | 427 (9.4%) |
| $500,000 to $749,999 | 6 (0.2%) | 0 (0.0%) |
| $750,000 to $999,999 | 0 (0.0%) | 34 (0.7%) |
| $1,000,000 or more | 9 (0.3%) | 0 (0.0%) |
| Total | 3,029 (100.0%) | 4,532 (100.0%) |
Household Income by Mortgage Status in Slidell
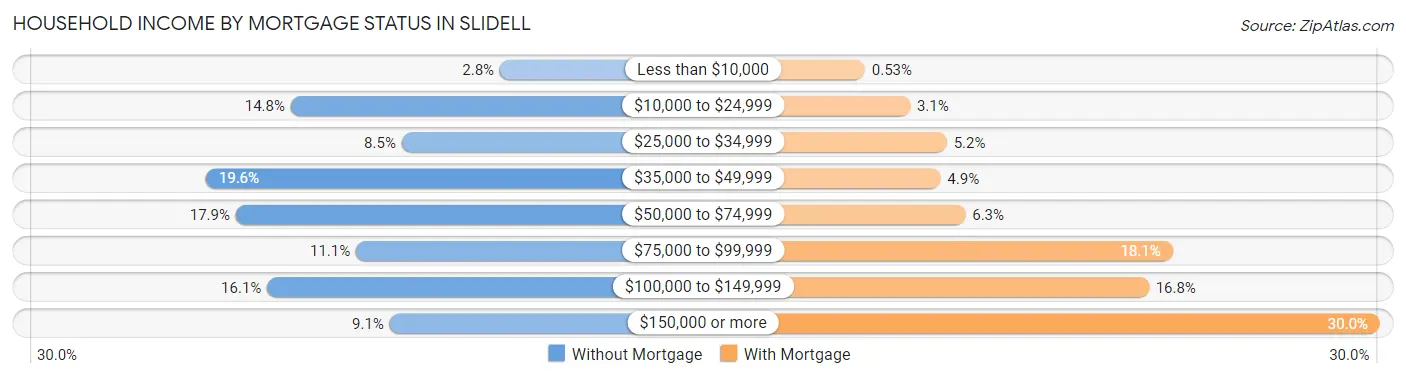
| Household Income | Without Mortgage | With Mortgage |
| Less than $10,000 | 86 (2.8%) | 24 (0.5%) |
| $10,000 to $24,999 | 448 (14.8%) | 141 (3.1%) |
| $25,000 to $34,999 | 256 (8.5%) | 236 (5.2%) |
| $35,000 to $49,999 | 595 (19.6%) | 220 (4.9%) |
| $50,000 to $74,999 | 543 (17.9%) | 284 (6.3%) |
| $75,000 to $99,999 | 335 (11.1%) | 821 (18.1%) |
| $100,000 to $149,999 | 489 (16.1%) | 759 (16.8%) |
| $150,000 or more | 277 (9.1%) | 1,358 (30.0%) |
| Total | 3,029 (100.0%) | 4,532 (100.0%) |
Property Value to Household Income Ratio in Slidell
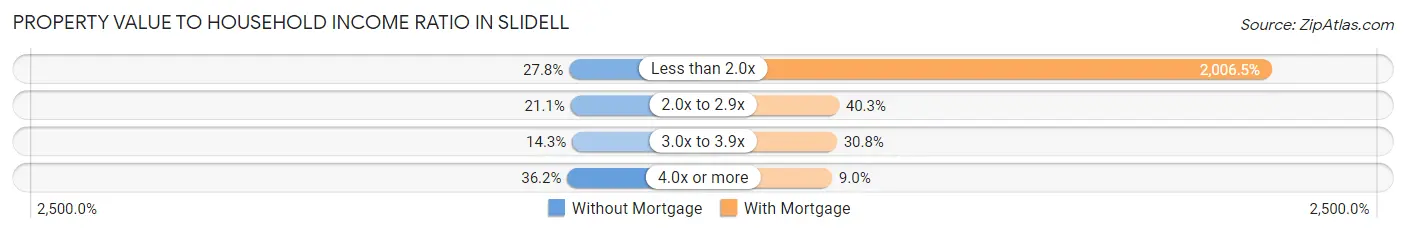
| Value-to-Income Ratio | Without Mortgage | With Mortgage |
| Less than 2.0x | 841 (27.8%) | 90,934 (2,006.5%) |
| 2.0x to 2.9x | 638 (21.1%) | 1,826 (40.3%) |
| 3.0x to 3.9x | 432 (14.3%) | 1,397 (30.8%) |
| 4.0x or more | 1,095 (36.1%) | 407 (9.0%) |
| Total | 3,029 (100.0%) | 4,532 (100.0%) |
Real Estate Taxes by Mortgage Status in Slidell
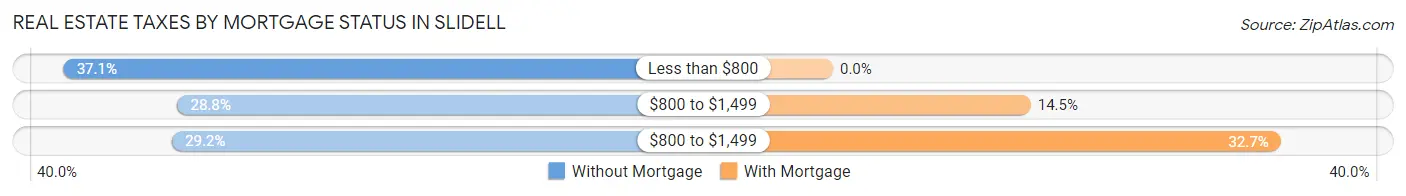
| Property Taxes | Without Mortgage | With Mortgage |
| Less than $800 | 1,125 (37.1%) | 0 (0.0%) |
| $800 to $1,499 | 873 (28.8%) | 655 (14.4%) |
| $800 to $1,499 | 885 (29.2%) | 1,482 (32.7%) |
| Total | 3,029 (100.0%) | 4,532 (100.0%) |
Health & Disability in Slidell
Health Insurance Coverage by Age in Slidell
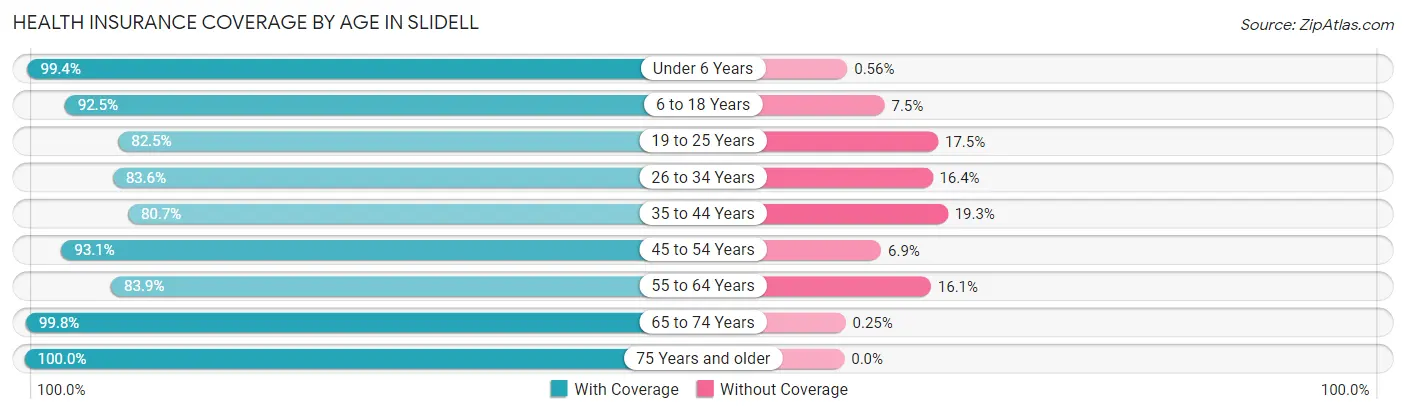
| Age Bracket | With Coverage | Without Coverage |
| Under 6 Years | 1,959 (99.4%) | 11 (0.6%) |
| 6 to 18 Years | 5,204 (92.5%) | 422 (7.5%) |
| 19 to 25 Years | 1,501 (82.5%) | 318 (17.5%) |
| 26 to 34 Years | 2,720 (83.6%) | 535 (16.4%) |
| 35 to 44 Years | 3,224 (80.7%) | 770 (19.3%) |
| 45 to 54 Years | 2,866 (93.1%) | 211 (6.9%) |
| 55 to 64 Years | 2,686 (83.9%) | 517 (16.1%) |
| 65 to 74 Years | 3,132 (99.8%) | 8 (0.3%) |
| 75 Years and older | 1,878 (100.0%) | 0 (0.0%) |
| Total | 25,170 (90.0%) | 2,792 (10.0%) |
Health Insurance Coverage by Citizenship Status in Slidell
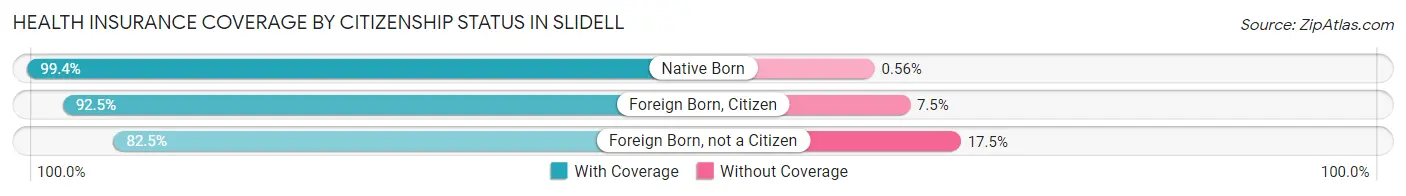
| Citizenship Status | With Coverage | Without Coverage |
| Native Born | 1,959 (99.4%) | 11 (0.6%) |
| Foreign Born, Citizen | 5,204 (92.5%) | 422 (7.5%) |
| Foreign Born, not a Citizen | 1,501 (82.5%) | 318 (17.5%) |
Health Insurance Coverage by Household Income in Slidell
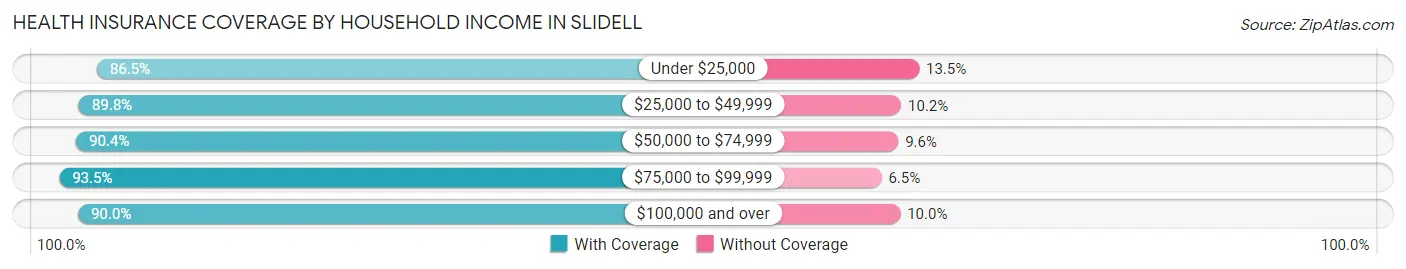
| Household Income | With Coverage | Without Coverage |
| Under $25,000 | 3,116 (86.5%) | 488 (13.5%) |
| $25,000 to $49,999 | 5,152 (89.8%) | 584 (10.2%) |
| $50,000 to $74,999 | 4,239 (90.4%) | 452 (9.6%) |
| $75,000 to $99,999 | 3,287 (93.5%) | 228 (6.5%) |
| $100,000 and over | 9,324 (90.0%) | 1,037 (10.0%) |
Public vs Private Health Insurance Coverage by Age in Slidell
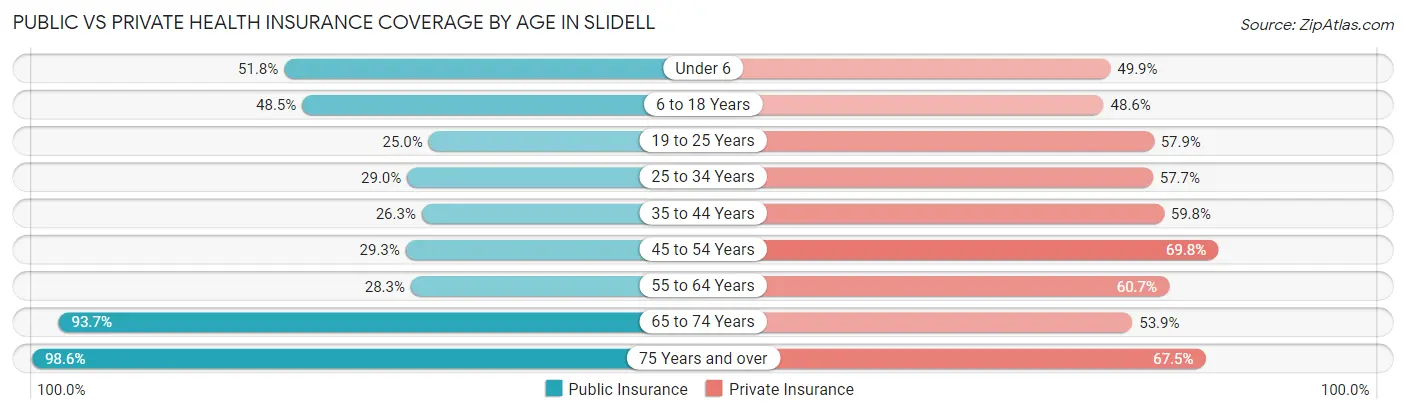
| Age Bracket | Public Insurance | Private Insurance |
| Under 6 | 1,021 (51.8%) | 982 (49.8%) |
| 6 to 18 Years | 2,728 (48.5%) | 2,734 (48.6%) |
| 19 to 25 Years | 455 (25.0%) | 1,053 (57.9%) |
| 25 to 34 Years | 944 (29.0%) | 1,879 (57.7%) |
| 35 to 44 Years | 1,050 (26.3%) | 2,387 (59.8%) |
| 45 to 54 Years | 901 (29.3%) | 2,149 (69.8%) |
| 55 to 64 Years | 907 (28.3%) | 1,944 (60.7%) |
| 65 to 74 Years | 2,942 (93.7%) | 1,693 (53.9%) |
| 75 Years and over | 1,852 (98.6%) | 1,267 (67.5%) |
| Total | 12,800 (45.8%) | 16,088 (57.5%) |
Disability Status by Sex by Age in Slidell
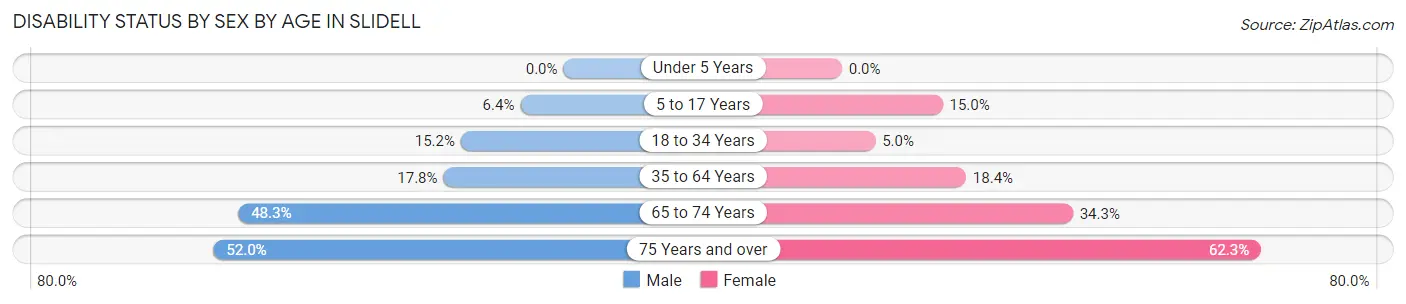
| Age Bracket | Male | Female |
| Under 5 Years | 0 (0.0%) | 0 (0.0%) |
| 5 to 17 Years | 183 (6.4%) | 413 (15.0%) |
| 18 to 34 Years | 370 (15.2%) | 153 (5.0%) |
| 35 to 64 Years | 859 (17.8%) | 1,005 (18.4%) |
| 65 to 74 Years | 626 (48.3%) | 632 (34.3%) |
| 75 Years and over | 384 (52.0%) | 709 (62.3%) |
Disability Class by Sex by Age in Slidell
Disability Class: Hearing Difficulty
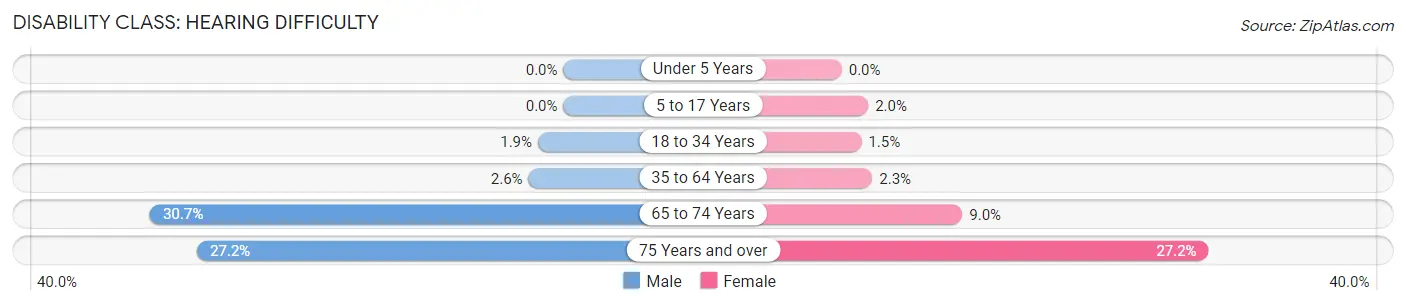
| Age Bracket | Male | Female |
| Under 5 Years | 0 (0.0%) | 0 (0.0%) |
| 5 to 17 Years | 0 (0.0%) | 54 (2.0%) |
| 18 to 34 Years | 46 (1.9%) | 45 (1.5%) |
| 35 to 64 Years | 125 (2.6%) | 124 (2.3%) |
| 65 to 74 Years | 398 (30.7%) | 165 (8.9%) |
| 75 Years and over | 201 (27.2%) | 310 (27.2%) |
Disability Class: Vision Difficulty
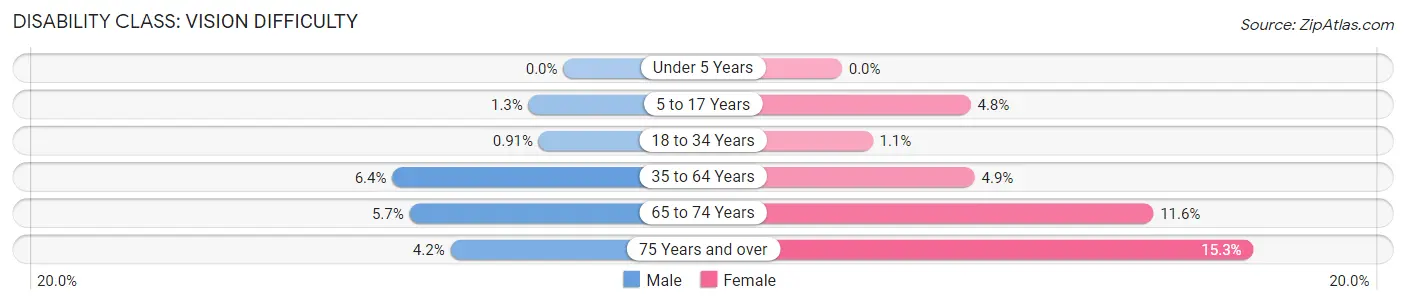
| Age Bracket | Male | Female |
| Under 5 Years | 0 (0.0%) | 0 (0.0%) |
| 5 to 17 Years | 37 (1.3%) | 132 (4.8%) |
| 18 to 34 Years | 22 (0.9%) | 35 (1.1%) |
| 35 to 64 Years | 306 (6.4%) | 269 (4.9%) |
| 65 to 74 Years | 74 (5.7%) | 213 (11.6%) |
| 75 Years and over | 31 (4.2%) | 174 (15.3%) |
Disability Class: Cognitive Difficulty
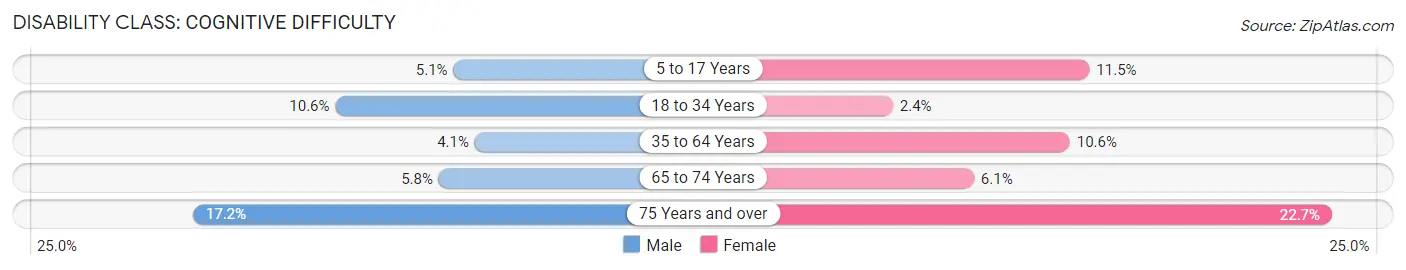
| Age Bracket | Male | Female |
| 5 to 17 Years | 146 (5.1%) | 317 (11.5%) |
| 18 to 34 Years | 257 (10.6%) | 73 (2.4%) |
| 35 to 64 Years | 198 (4.1%) | 577 (10.6%) |
| 65 to 74 Years | 75 (5.8%) | 113 (6.1%) |
| 75 Years and over | 127 (17.2%) | 259 (22.7%) |
Disability Class: Ambulatory Difficulty
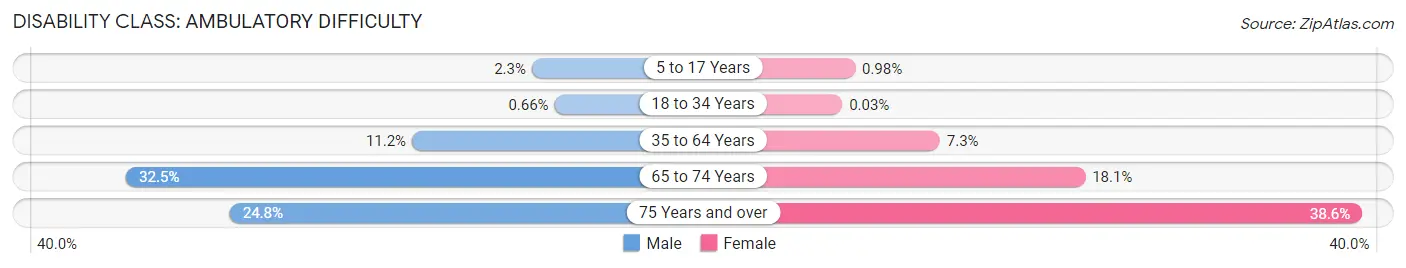
| Age Bracket | Male | Female |
| 5 to 17 Years | 67 (2.3%) | 27 (1.0%) |
| 18 to 34 Years | 16 (0.7%) | 1 (0.0%) |
| 35 to 64 Years | 542 (11.2%) | 397 (7.3%) |
| 65 to 74 Years | 421 (32.5%) | 333 (18.1%) |
| 75 Years and over | 183 (24.8%) | 440 (38.6%) |
Disability Class: Self-Care Difficulty
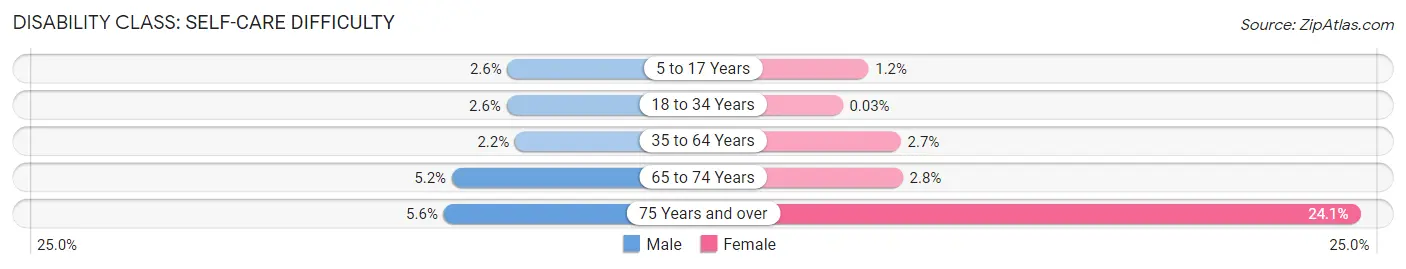
| Age Bracket | Male | Female |
| 5 to 17 Years | 74 (2.6%) | 34 (1.2%) |
| 18 to 34 Years | 64 (2.6%) | 1 (0.0%) |
| 35 to 64 Years | 108 (2.2%) | 149 (2.7%) |
| 65 to 74 Years | 67 (5.2%) | 52 (2.8%) |
| 75 Years and over | 41 (5.6%) | 274 (24.1%) |
Technology Access in Slidell
Computing Device Access in Slidell
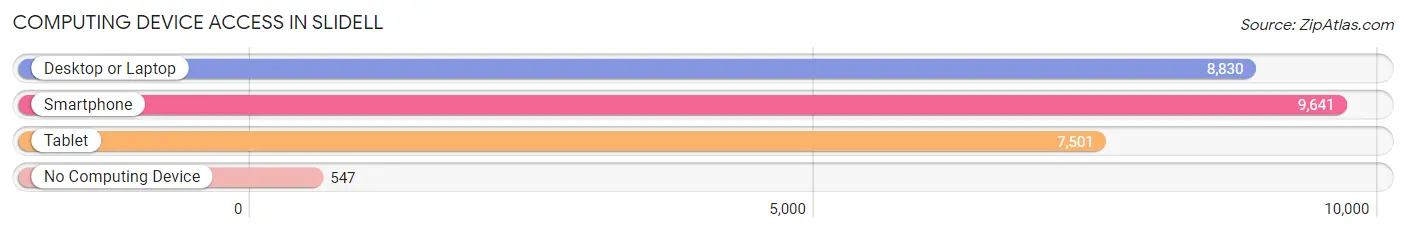
| Device Type | # Households | % Households |
| Desktop or Laptop | 8,830 | 82.1% |
| Smartphone | 9,641 | 89.6% |
| Tablet | 7,501 | 69.7% |
| No Computing Device | 547 | 5.1% |
| Total | 10,761 | 100.0% |
Internet Access in Slidell
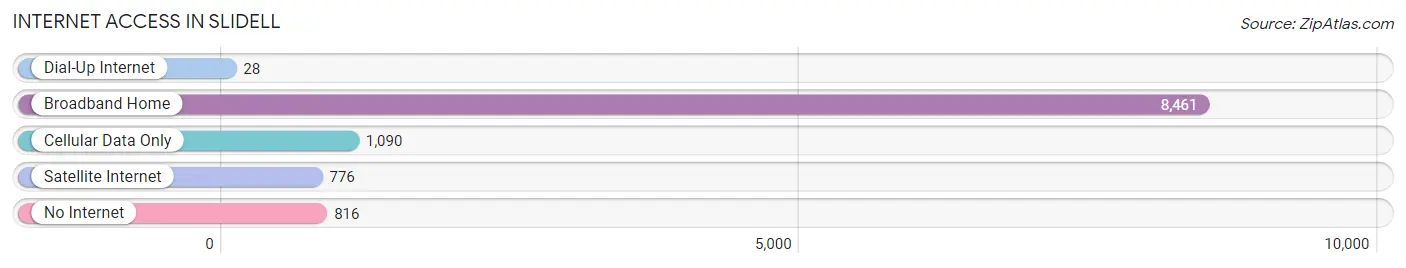
| Internet Type | # Households | % Households |
| Dial-Up Internet | 28 | 0.3% |
| Broadband Home | 8,461 | 78.6% |
| Cellular Data Only | 1,090 | 10.1% |
| Satellite Internet | 776 | 7.2% |
| No Internet | 816 | 7.6% |
| Total | 10,761 | 100.0% |
Slidell Summary
Slidell is a city located in St. Tammany Parish, Louisiana, United States. It is situated on the northeast shore of Lake Pontchartrain, about 30 miles (48 km) east of New Orleans. The population was 27,068 at the 2010 census. Greater Slidell has a population of about 90,000. It is part of the New Orleans–Metairie–Kenner Metropolitan Statistical Area.
History
Slidell was founded in 1882 by John Slidell, a wealthy New Orleans businessman and diplomat. He named the city after his father, John Slidell, Sr., who was a prominent politician in the area. The town was incorporated in 1888.
The city was originally a small fishing village, but it grew rapidly after the completion of the New Orleans and Northeastern Railroad in 1888. The railroad connected Slidell to New Orleans and other cities in the region. The city became a popular tourist destination, and it was known for its seafood restaurants and resorts.
Geography
Slidell is located at 30°17′N 89°45′W (30.28, -89.75). According to the United States Census Bureau, the city has a total area of 16.2 square miles (41.8 km2), of which 15.5 square miles (40.1 km2) is land and 0.7 square miles (1.7 km2) (4.37%) is water.
Economy
Slidell’s economy is largely based on tourism, manufacturing, and retail. The city is home to several large manufacturing plants, including a paper mill and a chemical plant. The city also has a large retail sector, with several shopping centers and malls.
Slidell is also home to several large employers, including Northrop Grumman, a defense contractor, and Ochsner Health System, a healthcare provider. The city is also home to several smaller businesses, including restaurants, bars, and other retail establishments.
Demographics
As of the 2010 census, there were 27,068 people, 10,890 households, and 7,541 families residing in the city. The population density was 1,743.3 people per square mile (673.2/km2). There were 11,837 housing units at an average density of 763.2 per square mile (294.7/km2). The racial makeup of the city was 79.2% White, 14.3% African American, 0.3% Native American, 2.2% Asian, 0.1% Pacific Islander, 1.2% from other races, and 2.7% from two or more races. Hispanic or Latino of any race were 4.7% of the population.
There were 10,890 households, out of which 33.2% had children under the age of 18 living with them, 51.2% were married couples living together, 14.2% had a female householder with no husband present, and 29.7% were non-families. 24.2% of all households were made up of individuals, and 8.2% had someone living alone who was 65 years of age or older. The average household size was 2.50 and the average family size was 2.96.
In the city, the population was spread out, with 25.2% under the age of 18, 8.7% from 18 to 24, 30.2% from 25 to 44, 23.2% from 45 to 64, and 12.7% who were 65 years of age or older. The median age was 36 years. For every 100 females, there were 93.2 males. For every 100 females age 18 and over, there were 89.7 males.
The median income for a household in the city was $45,902, and the median income for a family was $54,844. Males had a median income of $41,845 versus $27,851 for females. The per capita income for the city was $22,890. About 8.7% of families and 11.2% of the population were below the poverty line, including 15.2% of those under age 18 and 8.7% of those age 65 or over.
Common Questions
What is Per Capita Income in Slidell?
Per Capita income in Slidell is $31,276.
What is the Median Family Income in Slidell?
Median Family Income in Slidell is $75,525.
What is the Median Household income in Slidell?
Median Household Income in Slidell is $63,004.
What is Income or Wage Gap in Slidell?
Income or Wage Gap in Slidell is 38.8%.
Women in Slidell earn 61.2 cents for every dollar earned by a man.
What is Family Income Deficit in Slidell?
Family Income Deficit in Slidell is $12,653.
Families that are below poverty line in Slidell earn $12,653 less on average than the poverty threshold level.
What is Inequality or Gini Index in Slidell?
Inequality or Gini Index in Slidell is 0.40.
What is the Total Population of Slidell?
Total Population of Slidell is 28,690.
What is the Total Male Population of Slidell?
Total Male Population of Slidell is 13,419.
What is the Total Female Population of Slidell?
Total Female Population of Slidell is 15,271.
What is the Ratio of Males per 100 Females in Slidell?
There are 87.87 Males per 100 Females in Slidell.
What is the Ratio of Females per 100 Males in Slidell?
There are 113.80 Females per 100 Males in Slidell.
What is the Median Population Age in Slidell?
Median Population Age in Slidell is 38.7 Years.
What is the Average Family Size in Slidell
Average Family Size in Slidell is 3.2 People.
What is the Average Household Size in Slidell
Average Household Size in Slidell is 2.6 People.
How Large is the Labor Force in Slidell?
There are 13,828 People in the Labor Forcein in Slidell.
What is the Percentage of People in the Labor Force in Slidell?
62.3% of People are in the Labor Force in Slidell.
What is the Unemployment Rate in Slidell?
Unemployment Rate in Slidell is 5.2%.