Houma, LA Map & Demographics
Houma Map
Houma Overview
$34,727
PER CAPITA INCOME
$75,686
AVG FAMILY INCOME
$56,823
AVG HOUSEHOLD INCOME
47.4%
WAGE / INCOME GAP [ % ]
52.6¢/ $1
WAGE / INCOME GAP [ $ ]
$8,939
FAMILY INCOME DEFICIT
0.51
INEQUALITY / GINI INDEX
33,094
TOTAL POPULATION
16,165
MALE POPULATION
16,929
FEMALE POPULATION
95.49
MALES / 100 FEMALES
104.73
FEMALES / 100 MALES
35.7
MEDIAN AGE
3.0
AVG FAMILY SIZE
2.5
AVG HOUSEHOLD SIZE
15,668
LABOR FORCE [ PEOPLE ]
62.3%
PERCENT IN LABOR FORCE
5.1%
UNEMPLOYMENT RATE
Houma Area Codes
Income in Houma
Income Overview in Houma
Per Capita Income in Houma is $34,727, while median incomes of families and households are $75,686 and $56,823 respectively.
| Characteristic | Number | Measure |
| Per Capita Income | 33,094 | $34,727 |
| Median Family Income | 8,693 | $75,686 |
| Mean Family Income | 8,693 | $96,087 |
| Median Household Income | 13,315 | $56,823 |
| Mean Household Income | 13,315 | $85,363 |
| Income Deficit | 8,693 | $8,939 |
| Wage / Income Gap (%) | 33,094 | 47.39% |
| Wage / Income Gap ($) | 33,094 | 52.61¢ per $1 |
| Gini / Inequality Index | 33,094 | 0.51 |
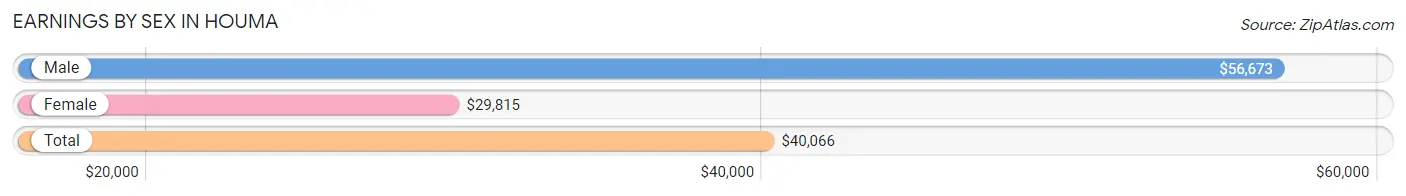
Earnings by Sex in Houma
Average Earnings in Houma are $40,066, $56,673 for men and $29,815 for women, a difference of 47.4%.
| Sex | Number | Average Earnings |
| Male | 8,408 (52.6%) | $56,673 |
| Female | 7,561 (47.3%) | $29,815 |
| Total | 15,969 (100.0%) | $40,066 |
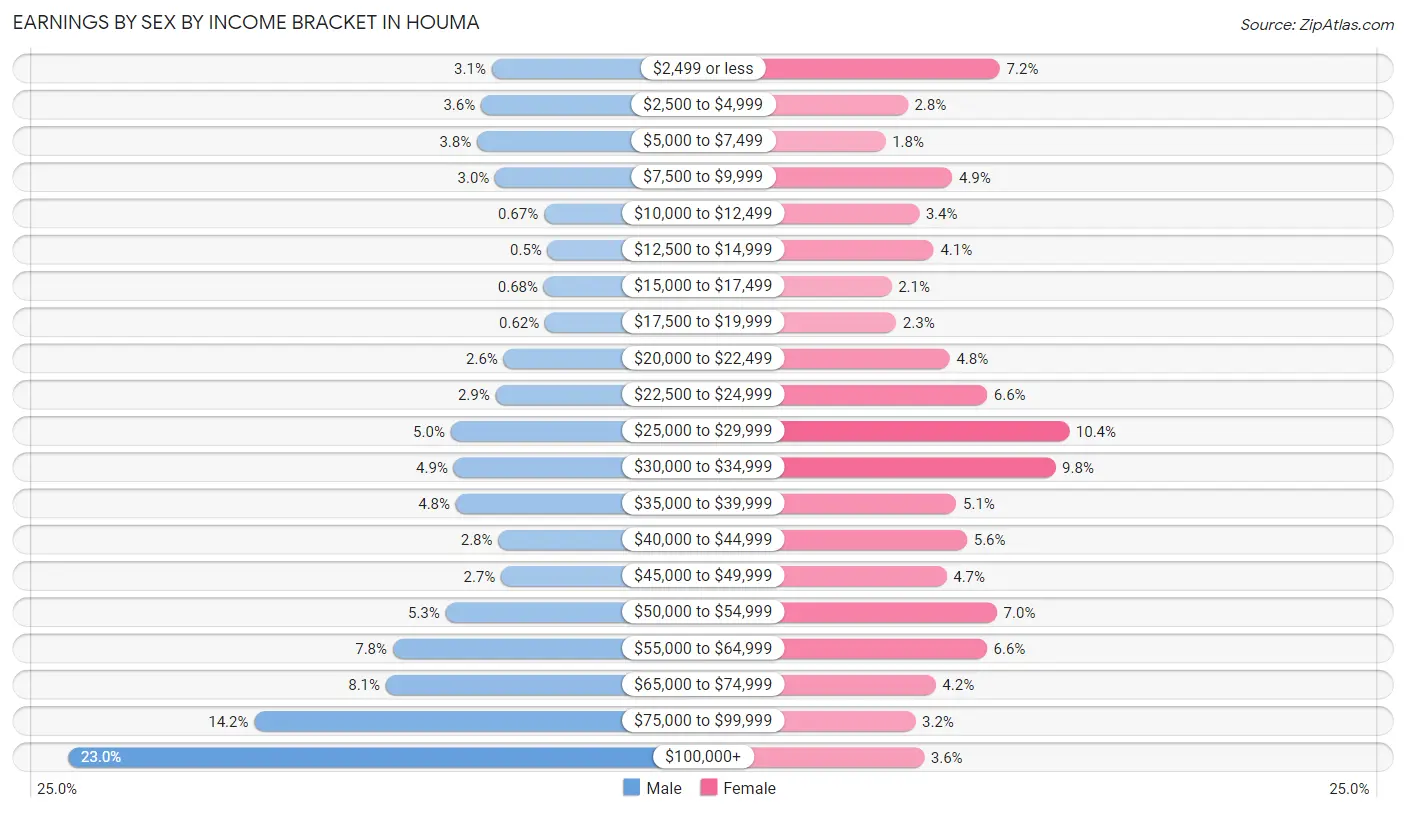
Earnings by Sex by Income Bracket in Houma
The most common earnings brackets in Houma are $100,000+ for men (1,931 | 23.0%) and $25,000 to $29,999 for women (786 | 10.4%).
| Income | Male | Female |
| $2,499 or less | 262 (3.1%) | 541 (7.2%) |
| $2,500 to $4,999 | 304 (3.6%) | 215 (2.8%) |
| $5,000 to $7,499 | 320 (3.8%) | 136 (1.8%) |
| $7,500 to $9,999 | 249 (3.0%) | 373 (4.9%) |
| $10,000 to $12,499 | 56 (0.7%) | 255 (3.4%) |
| $12,500 to $14,999 | 42 (0.5%) | 307 (4.1%) |
| $15,000 to $17,499 | 57 (0.7%) | 157 (2.1%) |
| $17,500 to $19,999 | 52 (0.6%) | 174 (2.3%) |
| $20,000 to $22,499 | 215 (2.6%) | 364 (4.8%) |
| $22,500 to $24,999 | 247 (2.9%) | 496 (6.6%) |
| $25,000 to $29,999 | 424 (5.0%) | 786 (10.4%) |
| $30,000 to $34,999 | 412 (4.9%) | 738 (9.8%) |
| $35,000 to $39,999 | 404 (4.8%) | 387 (5.1%) |
| $40,000 to $44,999 | 236 (2.8%) | 425 (5.6%) |
| $45,000 to $49,999 | 225 (2.7%) | 352 (4.7%) |
| $50,000 to $54,999 | 444 (5.3%) | 531 (7.0%) |
| $55,000 to $64,999 | 652 (7.7%) | 495 (6.6%) |
| $65,000 to $74,999 | 679 (8.1%) | 314 (4.2%) |
| $75,000 to $99,999 | 1,197 (14.2%) | 242 (3.2%) |
| $100,000+ | 1,931 (23.0%) | 273 (3.6%) |
| Total | 8,408 (100.0%) | 7,561 (100.0%) |
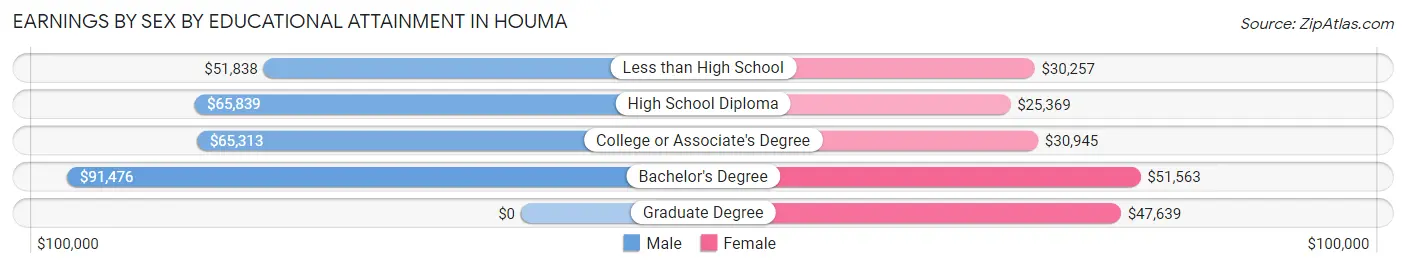
Earnings by Sex by Educational Attainment in Houma
Average earnings in Houma are $66,285 for men and $32,200 for women, a difference of 51.4%. Men with an educational attainment of bachelor's degree enjoy the highest average annual earnings of $91,476, while those with less than high school education earn the least with $51,838. Women with an educational attainment of bachelor's degree earn the most with the average annual earnings of $51,563, while those with high school diploma education have the smallest earnings of $25,369.
| Educational Attainment | Male Income | Female Income |
| Less than High School | $51,838 | $30,257 |
| High School Diploma | $65,839 | $25,369 |
| College or Associate's Degree | $65,313 | $30,945 |
| Bachelor's Degree | $91,476 | $51,563 |
| Graduate Degree | - | - |
| Total | $66,285 | $32,200 |
Family Income in Houma
Family Income Brackets in Houma
According to the Houma family income data, there are 1,495 families falling into the $100,000 to $149,999 income range, which is the most common income bracket and makes up 17.2% of all families. Conversely, the $10,000 to $14,999 income bracket is the least frequent group with only 104 families (1.2%) belonging to this category.
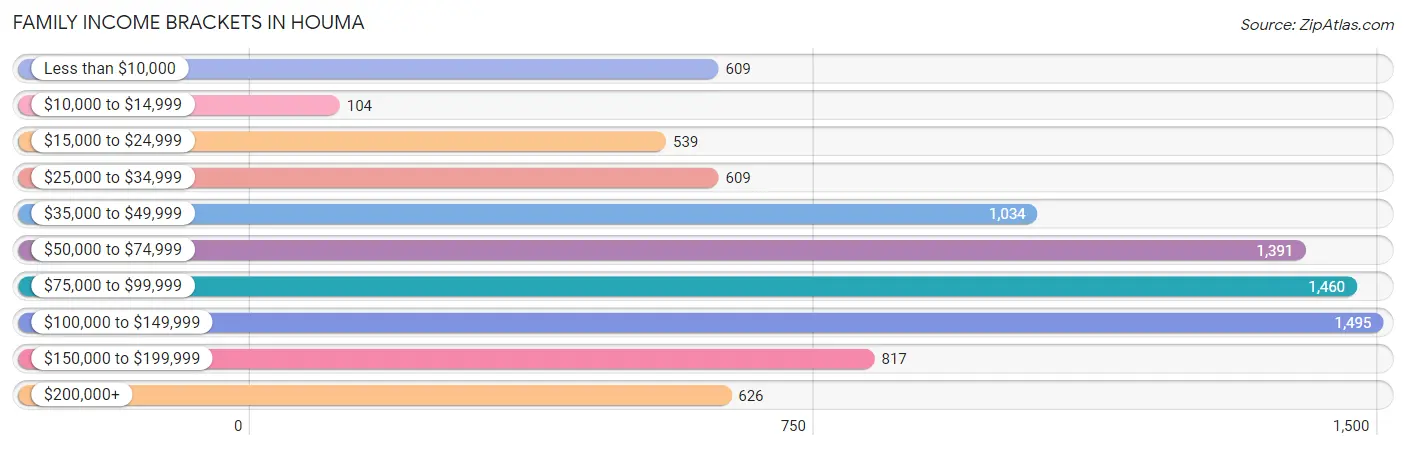
| Income Bracket | # Families | % Families |
| Less than $10,000 | 609 | 7.0% |
| $10,000 to $14,999 | 104 | 1.2% |
| $15,000 to $24,999 | 539 | 6.2% |
| $25,000 to $34,999 | 609 | 7.0% |
| $35,000 to $49,999 | 1,034 | 11.9% |
| $50,000 to $74,999 | 1,391 | 16.0% |
| $75,000 to $99,999 | 1,460 | 16.8% |
| $100,000 to $149,999 | 1,495 | 17.2% |
| $150,000 to $199,999 | 817 | 9.4% |
| $200,000+ | 626 | 7.2% |
Family Income by Famaliy Size in Houma
7+ person families (71 | 0.8%) account for the highest median family income in Houma with $212,724 per family, while 7+ person families (71 | 0.8%) have the highest median income of $30,389 per family member.
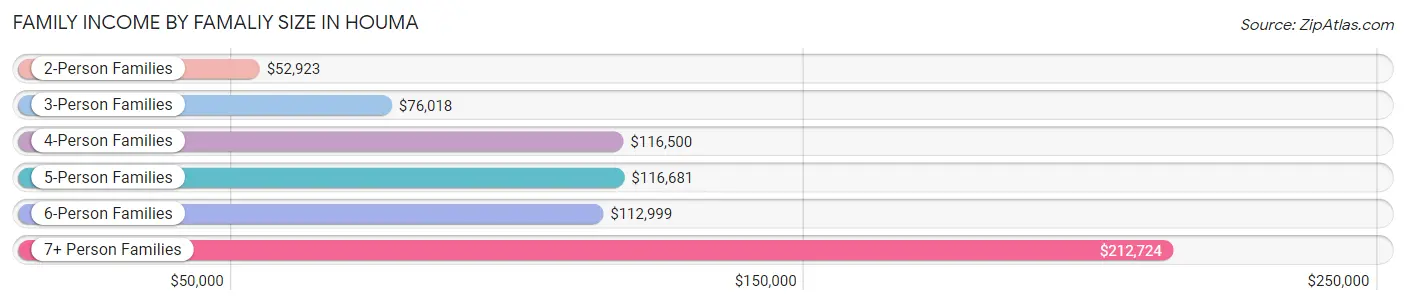
| Income Bracket | # Families | Median Income |
| 2-Person Families | 4,277 (49.2%) | $52,923 |
| 3-Person Families | 1,919 (22.1%) | $76,018 |
| 4-Person Families | 1,096 (12.6%) | $116,500 |
| 5-Person Families | 821 (9.4%) | $116,681 |
| 6-Person Families | 509 (5.9%) | $112,999 |
| 7+ Person Families | 71 (0.8%) | $212,724 |
| Total | 8,693 (100.0%) | $75,686 |
Family Income by Number of Earners in Houma
The median family income in Houma is $75,686, with families comprising 3+ earners (714) having the highest median family income of $115,862, while families with no earners (1,538) have the lowest median family income of $40,445, accounting for 8.2% and 17.7% of families, respectively.
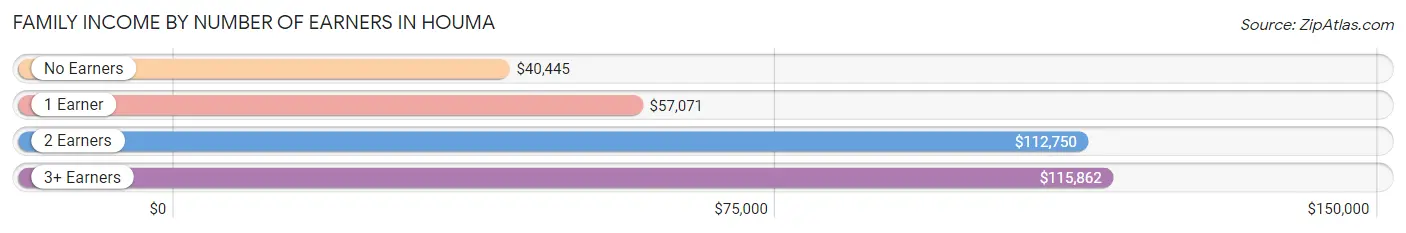
| Number of Earners | # Families | Median Income |
| No Earners | 1,538 (17.7%) | $40,445 |
| 1 Earner | 3,553 (40.9%) | $57,071 |
| 2 Earners | 2,888 (33.2%) | $112,750 |
| 3+ Earners | 714 (8.2%) | $115,862 |
| Total | 8,693 (100.0%) | $75,686 |
Household Income in Houma
Household Income Brackets in Houma
With 2,011 households falling in the category, the $50,000 to $74,999 income range is the most frequent in Houma, accounting for 15.1% of all households. In contrast, only 573 households (4.3%) fall into the $10,000 to $14,999 income bracket, making it the least populous group.
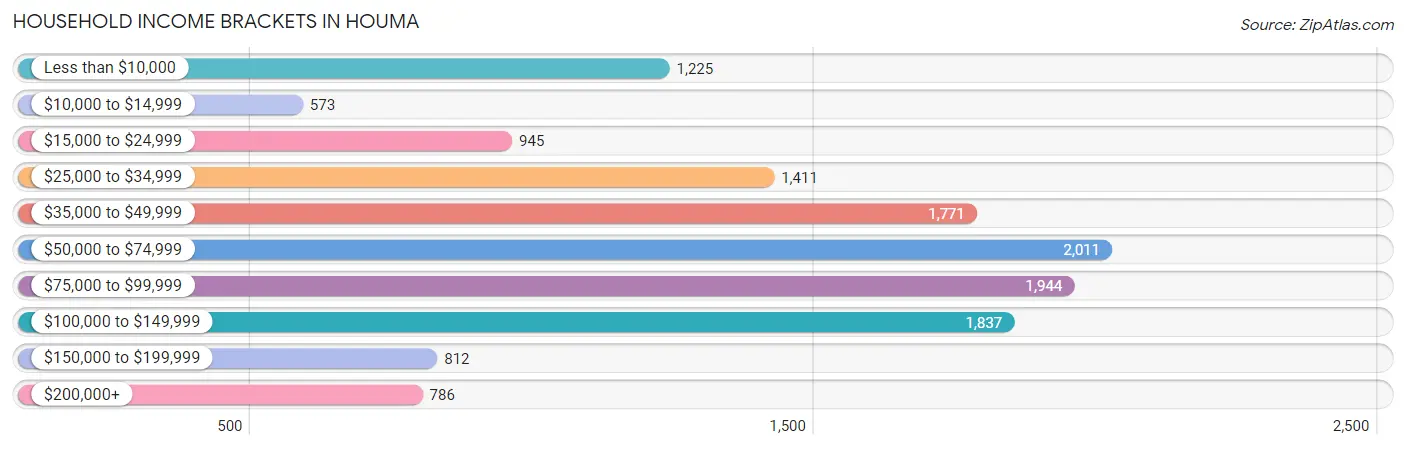
| Income Bracket | # Households | % Households |
| Less than $10,000 | 1,225 | 9.2% |
| $10,000 to $14,999 | 573 | 4.3% |
| $15,000 to $24,999 | 945 | 7.1% |
| $25,000 to $34,999 | 1,411 | 10.6% |
| $35,000 to $49,999 | 1,771 | 13.3% |
| $50,000 to $74,999 | 2,011 | 15.1% |
| $75,000 to $99,999 | 1,944 | 14.6% |
| $100,000 to $149,999 | 1,837 | 13.8% |
| $150,000 to $199,999 | 812 | 6.1% |
| $200,000+ | 786 | 5.9% |
Household Income by Householder Age in Houma
The median household income in Houma is $56,823, with the highest median household income of $75,320 found in the 25 to 44 years age bracket for the primary householder. A total of 5,143 households (38.6%) fall into this category. Meanwhile, the 15 to 24 years age bracket for the primary householder has the lowest median household income of $37,081, with 438 households (3.3%) in this group.
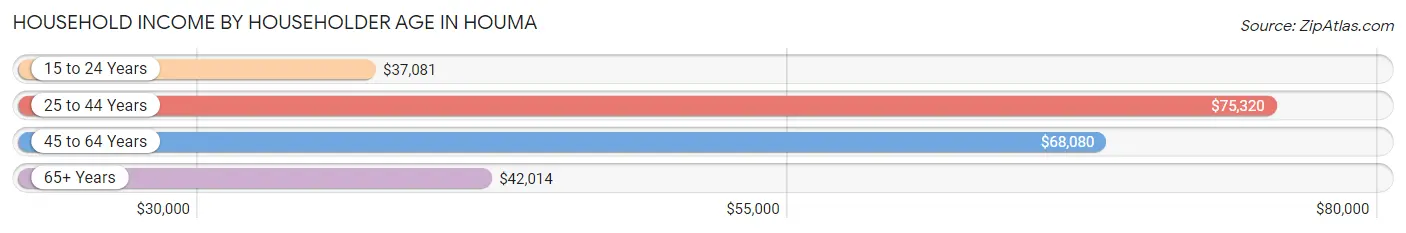
| Income Bracket | # Households | Median Income |
| 15 to 24 Years | 438 (3.3%) | $37,081 |
| 25 to 44 Years | 5,143 (38.6%) | $75,320 |
| 45 to 64 Years | 4,416 (33.2%) | $68,080 |
| 65+ Years | 3,318 (24.9%) | $42,014 |
| Total | 13,315 (100.0%) | $56,823 |
Poverty in Houma
Income Below Poverty by Sex and Age in Houma
With 13.1% poverty level for males and 20.1% for females among the residents of Houma, 15 year old males and 15 year old females are the most vulnerable to poverty, with 201 males (59.8%) and 124 females (62.9%) in their respective age groups living below the poverty level.
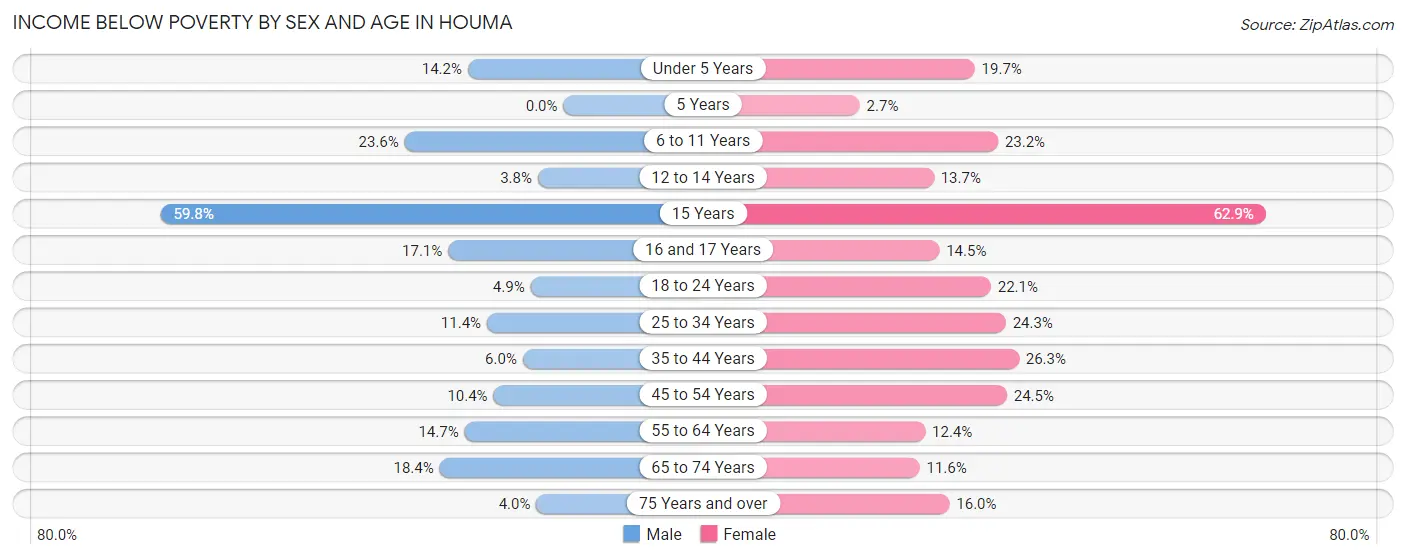
| Age Bracket | Male | Female |
| Under 5 Years | 232 (14.2%) | 292 (19.7%) |
| 5 Years | 0 (0.0%) | 10 (2.6%) |
| 6 to 11 Years | 366 (23.6%) | 282 (23.2%) |
| 12 to 14 Years | 12 (3.8%) | 67 (13.7%) |
| 15 Years | 201 (59.8%) | 124 (62.9%) |
| 16 and 17 Years | 64 (17.1%) | 57 (14.5%) |
| 18 to 24 Years | 68 (4.9%) | 231 (22.1%) |
| 25 to 34 Years | 241 (11.4%) | 678 (24.3%) |
| 35 to 44 Years | 119 (6.0%) | 551 (26.3%) |
| 45 to 54 Years | 201 (10.4%) | 455 (24.5%) |
| 55 to 64 Years | 284 (14.7%) | 259 (12.4%) |
| 65 to 74 Years | 284 (18.4%) | 193 (11.6%) |
| 75 Years and over | 28 (4.0%) | 177 (16.0%) |
| Total | 2,100 (13.1%) | 3,376 (20.1%) |
Income Above Poverty by Sex and Age in Houma
According to the poverty statistics in Houma, males aged 5 years and females aged 5 years are the age groups that are most secure financially, with 100.0% of males and 97.4% of females in these age groups living above the poverty line.
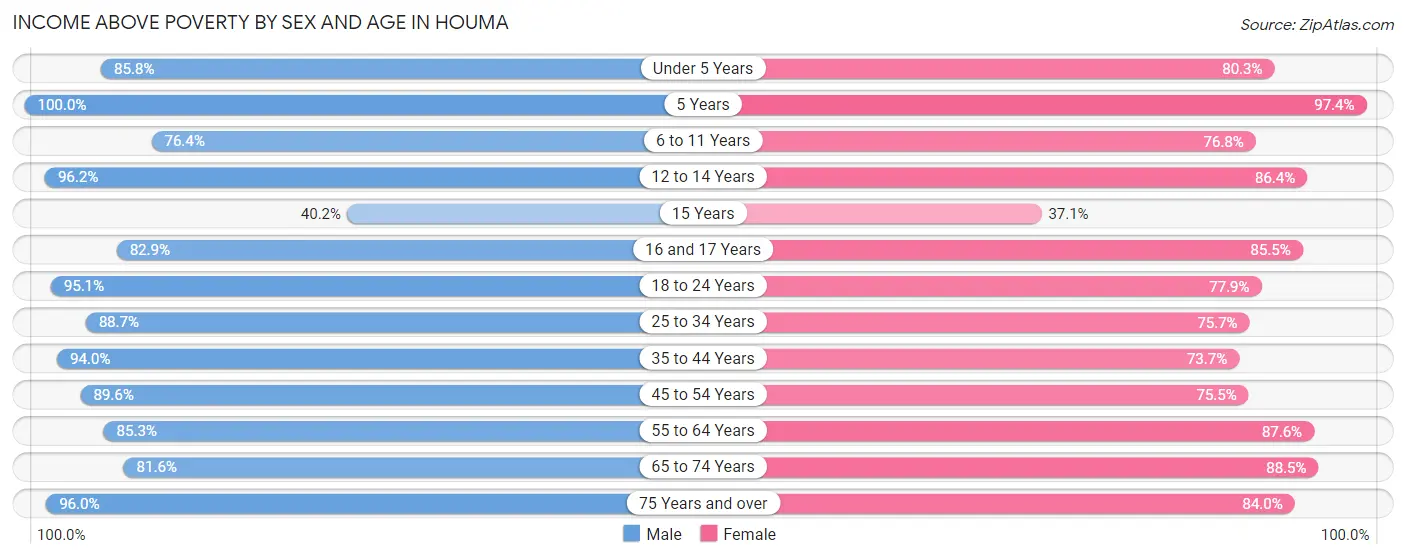
| Age Bracket | Male | Female |
| Under 5 Years | 1,403 (85.8%) | 1,188 (80.3%) |
| 5 Years | 268 (100.0%) | 367 (97.4%) |
| 6 to 11 Years | 1,187 (76.4%) | 934 (76.8%) |
| 12 to 14 Years | 305 (96.2%) | 424 (86.4%) |
| 15 Years | 135 (40.2%) | 73 (37.1%) |
| 16 and 17 Years | 310 (82.9%) | 337 (85.5%) |
| 18 to 24 Years | 1,326 (95.1%) | 813 (77.9%) |
| 25 to 34 Years | 1,882 (88.6%) | 2,108 (75.7%) |
| 35 to 44 Years | 1,856 (94.0%) | 1,546 (73.7%) |
| 45 to 54 Years | 1,735 (89.6%) | 1,402 (75.5%) |
| 55 to 64 Years | 1,650 (85.3%) | 1,834 (87.6%) |
| 65 to 74 Years | 1,260 (81.6%) | 1,478 (88.4%) |
| 75 Years and over | 669 (96.0%) | 931 (84.0%) |
| Total | 13,986 (87.0%) | 13,435 (79.9%) |
Income Below Poverty Among Married-Couple Families in Houma
The poverty statistics for married-couple families in Houma show that 3.1% or 174 of the total 5,645 families live below the poverty line. Families with 5 or more children have the highest poverty rate of 100.0%, comprising of 10 families. On the other hand, families with 3 or 4 children have the lowest poverty rate of 0.2%, which includes 2 families.
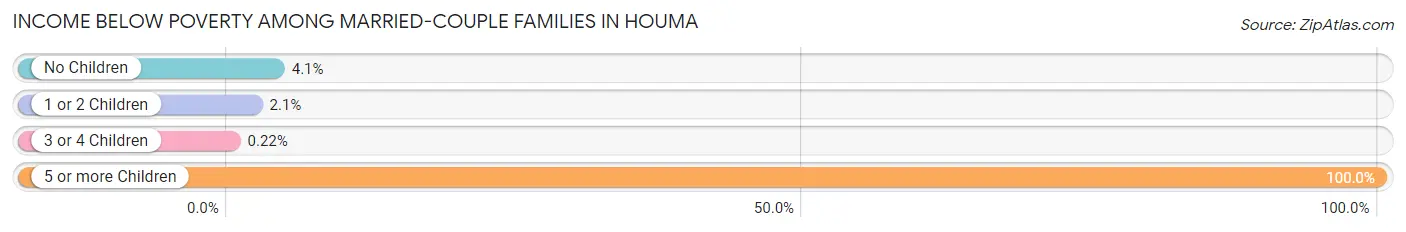
| Children | Above Poverty | Below Poverty |
| No Children | 3,044 (95.9%) | 129 (4.1%) |
| 1 or 2 Children | 1,506 (97.9%) | 33 (2.1%) |
| 3 or 4 Children | 921 (99.8%) | 2 (0.2%) |
| 5 or more Children | 0 (0.0%) | 10 (100.0%) |
| Total | 5,471 (96.9%) | 174 (3.1%) |
Income Below Poverty Among Single-Parent Households in Houma
According to the poverty data in Houma, 15.1% or 146 single-father households and 42.3% or 879 single-mother households are living below the poverty line. Among single-father households, those with no children have the highest poverty rate, with 75 households (19.5%) experiencing poverty. Likewise, among single-mother households, those with 1 or 2 children have the highest poverty rate, with 792 households (57.6%) falling below the poverty line.
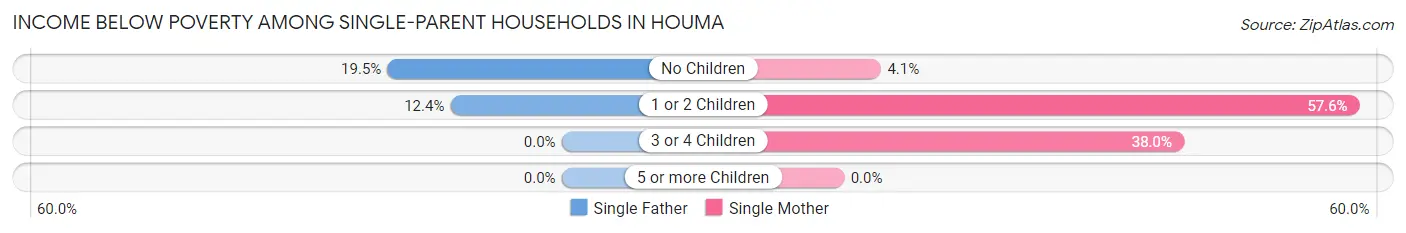
| Children | Single Father | Single Mother |
| No Children | 75 (19.5%) | 22 (4.1%) |
| 1 or 2 Children | 71 (12.4%) | 792 (57.6%) |
| 3 or 4 Children | 0 (0.0%) | 65 (38.0%) |
| 5 or more Children | 0 (0.0%) | 0 (0.0%) |
| Total | 146 (15.1%) | 879 (42.3%) |
Income Below Poverty Among Married-Couple vs Single-Parent Households in Houma
The poverty data for Houma shows that 174 of the married-couple family households (3.1%) and 1,025 of the single-parent households (33.6%) are living below the poverty level. Within the married-couple family households, those with 5 or more children have the highest poverty rate, with 10 households (100.0%) falling below the poverty line. Among the single-parent households, those with 1 or 2 children have the highest poverty rate, with 863 household (44.4%) living below poverty.
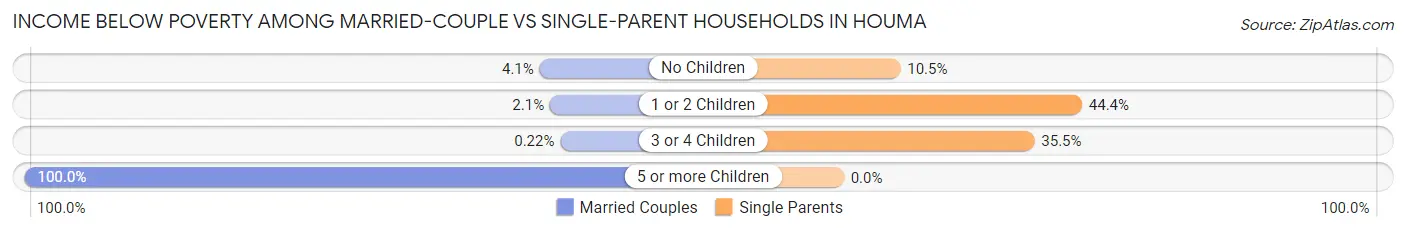
| Children | Married-Couple Families | Single-Parent Households |
| No Children | 129 (4.1%) | 97 (10.5%) |
| 1 or 2 Children | 33 (2.1%) | 863 (44.4%) |
| 3 or 4 Children | 2 (0.2%) | 65 (35.5%) |
| 5 or more Children | 10 (100.0%) | 0 (0.0%) |
| Total | 174 (3.1%) | 1,025 (33.6%) |
Race in Houma
The most populous races in Houma are White / Caucasian (22,718 | 68.6%), Black / African American (6,865 | 20.7%), and Two or more Races (1,522 | 4.6%).
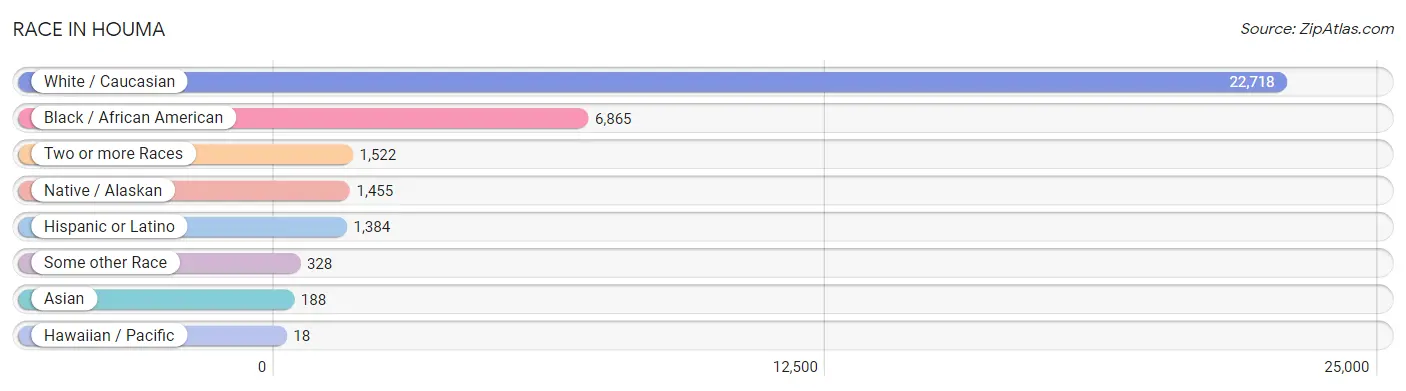
| Race | # Population | % Population |
| Asian | 188 | 0.6% |
| Black / African American | 6,865 | 20.7% |
| Hawaiian / Pacific | 18 | 0.1% |
| Hispanic or Latino | 1,384 | 4.2% |
| Native / Alaskan | 1,455 | 4.4% |
| White / Caucasian | 22,718 | 68.6% |
| Two or more Races | 1,522 | 4.6% |
| Some other Race | 328 | 1.0% |
| Total | 33,094 | 100.0% |
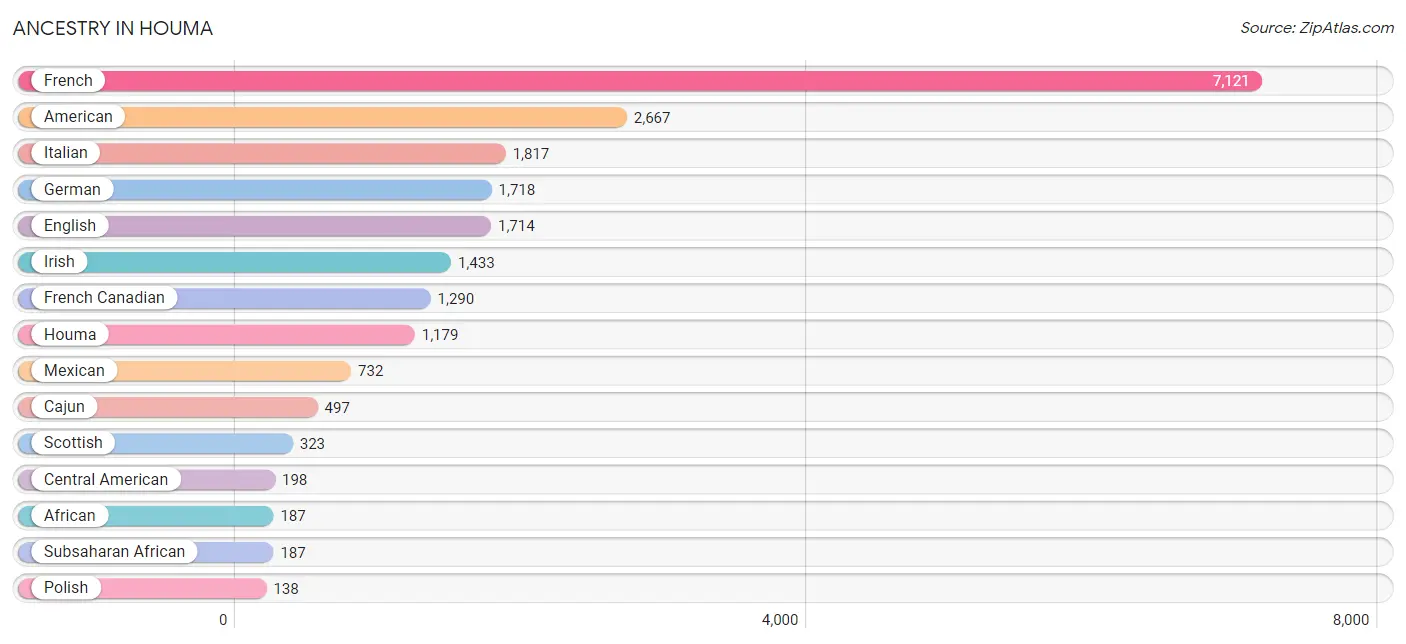
Ancestry in Houma
The most populous ancestries reported in Houma are French (7,121 | 21.5%), American (2,667 | 8.1%), Italian (1,817 | 5.5%), German (1,718 | 5.2%), and English (1,714 | 5.2%), together accounting for 45.4% of all Houma residents.
| Ancestry | # Population | % Population |
| African | 187 | 0.6% |
| American | 2,667 | 8.1% |
| Arab | 33 | 0.1% |
| Armenian | 17 | 0.1% |
| Australian | 44 | 0.1% |
| Austrian | 19 | 0.1% |
| Belgian | 33 | 0.1% |
| Bhutanese | 42 | 0.1% |
| Brazilian | 25 | 0.1% |
| British | 51 | 0.2% |
| Cajun | 497 | 1.5% |
| Canadian | 42 | 0.1% |
| Central American | 198 | 0.6% |
| Cherokee | 45 | 0.1% |
| Cuban | 17 | 0.1% |
| Czech | 20 | 0.1% |
| Danish | 39 | 0.1% |
| Dutch | 14 | 0.0% |
| Eastern European | 111 | 0.3% |
| English | 1,714 | 5.2% |
| European | 102 | 0.3% |
| French | 7,121 | 21.5% |
| French American Indian | 50 | 0.2% |
| French Canadian | 1,290 | 3.9% |
| German | 1,718 | 5.2% |
| Greek | 20 | 0.1% |
| Houma | 1,179 | 3.6% |
| Indian (Asian) | 80 | 0.2% |
| Iranian | 68 | 0.2% |
| Irish | 1,433 | 4.3% |
| Italian | 1,817 | 5.5% |
| Jamaican | 15 | 0.1% |
| Korean | 12 | 0.0% |
| Lebanese | 33 | 0.1% |
| Mexican | 732 | 2.2% |
| Mexican American Indian | 126 | 0.4% |
| Native Hawaiian | 18 | 0.1% |
| Nicaraguan | 97 | 0.3% |
| Northern European | 23 | 0.1% |
| Norwegian | 73 | 0.2% |
| Pakistani | 83 | 0.3% |
| Polish | 138 | 0.4% |
| Portuguese | 56 | 0.2% |
| Puerto Rican | 131 | 0.4% |
| Salvadoran | 101 | 0.3% |
| Scandinavian | 77 | 0.2% |
| Scotch-Irish | 26 | 0.1% |
| Scottish | 323 | 1.0% |
| Sioux | 17 | 0.1% |
| Slovene | 14 | 0.0% |
| Spaniard | 107 | 0.3% |
| Spanish | 128 | 0.4% |
| Spanish American | 49 | 0.2% |
| Subsaharan African | 187 | 0.6% |
| Swedish | 69 | 0.2% |
| Welsh | 31 | 0.1% | View All 56 Rows |
Immigrants in Houma
The most numerous immigrant groups reported in Houma came from Latin America (550 | 1.7%), Central America (487 | 1.5%), Mexico (462 | 1.4%), Asia (70 | 0.2%), and Eastern Asia (70 | 0.2%), together accounting for 4.9% of all Houma residents.
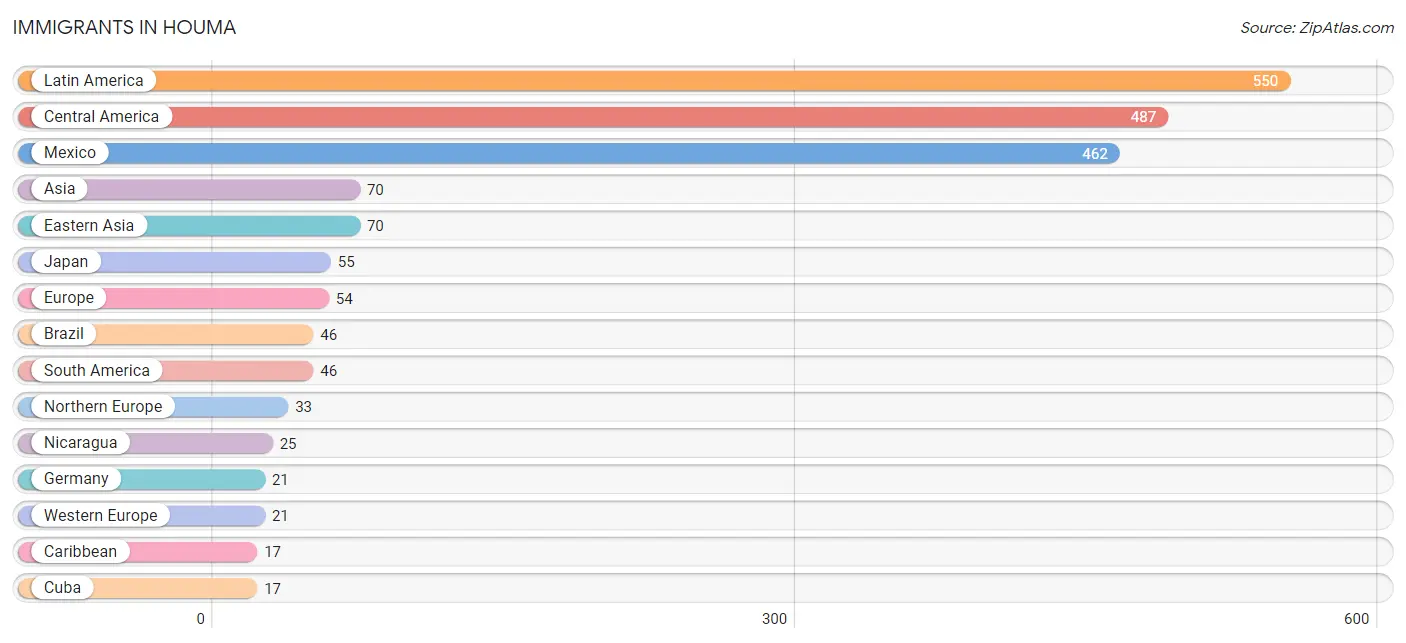
| Immigration Origin | # Population | % Population |
| Asia | 70 | 0.2% |
| Brazil | 46 | 0.1% |
| Caribbean | 17 | 0.1% |
| Central America | 487 | 1.5% |
| China | 15 | 0.1% |
| Cuba | 17 | 0.1% |
| Eastern Asia | 70 | 0.2% |
| Europe | 54 | 0.2% |
| Germany | 21 | 0.1% |
| Ireland | 12 | 0.0% |
| Japan | 55 | 0.2% |
| Latin America | 550 | 1.7% |
| Mexico | 462 | 1.4% |
| Nicaragua | 25 | 0.1% |
| Northern Europe | 33 | 0.1% |
| South America | 46 | 0.1% |
| Western Europe | 21 | 0.1% | View All 17 Rows |
Sex and Age in Houma
Sex and Age in Houma
The most populous age groups in Houma are Under 5 Years (1,652 | 10.2%) for men and Under 5 Years (1,480 | 8.7%) for women.
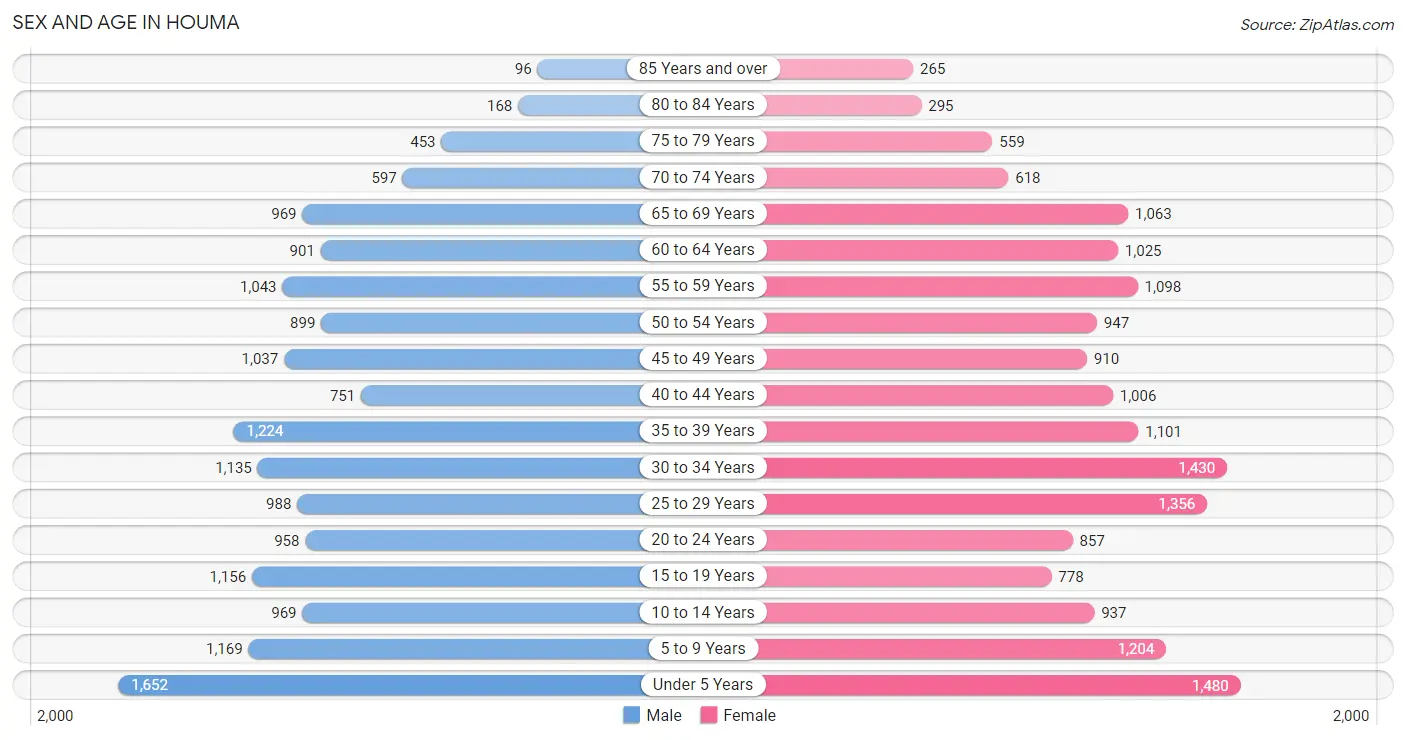
| Age Bracket | Male | Female |
| Under 5 Years | 1,652 (10.2%) | 1,480 (8.7%) |
| 5 to 9 Years | 1,169 (7.2%) | 1,204 (7.1%) |
| 10 to 14 Years | 969 (6.0%) | 937 (5.5%) |
| 15 to 19 Years | 1,156 (7.1%) | 778 (4.6%) |
| 20 to 24 Years | 958 (5.9%) | 857 (5.1%) |
| 25 to 29 Years | 988 (6.1%) | 1,356 (8.0%) |
| 30 to 34 Years | 1,135 (7.0%) | 1,430 (8.5%) |
| 35 to 39 Years | 1,224 (7.6%) | 1,101 (6.5%) |
| 40 to 44 Years | 751 (4.6%) | 1,006 (5.9%) |
| 45 to 49 Years | 1,037 (6.4%) | 910 (5.4%) |
| 50 to 54 Years | 899 (5.6%) | 947 (5.6%) |
| 55 to 59 Years | 1,043 (6.5%) | 1,098 (6.5%) |
| 60 to 64 Years | 901 (5.6%) | 1,025 (6.0%) |
| 65 to 69 Years | 969 (6.0%) | 1,063 (6.3%) |
| 70 to 74 Years | 597 (3.7%) | 618 (3.6%) |
| 75 to 79 Years | 453 (2.8%) | 559 (3.3%) |
| 80 to 84 Years | 168 (1.0%) | 295 (1.7%) |
| 85 Years and over | 96 (0.6%) | 265 (1.6%) |
| Total | 16,165 (100.0%) | 16,929 (100.0%) |
Families and Households in Houma
Median Family Size in Houma
The median family size in Houma is 3.04 persons per family, with married-couple families (5,645 | 64.9%) accounting for the largest median family size of 3.23 persons per family. On the other hand, single male/father families (968 | 11.1%) represent the smallest median family size with 2.39 persons per family.
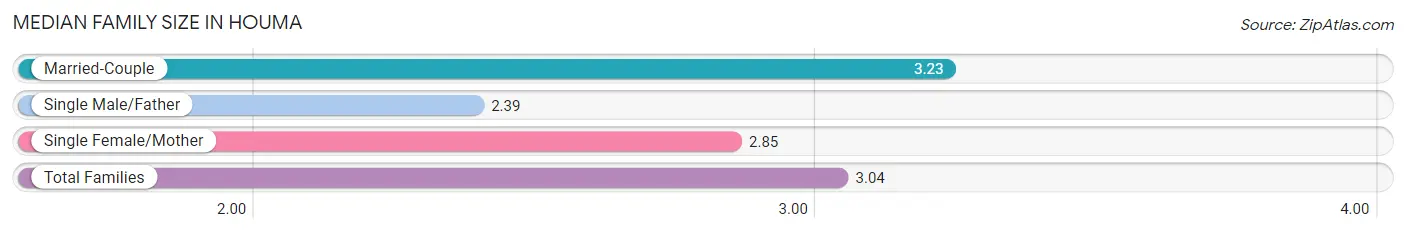
| Family Type | # Families | Family Size |
| Married-Couple | 5,645 (64.9%) | 3.23 |
| Single Male/Father | 968 (11.1%) | 2.39 |
| Single Female/Mother | 2,080 (23.9%) | 2.85 |
| Total Families | 8,693 (100.0%) | 3.04 |
Median Household Size in Houma
The median household size in Houma is 2.47 persons per household, with married-couple households (5,645 | 42.4%) accounting for the largest median household size of 3.24 persons per household. non-family households (4,622 | 34.7%) represent the smallest median household size with 1.21 persons per household.
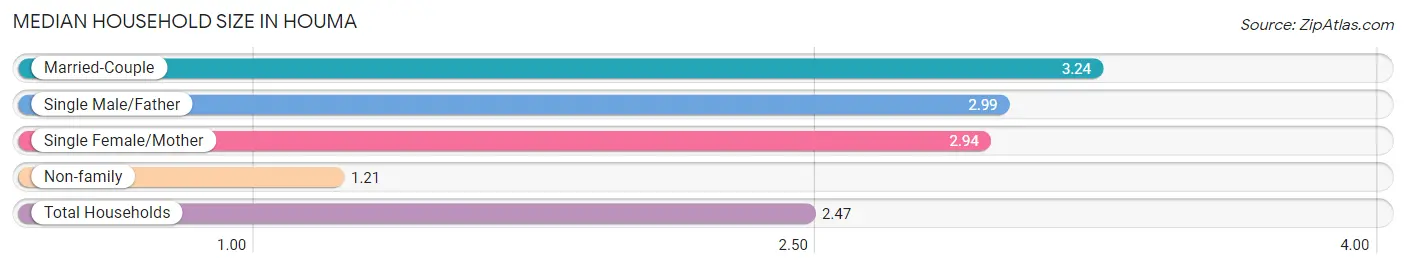
| Household Type | # Households | Household Size |
| Married-Couple | 5,645 (42.4%) | 3.24 |
| Single Male/Father | 968 (7.3%) | 2.99 |
| Single Female/Mother | 2,080 (15.6%) | 2.94 |
| Non-family | 4,622 (34.7%) | 1.21 |
| Total Households | 13,315 (100.0%) | 2.47 |
Household Size by Marriage Status in Houma
Out of a total of 13,315 households in Houma, 8,693 (65.3%) are family households, while 4,622 (34.7%) are nonfamily households. The most numerous type of family households are 2-person households, comprising 3,833, and the most common type of nonfamily households are 1-person households, comprising 3,698.
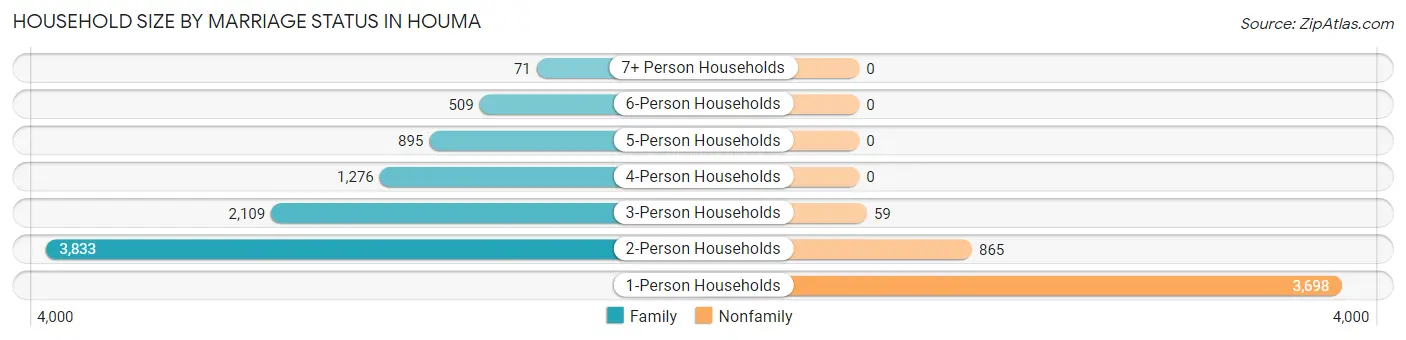
| Household Size | Family Households | Nonfamily Households |
| 1-Person Households | - | 3,698 (27.8%) |
| 2-Person Households | 3,833 (28.8%) | 865 (6.5%) |
| 3-Person Households | 2,109 (15.8%) | 59 (0.4%) |
| 4-Person Households | 1,276 (9.6%) | 0 (0.0%) |
| 5-Person Households | 895 (6.7%) | 0 (0.0%) |
| 6-Person Households | 509 (3.8%) | 0 (0.0%) |
| 7+ Person Households | 71 (0.5%) | 0 (0.0%) |
| Total | 8,693 (65.3%) | 4,622 (34.7%) |
Female Fertility in Houma
Fertility by Age in Houma
Average fertility rate in Houma is 99.0 births per 1,000 women. Women in the age bracket of 20 to 34 years have the highest fertility rate with 204.0 births per 1,000 women. Women in the age bracket of 20 to 34 years acount for 99.6% of all women with births.
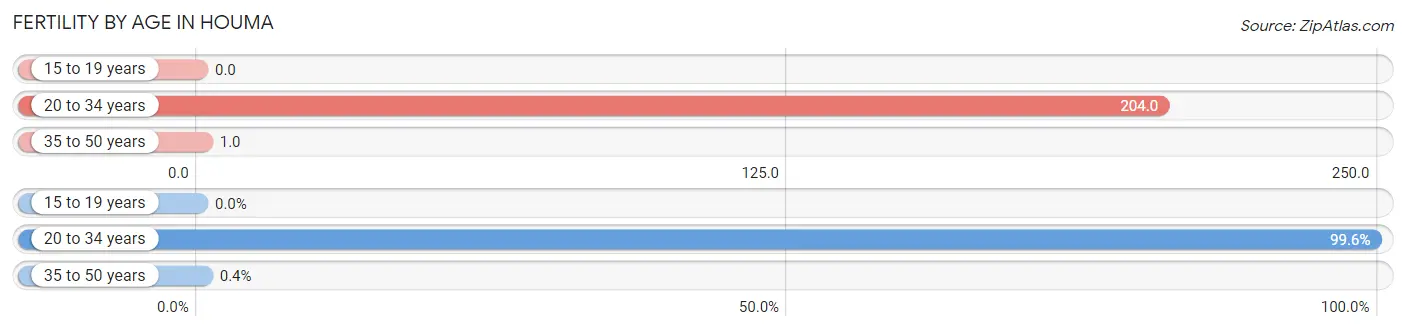
| Age Bracket | Women with Births | Births / 1,000 Women |
| 15 to 19 years | 0 (0.0%) | 0.0 |
| 20 to 34 years | 742 (99.6%) | 204.0 |
| 35 to 50 years | 3 (0.4%) | 1.0 |
| Total | 745 (100.0%) | 99.0 |
Fertility by Age by Marriage Status in Houma
32.1% of women with births (745) in Houma are married. The highest percentage of unmarried women with births falls into 20 to 34 years age bracket with 68.2% of them unmarried at the time of birth, while the lowest percentage of unmarried women with births belong to 35 to 50 years age bracket with 0.0% of them unmarried.
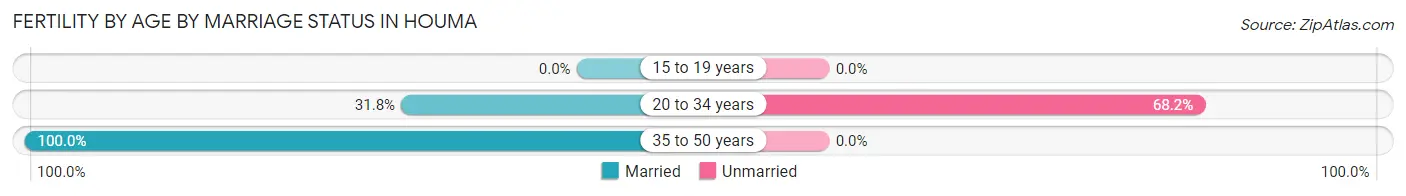
| Age Bracket | Married | Unmarried |
| 15 to 19 years | 0 (0.0%) | 0 (0.0%) |
| 20 to 34 years | 236 (31.8%) | 506 (68.2%) |
| 35 to 50 years | 3 (100.0%) | 0 (0.0%) |
| Total | 239 (32.1%) | 506 (67.9%) |
Fertility by Education in Houma
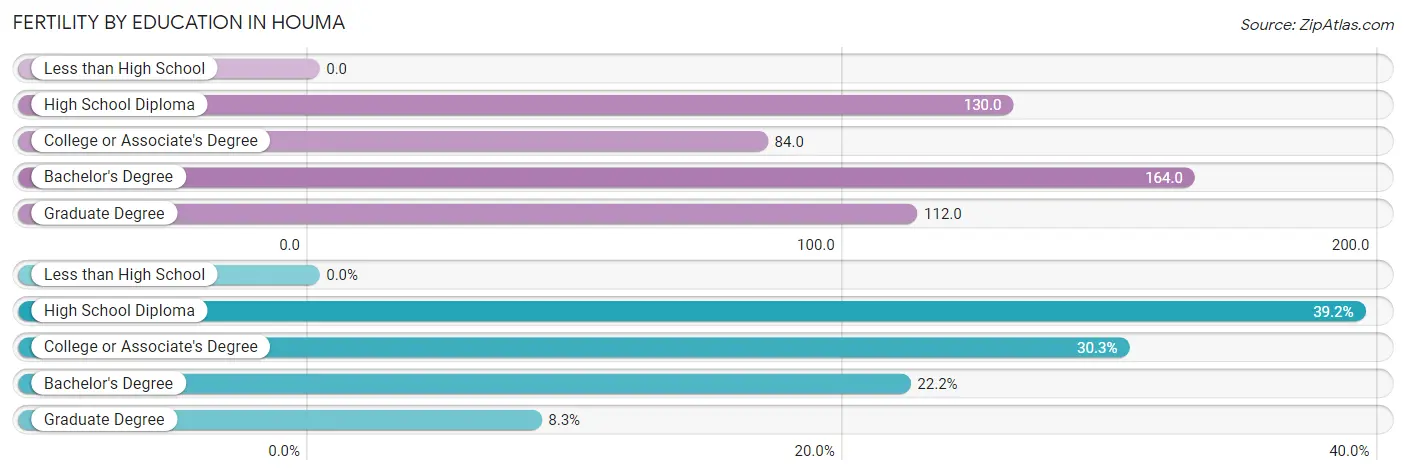
| Educational Attainment | Women with Births | Births / 1,000 Women |
| Less than High School | 0 (0.0%) | 0.0 |
| High School Diploma | 292 (39.2%) | 130.0 |
| College or Associate's Degree | 226 (30.3%) | 84.0 |
| Bachelor's Degree | 165 (22.2%) | 164.0 |
| Graduate Degree | 62 (8.3%) | 112.0 |
| Total | 745 (100.0%) | 99.0 |
Fertility by Education by Marriage Status in Houma
67.9% of women with births in Houma are unmarried. Women with the educational attainment of bachelor's degree are most likely to be married with 100.0% of them married at childbirth, while women with the educational attainment of high school diploma are least likely to be married with 100.0% of them unmarried at childbirth.
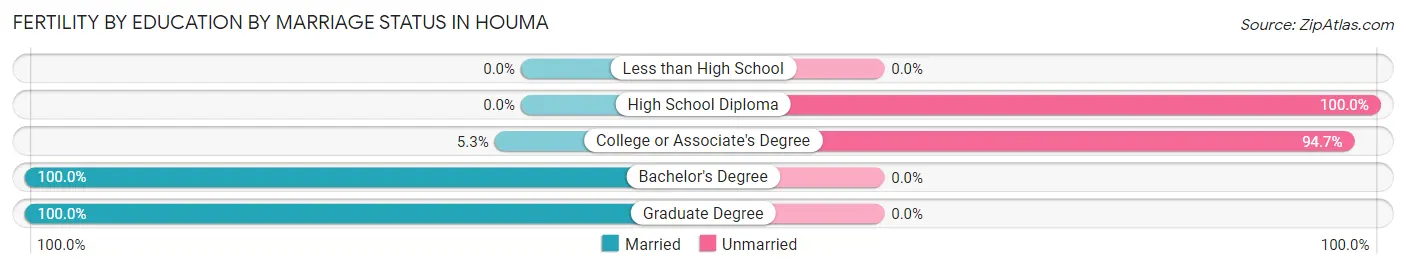
| Educational Attainment | Married | Unmarried |
| Less than High School | 0 (0.0%) | 0 (0.0%) |
| High School Diploma | 0 (0.0%) | 292 (100.0%) |
| College or Associate's Degree | 12 (5.3%) | 214 (94.7%) |
| Bachelor's Degree | 165 (100.0%) | 0 (0.0%) |
| Graduate Degree | 62 (100.0%) | 0 (0.0%) |
| Total | 239 (32.1%) | 506 (67.9%) |
Employment Characteristics in Houma
Employment by Class of Employer in Houma
Among the 14,546 employed individuals in Houma, private company employees (10,807 | 74.3%), not-for-profit organizations (1,129 | 7.8%), and local government employees (1,065 | 7.3%) make up the most common classes of employment.
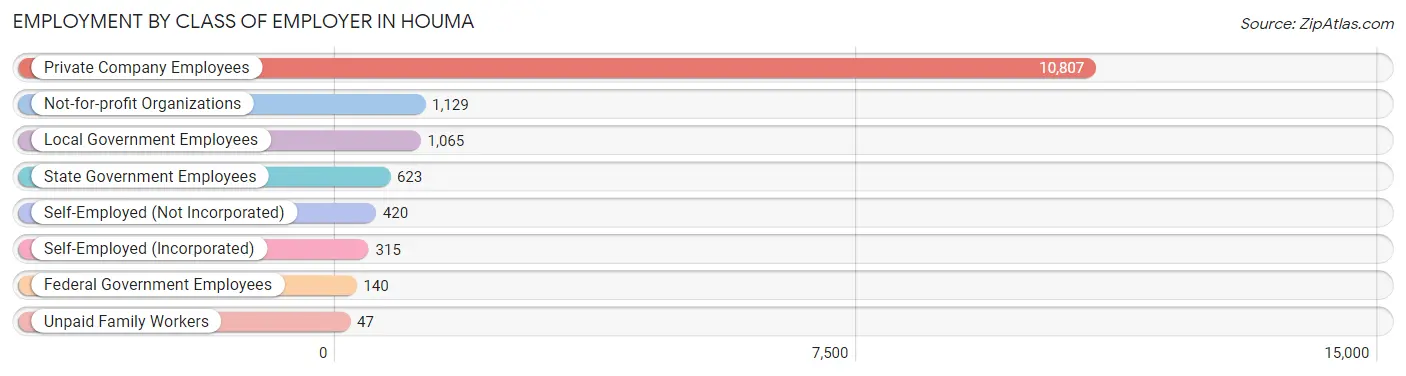
| Employer Class | # Employees | % Employees |
| Private Company Employees | 10,807 | 74.3% |
| Self-Employed (Incorporated) | 315 | 2.2% |
| Self-Employed (Not Incorporated) | 420 | 2.9% |
| Not-for-profit Organizations | 1,129 | 7.8% |
| Local Government Employees | 1,065 | 7.3% |
| State Government Employees | 623 | 4.3% |
| Federal Government Employees | 140 | 1.0% |
| Unpaid Family Workers | 47 | 0.3% |
| Total | 14,546 | 100.0% |
Employment Status by Age in Houma
According to the labor force statistics for Houma, out of the total population over 16 years of age (25,150), 62.3% or 15,668 individuals are in the labor force, with 5.1% or 799 of them unemployed. The age group with the highest labor force participation rate is 20 to 24 years, with 93.3% or 1,693 individuals in the labor force. Within the labor force, the 16 to 19 years age range has the highest percentage of unemployed individuals, with 12.7% or 66 of them being unemployed.
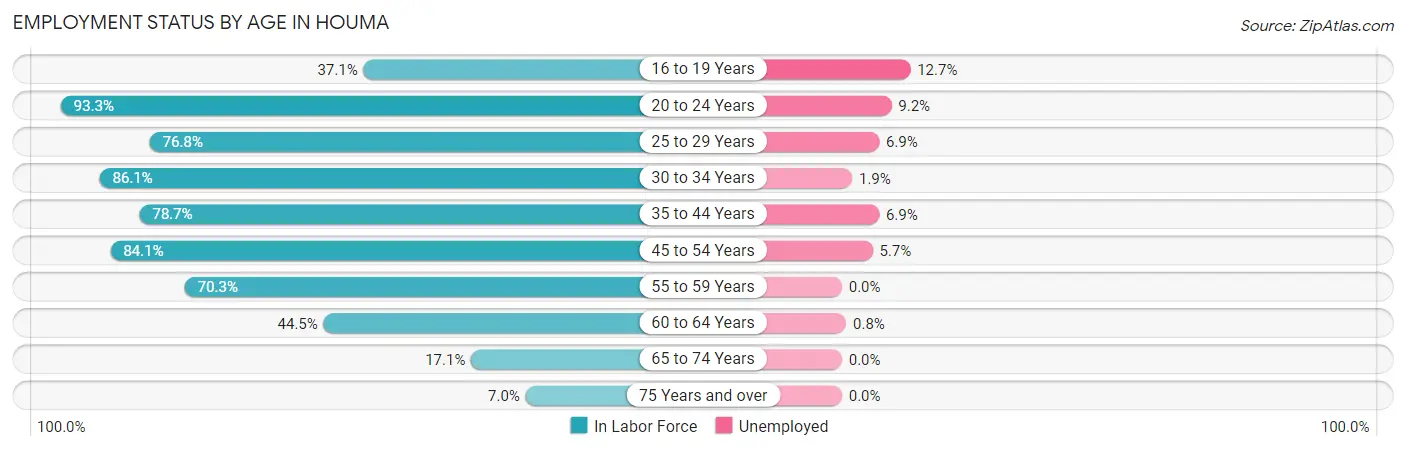
| Age Bracket | In Labor Force | Unemployed |
| 16 to 19 Years | 520 (37.1%) | 66 (12.7%) |
| 20 to 24 Years | 1,693 (93.3%) | 156 (9.2%) |
| 25 to 29 Years | 1,800 (76.8%) | 124 (6.9%) |
| 30 to 34 Years | 2,208 (86.1%) | 42 (1.9%) |
| 35 to 44 Years | 3,213 (78.7%) | 222 (6.9%) |
| 45 to 54 Years | 3,190 (84.1%) | 182 (5.7%) |
| 55 to 59 Years | 1,505 (70.3%) | 0 (0.0%) |
| 60 to 64 Years | 857 (44.5%) | 7 (0.8%) |
| 65 to 74 Years | 555 (17.1%) | 0 (0.0%) |
| 75 Years and over | 129 (7.0%) | 0 (0.0%) |
| Total | 15,668 (62.3%) | 799 (5.1%) |
Employment Status by Educational Attainment in Houma
According to labor force statistics for Houma, 75.8% of individuals (12,773) out of the total population between 25 and 64 years of age (16,851) are in the labor force, with 4.5% or 575 of them being unemployed. The group with the highest labor force participation rate are those with the educational attainment of bachelor's degree or higher, with 84.2% or 3,052 individuals in the labor force. Within the labor force, individuals with less than high school education have the highest percentage of unemployment, with 6.0% or 76 of them being unemployed.
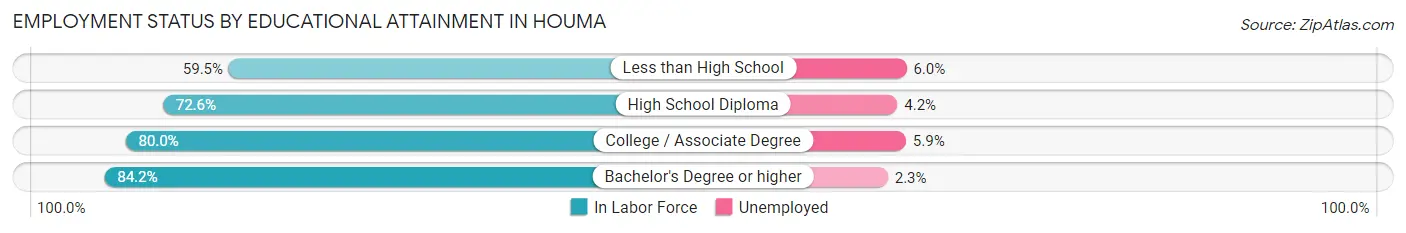
| Educational Attainment | In Labor Force | Unemployed |
| Less than High School | 1,267 (59.5%) | 128 (6.0%) |
| High School Diploma | 4,172 (72.6%) | 241 (4.2%) |
| College / Associate Degree | 4,280 (80.0%) | 316 (5.9%) |
| Bachelor's Degree or higher | 3,052 (84.2%) | 83 (2.3%) |
| Total | 12,773 (75.8%) | 758 (4.5%) |
Employment Occupations by Sex in Houma
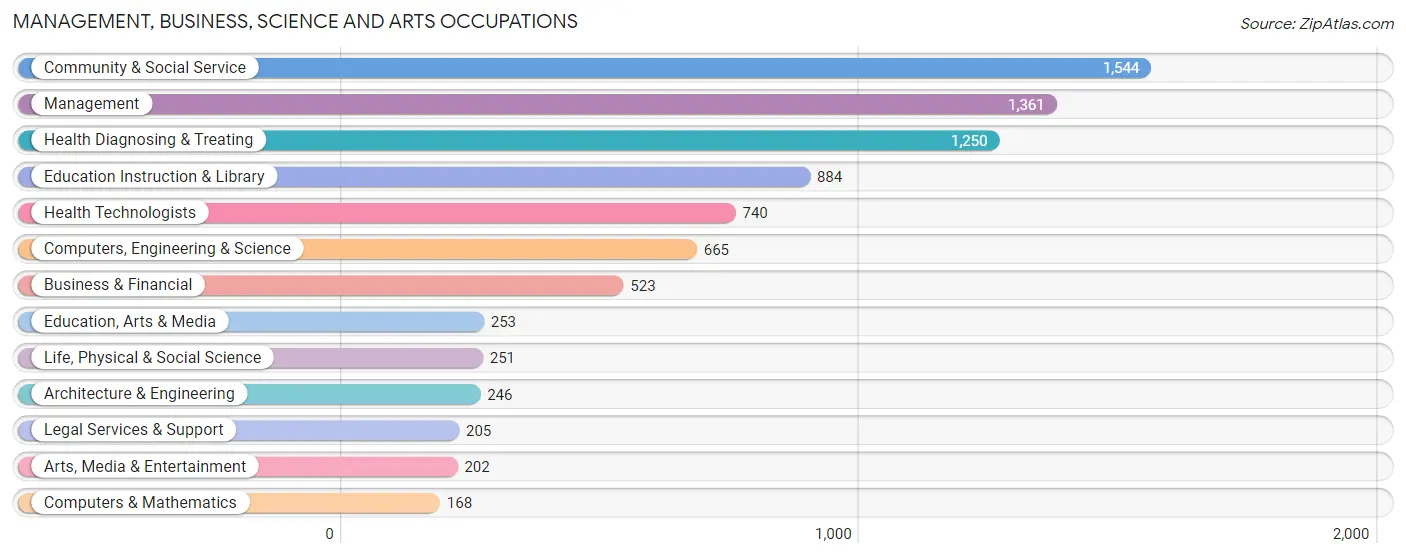
Management, Business, Science and Arts Occupations
The most common Management, Business, Science and Arts occupations in Houma are Community & Social Service (1,544 | 10.4%), Management (1,361 | 9.2%), Health Diagnosing & Treating (1,250 | 8.4%), Education Instruction & Library (884 | 6.0%), and Health Technologists (740 | 5.0%).
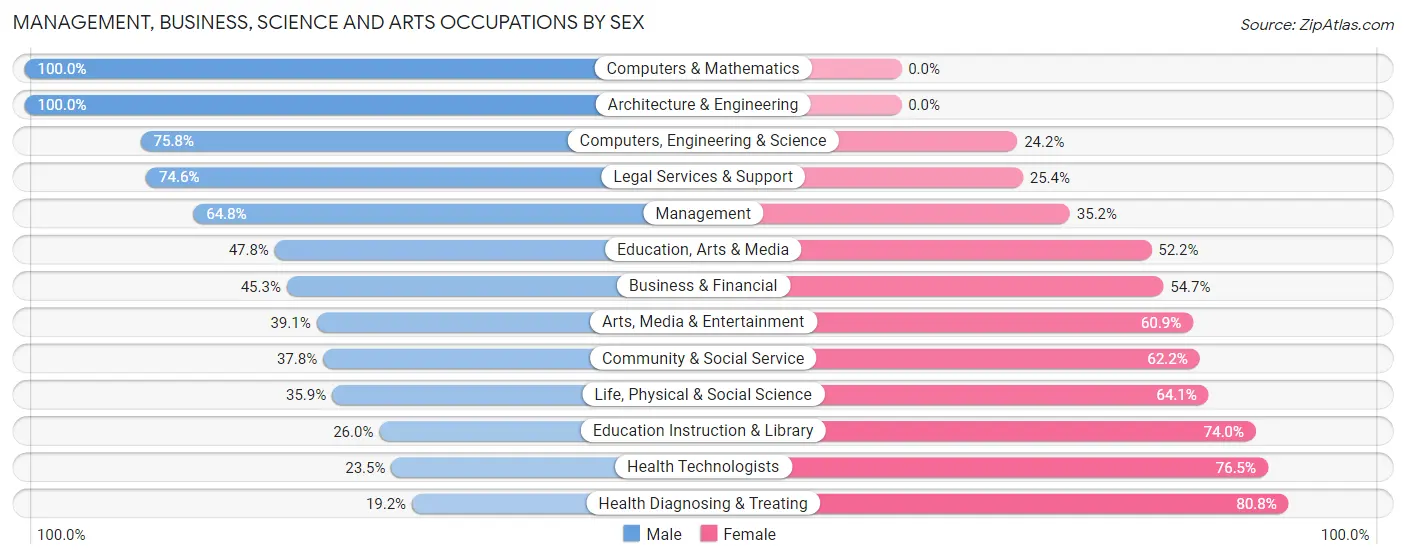
Management, Business, Science and Arts Occupations by Sex
Within the Management, Business, Science and Arts occupations in Houma, the most male-oriented occupations are Computers & Mathematics (100.0%), Architecture & Engineering (100.0%), and Computers, Engineering & Science (75.8%), while the most female-oriented occupations are Health Diagnosing & Treating (80.8%), Health Technologists (76.5%), and Education Instruction & Library (74.0%).
| Occupation | Male | Female |
| Management | 882 (64.8%) | 479 (35.2%) |
| Business & Financial | 237 (45.3%) | 286 (54.7%) |
| Computers, Engineering & Science | 504 (75.8%) | 161 (24.2%) |
| Computers & Mathematics | 168 (100.0%) | 0 (0.0%) |
| Architecture & Engineering | 246 (100.0%) | 0 (0.0%) |
| Life, Physical & Social Science | 90 (35.9%) | 161 (64.1%) |
| Community & Social Service | 583 (37.8%) | 961 (62.2%) |
| Education, Arts & Media | 121 (47.8%) | 132 (52.2%) |
| Legal Services & Support | 153 (74.6%) | 52 (25.4%) |
| Education Instruction & Library | 230 (26.0%) | 654 (74.0%) |
| Arts, Media & Entertainment | 79 (39.1%) | 123 (60.9%) |
| Health Diagnosing & Treating | 240 (19.2%) | 1,010 (80.8%) |
| Health Technologists | 174 (23.5%) | 566 (76.5%) |
| Total (Category) | 2,446 (45.8%) | 2,897 (54.2%) |
| Total (Overall) | 7,682 (51.8%) | 7,136 (48.2%) |
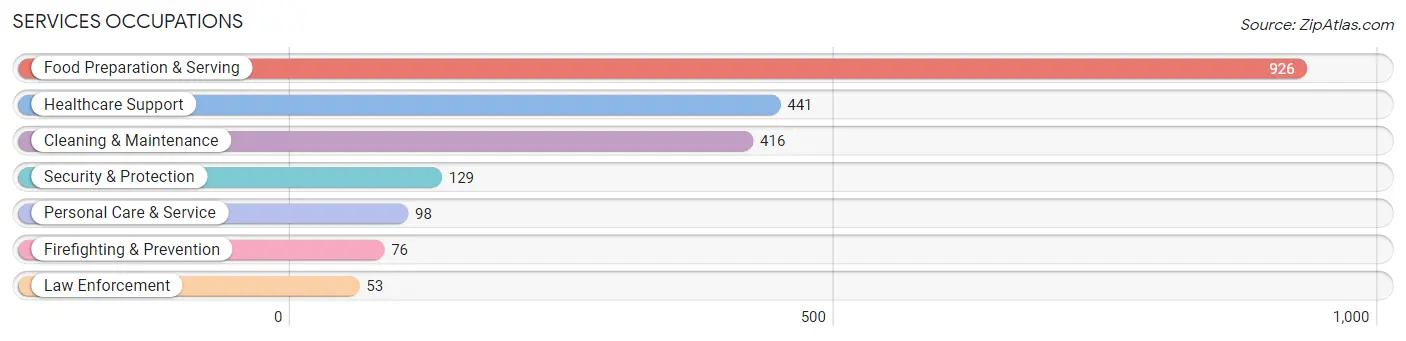
Services Occupations
The most common Services occupations in Houma are Food Preparation & Serving (926 | 6.2%), Healthcare Support (441 | 3.0%), Cleaning & Maintenance (416 | 2.8%), Security & Protection (129 | 0.9%), and Personal Care & Service (98 | 0.7%).
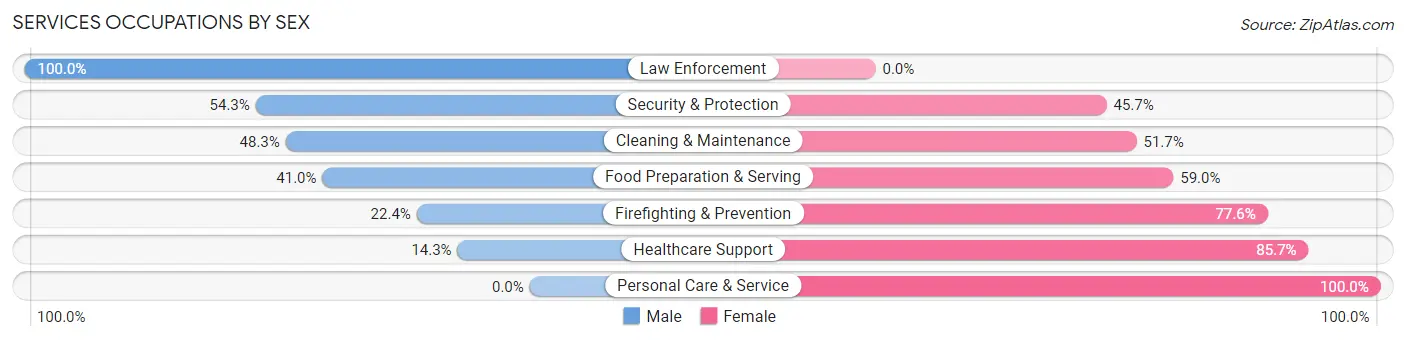
Services Occupations by Sex
Within the Services occupations in Houma, the most male-oriented occupations are Law Enforcement (100.0%), Security & Protection (54.3%), and Cleaning & Maintenance (48.3%), while the most female-oriented occupations are Personal Care & Service (100.0%), Healthcare Support (85.7%), and Firefighting & Prevention (77.6%).
| Occupation | Male | Female |
| Healthcare Support | 63 (14.3%) | 378 (85.7%) |
| Security & Protection | 70 (54.3%) | 59 (45.7%) |
| Firefighting & Prevention | 17 (22.4%) | 59 (77.6%) |
| Law Enforcement | 53 (100.0%) | 0 (0.0%) |
| Food Preparation & Serving | 380 (41.0%) | 546 (59.0%) |
| Cleaning & Maintenance | 201 (48.3%) | 215 (51.7%) |
| Personal Care & Service | 0 (0.0%) | 98 (100.0%) |
| Total (Category) | 714 (35.5%) | 1,296 (64.5%) |
| Total (Overall) | 7,682 (51.8%) | 7,136 (48.2%) |
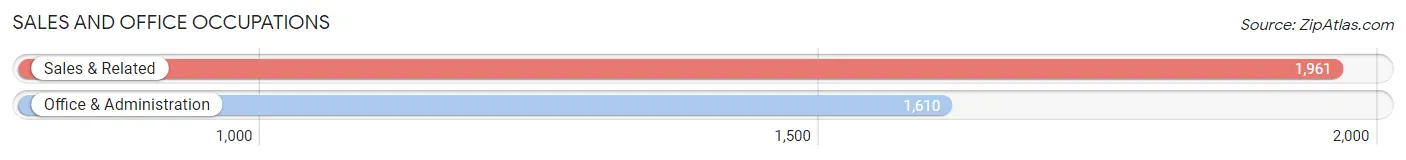
Sales and Office Occupations
The most common Sales and Office occupations in Houma are Sales & Related (1,961 | 13.2%), and Office & Administration (1,610 | 10.9%).
Sales and Office Occupations by Sex
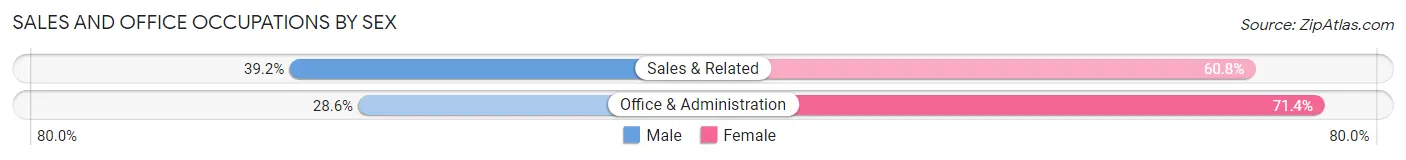
| Occupation | Male | Female |
| Sales & Related | 768 (39.2%) | 1,193 (60.8%) |
| Office & Administration | 460 (28.6%) | 1,150 (71.4%) |
| Total (Category) | 1,228 (34.4%) | 2,343 (65.6%) |
| Total (Overall) | 7,682 (51.8%) | 7,136 (48.2%) |
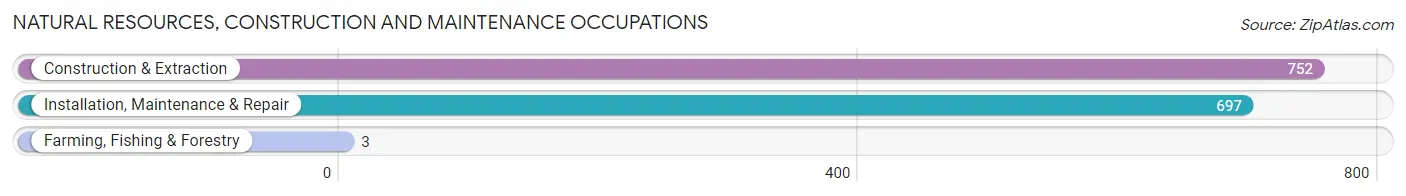
Natural Resources, Construction and Maintenance Occupations
The most common Natural Resources, Construction and Maintenance occupations in Houma are Construction & Extraction (752 | 5.1%), Installation, Maintenance & Repair (697 | 4.7%), and Farming, Fishing & Forestry (3 | 0.0%).
Natural Resources, Construction and Maintenance Occupations by Sex
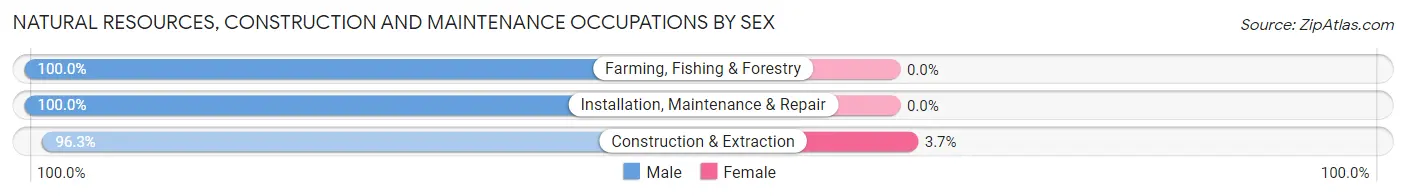
| Occupation | Male | Female |
| Farming, Fishing & Forestry | 3 (100.0%) | 0 (0.0%) |
| Construction & Extraction | 724 (96.3%) | 28 (3.7%) |
| Installation, Maintenance & Repair | 697 (100.0%) | 0 (0.0%) |
| Total (Category) | 1,424 (98.1%) | 28 (1.9%) |
| Total (Overall) | 7,682 (51.8%) | 7,136 (48.2%) |
Production, Transportation and Moving Occupations
The most common Production, Transportation and Moving occupations in Houma are Transportation (928 | 6.3%), Production (837 | 5.7%), and Material Moving (677 | 4.6%).
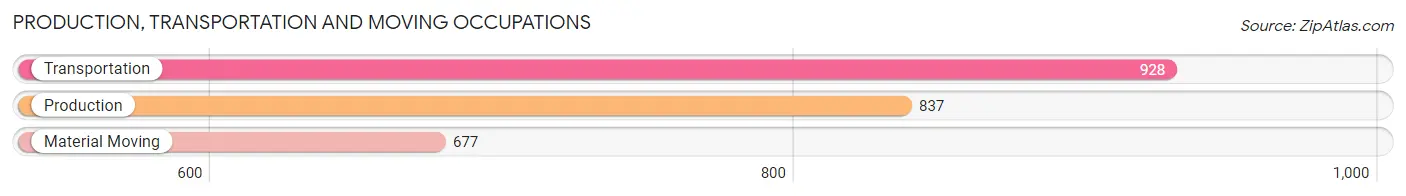
Production, Transportation and Moving Occupations by Sex
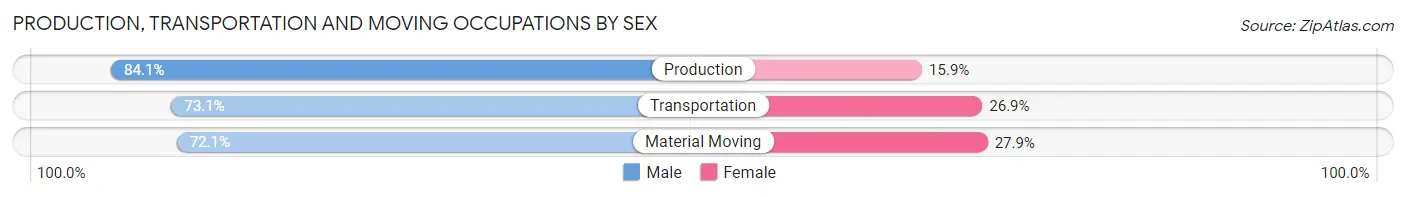
| Occupation | Male | Female |
| Production | 704 (84.1%) | 133 (15.9%) |
| Transportation | 678 (73.1%) | 250 (26.9%) |
| Material Moving | 488 (72.1%) | 189 (27.9%) |
| Total (Category) | 1,870 (76.6%) | 572 (23.4%) |
| Total (Overall) | 7,682 (51.8%) | 7,136 (48.2%) |
Employment Industries by Sex in Houma
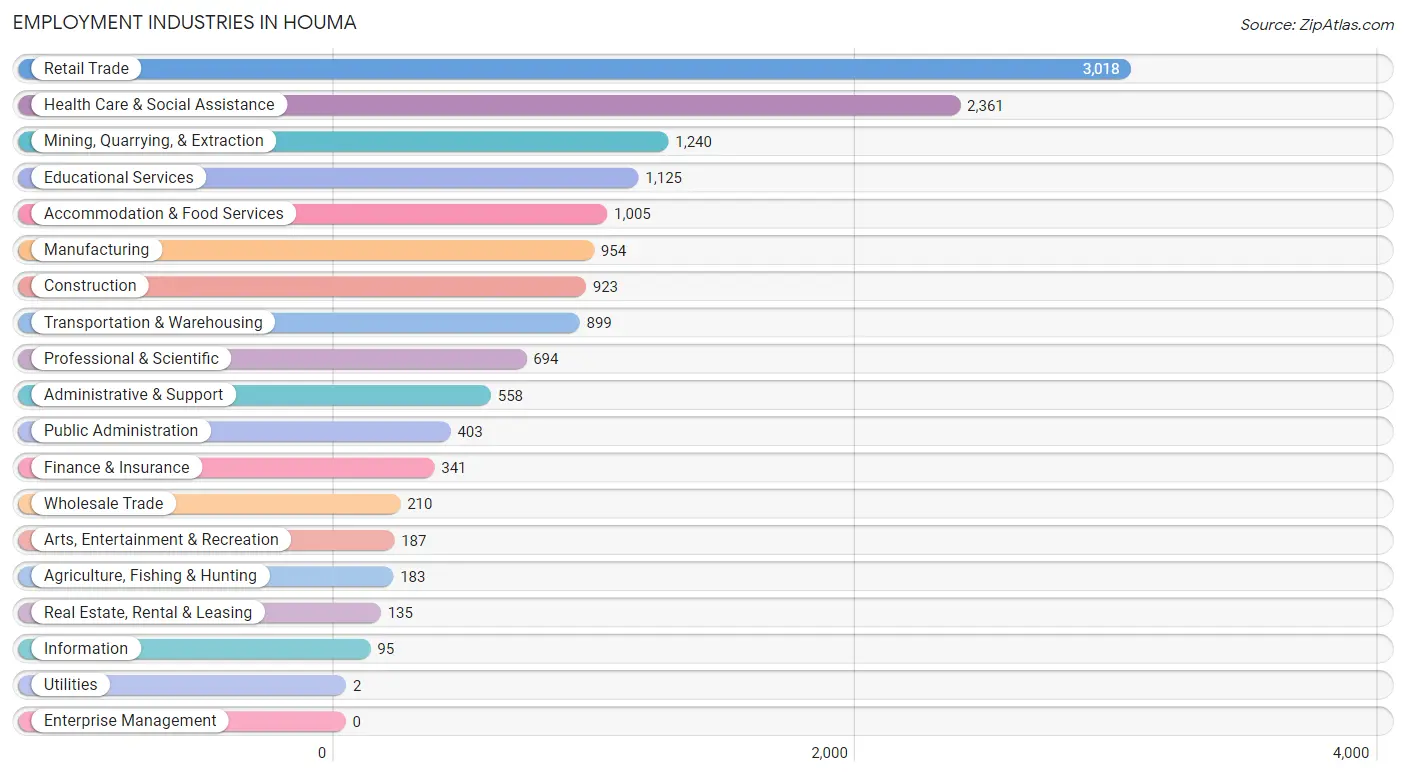
Employment Industries in Houma
The major employment industries in Houma include Retail Trade (3,018 | 20.4%), Health Care & Social Assistance (2,361 | 15.9%), Mining, Quarrying, & Extraction (1,240 | 8.4%), Educational Services (1,125 | 7.6%), and Accommodation & Food Services (1,005 | 6.8%).
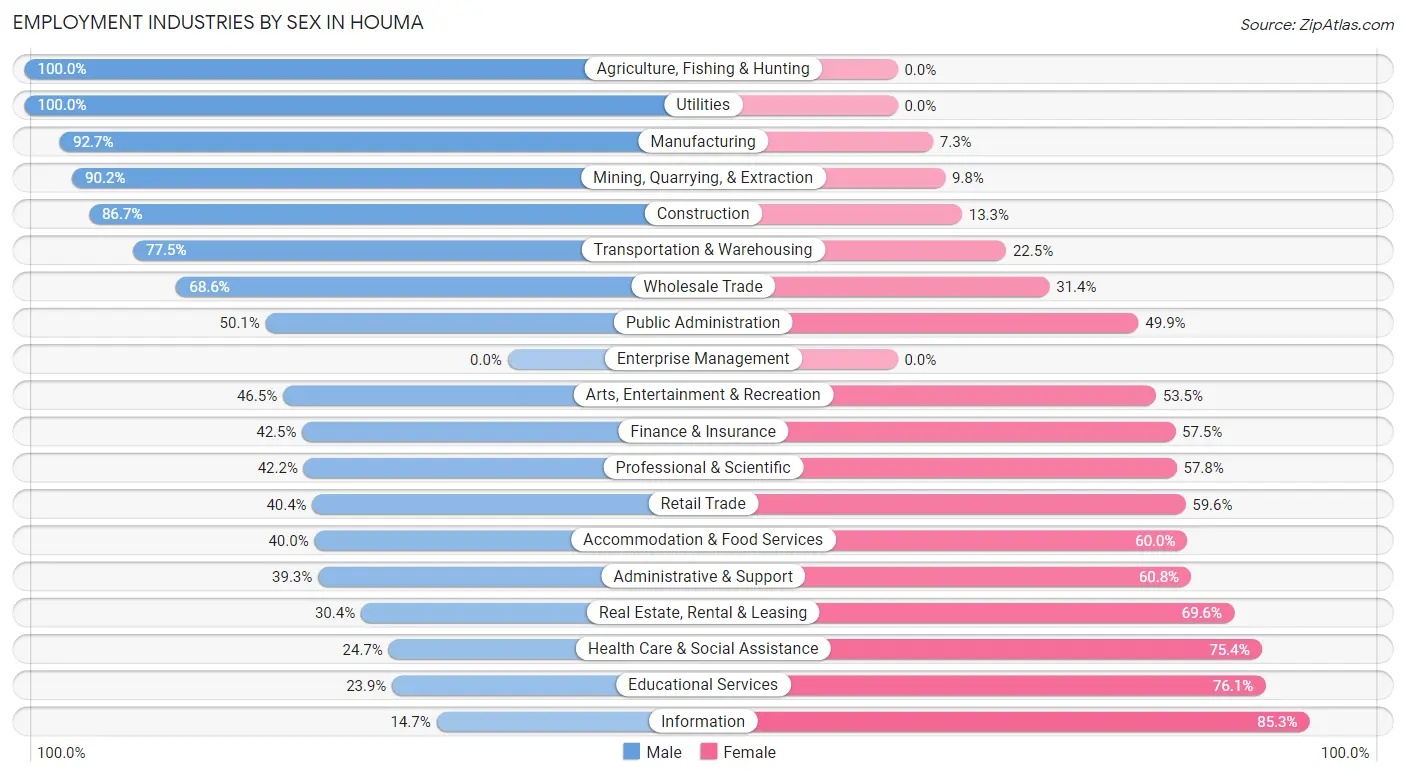
Employment Industries by Sex in Houma
The Houma industries that see more men than women are Agriculture, Fishing & Hunting (100.0%), Utilities (100.0%), and Manufacturing (92.7%), whereas the industries that tend to have a higher number of women are Information (85.3%), Educational Services (76.1%), and Health Care & Social Assistance (75.3%).
| Industry | Male | Female |
| Agriculture, Fishing & Hunting | 183 (100.0%) | 0 (0.0%) |
| Mining, Quarrying, & Extraction | 1,118 (90.2%) | 122 (9.8%) |
| Construction | 800 (86.7%) | 123 (13.3%) |
| Manufacturing | 884 (92.7%) | 70 (7.3%) |
| Wholesale Trade | 144 (68.6%) | 66 (31.4%) |
| Retail Trade | 1,220 (40.4%) | 1,798 (59.6%) |
| Transportation & Warehousing | 697 (77.5%) | 202 (22.5%) |
| Utilities | 2 (100.0%) | 0 (0.0%) |
| Information | 14 (14.7%) | 81 (85.3%) |
| Finance & Insurance | 145 (42.5%) | 196 (57.5%) |
| Real Estate, Rental & Leasing | 41 (30.4%) | 94 (69.6%) |
| Professional & Scientific | 293 (42.2%) | 401 (57.8%) |
| Enterprise Management | 0 (0.0%) | 0 (0.0%) |
| Administrative & Support | 219 (39.3%) | 339 (60.8%) |
| Educational Services | 269 (23.9%) | 856 (76.1%) |
| Health Care & Social Assistance | 582 (24.6%) | 1,779 (75.3%) |
| Arts, Entertainment & Recreation | 87 (46.5%) | 100 (53.5%) |
| Accommodation & Food Services | 402 (40.0%) | 603 (60.0%) |
| Public Administration | 202 (50.1%) | 201 (49.9%) |
| Total | 7,682 (51.8%) | 7,136 (48.2%) |
Education in Houma
School Enrollment in Houma
The most common levels of schooling among the 6,823 students in Houma are elementary school (1,671 | 24.5%), high school (1,473 | 21.6%), and middle school (1,443 | 21.1%).
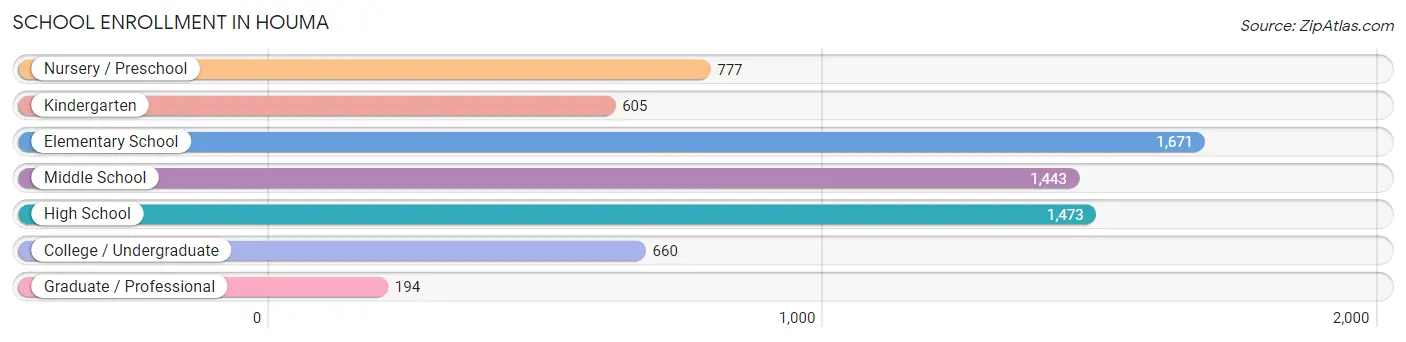
| School Level | # Students | % Students |
| Nursery / Preschool | 777 | 11.4% |
| Kindergarten | 605 | 8.9% |
| Elementary School | 1,671 | 24.5% |
| Middle School | 1,443 | 21.1% |
| High School | 1,473 | 21.6% |
| College / Undergraduate | 660 | 9.7% |
| Graduate / Professional | 194 | 2.8% |
| Total | 6,823 | 100.0% |
School Enrollment by Age by Funding Source in Houma
Out of a total of 6,823 students who are enrolled in schools in Houma, 1,972 (28.9%) attend a private institution, while the remaining 4,851 (71.1%) are enrolled in public schools. The age group of 3 to 4 year olds has the highest likelihood of being enrolled in private schools, with 309 (49.0% in the age bracket) enrolled. Conversely, the age group of 20 to 24 year olds has the lowest likelihood of being enrolled in a private school, with 165 (100.0% in the age bracket) attending a public institution.
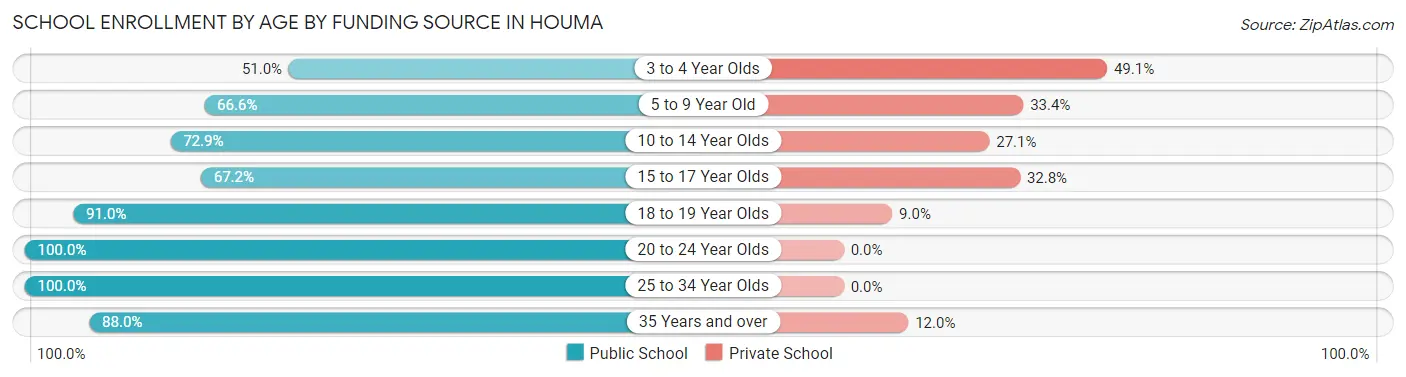
| Age Bracket | Public School | Private School |
| 3 to 4 Year Olds | 321 (50.9%) | 309 (49.0%) |
| 5 to 9 Year Old | 1,471 (66.6%) | 739 (33.4%) |
| 10 to 14 Year Olds | 1,276 (72.9%) | 475 (27.1%) |
| 15 to 17 Year Olds | 751 (67.2%) | 367 (32.8%) |
| 18 to 19 Year Olds | 413 (91.0%) | 41 (9.0%) |
| 20 to 24 Year Olds | 165 (100.0%) | 0 (0.0%) |
| 25 to 34 Year Olds | 179 (100.0%) | 0 (0.0%) |
| 35 Years and over | 278 (88.0%) | 38 (12.0%) |
| Total | 4,851 (71.1%) | 1,972 (28.9%) |
Educational Attainment by Field of Study in Houma
Science & technology (917 | 19.0%), business (833 | 17.3%), education (656 | 13.6%), arts & humanities (487 | 10.1%), and social sciences (359 | 7.4%) are the most common fields of study among 4,824 individuals in Houma who have obtained a bachelor's degree or higher.
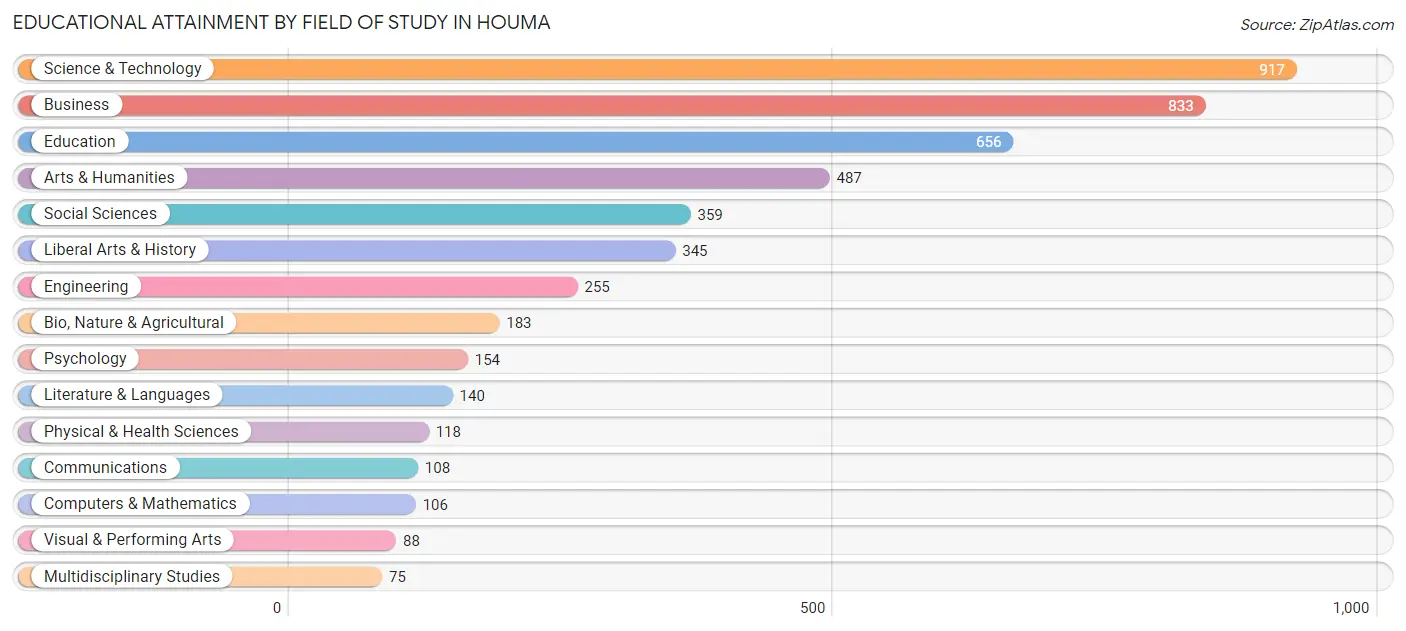
| Field of Study | # Graduates | % Graduates |
| Computers & Mathematics | 106 | 2.2% |
| Bio, Nature & Agricultural | 183 | 3.8% |
| Physical & Health Sciences | 118 | 2.5% |
| Psychology | 154 | 3.2% |
| Social Sciences | 359 | 7.4% |
| Engineering | 255 | 5.3% |
| Multidisciplinary Studies | 75 | 1.5% |
| Science & Technology | 917 | 19.0% |
| Business | 833 | 17.3% |
| Education | 656 | 13.6% |
| Literature & Languages | 140 | 2.9% |
| Liberal Arts & History | 345 | 7.1% |
| Visual & Performing Arts | 88 | 1.8% |
| Communications | 108 | 2.2% |
| Arts & Humanities | 487 | 10.1% |
| Total | 4,824 | 100.0% |
Transportation & Commute in Houma
Vehicle Availability by Sex in Houma
The most prevalent vehicle ownership categories in Houma are males with 2 vehicles (4,083, accounting for 53.5%) and females with 2 vehicles (3,458, making up 59.3%).
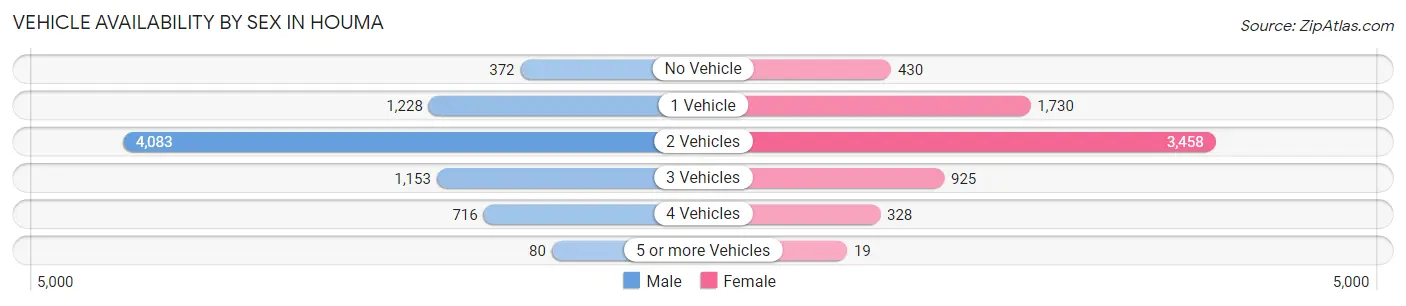
| Vehicles Available | Male | Female |
| No Vehicle | 372 (4.9%) | 430 (6.2%) |
| 1 Vehicle | 1,228 (16.1%) | 1,730 (25.1%) |
| 2 Vehicles | 4,083 (53.5%) | 3,458 (50.2%) |
| 3 Vehicles | 1,153 (15.1%) | 925 (13.4%) |
| 4 Vehicles | 716 (9.4%) | 328 (4.8%) |
| 5 or more Vehicles | 80 (1.1%) | 19 (0.3%) |
| Total | 7,632 (100.0%) | 6,890 (100.0%) |
Commute Time in Houma
The most frequently occuring commute durations in Houma are 10 to 14 minutes (3,239 commuters, 23.0%), 5 to 9 minutes (3,160 commuters, 22.4%), and 15 to 19 minutes (2,536 commuters, 18.0%).
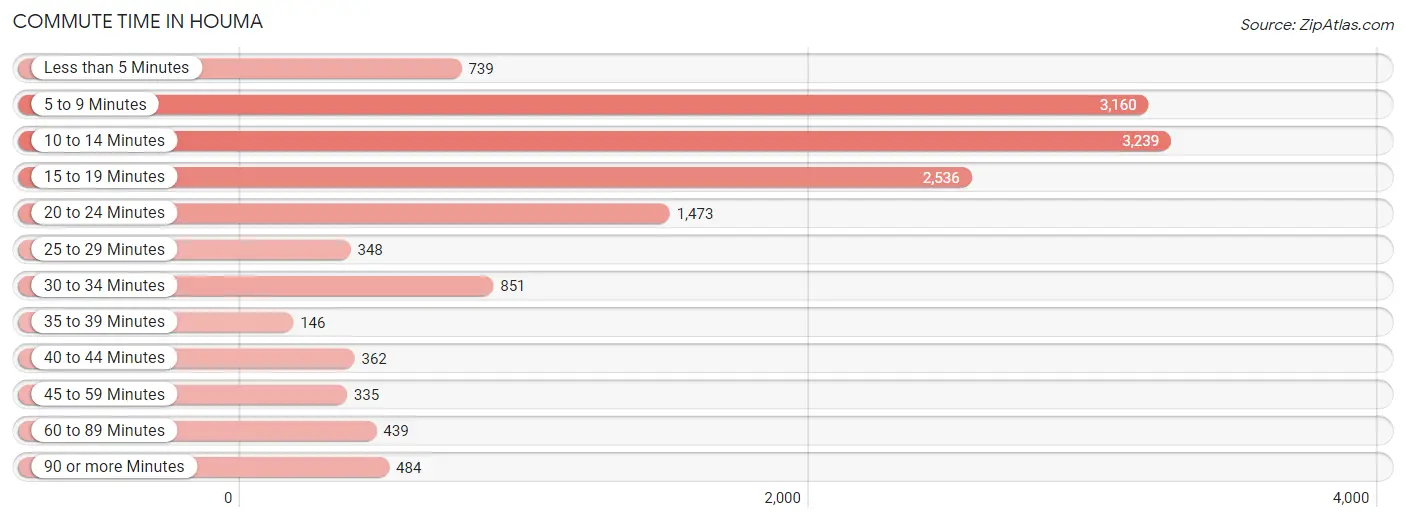
| Commute Time | # Commuters | % Commuters |
| Less than 5 Minutes | 739 | 5.2% |
| 5 to 9 Minutes | 3,160 | 22.4% |
| 10 to 14 Minutes | 3,239 | 23.0% |
| 15 to 19 Minutes | 2,536 | 18.0% |
| 20 to 24 Minutes | 1,473 | 10.4% |
| 25 to 29 Minutes | 348 | 2.5% |
| 30 to 34 Minutes | 851 | 6.0% |
| 35 to 39 Minutes | 146 | 1.0% |
| 40 to 44 Minutes | 362 | 2.6% |
| 45 to 59 Minutes | 335 | 2.4% |
| 60 to 89 Minutes | 439 | 3.1% |
| 90 or more Minutes | 484 | 3.4% |
Commute Time by Sex in Houma
The most common commute times in Houma are 5 to 9 minutes (1,600 commuters, 21.4%) for males and 10 to 14 minutes (1,839 commuters, 27.8%) for females.
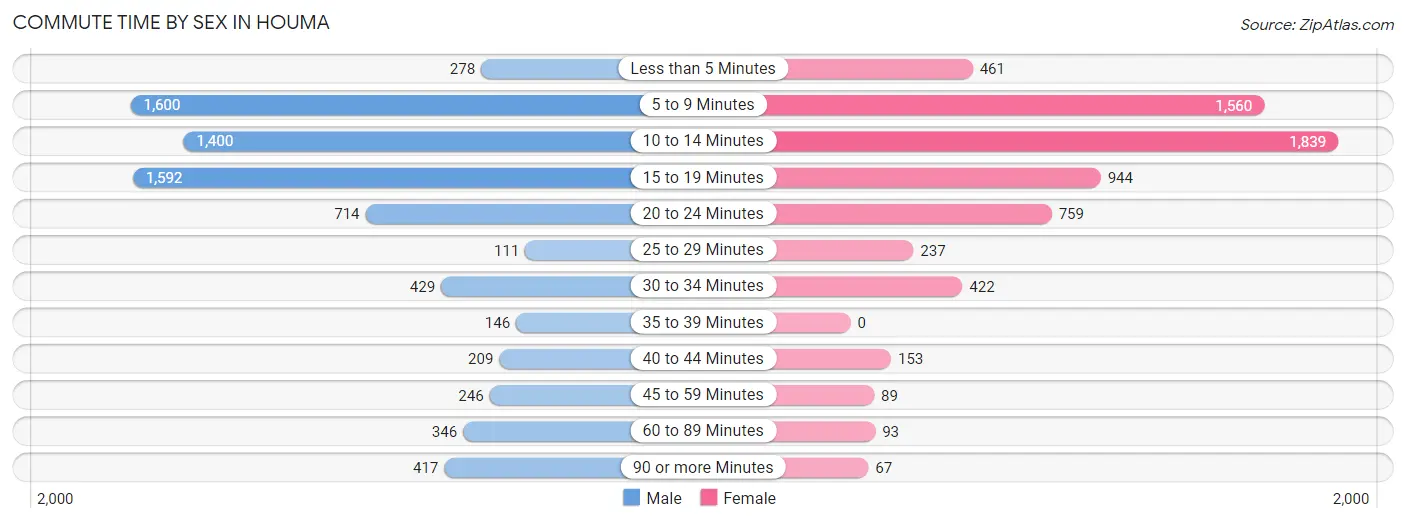
| Commute Time | Male | Female |
| Less than 5 Minutes | 278 (3.7%) | 461 (7.0%) |
| 5 to 9 Minutes | 1,600 (21.4%) | 1,560 (23.5%) |
| 10 to 14 Minutes | 1,400 (18.7%) | 1,839 (27.8%) |
| 15 to 19 Minutes | 1,592 (21.3%) | 944 (14.2%) |
| 20 to 24 Minutes | 714 (9.5%) | 759 (11.5%) |
| 25 to 29 Minutes | 111 (1.5%) | 237 (3.6%) |
| 30 to 34 Minutes | 429 (5.7%) | 422 (6.4%) |
| 35 to 39 Minutes | 146 (1.9%) | 0 (0.0%) |
| 40 to 44 Minutes | 209 (2.8%) | 153 (2.3%) |
| 45 to 59 Minutes | 246 (3.3%) | 89 (1.3%) |
| 60 to 89 Minutes | 346 (4.6%) | 93 (1.4%) |
| 90 or more Minutes | 417 (5.6%) | 67 (1.0%) |
Time of Departure to Work by Sex in Houma
The most frequent times of departure to work in Houma are 7:00 AM to 7:29 AM (1,066, 14.2%) for males and 7:30 AM to 7:59 AM (1,334, 20.1%) for females.
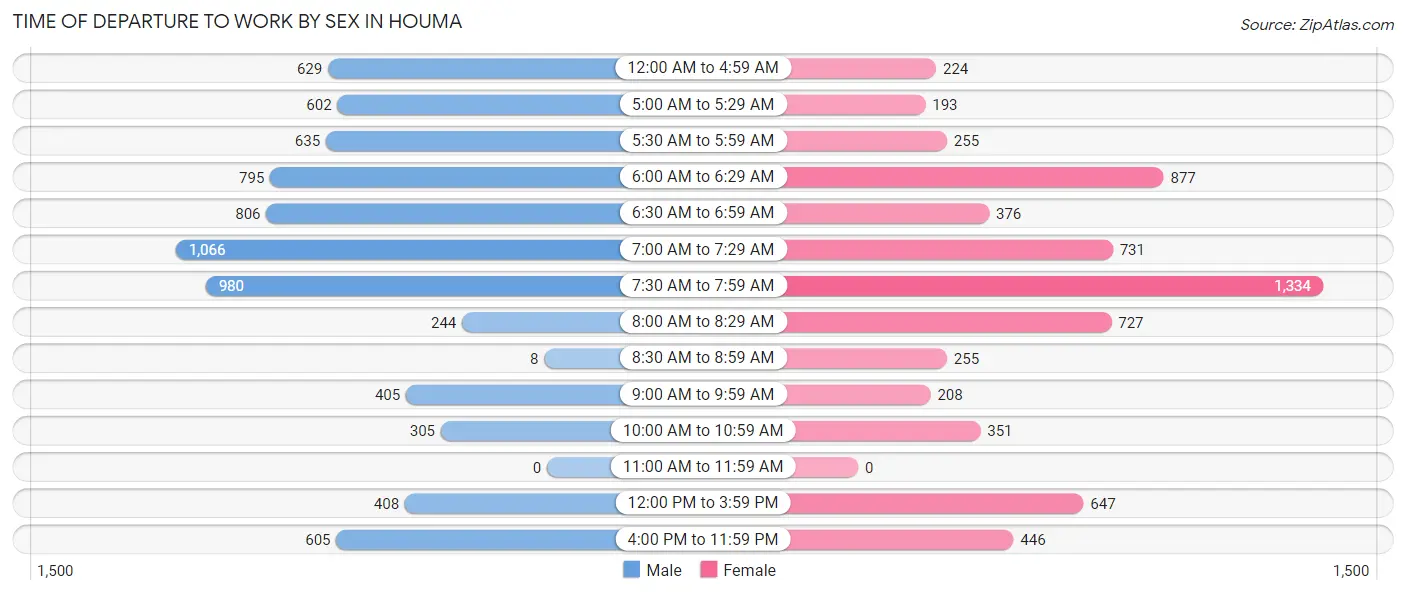
| Time of Departure | Male | Female |
| 12:00 AM to 4:59 AM | 629 (8.4%) | 224 (3.4%) |
| 5:00 AM to 5:29 AM | 602 (8.0%) | 193 (2.9%) |
| 5:30 AM to 5:59 AM | 635 (8.5%) | 255 (3.8%) |
| 6:00 AM to 6:29 AM | 795 (10.6%) | 877 (13.2%) |
| 6:30 AM to 6:59 AM | 806 (10.8%) | 376 (5.7%) |
| 7:00 AM to 7:29 AM | 1,066 (14.2%) | 731 (11.0%) |
| 7:30 AM to 7:59 AM | 980 (13.1%) | 1,334 (20.1%) |
| 8:00 AM to 8:29 AM | 244 (3.3%) | 727 (11.0%) |
| 8:30 AM to 8:59 AM | 8 (0.1%) | 255 (3.8%) |
| 9:00 AM to 9:59 AM | 405 (5.4%) | 208 (3.1%) |
| 10:00 AM to 10:59 AM | 305 (4.1%) | 351 (5.3%) |
| 11:00 AM to 11:59 AM | 0 (0.0%) | 0 (0.0%) |
| 12:00 PM to 3:59 PM | 408 (5.4%) | 647 (9.8%) |
| 4:00 PM to 11:59 PM | 605 (8.1%) | 446 (6.7%) |
| Total | 7,488 (100.0%) | 6,624 (100.0%) |
Housing Occupancy in Houma
Occupancy by Ownership in Houma
Of the total 13,315 dwellings in Houma, owner-occupied units account for 9,333 (70.1%), while renter-occupied units make up 3,982 (29.9%).
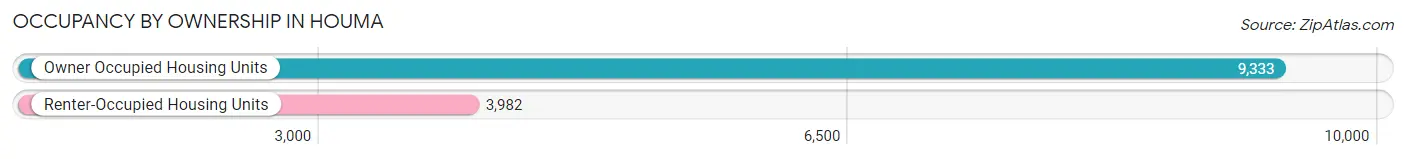
| Occupancy | # Housing Units | % Housing Units |
| Owner Occupied Housing Units | 9,333 | 70.1% |
| Renter-Occupied Housing Units | 3,982 | 29.9% |
| Total Occupied Housing Units | 13,315 | 100.0% |
Occupancy by Household Size in Houma
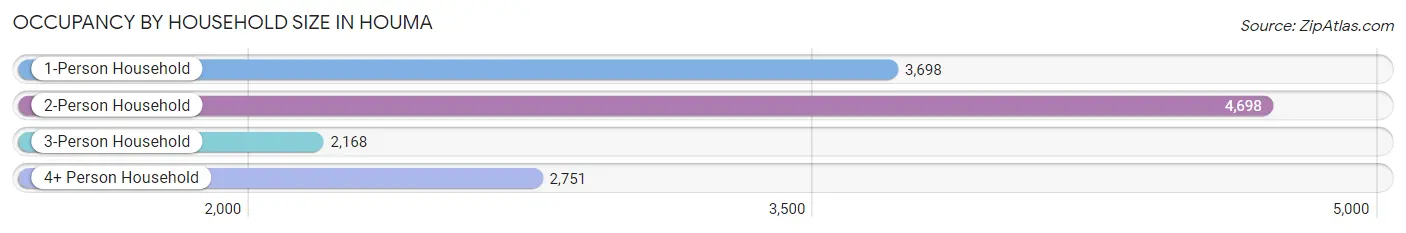
| Household Size | # Housing Units | % Housing Units |
| 1-Person Household | 3,698 | 27.8% |
| 2-Person Household | 4,698 | 35.3% |
| 3-Person Household | 2,168 | 16.3% |
| 4+ Person Household | 2,751 | 20.7% |
| Total Housing Units | 13,315 | 100.0% |
Occupancy by Ownership by Household Size in Houma
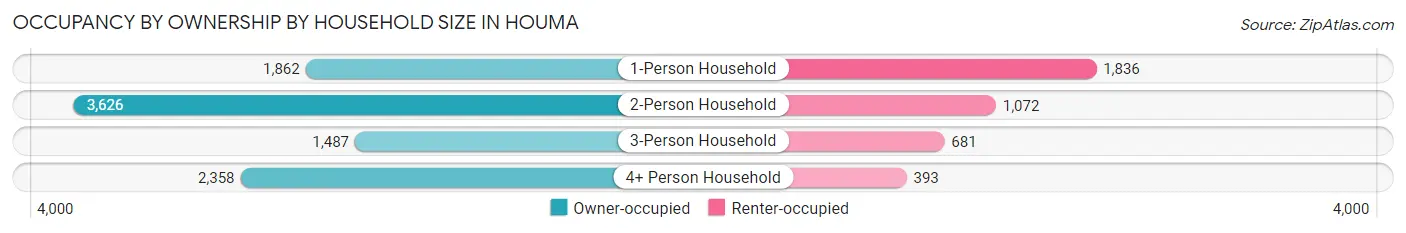
| Household Size | Owner-occupied | Renter-occupied |
| 1-Person Household | 1,862 (50.3%) | 1,836 (49.6%) |
| 2-Person Household | 3,626 (77.2%) | 1,072 (22.8%) |
| 3-Person Household | 1,487 (68.6%) | 681 (31.4%) |
| 4+ Person Household | 2,358 (85.7%) | 393 (14.3%) |
| Total Housing Units | 9,333 (70.1%) | 3,982 (29.9%) |
Occupancy by Educational Attainment in Houma
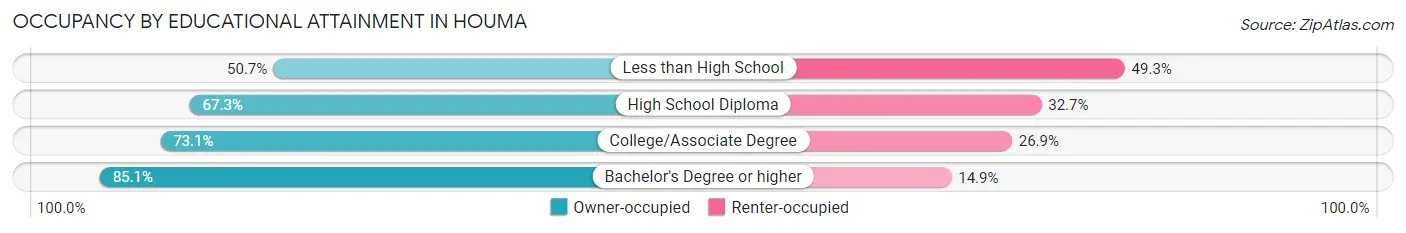
| Household Size | Owner-occupied | Renter-occupied |
| Less than High School | 941 (50.7%) | 914 (49.3%) |
| High School Diploma | 3,200 (67.3%) | 1,557 (32.7%) |
| College/Associate Degree | 3,124 (73.1%) | 1,149 (26.9%) |
| Bachelor's Degree or higher | 2,068 (85.1%) | 362 (14.9%) |
Occupancy by Age of Householder in Houma
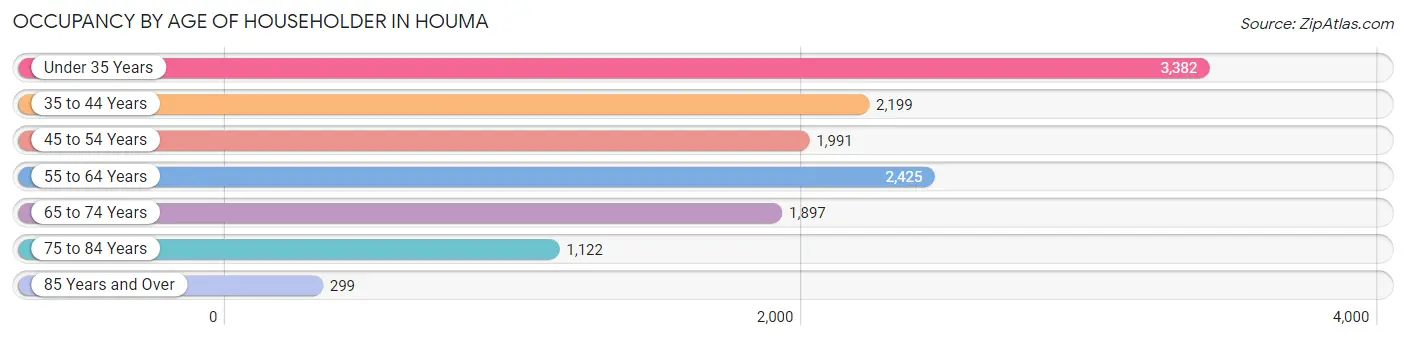
| Age Bracket | # Households | % Households |
| Under 35 Years | 3,382 | 25.4% |
| 35 to 44 Years | 2,199 | 16.5% |
| 45 to 54 Years | 1,991 | 14.9% |
| 55 to 64 Years | 2,425 | 18.2% |
| 65 to 74 Years | 1,897 | 14.2% |
| 75 to 84 Years | 1,122 | 8.4% |
| 85 Years and Over | 299 | 2.2% |
| Total | 13,315 | 100.0% |
Housing Finances in Houma
Median Income by Occupancy in Houma
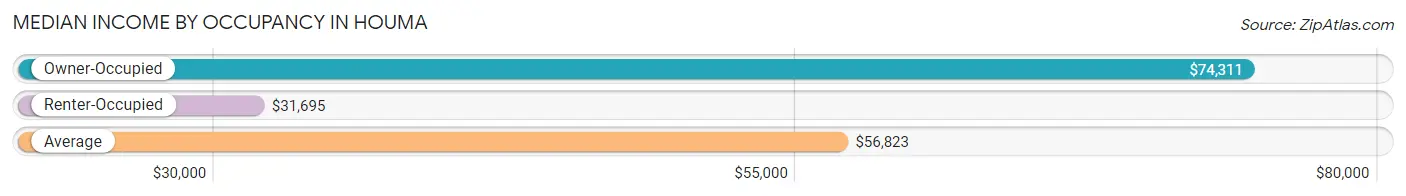
| Occupancy Type | # Households | Median Income |
| Owner-Occupied | 9,333 (70.1%) | $74,311 |
| Renter-Occupied | 3,982 (29.9%) | $31,695 |
| Average | 13,315 (100.0%) | $56,823 |
Occupancy by Householder Income Bracket in Houma
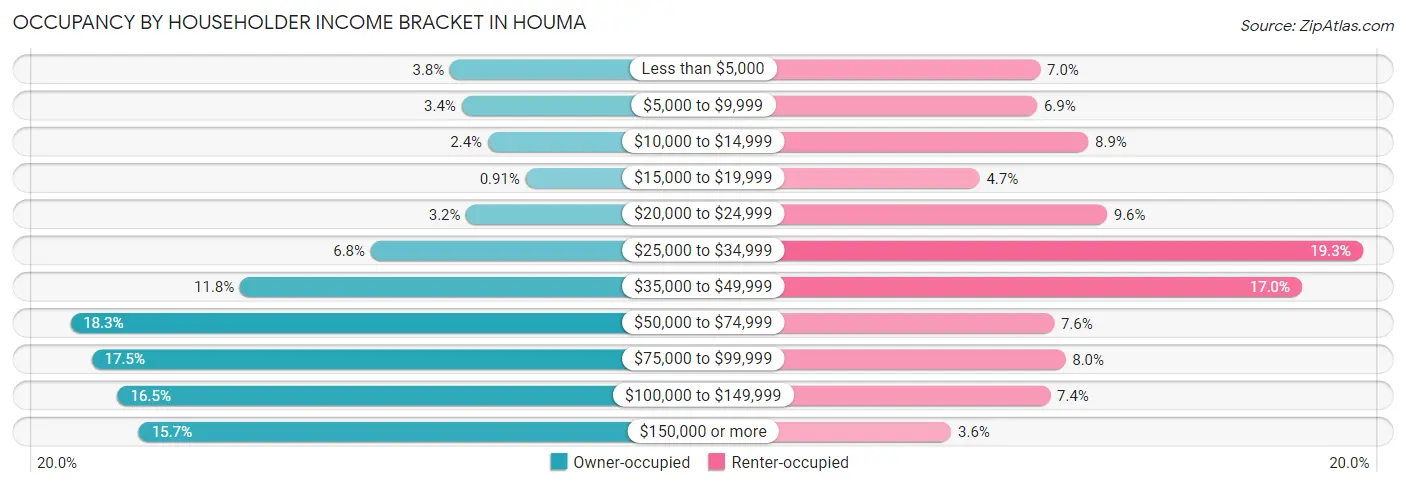
| Income Bracket | Owner-occupied | Renter-occupied |
| Less than $5,000 | 354 (3.8%) | 280 (7.0%) |
| $5,000 to $9,999 | 313 (3.4%) | 275 (6.9%) |
| $10,000 to $14,999 | 219 (2.4%) | 353 (8.9%) |
| $15,000 to $19,999 | 85 (0.9%) | 188 (4.7%) |
| $20,000 to $24,999 | 296 (3.2%) | 381 (9.6%) |
| $25,000 to $34,999 | 636 (6.8%) | 769 (19.3%) |
| $35,000 to $49,999 | 1,100 (11.8%) | 677 (17.0%) |
| $50,000 to $74,999 | 1,704 (18.3%) | 301 (7.6%) |
| $75,000 to $99,999 | 1,629 (17.4%) | 318 (8.0%) |
| $100,000 to $149,999 | 1,536 (16.5%) | 295 (7.4%) |
| $150,000 or more | 1,461 (15.7%) | 145 (3.6%) |
| Total | 9,333 (100.0%) | 3,982 (100.0%) |
Monthly Housing Cost Tiers in Houma
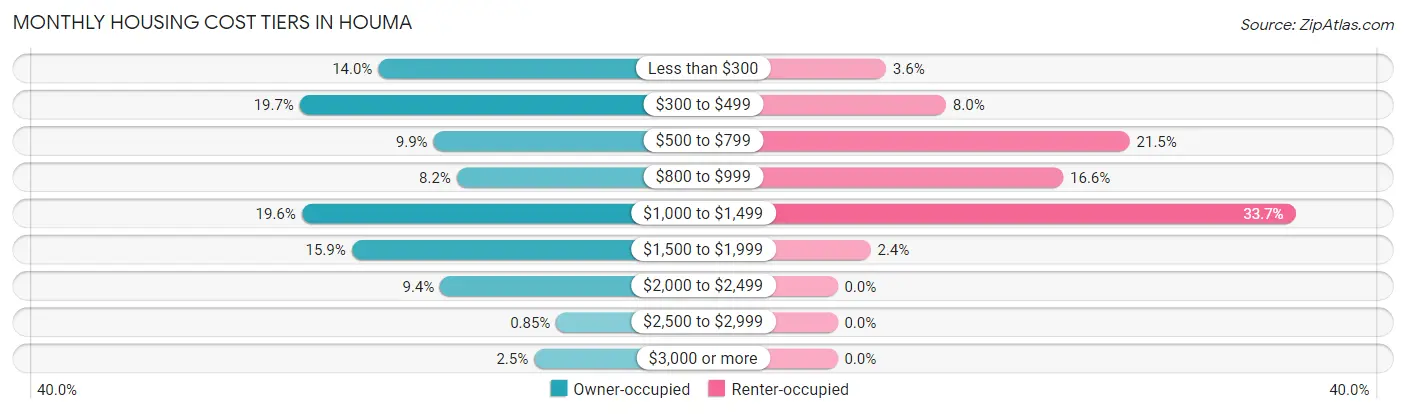
| Monthly Cost | Owner-occupied | Renter-occupied |
| Less than $300 | 1,303 (14.0%) | 142 (3.6%) |
| $300 to $499 | 1,842 (19.7%) | 318 (8.0%) |
| $500 to $799 | 923 (9.9%) | 857 (21.5%) |
| $800 to $999 | 763 (8.2%) | 662 (16.6%) |
| $1,000 to $1,499 | 1,829 (19.6%) | 1,343 (33.7%) |
| $1,500 to $1,999 | 1,486 (15.9%) | 97 (2.4%) |
| $2,000 to $2,499 | 877 (9.4%) | 0 (0.0%) |
| $2,500 to $2,999 | 79 (0.9%) | 0 (0.0%) |
| $3,000 or more | 231 (2.5%) | 0 (0.0%) |
| Total | 9,333 (100.0%) | 3,982 (100.0%) |
Physical Housing Characteristics in Houma
Housing Structures in Houma
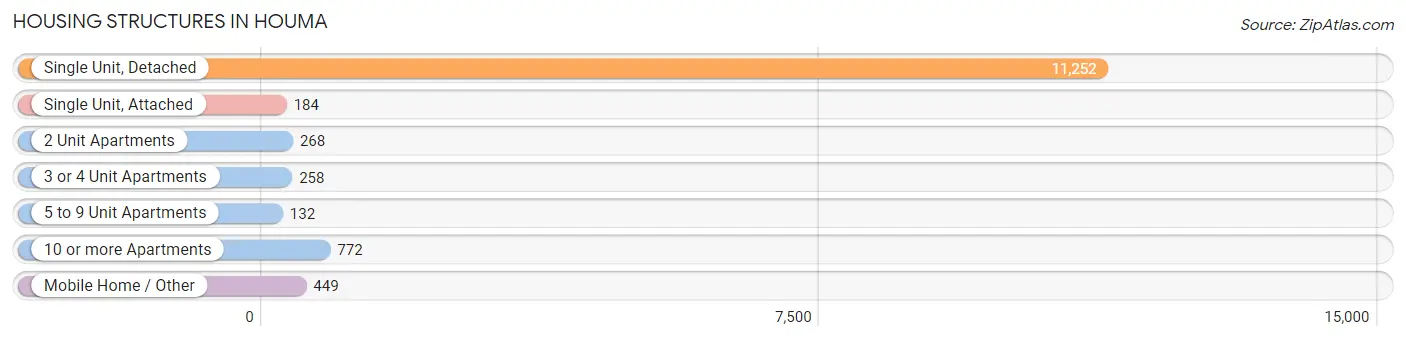
| Structure Type | # Housing Units | % Housing Units |
| Single Unit, Detached | 11,252 | 84.5% |
| Single Unit, Attached | 184 | 1.4% |
| 2 Unit Apartments | 268 | 2.0% |
| 3 or 4 Unit Apartments | 258 | 1.9% |
| 5 to 9 Unit Apartments | 132 | 1.0% |
| 10 or more Apartments | 772 | 5.8% |
| Mobile Home / Other | 449 | 3.4% |
| Total | 13,315 | 100.0% |
Housing Structures by Occupancy in Houma
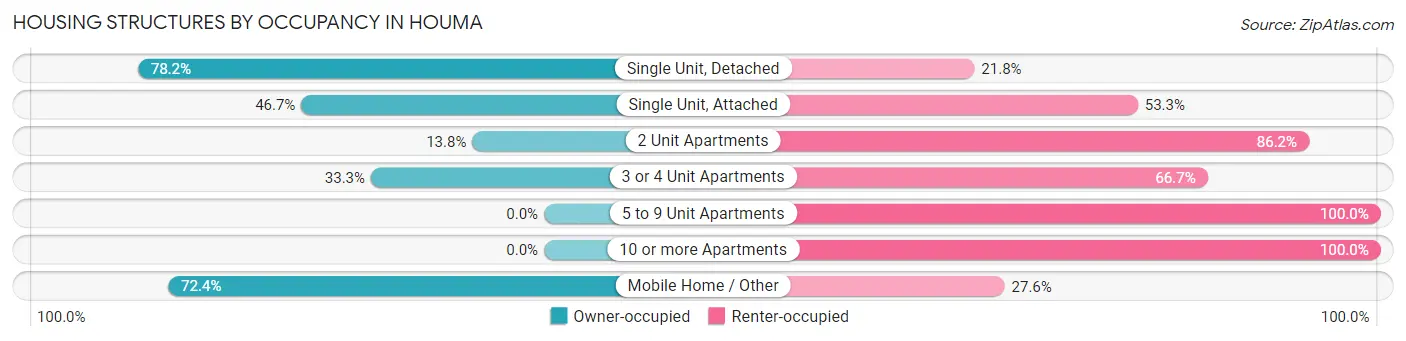
| Structure Type | Owner-occupied | Renter-occupied |
| Single Unit, Detached | 8,799 (78.2%) | 2,453 (21.8%) |
| Single Unit, Attached | 86 (46.7%) | 98 (53.3%) |
| 2 Unit Apartments | 37 (13.8%) | 231 (86.2%) |
| 3 or 4 Unit Apartments | 86 (33.3%) | 172 (66.7%) |
| 5 to 9 Unit Apartments | 0 (0.0%) | 132 (100.0%) |
| 10 or more Apartments | 0 (0.0%) | 772 (100.0%) |
| Mobile Home / Other | 325 (72.4%) | 124 (27.6%) |
| Total | 9,333 (70.1%) | 3,982 (29.9%) |
Housing Structures by Number of Rooms in Houma
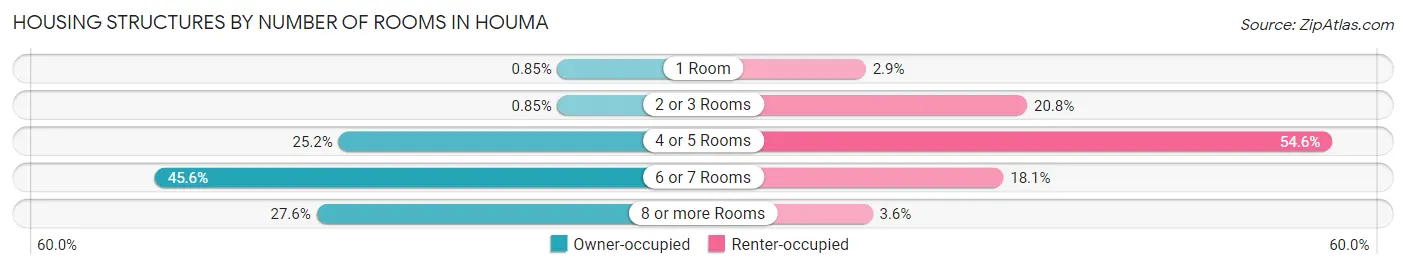
| Number of Rooms | Owner-occupied | Renter-occupied |
| 1 Room | 79 (0.9%) | 114 (2.9%) |
| 2 or 3 Rooms | 79 (0.9%) | 827 (20.8%) |
| 4 or 5 Rooms | 2,348 (25.2%) | 2,175 (54.6%) |
| 6 or 7 Rooms | 4,251 (45.6%) | 722 (18.1%) |
| 8 or more Rooms | 2,576 (27.6%) | 144 (3.6%) |
| Total | 9,333 (100.0%) | 3,982 (100.0%) |
Housing Structure by Heating Type in Houma
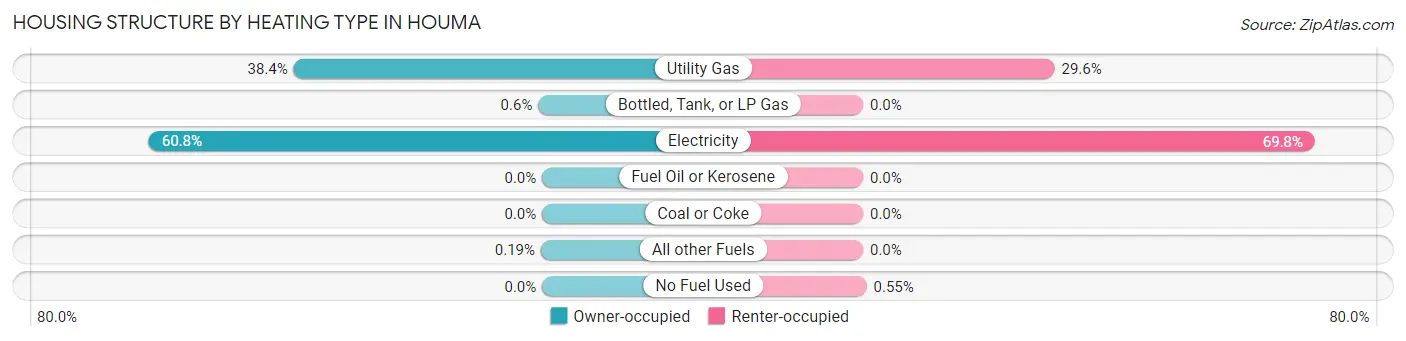
| Heating Type | Owner-occupied | Renter-occupied |
| Utility Gas | 3,585 (38.4%) | 1,179 (29.6%) |
| Bottled, Tank, or LP Gas | 56 (0.6%) | 0 (0.0%) |
| Electricity | 5,674 (60.8%) | 2,781 (69.8%) |
| Fuel Oil or Kerosene | 0 (0.0%) | 0 (0.0%) |
| Coal or Coke | 0 (0.0%) | 0 (0.0%) |
| All other Fuels | 18 (0.2%) | 0 (0.0%) |
| No Fuel Used | 0 (0.0%) | 22 (0.5%) |
| Total | 9,333 (100.0%) | 3,982 (100.0%) |
Household Vehicle Usage in Houma
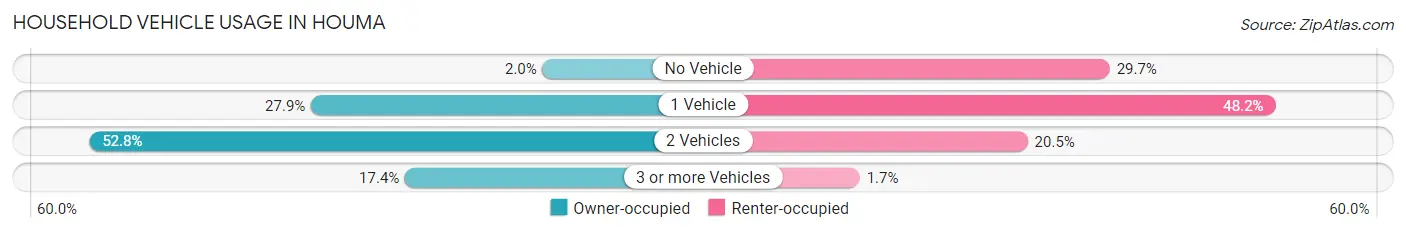
| Vehicles per Household | Owner-occupied | Renter-occupied |
| No Vehicle | 184 (2.0%) | 1,181 (29.7%) |
| 1 Vehicle | 2,604 (27.9%) | 1,920 (48.2%) |
| 2 Vehicles | 4,924 (52.8%) | 815 (20.5%) |
| 3 or more Vehicles | 1,621 (17.4%) | 66 (1.7%) |
| Total | 9,333 (100.0%) | 3,982 (100.0%) |
Real Estate & Mortgages in Houma
Real Estate and Mortgage Overview in Houma
| Characteristic | Without Mortgage | With Mortgage |
| Housing Units | 4,019 | 5,314 |
| Median Property Value | $165,200 | $227,000 |
| Median Household Income | $51,875 | $1,059 |
| Monthly Housing Costs | $387 | $231 |
| Real Estate Taxes | $478 | $401 |
Property Value by Mortgage Status in Houma
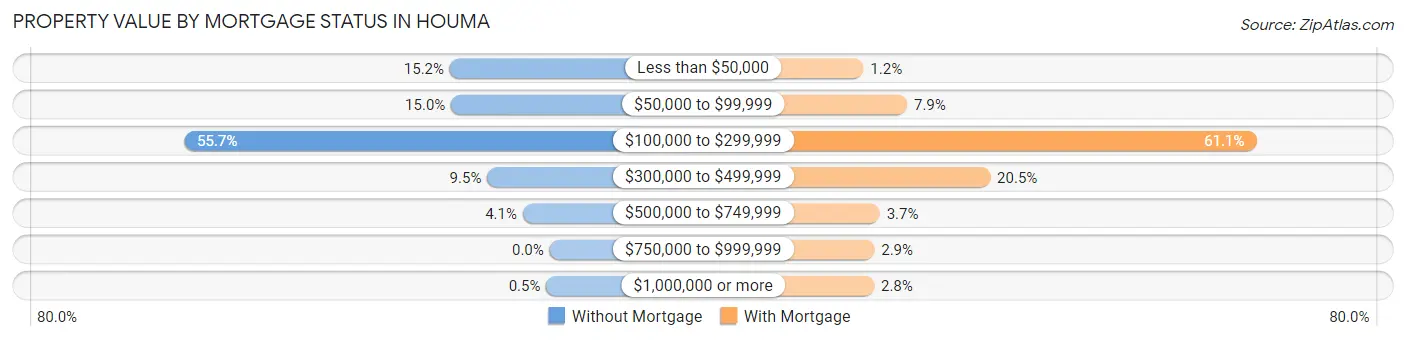
| Property Value | Without Mortgage | With Mortgage |
| Less than $50,000 | 611 (15.2%) | 64 (1.2%) |
| $50,000 to $99,999 | 603 (15.0%) | 417 (7.9%) |
| $100,000 to $299,999 | 2,239 (55.7%) | 3,245 (61.1%) |
| $300,000 to $499,999 | 382 (9.5%) | 1,090 (20.5%) |
| $500,000 to $749,999 | 164 (4.1%) | 196 (3.7%) |
| $750,000 to $999,999 | 0 (0.0%) | 152 (2.9%) |
| $1,000,000 or more | 20 (0.5%) | 150 (2.8%) |
| Total | 4,019 (100.0%) | 5,314 (100.0%) |
Household Income by Mortgage Status in Houma
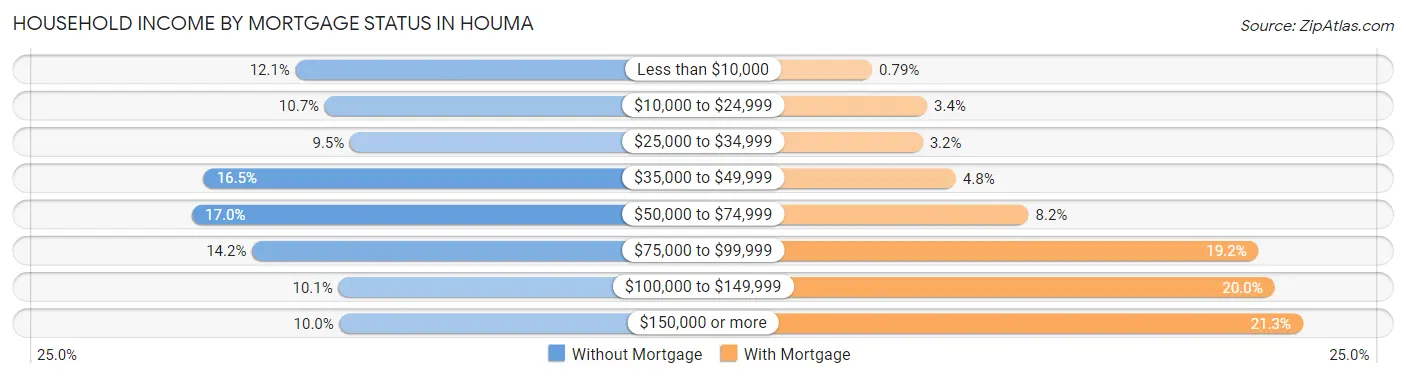
| Household Income | Without Mortgage | With Mortgage |
| Less than $10,000 | 486 (12.1%) | 42 (0.8%) |
| $10,000 to $24,999 | 430 (10.7%) | 181 (3.4%) |
| $25,000 to $34,999 | 382 (9.5%) | 170 (3.2%) |
| $35,000 to $49,999 | 662 (16.5%) | 254 (4.8%) |
| $50,000 to $74,999 | 684 (17.0%) | 438 (8.2%) |
| $75,000 to $99,999 | 569 (14.2%) | 1,020 (19.2%) |
| $100,000 to $149,999 | 404 (10.1%) | 1,060 (20.0%) |
| $150,000 or more | 402 (10.0%) | 1,132 (21.3%) |
| Total | 4,019 (100.0%) | 5,314 (100.0%) |
Property Value to Household Income Ratio in Houma
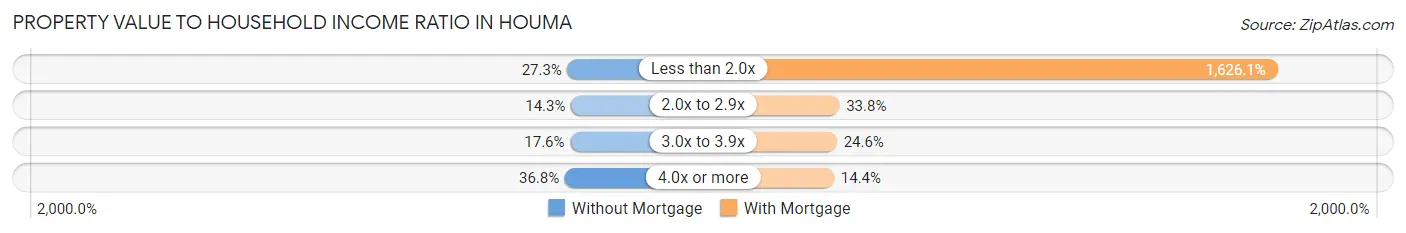
| Value-to-Income Ratio | Without Mortgage | With Mortgage |
| Less than 2.0x | 1,098 (27.3%) | 86,413 (1,626.1%) |
| 2.0x to 2.9x | 573 (14.3%) | 1,798 (33.8%) |
| 3.0x to 3.9x | 708 (17.6%) | 1,308 (24.6%) |
| 4.0x or more | 1,480 (36.8%) | 763 (14.4%) |
| Total | 4,019 (100.0%) | 5,314 (100.0%) |
Real Estate Taxes by Mortgage Status in Houma
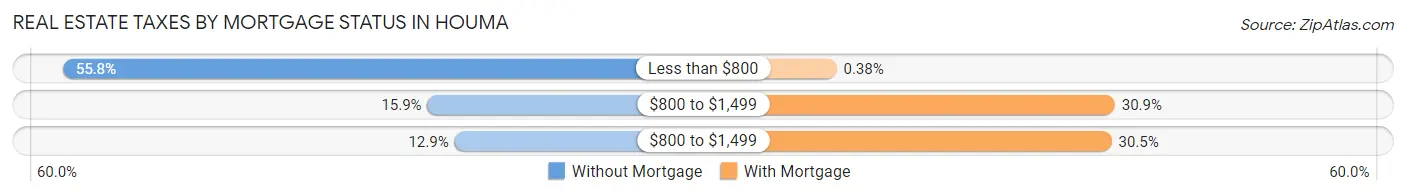
| Property Taxes | Without Mortgage | With Mortgage |
| Less than $800 | 2,243 (55.8%) | 20 (0.4%) |
| $800 to $1,499 | 637 (15.9%) | 1,641 (30.9%) |
| $800 to $1,499 | 518 (12.9%) | 1,622 (30.5%) |
| Total | 4,019 (100.0%) | 5,314 (100.0%) |
Health & Disability in Houma
Health Insurance Coverage by Age in Houma
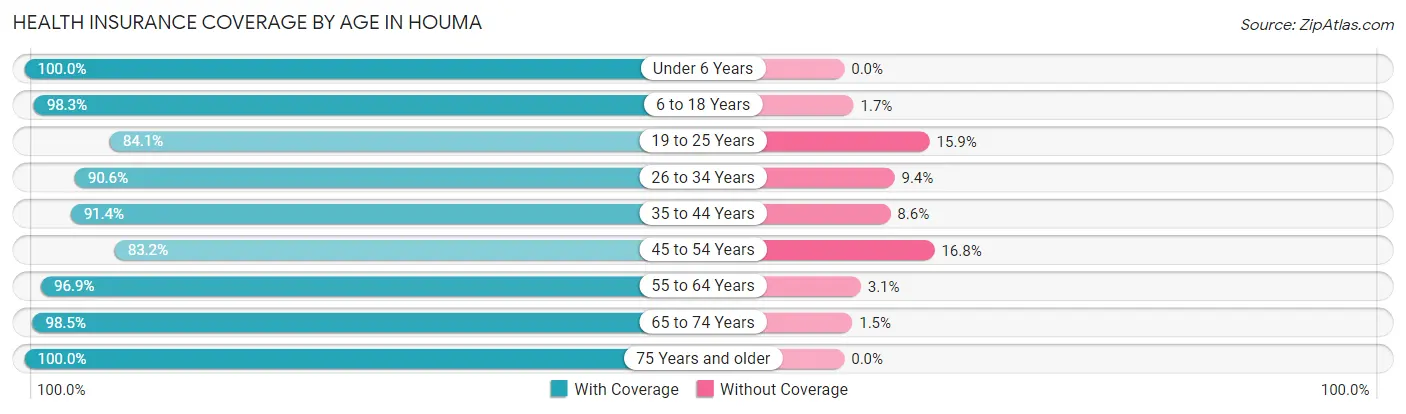
| Age Bracket | With Coverage | Without Coverage |
| Under 6 Years | 3,777 (100.0%) | 0 (0.0%) |
| 6 to 18 Years | 5,235 (98.3%) | 92 (1.7%) |
| 19 to 25 Years | 2,061 (84.1%) | 390 (15.9%) |
| 26 to 34 Years | 4,045 (90.6%) | 418 (9.4%) |
| 35 to 44 Years | 3,710 (91.4%) | 349 (8.6%) |
| 45 to 54 Years | 3,155 (83.2%) | 638 (16.8%) |
| 55 to 64 Years | 3,903 (96.9%) | 124 (3.1%) |
| 65 to 74 Years | 3,167 (98.5%) | 48 (1.5%) |
| 75 Years and older | 1,805 (100.0%) | 0 (0.0%) |
| Total | 30,858 (93.7%) | 2,059 (6.3%) |
Health Insurance Coverage by Citizenship Status in Houma
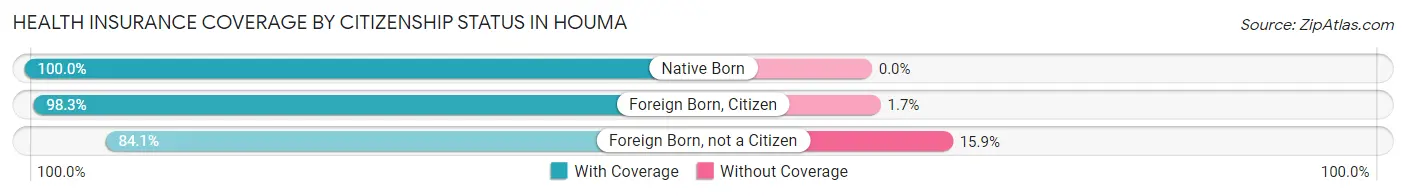
| Citizenship Status | With Coverage | Without Coverage |
| Native Born | 3,777 (100.0%) | 0 (0.0%) |
| Foreign Born, Citizen | 5,235 (98.3%) | 92 (1.7%) |
| Foreign Born, not a Citizen | 2,061 (84.1%) | 390 (15.9%) |
Health Insurance Coverage by Household Income in Houma
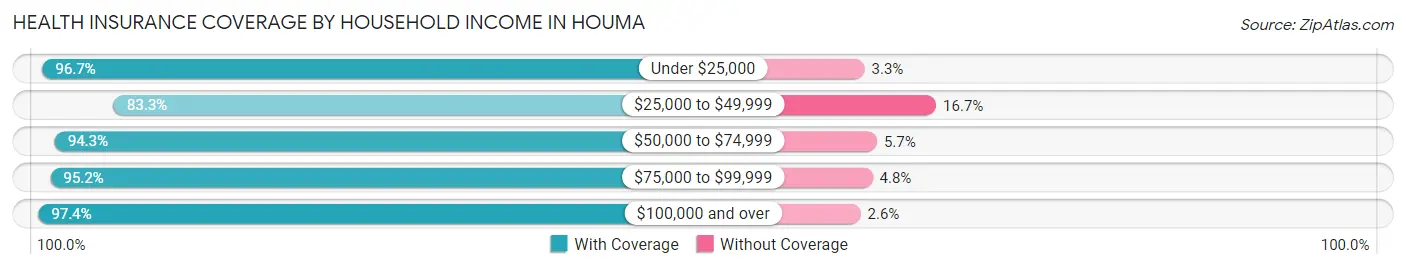
| Household Income | With Coverage | Without Coverage |
| Under $25,000 | 4,312 (96.7%) | 149 (3.3%) |
| $25,000 to $49,999 | 5,256 (83.3%) | 1,057 (16.7%) |
| $50,000 to $74,999 | 4,700 (94.3%) | 282 (5.7%) |
| $75,000 to $99,999 | 4,992 (95.2%) | 254 (4.8%) |
| $100,000 and over | 11,504 (97.4%) | 306 (2.6%) |
Public vs Private Health Insurance Coverage by Age in Houma
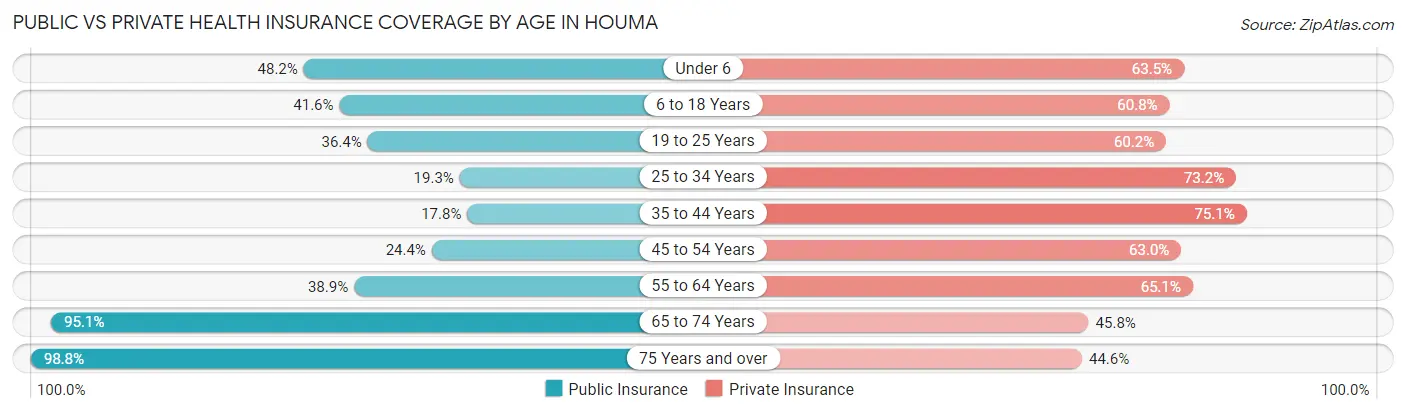
| Age Bracket | Public Insurance | Private Insurance |
| Under 6 | 1,821 (48.2%) | 2,398 (63.5%) |
| 6 to 18 Years | 2,215 (41.6%) | 3,239 (60.8%) |
| 19 to 25 Years | 891 (36.3%) | 1,475 (60.2%) |
| 25 to 34 Years | 859 (19.3%) | 3,265 (73.2%) |
| 35 to 44 Years | 724 (17.8%) | 3,050 (75.1%) |
| 45 to 54 Years | 927 (24.4%) | 2,389 (63.0%) |
| 55 to 64 Years | 1,565 (38.9%) | 2,623 (65.1%) |
| 65 to 74 Years | 3,057 (95.1%) | 1,473 (45.8%) |
| 75 Years and over | 1,784 (98.8%) | 805 (44.6%) |
| Total | 13,843 (42.0%) | 20,717 (62.9%) |
Disability Status by Sex by Age in Houma
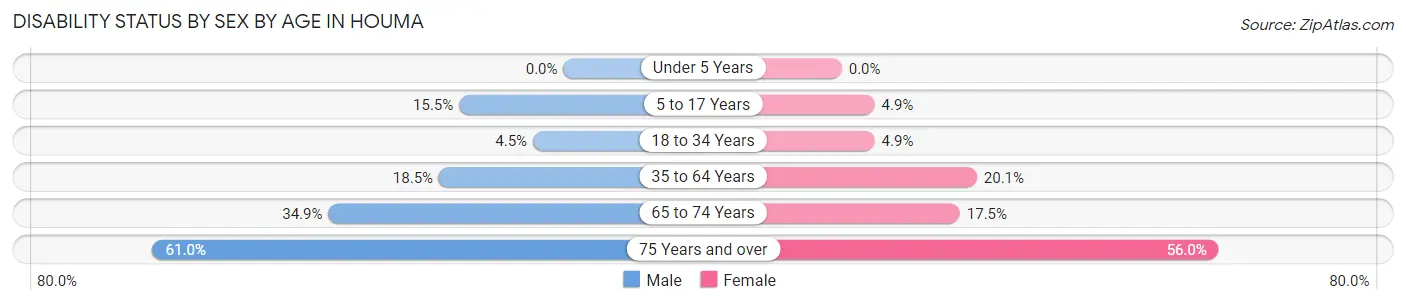
| Age Bracket | Male | Female |
| Under 5 Years | 0 (0.0%) | 0 (0.0%) |
| 5 to 17 Years | 441 (15.5%) | 133 (4.9%) |
| 18 to 34 Years | 157 (4.5%) | 187 (4.9%) |
| 35 to 64 Years | 1,078 (18.5%) | 1,213 (20.1%) |
| 65 to 74 Years | 539 (34.9%) | 293 (17.5%) |
| 75 Years and over | 425 (61.0%) | 620 (56.0%) |
Disability Class by Sex by Age in Houma
Disability Class: Hearing Difficulty
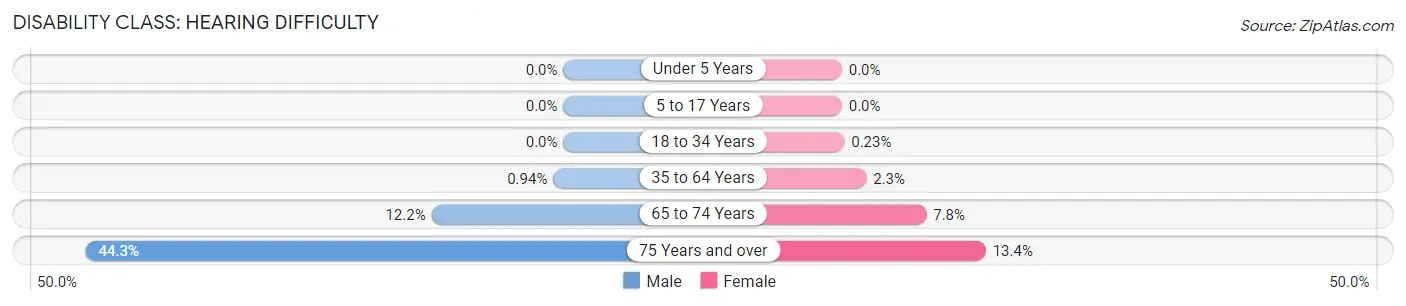
| Age Bracket | Male | Female |
| Under 5 Years | 0 (0.0%) | 0 (0.0%) |
| 5 to 17 Years | 0 (0.0%) | 0 (0.0%) |
| 18 to 34 Years | 0 (0.0%) | 9 (0.2%) |
| 35 to 64 Years | 55 (0.9%) | 137 (2.3%) |
| 65 to 74 Years | 189 (12.2%) | 131 (7.8%) |
| 75 Years and over | 309 (44.3%) | 148 (13.4%) |
Disability Class: Vision Difficulty
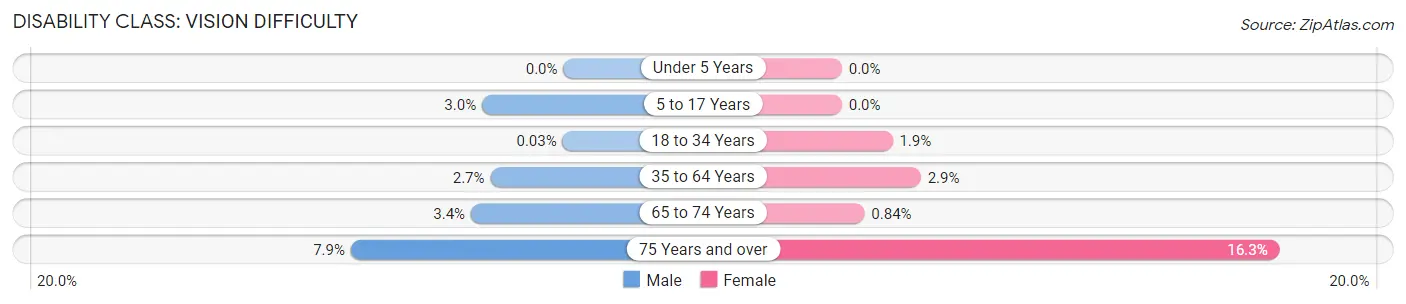
| Age Bracket | Male | Female |
| Under 5 Years | 0 (0.0%) | 0 (0.0%) |
| 5 to 17 Years | 86 (3.0%) | 0 (0.0%) |
| 18 to 34 Years | 1 (0.0%) | 72 (1.9%) |
| 35 to 64 Years | 158 (2.7%) | 177 (2.9%) |
| 65 to 74 Years | 53 (3.4%) | 14 (0.8%) |
| 75 Years and over | 55 (7.9%) | 180 (16.3%) |
Disability Class: Cognitive Difficulty
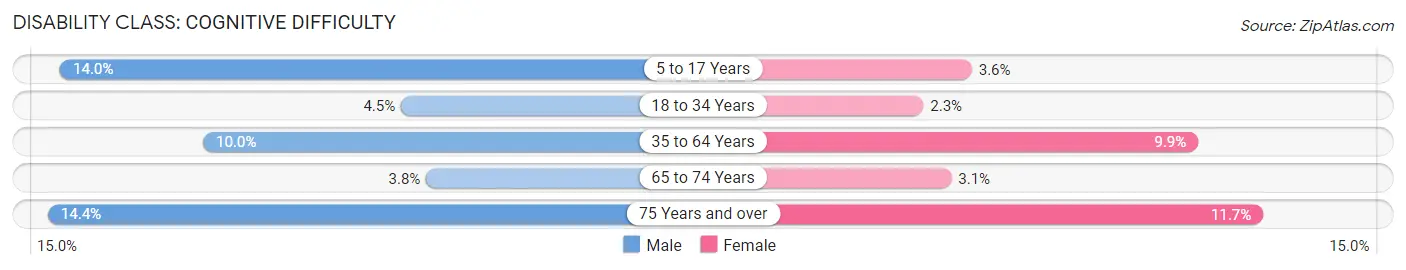
| Age Bracket | Male | Female |
| 5 to 17 Years | 399 (14.0%) | 99 (3.6%) |
| 18 to 34 Years | 157 (4.5%) | 87 (2.3%) |
| 35 to 64 Years | 585 (10.0%) | 600 (9.9%) |
| 65 to 74 Years | 59 (3.8%) | 51 (3.0%) |
| 75 Years and over | 100 (14.3%) | 130 (11.7%) |
Disability Class: Ambulatory Difficulty
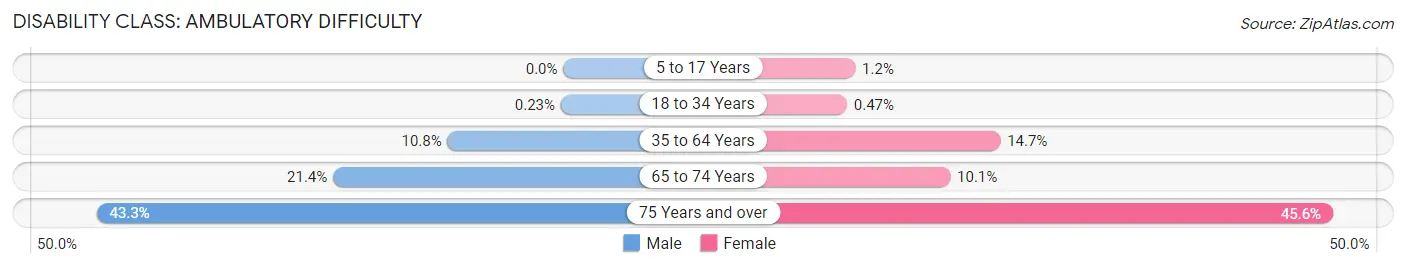
| Age Bracket | Male | Female |
| 5 to 17 Years | 0 (0.0%) | 34 (1.2%) |
| 18 to 34 Years | 8 (0.2%) | 18 (0.5%) |
| 35 to 64 Years | 627 (10.7%) | 889 (14.7%) |
| 65 to 74 Years | 330 (21.4%) | 168 (10.1%) |
| 75 Years and over | 302 (43.3%) | 505 (45.6%) |
Disability Class: Self-Care Difficulty
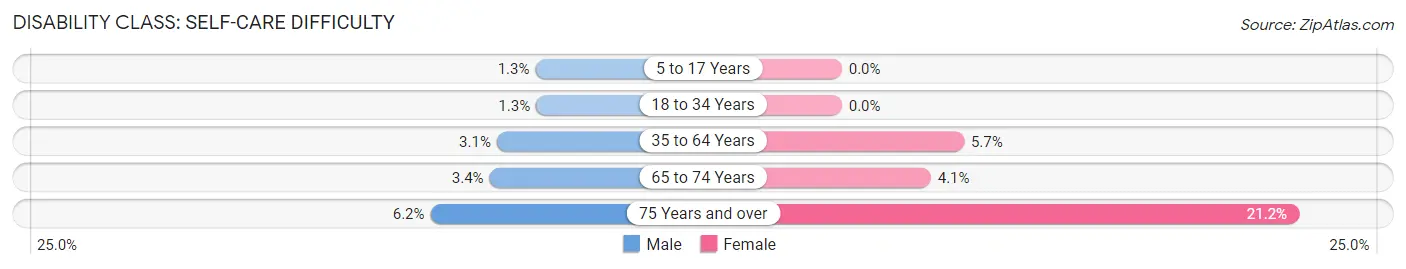
| Age Bracket | Male | Female |
| 5 to 17 Years | 37 (1.3%) | 0 (0.0%) |
| 18 to 34 Years | 44 (1.3%) | 0 (0.0%) |
| 35 to 64 Years | 180 (3.1%) | 343 (5.7%) |
| 65 to 74 Years | 53 (3.4%) | 69 (4.1%) |
| 75 Years and over | 43 (6.2%) | 235 (21.2%) |
Technology Access in Houma
Computing Device Access in Houma
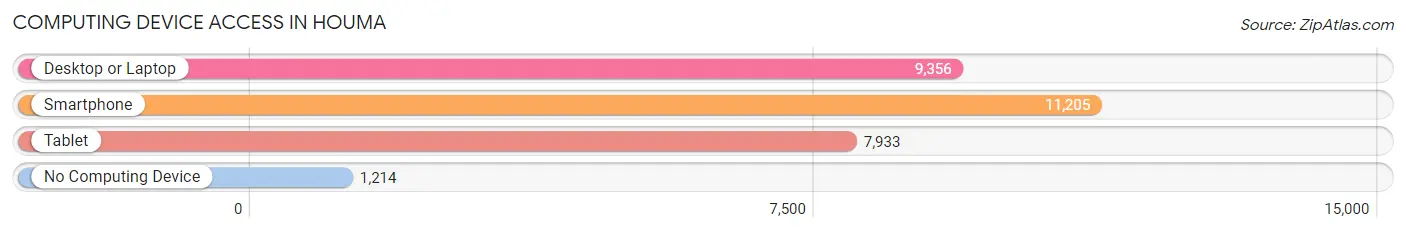
| Device Type | # Households | % Households |
| Desktop or Laptop | 9,356 | 70.3% |
| Smartphone | 11,205 | 84.2% |
| Tablet | 7,933 | 59.6% |
| No Computing Device | 1,214 | 9.1% |
| Total | 13,315 | 100.0% |
Internet Access in Houma
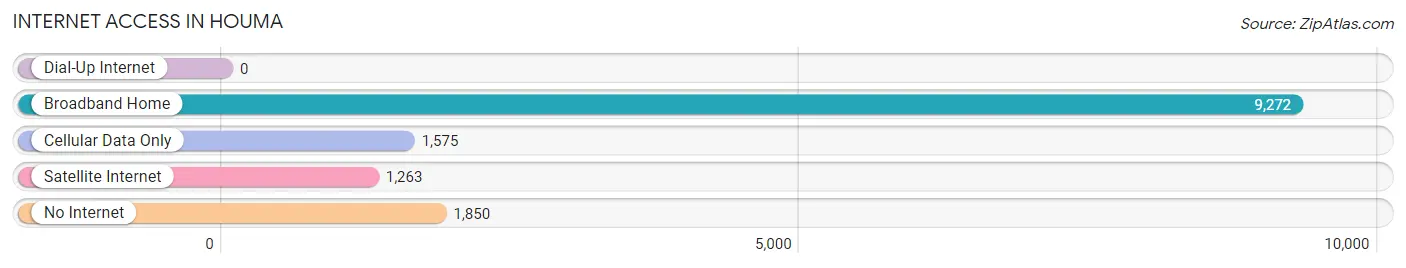
| Internet Type | # Households | % Households |
| Dial-Up Internet | 0 | 0.0% |
| Broadband Home | 9,272 | 69.6% |
| Cellular Data Only | 1,575 | 11.8% |
| Satellite Internet | 1,263 | 9.5% |
| No Internet | 1,850 | 13.9% |
| Total | 13,315 | 100.0% |
Houma Summary
Houma is a city located in Terrebonne Parish, Louisiana, United States. It is the largest city in the parish and the largest principal city of the Houma-Thibodaux Metropolitan Statistical Area. The city's population was 33,727 at the 2010 census, an increase of 1,334 over the 2000 tabulation of 32,393.
Geography
Houma is located in southeastern Louisiana, approximately 50 miles southwest of New Orleans and 40 miles northwest of the Gulf of Mexico. It is situated on the banks of Bayou Terrebonne, a tributary of the Gulf Intracoastal Waterway. The city is bordered by the towns of Schriever, Gray, and Montegut.
The terrain of Houma is flat, with an elevation of approximately 10 feet above sea level. The area is mostly marshland, with some areas of higher ground. The city is located in the humid subtropical climate zone, with hot, humid summers and mild winters.
Economy
Houma's economy is largely based on the oil and gas industry, with many of the city's residents employed in the industry. The city is also home to a number of manufacturing and service-based businesses, including shipbuilding, seafood processing, and retail.
The city is also home to a number of educational institutions, including Nicholls State University, South Louisiana Community College, and Fletcher Technical Community College.
Demographics
As of the 2010 census, Houma had a population of 33,727. The racial makeup of the city was 68.2% White, 24.2% African American, 0.3% Native American, 2.2% Asian, 0.1% Pacific Islander, 2.2% from other races, and 2.9% from two or more races. Hispanic or Latino of any race were 5.3% of the population.
The median income for a household in the city was $37,945, and the median income for a family was $45,945. The per capita income for the city was $20,845. About 17.2% of families and 20.3% of the population were below the poverty line, including 28.2% of those under age 18 and 11.2% of those age 65 or over.
Conclusion
Houma is a city located in Terrebonne Parish, Louisiana, United States. It is the largest city in the parish and the largest principal city of the Houma-Thibodaux Metropolitan Statistical Area. The city's population was 33,727 at the 2010 census, an increase of 1,334 over the 2000 tabulation of 32,393. The city is situated on the banks of Bayou Terrebonne, a tributary of the Gulf Intracoastal Waterway. The economy of Houma is largely based on the oil and gas industry, with many of the city's residents employed in the industry. The city is also home to a number of manufacturing and service-based businesses, including shipbuilding, seafood processing, and retail. As of the 2010 census, Houma had a population of 33,727, with a median household income of $37,945 and a median family income of $45,945.
Common Questions
What is Per Capita Income in Houma?
Per Capita income in Houma is $34,727.
What is the Median Family Income in Houma?
Median Family Income in Houma is $75,686.
What is the Median Household income in Houma?
Median Household Income in Houma is $56,823.
What is Income or Wage Gap in Houma?
Income or Wage Gap in Houma is 47.4%.
Women in Houma earn 52.6 cents for every dollar earned by a man.
What is Family Income Deficit in Houma?
Family Income Deficit in Houma is $8,939.
Families that are below poverty line in Houma earn $8,939 less on average than the poverty threshold level.
What is Inequality or Gini Index in Houma?
Inequality or Gini Index in Houma is 0.51.
What is the Total Population of Houma?
Total Population of Houma is 33,094.
What is the Total Male Population of Houma?
Total Male Population of Houma is 16,165.
What is the Total Female Population of Houma?
Total Female Population of Houma is 16,929.
What is the Ratio of Males per 100 Females in Houma?
There are 95.49 Males per 100 Females in Houma.
What is the Ratio of Females per 100 Males in Houma?
There are 104.73 Females per 100 Males in Houma.
What is the Median Population Age in Houma?
Median Population Age in Houma is 35.7 Years.
What is the Average Family Size in Houma
Average Family Size in Houma is 3.0 People.
What is the Average Household Size in Houma
Average Household Size in Houma is 2.5 People.
How Large is the Labor Force in Houma?
There are 15,668 People in the Labor Forcein in Houma.
What is the Percentage of People in the Labor Force in Houma?
62.3% of People are in the Labor Force in Houma.
What is the Unemployment Rate in Houma?
Unemployment Rate in Houma is 5.1%.