Terrytown, LA Map & Demographics
Terrytown Map
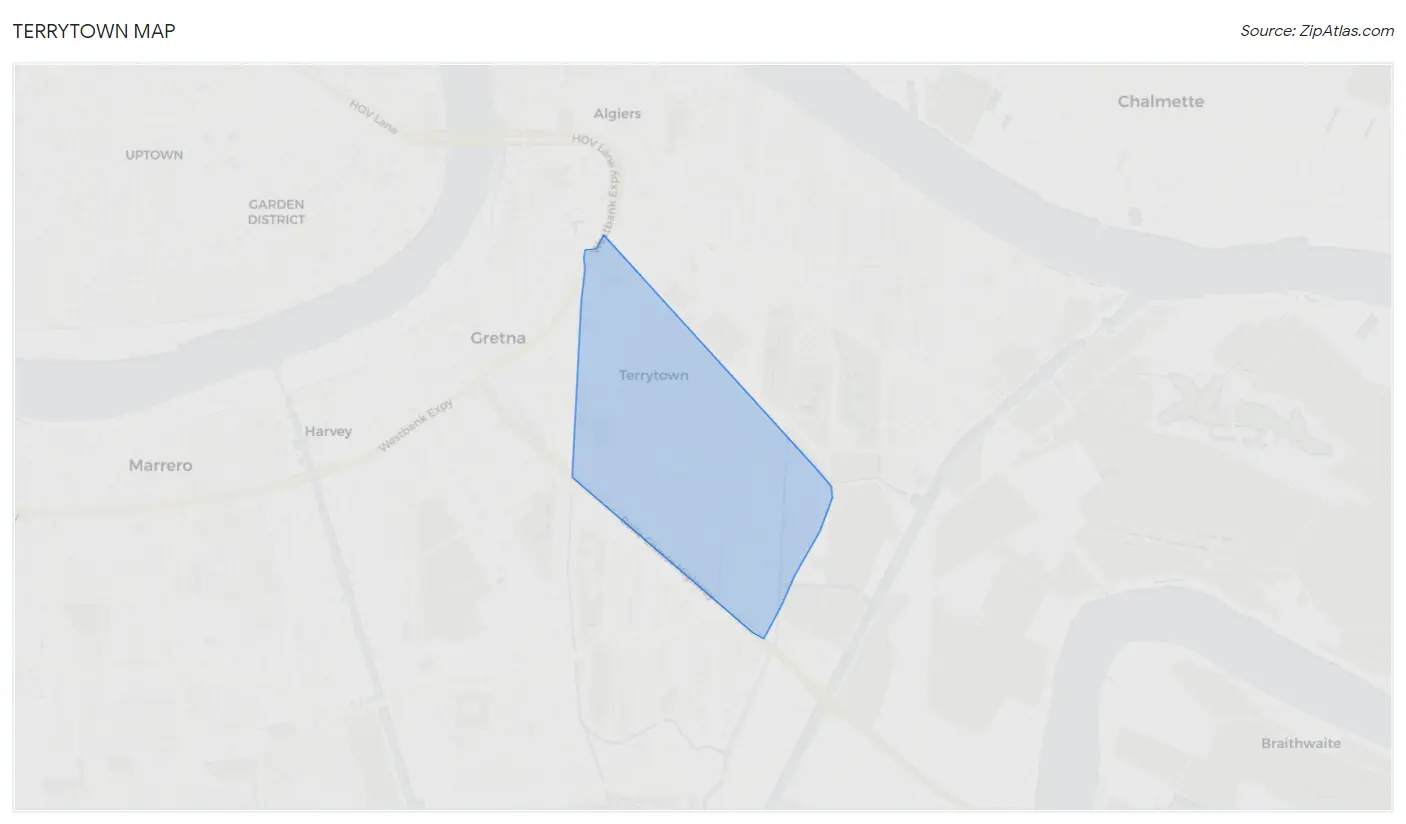
Terrytown Overview
$25,768
PER CAPITA INCOME
$76,833
AVG FAMILY INCOME
$56,877
AVG HOUSEHOLD INCOME
8.0%
WAGE / INCOME GAP [ % ]
92.0¢/ $1
WAGE / INCOME GAP [ $ ]
$8,946
FAMILY INCOME DEFICIT
0.41
INEQUALITY / GINI INDEX
26,105
TOTAL POPULATION
13,219
MALE POPULATION
12,886
FEMALE POPULATION
102.58
MALES / 100 FEMALES
97.48
FEMALES / 100 MALES
33.9
MEDIAN AGE
3.8
AVG FAMILY SIZE
3.0
AVG HOUSEHOLD SIZE
13,649
LABOR FORCE [ PEOPLE ]
69.9%
PERCENT IN LABOR FORCE
8.3%
UNEMPLOYMENT RATE
Terrytown Area Codes
Income in Terrytown
Income Overview in Terrytown
Per Capita Income in Terrytown is $25,768, while median incomes of families and households are $76,833 and $56,877 respectively.
| Characteristic | Number | Measure |
| Per Capita Income | 26,105 | $25,768 |
| Median Family Income | 5,666 | $76,833 |
| Mean Family Income | 5,666 | $87,803 |
| Median Household Income | 8,814 | $56,877 |
| Mean Household Income | 8,814 | $72,553 |
| Income Deficit | 5,666 | $8,946 |
| Wage / Income Gap (%) | 26,105 | 7.95% |
| Wage / Income Gap ($) | 26,105 | 92.05¢ per $1 |
| Gini / Inequality Index | 26,105 | 0.41 |
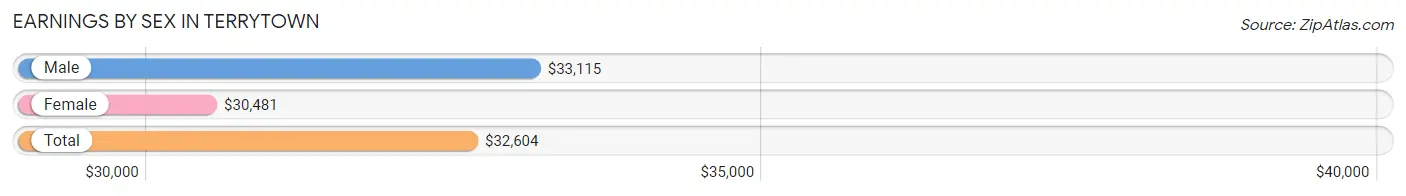
Earnings by Sex in Terrytown
Average Earnings in Terrytown are $32,604, $33,115 for men and $30,481 for women, a difference of 8.0%.
| Sex | Number | Average Earnings |
| Male | 7,649 (55.4%) | $33,115 |
| Female | 6,164 (44.6%) | $30,481 |
| Total | 13,813 (100.0%) | $32,604 |
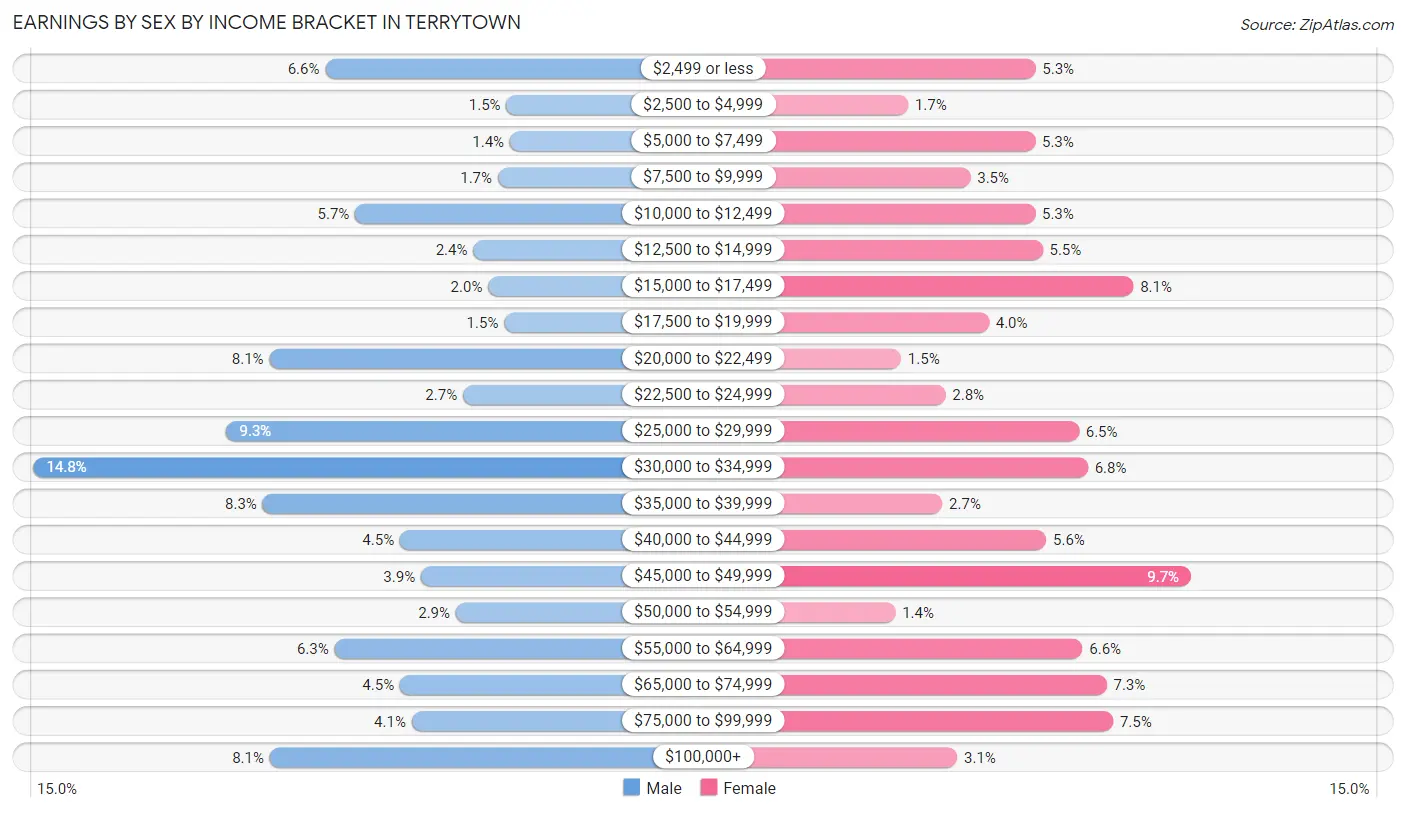
Earnings by Sex by Income Bracket in Terrytown
The most common earnings brackets in Terrytown are $30,000 to $34,999 for men (1,128 | 14.7%) and $45,000 to $49,999 for women (596 | 9.7%).
| Income | Male | Female |
| $2,499 or less | 501 (6.6%) | 327 (5.3%) |
| $2,500 to $4,999 | 112 (1.5%) | 106 (1.7%) |
| $5,000 to $7,499 | 104 (1.4%) | 326 (5.3%) |
| $7,500 to $9,999 | 130 (1.7%) | 214 (3.5%) |
| $10,000 to $12,499 | 437 (5.7%) | 326 (5.3%) |
| $12,500 to $14,999 | 183 (2.4%) | 339 (5.5%) |
| $15,000 to $17,499 | 151 (2.0%) | 496 (8.1%) |
| $17,500 to $19,999 | 116 (1.5%) | 246 (4.0%) |
| $20,000 to $22,499 | 621 (8.1%) | 94 (1.5%) |
| $22,500 to $24,999 | 205 (2.7%) | 171 (2.8%) |
| $25,000 to $29,999 | 714 (9.3%) | 402 (6.5%) |
| $30,000 to $34,999 | 1,128 (14.7%) | 417 (6.8%) |
| $35,000 to $39,999 | 636 (8.3%) | 165 (2.7%) |
| $40,000 to $44,999 | 340 (4.4%) | 345 (5.6%) |
| $45,000 to $49,999 | 295 (3.9%) | 596 (9.7%) |
| $50,000 to $54,999 | 220 (2.9%) | 84 (1.4%) |
| $55,000 to $64,999 | 481 (6.3%) | 408 (6.6%) |
| $65,000 to $74,999 | 340 (4.4%) | 450 (7.3%) |
| $75,000 to $99,999 | 315 (4.1%) | 461 (7.5%) |
| $100,000+ | 620 (8.1%) | 191 (3.1%) |
| Total | 7,649 (100.0%) | 6,164 (100.0%) |
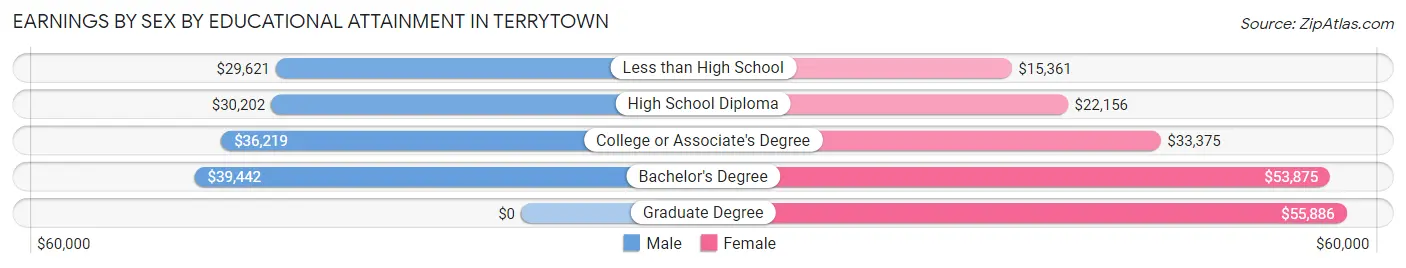
Earnings by Sex by Educational Attainment in Terrytown
Average earnings in Terrytown are $34,088 for men and $34,562 for women, a difference of 1.4%. Men with an educational attainment of bachelor's degree enjoy the highest average annual earnings of $39,442, while those with less than high school education earn the least with $29,621. Women with an educational attainment of graduate degree earn the most with the average annual earnings of $55,886, while those with less than high school education have the smallest earnings of $15,361.
| Educational Attainment | Male Income | Female Income |
| Less than High School | $29,621 | $15,361 |
| High School Diploma | $30,202 | $22,156 |
| College or Associate's Degree | $36,219 | $33,375 |
| Bachelor's Degree | $39,442 | $53,875 |
| Graduate Degree | - | - |
| Total | $34,088 | $34,562 |
Family Income in Terrytown
Family Income Brackets in Terrytown
According to the Terrytown family income data, there are 1,145 families falling into the $100,000 to $149,999 income range, which is the most common income bracket and makes up 20.2% of all families. Conversely, the $10,000 to $14,999 income bracket is the least frequent group with only 125 families (2.2%) belonging to this category.
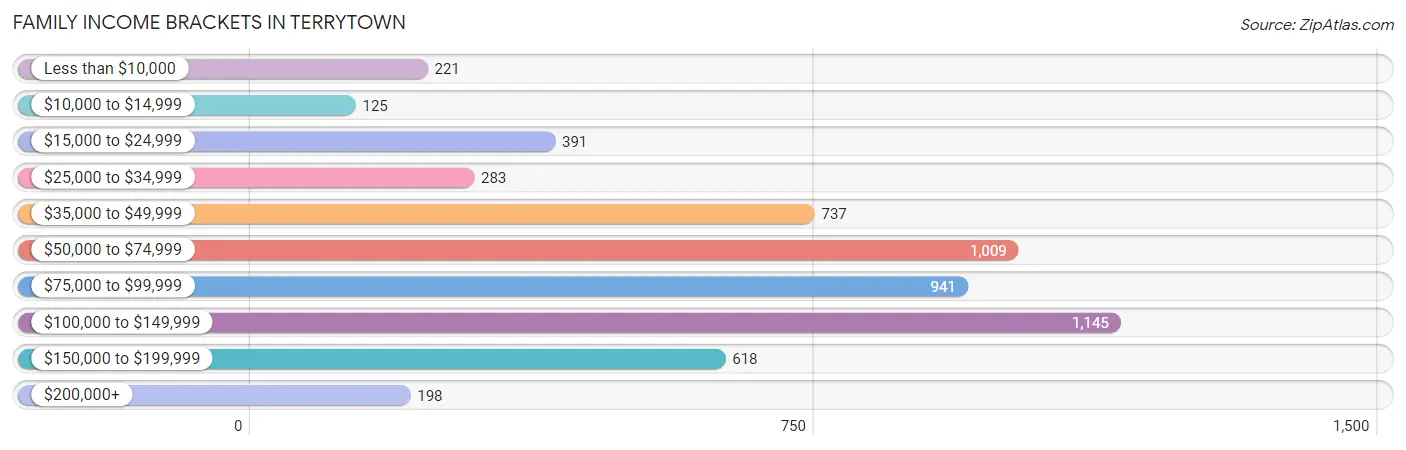
| Income Bracket | # Families | % Families |
| Less than $10,000 | 221 | 3.9% |
| $10,000 to $14,999 | 125 | 2.2% |
| $15,000 to $24,999 | 391 | 6.9% |
| $25,000 to $34,999 | 283 | 5.0% |
| $35,000 to $49,999 | 737 | 13.0% |
| $50,000 to $74,999 | 1,009 | 17.8% |
| $75,000 to $99,999 | 941 | 16.6% |
| $100,000 to $149,999 | 1,145 | 20.2% |
| $150,000 to $199,999 | 618 | 10.9% |
| $200,000+ | 198 | 3.5% |
Family Income by Famaliy Size in Terrytown
6-person families (211 | 3.7%) account for the highest median family income in Terrytown with $106,424 per family, while 2-person families (1,923 | 33.9%) have the highest median income of $29,041 per family member.
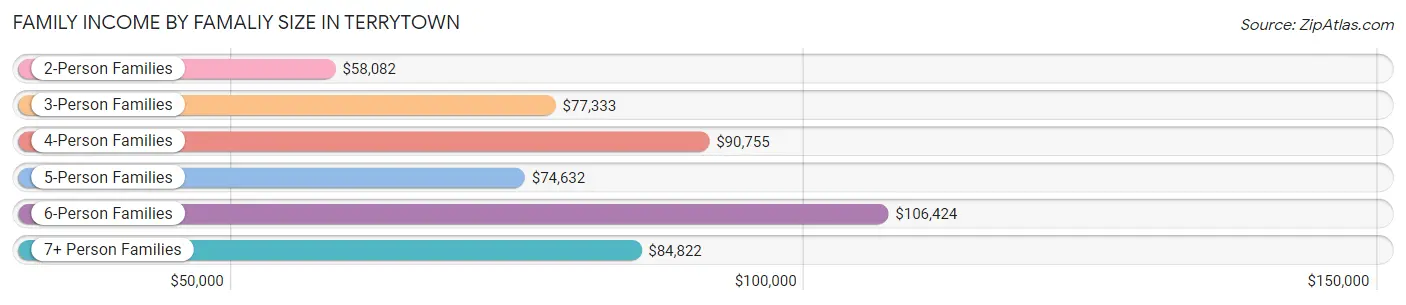
| Income Bracket | # Families | Median Income |
| 2-Person Families | 1,923 (33.9%) | $58,082 |
| 3-Person Families | 1,316 (23.2%) | $77,333 |
| 4-Person Families | 1,129 (19.9%) | $90,755 |
| 5-Person Families | 643 (11.4%) | $74,632 |
| 6-Person Families | 211 (3.7%) | $106,424 |
| 7+ Person Families | 444 (7.8%) | $84,822 |
| Total | 5,666 (100.0%) | $76,833 |
Family Income by Number of Earners in Terrytown
The median family income in Terrytown is $76,833, with families comprising 3+ earners (991) having the highest median family income of $119,112, while families with no earners (570) have the lowest median family income of $36,435, accounting for 17.5% and 10.1% of families, respectively.
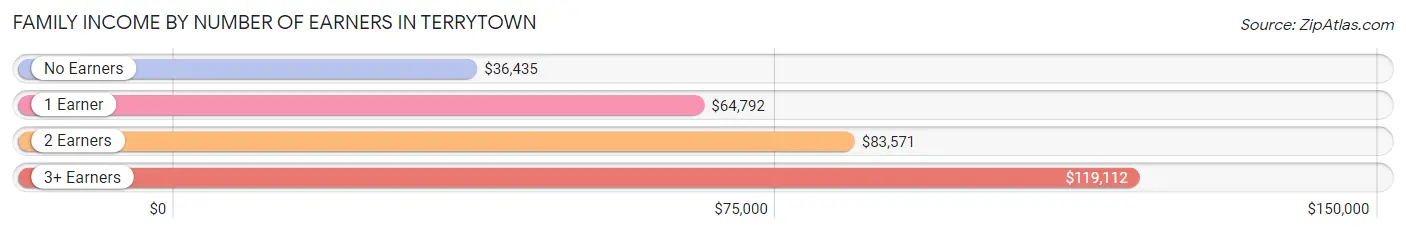
| Number of Earners | # Families | Median Income |
| No Earners | 570 (10.1%) | $36,435 |
| 1 Earner | 1,617 (28.5%) | $64,792 |
| 2 Earners | 2,488 (43.9%) | $83,571 |
| 3+ Earners | 991 (17.5%) | $119,112 |
| Total | 5,666 (100.0%) | $76,833 |
Household Income in Terrytown
Household Income Brackets in Terrytown
With 1,578 households falling in the category, the $50,000 to $74,999 income range is the most frequent in Terrytown, accounting for 17.9% of all households. In contrast, only 238 households (2.7%) fall into the $200,000+ income bracket, making it the least populous group.
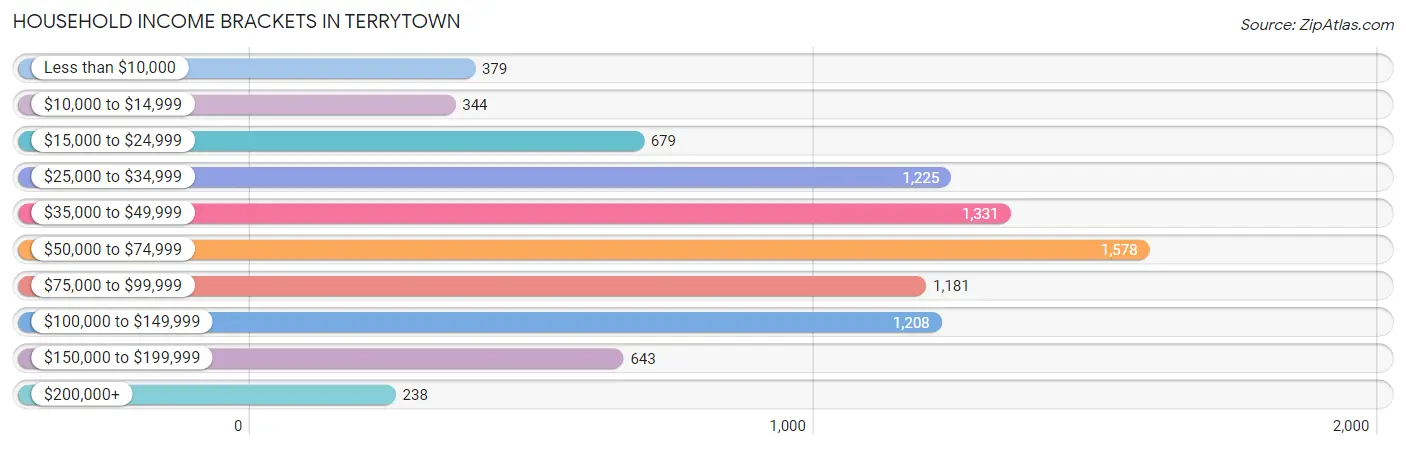
| Income Bracket | # Households | % Households |
| Less than $10,000 | 379 | 4.3% |
| $10,000 to $14,999 | 344 | 3.9% |
| $15,000 to $24,999 | 679 | 7.7% |
| $25,000 to $34,999 | 1,225 | 13.9% |
| $35,000 to $49,999 | 1,331 | 15.1% |
| $50,000 to $74,999 | 1,578 | 17.9% |
| $75,000 to $99,999 | 1,181 | 13.4% |
| $100,000 to $149,999 | 1,208 | 13.7% |
| $150,000 to $199,999 | 643 | 7.3% |
| $200,000+ | 238 | 2.7% |
Household Income by Householder Age in Terrytown
The median household income in Terrytown is $56,877, with the highest median household income of $66,037 found in the 45 to 64 years age bracket for the primary householder. A total of 3,494 households (39.6%) fall into this category. Meanwhile, the 15 to 24 years age bracket for the primary householder has the lowest median household income of $40,050, with 363 households (4.1%) in this group.
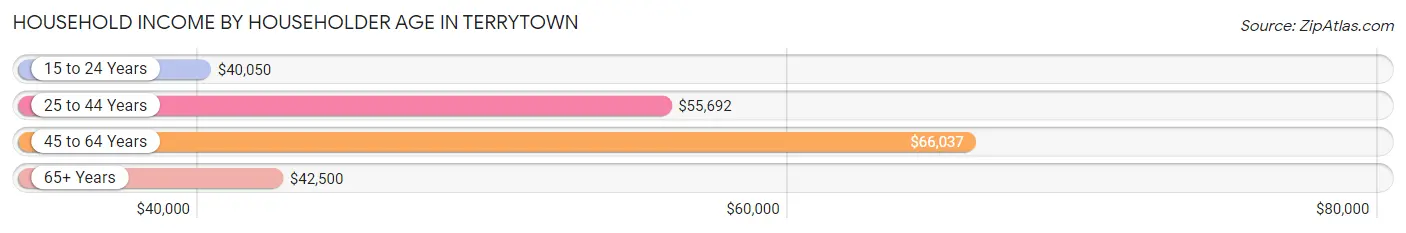
| Income Bracket | # Households | Median Income |
| 15 to 24 Years | 363 (4.1%) | $40,050 |
| 25 to 44 Years | 3,293 (37.4%) | $55,692 |
| 45 to 64 Years | 3,494 (39.6%) | $66,037 |
| 65+ Years | 1,664 (18.9%) | $42,500 |
| Total | 8,814 (100.0%) | $56,877 |
Poverty in Terrytown
Income Below Poverty by Sex and Age in Terrytown
With 18.1% poverty level for males and 14.3% for females among the residents of Terrytown, 15 year old males and 35 to 44 year old females are the most vulnerable to poverty, with 109 males (80.7%) and 375 females (20.3%) in their respective age groups living below the poverty level.
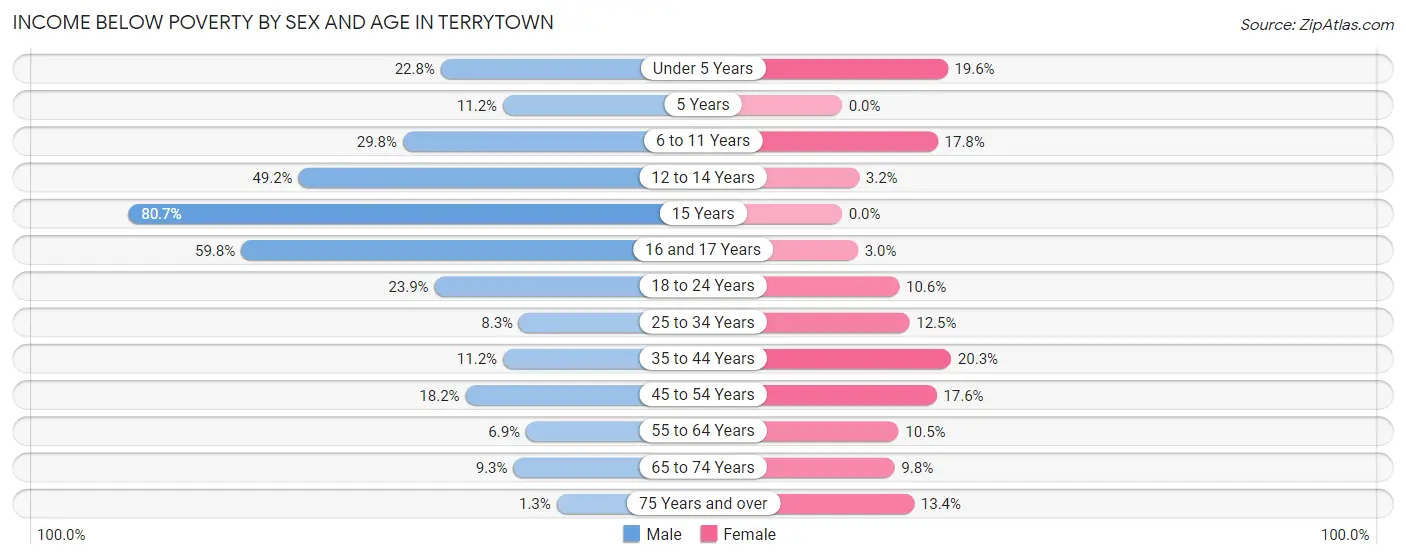
| Age Bracket | Male | Female |
| Under 5 Years | 301 (22.8%) | 301 (19.6%) |
| 5 Years | 39 (11.2%) | 0 (0.0%) |
| 6 to 11 Years | 309 (29.8%) | 215 (17.8%) |
| 12 to 14 Years | 266 (49.2%) | 9 (3.2%) |
| 15 Years | 109 (80.7%) | 0 (0.0%) |
| 16 and 17 Years | 277 (59.8%) | 11 (3.0%) |
| 18 to 24 Years | 223 (23.9%) | 157 (10.6%) |
| 25 to 34 Years | 172 (8.3%) | 211 (12.5%) |
| 35 to 44 Years | 209 (11.2%) | 375 (20.3%) |
| 45 to 54 Years | 309 (18.2%) | 227 (17.6%) |
| 55 to 64 Years | 97 (6.9%) | 166 (10.5%) |
| 65 to 74 Years | 68 (9.3%) | 84 (9.8%) |
| 75 Years and over | 8 (1.3%) | 80 (13.4%) |
| Total | 2,387 (18.1%) | 1,836 (14.3%) |
Income Above Poverty by Sex and Age in Terrytown
According to the poverty statistics in Terrytown, males aged 75 years and over and females aged 15 years are the age groups that are most secure financially, with 98.8% of males and 100.0% of females in these age groups living above the poverty line.
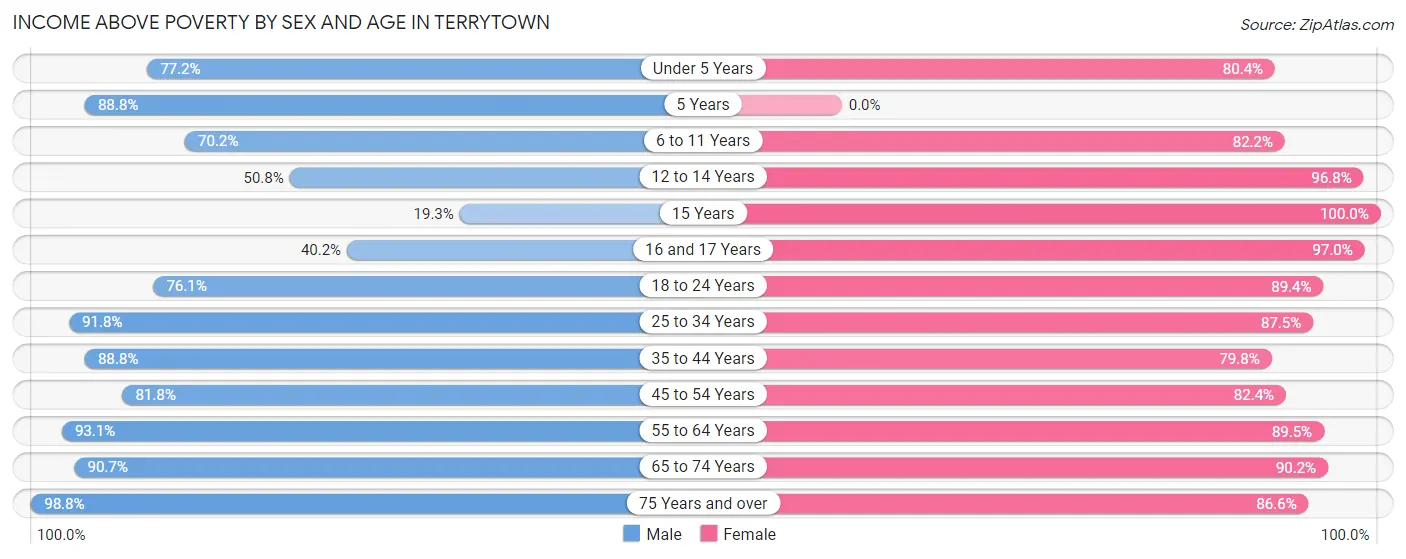
| Age Bracket | Male | Female |
| Under 5 Years | 1,021 (77.2%) | 1,234 (80.4%) |
| 5 Years | 309 (88.8%) | 0 (0.0%) |
| 6 to 11 Years | 728 (70.2%) | 994 (82.2%) |
| 12 to 14 Years | 275 (50.8%) | 276 (96.8%) |
| 15 Years | 26 (19.3%) | 112 (100.0%) |
| 16 and 17 Years | 186 (40.2%) | 361 (97.0%) |
| 18 to 24 Years | 709 (76.1%) | 1,322 (89.4%) |
| 25 to 34 Years | 1,912 (91.7%) | 1,473 (87.5%) |
| 35 to 44 Years | 1,653 (88.8%) | 1,477 (79.7%) |
| 45 to 54 Years | 1,391 (81.8%) | 1,065 (82.4%) |
| 55 to 64 Years | 1,300 (93.1%) | 1,413 (89.5%) |
| 65 to 74 Years | 665 (90.7%) | 776 (90.2%) |
| 75 Years and over | 630 (98.8%) | 518 (86.6%) |
| Total | 10,805 (81.9%) | 11,021 (85.7%) |
Income Below Poverty Among Married-Couple Families in Terrytown
The poverty statistics for married-couple families in Terrytown show that 7.1% or 235 of the total 3,317 families live below the poverty line. Families with 3 or 4 children have the highest poverty rate of 17.4%, comprising of 81 families. On the other hand, families with 5 or more children have the lowest poverty rate of 0.0%, which includes 0 families.
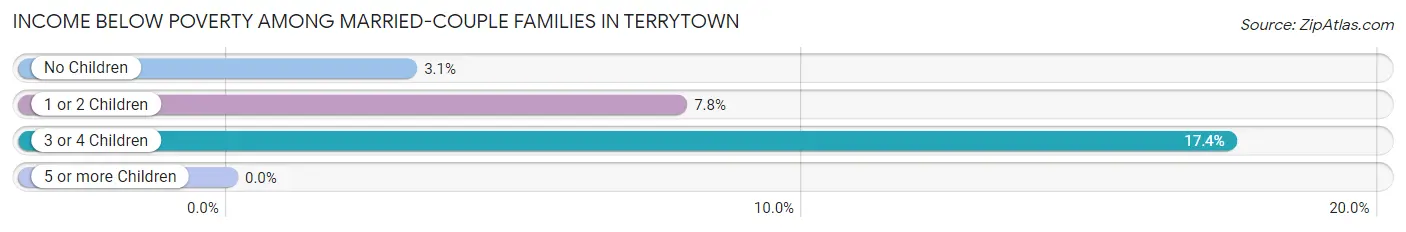
| Children | Above Poverty | Below Poverty |
| No Children | 1,302 (96.9%) | 42 (3.1%) |
| 1 or 2 Children | 1,320 (92.2%) | 112 (7.8%) |
| 3 or 4 Children | 385 (82.6%) | 81 (17.4%) |
| 5 or more Children | 75 (100.0%) | 0 (0.0%) |
| Total | 3,082 (92.9%) | 235 (7.1%) |
Income Below Poverty Among Single-Parent Households in Terrytown
According to the poverty data in Terrytown, 13.4% or 124 single-father households and 29.9% or 427 single-mother households are living below the poverty line. Among single-father households, those with 3 or 4 children have the highest poverty rate, with 26 households (32.1%) experiencing poverty. Likewise, among single-mother households, those with 1 or 2 children have the highest poverty rate, with 362 households (43.4%) falling below the poverty line.
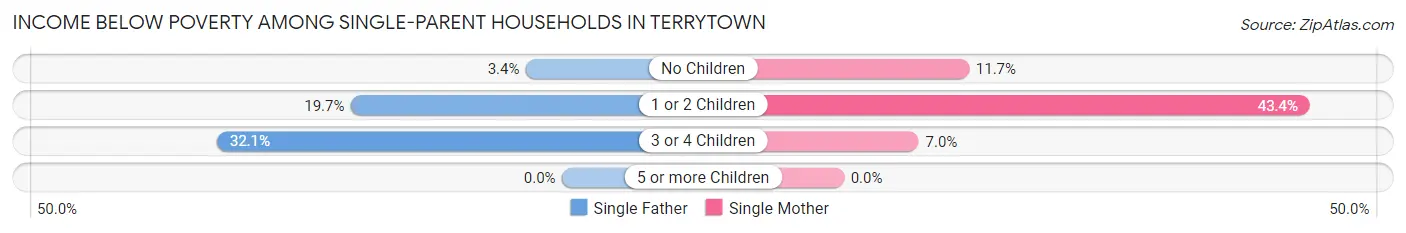
| Children | Single Father | Single Mother |
| No Children | 14 (3.4%) | 59 (11.7%) |
| 1 or 2 Children | 84 (19.7%) | 362 (43.4%) |
| 3 or 4 Children | 26 (32.1%) | 6 (7.0%) |
| 5 or more Children | 0 (0.0%) | 0 (0.0%) |
| Total | 124 (13.4%) | 427 (29.9%) |
Income Below Poverty Among Married-Couple vs Single-Parent Households in Terrytown
The poverty data for Terrytown shows that 235 of the married-couple family households (7.1%) and 551 of the single-parent households (23.5%) are living below the poverty level. Within the married-couple family households, those with 3 or 4 children have the highest poverty rate, with 81 households (17.4%) falling below the poverty line. Among the single-parent households, those with 1 or 2 children have the highest poverty rate, with 446 household (35.4%) living below poverty.
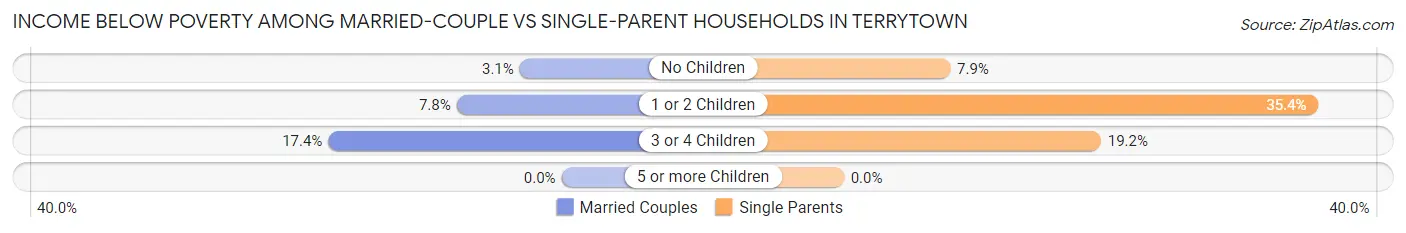
| Children | Married-Couple Families | Single-Parent Households |
| No Children | 42 (3.1%) | 73 (7.9%) |
| 1 or 2 Children | 112 (7.8%) | 446 (35.4%) |
| 3 or 4 Children | 81 (17.4%) | 32 (19.2%) |
| 5 or more Children | 0 (0.0%) | 0 (0.0%) |
| Total | 235 (7.1%) | 551 (23.5%) |
Race in Terrytown
The most populous races in Terrytown are Black / African American (10,569 | 40.5%), White / Caucasian (8,278 | 31.7%), and Hispanic or Latino (7,942 | 30.4%).
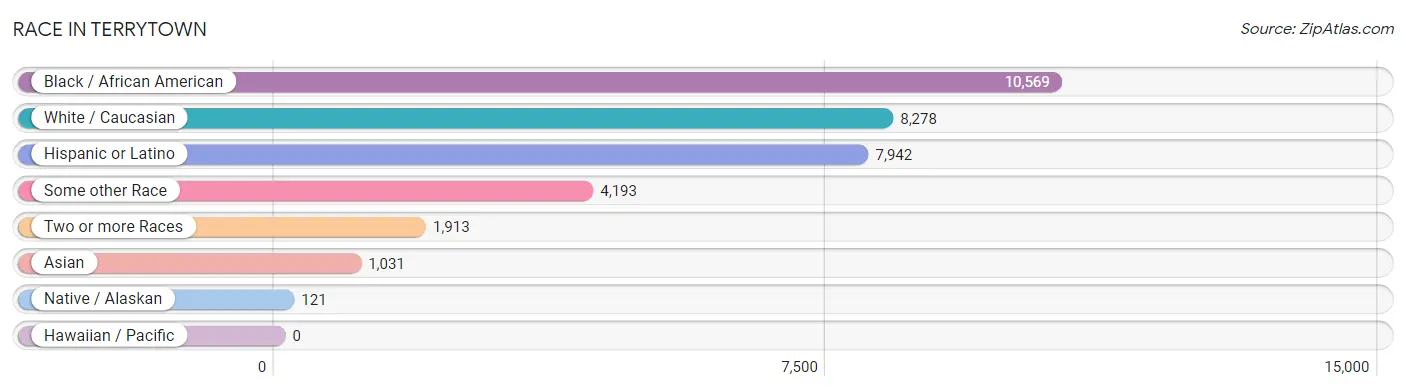
| Race | # Population | % Population |
| Asian | 1,031 | 4.0% |
| Black / African American | 10,569 | 40.5% |
| Hawaiian / Pacific | 0 | 0.0% |
| Hispanic or Latino | 7,942 | 30.4% |
| Native / Alaskan | 121 | 0.5% |
| White / Caucasian | 8,278 | 31.7% |
| Two or more Races | 1,913 | 7.3% |
| Some other Race | 4,193 | 16.1% |
| Total | 26,105 | 100.0% |
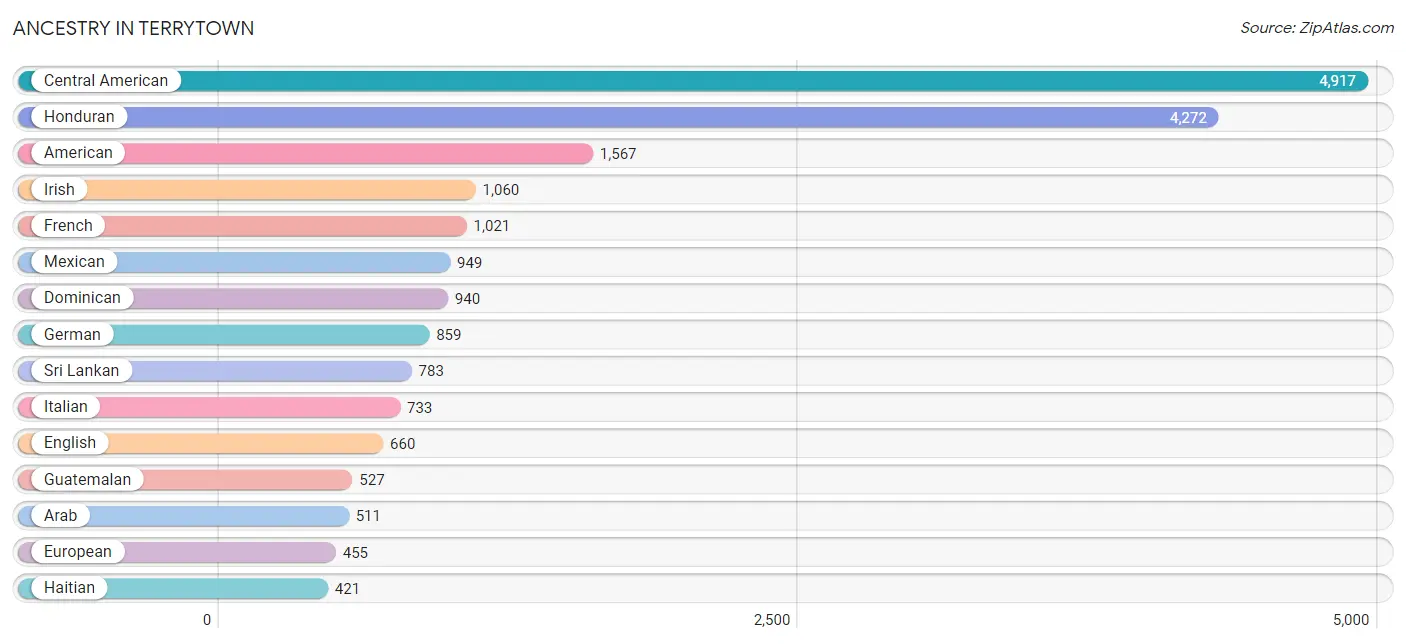
Ancestry in Terrytown
The most populous ancestries reported in Terrytown are Central American (4,917 | 18.8%), Honduran (4,272 | 16.4%), American (1,567 | 6.0%), Irish (1,060 | 4.1%), and French (1,021 | 3.9%), together accounting for 49.2% of all Terrytown residents.
| Ancestry | # Population | % Population |
| African | 144 | 0.5% |
| Albanian | 8 | 0.0% |
| American | 1,567 | 6.0% |
| Arab | 511 | 2.0% |
| Belgian | 23 | 0.1% |
| Belizean | 22 | 0.1% |
| Bhutanese | 57 | 0.2% |
| Blackfeet | 7 | 0.0% |
| Bolivian | 15 | 0.1% |
| British | 93 | 0.4% |
| Cajun | 54 | 0.2% |
| Canadian | 13 | 0.1% |
| Central American | 4,917 | 18.8% |
| Central American Indian | 8 | 0.0% |
| Cherokee | 151 | 0.6% |
| Colombian | 62 | 0.2% |
| Croatian | 28 | 0.1% |
| Cuban | 420 | 1.6% |
| Czech | 19 | 0.1% |
| Czechoslovakian | 15 | 0.1% |
| Danish | 24 | 0.1% |
| Delaware | 85 | 0.3% |
| Dominican | 940 | 3.6% |
| Dutch | 51 | 0.2% |
| Ecuadorian | 83 | 0.3% |
| English | 660 | 2.5% |
| European | 455 | 1.7% |
| French | 1,021 | 3.9% |
| French Canadian | 185 | 0.7% |
| German | 859 | 3.3% |
| Greek | 129 | 0.5% |
| Guatemalan | 527 | 2.0% |
| Haitian | 421 | 1.6% |
| Honduran | 4,272 | 16.4% |
| Indian (Asian) | 124 | 0.5% |
| Irish | 1,060 | 4.1% |
| Italian | 733 | 2.8% |
| Jamaican | 25 | 0.1% |
| Jordanian | 132 | 0.5% |
| Korean | 135 | 0.5% |
| Lebanese | 107 | 0.4% |
| Malaysian | 43 | 0.2% |
| Mexican | 949 | 3.6% |
| Nicaraguan | 118 | 0.4% |
| Norwegian | 4 | 0.0% |
| Palestinian | 140 | 0.5% |
| Polish | 69 | 0.3% |
| Portuguese | 25 | 0.1% |
| Puerto Rican | 72 | 0.3% |
| Russian | 8 | 0.0% |
| Scandinavian | 26 | 0.1% |
| Scotch-Irish | 63 | 0.2% |
| Scottish | 24 | 0.1% |
| Slovak | 7 | 0.0% |
| Slovene | 39 | 0.2% |
| South American | 279 | 1.1% |
| Sri Lankan | 783 | 3.0% |
| Subsaharan African | 144 | 0.5% |
| Swedish | 44 | 0.2% |
| Swiss | 43 | 0.2% |
| Venezuelan | 119 | 0.5% |
| Welsh | 60 | 0.2% |
| West Indian | 103 | 0.4% |
| Yugoslavian | 12 | 0.1% | View All 64 Rows |
Immigrants in Terrytown
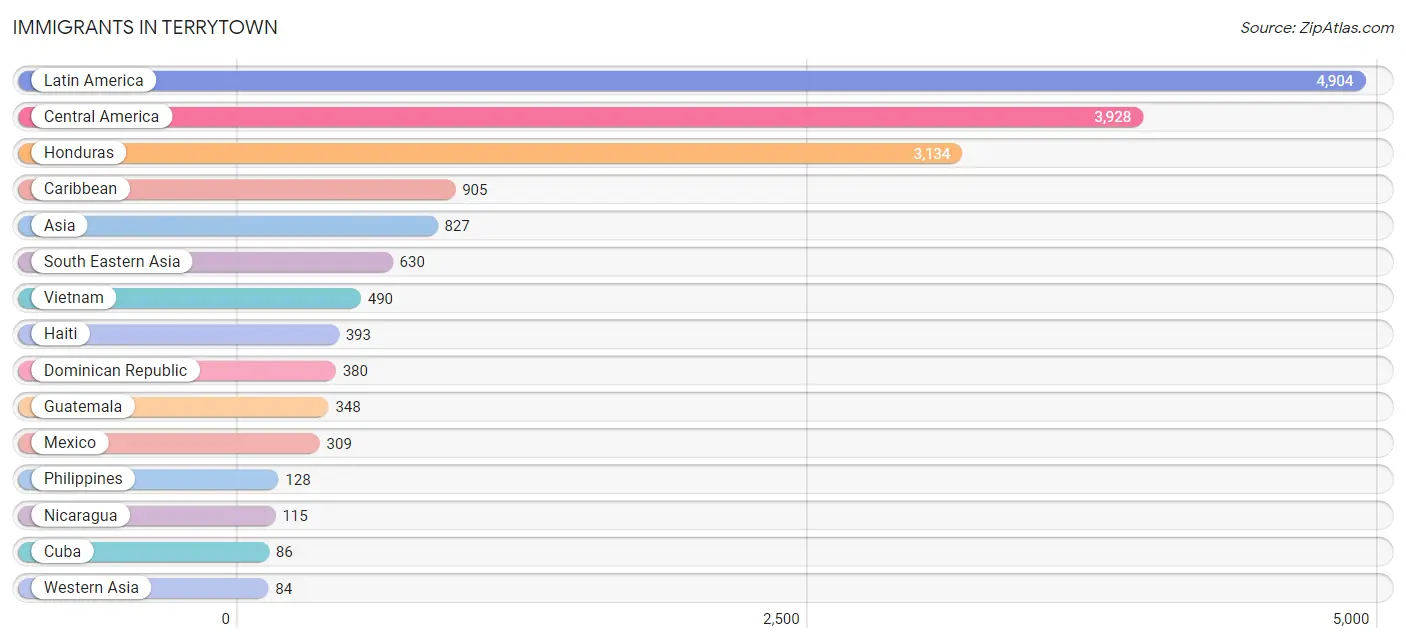
The most numerous immigrant groups reported in Terrytown came from Latin America (4,904 | 18.8%), Central America (3,928 | 15.0%), Honduras (3,134 | 12.0%), Caribbean (905 | 3.5%), and Asia (827 | 3.2%), together accounting for 52.5% of all Terrytown residents.
| Immigration Origin | # Population | % Population |
| Asia | 827 | 3.2% |
| Belgium | 6 | 0.0% |
| Belize | 22 | 0.1% |
| Bolivia | 7 | 0.0% |
| Canada | 13 | 0.1% |
| Caribbean | 905 | 3.5% |
| Central America | 3,928 | 15.0% |
| China | 26 | 0.1% |
| Colombia | 16 | 0.1% |
| Croatia | 21 | 0.1% |
| Cuba | 86 | 0.3% |
| Dominican Republic | 380 | 1.5% |
| Eastern Asia | 26 | 0.1% |
| Eastern Europe | 33 | 0.1% |
| Ecuador | 16 | 0.1% |
| Europe | 76 | 0.3% |
| Germany | 29 | 0.1% |
| Guatemala | 348 | 1.3% |
| Haiti | 393 | 1.5% |
| Honduras | 3,134 | 12.0% |
| Ireland | 8 | 0.0% |
| Israel | 22 | 0.1% |
| Jordan | 62 | 0.2% |
| Latin America | 4,904 | 18.8% |
| Mexico | 309 | 1.2% |
| Nicaragua | 115 | 0.4% |
| Northern Europe | 8 | 0.0% |
| Philippines | 128 | 0.5% |
| Singapore | 12 | 0.1% |
| South America | 71 | 0.3% |
| South Eastern Asia | 630 | 2.4% |
| Venezuela | 32 | 0.1% |
| Vietnam | 490 | 1.9% |
| Western Asia | 84 | 0.3% |
| Western Europe | 35 | 0.1% | View All 35 Rows |
Sex and Age in Terrytown
Sex and Age in Terrytown
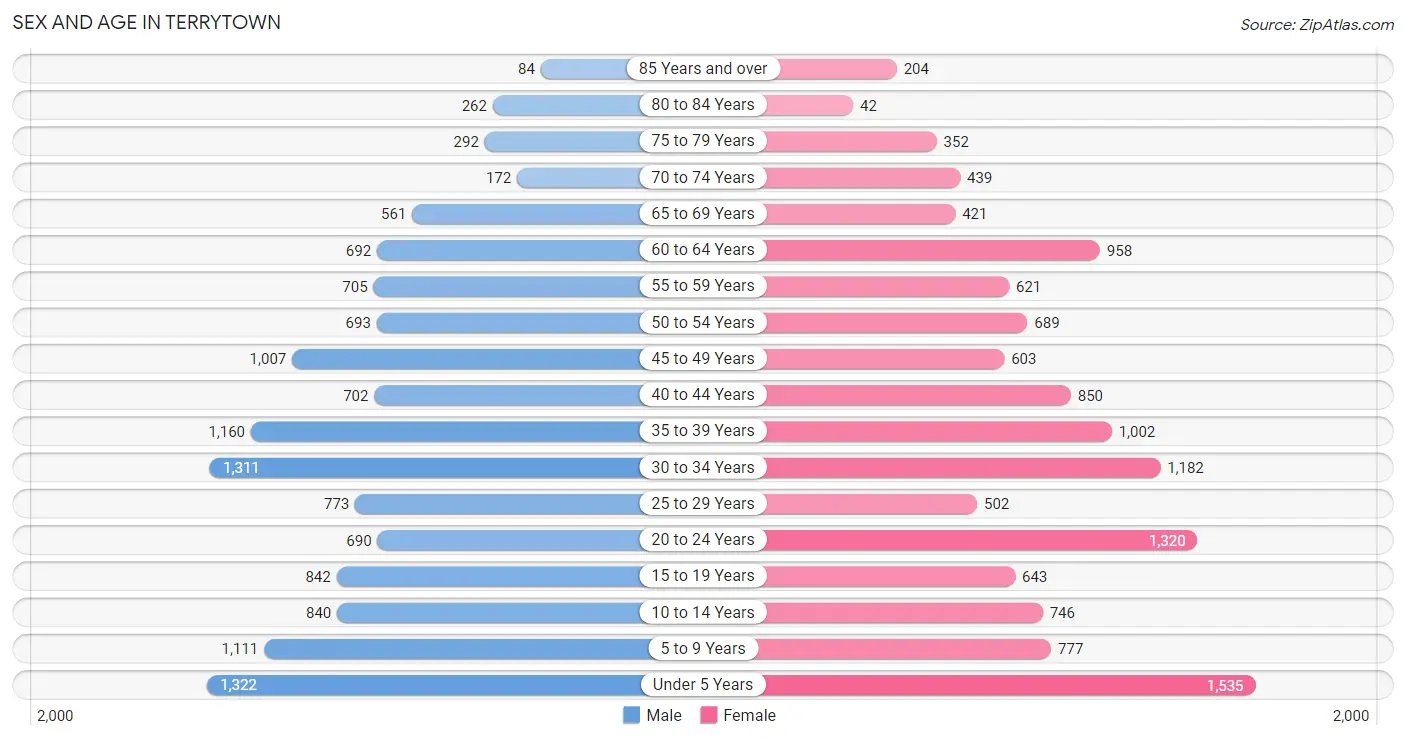
The most populous age groups in Terrytown are Under 5 Years (1,322 | 10.0%) for men and Under 5 Years (1,535 | 11.9%) for women.
| Age Bracket | Male | Female |
| Under 5 Years | 1,322 (10.0%) | 1,535 (11.9%) |
| 5 to 9 Years | 1,111 (8.4%) | 777 (6.0%) |
| 10 to 14 Years | 840 (6.4%) | 746 (5.8%) |
| 15 to 19 Years | 842 (6.4%) | 643 (5.0%) |
| 20 to 24 Years | 690 (5.2%) | 1,320 (10.2%) |
| 25 to 29 Years | 773 (5.9%) | 502 (3.9%) |
| 30 to 34 Years | 1,311 (9.9%) | 1,182 (9.2%) |
| 35 to 39 Years | 1,160 (8.8%) | 1,002 (7.8%) |
| 40 to 44 Years | 702 (5.3%) | 850 (6.6%) |
| 45 to 49 Years | 1,007 (7.6%) | 603 (4.7%) |
| 50 to 54 Years | 693 (5.2%) | 689 (5.3%) |
| 55 to 59 Years | 705 (5.3%) | 621 (4.8%) |
| 60 to 64 Years | 692 (5.2%) | 958 (7.4%) |
| 65 to 69 Years | 561 (4.2%) | 421 (3.3%) |
| 70 to 74 Years | 172 (1.3%) | 439 (3.4%) |
| 75 to 79 Years | 292 (2.2%) | 352 (2.7%) |
| 80 to 84 Years | 262 (2.0%) | 42 (0.3%) |
| 85 Years and over | 84 (0.6%) | 204 (1.6%) |
| Total | 13,219 (100.0%) | 12,886 (100.0%) |
Families and Households in Terrytown
Median Family Size in Terrytown
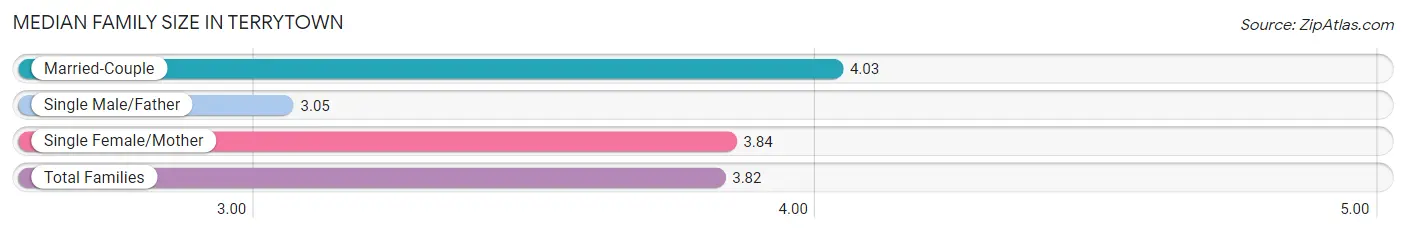
The median family size in Terrytown is 3.82 persons per family, with married-couple families (3,317 | 58.5%) accounting for the largest median family size of 4.03 persons per family. On the other hand, single male/father families (923 | 16.3%) represent the smallest median family size with 3.05 persons per family.
| Family Type | # Families | Family Size |
| Married-Couple | 3,317 (58.5%) | 4.03 |
| Single Male/Father | 923 (16.3%) | 3.05 |
| Single Female/Mother | 1,426 (25.2%) | 3.84 |
| Total Families | 5,666 (100.0%) | 3.82 |
Median Household Size in Terrytown
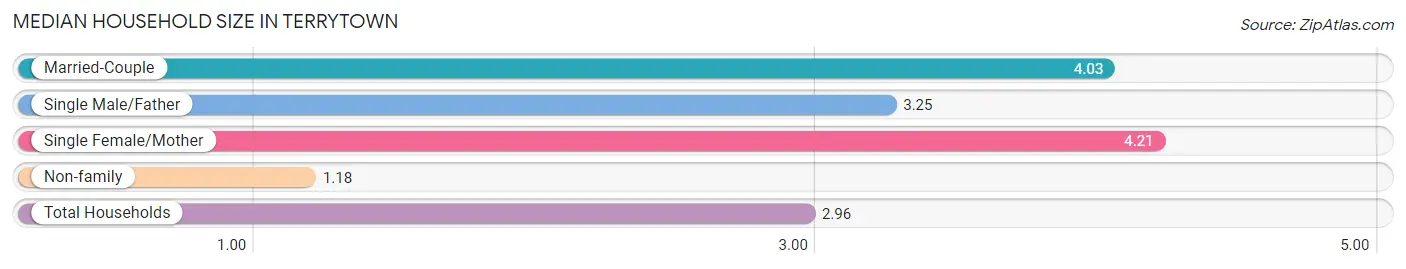
The median household size in Terrytown is 2.96 persons per household, with single female/mother households (1,426 | 16.2%) accounting for the largest median household size of 4.21 persons per household. non-family households (3,148 | 35.7%) represent the smallest median household size with 1.18 persons per household.
| Household Type | # Households | Household Size |
| Married-Couple | 3,317 (37.6%) | 4.03 |
| Single Male/Father | 923 (10.5%) | 3.25 |
| Single Female/Mother | 1,426 (16.2%) | 4.21 |
| Non-family | 3,148 (35.7%) | 1.18 |
| Total Households | 8,814 (100.0%) | 2.96 |
Household Size by Marriage Status in Terrytown
Out of a total of 8,814 households in Terrytown, 5,666 (64.3%) are family households, while 3,148 (35.7%) are nonfamily households. The most numerous type of family households are 2-person households, comprising 1,785, and the most common type of nonfamily households are 1-person households, comprising 2,618.
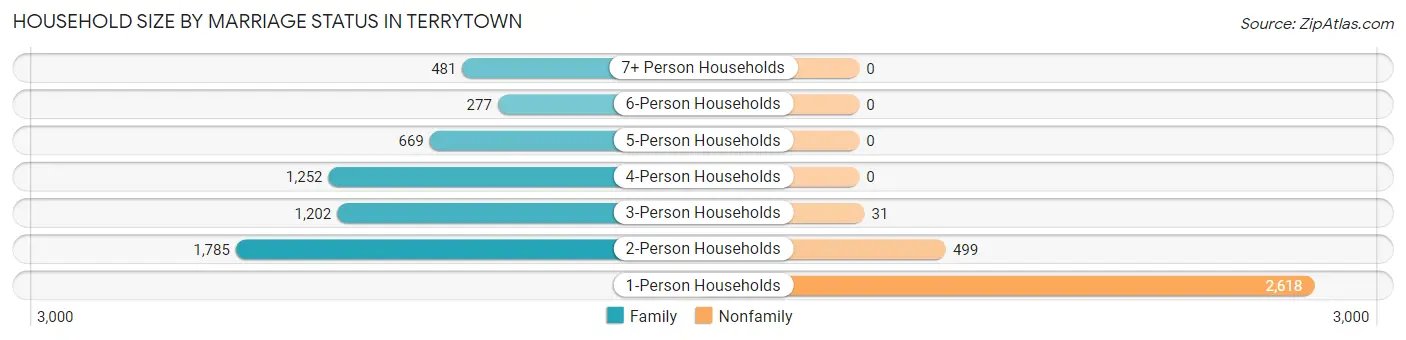
| Household Size | Family Households | Nonfamily Households |
| 1-Person Households | - | 2,618 (29.7%) |
| 2-Person Households | 1,785 (20.3%) | 499 (5.7%) |
| 3-Person Households | 1,202 (13.6%) | 31 (0.4%) |
| 4-Person Households | 1,252 (14.2%) | 0 (0.0%) |
| 5-Person Households | 669 (7.6%) | 0 (0.0%) |
| 6-Person Households | 277 (3.1%) | 0 (0.0%) |
| 7+ Person Households | 481 (5.5%) | 0 (0.0%) |
| Total | 5,666 (64.3%) | 3,148 (35.7%) |
Female Fertility in Terrytown
Fertility by Age in Terrytown
Average fertility rate in Terrytown is 135.0 births per 1,000 women. Women in the age bracket of 20 to 34 years have the highest fertility rate with 178.0 births per 1,000 women. Women in the age bracket of 20 to 34 years acount for 63.8% of all women with births.
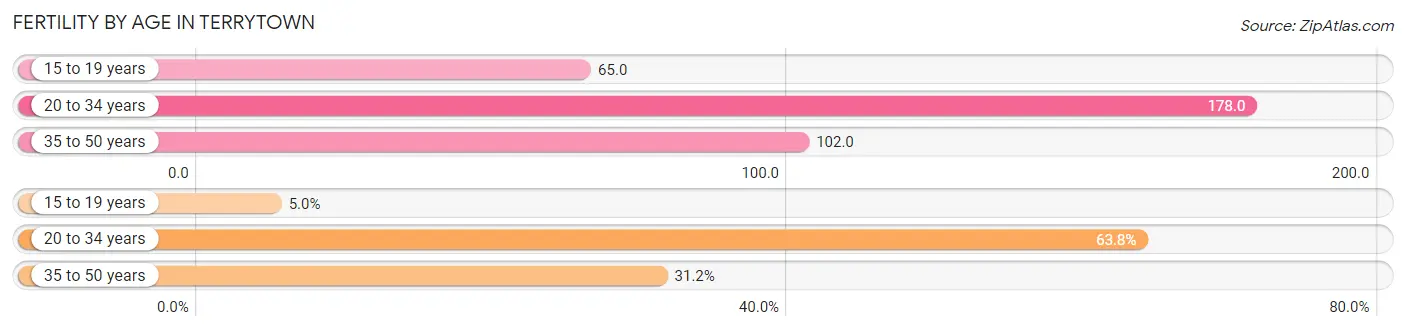
| Age Bracket | Women with Births | Births / 1,000 Women |
| 15 to 19 years | 42 (5.0%) | 65.0 |
| 20 to 34 years | 536 (63.8%) | 178.0 |
| 35 to 50 years | 262 (31.2%) | 102.0 |
| Total | 840 (100.0%) | 135.0 |
Fertility by Age by Marriage Status in Terrytown
50.5% of women with births (840) in Terrytown are married. The highest percentage of unmarried women with births falls into 15 to 19 years age bracket with 100.0% of them unmarried at the time of birth, while the lowest percentage of unmarried women with births belong to 35 to 50 years age bracket with 28.2% of them unmarried.
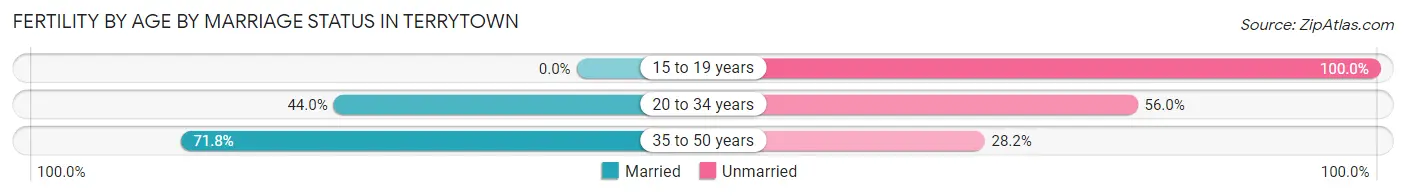
| Age Bracket | Married | Unmarried |
| 15 to 19 years | 0 (0.0%) | 42 (100.0%) |
| 20 to 34 years | 236 (44.0%) | 300 (56.0%) |
| 35 to 50 years | 188 (71.8%) | 74 (28.2%) |
| Total | 424 (50.5%) | 416 (49.5%) |
Fertility by Education in Terrytown
Average fertility rate in Terrytown is 135.0 births per 1,000 women. Women with the education attainment of high school diploma have the highest fertility rate of 272.0 births per 1,000 women, while women with the education attainment of less than high school have the lowest fertility at 10.0 births per 1,000 women. Women with the education attainment of high school diploma represent 53.0% of all women with births.
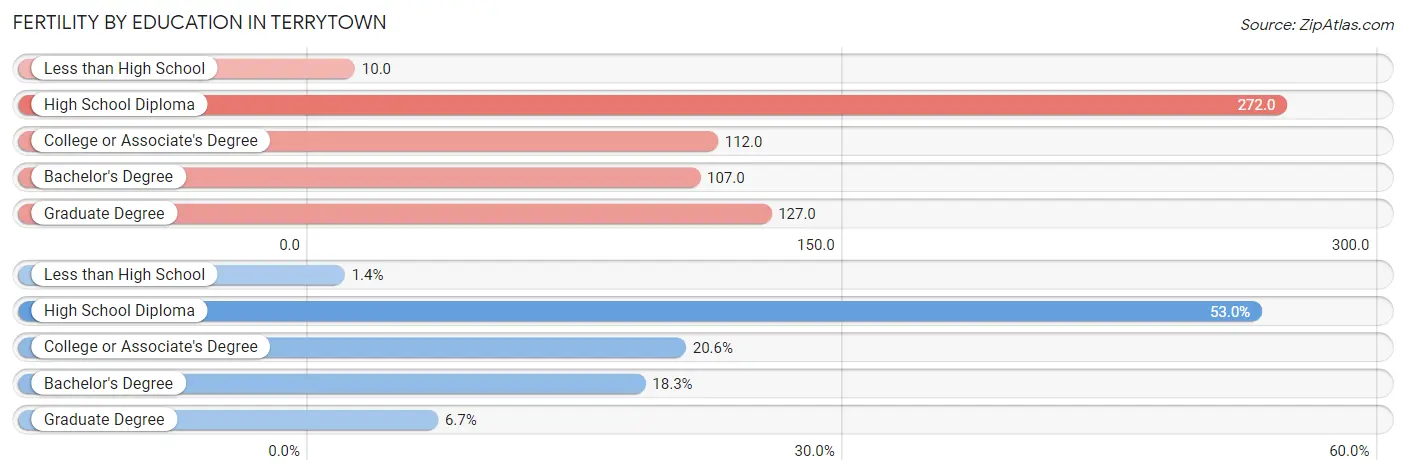
| Educational Attainment | Women with Births | Births / 1,000 Women |
| Less than High School | 12 (1.4%) | 10.0 |
| High School Diploma | 445 (53.0%) | 272.0 |
| College or Associate's Degree | 173 (20.6%) | 112.0 |
| Bachelor's Degree | 154 (18.3%) | 107.0 |
| Graduate Degree | 56 (6.7%) | 127.0 |
| Total | 840 (100.0%) | 135.0 |
Fertility by Education by Marriage Status in Terrytown
49.5% of women with births in Terrytown are unmarried. Women with the educational attainment of bachelor's degree are most likely to be married with 100.0% of them married at childbirth, while women with the educational attainment of less than high school are least likely to be married with 100.0% of them unmarried at childbirth.
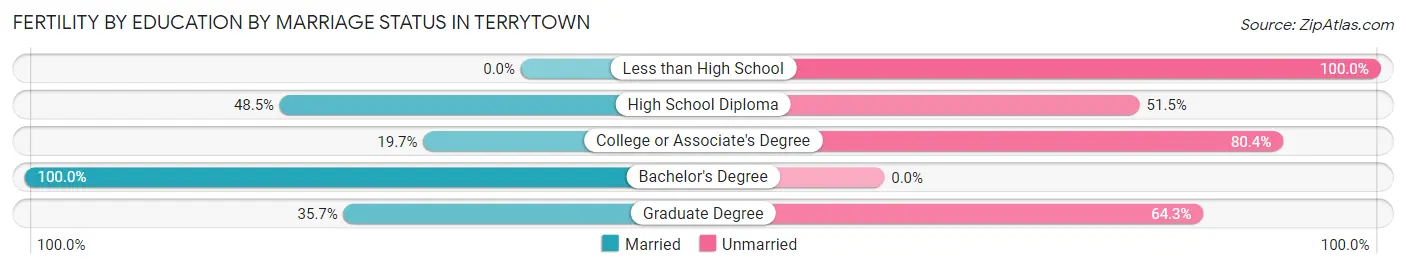
| Educational Attainment | Married | Unmarried |
| Less than High School | 0 (0.0%) | 12 (100.0%) |
| High School Diploma | 216 (48.5%) | 229 (51.5%) |
| College or Associate's Degree | 34 (19.7%) | 139 (80.3%) |
| Bachelor's Degree | 154 (100.0%) | 0 (0.0%) |
| Graduate Degree | 20 (35.7%) | 36 (64.3%) |
| Total | 424 (50.5%) | 416 (49.5%) |
Employment Characteristics in Terrytown
Employment by Class of Employer in Terrytown
Among the 12,252 employed individuals in Terrytown, private company employees (8,914 | 72.8%), not-for-profit organizations (769 | 6.3%), and federal government employees (718 | 5.9%) make up the most common classes of employment.
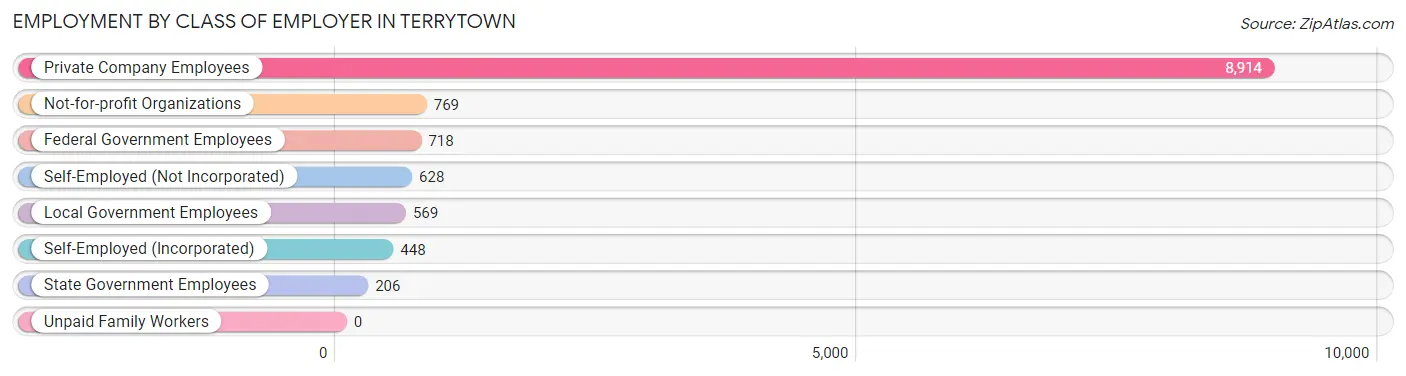
| Employer Class | # Employees | % Employees |
| Private Company Employees | 8,914 | 72.8% |
| Self-Employed (Incorporated) | 448 | 3.7% |
| Self-Employed (Not Incorporated) | 628 | 5.1% |
| Not-for-profit Organizations | 769 | 6.3% |
| Local Government Employees | 569 | 4.6% |
| State Government Employees | 206 | 1.7% |
| Federal Government Employees | 718 | 5.9% |
| Unpaid Family Workers | 0 | 0.0% |
| Total | 12,252 | 100.0% |
Employment Status by Age in Terrytown
According to the labor force statistics for Terrytown, out of the total population over 16 years of age (19,526), 69.9% or 13,649 individuals are in the labor force, with 8.3% or 1,133 of them unemployed. The age group with the highest labor force participation rate is 35 to 44 years, with 87.4% or 3,246 individuals in the labor force. Within the labor force, the 20 to 24 years age range has the highest percentage of unemployed individuals, with 19.5% or 324 of them being unemployed.
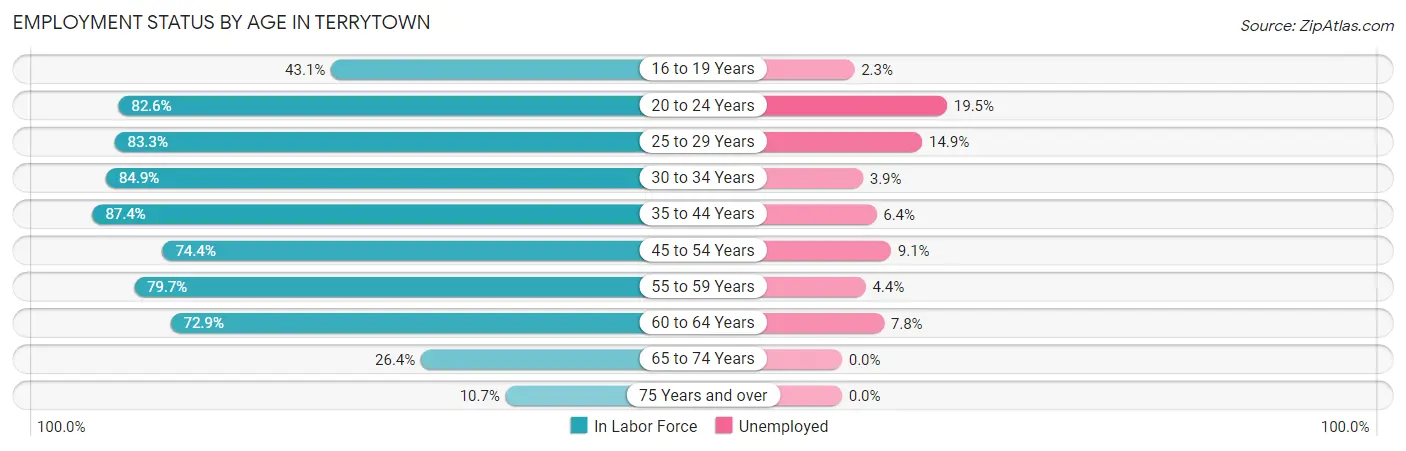
| Age Bracket | In Labor Force | Unemployed |
| 16 to 19 Years | 533 (43.1%) | 12 (2.3%) |
| 20 to 24 Years | 1,660 (82.6%) | 324 (19.5%) |
| 25 to 29 Years | 1,062 (83.3%) | 158 (14.9%) |
| 30 to 34 Years | 2,117 (84.9%) | 83 (3.9%) |
| 35 to 44 Years | 3,246 (87.4%) | 208 (6.4%) |
| 45 to 54 Years | 2,226 (74.4%) | 203 (9.1%) |
| 55 to 59 Years | 1,057 (79.7%) | 47 (4.4%) |
| 60 to 64 Years | 1,203 (72.9%) | 94 (7.8%) |
| 65 to 74 Years | 421 (26.4%) | 0 (0.0%) |
| 75 Years and over | 132 (10.7%) | 0 (0.0%) |
| Total | 13,649 (69.9%) | 1,133 (8.3%) |
Employment Status by Educational Attainment in Terrytown
According to labor force statistics for Terrytown, 81.1% of individuals (10,908) out of the total population between 25 and 64 years of age (13,450) are in the labor force, with 7.2% or 785 of them being unemployed. The group with the highest labor force participation rate are those with the educational attainment of college / associate degree, with 85.5% or 3,123 individuals in the labor force. Within the labor force, individuals with high school diploma education have the highest percentage of unemployment, with 8.1% or 265 of them being unemployed.
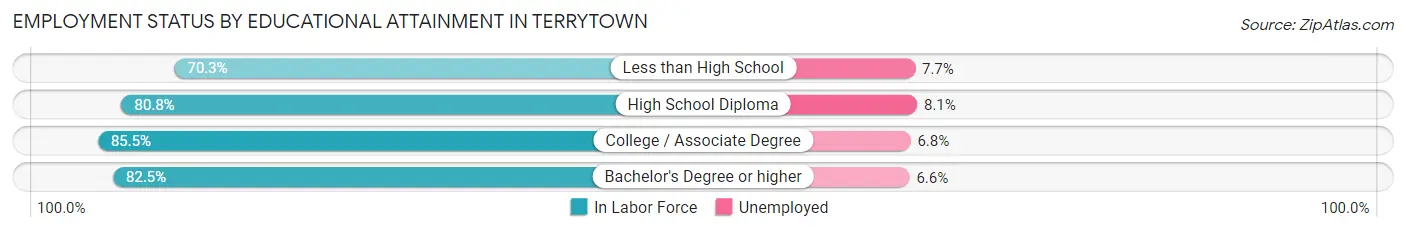
| Educational Attainment | In Labor Force | Unemployed |
| Less than High School | 1,343 (70.3%) | 147 (7.7%) |
| High School Diploma | 3,272 (80.8%) | 328 (8.1%) |
| College / Associate Degree | 3,123 (85.5%) | 248 (6.8%) |
| Bachelor's Degree or higher | 3,166 (82.5%) | 253 (6.6%) |
| Total | 10,908 (81.1%) | 968 (7.2%) |
Employment Occupations by Sex in Terrytown
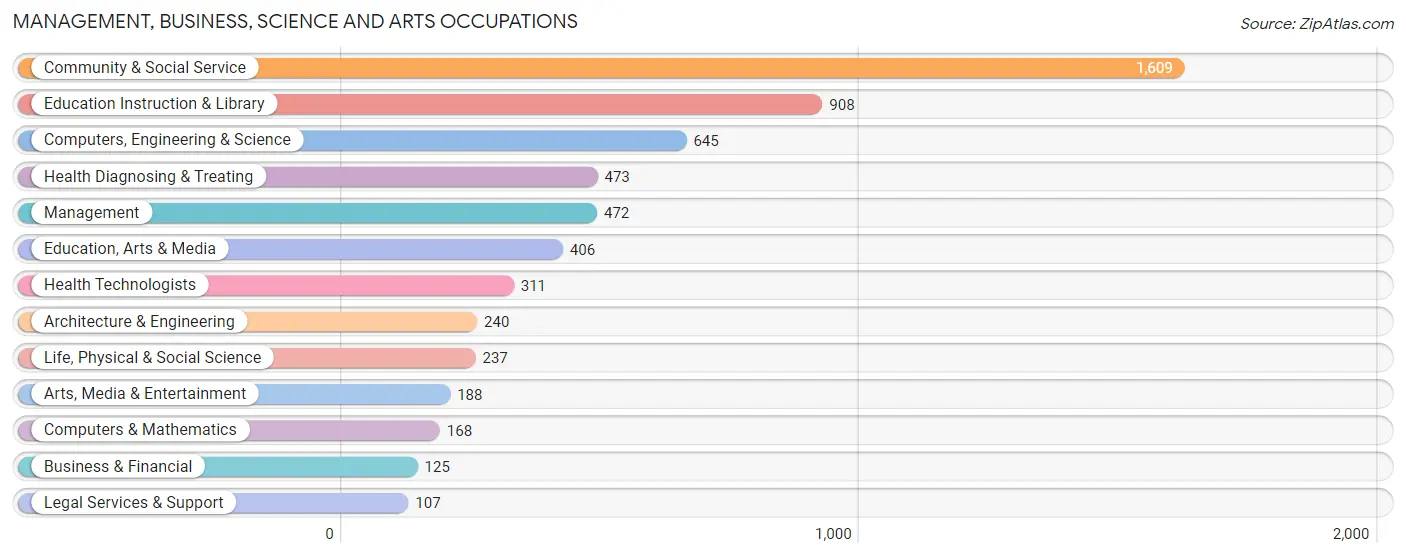
Management, Business, Science and Arts Occupations
The most common Management, Business, Science and Arts occupations in Terrytown are Community & Social Service (1,609 | 13.0%), Education Instruction & Library (908 | 7.3%), Computers, Engineering & Science (645 | 5.2%), Health Diagnosing & Treating (473 | 3.8%), and Management (472 | 3.8%).
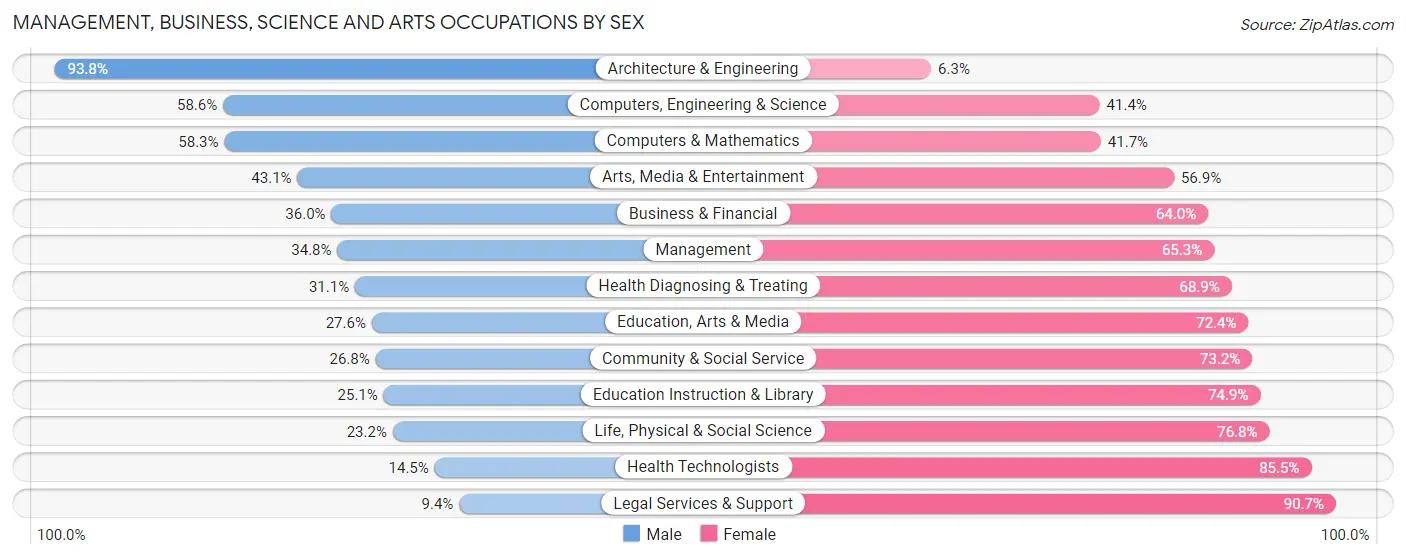
Management, Business, Science and Arts Occupations by Sex
Within the Management, Business, Science and Arts occupations in Terrytown, the most male-oriented occupations are Architecture & Engineering (93.8%), Computers, Engineering & Science (58.6%), and Computers & Mathematics (58.3%), while the most female-oriented occupations are Legal Services & Support (90.6%), Health Technologists (85.5%), and Life, Physical & Social Science (76.8%).
| Occupation | Male | Female |
| Management | 164 (34.7%) | 308 (65.2%) |
| Business & Financial | 45 (36.0%) | 80 (64.0%) |
| Computers, Engineering & Science | 378 (58.6%) | 267 (41.4%) |
| Computers & Mathematics | 98 (58.3%) | 70 (41.7%) |
| Architecture & Engineering | 225 (93.8%) | 15 (6.2%) |
| Life, Physical & Social Science | 55 (23.2%) | 182 (76.8%) |
| Community & Social Service | 431 (26.8%) | 1,178 (73.2%) |
| Education, Arts & Media | 112 (27.6%) | 294 (72.4%) |
| Legal Services & Support | 10 (9.3%) | 97 (90.6%) |
| Education Instruction & Library | 228 (25.1%) | 680 (74.9%) |
| Arts, Media & Entertainment | 81 (43.1%) | 107 (56.9%) |
| Health Diagnosing & Treating | 147 (31.1%) | 326 (68.9%) |
| Health Technologists | 45 (14.5%) | 266 (85.5%) |
| Total (Category) | 1,165 (35.0%) | 2,159 (64.9%) |
| Total (Overall) | 6,986 (56.3%) | 5,422 (43.7%) |
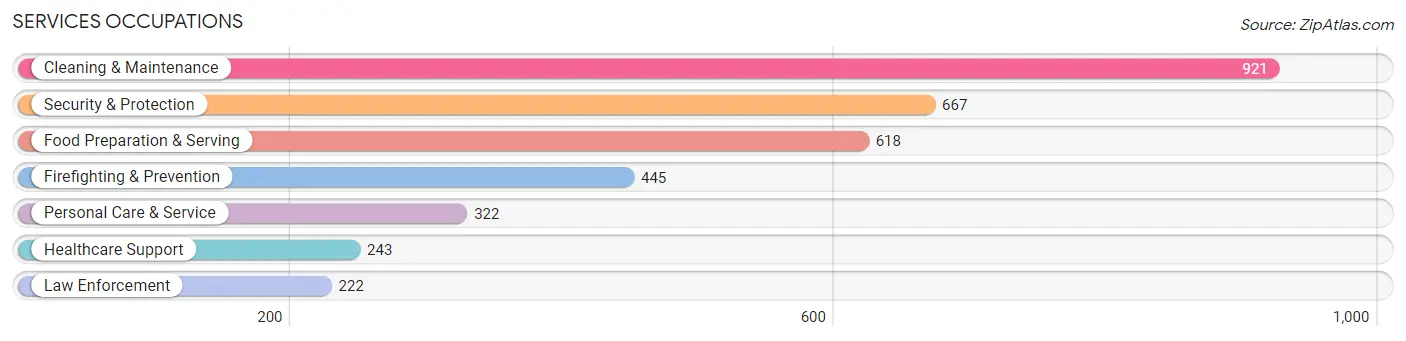
Services Occupations
The most common Services occupations in Terrytown are Cleaning & Maintenance (921 | 7.4%), Security & Protection (667 | 5.4%), Food Preparation & Serving (618 | 5.0%), Firefighting & Prevention (445 | 3.6%), and Personal Care & Service (322 | 2.6%).
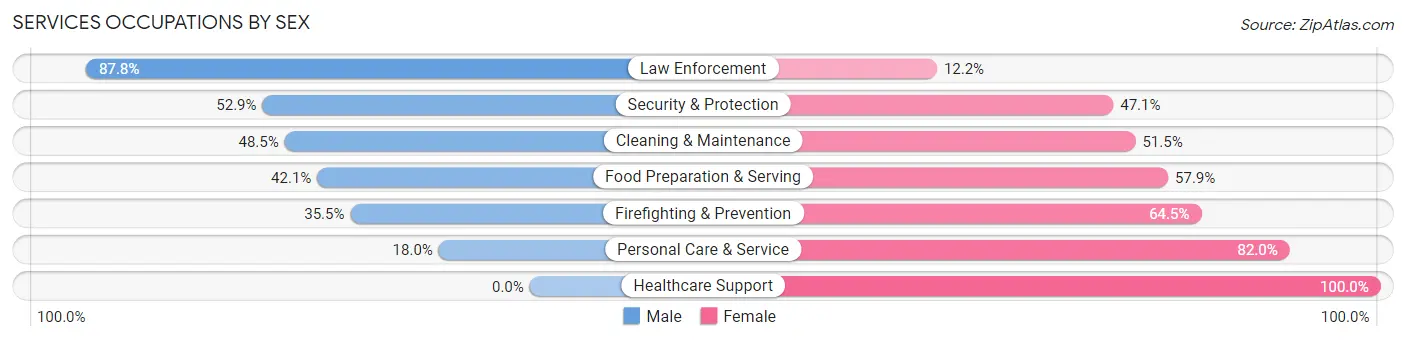
Services Occupations by Sex
Within the Services occupations in Terrytown, the most male-oriented occupations are Law Enforcement (87.8%), Security & Protection (52.9%), and Cleaning & Maintenance (48.5%), while the most female-oriented occupations are Healthcare Support (100.0%), Personal Care & Service (82.0%), and Firefighting & Prevention (64.5%).
| Occupation | Male | Female |
| Healthcare Support | 0 (0.0%) | 243 (100.0%) |
| Security & Protection | 353 (52.9%) | 314 (47.1%) |
| Firefighting & Prevention | 158 (35.5%) | 287 (64.5%) |
| Law Enforcement | 195 (87.8%) | 27 (12.2%) |
| Food Preparation & Serving | 260 (42.1%) | 358 (57.9%) |
| Cleaning & Maintenance | 447 (48.5%) | 474 (51.5%) |
| Personal Care & Service | 58 (18.0%) | 264 (82.0%) |
| Total (Category) | 1,118 (40.4%) | 1,653 (59.7%) |
| Total (Overall) | 6,986 (56.3%) | 5,422 (43.7%) |
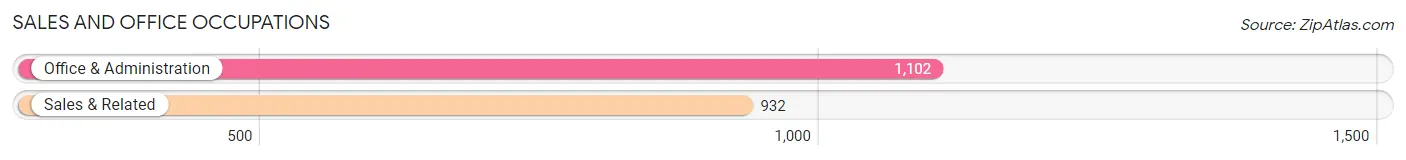
Sales and Office Occupations
The most common Sales and Office occupations in Terrytown are Office & Administration (1,102 | 8.9%), and Sales & Related (932 | 7.5%).
Sales and Office Occupations by Sex
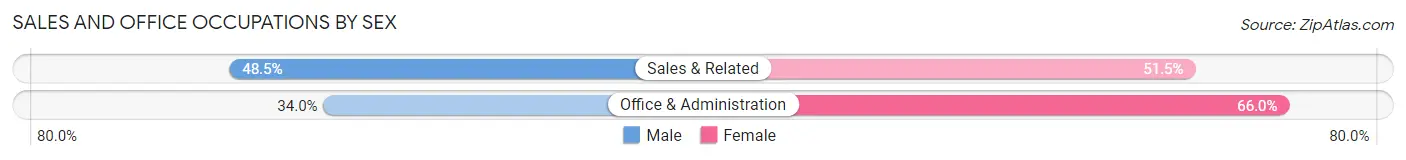
| Occupation | Male | Female |
| Sales & Related | 452 (48.5%) | 480 (51.5%) |
| Office & Administration | 375 (34.0%) | 727 (66.0%) |
| Total (Category) | 827 (40.7%) | 1,207 (59.3%) |
| Total (Overall) | 6,986 (56.3%) | 5,422 (43.7%) |
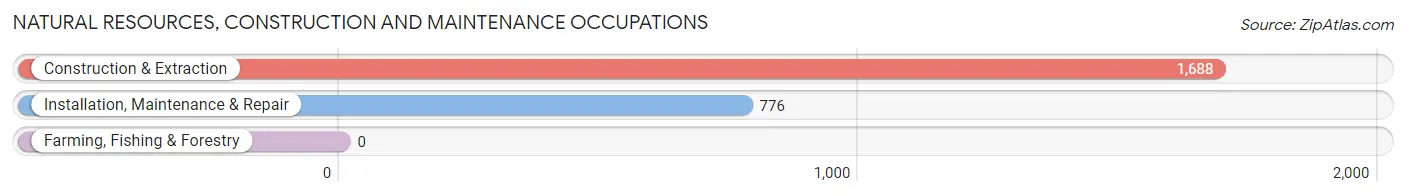
Natural Resources, Construction and Maintenance Occupations
The most common Natural Resources, Construction and Maintenance occupations in Terrytown are Construction & Extraction (1,688 | 13.6%), and Installation, Maintenance & Repair (776 | 6.2%).
Natural Resources, Construction and Maintenance Occupations by Sex
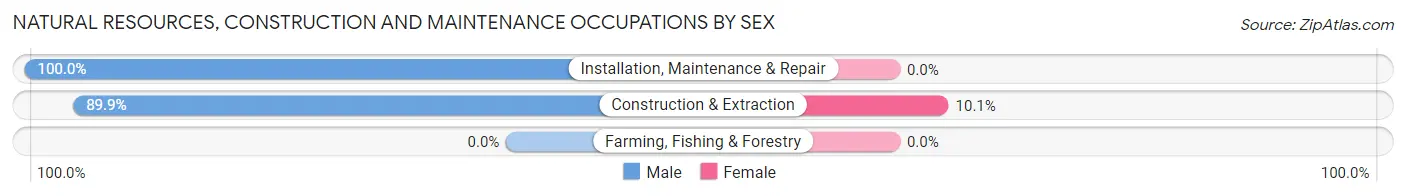
| Occupation | Male | Female |
| Farming, Fishing & Forestry | 0 (0.0%) | 0 (0.0%) |
| Construction & Extraction | 1,517 (89.9%) | 171 (10.1%) |
| Installation, Maintenance & Repair | 776 (100.0%) | 0 (0.0%) |
| Total (Category) | 2,293 (93.1%) | 171 (6.9%) |
| Total (Overall) | 6,986 (56.3%) | 5,422 (43.7%) |
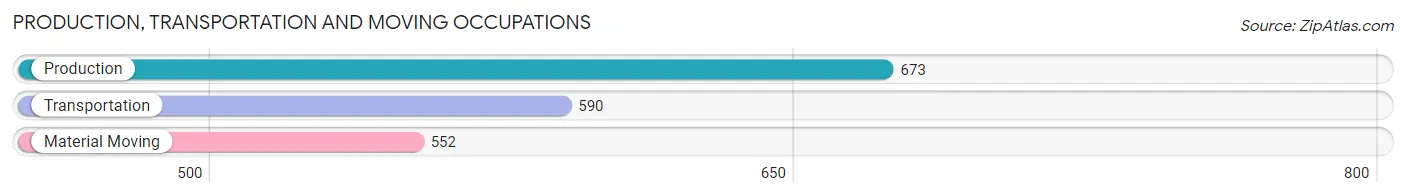
Production, Transportation and Moving Occupations
The most common Production, Transportation and Moving occupations in Terrytown are Production (673 | 5.4%), Transportation (590 | 4.8%), and Material Moving (552 | 4.4%).
Production, Transportation and Moving Occupations by Sex
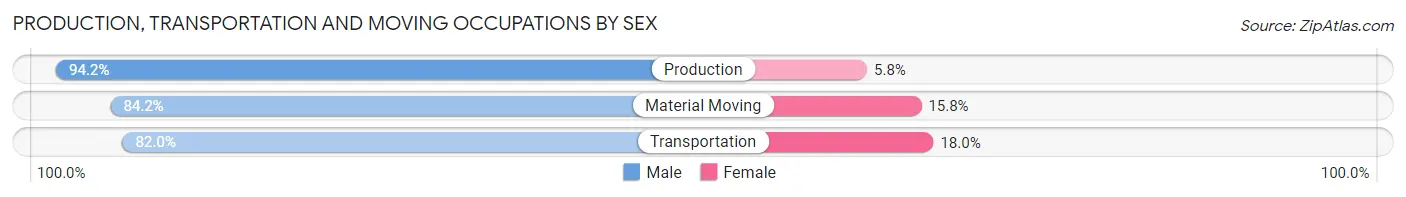
| Occupation | Male | Female |
| Production | 634 (94.2%) | 39 (5.8%) |
| Transportation | 484 (82.0%) | 106 (18.0%) |
| Material Moving | 465 (84.2%) | 87 (15.8%) |
| Total (Category) | 1,583 (87.2%) | 232 (12.8%) |
| Total (Overall) | 6,986 (56.3%) | 5,422 (43.7%) |
Employment Industries by Sex in Terrytown
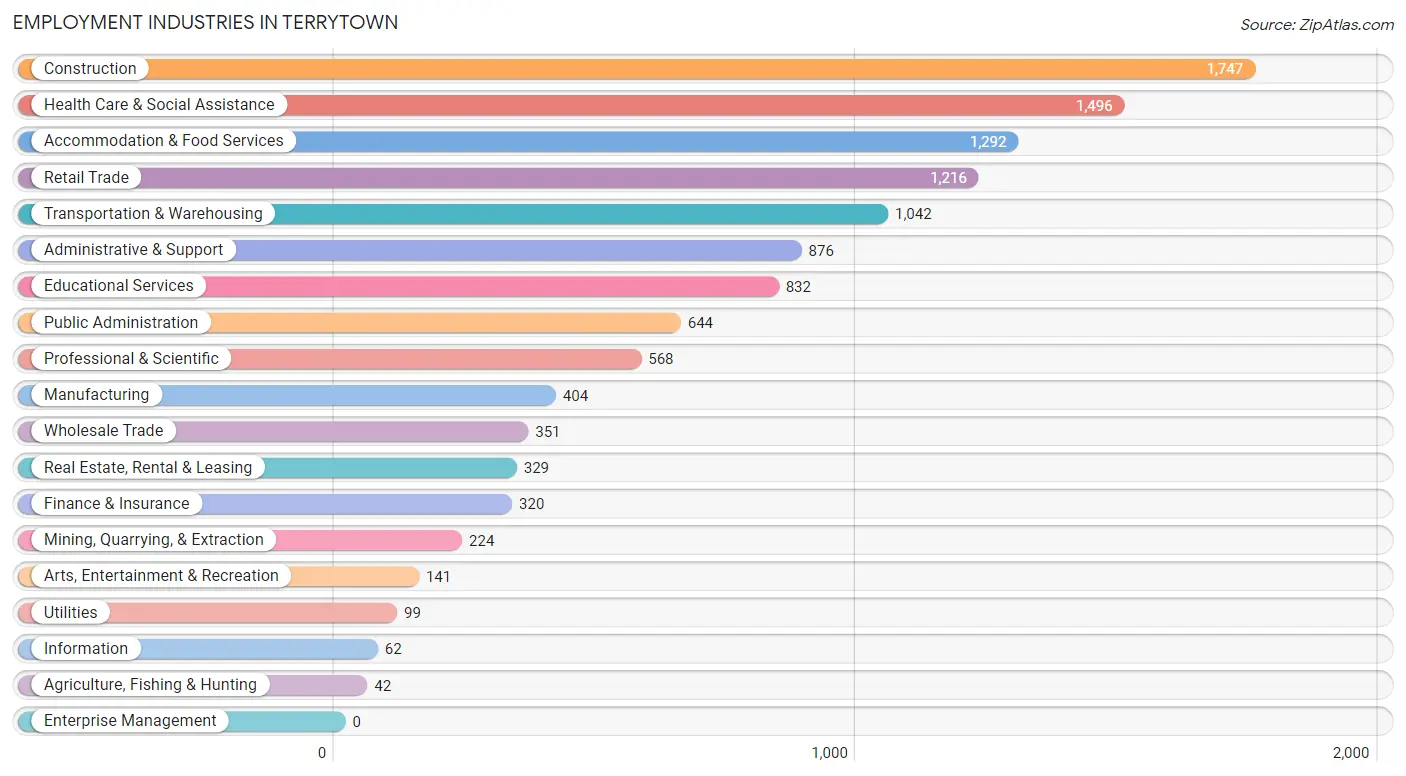
Employment Industries in Terrytown
The major employment industries in Terrytown include Construction (1,747 | 14.1%), Health Care & Social Assistance (1,496 | 12.1%), Accommodation & Food Services (1,292 | 10.4%), Retail Trade (1,216 | 9.8%), and Transportation & Warehousing (1,042 | 8.4%).
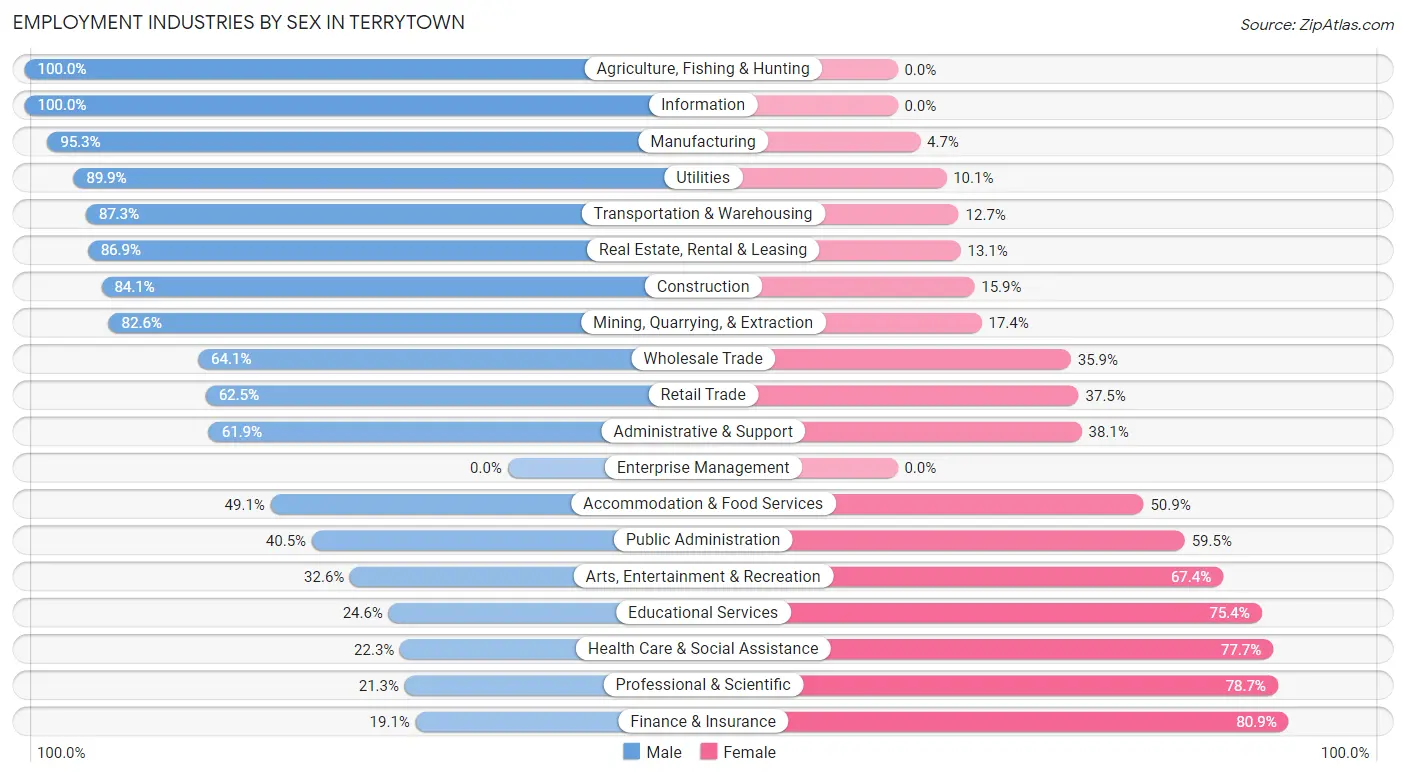
Employment Industries by Sex in Terrytown
The Terrytown industries that see more men than women are Agriculture, Fishing & Hunting (100.0%), Information (100.0%), and Manufacturing (95.3%), whereas the industries that tend to have a higher number of women are Finance & Insurance (80.9%), Professional & Scientific (78.7%), and Health Care & Social Assistance (77.7%).
| Industry | Male | Female |
| Agriculture, Fishing & Hunting | 42 (100.0%) | 0 (0.0%) |
| Mining, Quarrying, & Extraction | 185 (82.6%) | 39 (17.4%) |
| Construction | 1,469 (84.1%) | 278 (15.9%) |
| Manufacturing | 385 (95.3%) | 19 (4.7%) |
| Wholesale Trade | 225 (64.1%) | 126 (35.9%) |
| Retail Trade | 760 (62.5%) | 456 (37.5%) |
| Transportation & Warehousing | 910 (87.3%) | 132 (12.7%) |
| Utilities | 89 (89.9%) | 10 (10.1%) |
| Information | 62 (100.0%) | 0 (0.0%) |
| Finance & Insurance | 61 (19.1%) | 259 (80.9%) |
| Real Estate, Rental & Leasing | 286 (86.9%) | 43 (13.1%) |
| Professional & Scientific | 121 (21.3%) | 447 (78.7%) |
| Enterprise Management | 0 (0.0%) | 0 (0.0%) |
| Administrative & Support | 542 (61.9%) | 334 (38.1%) |
| Educational Services | 205 (24.6%) | 627 (75.4%) |
| Health Care & Social Assistance | 333 (22.3%) | 1,163 (77.7%) |
| Arts, Entertainment & Recreation | 46 (32.6%) | 95 (67.4%) |
| Accommodation & Food Services | 634 (49.1%) | 658 (50.9%) |
| Public Administration | 261 (40.5%) | 383 (59.5%) |
| Total | 6,986 (56.3%) | 5,422 (43.7%) |
Education in Terrytown
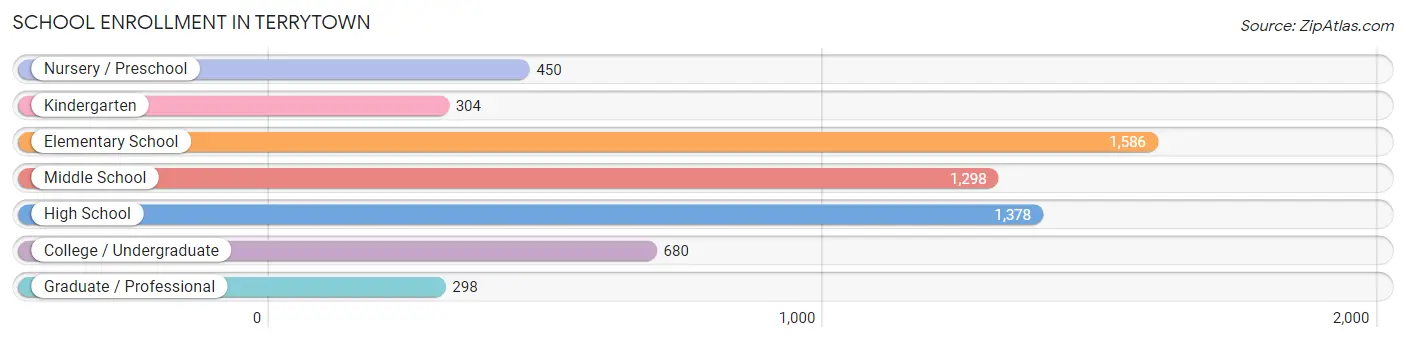
School Enrollment in Terrytown
The most common levels of schooling among the 5,994 students in Terrytown are elementary school (1,586 | 26.5%), high school (1,378 | 23.0%), and middle school (1,298 | 21.6%).
| School Level | # Students | % Students |
| Nursery / Preschool | 450 | 7.5% |
| Kindergarten | 304 | 5.1% |
| Elementary School | 1,586 | 26.5% |
| Middle School | 1,298 | 21.6% |
| High School | 1,378 | 23.0% |
| College / Undergraduate | 680 | 11.3% |
| Graduate / Professional | 298 | 5.0% |
| Total | 5,994 | 100.0% |
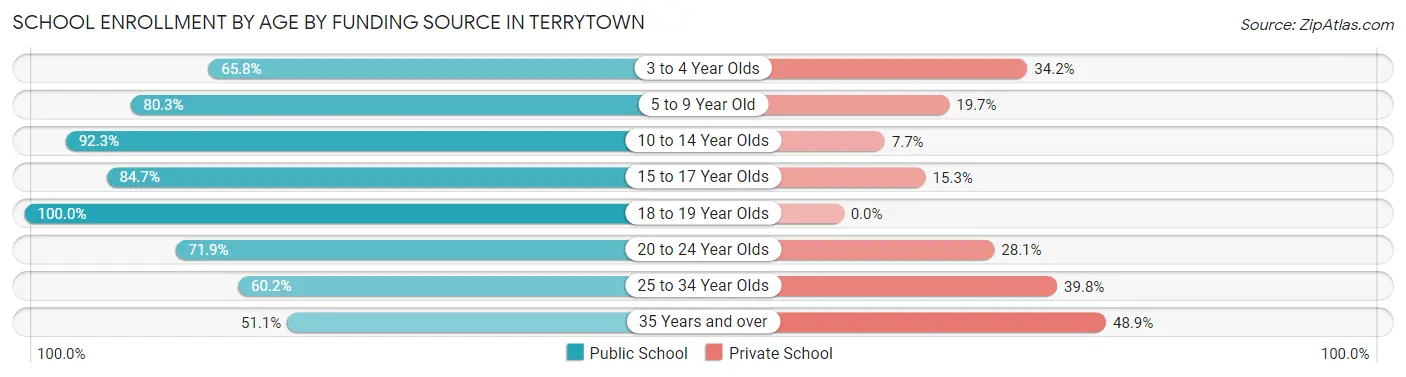
School Enrollment by Age by Funding Source in Terrytown
Out of a total of 5,994 students who are enrolled in schools in Terrytown, 1,175 (19.6%) attend a private institution, while the remaining 4,819 (80.4%) are enrolled in public schools. The age group of 35 years and over has the highest likelihood of being enrolled in private schools, with 197 (48.9% in the age bracket) enrolled. Conversely, the age group of 18 to 19 year olds has the lowest likelihood of being enrolled in a private school, with 135 (100.0% in the age bracket) attending a public institution.
| Age Bracket | Public School | Private School |
| 3 to 4 Year Olds | 248 (65.8%) | 129 (34.2%) |
| 5 to 9 Year Old | 1,513 (80.3%) | 371 (19.7%) |
| 10 to 14 Year Olds | 1,420 (92.3%) | 118 (7.7%) |
| 15 to 17 Year Olds | 899 (84.7%) | 162 (15.3%) |
| 18 to 19 Year Olds | 135 (100.0%) | 0 (0.0%) |
| 20 to 24 Year Olds | 246 (71.9%) | 96 (28.1%) |
| 25 to 34 Year Olds | 153 (60.2%) | 101 (39.8%) |
| 35 Years and over | 206 (51.1%) | 197 (48.9%) |
| Total | 4,819 (80.4%) | 1,175 (19.6%) |
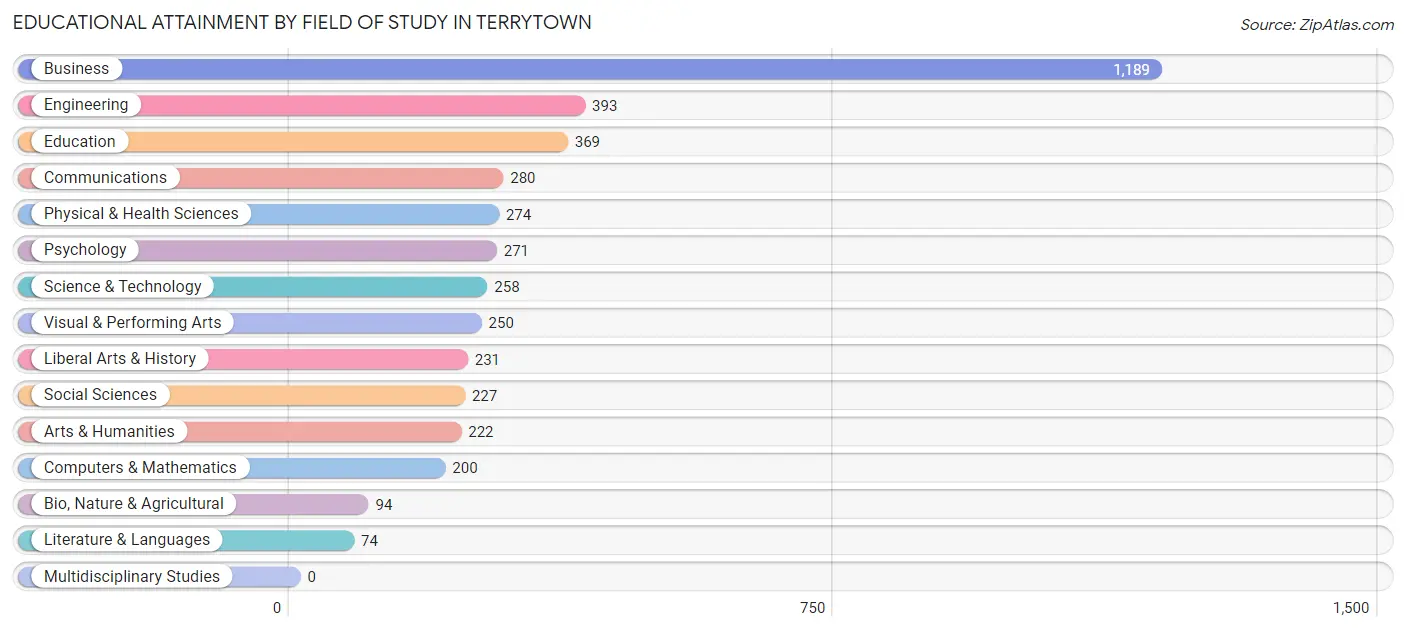
Educational Attainment by Field of Study in Terrytown
Business (1,189 | 27.5%), engineering (393 | 9.1%), education (369 | 8.5%), communications (280 | 6.5%), and physical & health sciences (274 | 6.3%) are the most common fields of study among 4,332 individuals in Terrytown who have obtained a bachelor's degree or higher.
| Field of Study | # Graduates | % Graduates |
| Computers & Mathematics | 200 | 4.6% |
| Bio, Nature & Agricultural | 94 | 2.2% |
| Physical & Health Sciences | 274 | 6.3% |
| Psychology | 271 | 6.3% |
| Social Sciences | 227 | 5.2% |
| Engineering | 393 | 9.1% |
| Multidisciplinary Studies | 0 | 0.0% |
| Science & Technology | 258 | 6.0% |
| Business | 1,189 | 27.5% |
| Education | 369 | 8.5% |
| Literature & Languages | 74 | 1.7% |
| Liberal Arts & History | 231 | 5.3% |
| Visual & Performing Arts | 250 | 5.8% |
| Communications | 280 | 6.5% |
| Arts & Humanities | 222 | 5.1% |
| Total | 4,332 | 100.0% |
Transportation & Commute in Terrytown
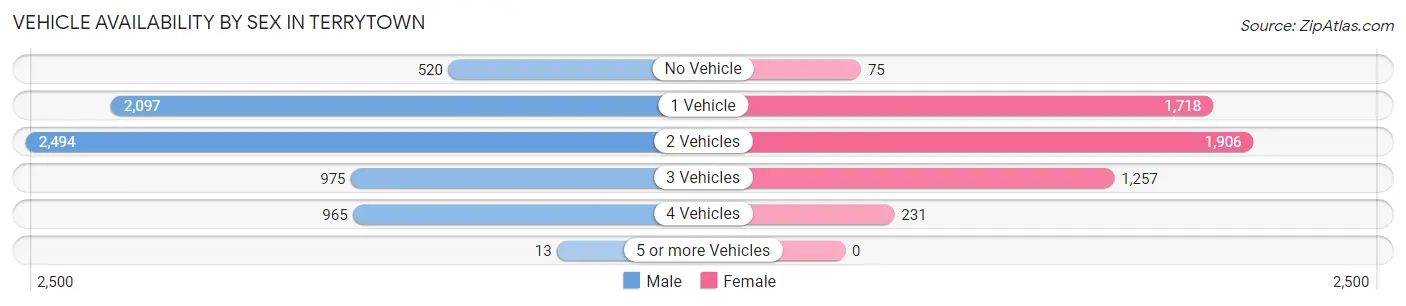
Vehicle Availability by Sex in Terrytown
The most prevalent vehicle ownership categories in Terrytown are males with 2 vehicles (2,494, accounting for 35.3%) and females with 2 vehicles (1,906, making up 48.1%).
| Vehicles Available | Male | Female |
| No Vehicle | 520 (7.4%) | 75 (1.5%) |
| 1 Vehicle | 2,097 (29.7%) | 1,718 (33.1%) |
| 2 Vehicles | 2,494 (35.3%) | 1,906 (36.7%) |
| 3 Vehicles | 975 (13.8%) | 1,257 (24.2%) |
| 4 Vehicles | 965 (13.7%) | 231 (4.4%) |
| 5 or more Vehicles | 13 (0.2%) | 0 (0.0%) |
| Total | 7,064 (100.0%) | 5,187 (100.0%) |
Commute Time in Terrytown
The most frequently occuring commute durations in Terrytown are 30 to 34 minutes (2,262 commuters, 19.7%), 15 to 19 minutes (2,009 commuters, 17.5%), and 20 to 24 minutes (1,941 commuters, 16.9%).
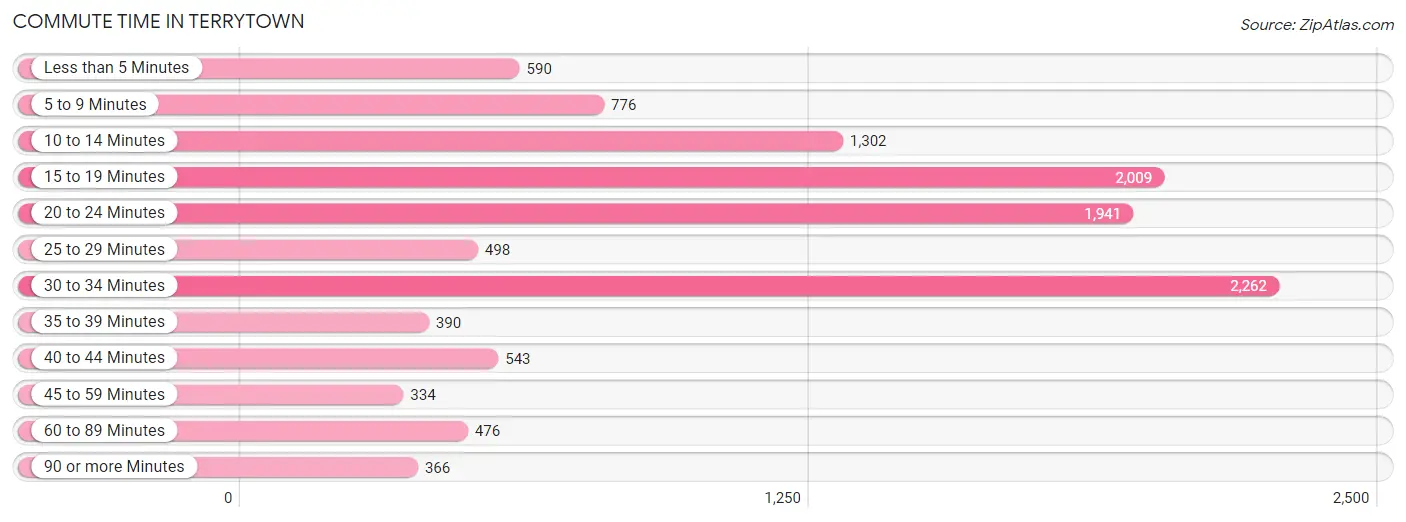
| Commute Time | # Commuters | % Commuters |
| Less than 5 Minutes | 590 | 5.1% |
| 5 to 9 Minutes | 776 | 6.8% |
| 10 to 14 Minutes | 1,302 | 11.3% |
| 15 to 19 Minutes | 2,009 | 17.5% |
| 20 to 24 Minutes | 1,941 | 16.9% |
| 25 to 29 Minutes | 498 | 4.3% |
| 30 to 34 Minutes | 2,262 | 19.7% |
| 35 to 39 Minutes | 390 | 3.4% |
| 40 to 44 Minutes | 543 | 4.7% |
| 45 to 59 Minutes | 334 | 2.9% |
| 60 to 89 Minutes | 476 | 4.1% |
| 90 or more Minutes | 366 | 3.2% |
Commute Time by Sex in Terrytown
The most common commute times in Terrytown are 20 to 24 minutes (1,354 commuters, 20.0%) for males and 30 to 34 minutes (961 commuters, 20.3%) for females.
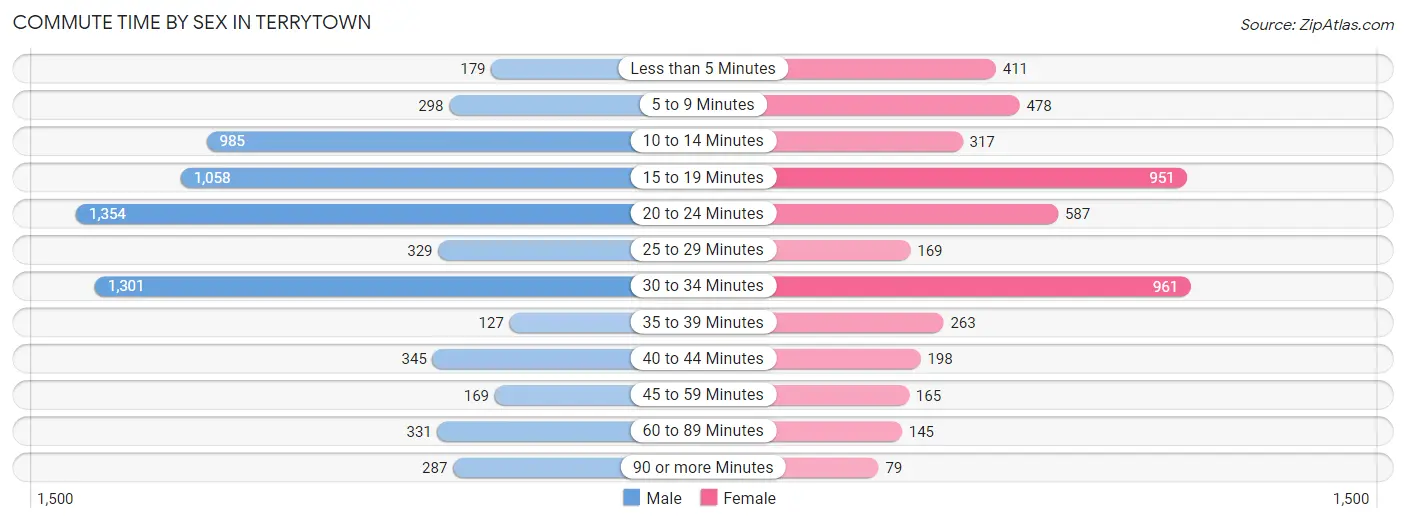
| Commute Time | Male | Female |
| Less than 5 Minutes | 179 (2.6%) | 411 (8.7%) |
| 5 to 9 Minutes | 298 (4.4%) | 478 (10.1%) |
| 10 to 14 Minutes | 985 (14.6%) | 317 (6.7%) |
| 15 to 19 Minutes | 1,058 (15.6%) | 951 (20.1%) |
| 20 to 24 Minutes | 1,354 (20.0%) | 587 (12.4%) |
| 25 to 29 Minutes | 329 (4.9%) | 169 (3.6%) |
| 30 to 34 Minutes | 1,301 (19.2%) | 961 (20.3%) |
| 35 to 39 Minutes | 127 (1.9%) | 263 (5.6%) |
| 40 to 44 Minutes | 345 (5.1%) | 198 (4.2%) |
| 45 to 59 Minutes | 169 (2.5%) | 165 (3.5%) |
| 60 to 89 Minutes | 331 (4.9%) | 145 (3.1%) |
| 90 or more Minutes | 287 (4.2%) | 79 (1.7%) |
Time of Departure to Work by Sex in Terrytown
The most frequent times of departure to work in Terrytown are 7:00 AM to 7:29 AM (794, 11.7%) for males and 7:00 AM to 7:29 AM (848, 17.9%) for females.
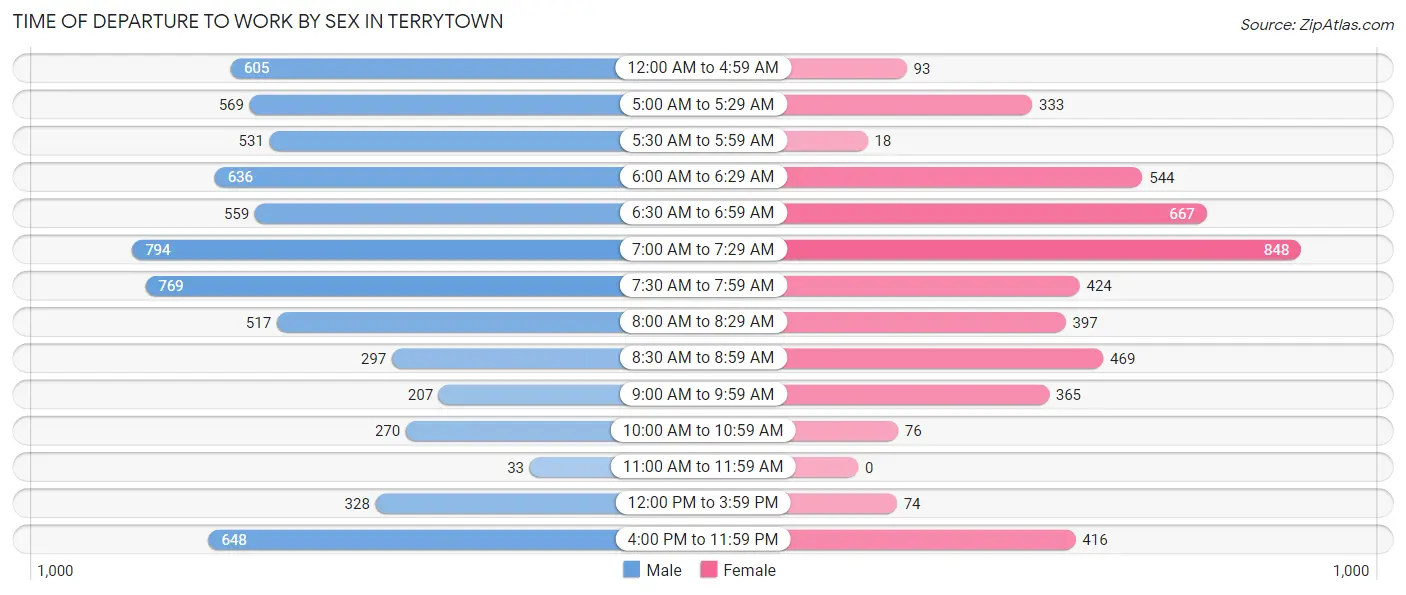
| Time of Departure | Male | Female |
| 12:00 AM to 4:59 AM | 605 (8.9%) | 93 (2.0%) |
| 5:00 AM to 5:29 AM | 569 (8.4%) | 333 (7.0%) |
| 5:30 AM to 5:59 AM | 531 (7.9%) | 18 (0.4%) |
| 6:00 AM to 6:29 AM | 636 (9.4%) | 544 (11.5%) |
| 6:30 AM to 6:59 AM | 559 (8.3%) | 667 (14.1%) |
| 7:00 AM to 7:29 AM | 794 (11.7%) | 848 (17.9%) |
| 7:30 AM to 7:59 AM | 769 (11.4%) | 424 (9.0%) |
| 8:00 AM to 8:29 AM | 517 (7.6%) | 397 (8.4%) |
| 8:30 AM to 8:59 AM | 297 (4.4%) | 469 (9.9%) |
| 9:00 AM to 9:59 AM | 207 (3.1%) | 365 (7.7%) |
| 10:00 AM to 10:59 AM | 270 (4.0%) | 76 (1.6%) |
| 11:00 AM to 11:59 AM | 33 (0.5%) | 0 (0.0%) |
| 12:00 PM to 3:59 PM | 328 (4.9%) | 74 (1.6%) |
| 4:00 PM to 11:59 PM | 648 (9.6%) | 416 (8.8%) |
| Total | 6,763 (100.0%) | 4,724 (100.0%) |
Housing Occupancy in Terrytown
Occupancy by Ownership in Terrytown
Of the total 8,814 dwellings in Terrytown, owner-occupied units account for 4,088 (46.4%), while renter-occupied units make up 4,726 (53.6%).
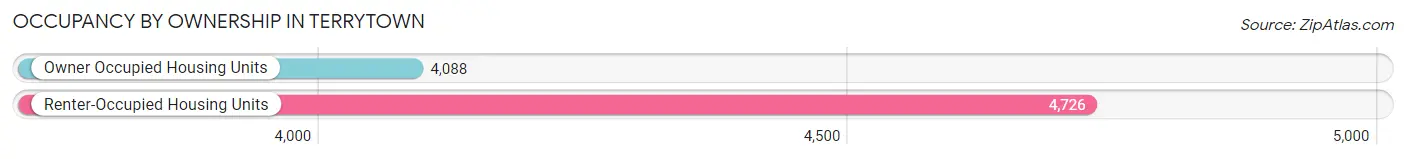
| Occupancy | # Housing Units | % Housing Units |
| Owner Occupied Housing Units | 4,088 | 46.4% |
| Renter-Occupied Housing Units | 4,726 | 53.6% |
| Total Occupied Housing Units | 8,814 | 100.0% |
Occupancy by Household Size in Terrytown
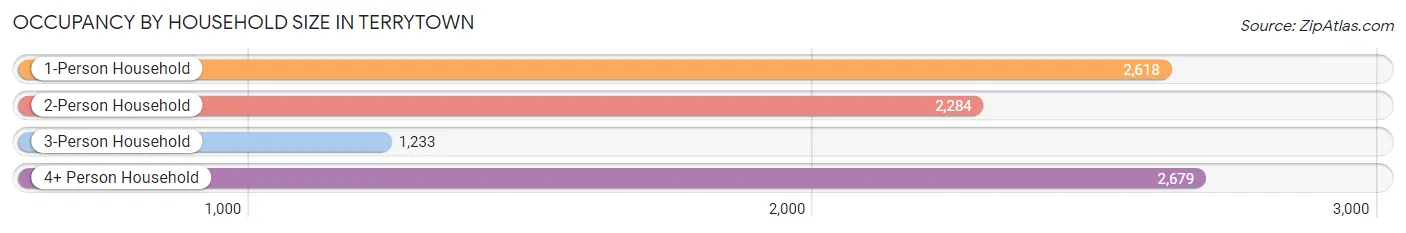
| Household Size | # Housing Units | % Housing Units |
| 1-Person Household | 2,618 | 29.7% |
| 2-Person Household | 2,284 | 25.9% |
| 3-Person Household | 1,233 | 14.0% |
| 4+ Person Household | 2,679 | 30.4% |
| Total Housing Units | 8,814 | 100.0% |
Occupancy by Ownership by Household Size in Terrytown
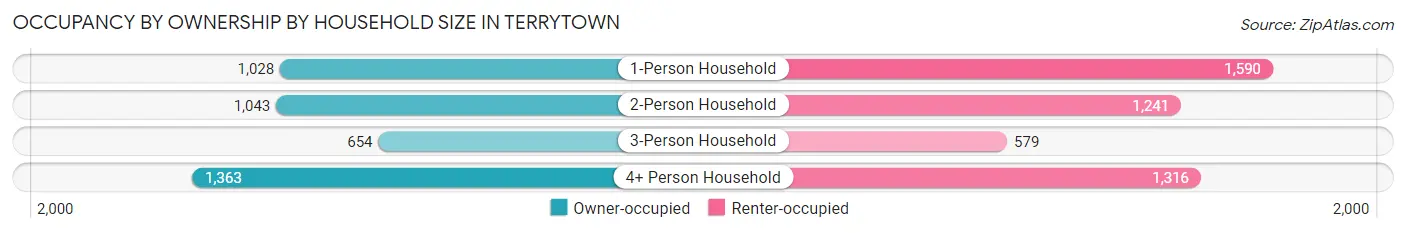
| Household Size | Owner-occupied | Renter-occupied |
| 1-Person Household | 1,028 (39.3%) | 1,590 (60.7%) |
| 2-Person Household | 1,043 (45.7%) | 1,241 (54.3%) |
| 3-Person Household | 654 (53.0%) | 579 (47.0%) |
| 4+ Person Household | 1,363 (50.9%) | 1,316 (49.1%) |
| Total Housing Units | 4,088 (46.4%) | 4,726 (53.6%) |
Occupancy by Educational Attainment in Terrytown
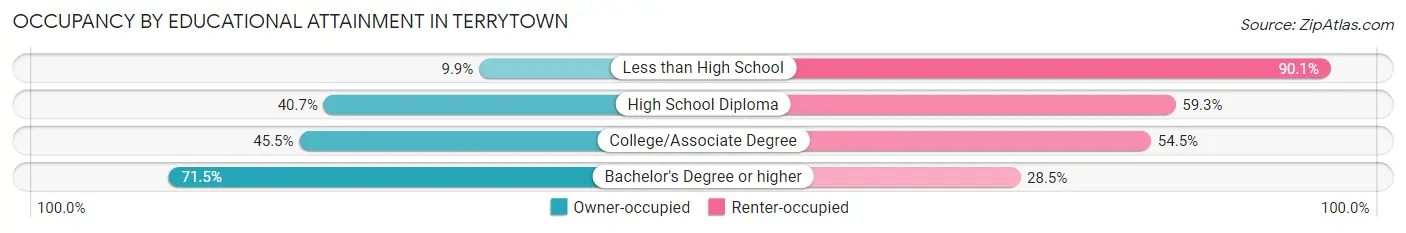
| Household Size | Owner-occupied | Renter-occupied |
| Less than High School | 94 (9.9%) | 857 (90.1%) |
| High School Diploma | 1,079 (40.7%) | 1,573 (59.3%) |
| College/Associate Degree | 1,420 (45.5%) | 1,699 (54.5%) |
| Bachelor's Degree or higher | 1,495 (71.5%) | 597 (28.5%) |
Occupancy by Age of Householder in Terrytown
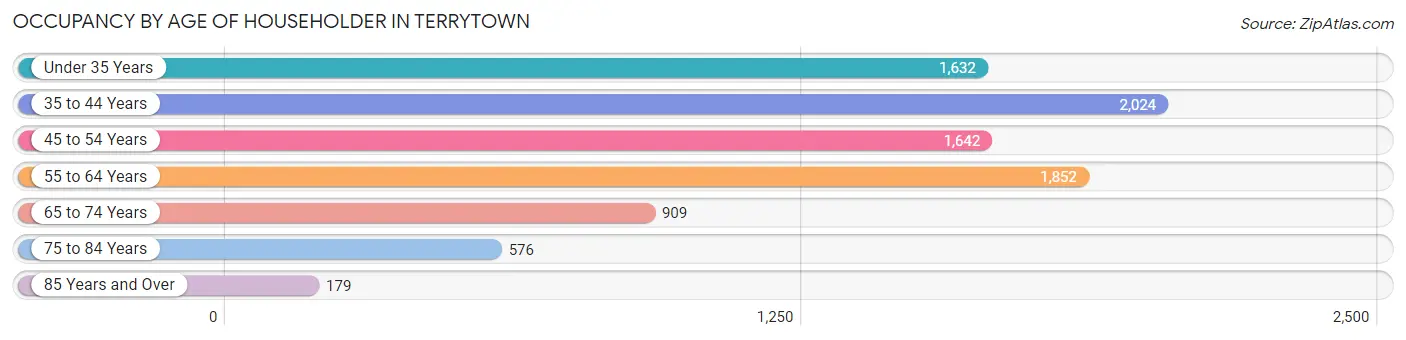
| Age Bracket | # Households | % Households |
| Under 35 Years | 1,632 | 18.5% |
| 35 to 44 Years | 2,024 | 23.0% |
| 45 to 54 Years | 1,642 | 18.6% |
| 55 to 64 Years | 1,852 | 21.0% |
| 65 to 74 Years | 909 | 10.3% |
| 75 to 84 Years | 576 | 6.5% |
| 85 Years and Over | 179 | 2.0% |
| Total | 8,814 | 100.0% |
Housing Finances in Terrytown
Median Income by Occupancy in Terrytown
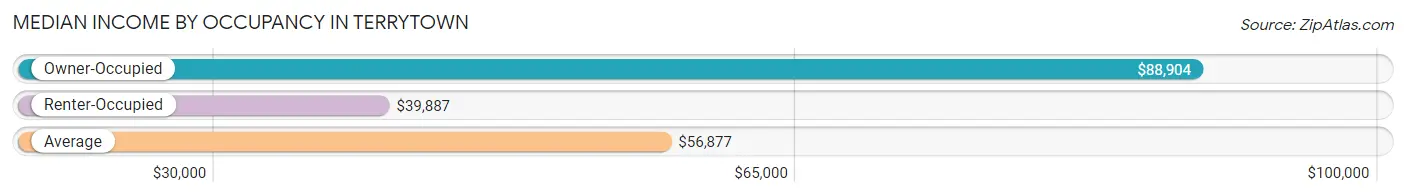
| Occupancy Type | # Households | Median Income |
| Owner-Occupied | 4,088 (46.4%) | $88,904 |
| Renter-Occupied | 4,726 (53.6%) | $39,887 |
| Average | 8,814 (100.0%) | $56,877 |
Occupancy by Householder Income Bracket in Terrytown
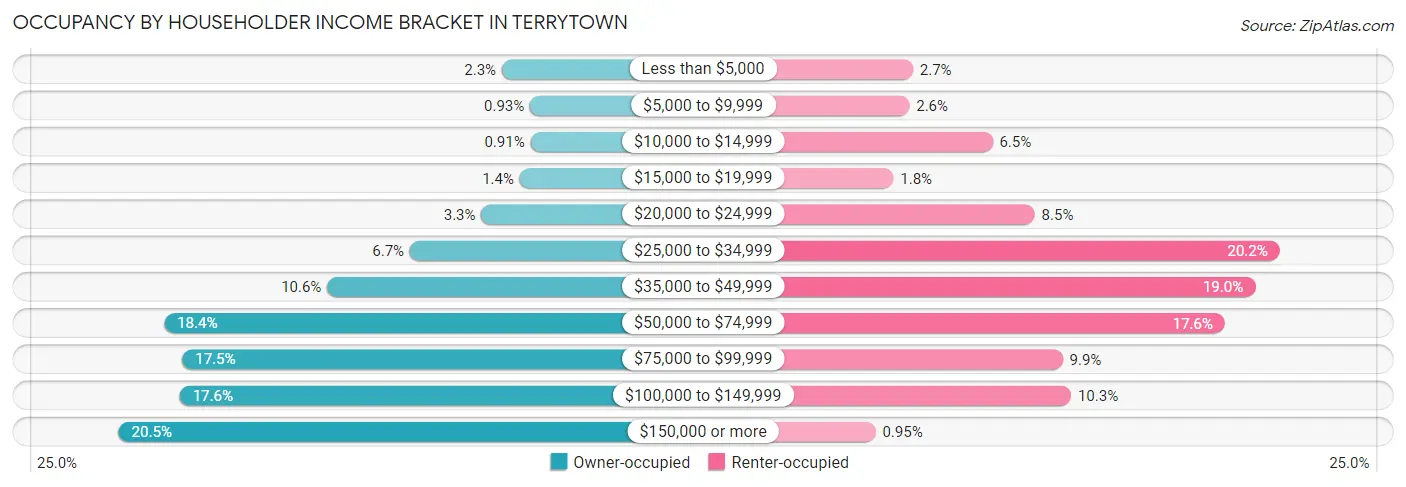
| Income Bracket | Owner-occupied | Renter-occupied |
| Less than $5,000 | 93 (2.3%) | 129 (2.7%) |
| $5,000 to $9,999 | 38 (0.9%) | 121 (2.6%) |
| $10,000 to $14,999 | 37 (0.9%) | 308 (6.5%) |
| $15,000 to $19,999 | 58 (1.4%) | 85 (1.8%) |
| $20,000 to $24,999 | 133 (3.3%) | 403 (8.5%) |
| $25,000 to $34,999 | 272 (6.7%) | 954 (20.2%) |
| $35,000 to $49,999 | 433 (10.6%) | 899 (19.0%) |
| $50,000 to $74,999 | 750 (18.3%) | 831 (17.6%) |
| $75,000 to $99,999 | 715 (17.5%) | 466 (9.9%) |
| $100,000 to $149,999 | 720 (17.6%) | 485 (10.3%) |
| $150,000 or more | 839 (20.5%) | 45 (0.9%) |
| Total | 4,088 (100.0%) | 4,726 (100.0%) |
Monthly Housing Cost Tiers in Terrytown
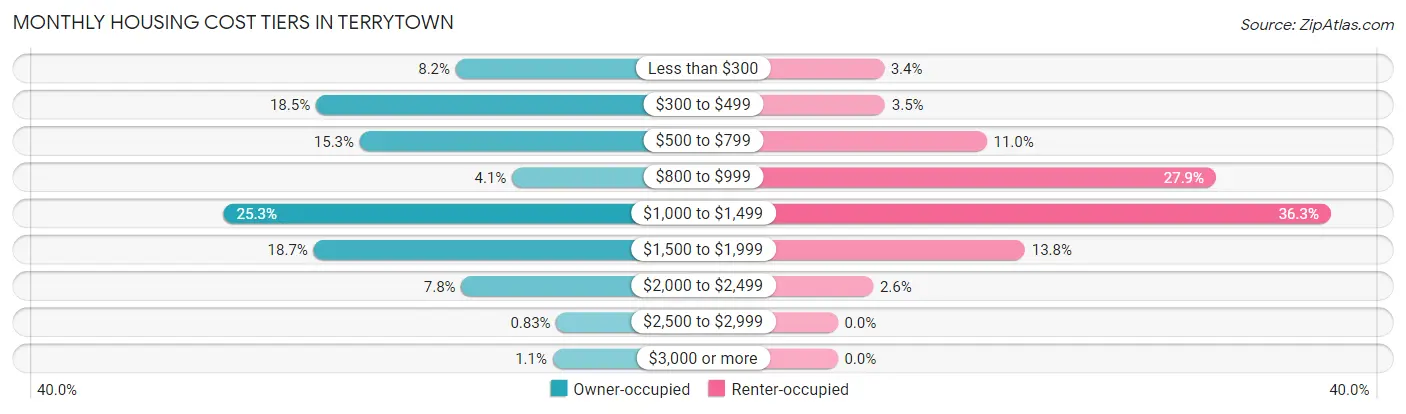
| Monthly Cost | Owner-occupied | Renter-occupied |
| Less than $300 | 337 (8.2%) | 161 (3.4%) |
| $300 to $499 | 758 (18.5%) | 165 (3.5%) |
| $500 to $799 | 626 (15.3%) | 519 (11.0%) |
| $800 to $999 | 167 (4.1%) | 1,317 (27.9%) |
| $1,000 to $1,499 | 1,036 (25.3%) | 1,717 (36.3%) |
| $1,500 to $1,999 | 765 (18.7%) | 652 (13.8%) |
| $2,000 to $2,499 | 320 (7.8%) | 124 (2.6%) |
| $2,500 to $2,999 | 34 (0.8%) | 0 (0.0%) |
| $3,000 or more | 45 (1.1%) | 0 (0.0%) |
| Total | 4,088 (100.0%) | 4,726 (100.0%) |
Physical Housing Characteristics in Terrytown
Housing Structures in Terrytown
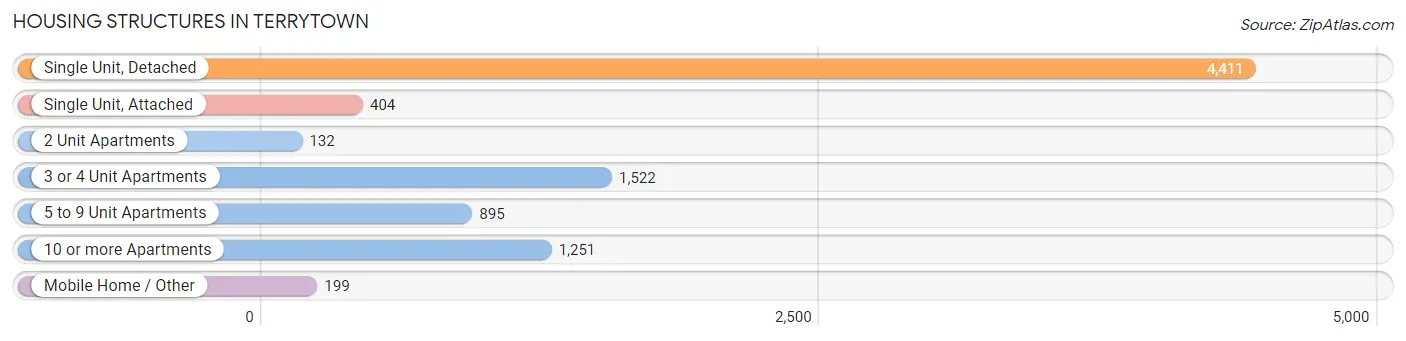
| Structure Type | # Housing Units | % Housing Units |
| Single Unit, Detached | 4,411 | 50.0% |
| Single Unit, Attached | 404 | 4.6% |
| 2 Unit Apartments | 132 | 1.5% |
| 3 or 4 Unit Apartments | 1,522 | 17.3% |
| 5 to 9 Unit Apartments | 895 | 10.2% |
| 10 or more Apartments | 1,251 | 14.2% |
| Mobile Home / Other | 199 | 2.3% |
| Total | 8,814 | 100.0% |
Housing Structures by Occupancy in Terrytown
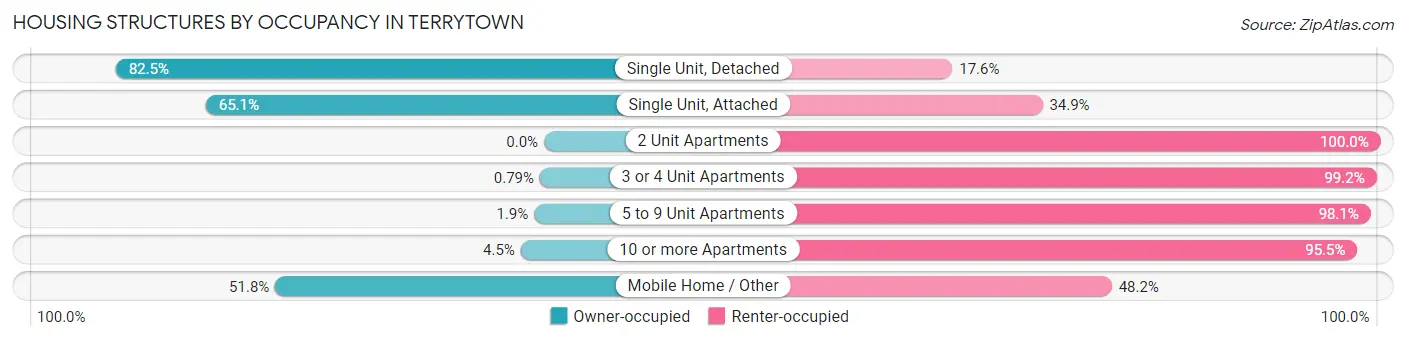
| Structure Type | Owner-occupied | Renter-occupied |
| Single Unit, Detached | 3,637 (82.5%) | 774 (17.5%) |
| Single Unit, Attached | 263 (65.1%) | 141 (34.9%) |
| 2 Unit Apartments | 0 (0.0%) | 132 (100.0%) |
| 3 or 4 Unit Apartments | 12 (0.8%) | 1,510 (99.2%) |
| 5 to 9 Unit Apartments | 17 (1.9%) | 878 (98.1%) |
| 10 or more Apartments | 56 (4.5%) | 1,195 (95.5%) |
| Mobile Home / Other | 103 (51.8%) | 96 (48.2%) |
| Total | 4,088 (46.4%) | 4,726 (53.6%) |
Housing Structures by Number of Rooms in Terrytown
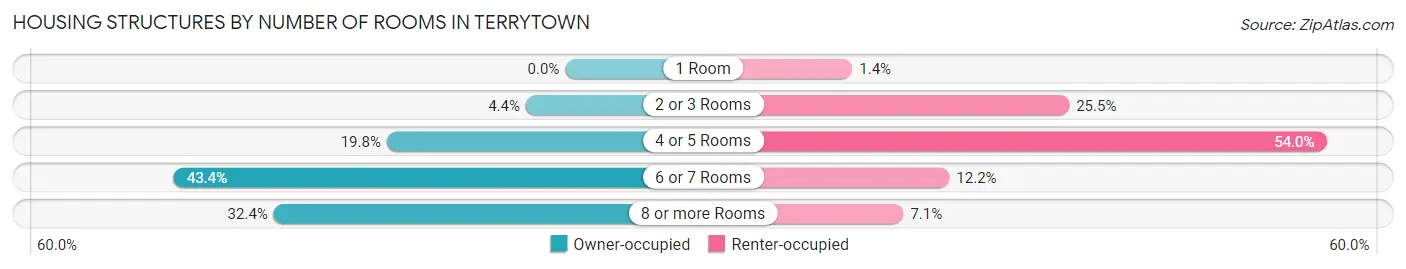
| Number of Rooms | Owner-occupied | Renter-occupied |
| 1 Room | 0 (0.0%) | 65 (1.4%) |
| 2 or 3 Rooms | 179 (4.4%) | 1,203 (25.5%) |
| 4 or 5 Rooms | 810 (19.8%) | 2,551 (54.0%) |
| 6 or 7 Rooms | 1,776 (43.4%) | 574 (12.1%) |
| 8 or more Rooms | 1,323 (32.4%) | 333 (7.0%) |
| Total | 4,088 (100.0%) | 4,726 (100.0%) |
Housing Structure by Heating Type in Terrytown
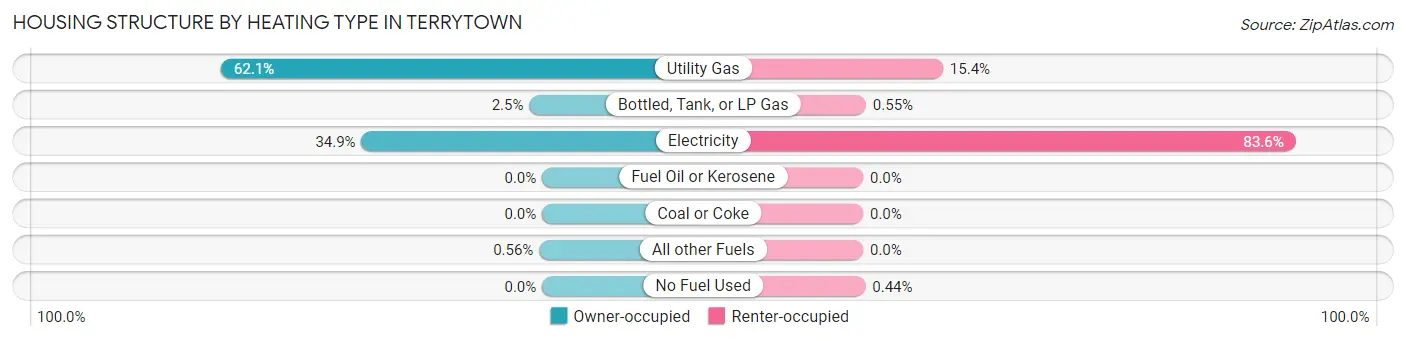
| Heating Type | Owner-occupied | Renter-occupied |
| Utility Gas | 2,537 (62.1%) | 729 (15.4%) |
| Bottled, Tank, or LP Gas | 101 (2.5%) | 26 (0.5%) |
| Electricity | 1,427 (34.9%) | 3,950 (83.6%) |
| Fuel Oil or Kerosene | 0 (0.0%) | 0 (0.0%) |
| Coal or Coke | 0 (0.0%) | 0 (0.0%) |
| All other Fuels | 23 (0.6%) | 0 (0.0%) |
| No Fuel Used | 0 (0.0%) | 21 (0.4%) |
| Total | 4,088 (100.0%) | 4,726 (100.0%) |
Household Vehicle Usage in Terrytown
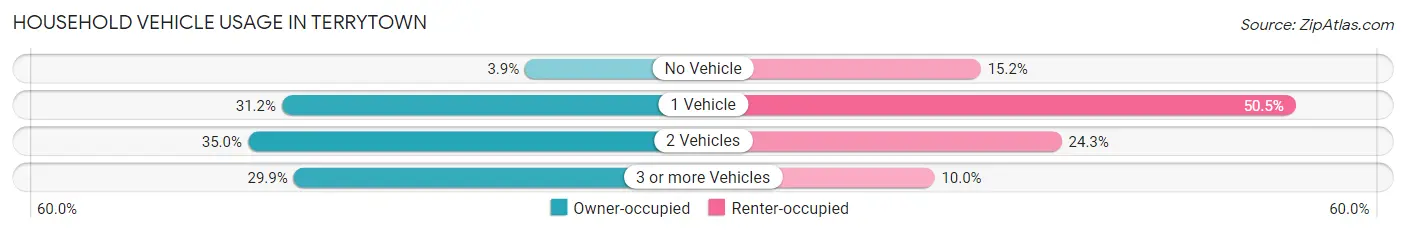
| Vehicles per Household | Owner-occupied | Renter-occupied |
| No Vehicle | 161 (3.9%) | 719 (15.2%) |
| 1 Vehicle | 1,275 (31.2%) | 2,386 (50.5%) |
| 2 Vehicles | 1,431 (35.0%) | 1,147 (24.3%) |
| 3 or more Vehicles | 1,221 (29.9%) | 474 (10.0%) |
| Total | 4,088 (100.0%) | 4,726 (100.0%) |
Real Estate & Mortgages in Terrytown
Real Estate and Mortgage Overview in Terrytown
| Characteristic | Without Mortgage | With Mortgage |
| Housing Units | 1,664 | 2,424 |
| Median Property Value | $194,700 | $206,400 |
| Median Household Income | $60,000 | $592 |
| Monthly Housing Costs | $443 | $17 |
| Real Estate Taxes | $716 | $71 |
Property Value by Mortgage Status in Terrytown
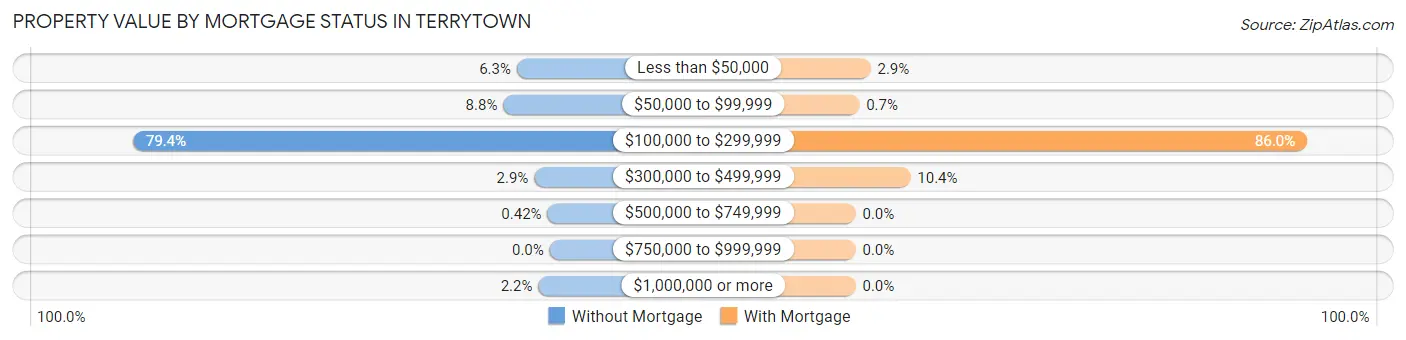
| Property Value | Without Mortgage | With Mortgage |
| Less than $50,000 | 104 (6.2%) | 69 (2.9%) |
| $50,000 to $99,999 | 147 (8.8%) | 17 (0.7%) |
| $100,000 to $299,999 | 1,321 (79.4%) | 2,085 (86.0%) |
| $300,000 to $499,999 | 49 (2.9%) | 253 (10.4%) |
| $500,000 to $749,999 | 7 (0.4%) | 0 (0.0%) |
| $750,000 to $999,999 | 0 (0.0%) | 0 (0.0%) |
| $1,000,000 or more | 36 (2.2%) | 0 (0.0%) |
| Total | 1,664 (100.0%) | 2,424 (100.0%) |
Household Income by Mortgage Status in Terrytown
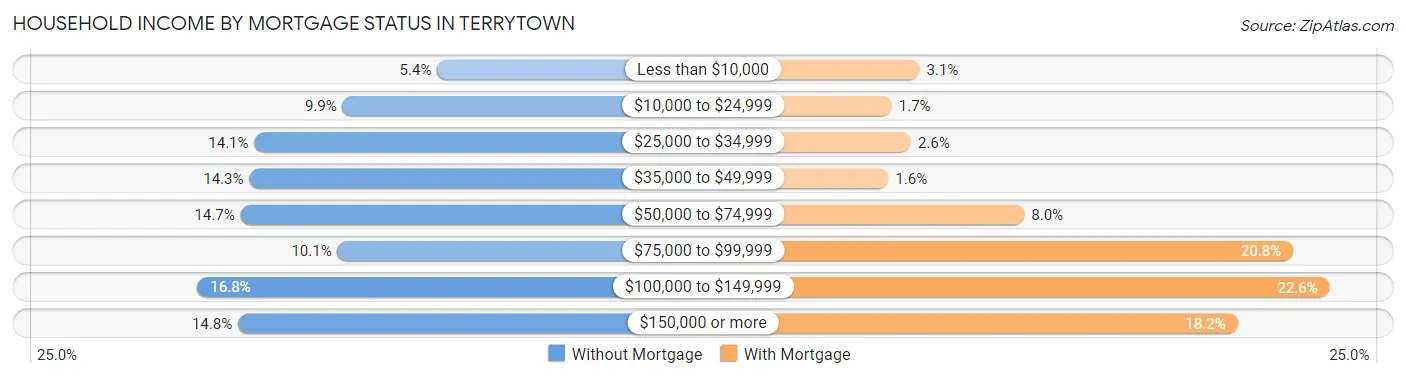
| Household Income | Without Mortgage | With Mortgage |
| Less than $10,000 | 89 (5.3%) | 74 (3.0%) |
| $10,000 to $24,999 | 164 (9.9%) | 42 (1.7%) |
| $25,000 to $34,999 | 234 (14.1%) | 64 (2.6%) |
| $35,000 to $49,999 | 238 (14.3%) | 38 (1.6%) |
| $50,000 to $74,999 | 245 (14.7%) | 195 (8.0%) |
| $75,000 to $99,999 | 168 (10.1%) | 505 (20.8%) |
| $100,000 to $149,999 | 279 (16.8%) | 547 (22.6%) |
| $150,000 or more | 247 (14.8%) | 441 (18.2%) |
| Total | 1,664 (100.0%) | 2,424 (100.0%) |
Property Value to Household Income Ratio in Terrytown
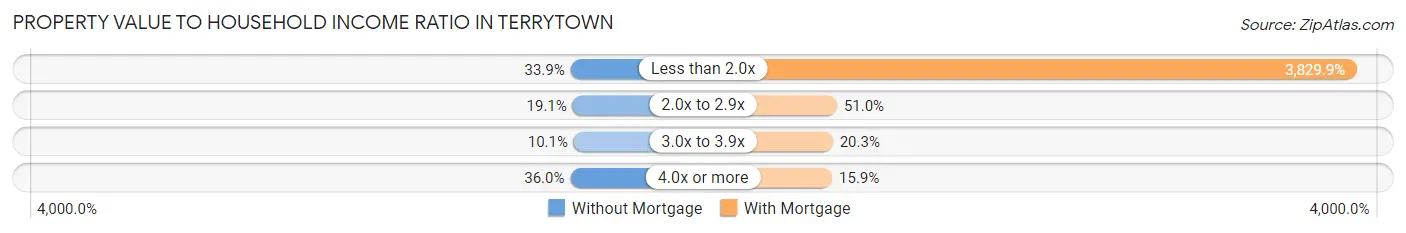
| Value-to-Income Ratio | Without Mortgage | With Mortgage |
| Less than 2.0x | 564 (33.9%) | 92,837 (3,829.9%) |
| 2.0x to 2.9x | 318 (19.1%) | 1,236 (51.0%) |
| 3.0x to 3.9x | 168 (10.1%) | 493 (20.3%) |
| 4.0x or more | 599 (36.0%) | 386 (15.9%) |
| Total | 1,664 (100.0%) | 2,424 (100.0%) |
Real Estate Taxes by Mortgage Status in Terrytown
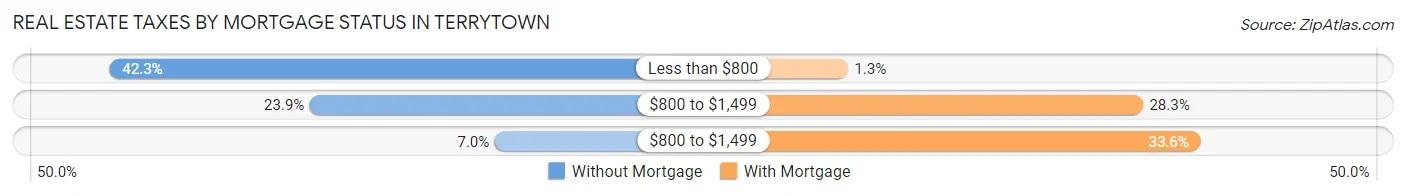
| Property Taxes | Without Mortgage | With Mortgage |
| Less than $800 | 703 (42.2%) | 32 (1.3%) |
| $800 to $1,499 | 398 (23.9%) | 685 (28.3%) |
| $800 to $1,499 | 117 (7.0%) | 814 (33.6%) |
| Total | 1,664 (100.0%) | 2,424 (100.0%) |
Health & Disability in Terrytown
Health Insurance Coverage by Age in Terrytown
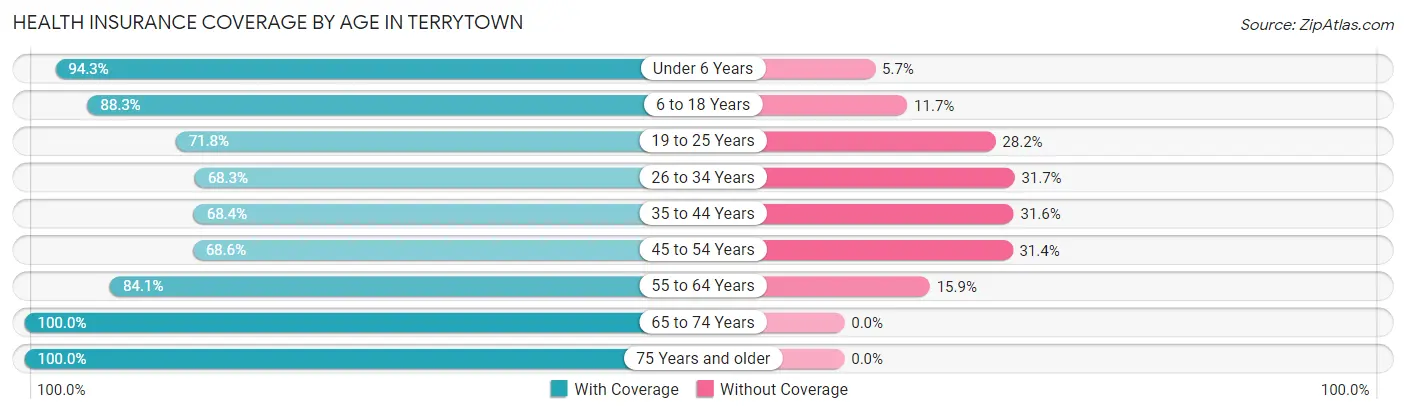
| Age Bracket | With Coverage | Without Coverage |
| Under 6 Years | 3,021 (94.3%) | 184 (5.7%) |
| 6 to 18 Years | 3,855 (88.3%) | 512 (11.7%) |
| 19 to 25 Years | 1,715 (71.8%) | 673 (28.2%) |
| 26 to 34 Years | 2,461 (68.3%) | 1,144 (31.7%) |
| 35 to 44 Years | 2,542 (68.4%) | 1,172 (31.6%) |
| 45 to 54 Years | 1,983 (68.6%) | 906 (31.4%) |
| 55 to 64 Years | 2,502 (84.1%) | 474 (15.9%) |
| 65 to 74 Years | 1,593 (100.0%) | 0 (0.0%) |
| 75 Years and older | 1,236 (100.0%) | 0 (0.0%) |
| Total | 20,908 (80.5%) | 5,065 (19.5%) |
Health Insurance Coverage by Citizenship Status in Terrytown
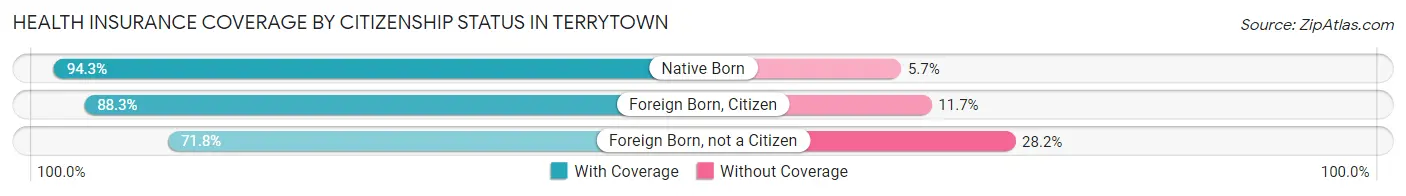
| Citizenship Status | With Coverage | Without Coverage |
| Native Born | 3,021 (94.3%) | 184 (5.7%) |
| Foreign Born, Citizen | 3,855 (88.3%) | 512 (11.7%) |
| Foreign Born, not a Citizen | 1,715 (71.8%) | 673 (28.2%) |
Health Insurance Coverage by Household Income in Terrytown
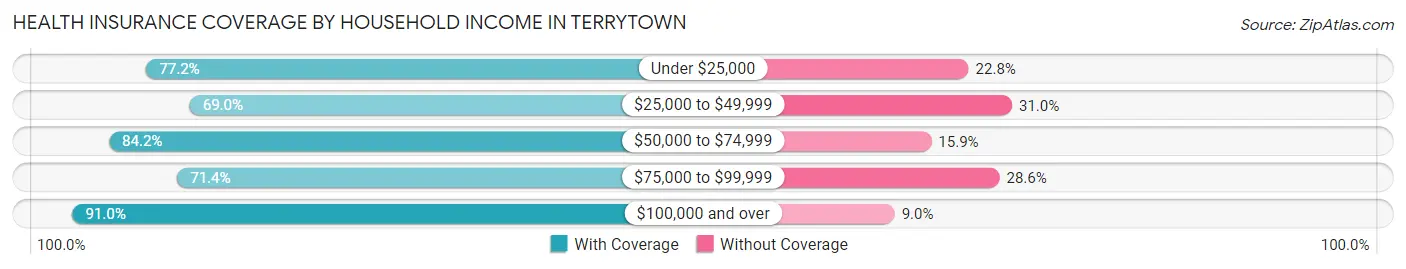
| Household Income | With Coverage | Without Coverage |
| Under $25,000 | 2,447 (77.2%) | 724 (22.8%) |
| $25,000 to $49,999 | 3,829 (69.0%) | 1,717 (31.0%) |
| $50,000 to $74,999 | 3,896 (84.2%) | 734 (15.9%) |
| $75,000 to $99,999 | 2,748 (71.4%) | 1,102 (28.6%) |
| $100,000 and over | 7,966 (91.0%) | 786 (9.0%) |
Public vs Private Health Insurance Coverage by Age in Terrytown
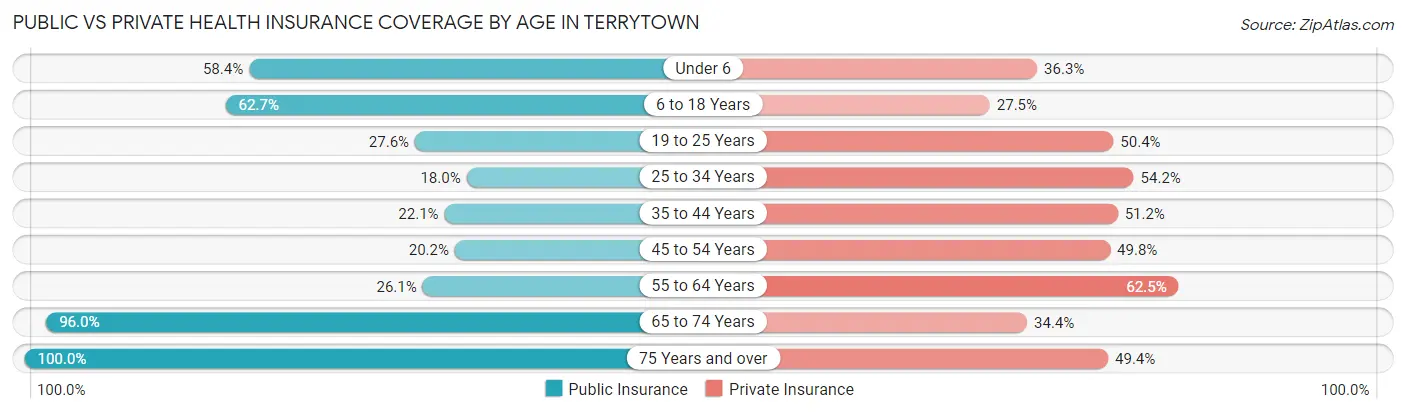
| Age Bracket | Public Insurance | Private Insurance |
| Under 6 | 1,870 (58.4%) | 1,162 (36.3%) |
| 6 to 18 Years | 2,738 (62.7%) | 1,200 (27.5%) |
| 19 to 25 Years | 658 (27.6%) | 1,204 (50.4%) |
| 25 to 34 Years | 648 (18.0%) | 1,953 (54.2%) |
| 35 to 44 Years | 820 (22.1%) | 1,902 (51.2%) |
| 45 to 54 Years | 582 (20.2%) | 1,439 (49.8%) |
| 55 to 64 Years | 778 (26.1%) | 1,860 (62.5%) |
| 65 to 74 Years | 1,529 (96.0%) | 548 (34.4%) |
| 75 Years and over | 1,236 (100.0%) | 611 (49.4%) |
| Total | 10,859 (41.8%) | 11,879 (45.7%) |
Disability Status by Sex by Age in Terrytown
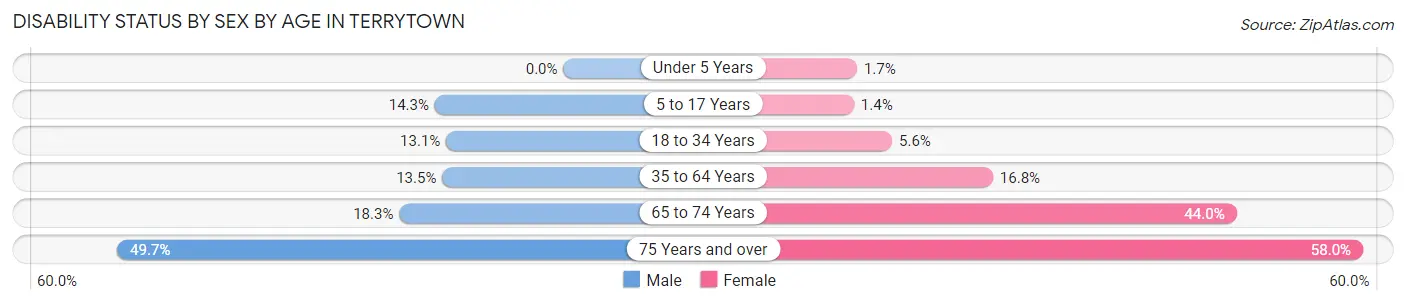
| Age Bracket | Male | Female |
| Under 5 Years | 0 (0.0%) | 26 (1.7%) |
| 5 to 17 Years | 365 (14.3%) | 27 (1.3%) |
| 18 to 34 Years | 390 (13.1%) | 177 (5.6%) |
| 35 to 64 Years | 655 (13.5%) | 795 (16.8%) |
| 65 to 74 Years | 134 (18.3%) | 378 (44.0%) |
| 75 Years and over | 317 (49.7%) | 347 (58.0%) |
Disability Class by Sex by Age in Terrytown
Disability Class: Hearing Difficulty
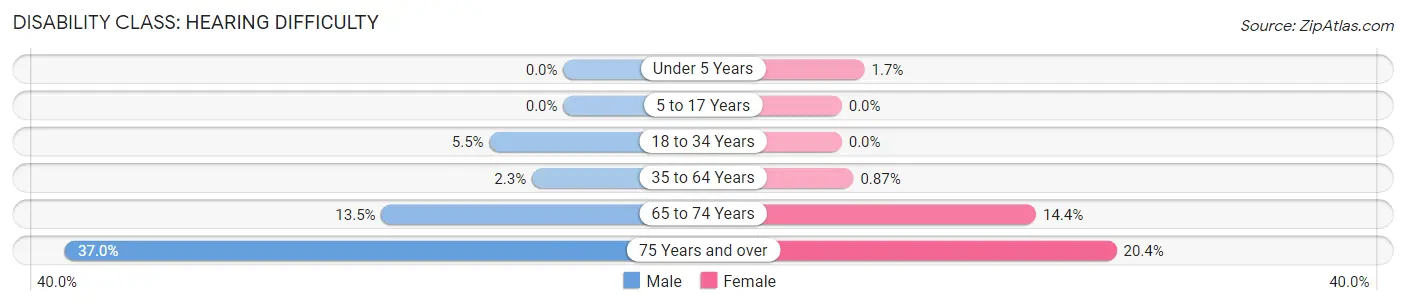
| Age Bracket | Male | Female |
| Under 5 Years | 0 (0.0%) | 26 (1.7%) |
| 5 to 17 Years | 0 (0.0%) | 0 (0.0%) |
| 18 to 34 Years | 164 (5.5%) | 0 (0.0%) |
| 35 to 64 Years | 113 (2.3%) | 41 (0.9%) |
| 65 to 74 Years | 99 (13.5%) | 124 (14.4%) |
| 75 Years and over | 236 (37.0%) | 122 (20.4%) |
Disability Class: Vision Difficulty
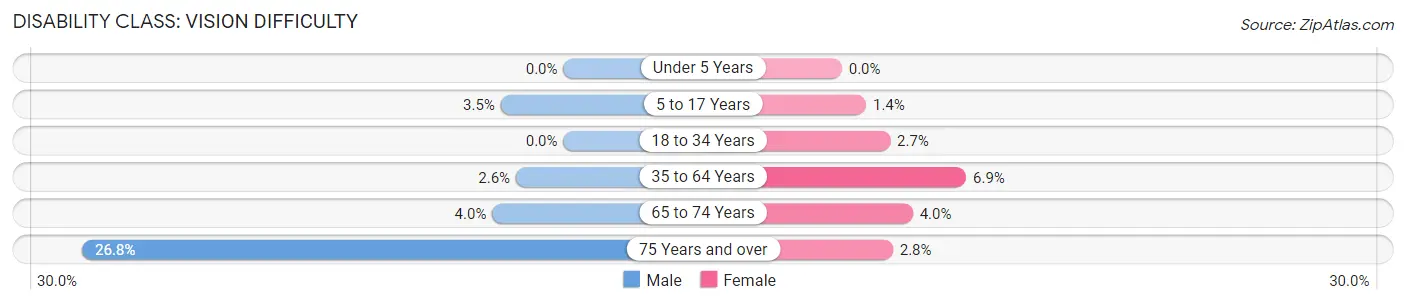
| Age Bracket | Male | Female |
| Under 5 Years | 0 (0.0%) | 0 (0.0%) |
| 5 to 17 Years | 89 (3.5%) | 27 (1.3%) |
| 18 to 34 Years | 0 (0.0%) | 85 (2.7%) |
| 35 to 64 Years | 128 (2.6%) | 327 (6.9%) |
| 65 to 74 Years | 29 (4.0%) | 34 (4.0%) |
| 75 Years and over | 171 (26.8%) | 17 (2.8%) |
Disability Class: Cognitive Difficulty
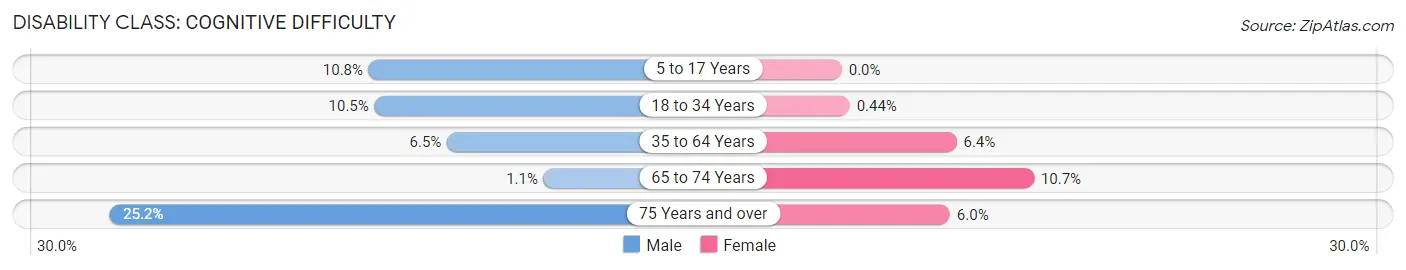
| Age Bracket | Male | Female |
| 5 to 17 Years | 276 (10.8%) | 0 (0.0%) |
| 18 to 34 Years | 314 (10.5%) | 14 (0.4%) |
| 35 to 64 Years | 314 (6.5%) | 302 (6.4%) |
| 65 to 74 Years | 8 (1.1%) | 92 (10.7%) |
| 75 Years and over | 161 (25.2%) | 36 (6.0%) |
Disability Class: Ambulatory Difficulty
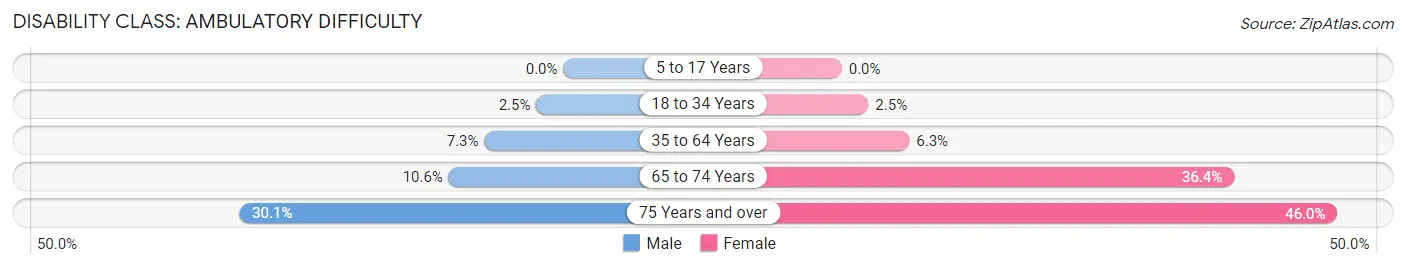
| Age Bracket | Male | Female |
| 5 to 17 Years | 0 (0.0%) | 0 (0.0%) |
| 18 to 34 Years | 75 (2.5%) | 78 (2.5%) |
| 35 to 64 Years | 356 (7.3%) | 296 (6.3%) |
| 65 to 74 Years | 78 (10.6%) | 313 (36.4%) |
| 75 Years and over | 192 (30.1%) | 275 (46.0%) |
Disability Class: Self-Care Difficulty
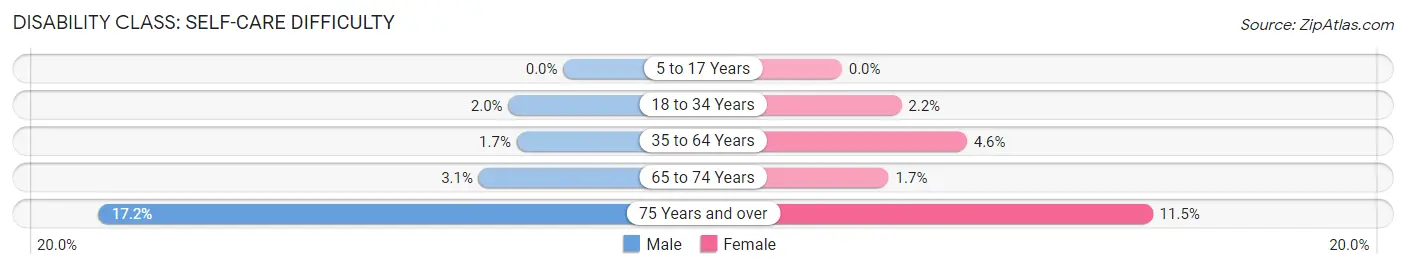
| Age Bracket | Male | Female |
| 5 to 17 Years | 0 (0.0%) | 0 (0.0%) |
| 18 to 34 Years | 61 (2.0%) | 70 (2.2%) |
| 35 to 64 Years | 84 (1.7%) | 219 (4.6%) |
| 65 to 74 Years | 23 (3.1%) | 15 (1.7%) |
| 75 Years and over | 110 (17.2%) | 69 (11.5%) |
Technology Access in Terrytown
Computing Device Access in Terrytown
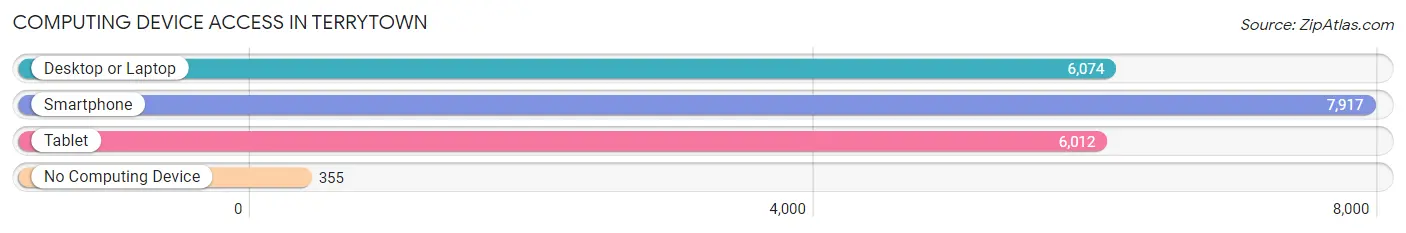
| Device Type | # Households | % Households |
| Desktop or Laptop | 6,074 | 68.9% |
| Smartphone | 7,917 | 89.8% |
| Tablet | 6,012 | 68.2% |
| No Computing Device | 355 | 4.0% |
| Total | 8,814 | 100.0% |
Internet Access in Terrytown
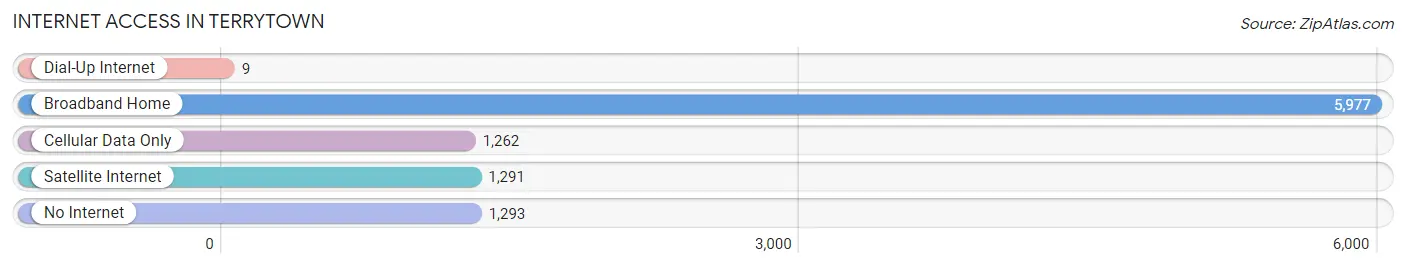
| Internet Type | # Households | % Households |
| Dial-Up Internet | 9 | 0.1% |
| Broadband Home | 5,977 | 67.8% |
| Cellular Data Only | 1,262 | 14.3% |
| Satellite Internet | 1,291 | 14.6% |
| No Internet | 1,293 | 14.7% |
| Total | 8,814 | 100.0% |
Terrytown Summary
Tucked away in the suburbs of New Orleans, Terrytown is a small city in Jefferson Parish, Louisiana. With a population of just over 21,000, Terrytown is a tight-knit community with a rich history and culture.
History
Terrytown was founded in the late 1950s by developer and entrepreneur, William Terry. Terry purchased the land from the local parish and began developing the area into a residential community. The city was named after Terry and incorporated in 1960.
In the early years, Terrytown was a small, rural community with a population of just over 1,000. As the city grew, it became a popular destination for families looking for affordable housing and a safe place to raise their children.
In the 1970s, Terrytown began to experience rapid growth. The population increased from 1,000 to over 10,000 in just a few years. This growth was largely due to the influx of people from New Orleans who were looking for a safe place to live after Hurricane Katrina.
Geography
Terrytown is located in Jefferson Parish, Louisiana, just west of New Orleans. The city is situated on the banks of the Mississippi River and is bordered by the cities of Gretna, Harvey, and Marrero.
The city has a total area of 4.2 square miles, with 0.2 square miles of water. The terrain is mostly flat, with some rolling hills in the northern part of the city.
Economy
Terrytown’s economy is largely based on the service industry. The city is home to a variety of restaurants, retail stores, and other businesses. The city also has a large industrial park, which is home to several manufacturing and distribution companies.
The city’s largest employer is the Jefferson Parish School Board, which employs over 1,000 people. Other major employers include Ochsner Health System, Walmart, and the City of Terrytown.
Demographics
As of the 2010 census, the population of Terrytown was 21,265. The racial makeup of the city was 57.3% White, 33.2% African American, 0.5% Native American, 2.2% Asian, 0.1% Pacific Islander, and 6.7% from other races. Hispanic or Latino of any race were 11.3% of the population.
The median household income in Terrytown was $41,945, and the median family income was $50,945. The per capita income was $20,945. About 17.2% of families and 20.3% of the population were below the poverty line.
Terrytown is a diverse city with a rich history and culture. The city has experienced rapid growth in recent years, and is now home to a vibrant economy and a diverse population. With its close proximity to New Orleans, Terrytown is an ideal place to live for those looking for a safe and affordable place to call home.
Common Questions
What is Per Capita Income in Terrytown?
Per Capita income in Terrytown is $25,768.
What is the Median Family Income in Terrytown?
Median Family Income in Terrytown is $76,833.
What is the Median Household income in Terrytown?
Median Household Income in Terrytown is $56,877.
What is Income or Wage Gap in Terrytown?
Income or Wage Gap in Terrytown is 8.0%.
Women in Terrytown earn 92.0 cents for every dollar earned by a man.
What is Family Income Deficit in Terrytown?
Family Income Deficit in Terrytown is $8,946.
Families that are below poverty line in Terrytown earn $8,946 less on average than the poverty threshold level.
What is Inequality or Gini Index in Terrytown?
Inequality or Gini Index in Terrytown is 0.41.
What is the Total Population of Terrytown?
Total Population of Terrytown is 26,105.
What is the Total Male Population of Terrytown?
Total Male Population of Terrytown is 13,219.
What is the Total Female Population of Terrytown?
Total Female Population of Terrytown is 12,886.
What is the Ratio of Males per 100 Females in Terrytown?
There are 102.58 Males per 100 Females in Terrytown.
What is the Ratio of Females per 100 Males in Terrytown?
There are 97.48 Females per 100 Males in Terrytown.
What is the Median Population Age in Terrytown?
Median Population Age in Terrytown is 33.9 Years.
What is the Average Family Size in Terrytown
Average Family Size in Terrytown is 3.8 People.
What is the Average Household Size in Terrytown
Average Household Size in Terrytown is 3.0 People.
How Large is the Labor Force in Terrytown?
There are 13,649 People in the Labor Forcein in Terrytown.
What is the Percentage of People in the Labor Force in Terrytown?
69.9% of People are in the Labor Force in Terrytown.
What is the Unemployment Rate in Terrytown?
Unemployment Rate in Terrytown is 8.3%.