Shenandoah, LA Map & Demographics
Shenandoah Map
Shenandoah Overview
$48,493
PER CAPITA INCOME
$118,890
AVG FAMILY INCOME
$103,130
AVG HOUSEHOLD INCOME
29.3%
WAGE / INCOME GAP [ % ]
70.7¢/ $1
WAGE / INCOME GAP [ $ ]
0.42
INEQUALITY / GINI INDEX
18,561
TOTAL POPULATION
8,451
MALE POPULATION
10,110
FEMALE POPULATION
83.59
MALES / 100 FEMALES
119.63
FEMALES / 100 MALES
39.5
MEDIAN AGE
3.2
AVG FAMILY SIZE
2.6
AVG HOUSEHOLD SIZE
9,934
LABOR FORCE [ PEOPLE ]
69.2%
PERCENT IN LABOR FORCE
5.3%
UNEMPLOYMENT RATE
Income in Shenandoah
Income Overview in Shenandoah
Per Capita Income in Shenandoah is $48,493, while median incomes of families and households are $118,890 and $103,130 respectively.
| Characteristic | Number | Measure |
| Per Capita Income | 18,561 | $48,493 |
| Median Family Income | 5,169 | $118,890 |
| Mean Family Income | 5,169 | $145,658 |
| Median Household Income | 7,041 | $103,130 |
| Mean Household Income | 7,041 | $125,989 |
| Income Deficit | 5,169 | $0 |
| Wage / Income Gap (%) | 18,561 | 29.32% |
| Wage / Income Gap ($) | 18,561 | 70.68¢ per $1 |
| Gini / Inequality Index | 18,561 | 0.42 |
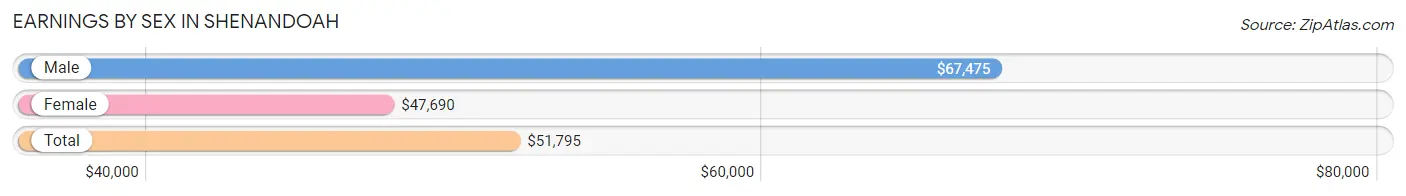
Earnings by Sex in Shenandoah
Average Earnings in Shenandoah are $51,795, $67,475 for men and $47,690 for women, a difference of 29.3%.
| Sex | Number | Average Earnings |
| Male | 5,278 (51.4%) | $67,475 |
| Female | 4,995 (48.6%) | $47,690 |
| Total | 10,273 (100.0%) | $51,795 |
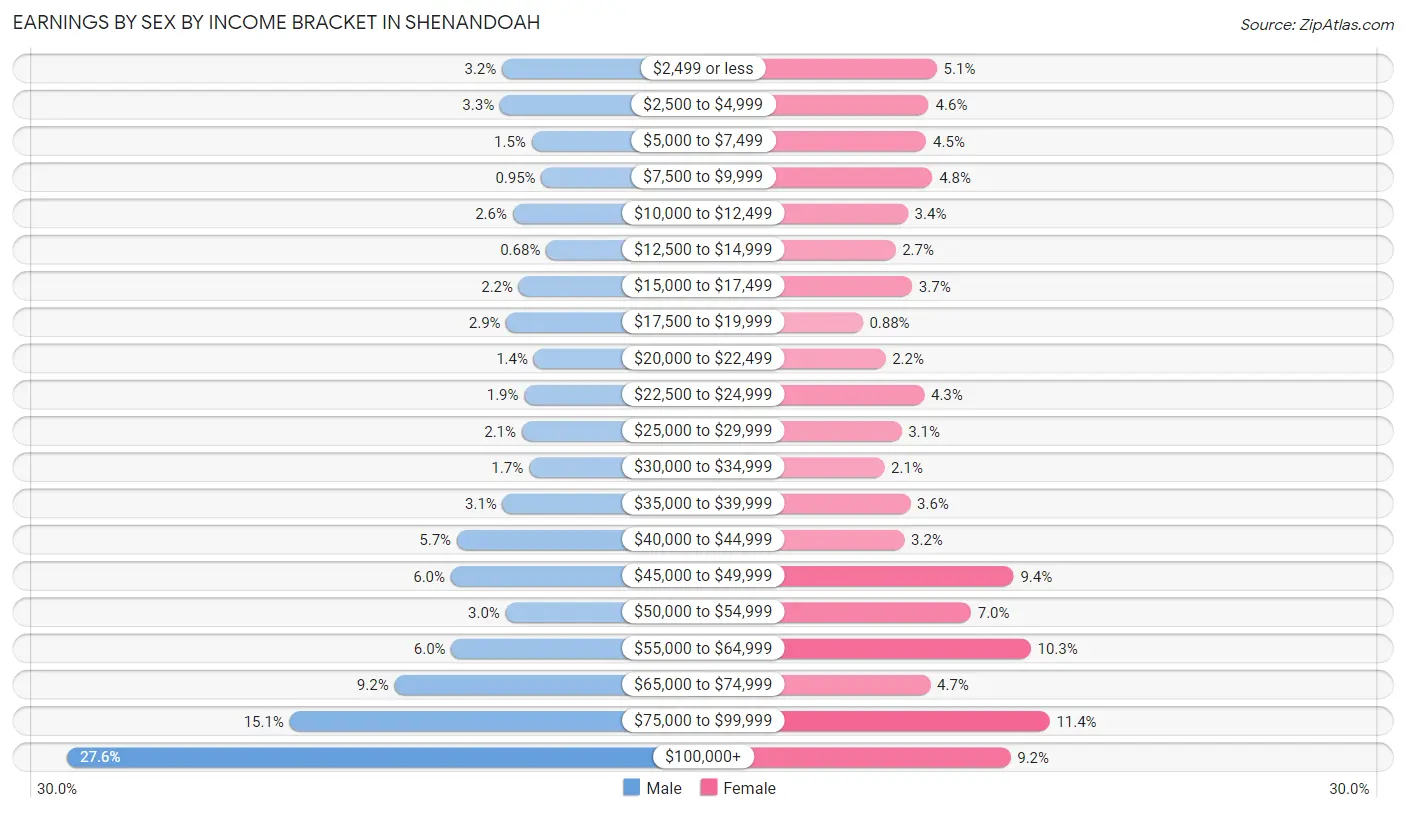
Earnings by Sex by Income Bracket in Shenandoah
The most common earnings brackets in Shenandoah are $100,000+ for men (1,457 | 27.6%) and $75,000 to $99,999 for women (569 | 11.4%).
| Income | Male | Female |
| $2,499 or less | 167 (3.2%) | 252 (5.1%) |
| $2,500 to $4,999 | 173 (3.3%) | 230 (4.6%) |
| $5,000 to $7,499 | 79 (1.5%) | 223 (4.5%) |
| $7,500 to $9,999 | 50 (0.9%) | 240 (4.8%) |
| $10,000 to $12,499 | 135 (2.6%) | 171 (3.4%) |
| $12,500 to $14,999 | 36 (0.7%) | 136 (2.7%) |
| $15,000 to $17,499 | 117 (2.2%) | 183 (3.7%) |
| $17,500 to $19,999 | 154 (2.9%) | 44 (0.9%) |
| $20,000 to $22,499 | 73 (1.4%) | 108 (2.2%) |
| $22,500 to $24,999 | 101 (1.9%) | 217 (4.3%) |
| $25,000 to $29,999 | 108 (2.1%) | 153 (3.1%) |
| $30,000 to $34,999 | 87 (1.7%) | 105 (2.1%) |
| $35,000 to $39,999 | 165 (3.1%) | 178 (3.6%) |
| $40,000 to $44,999 | 301 (5.7%) | 161 (3.2%) |
| $45,000 to $49,999 | 319 (6.0%) | 468 (9.4%) |
| $50,000 to $54,999 | 156 (3.0%) | 348 (7.0%) |
| $55,000 to $64,999 | 317 (6.0%) | 516 (10.3%) |
| $65,000 to $74,999 | 486 (9.2%) | 234 (4.7%) |
| $75,000 to $99,999 | 797 (15.1%) | 569 (11.4%) |
| $100,000+ | 1,457 (27.6%) | 459 (9.2%) |
| Total | 5,278 (100.0%) | 4,995 (100.0%) |
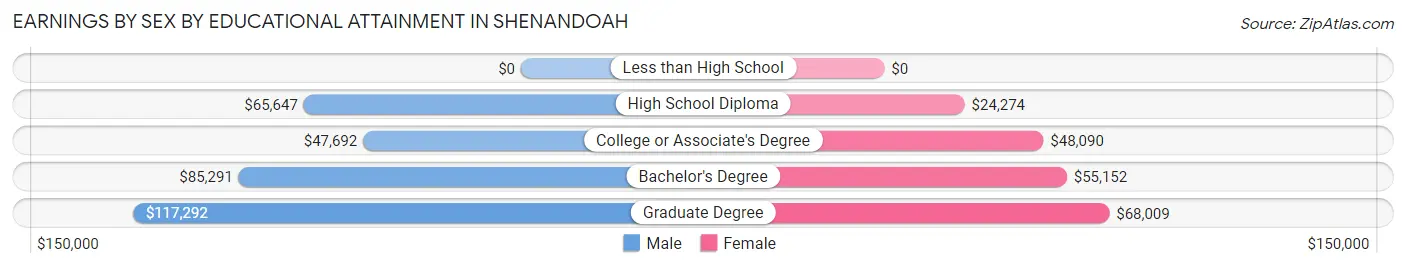
Earnings by Sex by Educational Attainment in Shenandoah
Average earnings in Shenandoah are $73,125 for men and $49,366 for women, a difference of 32.5%. Men with an educational attainment of graduate degree enjoy the highest average annual earnings of $117,292, while those with college or associate's degree education earn the least with $47,692. Women with an educational attainment of graduate degree earn the most with the average annual earnings of $68,009, while those with high school diploma education have the smallest earnings of $24,274.
| Educational Attainment | Male Income | Female Income |
| Less than High School | - | - |
| High School Diploma | $65,647 | $24,274 |
| College or Associate's Degree | $47,692 | $48,090 |
| Bachelor's Degree | $85,291 | $55,152 |
| Graduate Degree | $117,292 | $68,009 |
| Total | $73,125 | $49,366 |
Family Income in Shenandoah
Family Income Brackets in Shenandoah
According to the Shenandoah family income data, there are 1,406 families falling into the $100,000 to $149,999 income range, which is the most common income bracket and makes up 27.2% of all families. Conversely, the $10,000 to $14,999 income bracket is the least frequent group with only 57 families (1.1%) belonging to this category.
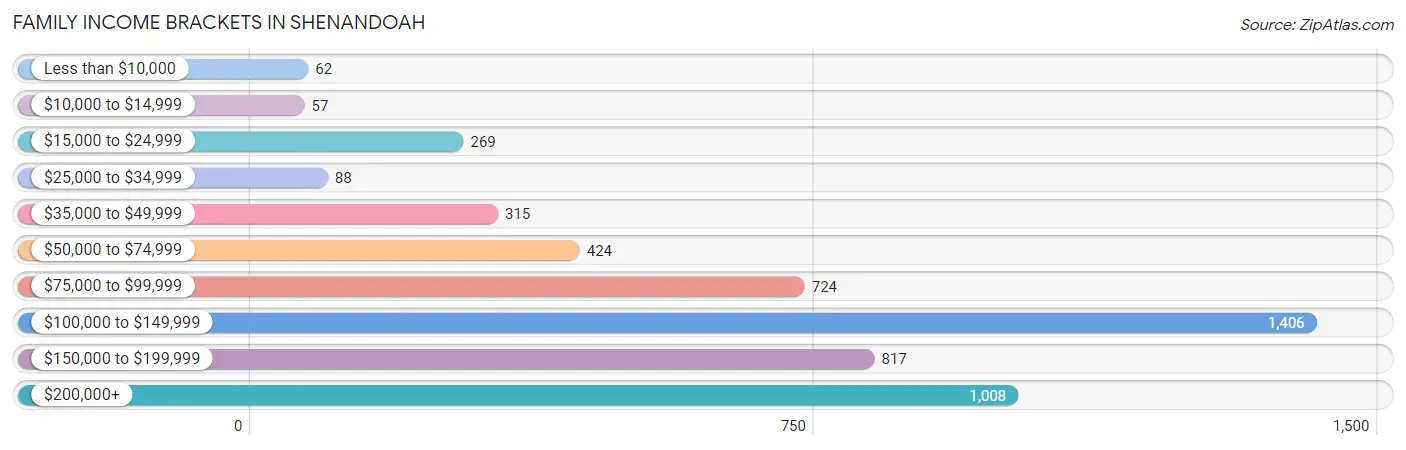
| Income Bracket | # Families | % Families |
| Less than $10,000 | 62 | 1.2% |
| $10,000 to $14,999 | 57 | 1.1% |
| $15,000 to $24,999 | 269 | 5.2% |
| $25,000 to $34,999 | 88 | 1.7% |
| $35,000 to $49,999 | 315 | 6.1% |
| $50,000 to $74,999 | 424 | 8.2% |
| $75,000 to $99,999 | 724 | 14.0% |
| $100,000 to $149,999 | 1,406 | 27.2% |
| $150,000 to $199,999 | 817 | 15.8% |
| $200,000+ | 1,008 | 19.5% |
Family Income by Famaliy Size in Shenandoah
6-person families (94 | 1.8%) account for the highest median family income in Shenandoah with $167,813 per family, while 2-person families (2,799 | 54.1%) have the highest median income of $54,702 per family member.
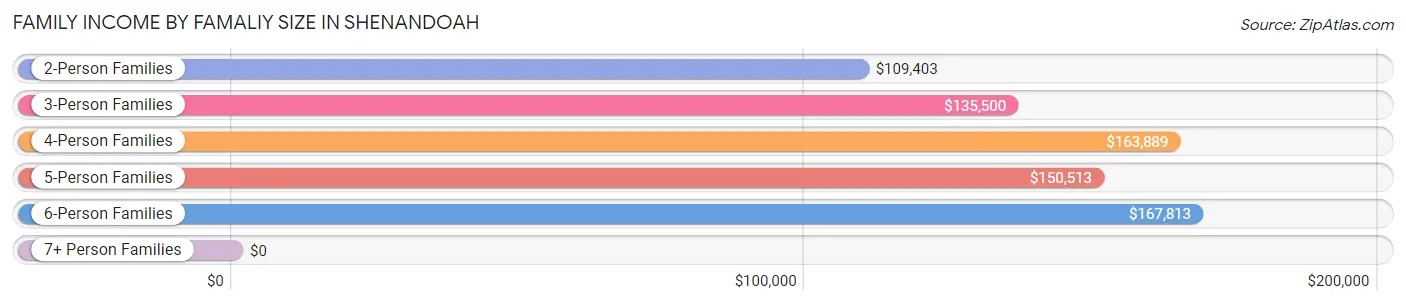
| Income Bracket | # Families | Median Income |
| 2-Person Families | 2,799 (54.1%) | $109,403 |
| 3-Person Families | 1,170 (22.6%) | $135,500 |
| 4-Person Families | 660 (12.8%) | $163,889 |
| 5-Person Families | 392 (7.6%) | $150,513 |
| 6-Person Families | 94 (1.8%) | $167,813 |
| 7+ Person Families | 54 (1.0%) | $0 |
| Total | 5,169 (100.0%) | $118,890 |
Family Income by Number of Earners in Shenandoah
The median family income in Shenandoah is $118,890, with families comprising 3+ earners (593) having the highest median family income of $202,614, while families with 1 earner (1,324) have the lowest median family income of $73,750, accounting for 11.5% and 25.6% of families, respectively.
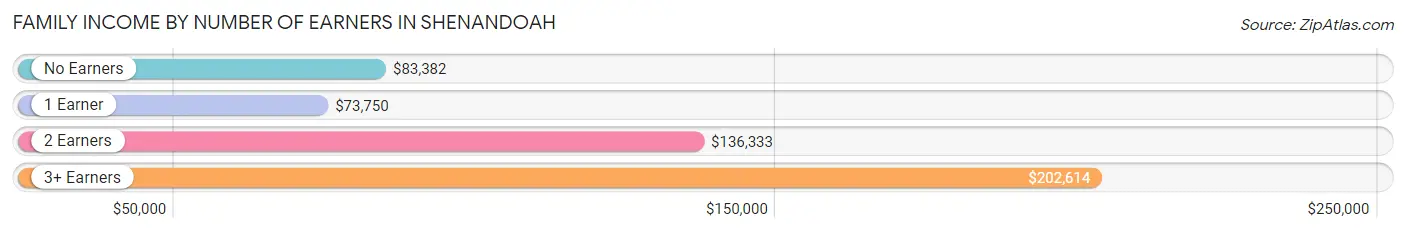
| Number of Earners | # Families | Median Income |
| No Earners | 740 (14.3%) | $83,382 |
| 1 Earner | 1,324 (25.6%) | $73,750 |
| 2 Earners | 2,512 (48.6%) | $136,333 |
| 3+ Earners | 593 (11.5%) | $202,614 |
| Total | 5,169 (100.0%) | $118,890 |
Household Income in Shenandoah
Household Income Brackets in Shenandoah
With 1,648 households falling in the category, the $100,000 to $149,999 income range is the most frequent in Shenandoah, accounting for 23.4% of all households. In contrast, only 49 households (0.7%) fall into the $10,000 to $14,999 income bracket, making it the least populous group.
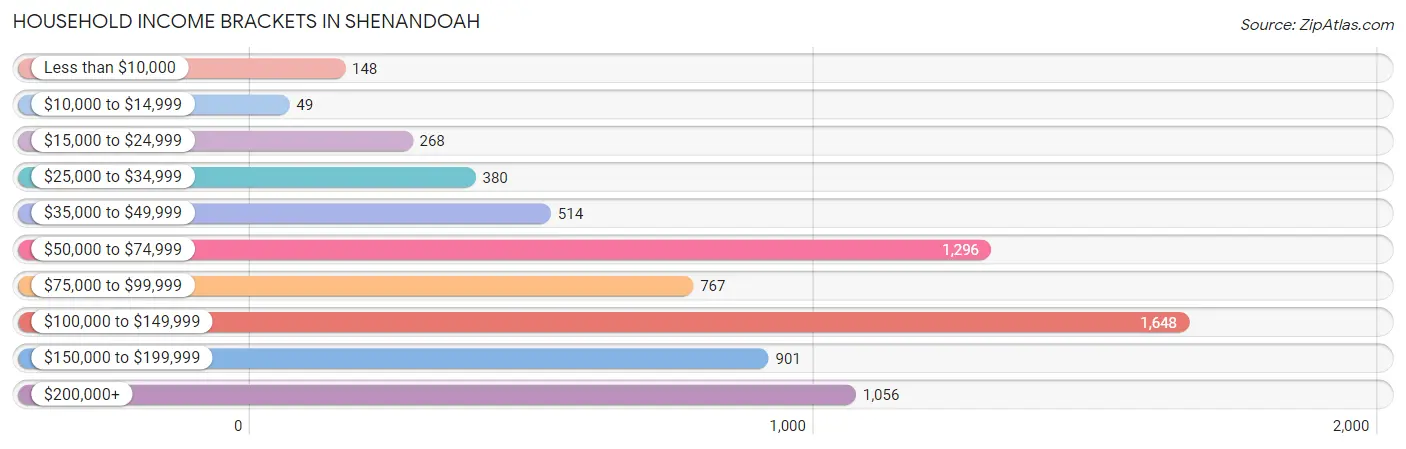
| Income Bracket | # Households | % Households |
| Less than $10,000 | 148 | 2.1% |
| $10,000 to $14,999 | 49 | 0.7% |
| $15,000 to $24,999 | 268 | 3.8% |
| $25,000 to $34,999 | 380 | 5.4% |
| $35,000 to $49,999 | 514 | 7.3% |
| $50,000 to $74,999 | 1,296 | 18.4% |
| $75,000 to $99,999 | 767 | 10.9% |
| $100,000 to $149,999 | 1,648 | 23.4% |
| $150,000 to $199,999 | 901 | 12.8% |
| $200,000+ | 1,056 | 15.0% |
Household Income by Householder Age in Shenandoah
The median household income in Shenandoah is $103,130, with the highest median household income of $136,094 found in the 45 to 64 years age bracket for the primary householder. A total of 2,287 households (32.5%) fall into this category. Meanwhile, the 15 to 24 years age bracket for the primary householder has the lowest median household income of $0, with 78 households (1.1%) in this group.
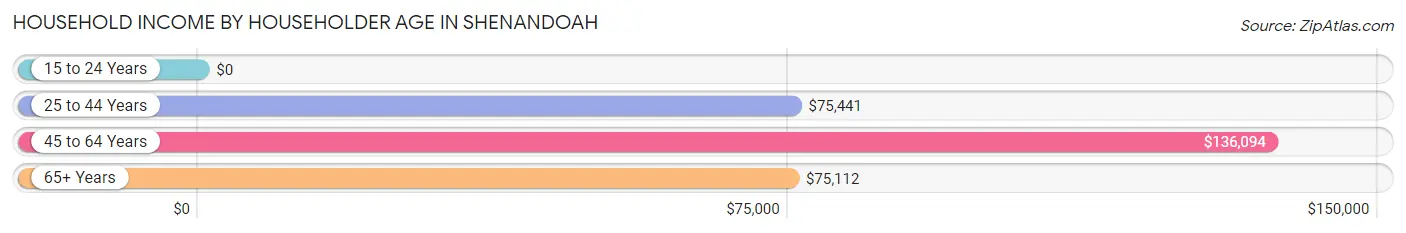
| Income Bracket | # Households | Median Income |
| 15 to 24 Years | 78 (1.1%) | $0 |
| 25 to 44 Years | 2,640 (37.5%) | $75,441 |
| 45 to 64 Years | 2,287 (32.5%) | $136,094 |
| 65+ Years | 2,036 (28.9%) | $75,112 |
| Total | 7,041 (100.0%) | $103,130 |
Poverty in Shenandoah
Income Below Poverty by Sex and Age in Shenandoah
With 7.2% poverty level for males and 7.9% for females among the residents of Shenandoah, 5 year old males and 6 to 11 year old females are the most vulnerable to poverty, with 84 males (73.7%) and 168 females (28.1%) in their respective age groups living below the poverty level.
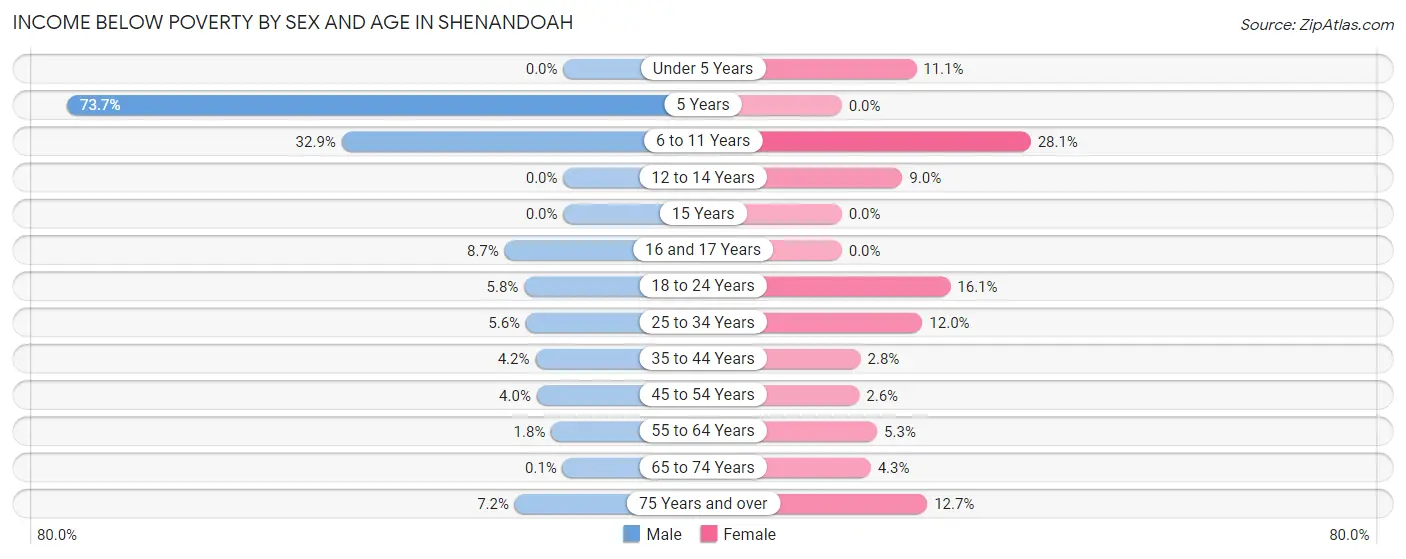
| Age Bracket | Male | Female |
| Under 5 Years | 0 (0.0%) | 77 (11.1%) |
| 5 Years | 84 (73.7%) | 0 (0.0%) |
| 6 to 11 Years | 264 (32.9%) | 168 (28.1%) |
| 12 to 14 Years | 0 (0.0%) | 36 (9.0%) |
| 15 Years | 0 (0.0%) | 0 (0.0%) |
| 16 and 17 Years | 15 (8.7%) | 0 (0.0%) |
| 18 to 24 Years | 36 (5.8%) | 74 (16.1%) |
| 25 to 34 Years | 56 (5.6%) | 181 (12.0%) |
| 35 to 44 Years | 54 (4.2%) | 29 (2.8%) |
| 45 to 54 Years | 42 (4.0%) | 25 (2.6%) |
| 55 to 64 Years | 23 (1.8%) | 71 (5.2%) |
| 65 to 74 Years | 1 (0.1%) | 53 (4.3%) |
| 75 Years and over | 30 (7.2%) | 86 (12.7%) |
| Total | 605 (7.2%) | 800 (7.9%) |
Income Above Poverty by Sex and Age in Shenandoah
According to the poverty statistics in Shenandoah, males aged under 5 years and females aged 5 years are the age groups that are most secure financially, with 100.0% of males and 100.0% of females in these age groups living above the poverty line.
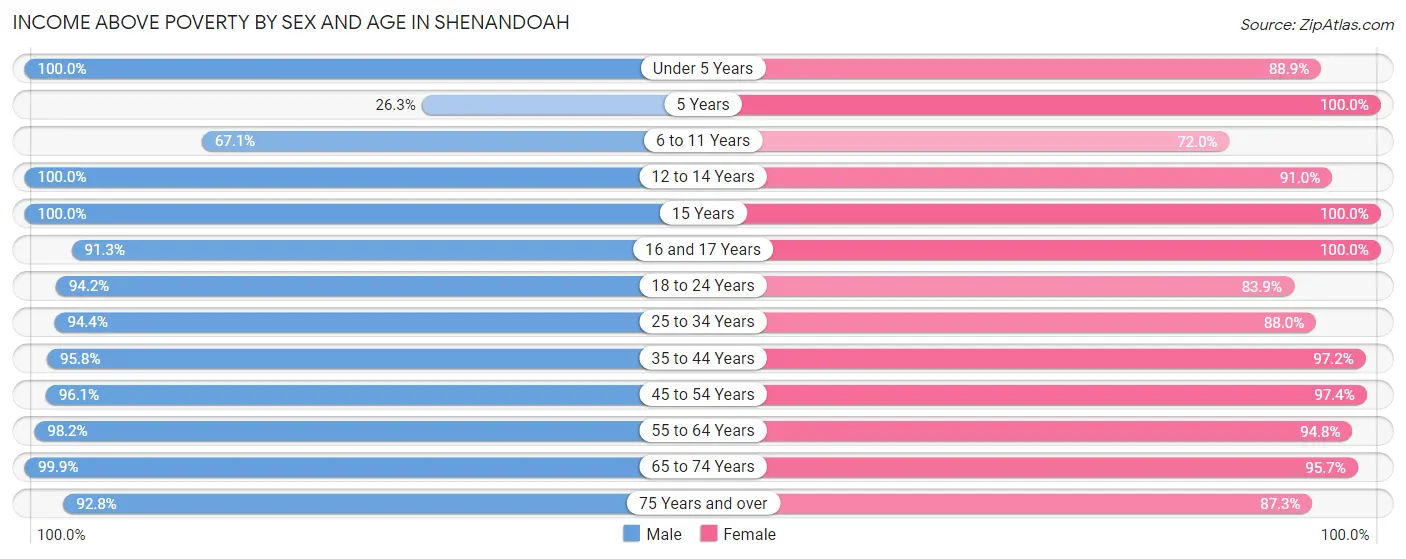
| Age Bracket | Male | Female |
| Under 5 Years | 348 (100.0%) | 619 (88.9%) |
| 5 Years | 30 (26.3%) | 877 (100.0%) |
| 6 to 11 Years | 538 (67.1%) | 431 (72.0%) |
| 12 to 14 Years | 236 (100.0%) | 364 (91.0%) |
| 15 Years | 65 (100.0%) | 69 (100.0%) |
| 16 and 17 Years | 157 (91.3%) | 232 (100.0%) |
| 18 to 24 Years | 583 (94.2%) | 385 (83.9%) |
| 25 to 34 Years | 951 (94.4%) | 1,331 (88.0%) |
| 35 to 44 Years | 1,241 (95.8%) | 1,009 (97.2%) |
| 45 to 54 Years | 1,020 (96.1%) | 933 (97.4%) |
| 55 to 64 Years | 1,252 (98.2%) | 1,281 (94.8%) |
| 65 to 74 Years | 1,036 (99.9%) | 1,181 (95.7%) |
| 75 Years and over | 386 (92.8%) | 592 (87.3%) |
| Total | 7,843 (92.8%) | 9,304 (92.1%) |
Income Below Poverty Among Married-Couple Families in Shenandoah
The poverty statistics for married-couple families in Shenandoah show that 2.1% or 91 of the total 4,304 families live below the poverty line. Families with 3 or 4 children have the highest poverty rate of 14.2%, comprising of 40 families. On the other hand, families with 5 or more children have the lowest poverty rate of 0.0%, which includes 0 families.
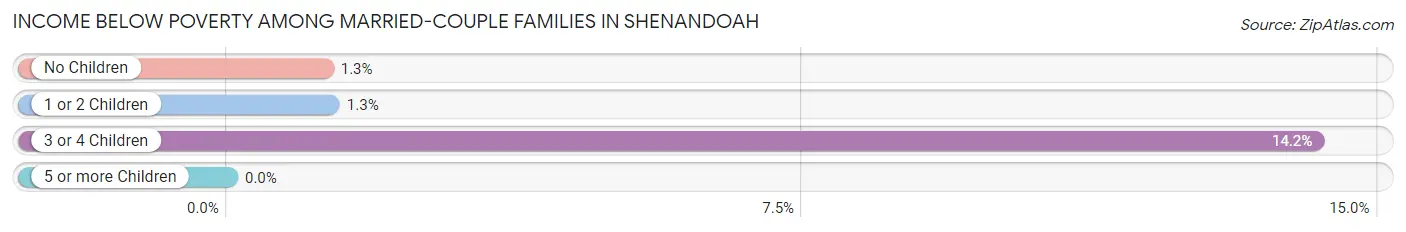
| Children | Above Poverty | Below Poverty |
| No Children | 2,924 (98.8%) | 37 (1.3%) |
| 1 or 2 Children | 1,042 (98.7%) | 14 (1.3%) |
| 3 or 4 Children | 242 (85.8%) | 40 (14.2%) |
| 5 or more Children | 5 (100.0%) | 0 (0.0%) |
| Total | 4,213 (97.9%) | 91 (2.1%) |
Income Below Poverty Among Single-Parent Households in Shenandoah
According to the poverty data in Shenandoah, 15.2% or 49 single-father households and 36.7% or 199 single-mother households are living below the poverty line. Among single-father households, those with 3 or 4 children have the highest poverty rate, with 36 households (100.0%) experiencing poverty. Likewise, among single-mother households, those with 1 or 2 children have the highest poverty rate, with 189 households (51.1%) falling below the poverty line.
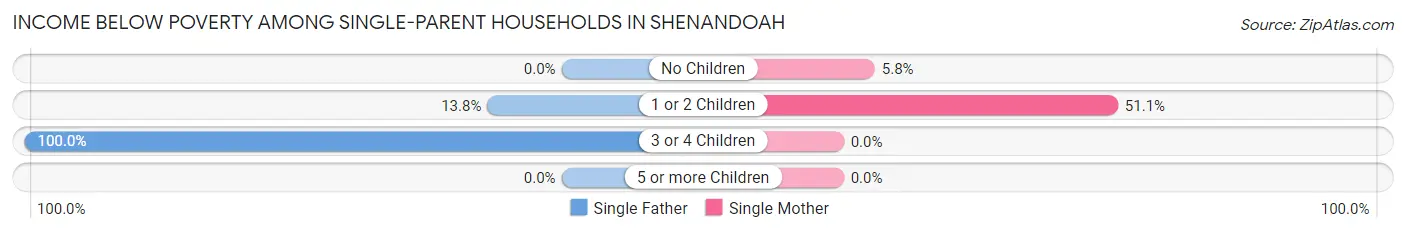
| Children | Single Father | Single Mother |
| No Children | 0 (0.0%) | 10 (5.8%) |
| 1 or 2 Children | 13 (13.8%) | 189 (51.1%) |
| 3 or 4 Children | 36 (100.0%) | 0 (0.0%) |
| 5 or more Children | 0 (0.0%) | 0 (0.0%) |
| Total | 49 (15.2%) | 199 (36.7%) |
Income Below Poverty Among Married-Couple vs Single-Parent Households in Shenandoah
The poverty data for Shenandoah shows that 91 of the married-couple family households (2.1%) and 248 of the single-parent households (28.7%) are living below the poverty level. Within the married-couple family households, those with 3 or 4 children have the highest poverty rate, with 40 households (14.2%) falling below the poverty line. Among the single-parent households, those with 3 or 4 children have the highest poverty rate, with 36 household (100.0%) living below poverty.
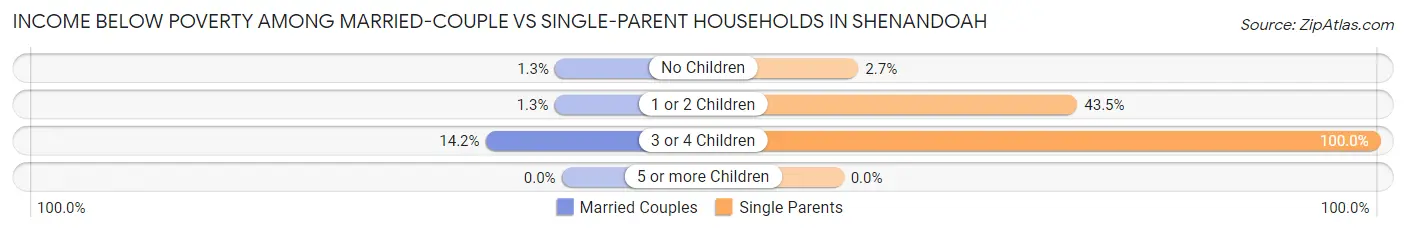
| Children | Married-Couple Families | Single-Parent Households |
| No Children | 37 (1.3%) | 10 (2.7%) |
| 1 or 2 Children | 14 (1.3%) | 202 (43.5%) |
| 3 or 4 Children | 40 (14.2%) | 36 (100.0%) |
| 5 or more Children | 0 (0.0%) | 0 (0.0%) |
| Total | 91 (2.1%) | 248 (28.7%) |
Race in Shenandoah
The most populous races in Shenandoah are White / Caucasian (12,475 | 67.2%), Black / African American (3,496 | 18.8%), and Two or more Races (1,977 | 10.6%).
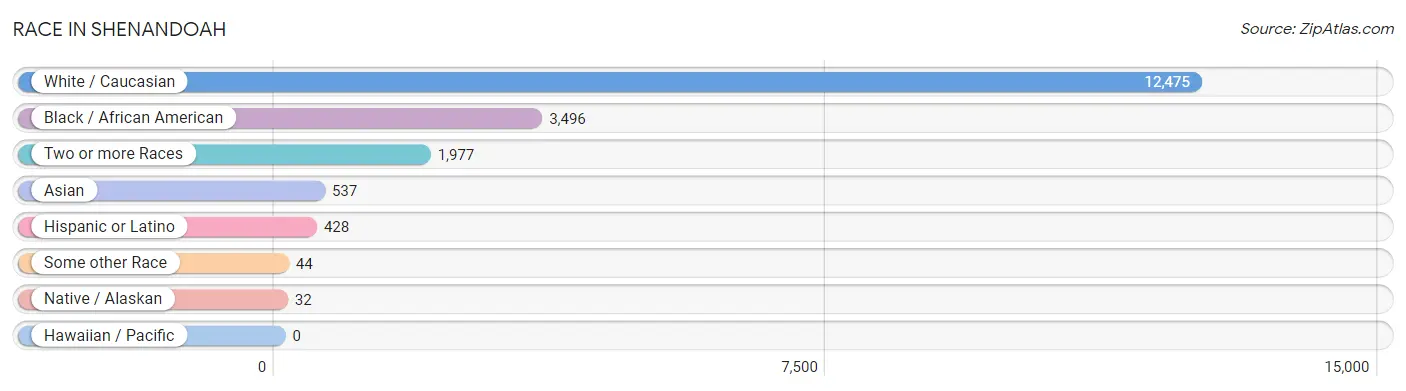
| Race | # Population | % Population |
| Asian | 537 | 2.9% |
| Black / African American | 3,496 | 18.8% |
| Hawaiian / Pacific | 0 | 0.0% |
| Hispanic or Latino | 428 | 2.3% |
| Native / Alaskan | 32 | 0.2% |
| White / Caucasian | 12,475 | 67.2% |
| Two or more Races | 1,977 | 10.6% |
| Some other Race | 44 | 0.2% |
| Total | 18,561 | 100.0% |
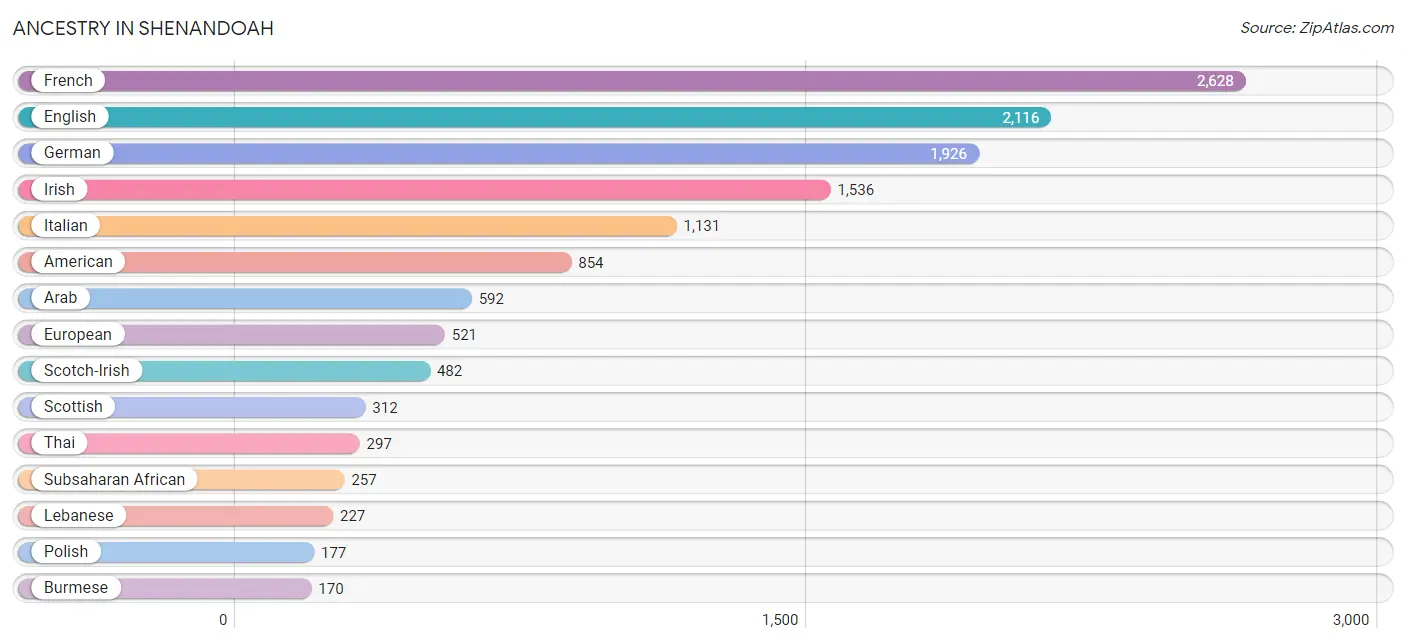
Ancestry in Shenandoah
The most populous ancestries reported in Shenandoah are French (2,628 | 14.2%), English (2,116 | 11.4%), German (1,926 | 10.4%), Irish (1,536 | 8.3%), and Italian (1,131 | 6.1%), together accounting for 50.3% of all Shenandoah residents.
| Ancestry | # Population | % Population |
| African | 150 | 0.8% |
| American | 854 | 4.6% |
| Arab | 592 | 3.2% |
| Australian | 16 | 0.1% |
| Belgian | 8 | 0.0% |
| Bhutanese | 31 | 0.2% |
| Blackfeet | 6 | 0.0% |
| Bolivian | 10 | 0.1% |
| British | 101 | 0.5% |
| Burmese | 170 | 0.9% |
| Cajun | 161 | 0.9% |
| Central American | 152 | 0.8% |
| Central American Indian | 15 | 0.1% |
| Cherokee | 50 | 0.3% |
| Choctaw | 35 | 0.2% |
| Cuban | 59 | 0.3% |
| Czech | 48 | 0.3% |
| Eastern European | 61 | 0.3% |
| English | 2,116 | 11.4% |
| European | 521 | 2.8% |
| Finnish | 3 | 0.0% |
| French | 2,628 | 14.2% |
| French Canadian | 113 | 0.6% |
| German | 1,926 | 10.4% |
| Guatemalan | 23 | 0.1% |
| Honduran | 129 | 0.7% |
| Hungarian | 14 | 0.1% |
| Indian (Asian) | 10 | 0.1% |
| Iranian | 9 | 0.1% |
| Iraqi | 51 | 0.3% |
| Irish | 1,536 | 8.3% |
| Italian | 1,131 | 6.1% |
| Laotian | 18 | 0.1% |
| Lebanese | 227 | 1.2% |
| Mexican | 139 | 0.7% |
| Northern European | 30 | 0.2% |
| Norwegian | 38 | 0.2% |
| Palestinian | 38 | 0.2% |
| Polish | 177 | 0.9% |
| Portuguese | 32 | 0.2% |
| Puerto Rican | 3 | 0.0% |
| Scandinavian | 16 | 0.1% |
| Scotch-Irish | 482 | 2.6% |
| Scottish | 312 | 1.7% |
| Slovak | 16 | 0.1% |
| South American | 24 | 0.1% |
| Spaniard | 27 | 0.2% |
| Spanish | 24 | 0.1% |
| Sri Lankan | 111 | 0.6% |
| Subsaharan African | 257 | 1.4% |
| Swedish | 142 | 0.8% |
| Swiss | 26 | 0.1% |
| Thai | 297 | 1.6% |
| Turkish | 47 | 0.3% |
| Venezuelan | 14 | 0.1% |
| Welsh | 56 | 0.3% | View All 56 Rows |
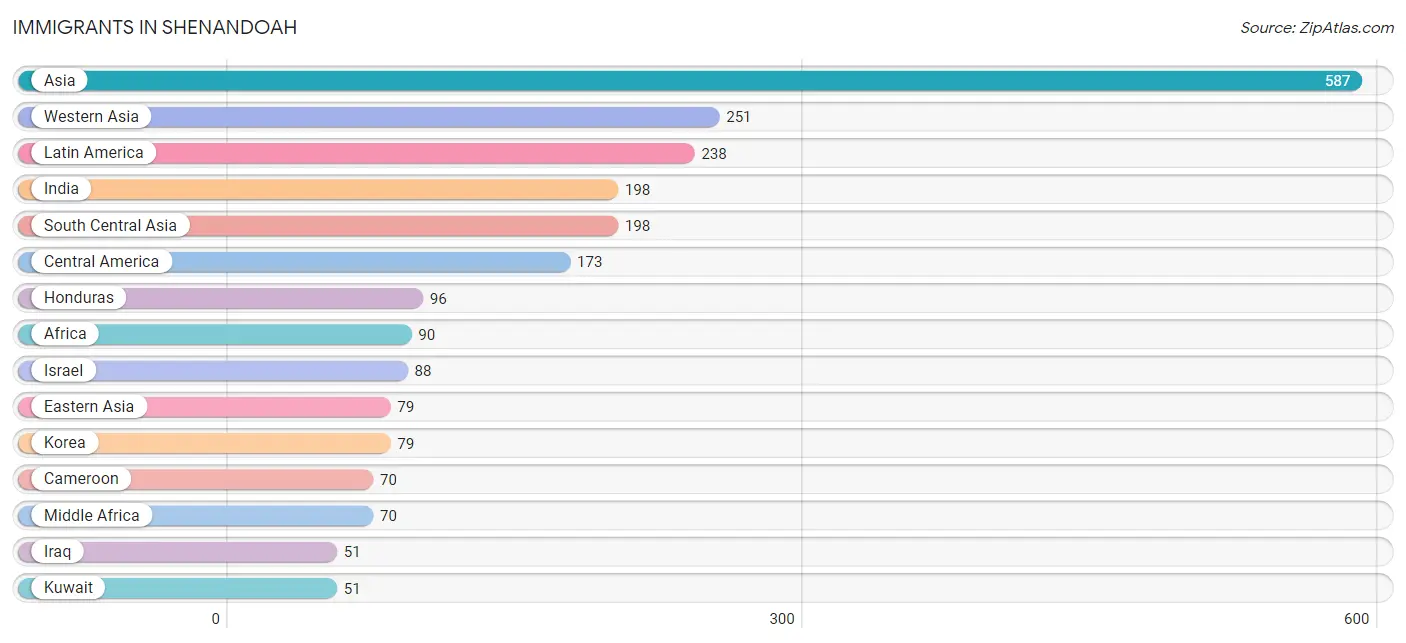
Immigrants in Shenandoah
The most numerous immigrant groups reported in Shenandoah came from Asia (587 | 3.2%), Western Asia (251 | 1.3%), Latin America (238 | 1.3%), India (198 | 1.1%), and South Central Asia (198 | 1.1%), together accounting for 7.9% of all Shenandoah residents.
| Immigration Origin | # Population | % Population |
| Africa | 90 | 0.5% |
| Asia | 587 | 3.2% |
| Australia | 18 | 0.1% |
| Bolivia | 10 | 0.1% |
| Cameroon | 70 | 0.4% |
| Caribbean | 32 | 0.2% |
| Central America | 173 | 0.9% |
| Cuba | 32 | 0.2% |
| Eastern Asia | 79 | 0.4% |
| El Salvador | 24 | 0.1% |
| England | 12 | 0.1% |
| Europe | 12 | 0.1% |
| Guatemala | 23 | 0.1% |
| Honduras | 96 | 0.5% |
| India | 198 | 1.1% |
| Indonesia | 18 | 0.1% |
| Iraq | 51 | 0.3% |
| Israel | 88 | 0.5% |
| Korea | 79 | 0.4% |
| Kuwait | 51 | 0.3% |
| Latin America | 238 | 1.3% |
| Lebanon | 48 | 0.3% |
| Mexico | 30 | 0.2% |
| Middle Africa | 70 | 0.4% |
| Northern Europe | 12 | 0.1% |
| Oceania | 18 | 0.1% |
| Philippines | 19 | 0.1% |
| Singapore | 10 | 0.1% |
| South America | 33 | 0.2% |
| South Central Asia | 198 | 1.1% |
| South Eastern Asia | 47 | 0.3% |
| Turkey | 13 | 0.1% |
| Venezuela | 23 | 0.1% |
| Western Asia | 251 | 1.3% | View All 34 Rows |
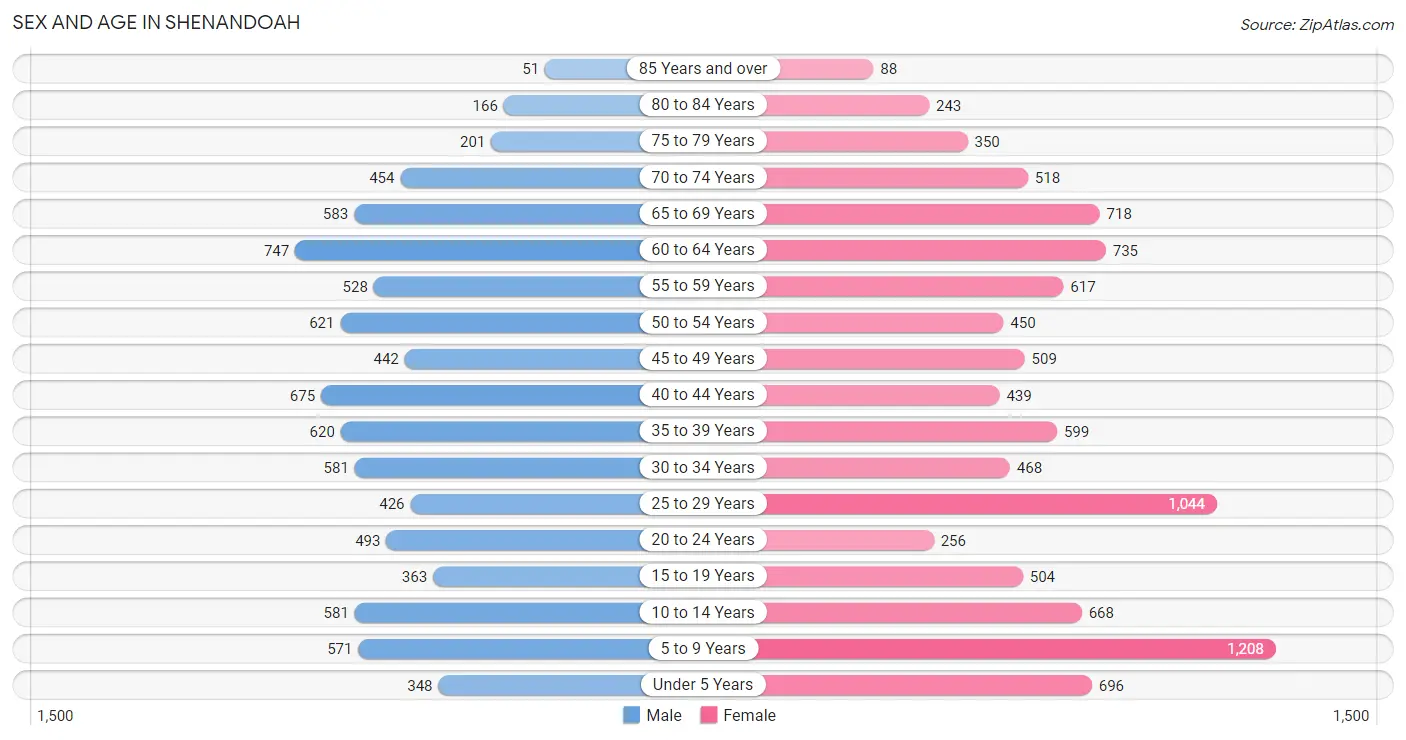
Sex and Age in Shenandoah
Sex and Age in Shenandoah
The most populous age groups in Shenandoah are 60 to 64 Years (747 | 8.8%) for men and 5 to 9 Years (1,208 | 11.9%) for women.
| Age Bracket | Male | Female |
| Under 5 Years | 348 (4.1%) | 696 (6.9%) |
| 5 to 9 Years | 571 (6.8%) | 1,208 (11.9%) |
| 10 to 14 Years | 581 (6.9%) | 668 (6.6%) |
| 15 to 19 Years | 363 (4.3%) | 504 (5.0%) |
| 20 to 24 Years | 493 (5.8%) | 256 (2.5%) |
| 25 to 29 Years | 426 (5.0%) | 1,044 (10.3%) |
| 30 to 34 Years | 581 (6.9%) | 468 (4.6%) |
| 35 to 39 Years | 620 (7.3%) | 599 (5.9%) |
| 40 to 44 Years | 675 (8.0%) | 439 (4.3%) |
| 45 to 49 Years | 442 (5.2%) | 509 (5.0%) |
| 50 to 54 Years | 621 (7.3%) | 450 (4.4%) |
| 55 to 59 Years | 528 (6.2%) | 617 (6.1%) |
| 60 to 64 Years | 747 (8.8%) | 735 (7.3%) |
| 65 to 69 Years | 583 (6.9%) | 718 (7.1%) |
| 70 to 74 Years | 454 (5.4%) | 518 (5.1%) |
| 75 to 79 Years | 201 (2.4%) | 350 (3.5%) |
| 80 to 84 Years | 166 (2.0%) | 243 (2.4%) |
| 85 Years and over | 51 (0.6%) | 88 (0.9%) |
| Total | 8,451 (100.0%) | 10,110 (100.0%) |
Families and Households in Shenandoah
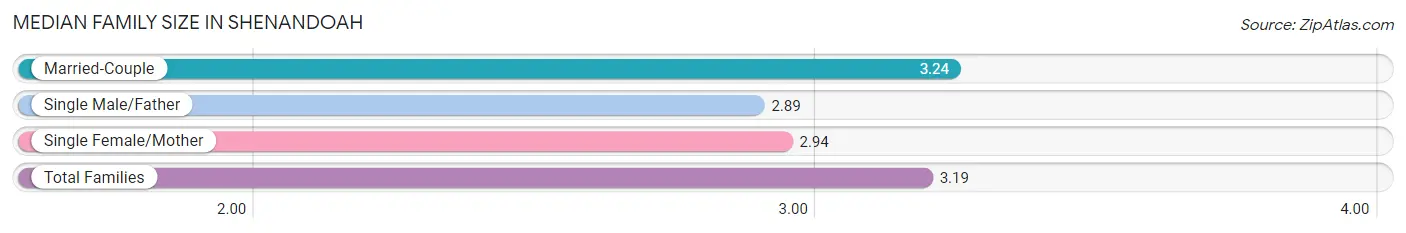
Median Family Size in Shenandoah
The median family size in Shenandoah is 3.19 persons per family, with married-couple families (4,304 | 83.3%) accounting for the largest median family size of 3.24 persons per family. On the other hand, single male/father families (323 | 6.2%) represent the smallest median family size with 2.89 persons per family.
| Family Type | # Families | Family Size |
| Married-Couple | 4,304 (83.3%) | 3.24 |
| Single Male/Father | 323 (6.2%) | 2.89 |
| Single Female/Mother | 542 (10.5%) | 2.94 |
| Total Families | 5,169 (100.0%) | 3.19 |
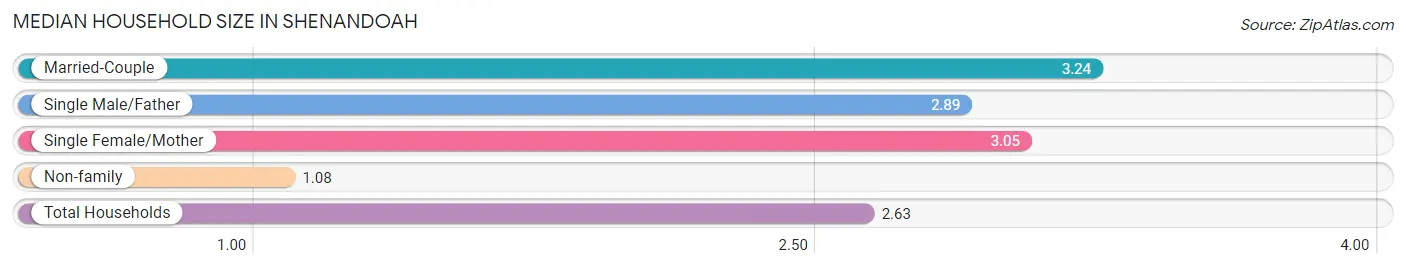
Median Household Size in Shenandoah
The median household size in Shenandoah is 2.63 persons per household, with married-couple households (4,304 | 61.1%) accounting for the largest median household size of 3.24 persons per household. non-family households (1,872 | 26.6%) represent the smallest median household size with 1.08 persons per household.
| Household Type | # Households | Household Size |
| Married-Couple | 4,304 (61.1%) | 3.24 |
| Single Male/Father | 323 (4.6%) | 2.89 |
| Single Female/Mother | 542 (7.7%) | 3.05 |
| Non-family | 1,872 (26.6%) | 1.08 |
| Total Households | 7,041 (100.0%) | 2.63 |
Household Size by Marriage Status in Shenandoah
Out of a total of 7,041 households in Shenandoah, 5,169 (73.4%) are family households, while 1,872 (26.6%) are nonfamily households. The most numerous type of family households are 2-person households, comprising 2,783, and the most common type of nonfamily households are 1-person households, comprising 1,436.
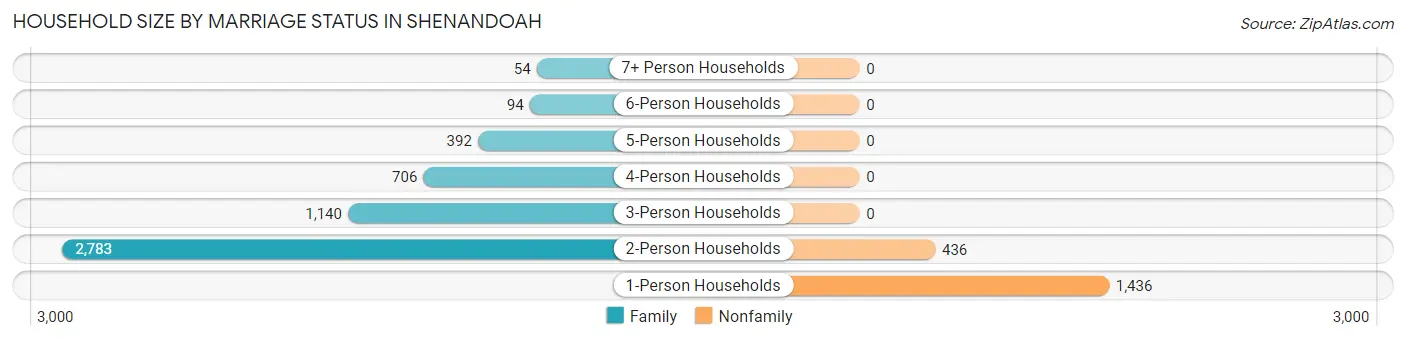
| Household Size | Family Households | Nonfamily Households |
| 1-Person Households | - | 1,436 (20.4%) |
| 2-Person Households | 2,783 (39.5%) | 436 (6.2%) |
| 3-Person Households | 1,140 (16.2%) | 0 (0.0%) |
| 4-Person Households | 706 (10.0%) | 0 (0.0%) |
| 5-Person Households | 392 (5.6%) | 0 (0.0%) |
| 6-Person Households | 94 (1.3%) | 0 (0.0%) |
| 7+ Person Households | 54 (0.8%) | 0 (0.0%) |
| Total | 5,169 (73.4%) | 1,872 (26.6%) |
Female Fertility in Shenandoah
Fertility by Age in Shenandoah
Average fertility rate in Shenandoah is 9.0 births per 1,000 women. Women in the age bracket of 20 to 34 years have the highest fertility rate with 11.0 births per 1,000 women. Women in the age bracket of 20 to 34 years acount for 51.3% of all women with births.
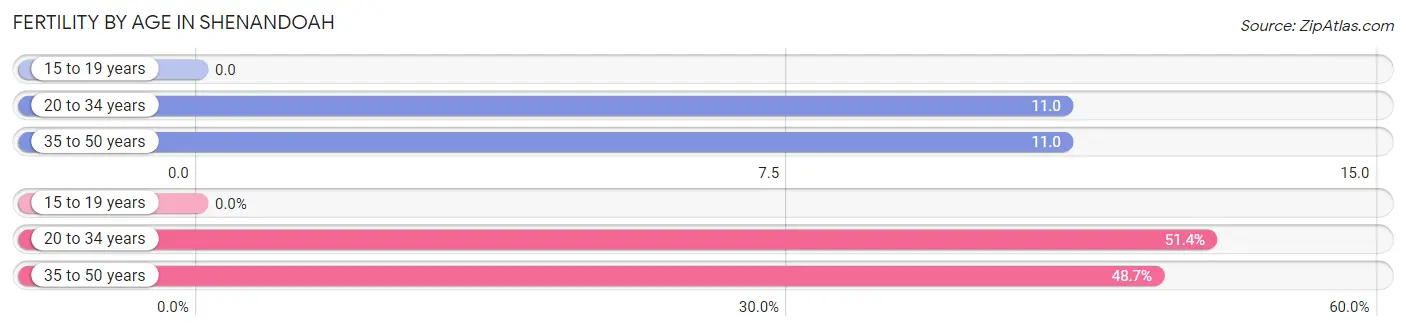
| Age Bracket | Women with Births | Births / 1,000 Women |
| 15 to 19 years | 0 (0.0%) | 0.0 |
| 20 to 34 years | 19 (51.3%) | 11.0 |
| 35 to 50 years | 18 (48.6%) | 11.0 |
| Total | 37 (100.0%) | 9.0 |
Fertility by Age by Marriage Status in Shenandoah
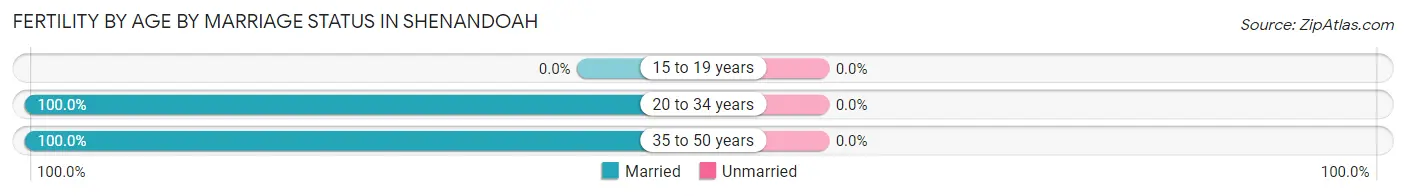
| Age Bracket | Married | Unmarried |
| 15 to 19 years | 0 (0.0%) | 0 (0.0%) |
| 20 to 34 years | 19 (100.0%) | 0 (0.0%) |
| 35 to 50 years | 18 (100.0%) | 0 (0.0%) |
| Total | 37 (100.0%) | 0 (0.0%) |
Fertility by Education in Shenandoah
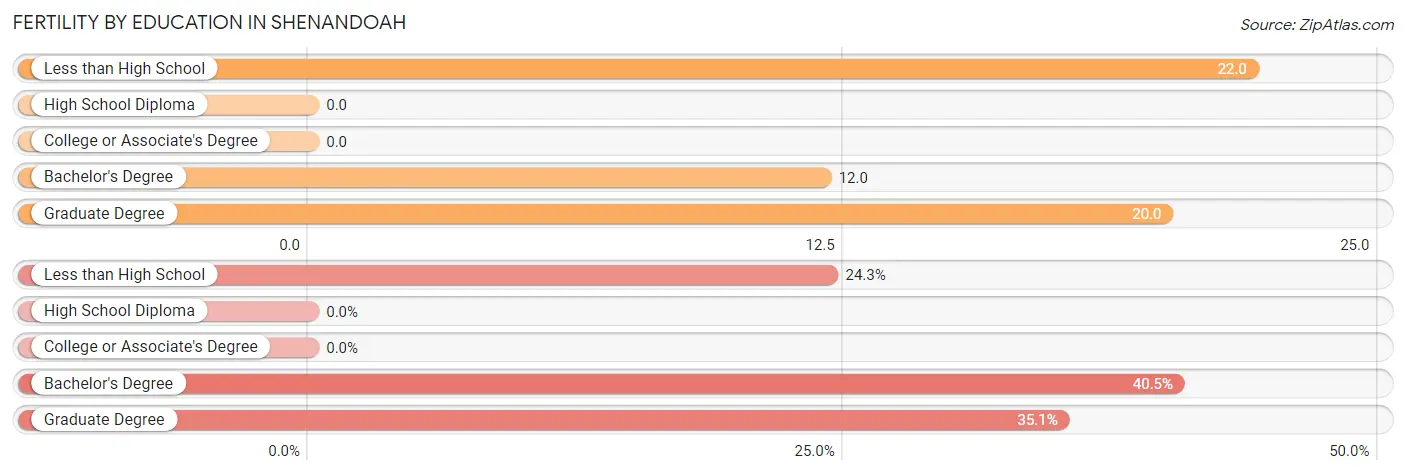
| Educational Attainment | Women with Births | Births / 1,000 Women |
| Less than High School | 9 (24.3%) | 22.0 |
| High School Diploma | 0 (0.0%) | 0.0 |
| College or Associate's Degree | 0 (0.0%) | 0.0 |
| Bachelor's Degree | 15 (40.5%) | 12.0 |
| Graduate Degree | 13 (35.1%) | 20.0 |
| Total | 37 (100.0%) | 9.0 |
Fertility by Education by Marriage Status in Shenandoah
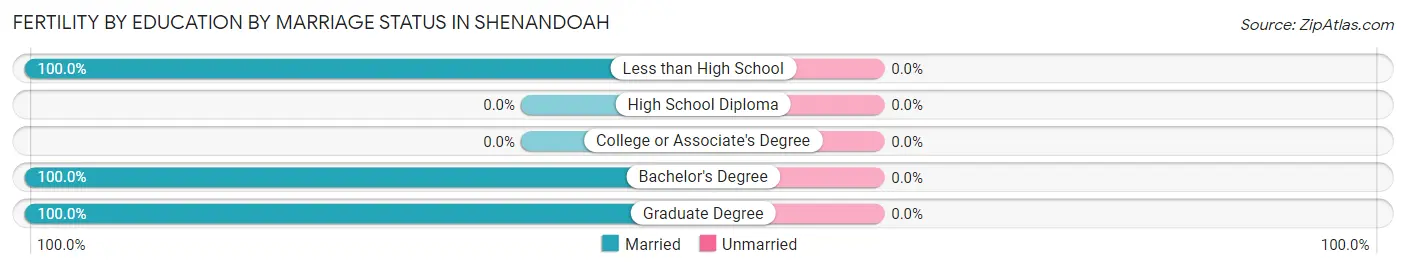
| Educational Attainment | Married | Unmarried |
| Less than High School | 9 (100.0%) | 0 (0.0%) |
| High School Diploma | 0 (0.0%) | 0 (0.0%) |
| College or Associate's Degree | 0 (0.0%) | 0 (0.0%) |
| Bachelor's Degree | 15 (100.0%) | 0 (0.0%) |
| Graduate Degree | 13 (100.0%) | 0 (0.0%) |
| Total | 37 (100.0%) | 0 (0.0%) |
Employment Characteristics in Shenandoah
Employment by Class of Employer in Shenandoah
Among the 9,151 employed individuals in Shenandoah, private company employees (5,499 | 60.1%), state government employees (988 | 10.8%), and self-employed (incorporated) (828 | 9.0%) make up the most common classes of employment.
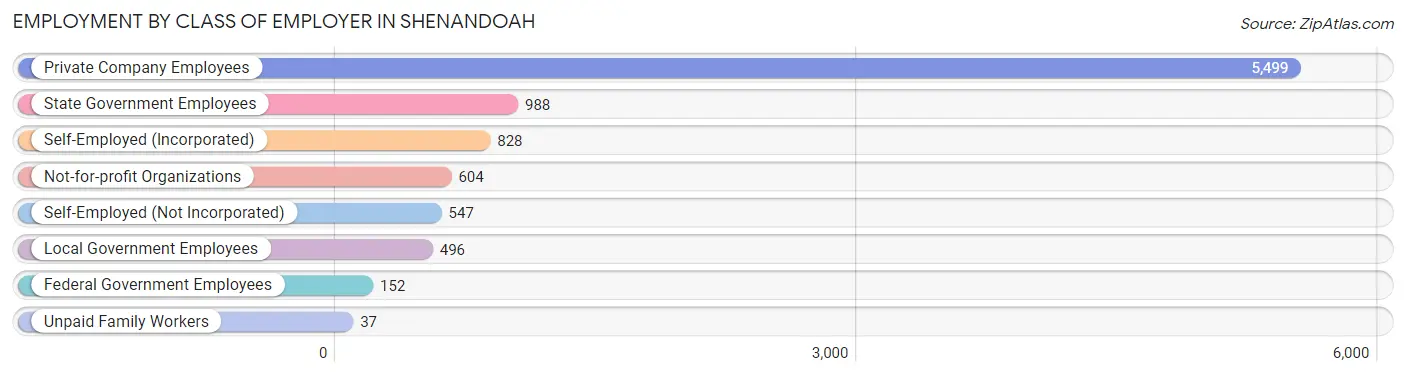
| Employer Class | # Employees | % Employees |
| Private Company Employees | 5,499 | 60.1% |
| Self-Employed (Incorporated) | 828 | 9.0% |
| Self-Employed (Not Incorporated) | 547 | 6.0% |
| Not-for-profit Organizations | 604 | 6.6% |
| Local Government Employees | 496 | 5.4% |
| State Government Employees | 988 | 10.8% |
| Federal Government Employees | 152 | 1.7% |
| Unpaid Family Workers | 37 | 0.4% |
| Total | 9,151 | 100.0% |
Employment Status by Age in Shenandoah
According to the labor force statistics for Shenandoah, out of the total population over 16 years of age (14,355), 69.2% or 9,934 individuals are in the labor force, with 5.3% or 527 of them unemployed. The age group with the highest labor force participation rate is 25 to 29 years, with 95.6% or 1,405 individuals in the labor force. Within the labor force, the 16 to 19 years age range has the highest percentage of unemployed individuals, with 14.3% or 58 of them being unemployed.
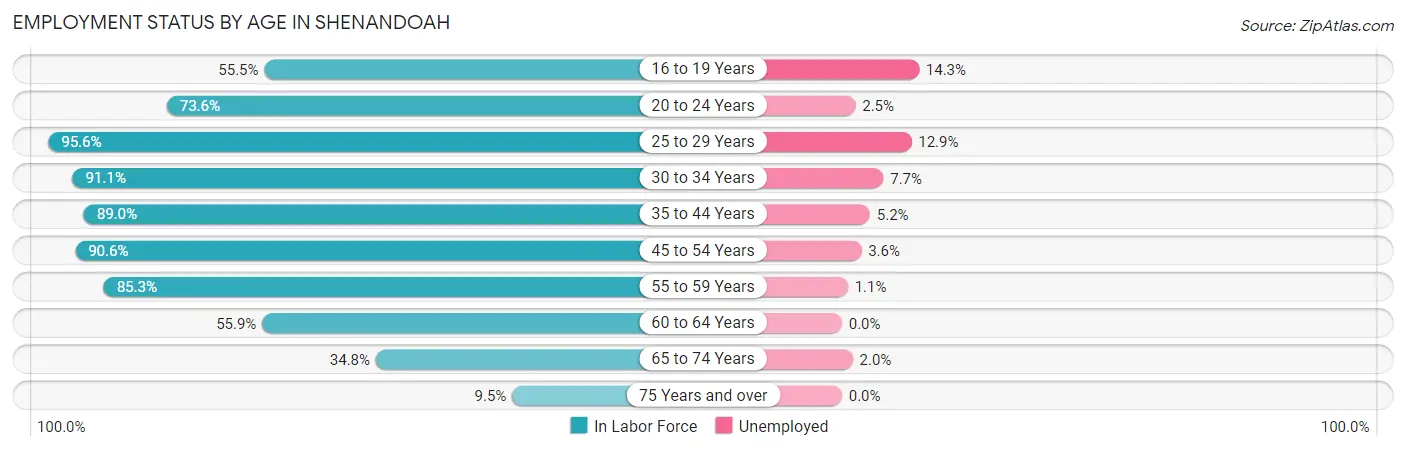
| Age Bracket | In Labor Force | Unemployed |
| 16 to 19 Years | 407 (55.5%) | 58 (14.3%) |
| 20 to 24 Years | 551 (73.6%) | 14 (2.5%) |
| 25 to 29 Years | 1,405 (95.6%) | 181 (12.9%) |
| 30 to 34 Years | 956 (91.1%) | 74 (7.7%) |
| 35 to 44 Years | 2,076 (89.0%) | 108 (5.2%) |
| 45 to 54 Years | 1,832 (90.6%) | 66 (3.6%) |
| 55 to 59 Years | 977 (85.3%) | 11 (1.1%) |
| 60 to 64 Years | 828 (55.9%) | 0 (0.0%) |
| 65 to 74 Years | 791 (34.8%) | 16 (2.0%) |
| 75 Years and over | 104 (9.5%) | 0 (0.0%) |
| Total | 9,934 (69.2%) | 527 (5.3%) |
Employment Status by Educational Attainment in Shenandoah
According to labor force statistics for Shenandoah, 85.0% of individuals (8,076) out of the total population between 25 and 64 years of age (9,501) are in the labor force, with 5.4% or 436 of them being unemployed. The group with the highest labor force participation rate are those with the educational attainment of college / associate degree, with 88.6% or 2,446 individuals in the labor force. Within the labor force, individuals with less than high school education have the highest percentage of unemployment, with 60.0% or 30 of them being unemployed.
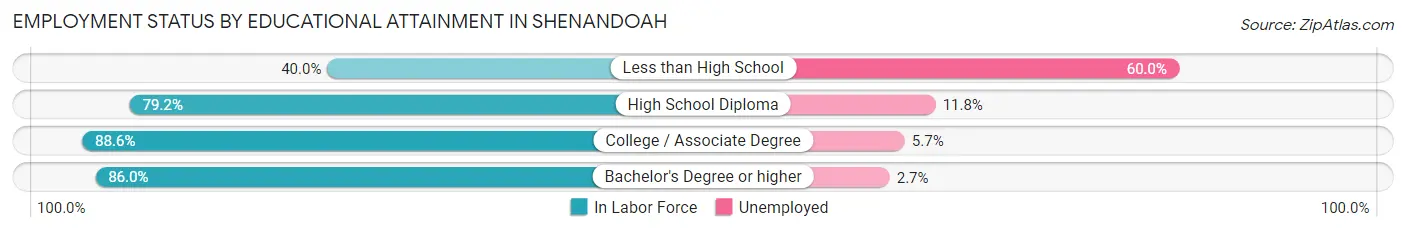
| Educational Attainment | In Labor Force | Unemployed |
| Less than High School | 50 (40.0%) | 75 (60.0%) |
| High School Diploma | 1,288 (79.2%) | 192 (11.8%) |
| College / Associate Degree | 2,446 (88.6%) | 157 (5.7%) |
| Bachelor's Degree or higher | 4,291 (86.0%) | 135 (2.7%) |
| Total | 8,076 (85.0%) | 513 (5.4%) |
Employment Occupations by Sex in Shenandoah
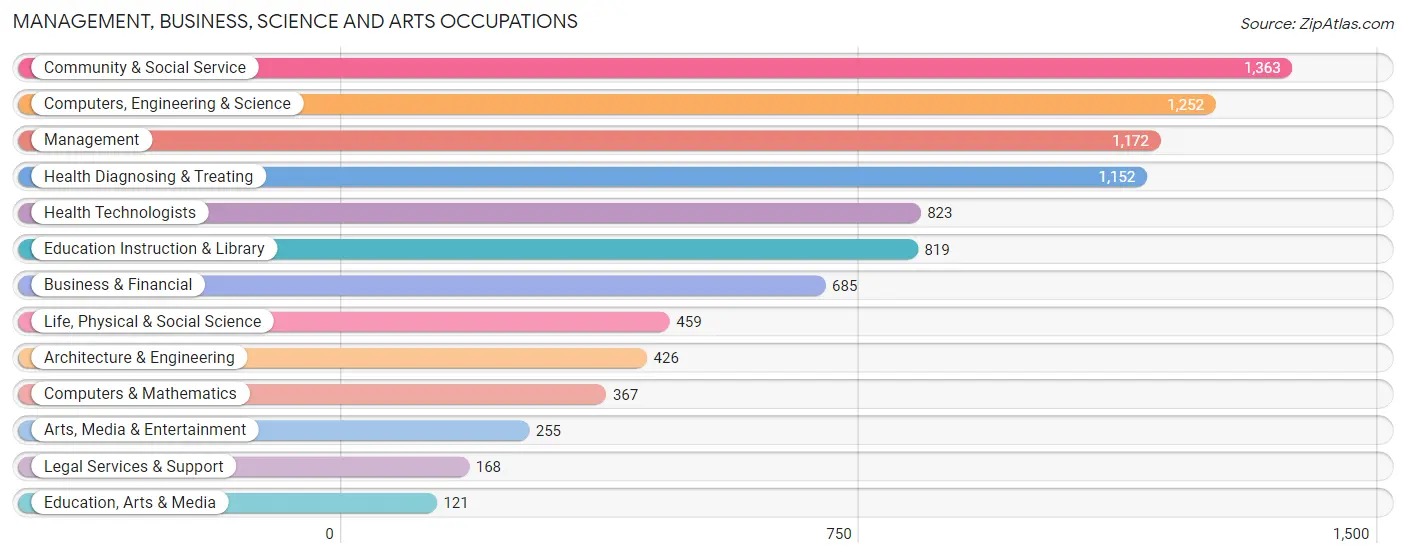
Management, Business, Science and Arts Occupations
The most common Management, Business, Science and Arts occupations in Shenandoah are Community & Social Service (1,363 | 14.6%), Computers, Engineering & Science (1,252 | 13.4%), Management (1,172 | 12.5%), Health Diagnosing & Treating (1,152 | 12.3%), and Health Technologists (823 | 8.8%).
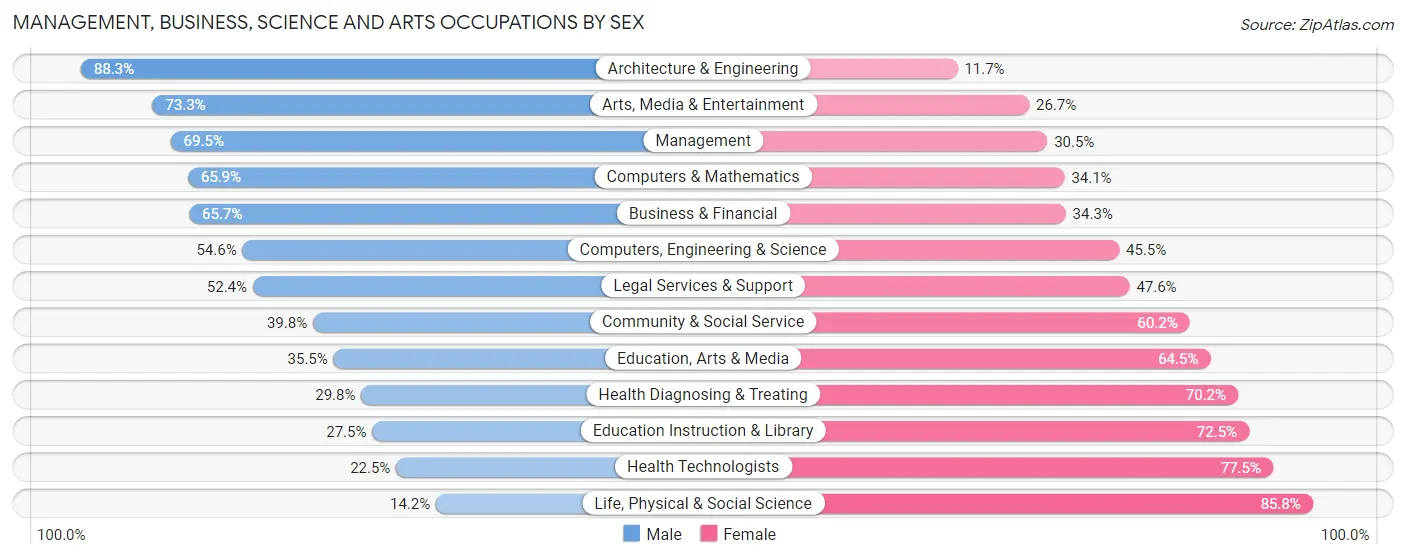
Management, Business, Science and Arts Occupations by Sex
Within the Management, Business, Science and Arts occupations in Shenandoah, the most male-oriented occupations are Architecture & Engineering (88.3%), Arts, Media & Entertainment (73.3%), and Management (69.5%), while the most female-oriented occupations are Life, Physical & Social Science (85.8%), Health Technologists (77.5%), and Education Instruction & Library (72.5%).
| Occupation | Male | Female |
| Management | 815 (69.5%) | 357 (30.5%) |
| Business & Financial | 450 (65.7%) | 235 (34.3%) |
| Computers, Engineering & Science | 683 (54.5%) | 569 (45.5%) |
| Computers & Mathematics | 242 (65.9%) | 125 (34.1%) |
| Architecture & Engineering | 376 (88.3%) | 50 (11.7%) |
| Life, Physical & Social Science | 65 (14.2%) | 394 (85.8%) |
| Community & Social Service | 543 (39.8%) | 820 (60.2%) |
| Education, Arts & Media | 43 (35.5%) | 78 (64.5%) |
| Legal Services & Support | 88 (52.4%) | 80 (47.6%) |
| Education Instruction & Library | 225 (27.5%) | 594 (72.5%) |
| Arts, Media & Entertainment | 187 (73.3%) | 68 (26.7%) |
| Health Diagnosing & Treating | 343 (29.8%) | 809 (70.2%) |
| Health Technologists | 185 (22.5%) | 638 (77.5%) |
| Total (Category) | 2,834 (50.4%) | 2,790 (49.6%) |
| Total (Overall) | 4,840 (51.7%) | 4,520 (48.3%) |
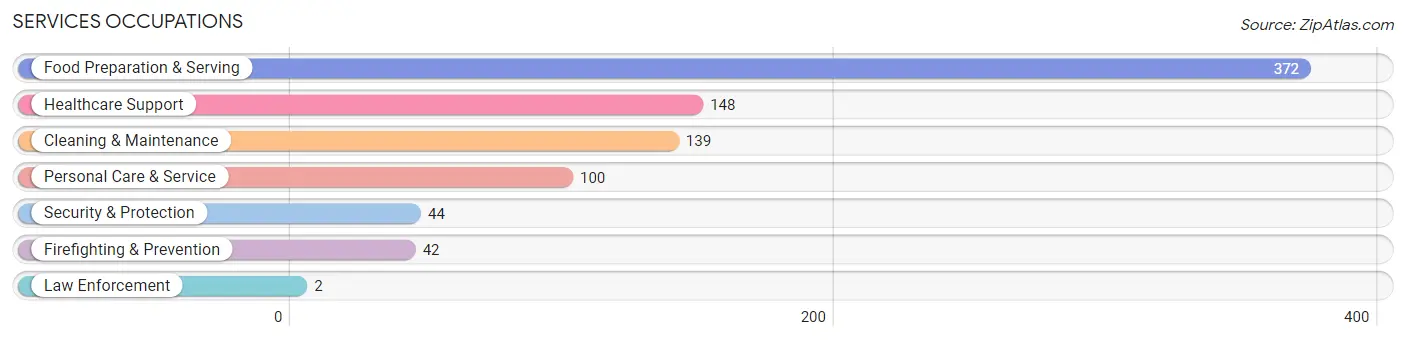
Services Occupations
The most common Services occupations in Shenandoah are Food Preparation & Serving (372 | 4.0%), Healthcare Support (148 | 1.6%), Cleaning & Maintenance (139 | 1.5%), Personal Care & Service (100 | 1.1%), and Security & Protection (44 | 0.5%).
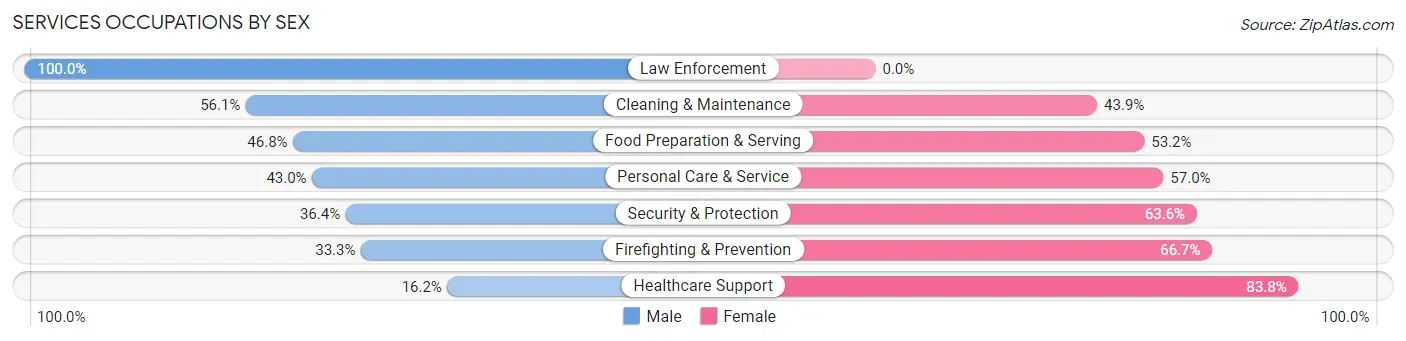
Services Occupations by Sex
Within the Services occupations in Shenandoah, the most male-oriented occupations are Law Enforcement (100.0%), Cleaning & Maintenance (56.1%), and Food Preparation & Serving (46.8%), while the most female-oriented occupations are Healthcare Support (83.8%), Firefighting & Prevention (66.7%), and Security & Protection (63.6%).
| Occupation | Male | Female |
| Healthcare Support | 24 (16.2%) | 124 (83.8%) |
| Security & Protection | 16 (36.4%) | 28 (63.6%) |
| Firefighting & Prevention | 14 (33.3%) | 28 (66.7%) |
| Law Enforcement | 2 (100.0%) | 0 (0.0%) |
| Food Preparation & Serving | 174 (46.8%) | 198 (53.2%) |
| Cleaning & Maintenance | 78 (56.1%) | 61 (43.9%) |
| Personal Care & Service | 43 (43.0%) | 57 (57.0%) |
| Total (Category) | 335 (41.7%) | 468 (58.3%) |
| Total (Overall) | 4,840 (51.7%) | 4,520 (48.3%) |
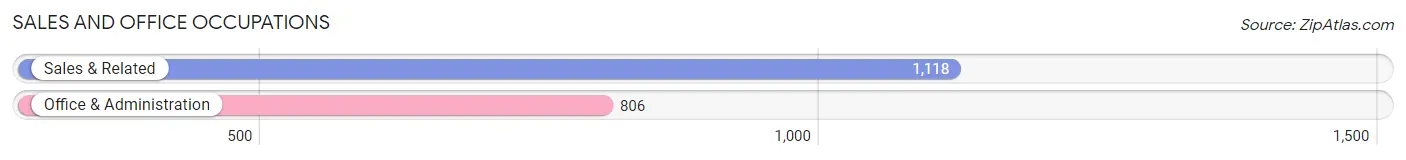
Sales and Office Occupations
The most common Sales and Office occupations in Shenandoah are Sales & Related (1,118 | 11.9%), and Office & Administration (806 | 8.6%).
Sales and Office Occupations by Sex
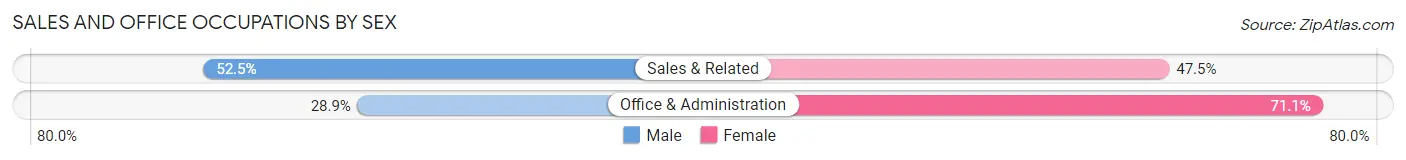
| Occupation | Male | Female |
| Sales & Related | 587 (52.5%) | 531 (47.5%) |
| Office & Administration | 233 (28.9%) | 573 (71.1%) |
| Total (Category) | 820 (42.6%) | 1,104 (57.4%) |
| Total (Overall) | 4,840 (51.7%) | 4,520 (48.3%) |
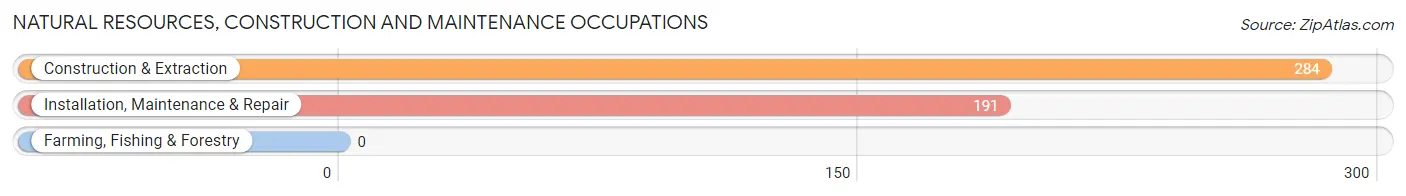
Natural Resources, Construction and Maintenance Occupations
The most common Natural Resources, Construction and Maintenance occupations in Shenandoah are Construction & Extraction (284 | 3.0%), and Installation, Maintenance & Repair (191 | 2.0%).
Natural Resources, Construction and Maintenance Occupations by Sex
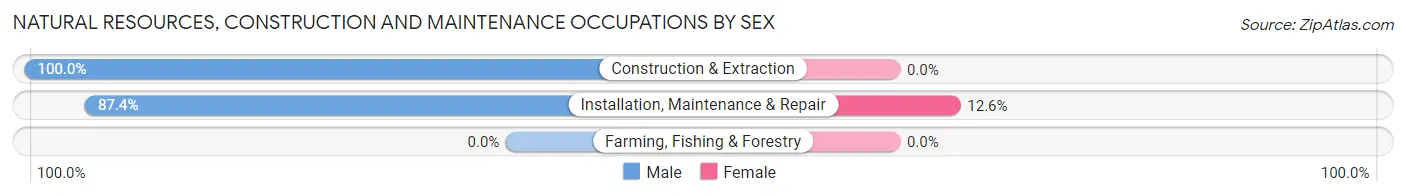
| Occupation | Male | Female |
| Farming, Fishing & Forestry | 0 (0.0%) | 0 (0.0%) |
| Construction & Extraction | 284 (100.0%) | 0 (0.0%) |
| Installation, Maintenance & Repair | 167 (87.4%) | 24 (12.6%) |
| Total (Category) | 451 (95.0%) | 24 (5.1%) |
| Total (Overall) | 4,840 (51.7%) | 4,520 (48.3%) |
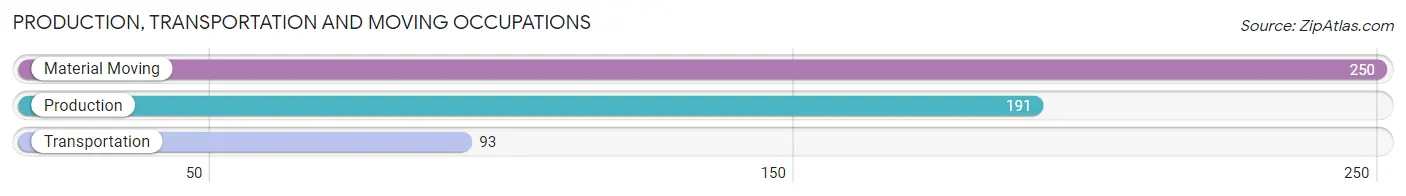
Production, Transportation and Moving Occupations
The most common Production, Transportation and Moving occupations in Shenandoah are Material Moving (250 | 2.7%), Production (191 | 2.0%), and Transportation (93 | 1.0%).
Production, Transportation and Moving Occupations by Sex
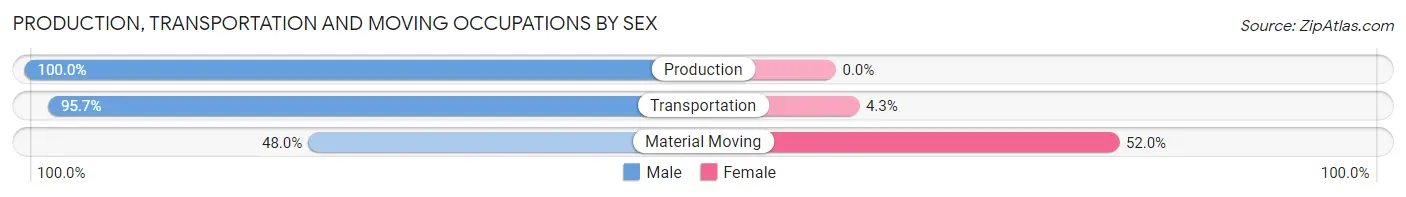
| Occupation | Male | Female |
| Production | 191 (100.0%) | 0 (0.0%) |
| Transportation | 89 (95.7%) | 4 (4.3%) |
| Material Moving | 120 (48.0%) | 130 (52.0%) |
| Total (Category) | 400 (74.9%) | 134 (25.1%) |
| Total (Overall) | 4,840 (51.7%) | 4,520 (48.3%) |
Employment Industries by Sex in Shenandoah
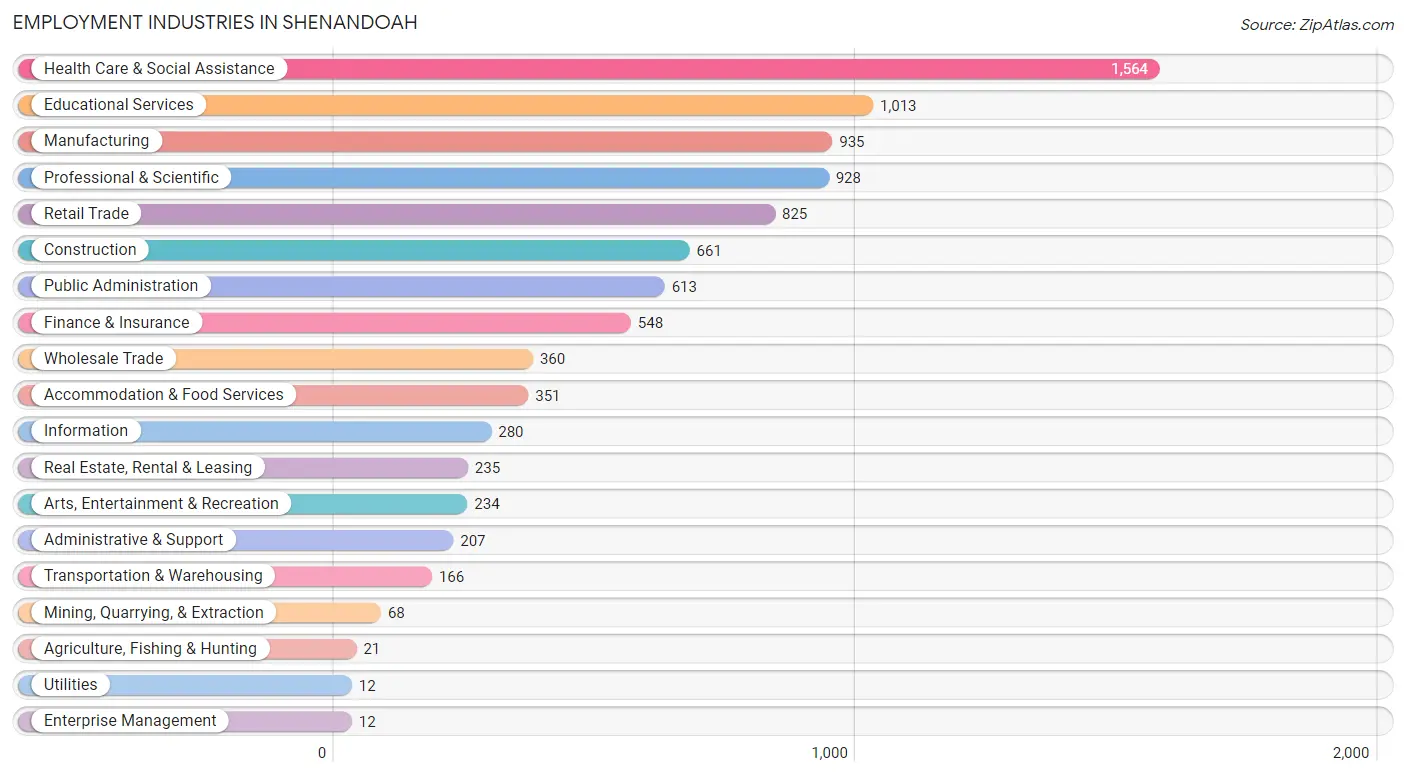
Employment Industries in Shenandoah
The major employment industries in Shenandoah include Health Care & Social Assistance (1,564 | 16.7%), Educational Services (1,013 | 10.8%), Manufacturing (935 | 10.0%), Professional & Scientific (928 | 9.9%), and Retail Trade (825 | 8.8%).
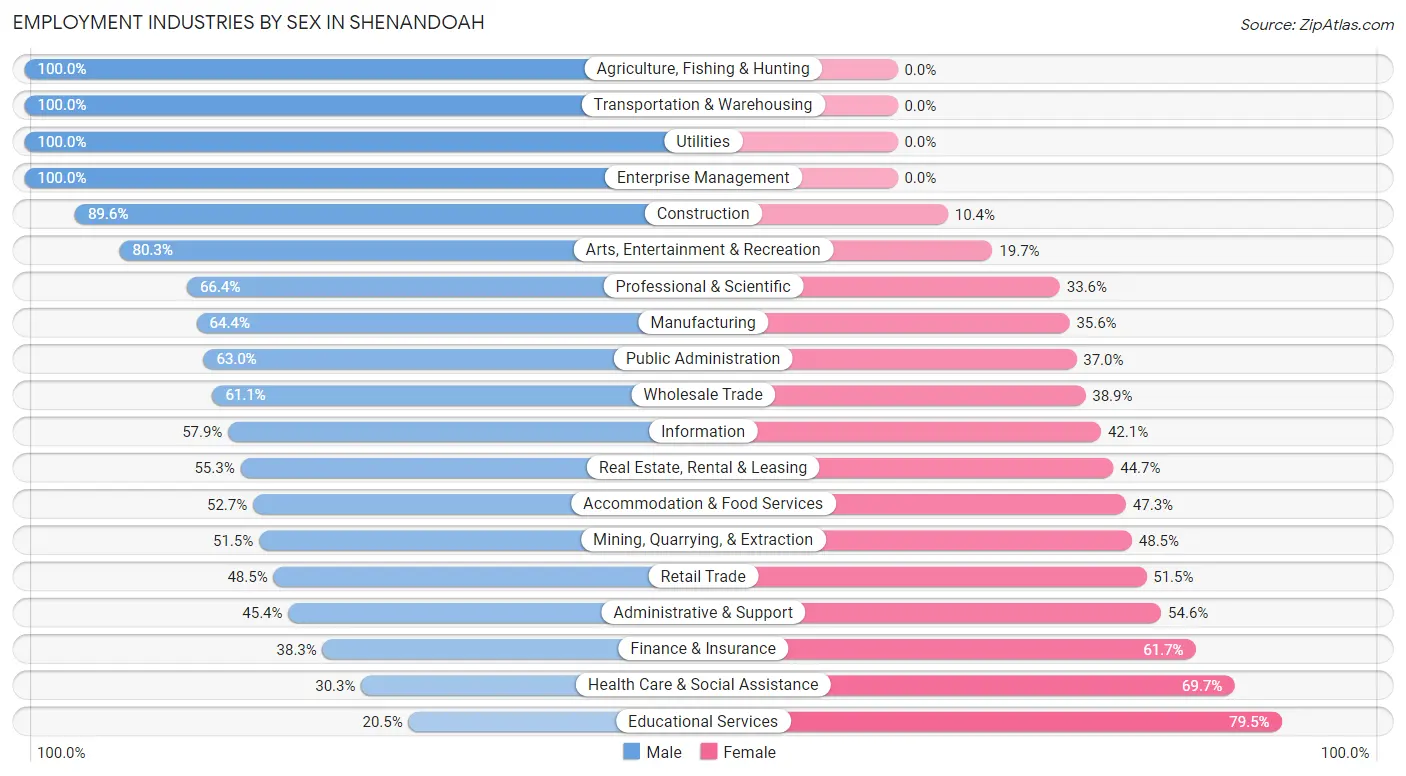
Employment Industries by Sex in Shenandoah
The Shenandoah industries that see more men than women are Agriculture, Fishing & Hunting (100.0%), Transportation & Warehousing (100.0%), and Utilities (100.0%), whereas the industries that tend to have a higher number of women are Educational Services (79.5%), Health Care & Social Assistance (69.7%), and Finance & Insurance (61.7%).
| Industry | Male | Female |
| Agriculture, Fishing & Hunting | 21 (100.0%) | 0 (0.0%) |
| Mining, Quarrying, & Extraction | 35 (51.5%) | 33 (48.5%) |
| Construction | 592 (89.6%) | 69 (10.4%) |
| Manufacturing | 602 (64.4%) | 333 (35.6%) |
| Wholesale Trade | 220 (61.1%) | 140 (38.9%) |
| Retail Trade | 400 (48.5%) | 425 (51.5%) |
| Transportation & Warehousing | 166 (100.0%) | 0 (0.0%) |
| Utilities | 12 (100.0%) | 0 (0.0%) |
| Information | 162 (57.9%) | 118 (42.1%) |
| Finance & Insurance | 210 (38.3%) | 338 (61.7%) |
| Real Estate, Rental & Leasing | 130 (55.3%) | 105 (44.7%) |
| Professional & Scientific | 616 (66.4%) | 312 (33.6%) |
| Enterprise Management | 12 (100.0%) | 0 (0.0%) |
| Administrative & Support | 94 (45.4%) | 113 (54.6%) |
| Educational Services | 208 (20.5%) | 805 (79.5%) |
| Health Care & Social Assistance | 474 (30.3%) | 1,090 (69.7%) |
| Arts, Entertainment & Recreation | 188 (80.3%) | 46 (19.7%) |
| Accommodation & Food Services | 185 (52.7%) | 166 (47.3%) |
| Public Administration | 386 (63.0%) | 227 (37.0%) |
| Total | 4,840 (51.7%) | 4,520 (48.3%) |
Education in Shenandoah
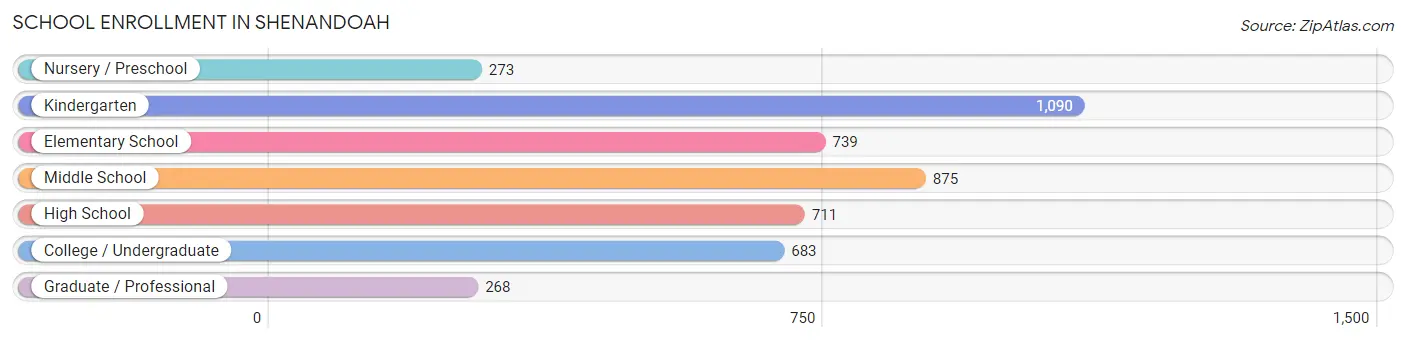
School Enrollment in Shenandoah
The most common levels of schooling among the 4,639 students in Shenandoah are kindergarten (1,090 | 23.5%), middle school (875 | 18.9%), and elementary school (739 | 15.9%).
| School Level | # Students | % Students |
| Nursery / Preschool | 273 | 5.9% |
| Kindergarten | 1,090 | 23.5% |
| Elementary School | 739 | 15.9% |
| Middle School | 875 | 18.9% |
| High School | 711 | 15.3% |
| College / Undergraduate | 683 | 14.7% |
| Graduate / Professional | 268 | 5.8% |
| Total | 4,639 | 100.0% |
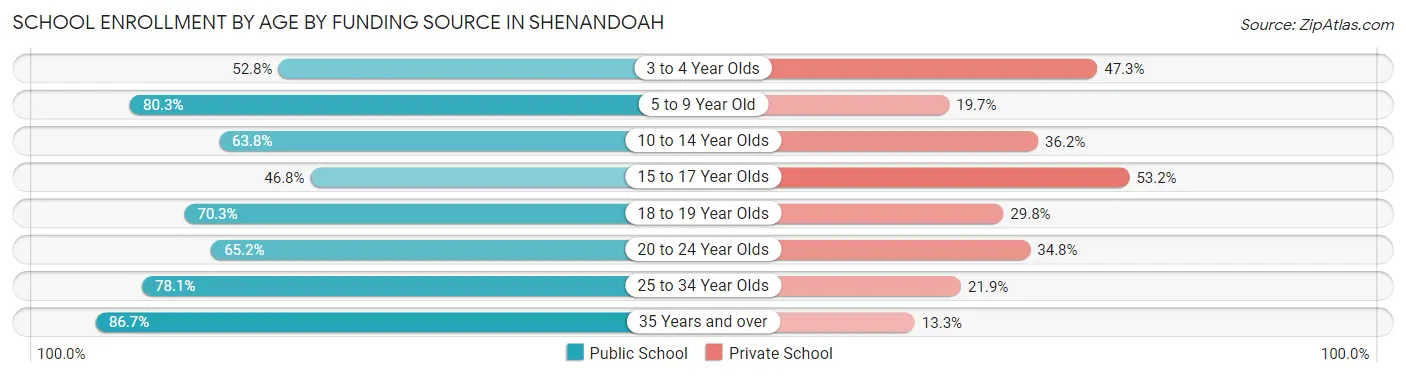
School Enrollment by Age by Funding Source in Shenandoah
Out of a total of 4,639 students who are enrolled in schools in Shenandoah, 1,378 (29.7%) attend a private institution, while the remaining 3,261 (70.3%) are enrolled in public schools. The age group of 15 to 17 year olds has the highest likelihood of being enrolled in private schools, with 247 (53.2% in the age bracket) enrolled. Conversely, the age group of 35 years and over has the lowest likelihood of being enrolled in a private school, with 85 (86.7% in the age bracket) attending a public institution.
| Age Bracket | Public School | Private School |
| 3 to 4 Year Olds | 96 (52.7%) | 86 (47.2%) |
| 5 to 9 Year Old | 1,429 (80.3%) | 350 (19.7%) |
| 10 to 14 Year Olds | 690 (63.8%) | 392 (36.2%) |
| 15 to 17 Year Olds | 217 (46.8%) | 247 (53.2%) |
| 18 to 19 Year Olds | 222 (70.3%) | 94 (29.7%) |
| 20 to 24 Year Olds | 197 (65.2%) | 105 (34.8%) |
| 25 to 34 Year Olds | 325 (78.1%) | 91 (21.9%) |
| 35 Years and over | 85 (86.7%) | 13 (13.3%) |
| Total | 3,261 (70.3%) | 1,378 (29.7%) |
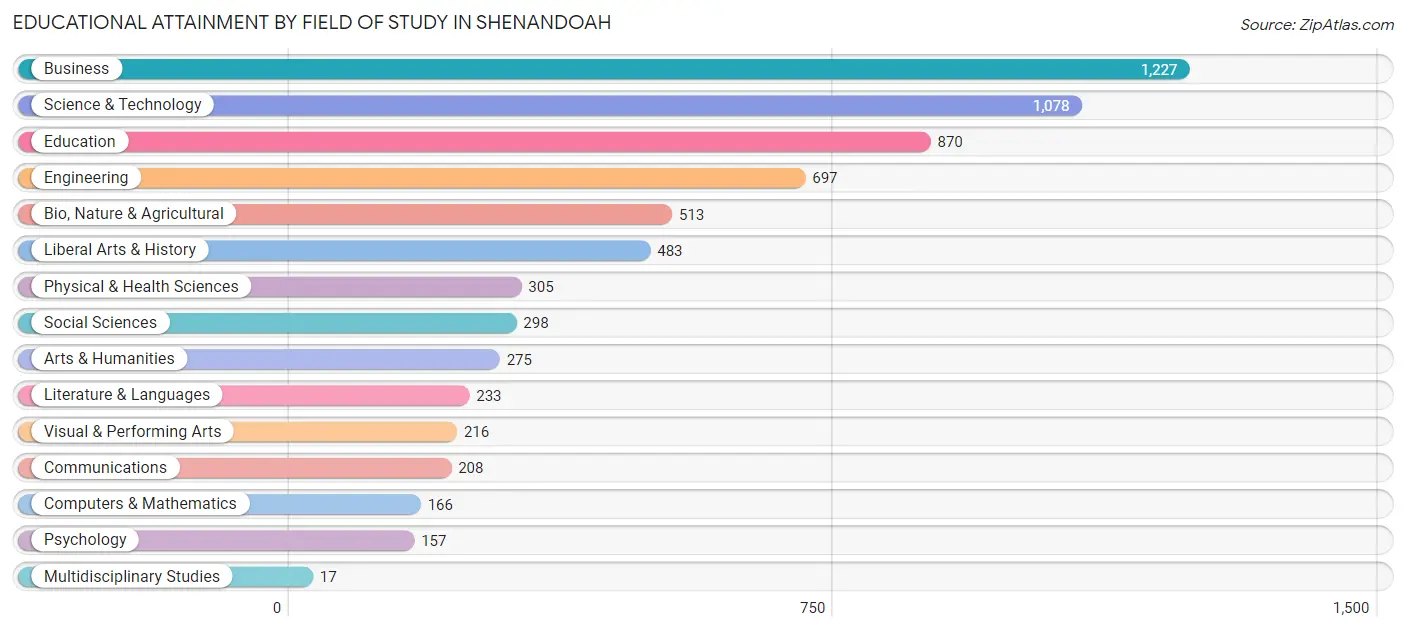
Educational Attainment by Field of Study in Shenandoah
Business (1,227 | 18.2%), science & technology (1,078 | 16.0%), education (870 | 12.9%), engineering (697 | 10.3%), and bio, nature & agricultural (513 | 7.6%) are the most common fields of study among 6,743 individuals in Shenandoah who have obtained a bachelor's degree or higher.
| Field of Study | # Graduates | % Graduates |
| Computers & Mathematics | 166 | 2.5% |
| Bio, Nature & Agricultural | 513 | 7.6% |
| Physical & Health Sciences | 305 | 4.5% |
| Psychology | 157 | 2.3% |
| Social Sciences | 298 | 4.4% |
| Engineering | 697 | 10.3% |
| Multidisciplinary Studies | 17 | 0.3% |
| Science & Technology | 1,078 | 16.0% |
| Business | 1,227 | 18.2% |
| Education | 870 | 12.9% |
| Literature & Languages | 233 | 3.5% |
| Liberal Arts & History | 483 | 7.2% |
| Visual & Performing Arts | 216 | 3.2% |
| Communications | 208 | 3.1% |
| Arts & Humanities | 275 | 4.1% |
| Total | 6,743 | 100.0% |
Transportation & Commute in Shenandoah
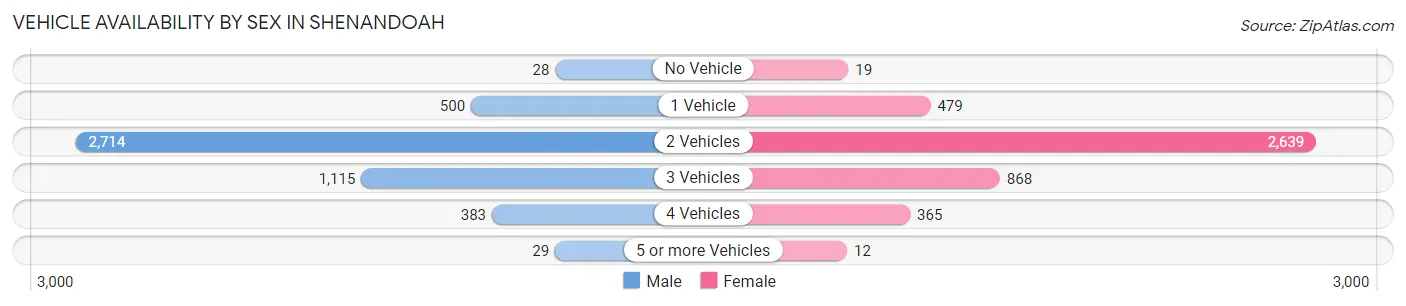
Vehicle Availability by Sex in Shenandoah
The most prevalent vehicle ownership categories in Shenandoah are males with 2 vehicles (2,714, accounting for 56.9%) and females with 2 vehicles (2,639, making up 61.9%).
| Vehicles Available | Male | Female |
| No Vehicle | 28 (0.6%) | 19 (0.4%) |
| 1 Vehicle | 500 (10.5%) | 479 (10.9%) |
| 2 Vehicles | 2,714 (56.9%) | 2,639 (60.2%) |
| 3 Vehicles | 1,115 (23.4%) | 868 (19.8%) |
| 4 Vehicles | 383 (8.0%) | 365 (8.3%) |
| 5 or more Vehicles | 29 (0.6%) | 12 (0.3%) |
| Total | 4,769 (100.0%) | 4,382 (100.0%) |
Commute Time in Shenandoah
The most frequently occuring commute durations in Shenandoah are 20 to 24 minutes (1,630 commuters, 20.5%), 15 to 19 minutes (1,235 commuters, 15.5%), and 30 to 34 minutes (1,185 commuters, 14.9%).
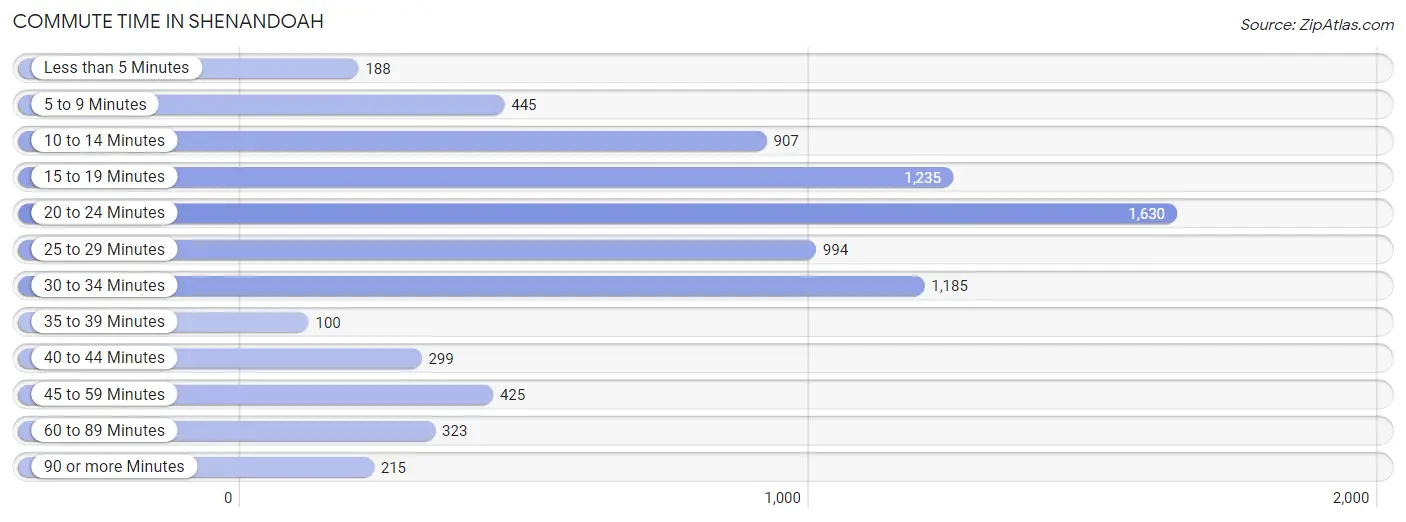
| Commute Time | # Commuters | % Commuters |
| Less than 5 Minutes | 188 | 2.4% |
| 5 to 9 Minutes | 445 | 5.6% |
| 10 to 14 Minutes | 907 | 11.4% |
| 15 to 19 Minutes | 1,235 | 15.5% |
| 20 to 24 Minutes | 1,630 | 20.5% |
| 25 to 29 Minutes | 994 | 12.5% |
| 30 to 34 Minutes | 1,185 | 14.9% |
| 35 to 39 Minutes | 100 | 1.3% |
| 40 to 44 Minutes | 299 | 3.8% |
| 45 to 59 Minutes | 425 | 5.3% |
| 60 to 89 Minutes | 323 | 4.1% |
| 90 or more Minutes | 215 | 2.7% |
Commute Time by Sex in Shenandoah
The most common commute times in Shenandoah are 20 to 24 minutes (808 commuters, 19.5%) for males and 20 to 24 minutes (822 commuters, 21.6%) for females.
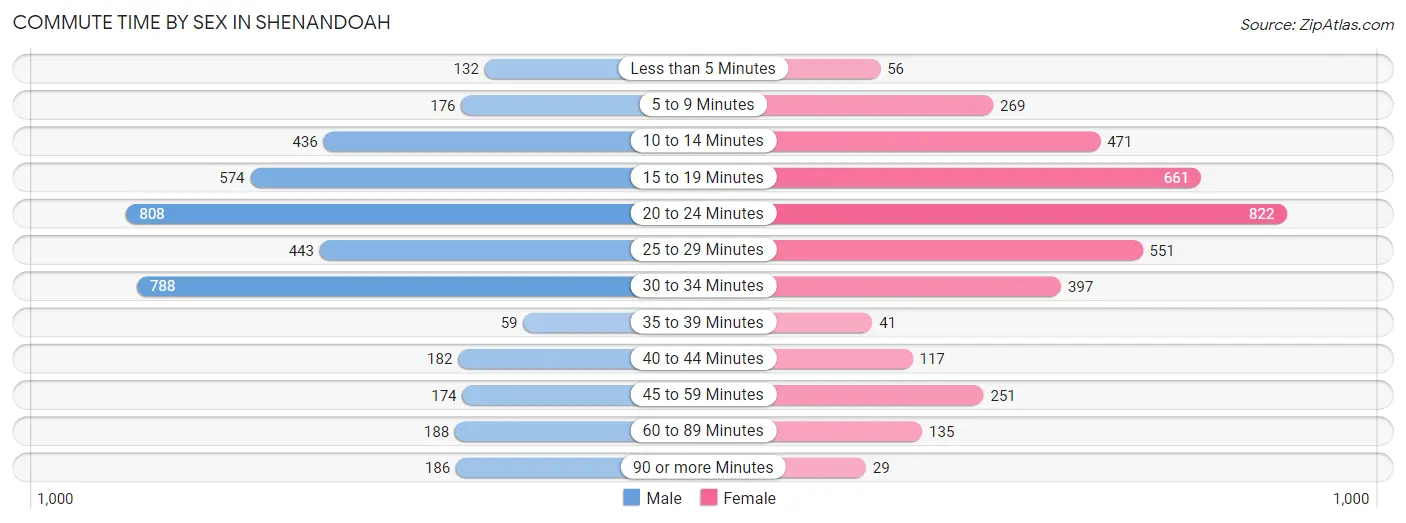
| Commute Time | Male | Female |
| Less than 5 Minutes | 132 (3.2%) | 56 (1.5%) |
| 5 to 9 Minutes | 176 (4.3%) | 269 (7.1%) |
| 10 to 14 Minutes | 436 (10.5%) | 471 (12.4%) |
| 15 to 19 Minutes | 574 (13.8%) | 661 (17.4%) |
| 20 to 24 Minutes | 808 (19.5%) | 822 (21.6%) |
| 25 to 29 Minutes | 443 (10.7%) | 551 (14.5%) |
| 30 to 34 Minutes | 788 (19.0%) | 397 (10.4%) |
| 35 to 39 Minutes | 59 (1.4%) | 41 (1.1%) |
| 40 to 44 Minutes | 182 (4.4%) | 117 (3.1%) |
| 45 to 59 Minutes | 174 (4.2%) | 251 (6.6%) |
| 60 to 89 Minutes | 188 (4.5%) | 135 (3.5%) |
| 90 or more Minutes | 186 (4.5%) | 29 (0.8%) |
Time of Departure to Work by Sex in Shenandoah
The most frequent times of departure to work in Shenandoah are 7:00 AM to 7:29 AM (1,056, 25.5%) for males and 7:30 AM to 7:59 AM (574, 15.1%) for females.
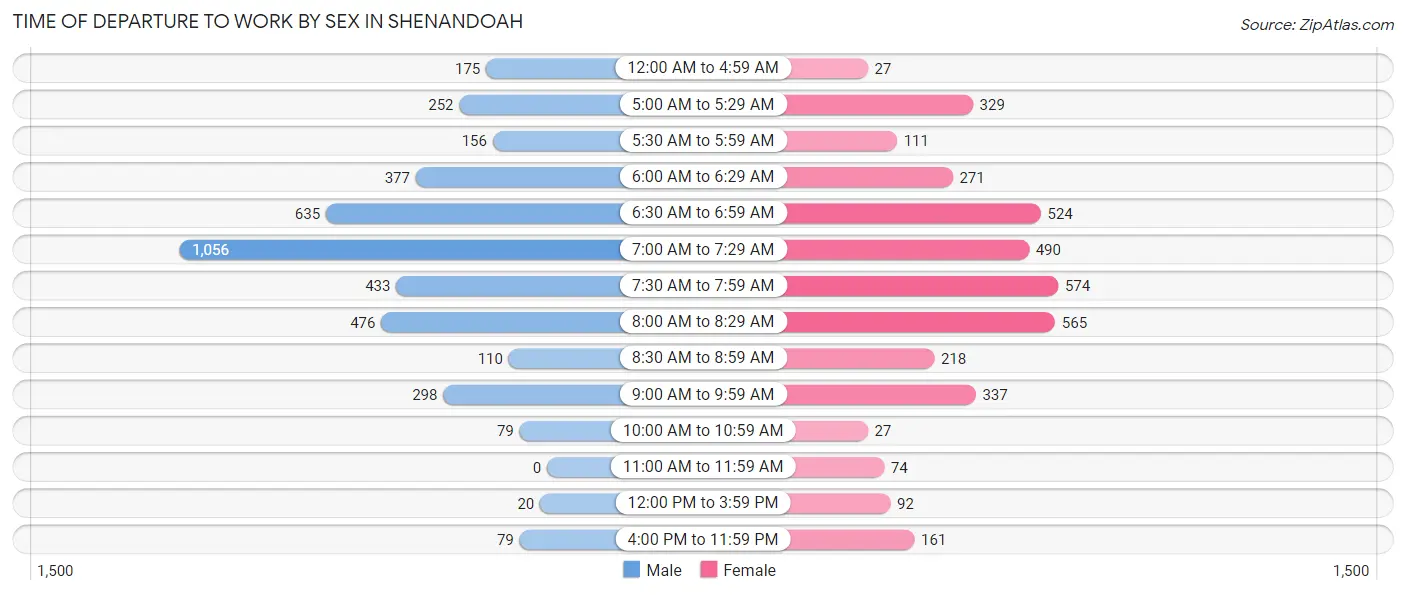
| Time of Departure | Male | Female |
| 12:00 AM to 4:59 AM | 175 (4.2%) | 27 (0.7%) |
| 5:00 AM to 5:29 AM | 252 (6.1%) | 329 (8.7%) |
| 5:30 AM to 5:59 AM | 156 (3.8%) | 111 (2.9%) |
| 6:00 AM to 6:29 AM | 377 (9.1%) | 271 (7.1%) |
| 6:30 AM to 6:59 AM | 635 (15.3%) | 524 (13.8%) |
| 7:00 AM to 7:29 AM | 1,056 (25.5%) | 490 (12.9%) |
| 7:30 AM to 7:59 AM | 433 (10.4%) | 574 (15.1%) |
| 8:00 AM to 8:29 AM | 476 (11.5%) | 565 (14.9%) |
| 8:30 AM to 8:59 AM | 110 (2.6%) | 218 (5.7%) |
| 9:00 AM to 9:59 AM | 298 (7.2%) | 337 (8.9%) |
| 10:00 AM to 10:59 AM | 79 (1.9%) | 27 (0.7%) |
| 11:00 AM to 11:59 AM | 0 (0.0%) | 74 (1.9%) |
| 12:00 PM to 3:59 PM | 20 (0.5%) | 92 (2.4%) |
| 4:00 PM to 11:59 PM | 79 (1.9%) | 161 (4.2%) |
| Total | 4,146 (100.0%) | 3,800 (100.0%) |
Housing Occupancy in Shenandoah
Occupancy by Ownership in Shenandoah
Of the total 7,041 dwellings in Shenandoah, owner-occupied units account for 5,509 (78.2%), while renter-occupied units make up 1,532 (21.8%).
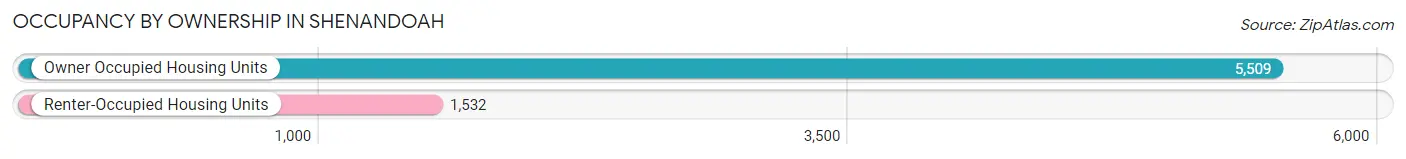
| Occupancy | # Housing Units | % Housing Units |
| Owner Occupied Housing Units | 5,509 | 78.2% |
| Renter-Occupied Housing Units | 1,532 | 21.8% |
| Total Occupied Housing Units | 7,041 | 100.0% |
Occupancy by Household Size in Shenandoah
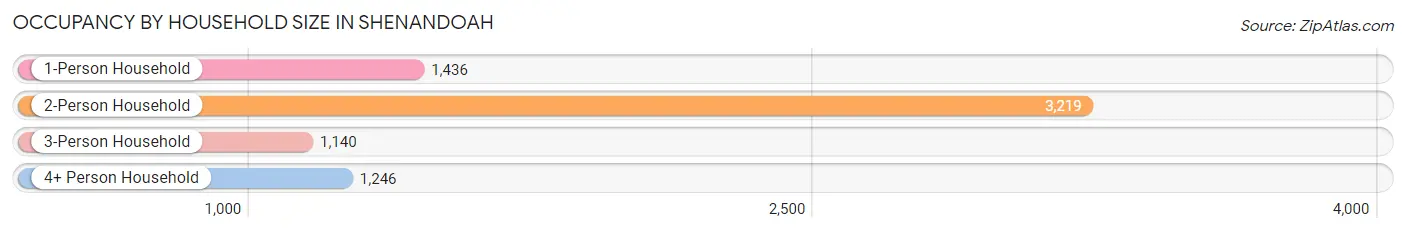
| Household Size | # Housing Units | % Housing Units |
| 1-Person Household | 1,436 | 20.4% |
| 2-Person Household | 3,219 | 45.7% |
| 3-Person Household | 1,140 | 16.2% |
| 4+ Person Household | 1,246 | 17.7% |
| Total Housing Units | 7,041 | 100.0% |
Occupancy by Ownership by Household Size in Shenandoah
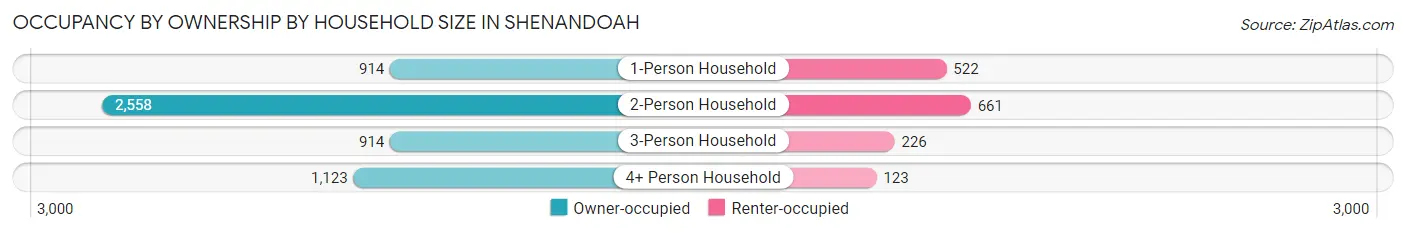
| Household Size | Owner-occupied | Renter-occupied |
| 1-Person Household | 914 (63.6%) | 522 (36.3%) |
| 2-Person Household | 2,558 (79.5%) | 661 (20.5%) |
| 3-Person Household | 914 (80.2%) | 226 (19.8%) |
| 4+ Person Household | 1,123 (90.1%) | 123 (9.9%) |
| Total Housing Units | 5,509 (78.2%) | 1,532 (21.8%) |
Occupancy by Educational Attainment in Shenandoah
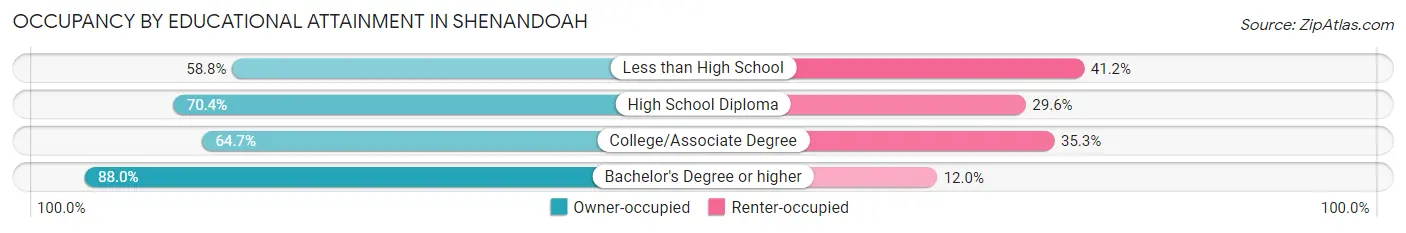
| Household Size | Owner-occupied | Renter-occupied |
| Less than High School | 40 (58.8%) | 28 (41.2%) |
| High School Diploma | 733 (70.4%) | 308 (29.6%) |
| College/Associate Degree | 1,345 (64.7%) | 733 (35.3%) |
| Bachelor's Degree or higher | 3,391 (88.0%) | 463 (12.0%) |
Occupancy by Age of Householder in Shenandoah
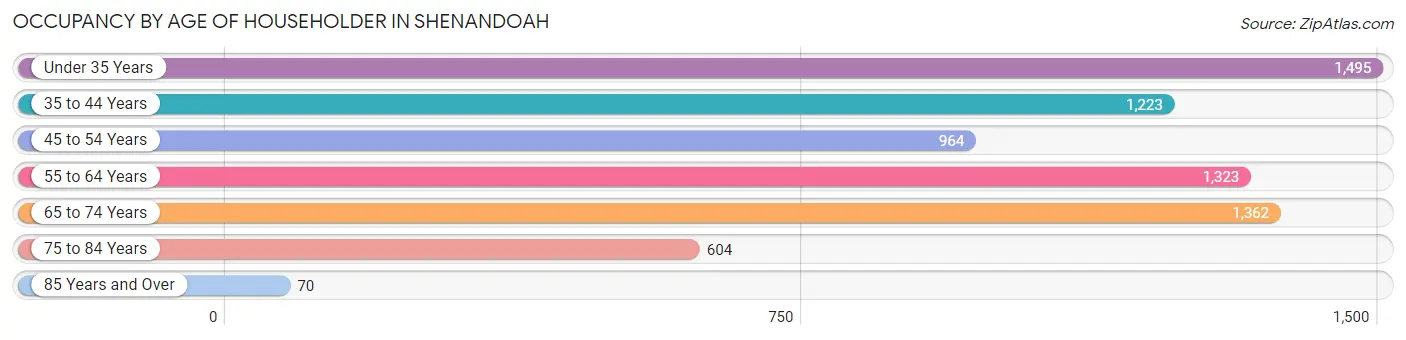
| Age Bracket | # Households | % Households |
| Under 35 Years | 1,495 | 21.2% |
| 35 to 44 Years | 1,223 | 17.4% |
| 45 to 54 Years | 964 | 13.7% |
| 55 to 64 Years | 1,323 | 18.8% |
| 65 to 74 Years | 1,362 | 19.3% |
| 75 to 84 Years | 604 | 8.6% |
| 85 Years and Over | 70 | 1.0% |
| Total | 7,041 | 100.0% |
Housing Finances in Shenandoah
Median Income by Occupancy in Shenandoah
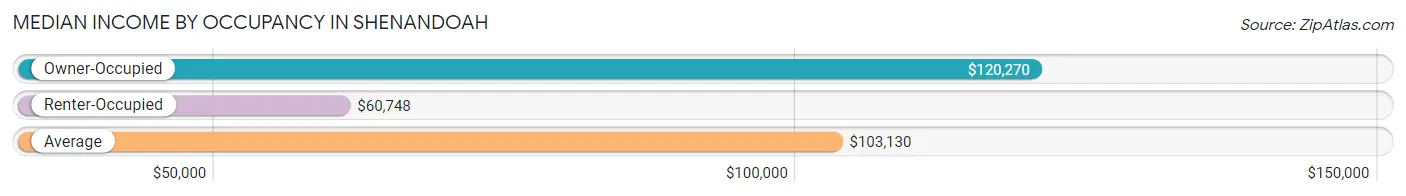
| Occupancy Type | # Households | Median Income |
| Owner-Occupied | 5,509 (78.2%) | $120,270 |
| Renter-Occupied | 1,532 (21.8%) | $60,748 |
| Average | 7,041 (100.0%) | $103,130 |
Occupancy by Householder Income Bracket in Shenandoah
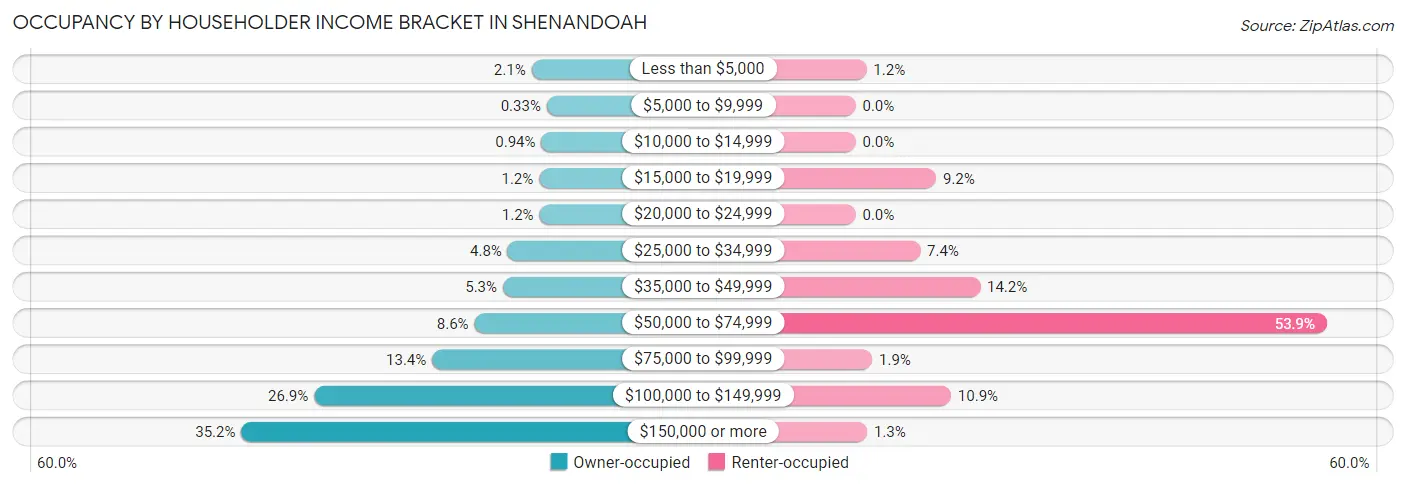
| Income Bracket | Owner-occupied | Renter-occupied |
| Less than $5,000 | 114 (2.1%) | 19 (1.2%) |
| $5,000 to $9,999 | 18 (0.3%) | 0 (0.0%) |
| $10,000 to $14,999 | 52 (0.9%) | 0 (0.0%) |
| $15,000 to $19,999 | 66 (1.2%) | 141 (9.2%) |
| $20,000 to $24,999 | 64 (1.2%) | 0 (0.0%) |
| $25,000 to $34,999 | 264 (4.8%) | 113 (7.4%) |
| $35,000 to $49,999 | 294 (5.3%) | 218 (14.2%) |
| $50,000 to $74,999 | 473 (8.6%) | 825 (53.8%) |
| $75,000 to $99,999 | 740 (13.4%) | 29 (1.9%) |
| $100,000 to $149,999 | 1,483 (26.9%) | 167 (10.9%) |
| $150,000 or more | 1,941 (35.2%) | 20 (1.3%) |
| Total | 5,509 (100.0%) | 1,532 (100.0%) |
Monthly Housing Cost Tiers in Shenandoah
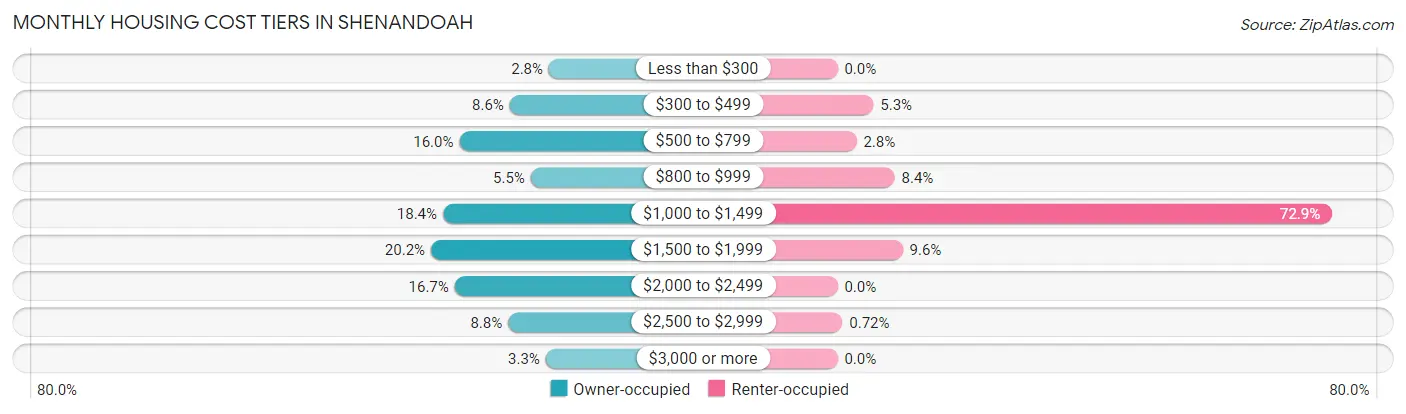
| Monthly Cost | Owner-occupied | Renter-occupied |
| Less than $300 | 153 (2.8%) | 0 (0.0%) |
| $300 to $499 | 471 (8.6%) | 81 (5.3%) |
| $500 to $799 | 880 (16.0%) | 43 (2.8%) |
| $800 to $999 | 301 (5.5%) | 129 (8.4%) |
| $1,000 to $1,499 | 1,013 (18.4%) | 1,116 (72.9%) |
| $1,500 to $1,999 | 1,110 (20.2%) | 147 (9.6%) |
| $2,000 to $2,499 | 918 (16.7%) | 0 (0.0%) |
| $2,500 to $2,999 | 484 (8.8%) | 11 (0.7%) |
| $3,000 or more | 179 (3.3%) | 0 (0.0%) |
| Total | 5,509 (100.0%) | 1,532 (100.0%) |
Physical Housing Characteristics in Shenandoah
Housing Structures in Shenandoah
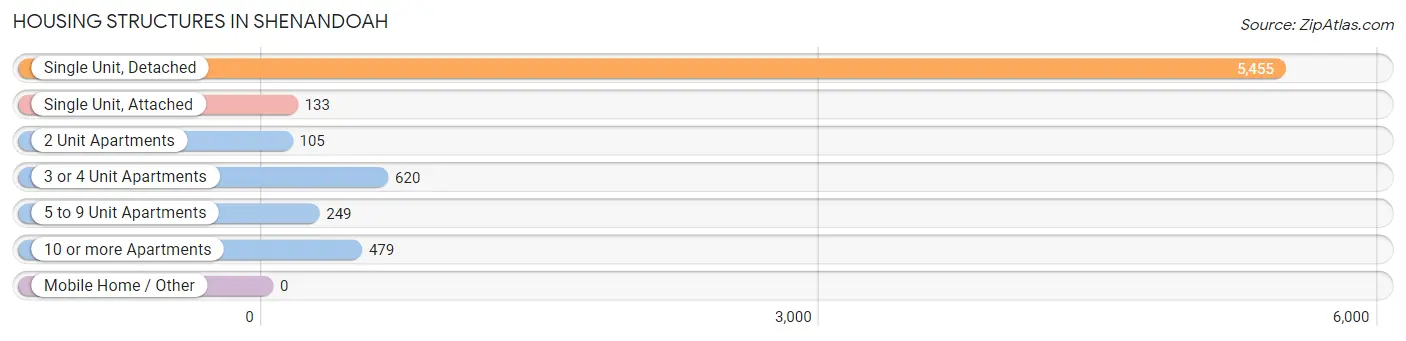
| Structure Type | # Housing Units | % Housing Units |
| Single Unit, Detached | 5,455 | 77.5% |
| Single Unit, Attached | 133 | 1.9% |
| 2 Unit Apartments | 105 | 1.5% |
| 3 or 4 Unit Apartments | 620 | 8.8% |
| 5 to 9 Unit Apartments | 249 | 3.5% |
| 10 or more Apartments | 479 | 6.8% |
| Mobile Home / Other | 0 | 0.0% |
| Total | 7,041 | 100.0% |
Housing Structures by Occupancy in Shenandoah
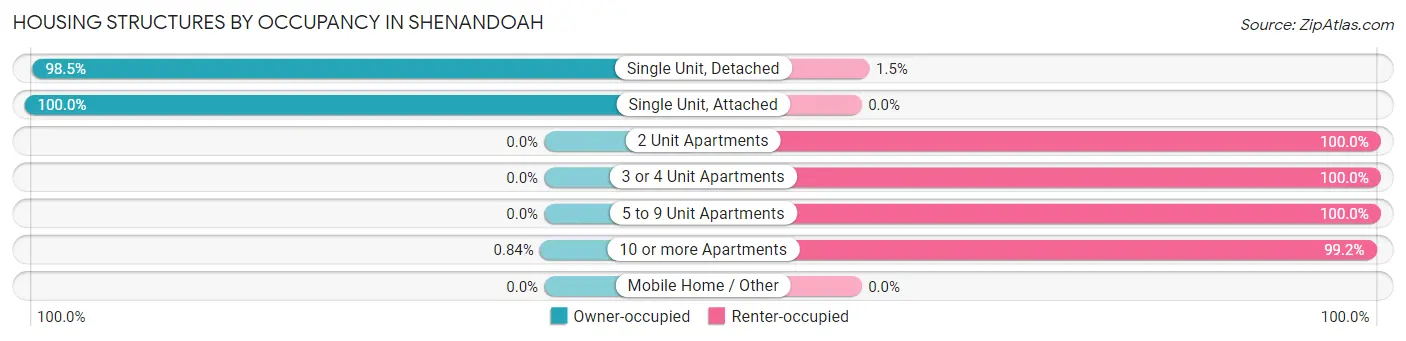
| Structure Type | Owner-occupied | Renter-occupied |
| Single Unit, Detached | 5,372 (98.5%) | 83 (1.5%) |
| Single Unit, Attached | 133 (100.0%) | 0 (0.0%) |
| 2 Unit Apartments | 0 (0.0%) | 105 (100.0%) |
| 3 or 4 Unit Apartments | 0 (0.0%) | 620 (100.0%) |
| 5 to 9 Unit Apartments | 0 (0.0%) | 249 (100.0%) |
| 10 or more Apartments | 4 (0.8%) | 475 (99.2%) |
| Mobile Home / Other | 0 (0.0%) | 0 (0.0%) |
| Total | 5,509 (78.2%) | 1,532 (21.8%) |
Housing Structures by Number of Rooms in Shenandoah
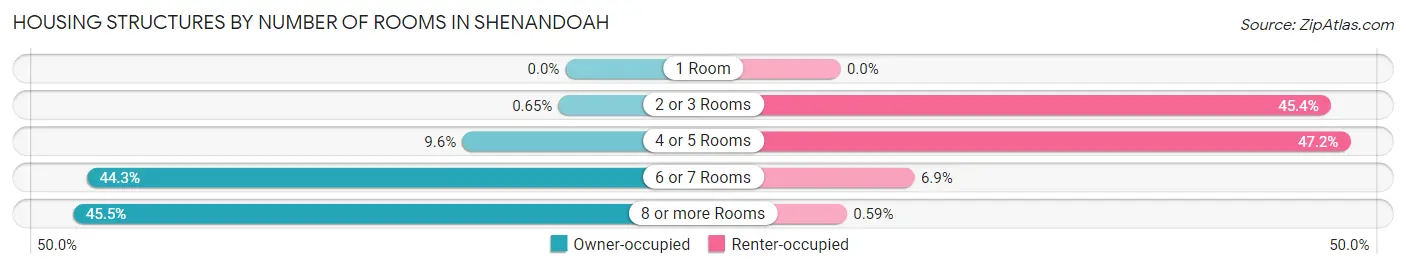
| Number of Rooms | Owner-occupied | Renter-occupied |
| 1 Room | 0 (0.0%) | 0 (0.0%) |
| 2 or 3 Rooms | 36 (0.6%) | 695 (45.4%) |
| 4 or 5 Rooms | 526 (9.6%) | 723 (47.2%) |
| 6 or 7 Rooms | 2,439 (44.3%) | 105 (6.9%) |
| 8 or more Rooms | 2,508 (45.5%) | 9 (0.6%) |
| Total | 5,509 (100.0%) | 1,532 (100.0%) |
Housing Structure by Heating Type in Shenandoah
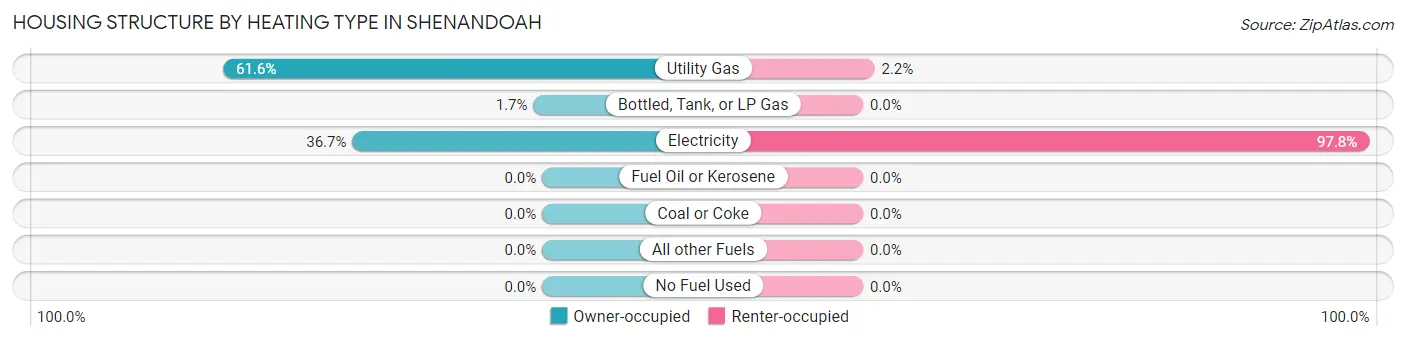
| Heating Type | Owner-occupied | Renter-occupied |
| Utility Gas | 3,396 (61.6%) | 34 (2.2%) |
| Bottled, Tank, or LP Gas | 93 (1.7%) | 0 (0.0%) |
| Electricity | 2,020 (36.7%) | 1,498 (97.8%) |
| Fuel Oil or Kerosene | 0 (0.0%) | 0 (0.0%) |
| Coal or Coke | 0 (0.0%) | 0 (0.0%) |
| All other Fuels | 0 (0.0%) | 0 (0.0%) |
| No Fuel Used | 0 (0.0%) | 0 (0.0%) |
| Total | 5,509 (100.0%) | 1,532 (100.0%) |
Household Vehicle Usage in Shenandoah
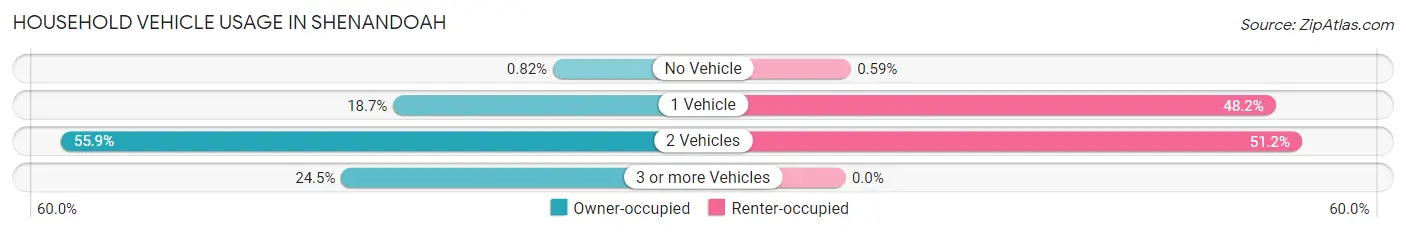
| Vehicles per Household | Owner-occupied | Renter-occupied |
| No Vehicle | 45 (0.8%) | 9 (0.6%) |
| 1 Vehicle | 1,031 (18.7%) | 739 (48.2%) |
| 2 Vehicles | 3,082 (55.9%) | 784 (51.2%) |
| 3 or more Vehicles | 1,351 (24.5%) | 0 (0.0%) |
| Total | 5,509 (100.0%) | 1,532 (100.0%) |
Real Estate & Mortgages in Shenandoah
Real Estate and Mortgage Overview in Shenandoah
| Characteristic | Without Mortgage | With Mortgage |
| Housing Units | 2,047 | 3,462 |
| Median Property Value | $295,700 | $297,800 |
| Median Household Income | $104,801 | $1,263 |
| Monthly Housing Costs | $625 | $179 |
| Real Estate Taxes | $1,962 | $67 |
Property Value by Mortgage Status in Shenandoah
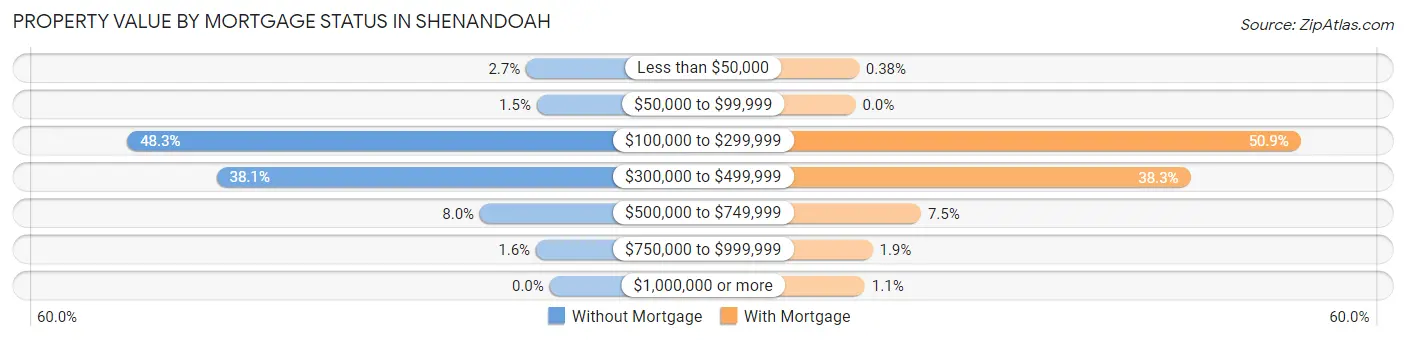
| Property Value | Without Mortgage | With Mortgage |
| Less than $50,000 | 55 (2.7%) | 13 (0.4%) |
| $50,000 to $99,999 | 30 (1.5%) | 0 (0.0%) |
| $100,000 to $299,999 | 988 (48.3%) | 1,761 (50.9%) |
| $300,000 to $499,999 | 779 (38.1%) | 1,325 (38.3%) |
| $500,000 to $749,999 | 163 (8.0%) | 259 (7.5%) |
| $750,000 to $999,999 | 32 (1.6%) | 67 (1.9%) |
| $1,000,000 or more | 0 (0.0%) | 37 (1.1%) |
| Total | 2,047 (100.0%) | 3,462 (100.0%) |
Household Income by Mortgage Status in Shenandoah
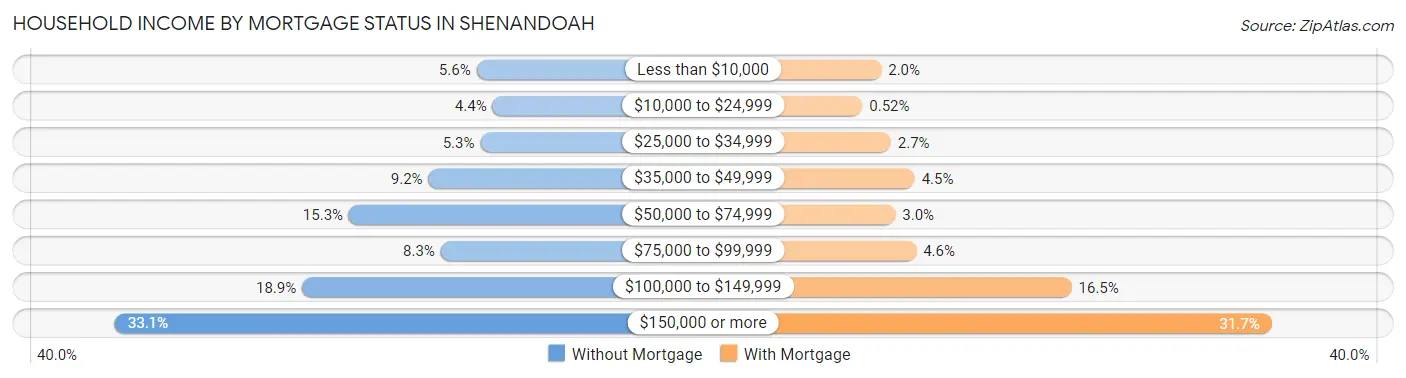
| Household Income | Without Mortgage | With Mortgage |
| Less than $10,000 | 114 (5.6%) | 68 (2.0%) |
| $10,000 to $24,999 | 89 (4.3%) | 18 (0.5%) |
| $25,000 to $34,999 | 108 (5.3%) | 93 (2.7%) |
| $35,000 to $49,999 | 189 (9.2%) | 156 (4.5%) |
| $50,000 to $74,999 | 313 (15.3%) | 105 (3.0%) |
| $75,000 to $99,999 | 170 (8.3%) | 160 (4.6%) |
| $100,000 to $149,999 | 386 (18.9%) | 570 (16.5%) |
| $150,000 or more | 678 (33.1%) | 1,097 (31.7%) |
| Total | 2,047 (100.0%) | 3,462 (100.0%) |
Property Value to Household Income Ratio in Shenandoah
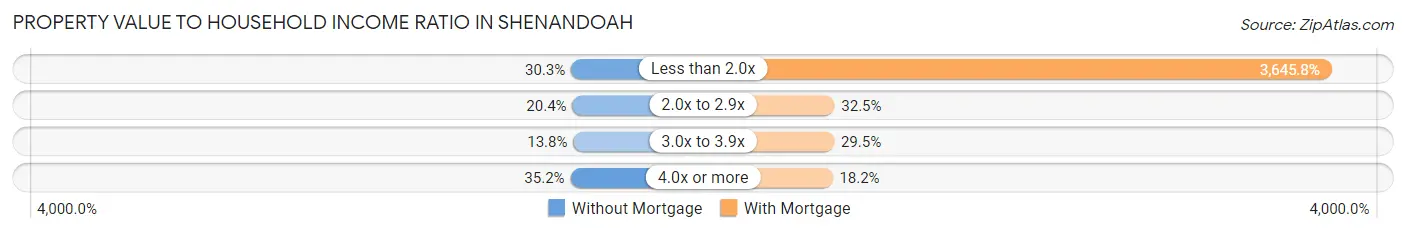
| Value-to-Income Ratio | Without Mortgage | With Mortgage |
| Less than 2.0x | 620 (30.3%) | 126,217 (3,645.8%) |
| 2.0x to 2.9x | 417 (20.4%) | 1,124 (32.5%) |
| 3.0x to 3.9x | 283 (13.8%) | 1,022 (29.5%) |
| 4.0x or more | 720 (35.2%) | 631 (18.2%) |
| Total | 2,047 (100.0%) | 3,462 (100.0%) |
Real Estate Taxes by Mortgage Status in Shenandoah
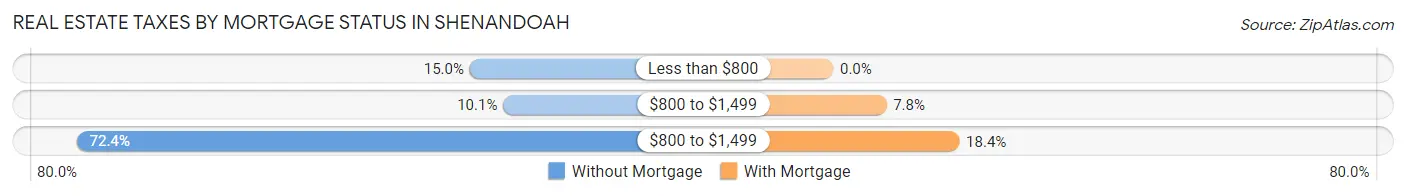
| Property Taxes | Without Mortgage | With Mortgage |
| Less than $800 | 306 (14.9%) | 0 (0.0%) |
| $800 to $1,499 | 206 (10.1%) | 269 (7.8%) |
| $800 to $1,499 | 1,482 (72.4%) | 638 (18.4%) |
| Total | 2,047 (100.0%) | 3,462 (100.0%) |
Health & Disability in Shenandoah
Health Insurance Coverage by Age in Shenandoah
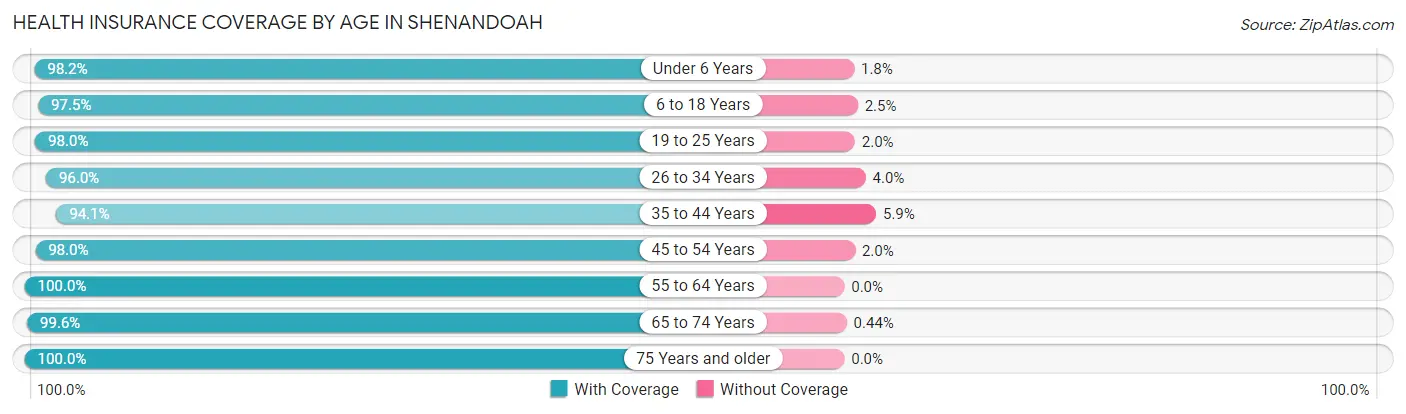
| Age Bracket | With Coverage | Without Coverage |
| Under 6 Years | 1,998 (98.2%) | 37 (1.8%) |
| 6 to 18 Years | 2,687 (97.5%) | 69 (2.5%) |
| 19 to 25 Years | 1,398 (98.0%) | 28 (2.0%) |
| 26 to 34 Years | 1,883 (96.0%) | 78 (4.0%) |
| 35 to 44 Years | 2,195 (94.1%) | 138 (5.9%) |
| 45 to 54 Years | 1,967 (98.0%) | 40 (2.0%) |
| 55 to 64 Years | 2,627 (100.0%) | 0 (0.0%) |
| 65 to 74 Years | 2,261 (99.6%) | 10 (0.4%) |
| 75 Years and older | 1,094 (100.0%) | 0 (0.0%) |
| Total | 18,110 (97.8%) | 400 (2.2%) |
Health Insurance Coverage by Citizenship Status in Shenandoah
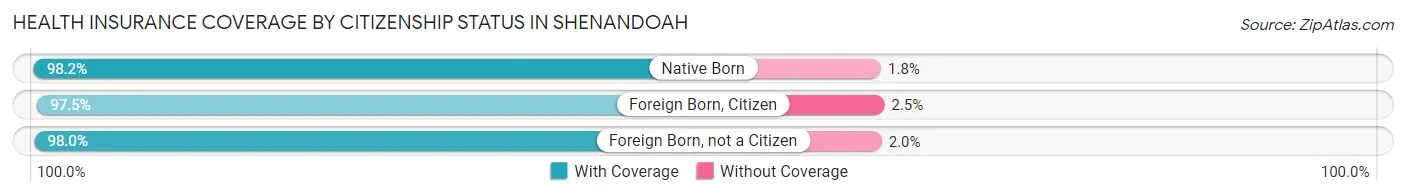
| Citizenship Status | With Coverage | Without Coverage |
| Native Born | 1,998 (98.2%) | 37 (1.8%) |
| Foreign Born, Citizen | 2,687 (97.5%) | 69 (2.5%) |
| Foreign Born, not a Citizen | 1,398 (98.0%) | 28 (2.0%) |
Health Insurance Coverage by Household Income in Shenandoah
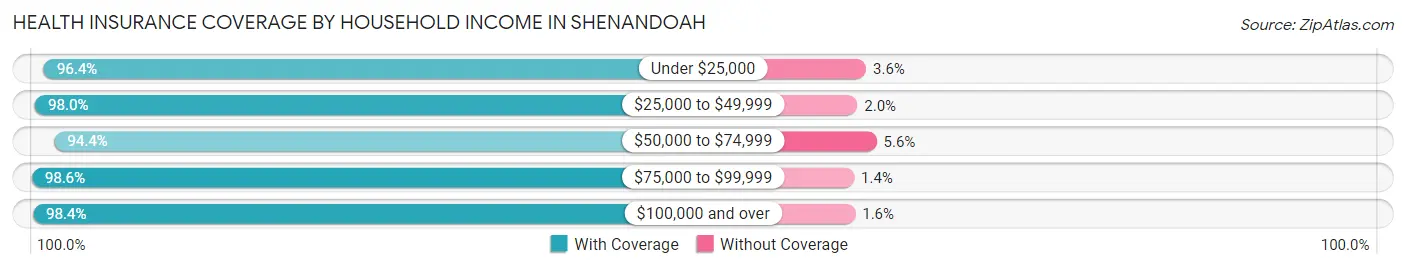
| Household Income | With Coverage | Without Coverage |
| Under $25,000 | 1,065 (96.4%) | 40 (3.6%) |
| $25,000 to $49,999 | 1,930 (98.0%) | 39 (2.0%) |
| $50,000 to $74,999 | 1,892 (94.4%) | 112 (5.6%) |
| $75,000 to $99,999 | 1,951 (98.6%) | 27 (1.4%) |
| $100,000 and over | 11,269 (98.4%) | 182 (1.6%) |
Public vs Private Health Insurance Coverage by Age in Shenandoah
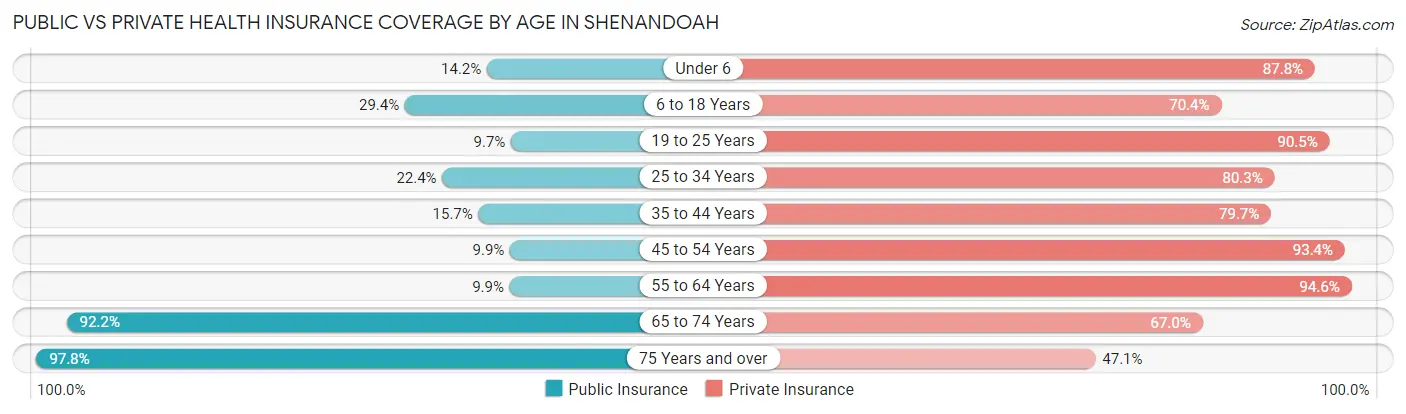
| Age Bracket | Public Insurance | Private Insurance |
| Under 6 | 288 (14.1%) | 1,787 (87.8%) |
| 6 to 18 Years | 810 (29.4%) | 1,941 (70.4%) |
| 19 to 25 Years | 138 (9.7%) | 1,291 (90.5%) |
| 25 to 34 Years | 440 (22.4%) | 1,575 (80.3%) |
| 35 to 44 Years | 367 (15.7%) | 1,859 (79.7%) |
| 45 to 54 Years | 198 (9.9%) | 1,874 (93.4%) |
| 55 to 64 Years | 261 (9.9%) | 2,486 (94.6%) |
| 65 to 74 Years | 2,094 (92.2%) | 1,521 (67.0%) |
| 75 Years and over | 1,070 (97.8%) | 515 (47.1%) |
| Total | 5,666 (30.6%) | 14,849 (80.2%) |
Disability Status by Sex by Age in Shenandoah
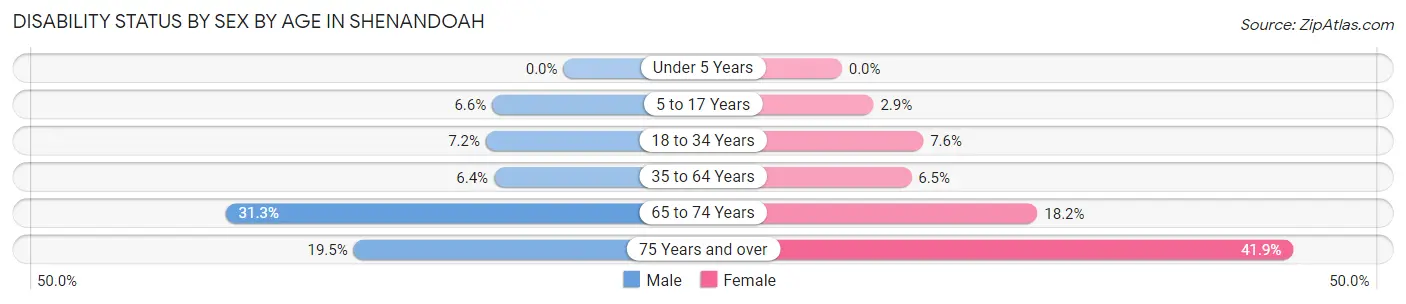
| Age Bracket | Male | Female |
| Under 5 Years | 0 (0.0%) | 0 (0.0%) |
| 5 to 17 Years | 92 (6.6%) | 64 (2.9%) |
| 18 to 34 Years | 115 (7.2%) | 149 (7.6%) |
| 35 to 64 Years | 233 (6.4%) | 216 (6.5%) |
| 65 to 74 Years | 325 (31.3%) | 224 (18.1%) |
| 75 Years and over | 81 (19.5%) | 284 (41.9%) |
Disability Class by Sex by Age in Shenandoah
Disability Class: Hearing Difficulty
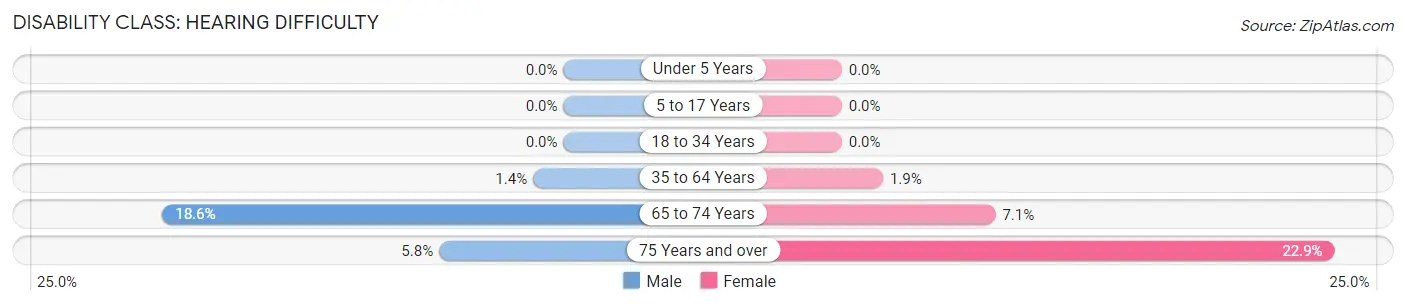
| Age Bracket | Male | Female |
| Under 5 Years | 0 (0.0%) | 0 (0.0%) |
| 5 to 17 Years | 0 (0.0%) | 0 (0.0%) |
| 18 to 34 Years | 0 (0.0%) | 0 (0.0%) |
| 35 to 64 Years | 51 (1.4%) | 64 (1.9%) |
| 65 to 74 Years | 193 (18.6%) | 88 (7.1%) |
| 75 Years and over | 24 (5.8%) | 155 (22.9%) |
Disability Class: Vision Difficulty
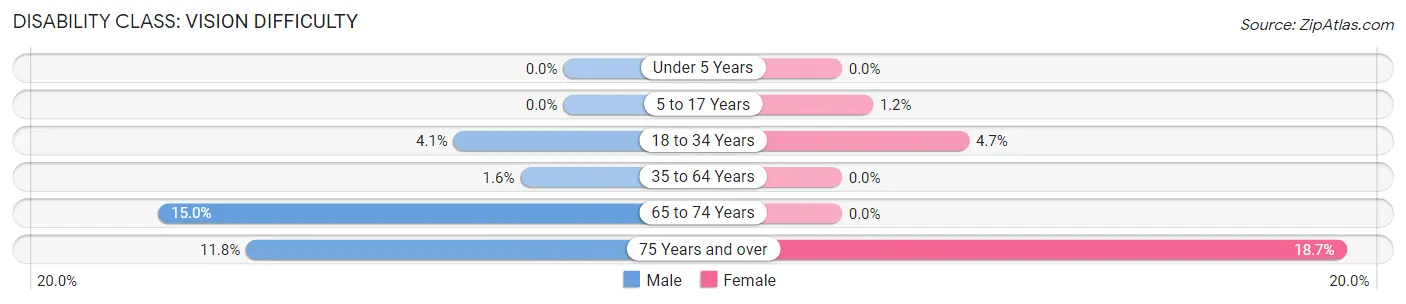
| Age Bracket | Male | Female |
| Under 5 Years | 0 (0.0%) | 0 (0.0%) |
| 5 to 17 Years | 0 (0.0%) | 25 (1.1%) |
| 18 to 34 Years | 65 (4.1%) | 93 (4.7%) |
| 35 to 64 Years | 58 (1.6%) | 0 (0.0%) |
| 65 to 74 Years | 156 (15.0%) | 0 (0.0%) |
| 75 Years and over | 49 (11.8%) | 127 (18.7%) |
Disability Class: Cognitive Difficulty
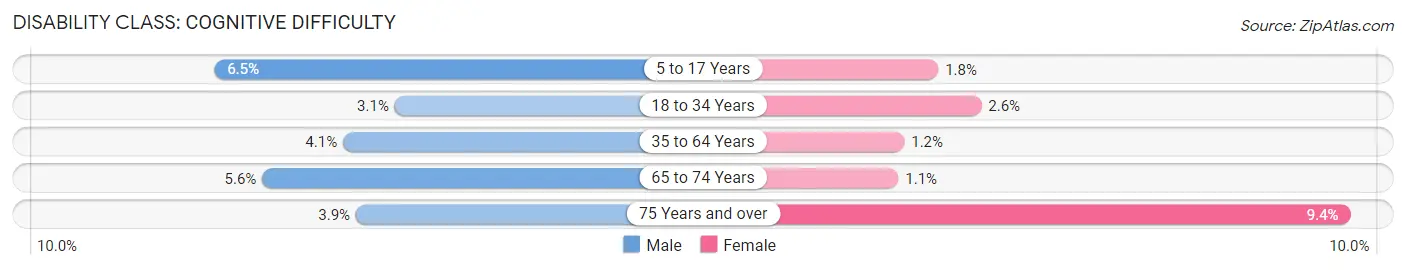
| Age Bracket | Male | Female |
| 5 to 17 Years | 90 (6.5%) | 39 (1.8%) |
| 18 to 34 Years | 50 (3.1%) | 51 (2.6%) |
| 35 to 64 Years | 148 (4.1%) | 39 (1.2%) |
| 65 to 74 Years | 58 (5.6%) | 13 (1.1%) |
| 75 Years and over | 16 (3.8%) | 64 (9.4%) |
Disability Class: Ambulatory Difficulty
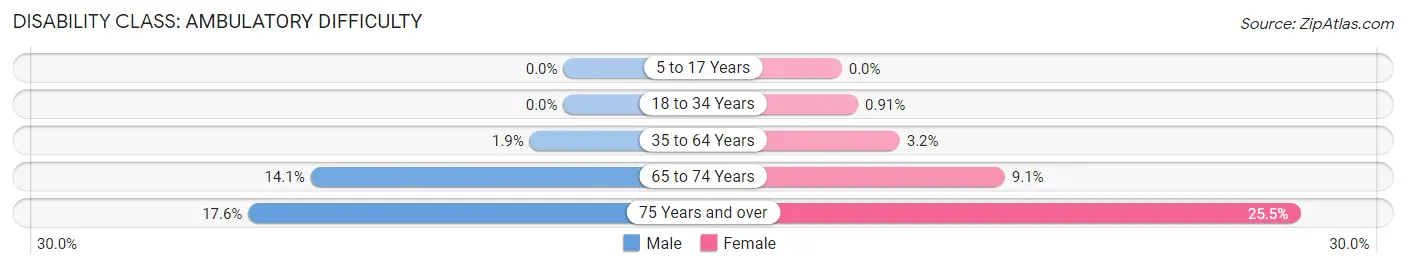
| Age Bracket | Male | Female |
| 5 to 17 Years | 0 (0.0%) | 0 (0.0%) |
| 18 to 34 Years | 0 (0.0%) | 18 (0.9%) |
| 35 to 64 Years | 68 (1.9%) | 108 (3.2%) |
| 65 to 74 Years | 146 (14.1%) | 112 (9.1%) |
| 75 Years and over | 73 (17.5%) | 173 (25.5%) |
Disability Class: Self-Care Difficulty
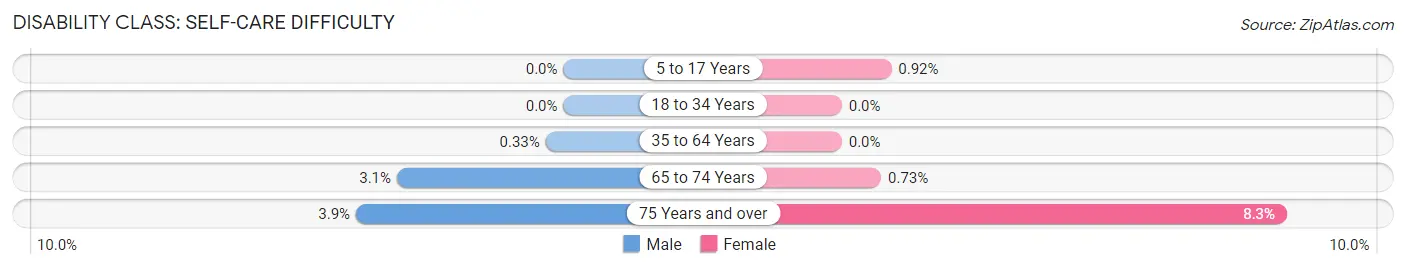
| Age Bracket | Male | Female |
| 5 to 17 Years | 0 (0.0%) | 20 (0.9%) |
| 18 to 34 Years | 0 (0.0%) | 0 (0.0%) |
| 35 to 64 Years | 12 (0.3%) | 0 (0.0%) |
| 65 to 74 Years | 32 (3.1%) | 9 (0.7%) |
| 75 Years and over | 16 (3.8%) | 56 (8.3%) |
Technology Access in Shenandoah
Computing Device Access in Shenandoah
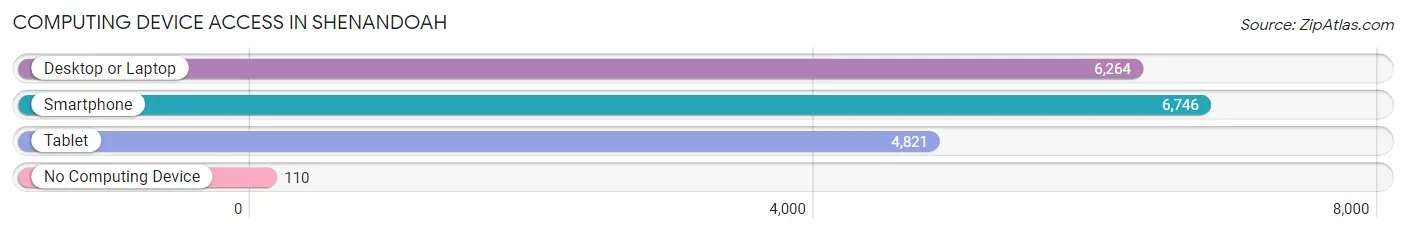
| Device Type | # Households | % Households |
| Desktop or Laptop | 6,264 | 89.0% |
| Smartphone | 6,746 | 95.8% |
| Tablet | 4,821 | 68.5% |
| No Computing Device | 110 | 1.6% |
| Total | 7,041 | 100.0% |
Internet Access in Shenandoah
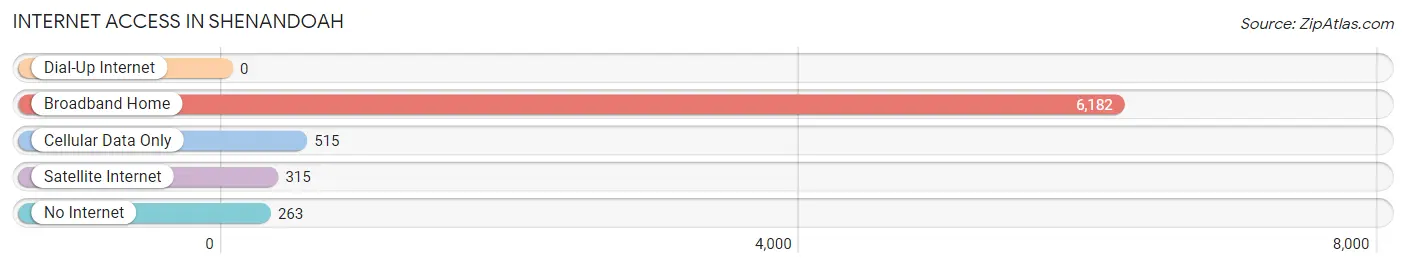
| Internet Type | # Households | % Households |
| Dial-Up Internet | 0 | 0.0% |
| Broadband Home | 6,182 | 87.8% |
| Cellular Data Only | 515 | 7.3% |
| Satellite Internet | 315 | 4.5% |
| No Internet | 263 | 3.7% |
| Total | 7,041 | 100.0% |
Shenandoah Summary
Shenandoah is a small town located in the state of Louisiana, United States. It is situated in the northern part of the state, in the parish of Rapides. The town has a population of around 1,500 people and is part of the Alexandria Metropolitan Statistical Area.
History
Shenandoah was founded in 1883 by a group of settlers from the nearby town of Alexandria. The town was named after the Shenandoah Valley in Virginia, which was the home of many of the settlers. The town was originally a farming community, but it soon developed into a small industrial center. The town was incorporated in 1887 and the first mayor was elected in 1888.
In the early 1900s, Shenandoah was a thriving community with a variety of businesses, including a cotton gin, a sawmill, a grist mill, and a brickyard. The town also had a number of churches, schools, and a post office.
In the 1920s, the town began to decline as the local economy shifted away from agriculture and industry. The Great Depression further weakened the town’s economy, and many of the businesses closed. The population of Shenandoah dropped from 1,500 in 1930 to just over 500 in 1940.
In the 1950s, the town began to experience a resurgence as the local economy shifted back to agriculture and industry. The population of Shenandoah increased to 1,500 by 1960.
Geography
Shenandoah is located in the northern part of the state of Louisiana, in the parish of Rapides. The town is situated on the banks of the Red River, which forms the border between Louisiana and Texas. The town is located about 25 miles south of Alexandria and about 50 miles north of Shreveport.
The town has a total area of 1.2 square miles, all of which is land. The terrain of the area is mostly flat, with some rolling hills. The climate of the area is humid subtropical, with hot, humid summers and mild winters.
Economy
The economy of Shenandoah is largely based on agriculture and industry. The town is home to a number of small businesses, including a lumber mill, a feed mill, and a brickyard. The town also has a number of churches, schools, and a post office.
The town is also home to a number of tourist attractions, including the Red River National Wildlife Refuge, the Red River Valley Museum, and the Red River Valley Railroad Museum.
Demographics
As of the 2010 census, the population of Shenandoah was 1,500. The racial makeup of the town was 79.3% White, 17.3% African American, 0.7% Native American, 0.3% Asian, 0.1% Pacific Islander, and 2.3% from other races. Hispanic or Latino of any race were 2.7% of the population.
The median household income in Shenandoah was $31,250, and the median family income was $37,500. The per capita income for the town was $15,945. About 17.3% of the population was below the poverty line.
Common Questions
What is Per Capita Income in Shenandoah?
Per Capita income in Shenandoah is $48,493.
What is the Median Family Income in Shenandoah?
Median Family Income in Shenandoah is $118,890.
What is the Median Household income in Shenandoah?
Median Household Income in Shenandoah is $103,130.
What is Income or Wage Gap in Shenandoah?
Income or Wage Gap in Shenandoah is 29.3%.
Women in Shenandoah earn 70.7 cents for every dollar earned by a man.
What is Inequality or Gini Index in Shenandoah?
Inequality or Gini Index in Shenandoah is 0.42.
What is the Total Population of Shenandoah?
Total Population of Shenandoah is 18,561.
What is the Total Male Population of Shenandoah?
Total Male Population of Shenandoah is 8,451.
What is the Total Female Population of Shenandoah?
Total Female Population of Shenandoah is 10,110.
What is the Ratio of Males per 100 Females in Shenandoah?
There are 83.59 Males per 100 Females in Shenandoah.
What is the Ratio of Females per 100 Males in Shenandoah?
There are 119.63 Females per 100 Males in Shenandoah.
What is the Median Population Age in Shenandoah?
Median Population Age in Shenandoah is 39.5 Years.
What is the Average Family Size in Shenandoah
Average Family Size in Shenandoah is 3.2 People.
What is the Average Household Size in Shenandoah
Average Household Size in Shenandoah is 2.6 People.
How Large is the Labor Force in Shenandoah?
There are 9,934 People in the Labor Forcein in Shenandoah.
What is the Percentage of People in the Labor Force in Shenandoah?
69.2% of People are in the Labor Force in Shenandoah.
What is the Unemployment Rate in Shenandoah?
Unemployment Rate in Shenandoah is 5.3%.